Article

The Profiles Based on Ridge and Valley Lines to Extract Shoulder Lines on the Loess Plateau

1
College of Geology Engineering and Geomatics, Chang’an University, Xi’an 710054, China
2
College of Civil Engineering and Mechanics, Lanzhou University, Lanzhou 730000, China
3
Key Laboratory of Western China’s Mineral Resources and Geological Engineering, Ministry of Education, No. 126 Yanta Road, Xi’an 710054, China
4
Xi’an Institute for Innovative Earth Environment Research, Xi’an 710061, China
5
State Key Laboratory of Loess and Quaternary Geology, Institute of Earth Environment, Chinese Academy of Sciences, Xi’an 710061, China
*
Author to whom correspondence should be addressed.
Remote Sens. 2023, 15(2), 380; https://doi.org/10.3390/rs15020380
Submission received: 18 November 2022 / Revised: 4 January 2023 / Accepted: 6 January 2023 / Published: 8 January 2023
(This article belongs to the Section Remote Sensing in Geology, Geomorphology and Hydrology)

Abstract

:
The shoulder line is fundamental to geomorphic evolution and erosion monitoring research on the Loess Plateau, which represents the boundary between positive terrain (intergully) and negative terrain (inner gully). The existing extraction methods mainly suffer the problems of unclear geological significance, poor landform application, and low efficiency of algorithms. This paper proposes a new loess shoulder line automatic extraction method, in which topographic feature points (ridge and valley points) were used as endpoints to generate continuous profiles, and two parameters, analysis operator size (L) and filter threshold (σ), were created for shoulder point extraction from each profile. This method can be applied to complex landforms such as the continuous shoulder lines of terraces and extracts. Herein, three typical areas on the Dongzhi Plateau were selected to assess the performance of the method, and a digital elevation model (DEM) with a resolution of 5 m was used as source data. The accuracy assessment index was the Euclidean distance offset percentage (EDOP), and the original evaluation method was improved based on Structure from Motion–Multiview Stereo (SfM-MVS) technology. The experimental results showed that the average accuracy of the proposed method in the three test areas reached 89.3%, which is higher than that of the multidirectional hill-shading and P-N methods. Via testing in different areas, it could be concluded that the extraction efficiency was less affected by the area of the test region, and the approach exhibited a suitable robustness. Simultaneously, the optimal values of parameters L and σ were examined. This study increases the possibility of accurate shoulder line extraction in the large area of the Loess Plateau.

1. Introduction

The Loess Plateau is hailed as one of the most valuable areas for geoscience research globally because of its unique development pattern and various combinations of geomorphic forms [1,2,3,4]. Due to long-term soil erosion on the Loess Plateau, a fragmented landscape of gullies and ravines has been formed, and the gravity erosion process, resulting in landslides and collapses, is very active, seriously threatening the life and property safety of residents on the Loess Plateau [5,6,7,8]. As the boundary between positive terrain (intergully area) and negative terrain (inner gully area), the shoulder line is the topographic structure line that best reflects the morphological characteristics of loess landforms, and it plays an important role in gully erosion monitoring [9,10,11], mapping [12,13], and research on spatial heterogeneity [14,15].
The accurate and rapid extraction of the shoulder line has always been a very important task in scientific research and mapping applications on the Loess Plateau [16]. The previous method of extracting shoulder lines entailed manual delineation by using a topographic map or a remote sensing image; the advantage of this method is that highly accurate shoulder line extraction results can be extracted and used as a reference data if the operator is experienced, but the disadvantage is that it is time consuming and difficult to apply in large areas. With the increasing development of geographic information system (GIS) technology and the multiple sources and enrichment of remote sensing data, a large number of scholars have proposed many automatic extraction methods for shoulder lines based on digital elevation models (DEMs), which are mainly divided into automatic extraction methods based on image gradients and automatic extraction methods based on geomorphic features. Among them, the basic principle of automatic extraction based on the image gradient is to process the DEM as an image and extract shoulder lines with image processing and computer vision techniques. Yan [17] used four edge detection operators, such as Laplacian of Gaussian (LOG), to extract shoulder lines and obtained an edge detection operator with the best extraction effect by comparison. Although the method could obtain a high accuracy, it generated a large amount of errors in the extraction process, and the noise removal procedure was difficult to apply in large areas. Yan [18] and Song [19] used the snake model and proposed a parallel algorithm to improve the computational efficiency, which solved the problem of the discontinuous extraction of shoulder lines, but the extraction results were influenced by the initial shoulder line, the accuracy was not satisfactory, and the curve was too smooth to describe the realistic gully morphology.
Compared to the first category, the automatic extraction method based on geomorphic features is highly recognized, and its principle is to take advantage of the slope mutation in the slope of the terrain on both sides of the shoulder line, and the geological significance is clear. The geomorphic feature-based methods include the terrain attributes method and the terrain visibility method. The extraction method based on terrain attributes uses shoulder line locations with a clear difference in elevation, slope, and curvature. Zhou [15] regarded the slope mutation unit as a candidate unit based on the size 7 × 7 pixels analysis operator and then extracted shoulder lines through directional expansion and noise removal steps. Zhu [20] used the branching points of the flow network as seeds and the results of the curvature feature analysis of the surface profile as the growth criterion to achieve the automatic segmentation of intergully, gully slope, and gully bottom land in loess areas. The advantages of both methods are simple operation and easy implementation. However, the disadvantages are that the results are influenced by the threshold value, and it is difficult to propose an adaptive threshold acquisition algorithm based on the local topography of the study area. Evans [21] used a mean-filter DEM to obtain the difference from the original DEM, and its outstanding advantage was the simplicity of the method, but this method extracted low-lying terrain not induced by gully erosion, and it was difficult to denoise the data, resulting in lower accuracy. Extraction based on terrain visibility is an indirect method of using terrain features. Wang [22] used the topographic openness to extract shoulder lines. The advantage is that the topographic openness fully reflects the multiscale characteristics of the topography, which is conducive to improving the extraction accuracy, but a large number of parameters could lead to excessive calculations, which is difficult to apply in large areas. Na [23] proposed a bidirectional relief shading method, and this method algorithm was simple and easy to implement on ArcGIS; on this basis, to adapt the method to the applicability of the loess hilly landform type, Yang [24] proposed a new method of gully identification based on a multidirectional hill-shading map. However, this method is greatly influenced by the altitude parameter and produces erroneous extraction zones and missed extraction zones in terraced, wide, and flat gully bottoms, so the results need further enhancement.
Based on the study of the above problems and inspired by the definition of the shoulder line, this paper proposes a new shoulder line extraction method, which includes three main steps: (1) Topographic feature lines (ridge and valley lines) in the study area are extracted based on the GIS hydromethod, and continuous raster profiles are generated along the slope strike direction between the ridge and valley lines. (2) Based on the DEM, all pixels in the study area are traversed by the analysis operator, and the slope variation matrix in each pixel is calculated. (3) Pixels are selected through prior ranking of the slope variation in each profile, and finally errors are eliminated.
The objectives of this paper are (1) to propose an extraction method for shoulder lines suitable for various landform types in the Loess Plateau; (2) to perform parameter analysis and select the optimal values; and (3) to assess the accuracy and efficiency of the proposed method.

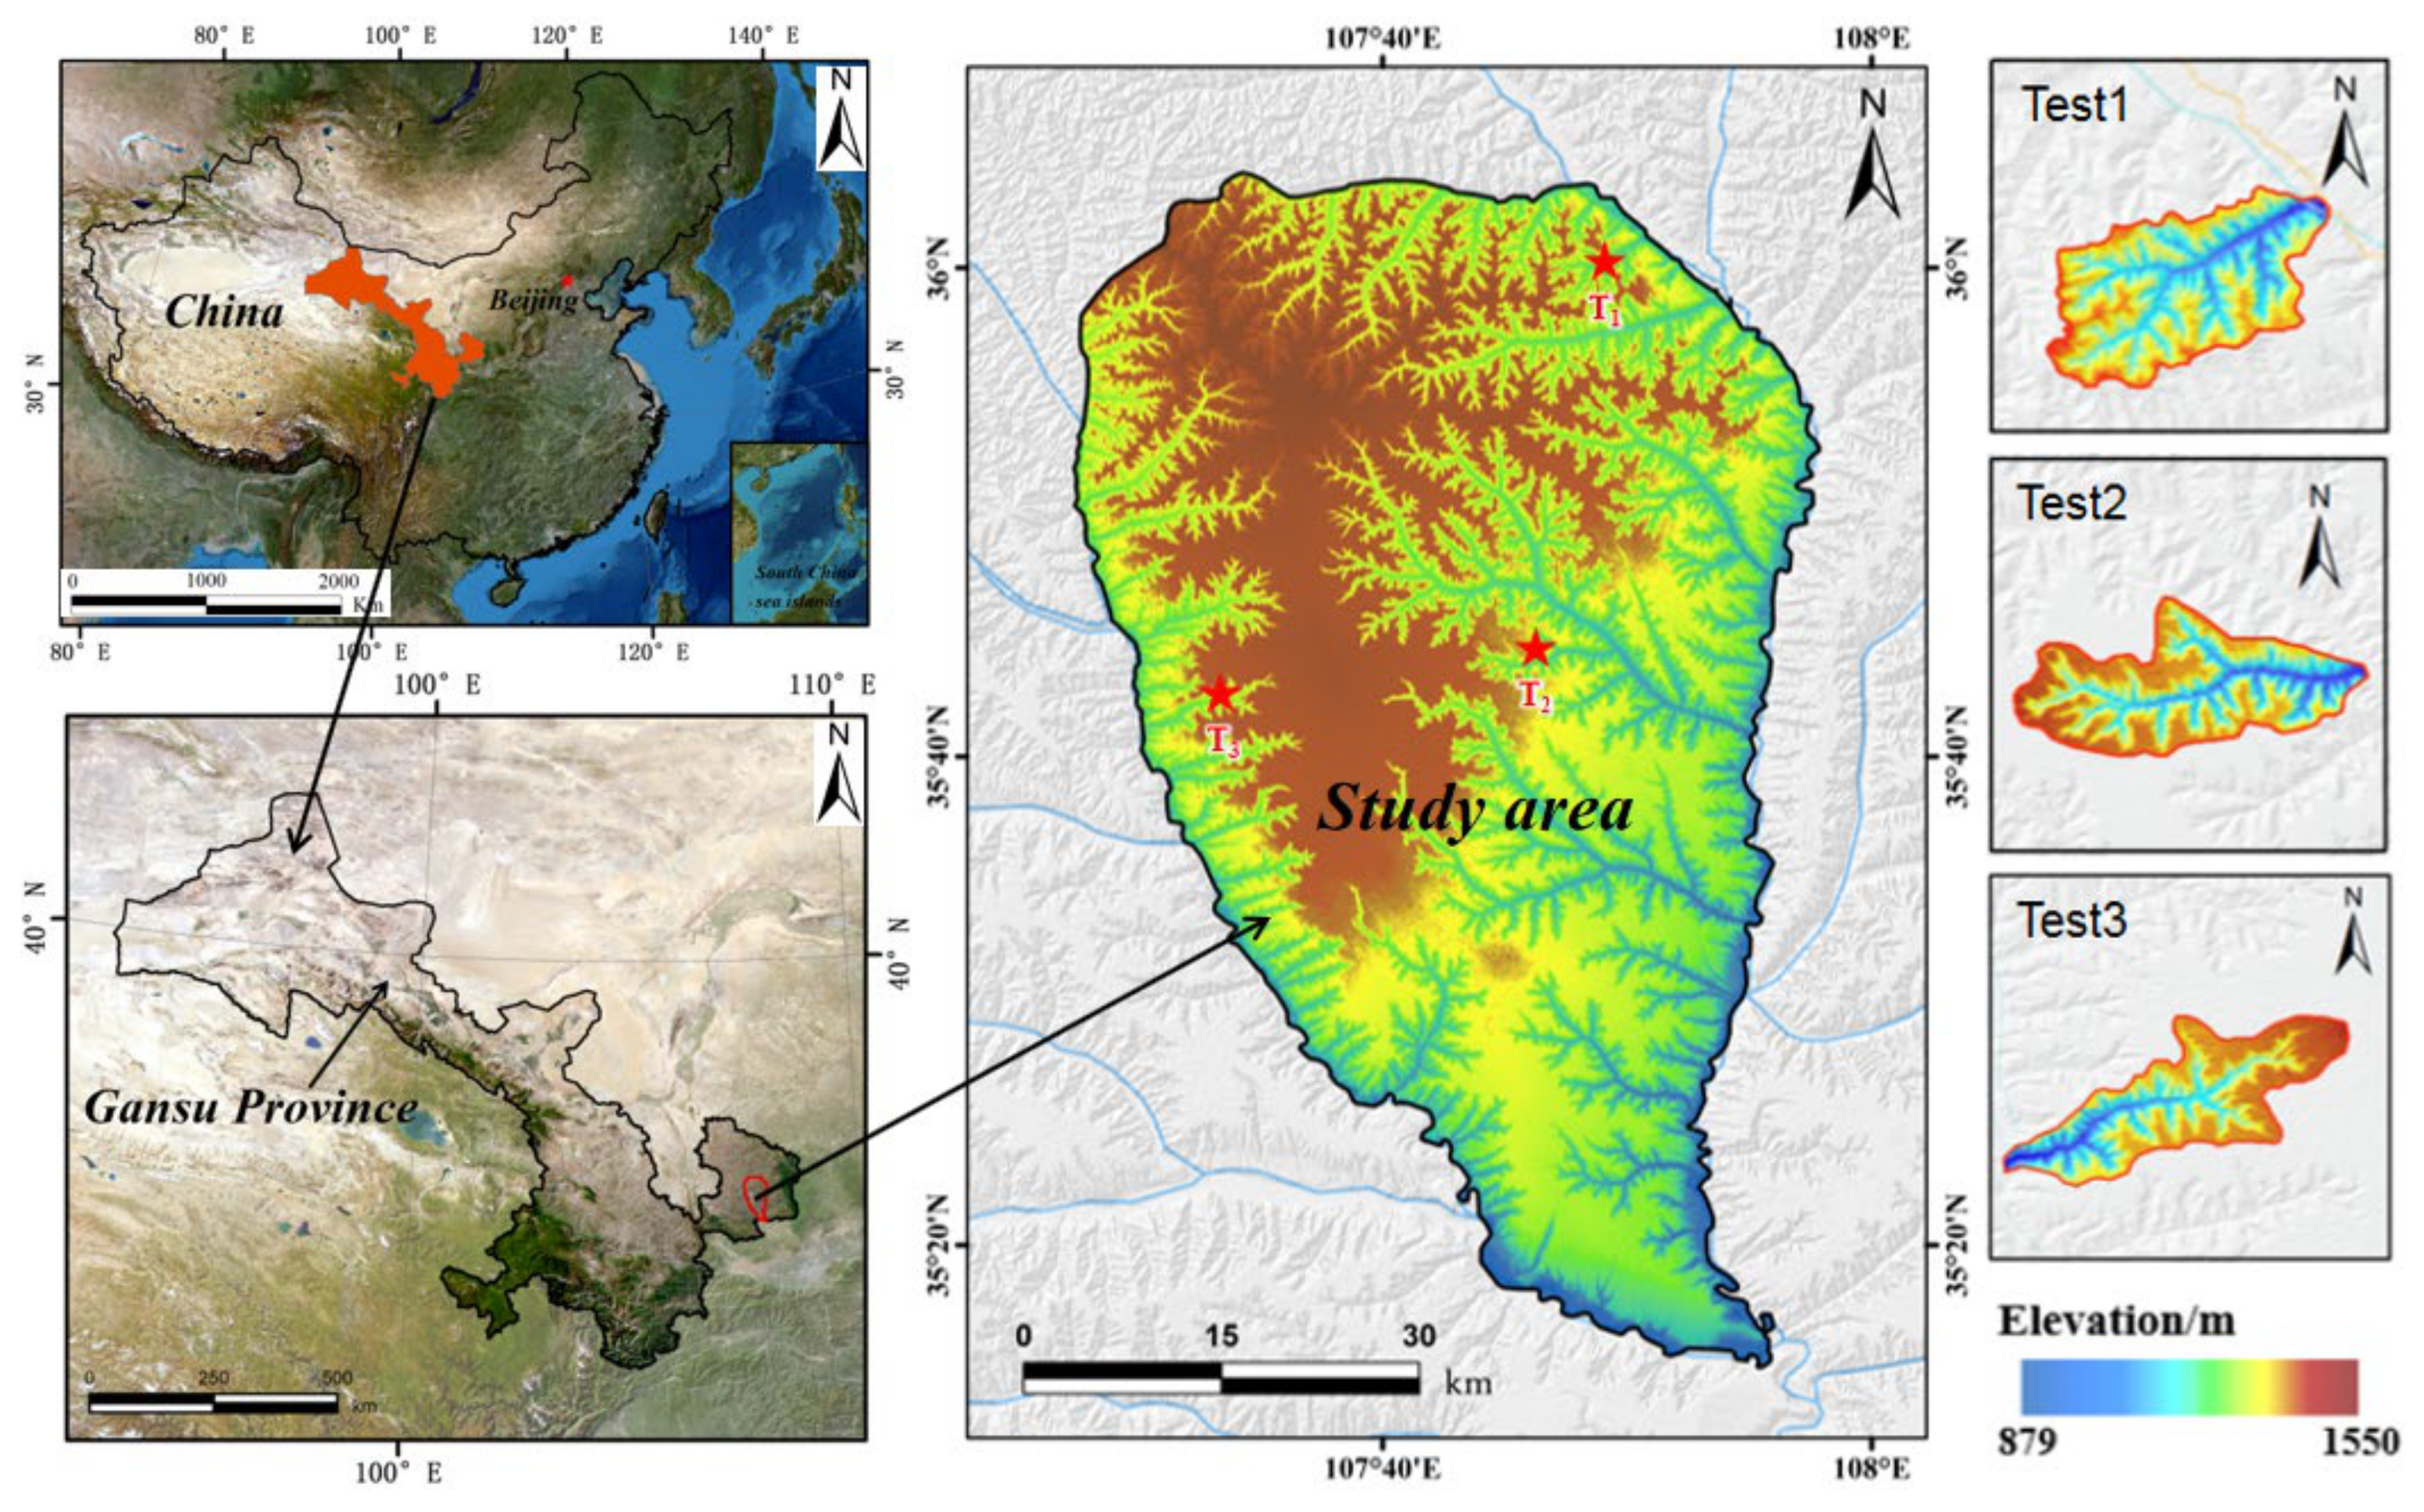
2. Test Area and Data

The research area, the Dongzhi Plateau, is located in Qingyang city, eastern Gansu Province (34°50′–37°19′N, 106°14′–108°42′E), in the hinterland of the Loess Plateau, extending north–south, and it contains the largest, thickest loess layer and represents the best-preserved part of the Loess Plateau in China. It occurs east of the Malian River, west of the Pu River, south of the Jing River, and north of the Caijiamiao River (Figure 1). The total area of the study area is 2765.5 km2, of which the plateau area is 960.05 km2. Due to the unique geographical environment and unreasonable human engineering activities, soil erosion in the tableland area reached 2735.95 km2, accounting for 98.9% of the total area, and the hazards of gully erosion are extremely serious.
The surface layer of the Dongzhi Plateau is widely covered by Quaternary thick massive loess with a thickness of 100–200 m. The underlying bedrock is Tertiary mudstone (N) and Cretaceous sandstone (K) with a nearly horizontal attitude. The annual precipitation in the research area ranges from 600–800 mm, and the area exhibits the characteristics of a high interannual variation in precipitation and an extremely uneven distribution during the year. According to meteorological data, more than 70% of the total precipitation occurs during the rainy season, with an average annual precipitation of 551 mm from June to September, and with frequent heavy rainfall conditions, extreme rainfall events are considered a major trigger for gully erosion [9,25,26].
Considering the representativeness of the test area and the complexity of geomorphic types, the Bianjiagou, Nanxiaohe, and Chuanhegou watersheds (Figure 1) were selected to assess the performance of the proposed method. The Bianjiagou watershed, north of Dongzhi Plateau, belongs to the loess hilly landform type, while the Nanxiaohe and Chuanhegou watersheds belong to the Loess residual tableland landform type. These three watersheds exhibit typical geomorphic features of the Loess Plateau and notable gully erosion hazards. The data types and a description of the research area are provided in Table 1.

3. Materials and Methods

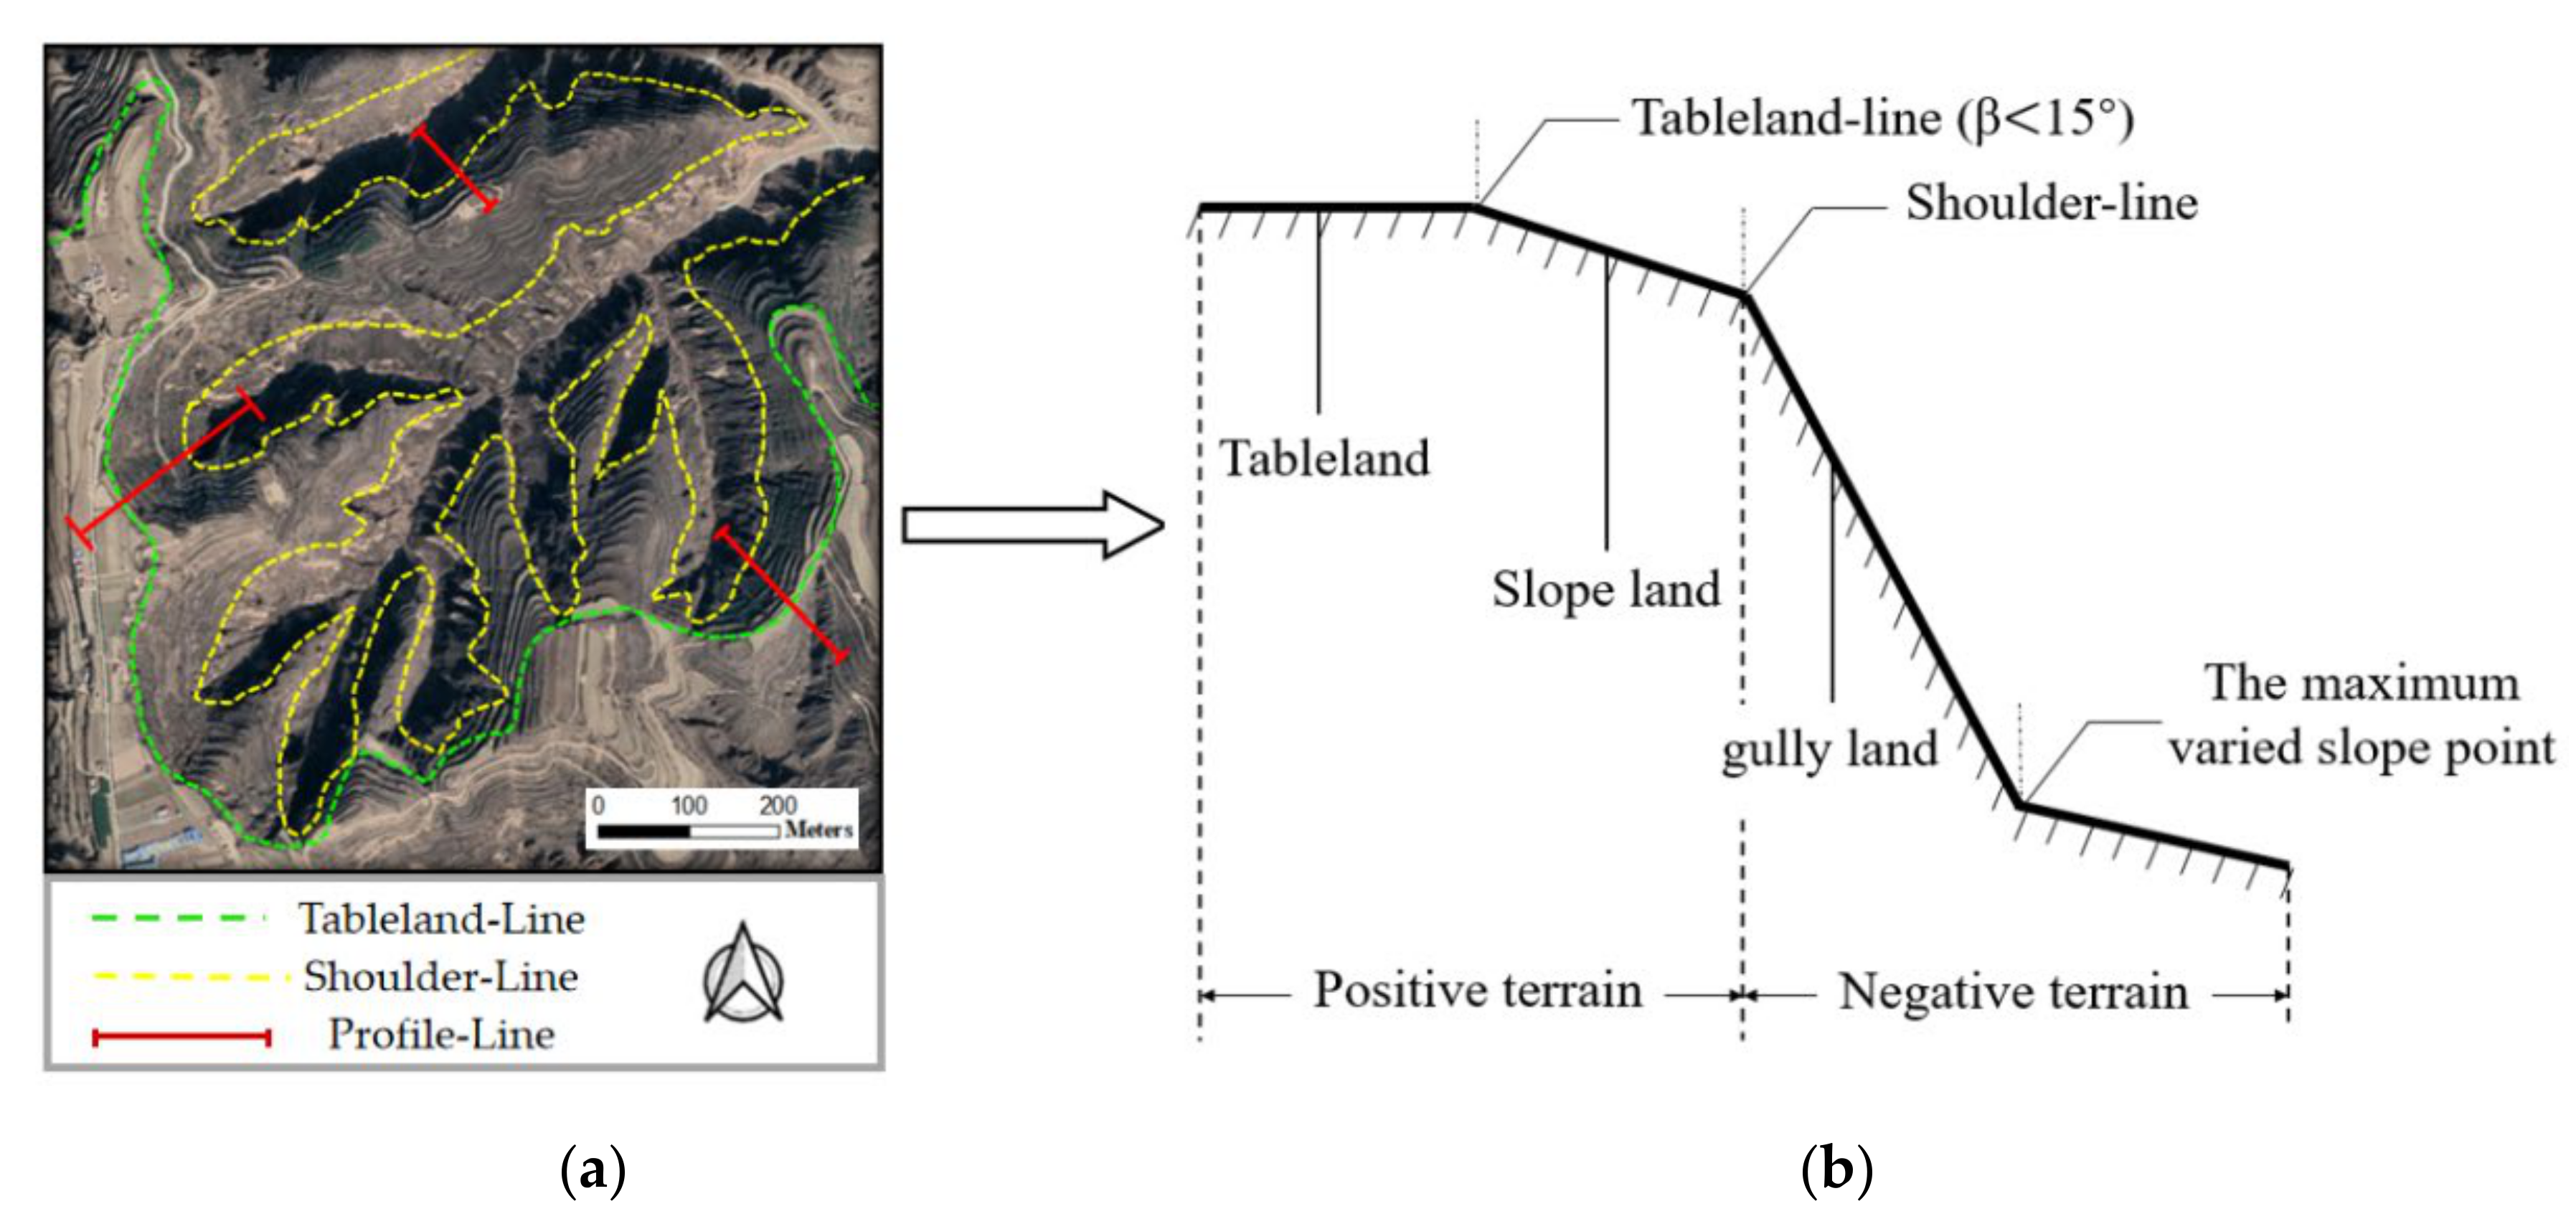
3.1. Basis for the Demarcation of the Shoulder Line

In this paper, the typical characteristics of the shoulder line were used as the basis for demarcation. Based on previous research results and field surveys, the positive and negative terrain on both sides of the shoulder line mainly exists in the following aspects:
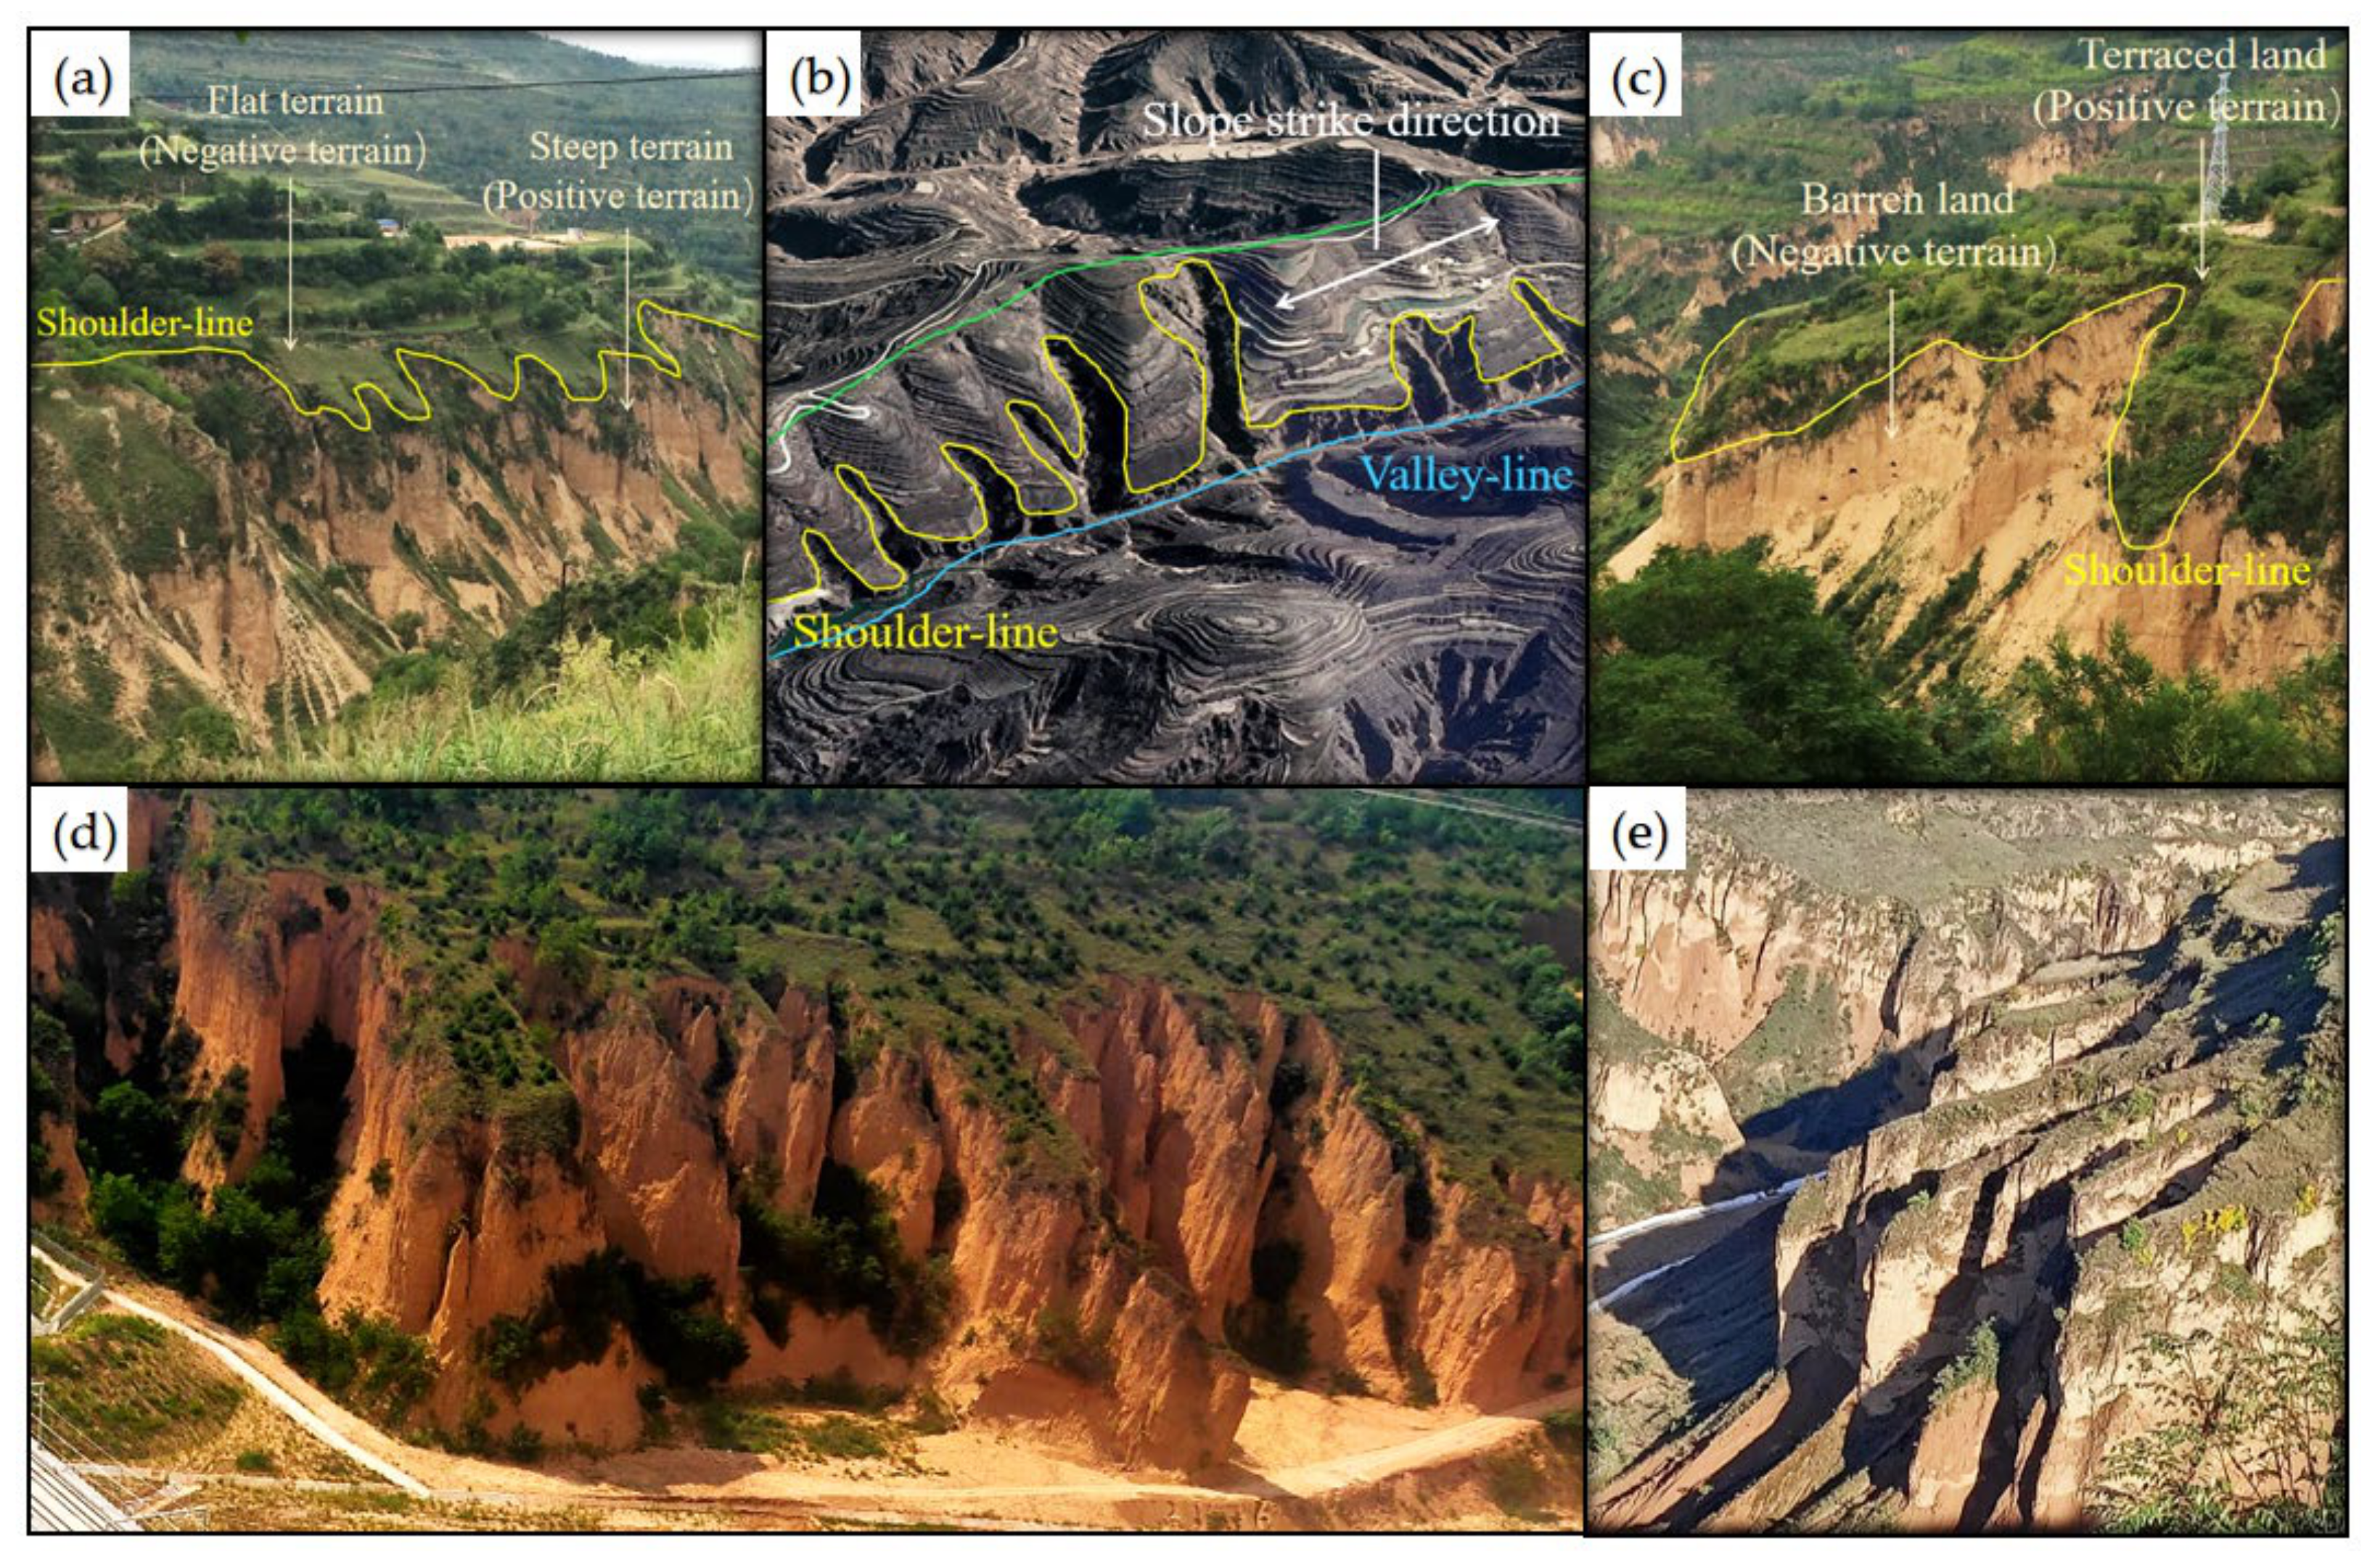
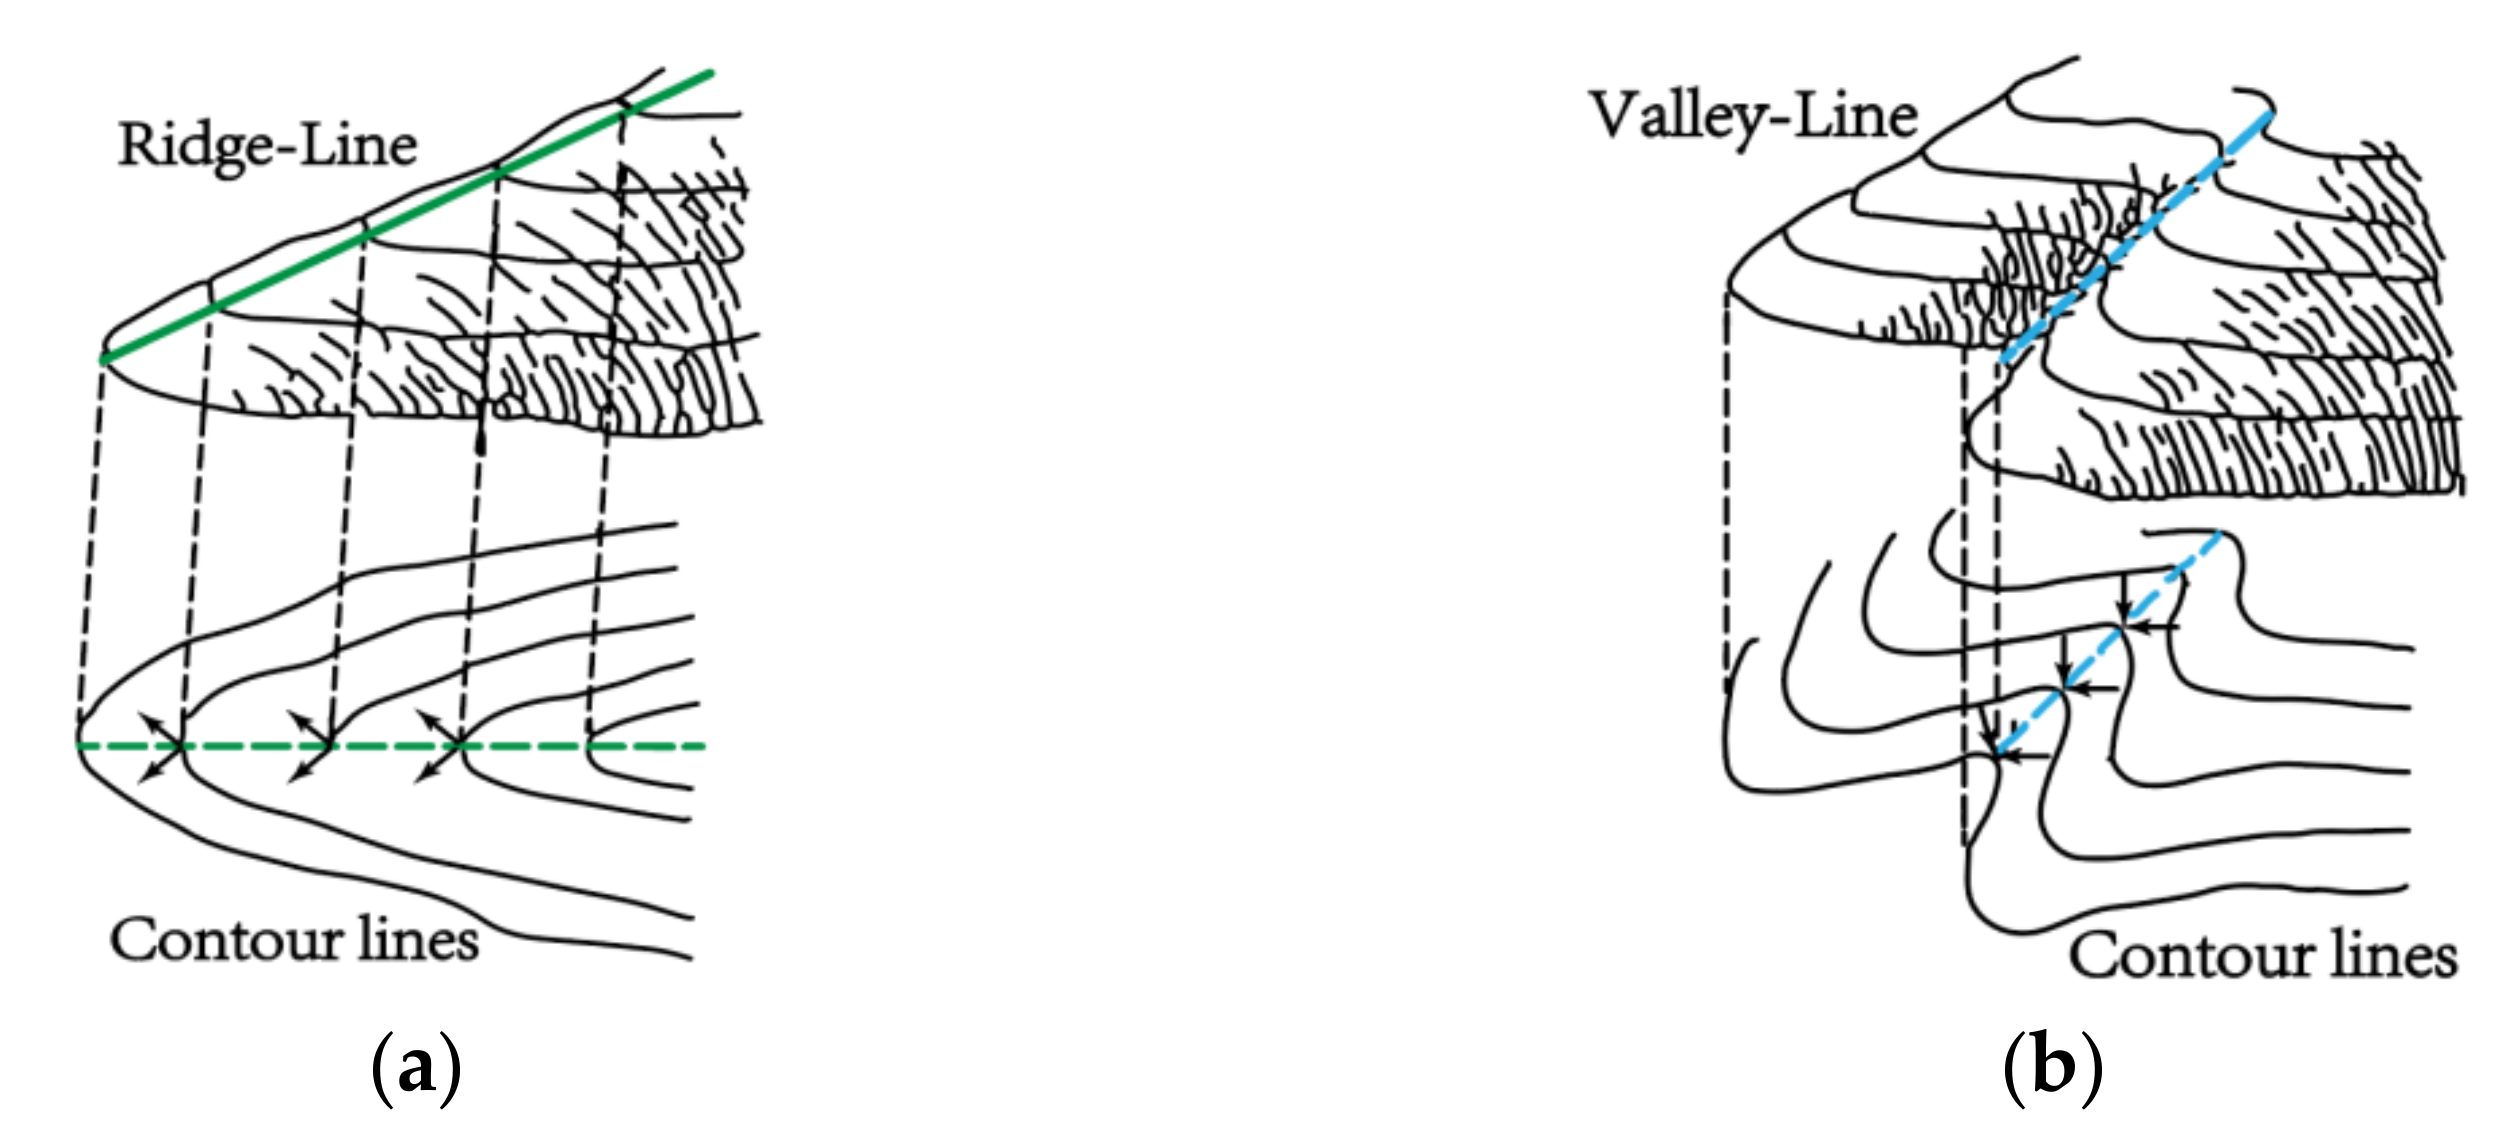
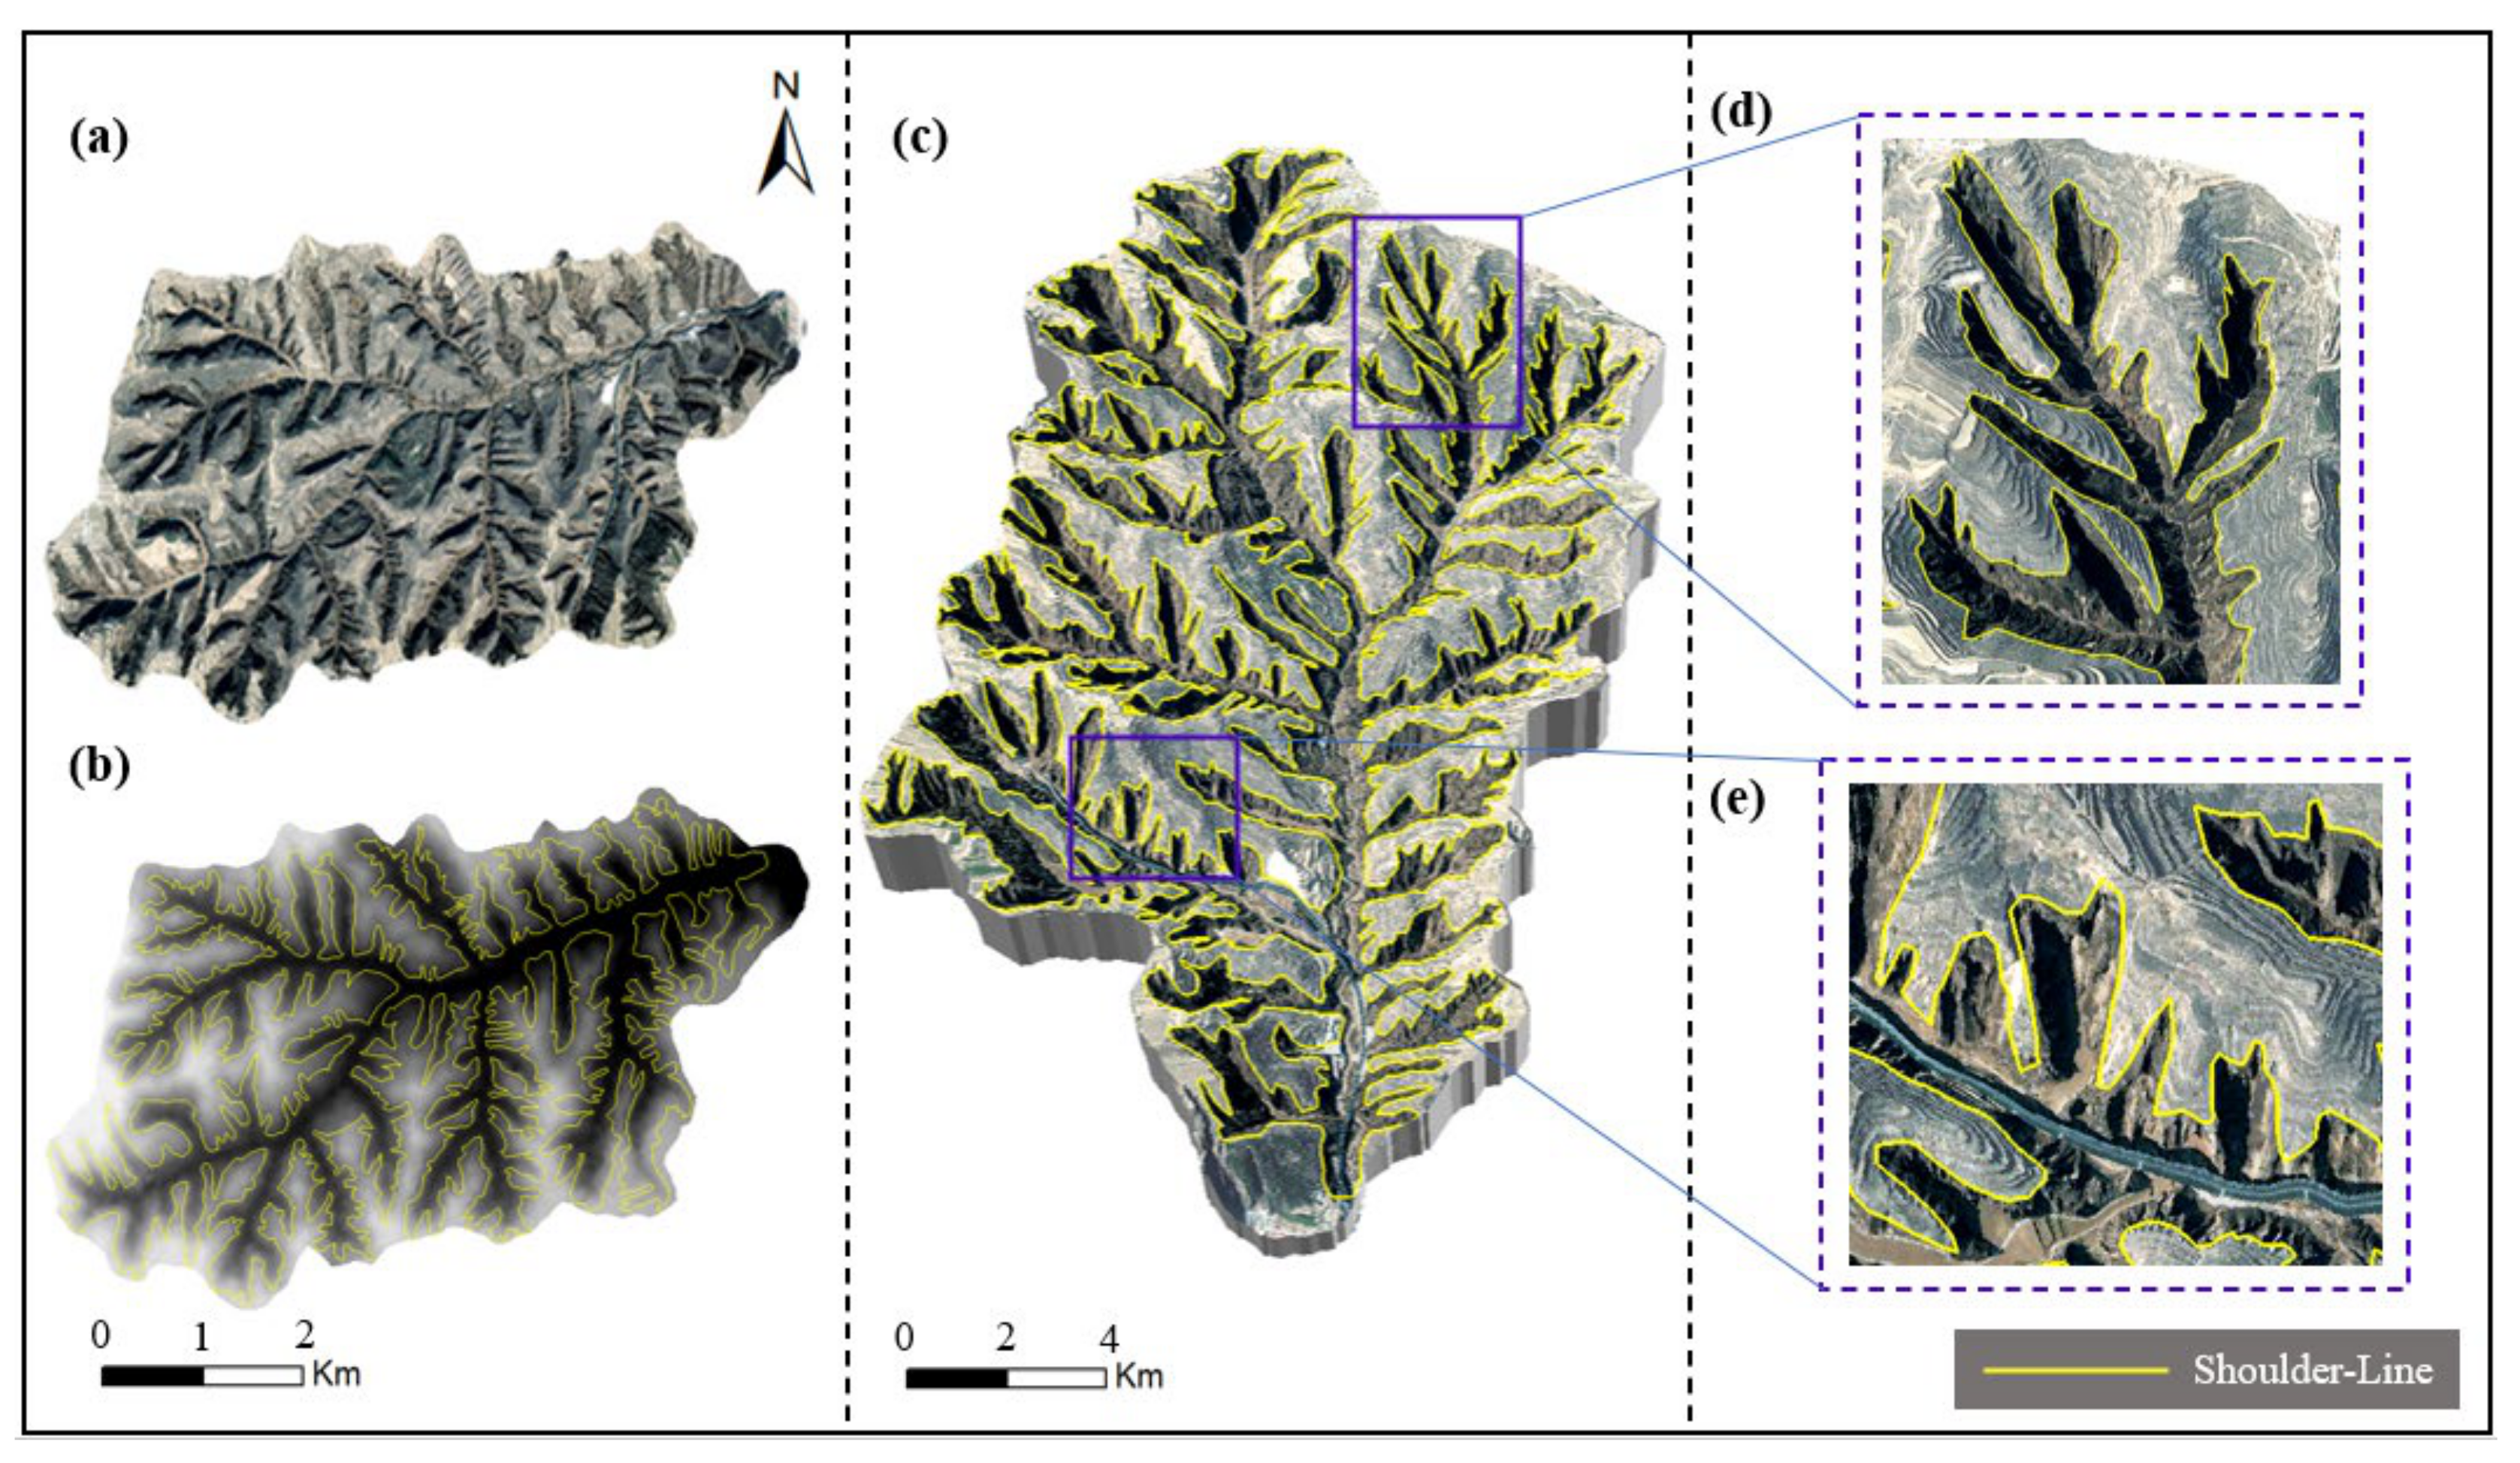
  • In terms of geomorphic features, there are obvious slope differences above and below the shoulder line. Generally, it is the line consisting of the points on the profile with the highest variation in slope. Especially in the loess tableland area and the loess residual tableland area, some gully walls are nearly vertical (Figure 2a).
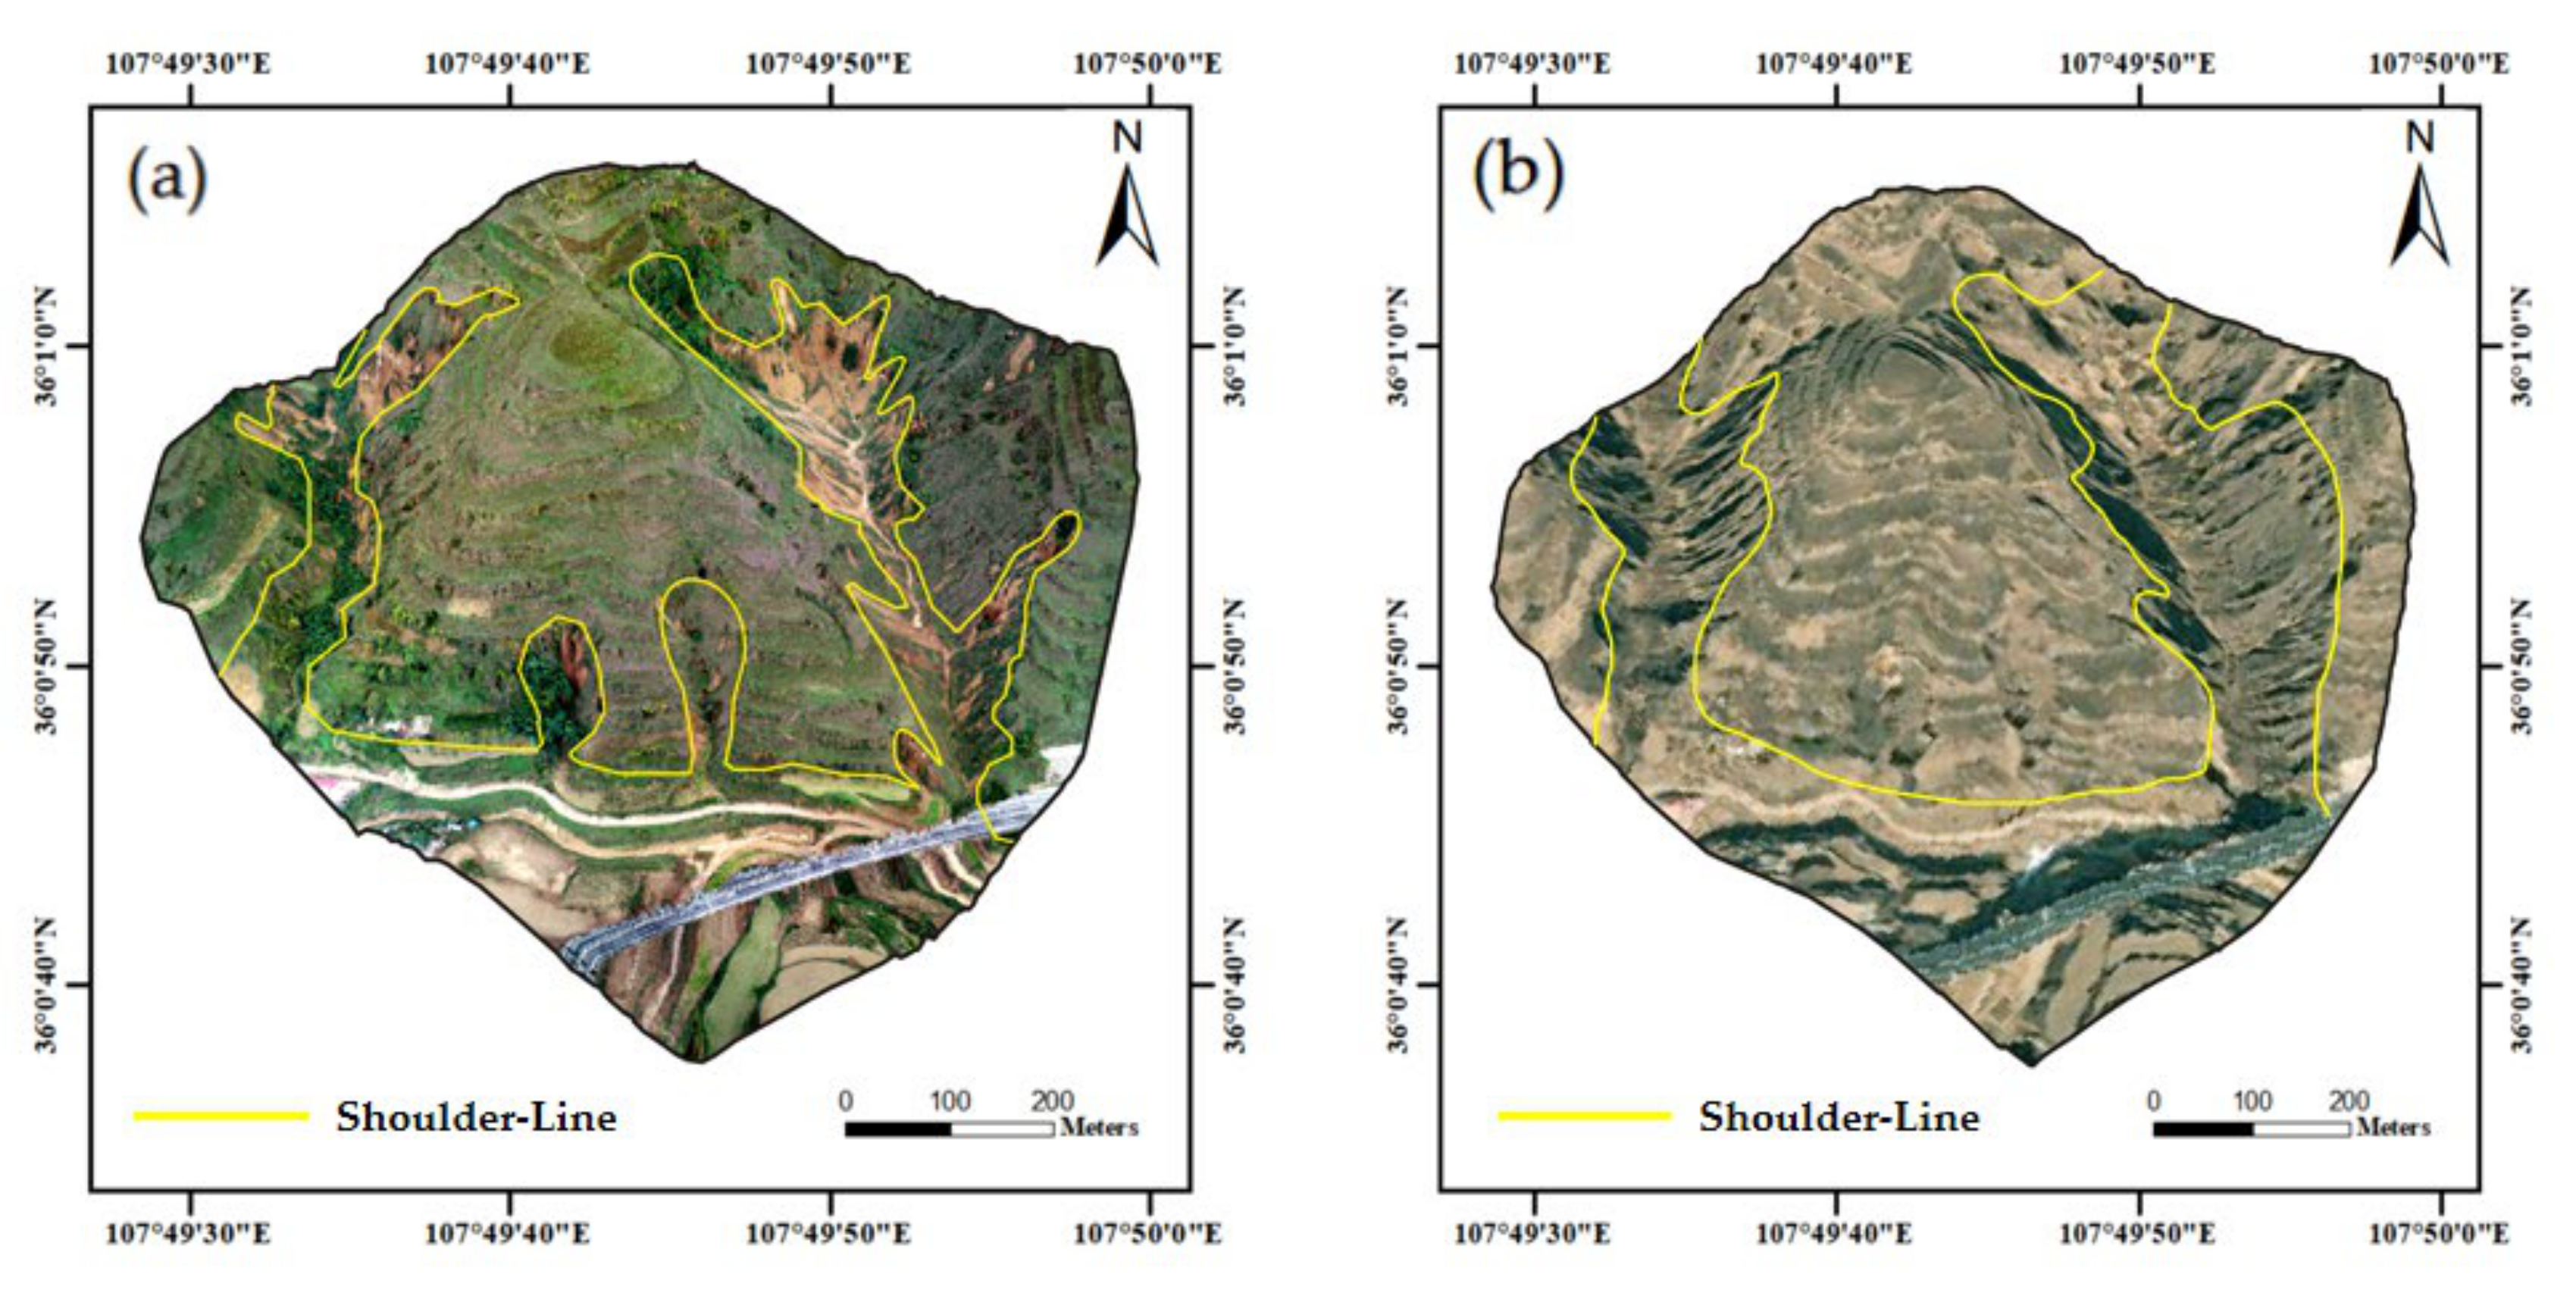
  • In terms of the spatial distribution, it is well developed along the slope strike direction between the ridge and valley lines with a suitable continuity (Figure 2b).
  • In terms of land use, above the shoulder line, there are mostly terraces and vegetation development; in contrast, there is usually a barren wasteland exposed due to gully erosion in the positive terrain area, and these features can be reflected in remote sensing images (Figure 2c).
  • The macroscopic morphology of the shoulder line mostly includes jagged (Figure 2d) and palm-shaped patterns (Figure 2e).
Combining the above four features, the first two aspects were adopted as the basis of automatic extraction, and the third and fourth points were employed as the basis of the accuracy assessment.
It is worth noting that there are also slope mutations on both sides of the tableland line (Figure 3), which is defined as the intersection line between the tableland and sloping land regions, and most of them are attributed to human engineering activities. Compared to the shoulder line, the macroscopic morphology of the tableland line is smoother. The slope difference between the two sides of the tableland line is small, generally below 15 degrees. Based on the above features, this paper overcame the interference of the tableland line on the results through the design of the automatic extraction method.

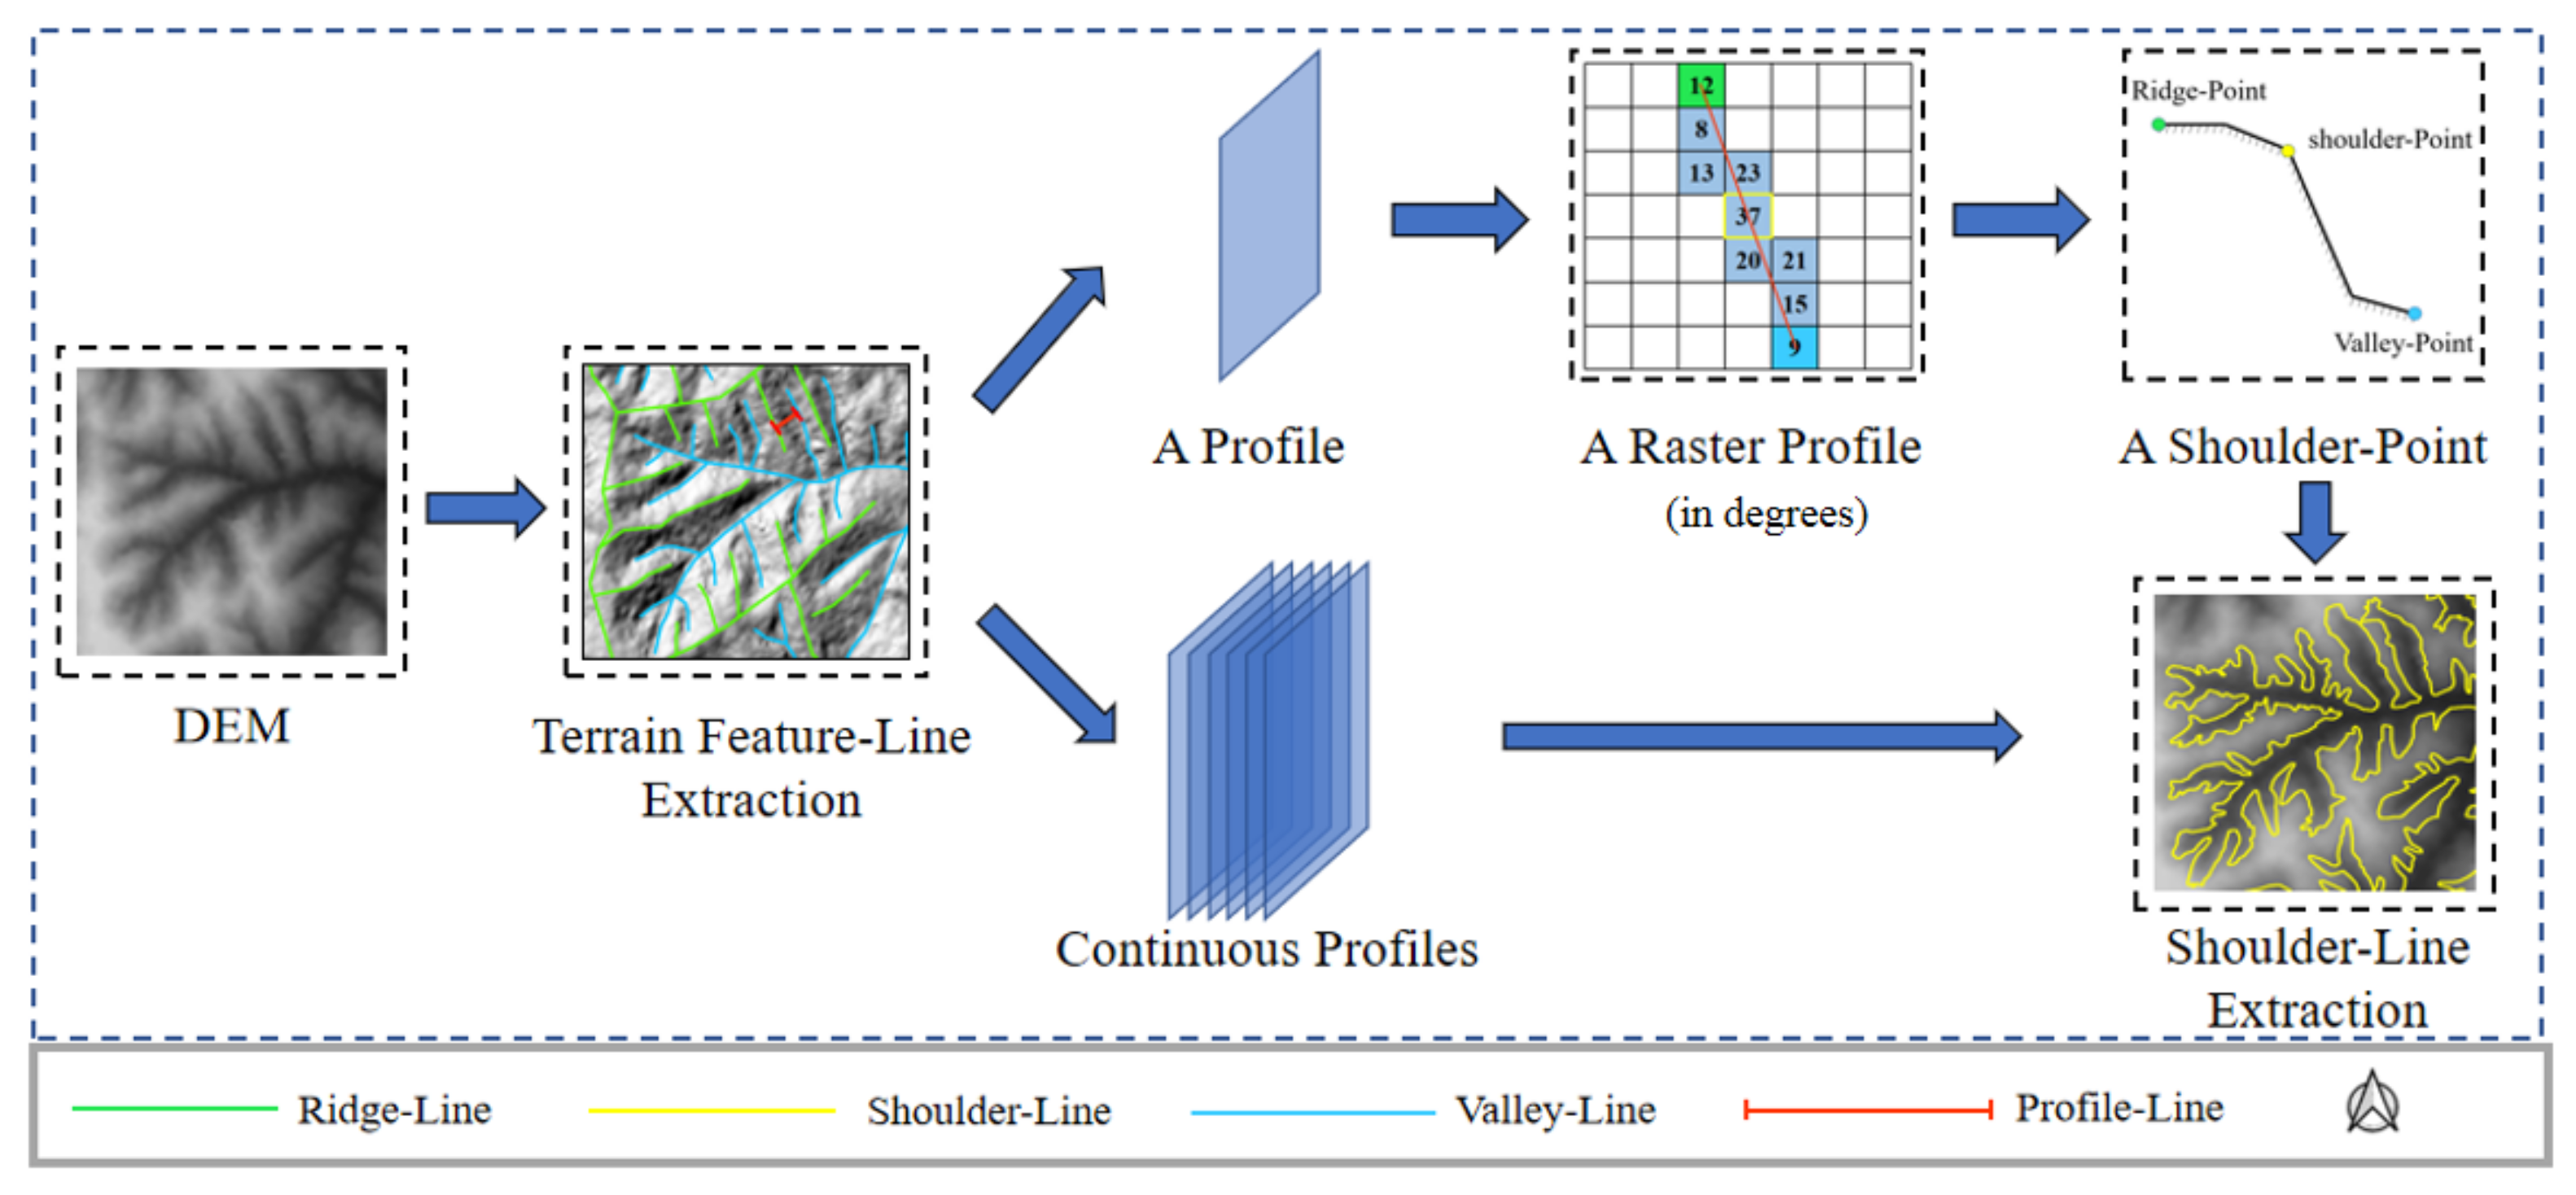
3.2. Extraction Principle and Method

3.2.1. Extraction Principle

Based on the demarcation basis, the extraction principle of the proposed method is shown in Figure 4.

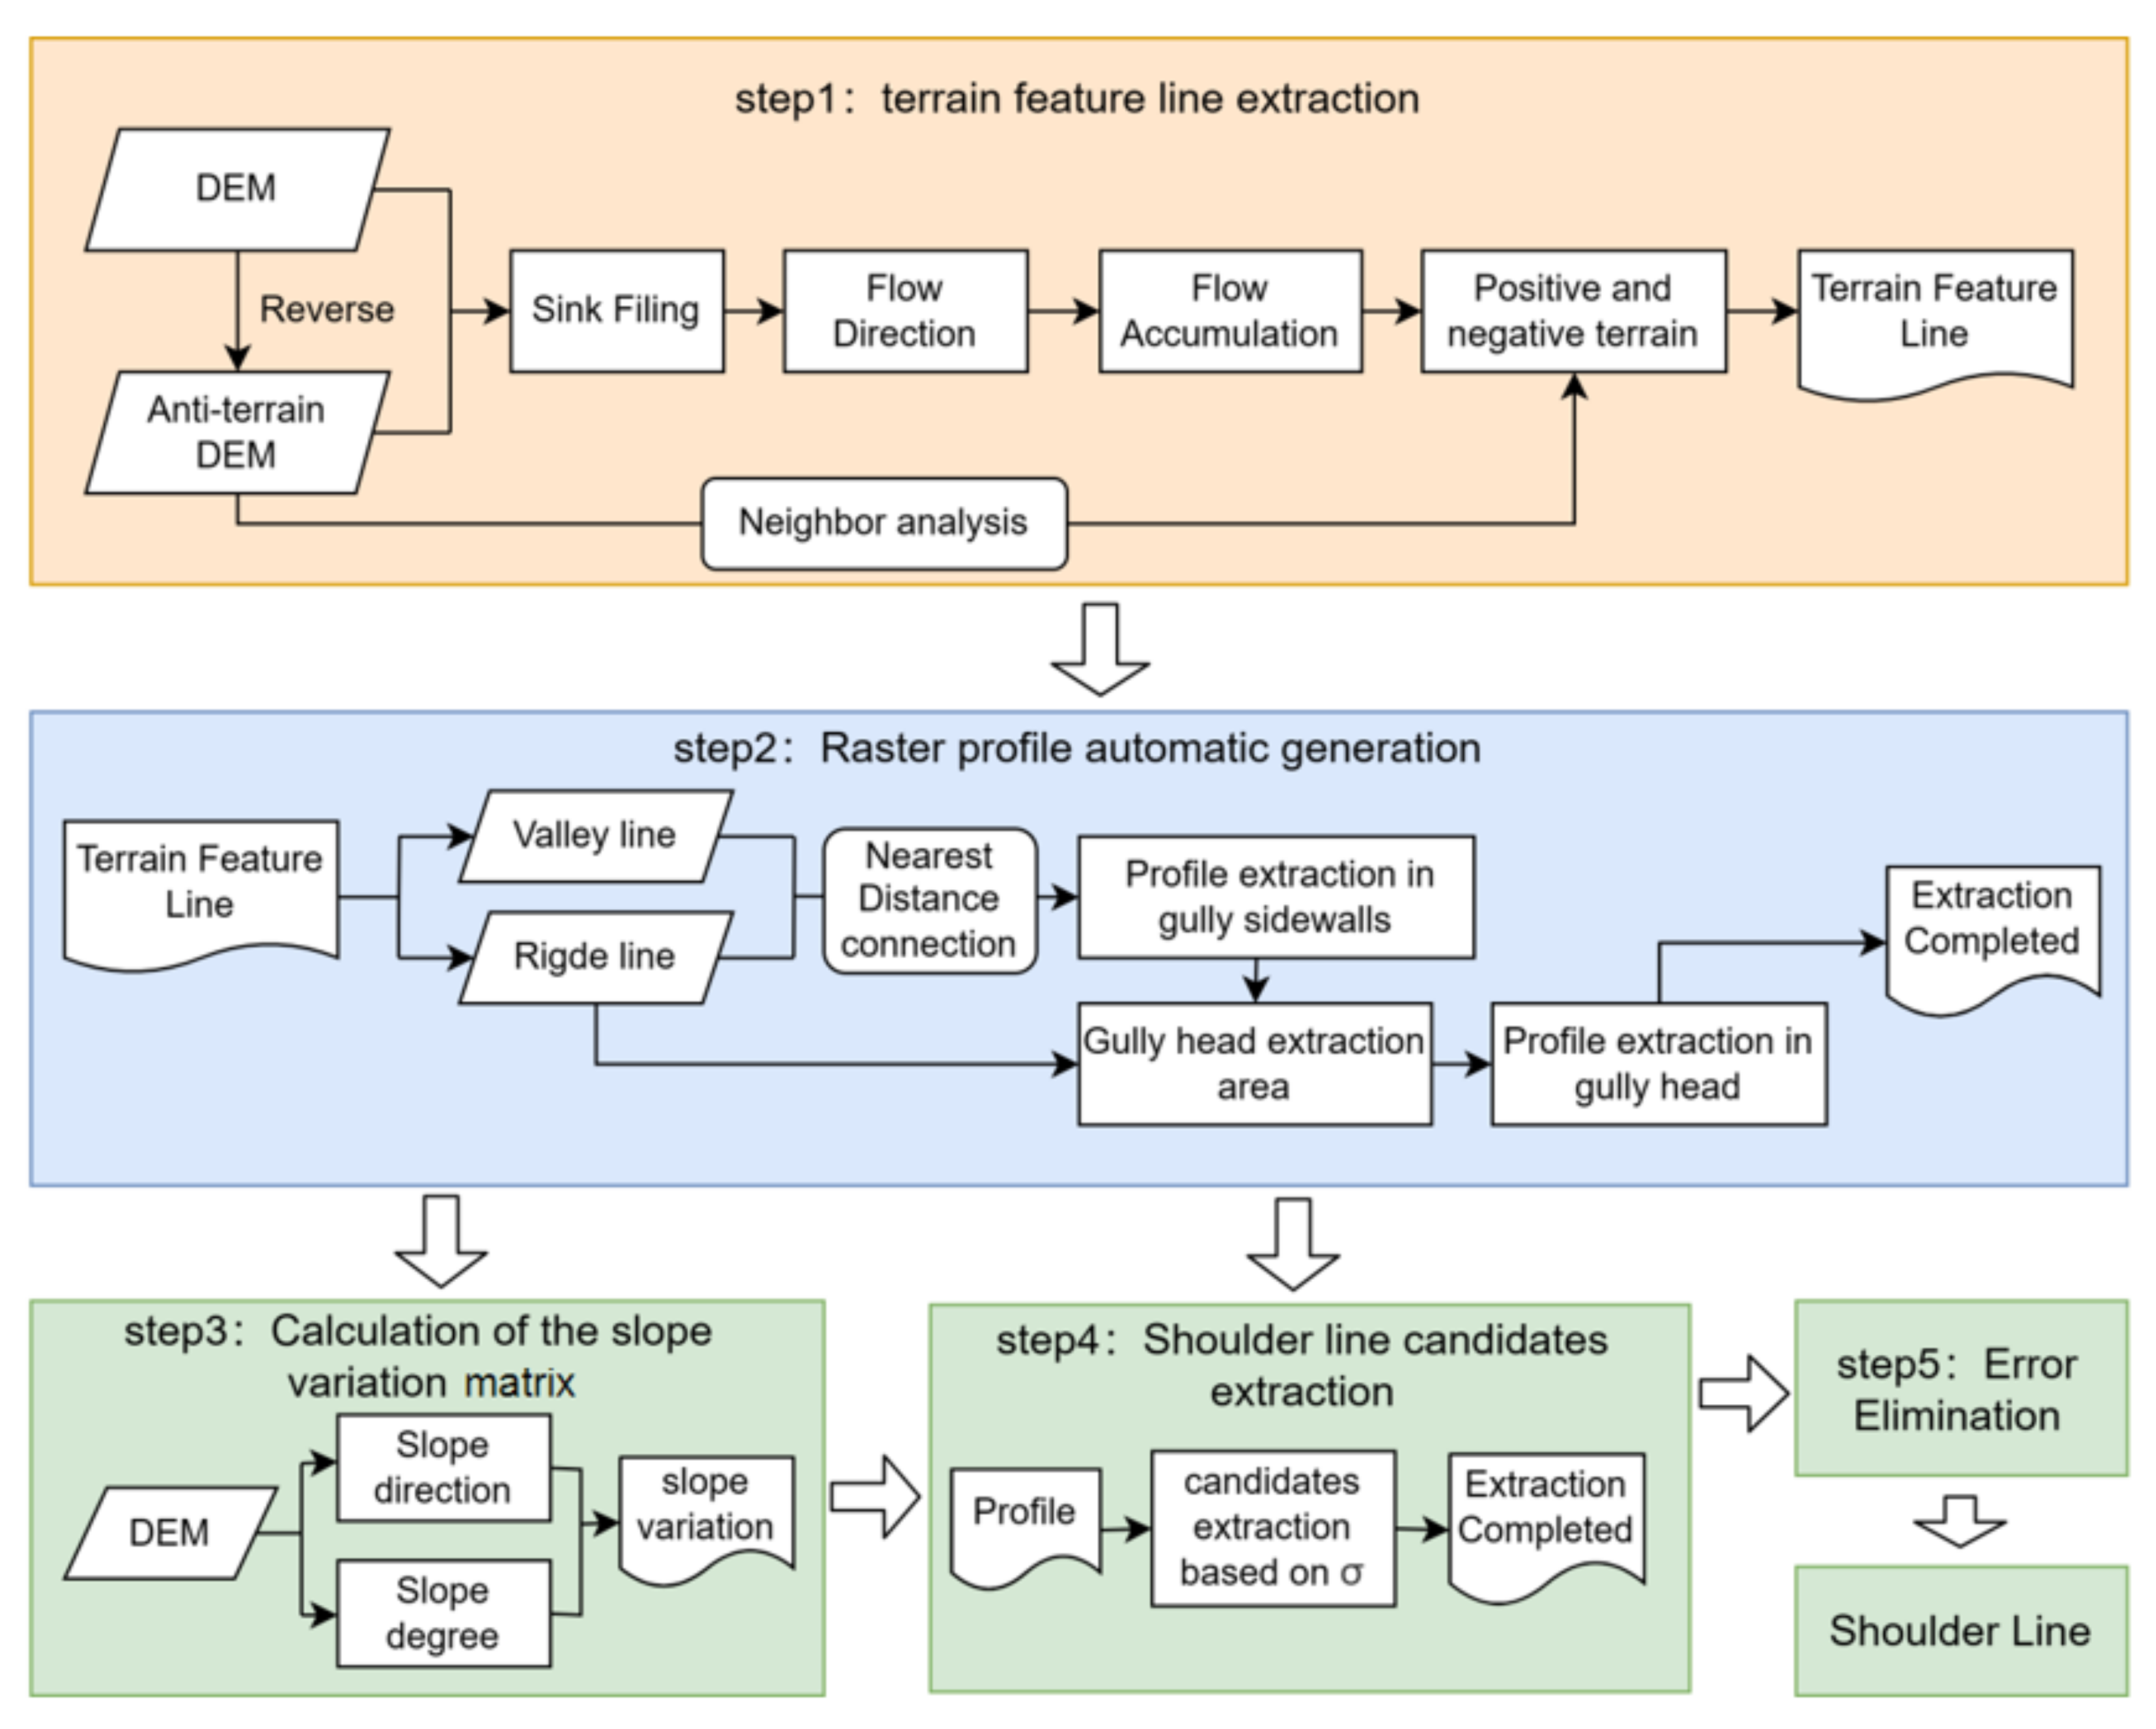
3.2.2. Extraction Method

The extraction method of the shoulder line consists of five steps (Figure 5). First, the topographic feature lines are automatically extracted based on the hydro-analysis module of ArcGIS10.8. The second step is to generate a continuous raster profile along the direction of the slope strike between the ridge and valley lines. The third step is to traverse all the pixels based on the DEM with a 5 m resolution in the test area and calculate the slope variation matrix. In the fourth step, pixels with a priority ranking of the slope variation in each profile are screened as candidate units for the shoulder line. In the last step, the error is eliminated via the depth first search (DFS) algorithm to extract the shoulder line in the test area. The specific extraction steps are described below.
The first step is to extract terrain feature lines. The topographic feature line is an important geomorphic boundary line to describe the structure of the terrain skeleton and reveal the nature of the geomorphology. It consists of ridge and valley lines, where the ridge line is the line connecting the highest points of the ridge, which is the line formed at the top of the strip-like rise in the topographic morphology (Figure 6a); in contrast, the valley line is the line connecting the lowest points of the valley (Figure 6b) [27,28].
Currently, research on the extraction method of topographic feature lines is at a relatively mature stage, and many methods have been proposed [29,30,31]. In this paper, the flow threshold determination method based on the ArcGIS 10.8 hydroanalysis module was used for extraction [30], and the algorithm is easy to implement, while the results are more applicable to the subsequent shoulder line extraction.
In the positive and negative terrain extraction, the mean filtering method [21] was chosen to extract it to prevent ridge lines from entering the negative terrain area and similarly prevent valley lines from entering the positive terrain area. Although this method can divide positive and negative terrain regions and obtain a continuous shoulder line, the extraction accuracy is not high; generally, it reaches approximately 70% [19,23], and especially in an area with more depressions, the distribution extraction accuracy cannot be guaranteed. However, the algorithm of this method is simple and easy to implement, and through testing, the error generated by it exerts little interference on topographic feature line extraction [30]. According to the test in the study area, the size of the mean filtering analysis window in this paper was set to 21 m ∗ 21 m [21].
The second step is the generation of raster profiles. Topographic feature lines are widely used in the task of extracting slope units in geological hazard evaluation [32,33] and terrain data generation [34]. Inspired by this research and based on the feature whereby shoulder lines develop along the direction of the slope strike, this paper extracted it based on ridge and valley lines.
In order to extract continuous and complete profiles, we divided it into the profile extraction of the gully sidewalls and gully head. First, the profiles of the gully sidewalls were extracted, as we followed the principle of connecting units based on the nearest distance; then, each unit of a ridge line was connected to the unit of its nearest valley line to form a profile line, and the units where the profile line overlapped were extracted as a raster profile, and the same occurred with the valley line. Secondly, the area enclosed by the ridge line and the profiles on both sides were taken as the gully head extraction area (Figure 7b), with the endpoint of the valley line as the center of the circle, which launched a straight line that ended at the ridge units in the gully head extraction area. To improve the efficiency of the operation, the angle α should satisfy the following Equation (1) to remove profiles with too much overlap; additionally, as the profile extraction between different regions does not interfere with each other, a parallel algorithm [19] was adopted in this paper to improve the efficiency, as shown in Figure 8.
α ( ° ) 2 tan 1 d l
Where d is the length of the sides of the pixel, l is the length of the profile being generated, and α is the angle between the two profiles.
The extraction of raster profiles mainly includes the following two types (Figure 7):
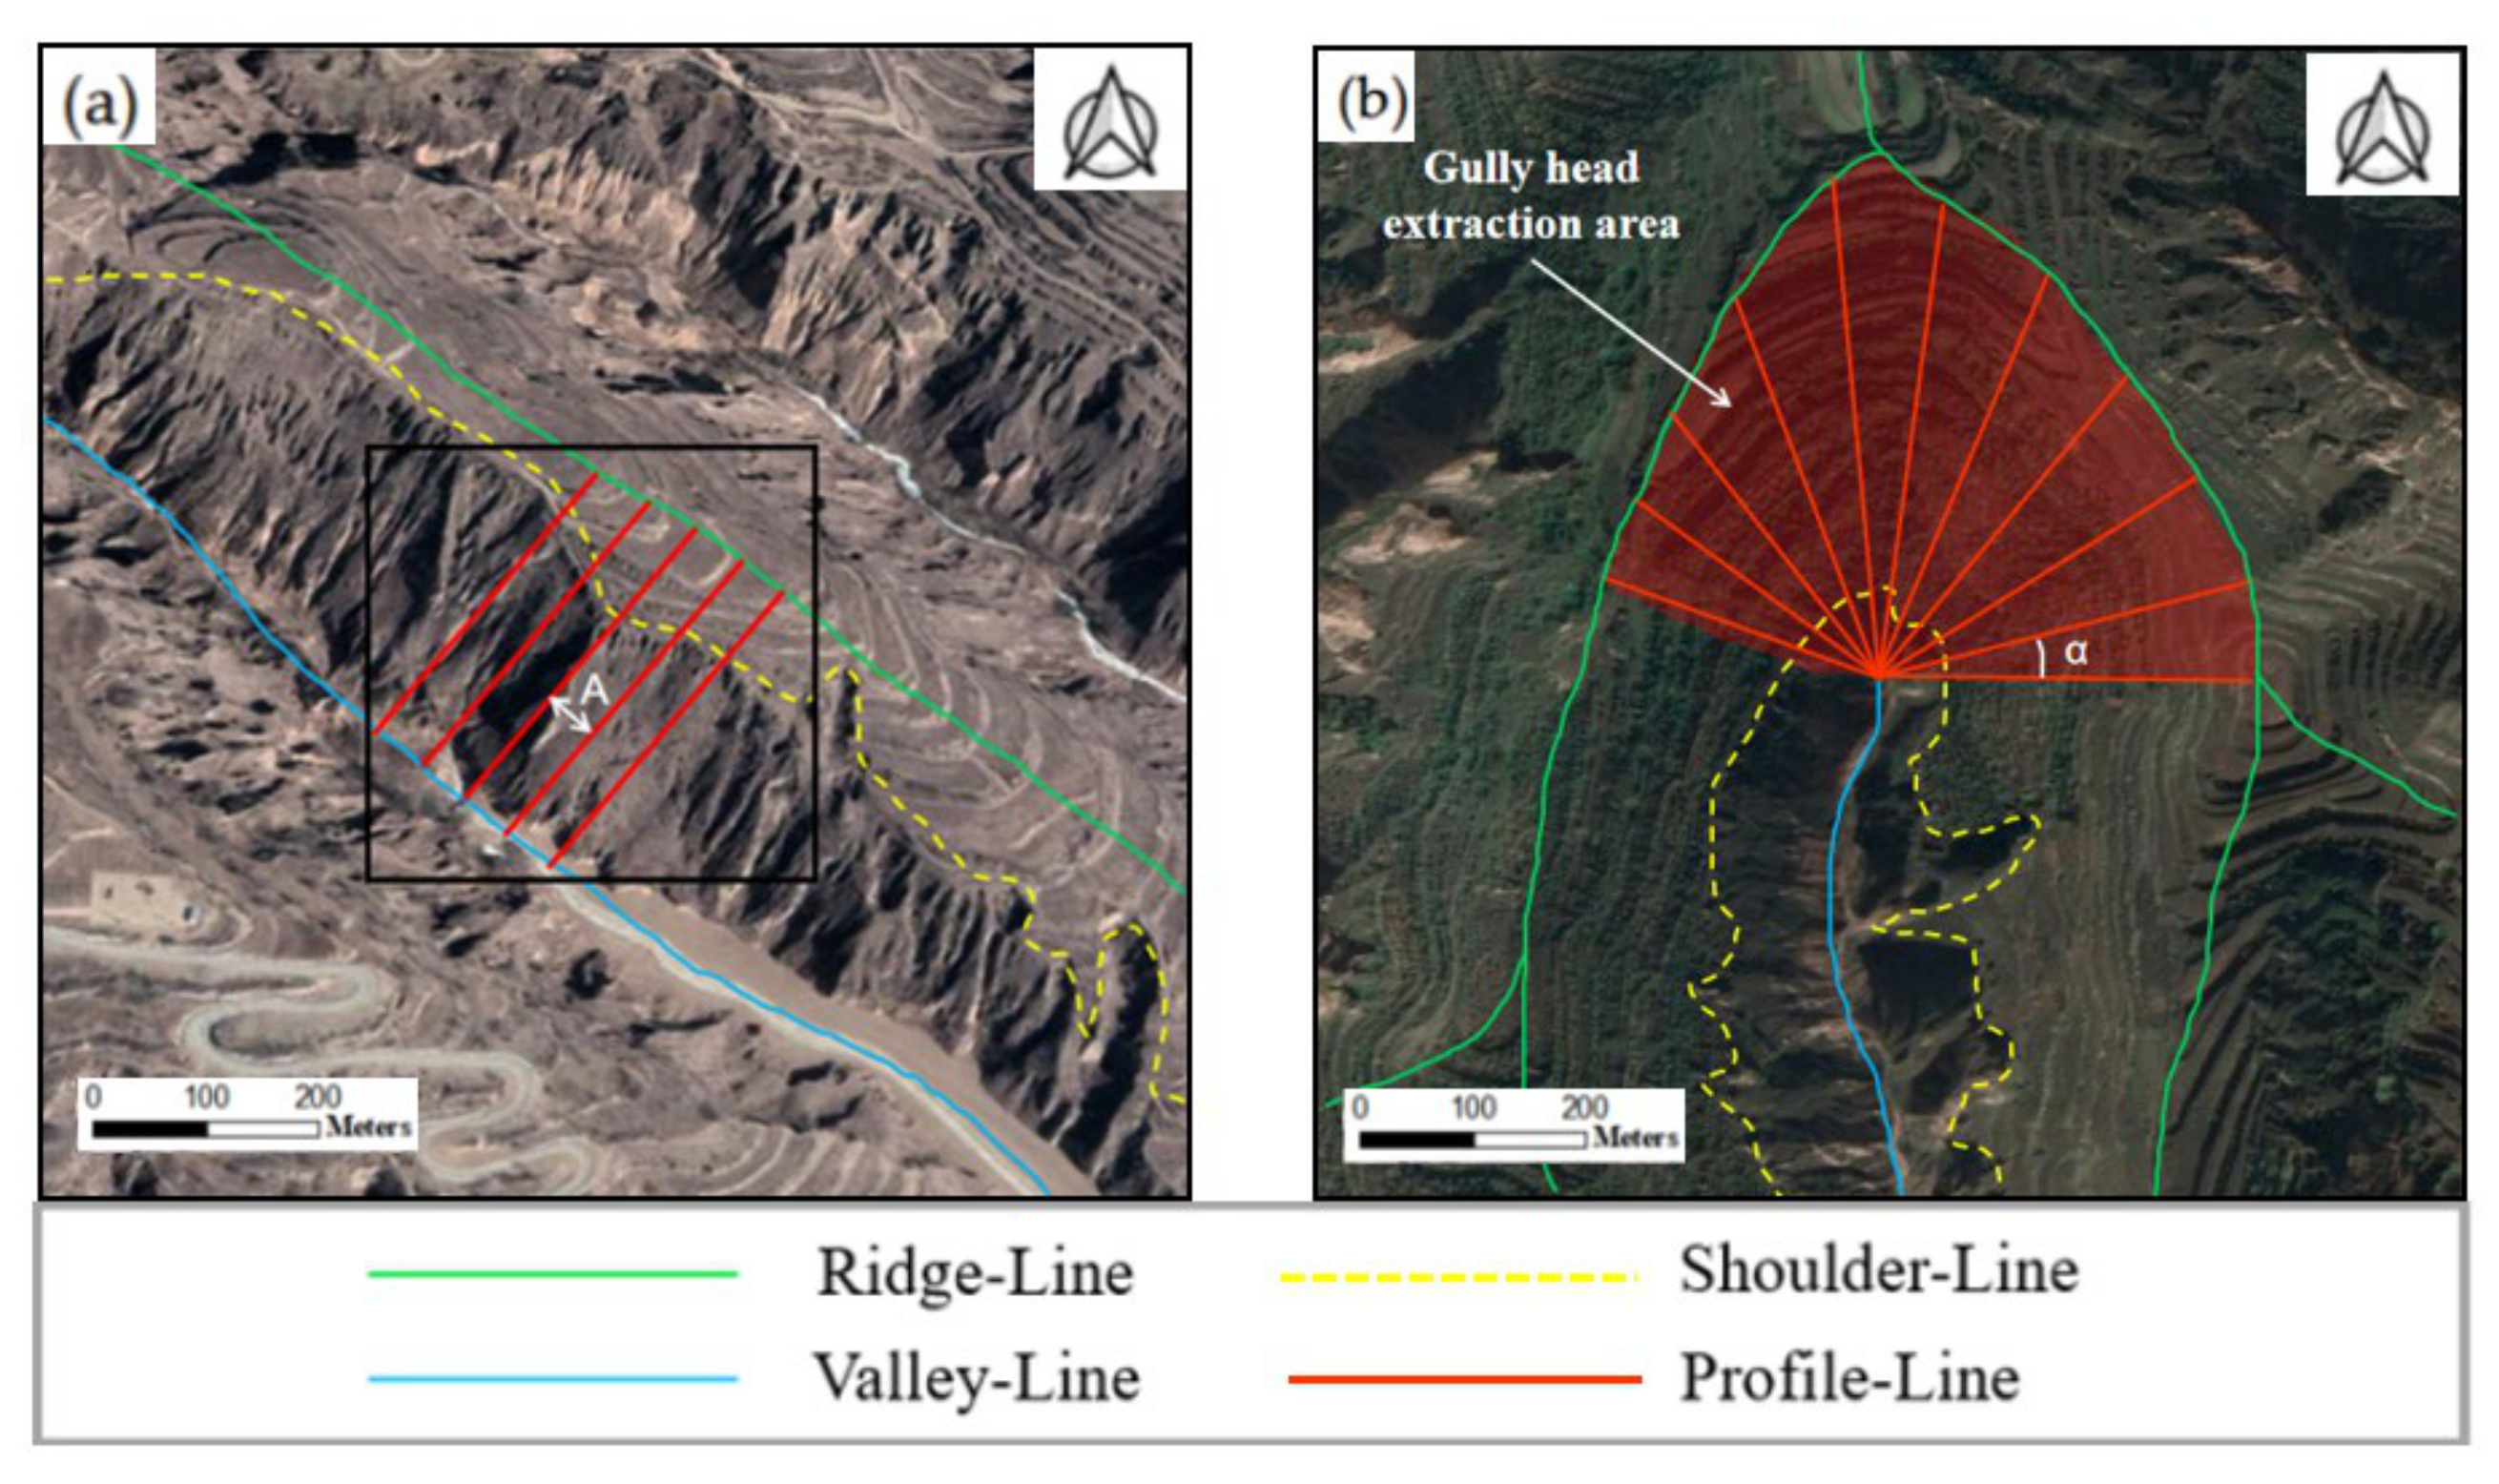
  • In the extraction at the gully sidewalls, the ridge and valley lines have nearly the same direction, and the extracted profiles are approximately linearly distributed as shown in Figure 7a. The interval distance is the size of one pixel, represented as A.
  • In the extraction at the gully head, the location relationship between the ridge and valley lines is shown in Figure 7b; the extracted profile has an approximately fan-shaped distribution, and the intersection angle is α.
The third step is the calculation of the slope variation matrix. Zhou [15] designed an analysis operator (Figure 9) to accurately extract the P-N topography of 48 geomorphic units in different areas of the Loess Plateau using a 5 m resolution DEM as the original test data. In this paper, a slope variation matrix of the test area was calculated based on this analysis operator, and the aspect and slope matrix that could be derived from the DEM data using ArcGIS 10.8 were used for the detection. The calculation principles are as follows:
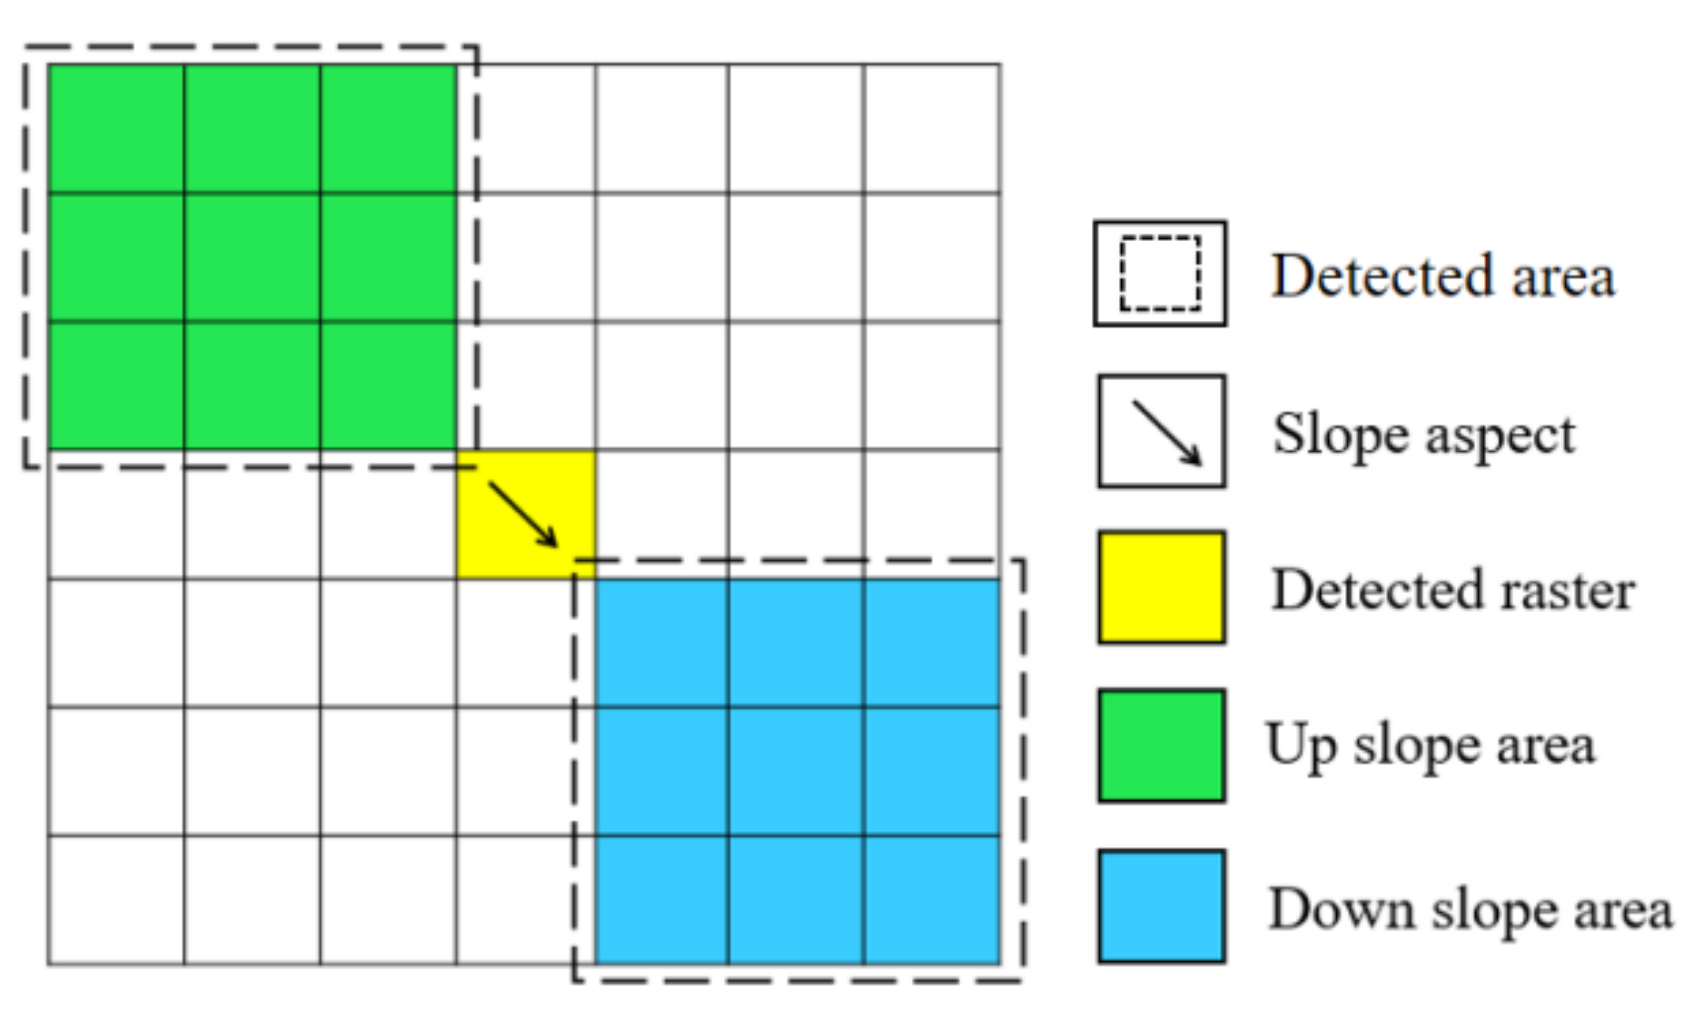
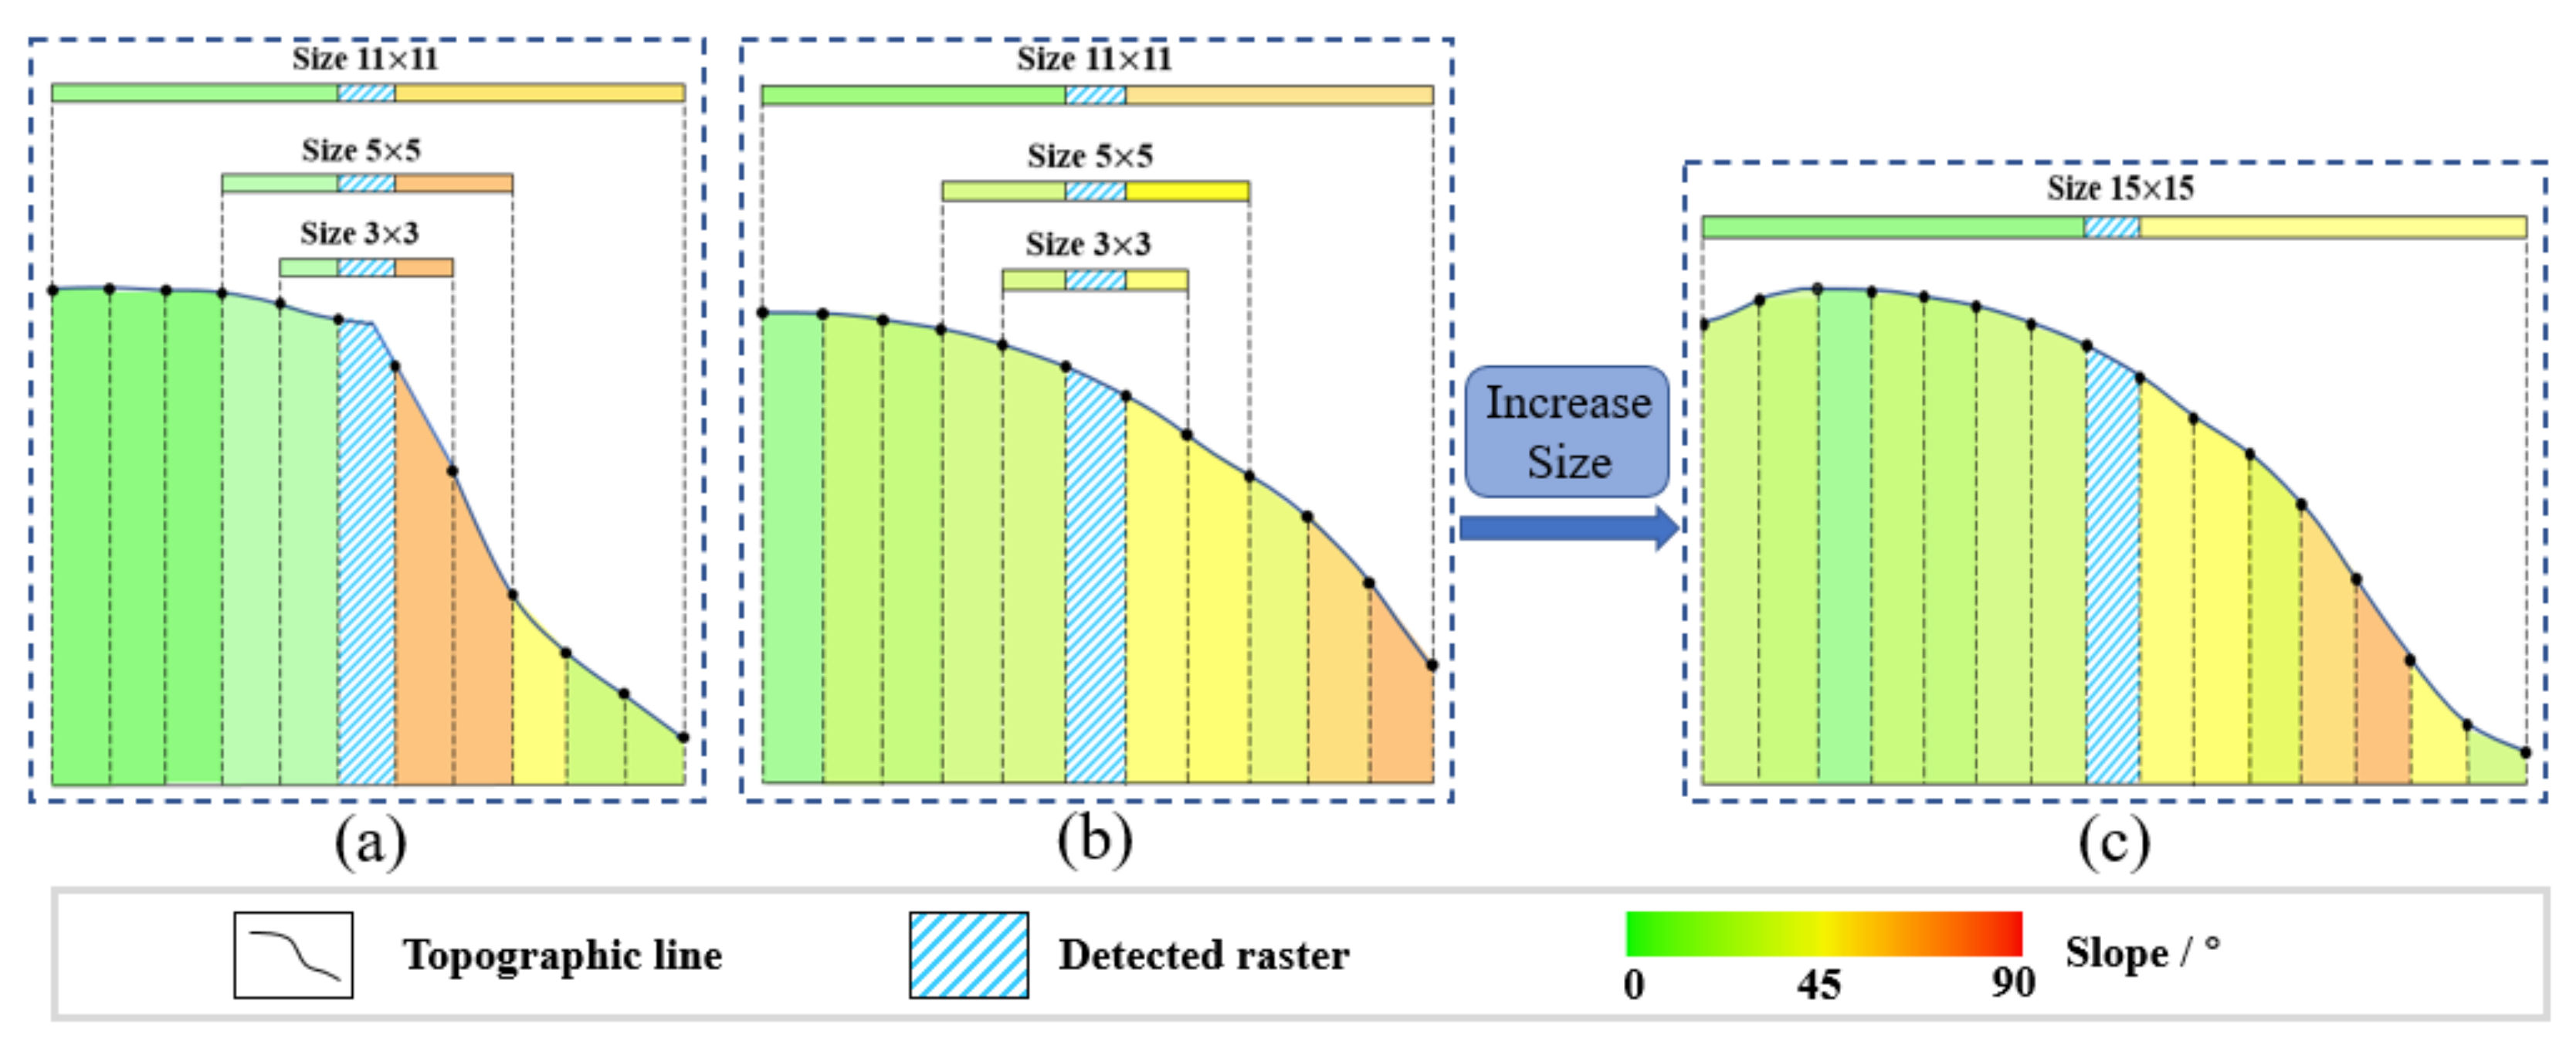
  • Through assessment of the upslope and downslope location relationship according to the slope direction, the horizontal projection of the slope direction yields the downslope position.
  • The slope of the upslope part is subtracted from that of the downslope part, and the entire test area is traversed to generate the slope variation matrix.
The fourth step is the extraction of the shoulder line candidates. According to the definition of the shoulder line, based on the slope variation matrix, the pixel with the highest slope variation value (β,β > 15°) in each profile was scanned and extracted as a shoulder line candidate [15,16,17]. However, during the test, it was found that complex landforms such as terraces interfered with the results, resulting in real shoulder points being missed in the extraction. To improve the extraction accuracy, this paper extracted pixels with rank α below the filter threshold (σ) as shoulder line candidates. The value of parameter σ is examined in Section 5.2.2.
The final step is to eliminate errors. In step four, to overcome the interference of complex terrain on the extraction results, we increased σ, resulting in certain errors. The main feature is the development of isolated shoulder line candidate units in the terrace area. However, the shoulder line develops continuously along the slope strike direction in the complete watershed. Based on this feature, this paper adopted the depth-first search (DFS) method [35,36], the principle of which aims to eliminate isolated candidates with lengths less than 50 m (10 units) to successfully extract the shoulder line in the test area.

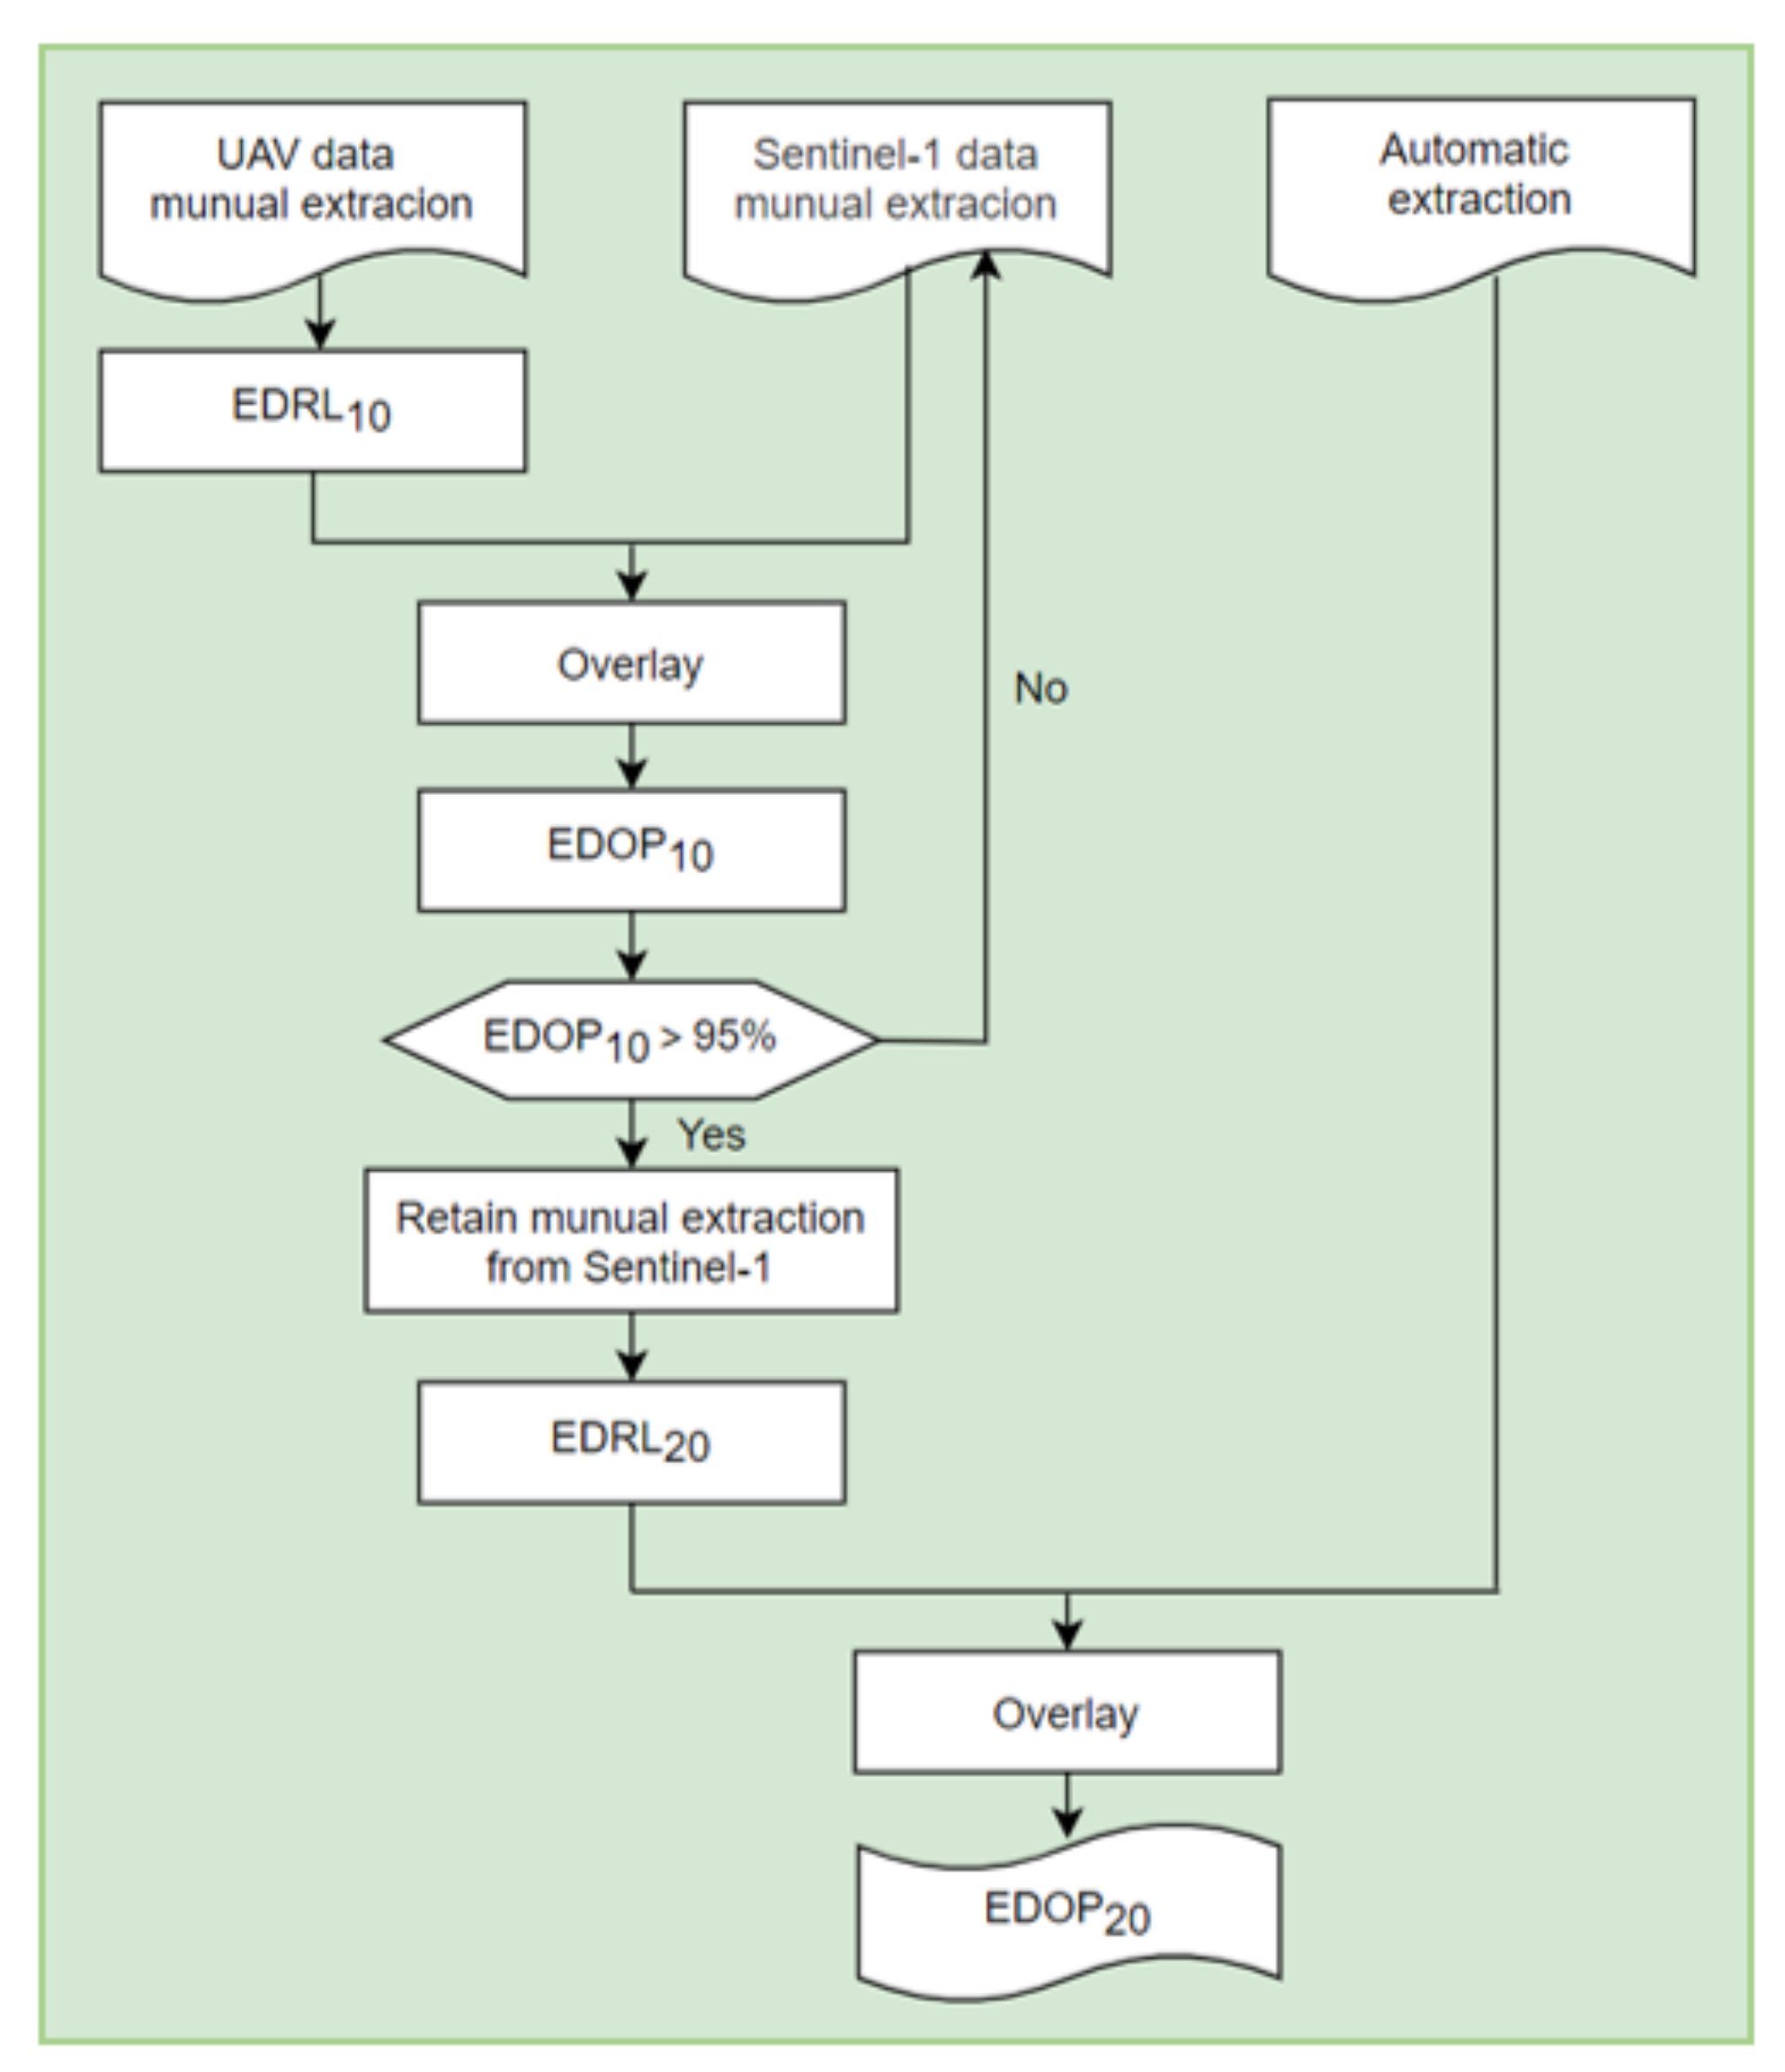
3.3. Accuracy Verification

To verify the accuracy of the proposed method, the extraction results were compared to the reference data and evaluated via two indexes, the Euclidean distance raster layer (EDRL) and Euclidean distance offset percentage (EDOP) [18], where EDRLa is a European distance raster layer consisting of a maximum offset distance a (in meters) set on each side with the reference data as the base, calculated in ArcGIS 10.8 Euclidean distance modules. The value of EDOPa represents the accuracy of extraction, and it can be calculated as follows:
EDOP % = N i n N t o t a l × 100 %
where Nin is the number of pixels whose extraction results are located in EDRLa and Ntotal is the total number of pixels extracted.
For the acquisition of reference data, scholars usually adopt the manual depiction method based on satellite images [19,22,23], which suffers the following two defects:
  • The satellite image is 2D and can only be recognized by image texture, and it is easy to ignore the 3D information.
  • Satellite images are synthesized with multiple bands, and the maximum number of bands can be more than 350, resulting in a large difference between the image and the real terrain.
With the increasing maturity of low-altitude UAV technology in the field of soil erosion [37,38,39], it can generate 3D models with centimeter-level accuracy based on SfM-MVS technology (Figure 10), which is significantly helpful for the manual depiction of the shoulder line. Based on this approach, we improved the accuracy assessment method in this paper (Figure 11). Considering the time cost, we used an unmanned aerial vehicle (UAV) to scan 10% of the area containing the larger test area. A nadir-only image set accompanied by the dense deployment of ground control points (GCPs) was used in the flight plan, which yielded better results [38].
Therefore, this paper used 1 m resolution Google images (Worldview, Quickbird) combined with the 0.1 m resolution DOM from UAVs in typical areas as the remote sensing verification data, and the manual depiction of three test areas was used as the reference data.
In addition, we also acquired the measured data in the field to verify the reference data [8,9,40,41]. Ten typical gully heads were selected on the basis of the manual extraction of shoulder line data, and 10 points were selected at 50 m intervals on the shoulder line of each gully head area, while their corresponding latitude and longitude coordinates were generated. The 100 typical points were verified with real measurements in the study area; if the Euclidean distance of the real shoulder line points was within 10 m, the reference data were judged to be correct and the reference data could be considered reliable. The results of the verification are shown in Table 2.

4. Results

Based on the extraction method in Section 3.2, the performance of the proposed method was assessed by choosing the Bianjiagou watershed as an example (Figure 12a). The watershed is a typical area on the Loess Plateau with various landscape features. The DEM of the test area is shown in Figure 12b, and the shoulder line extraction results are shown in Figure 12c. According to the shoulder line extraction results, the continuity is satisfactory because the development direction of the shoulder line matches the direction of the slope strike in the test area. Moreover, in terms of macroscopic morphology, it is developed in palm-shaped (Figure 12d) and jagged (Figure 12e) shapes.

5. Discussion

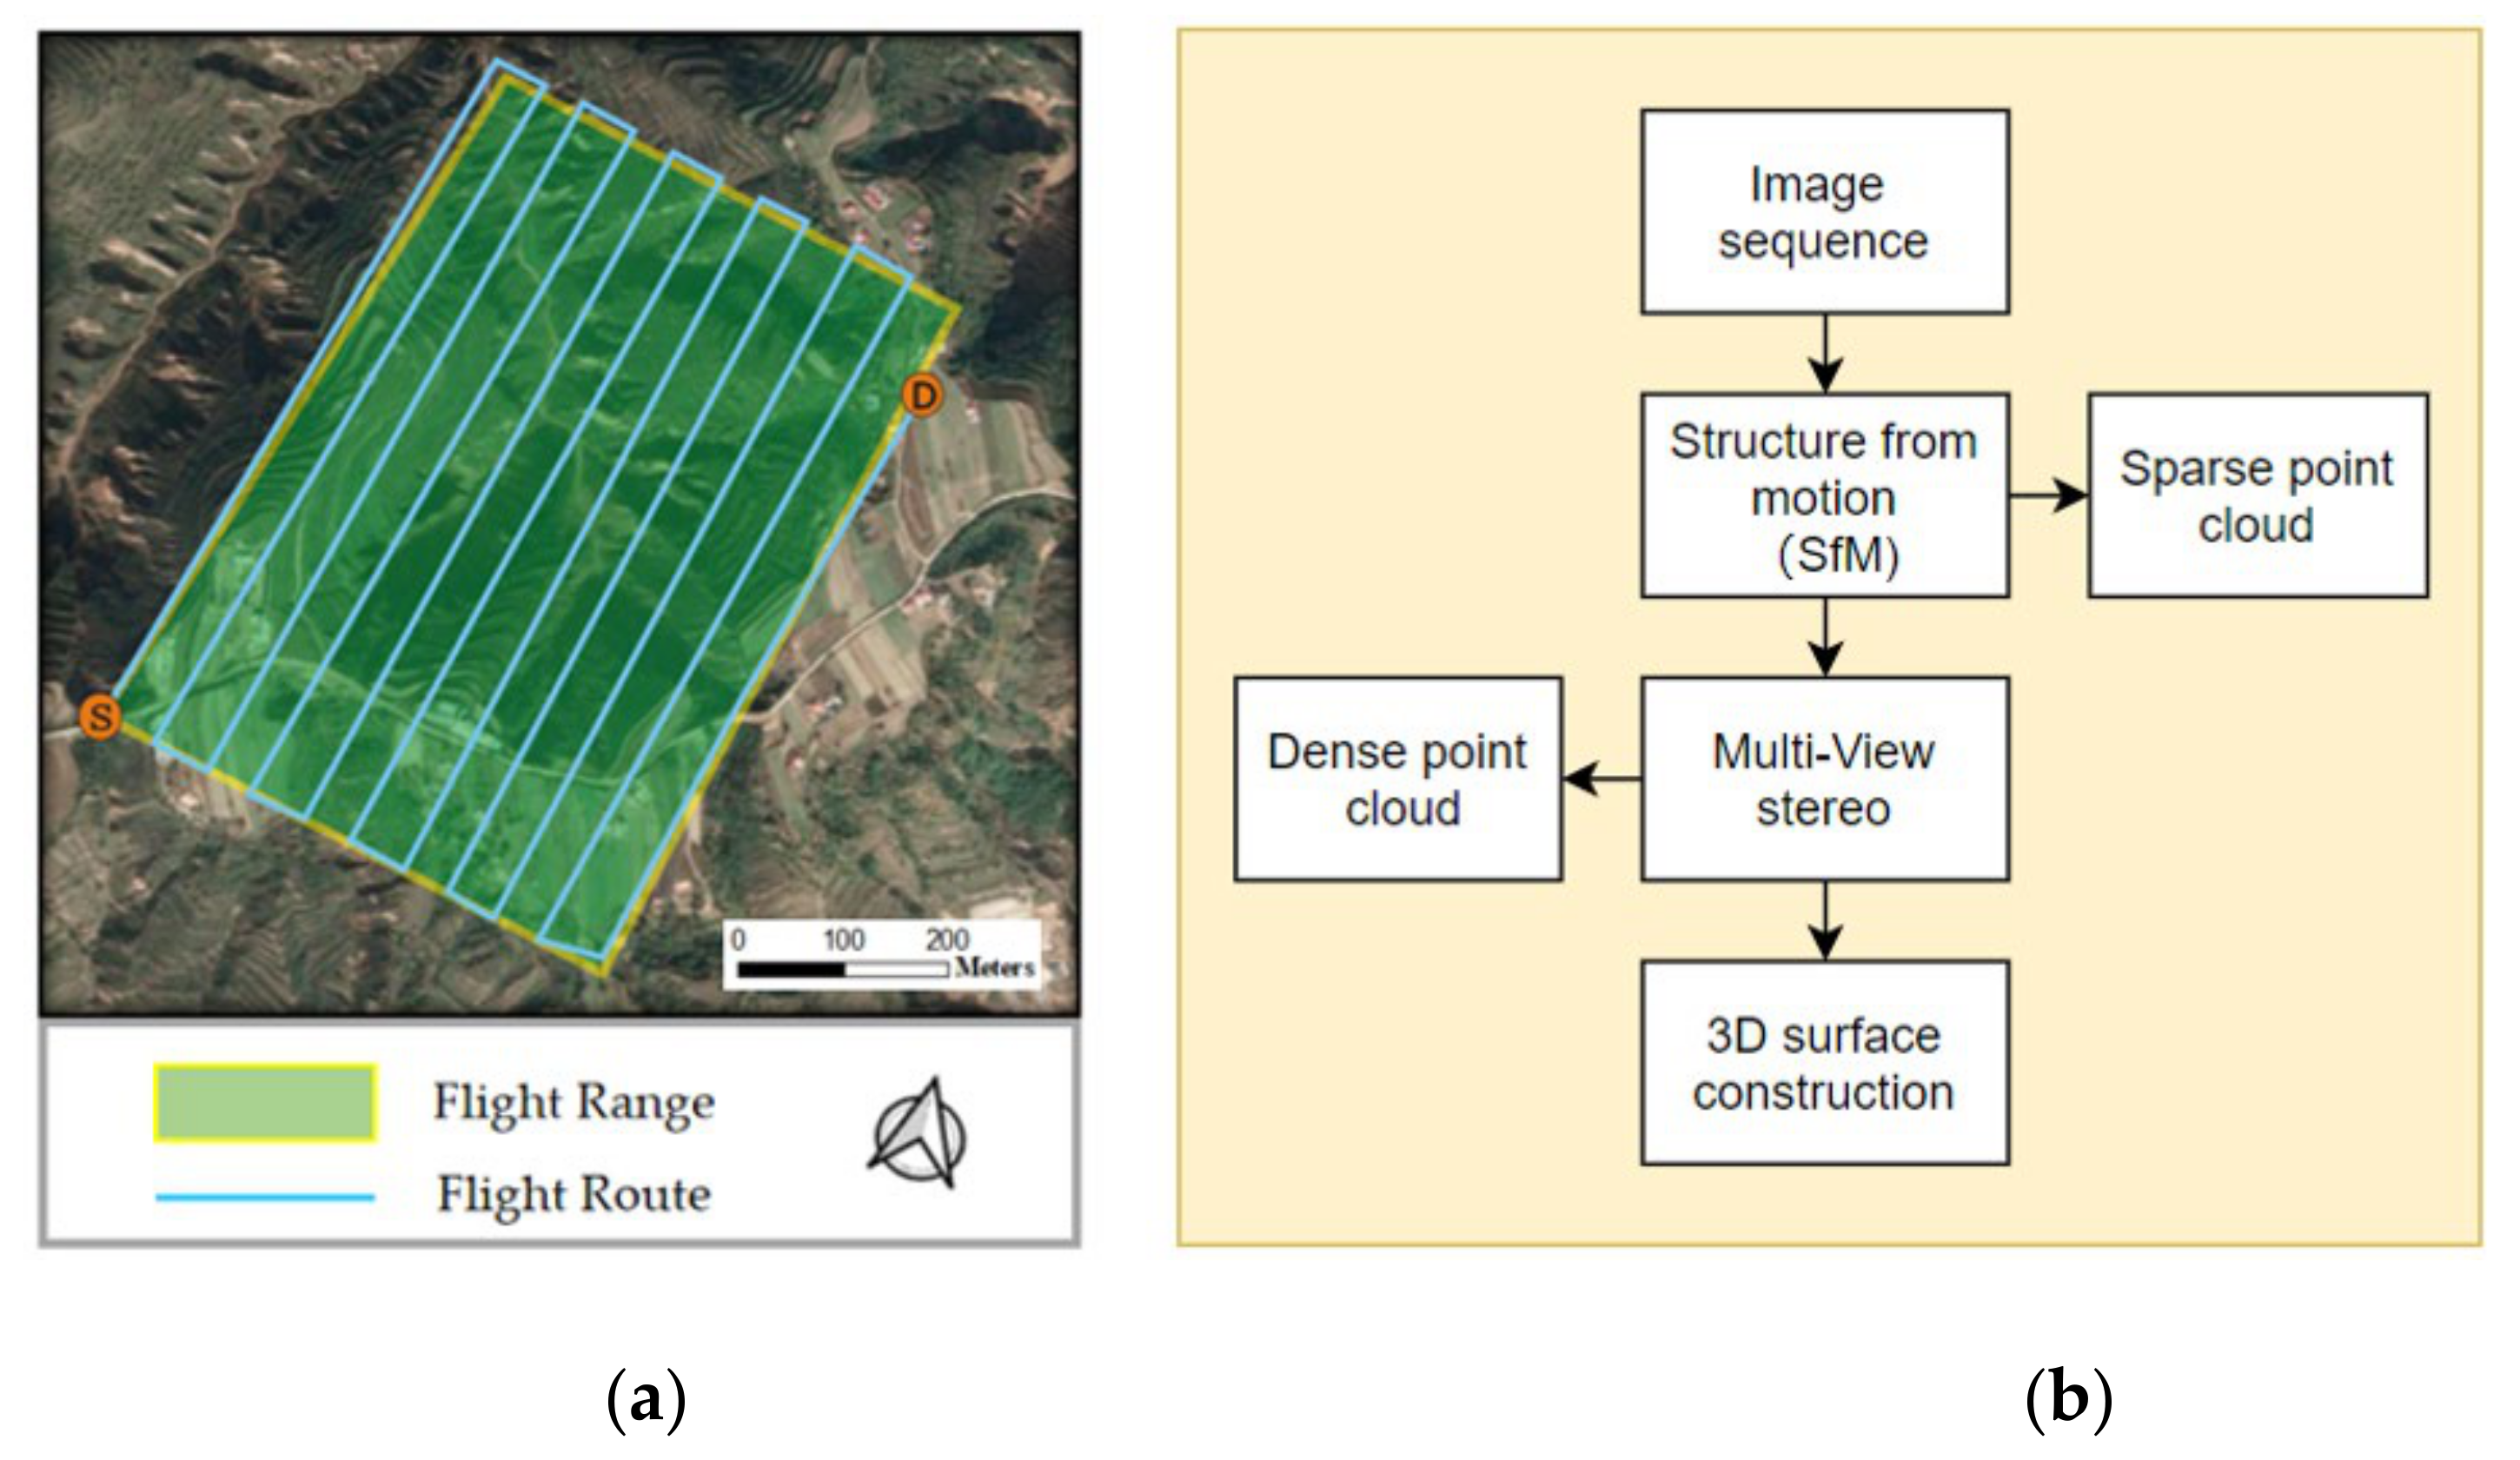
5.1. Accuracy Verification via SfM-MVS

Numerous studies have indicated that very-high-resolution topographic data can be produced based on SfM-MVS, comparable to TLS [42,43]. It provides significant advantages in feature extraction, and with great applicability and convenience [44,45,46], it helps to improve the accuracy of the reference data and increase the conviction of accuracy verification.
In this paper, a typical area in the Bianjiagou watershed was scanned by the UAV, and a total of 634 aerial photographs were obtained during the aerial campaign, and all of them were calibrated. The 3D surface reconstruction result based on SfM-MVS is shown in Figure 13a, and the extracted parameters are listed in Table 3. Moreover, based on the Google Earth images, satellite images of the same location were obtained (Figure 13b).
Compared to the UAV images, although the satellite images could conform to the manual extraction results to a certain degree, the satellite images were synthesized by entailing multiple bands, resulting in an inability to employ color information as the basis for extraction and an overreliance on image texture features, yielding a low extraction accuracy. In contrast, the UAV images could distinguish positive and negative terrain regions via barren land, vegetation, and color variation features. In addition, the 3D model provided more details on the 3D structure of the gully sidewalls and gully heads, but the satellite images lacked 3D information [47,48,49]. UAV imagery based on SfM-MVS provided a valuable intermediate scale between the satellite and field scales, strengthening the relationship between these scales, and these two sources of remote sensing data could be compared and were complementary according to the research requirements [49,50]. Compared to single-scale data, disaster monitoring and mechanism analysis based on multisource and multiscale data will comprise the main focus of future research.

5.2. Parameter Analysis

5.2.1. DEM Resolution Determination

The DEM resolution is highly uncertain for the representation of the loess erosional gully morphology, and there is an optimal resolution range for calculating each gully character expression indicators [51]. Dai [13] determined the most suitable resolution range for gully mapping based on the multidirectional hill-shading method. In the shoulder line extraction algorithm of this paper, as it was necessary to traverse the test area by analysis operators to extract shoulder line candidate units, too high a DEM resolution would lead to an exponential increase in computing volume and would also generate too much error, making the extraction accuracy and efficiency reduced. The DEM resolution of 5 m was confirmed by many scholars to be sufficient for the dynamic monitoring of shoulder lines and the study of spatial heterogeneity research of shoulder lines [15,17,19,22]. Furthermore, the proposed algorithm was not very dependent on the high-resolution DEM and did not improve significantly on the extraction accuracy. Therefore, this paper used a DEM resolution of 5 m for the shoulder line extraction.

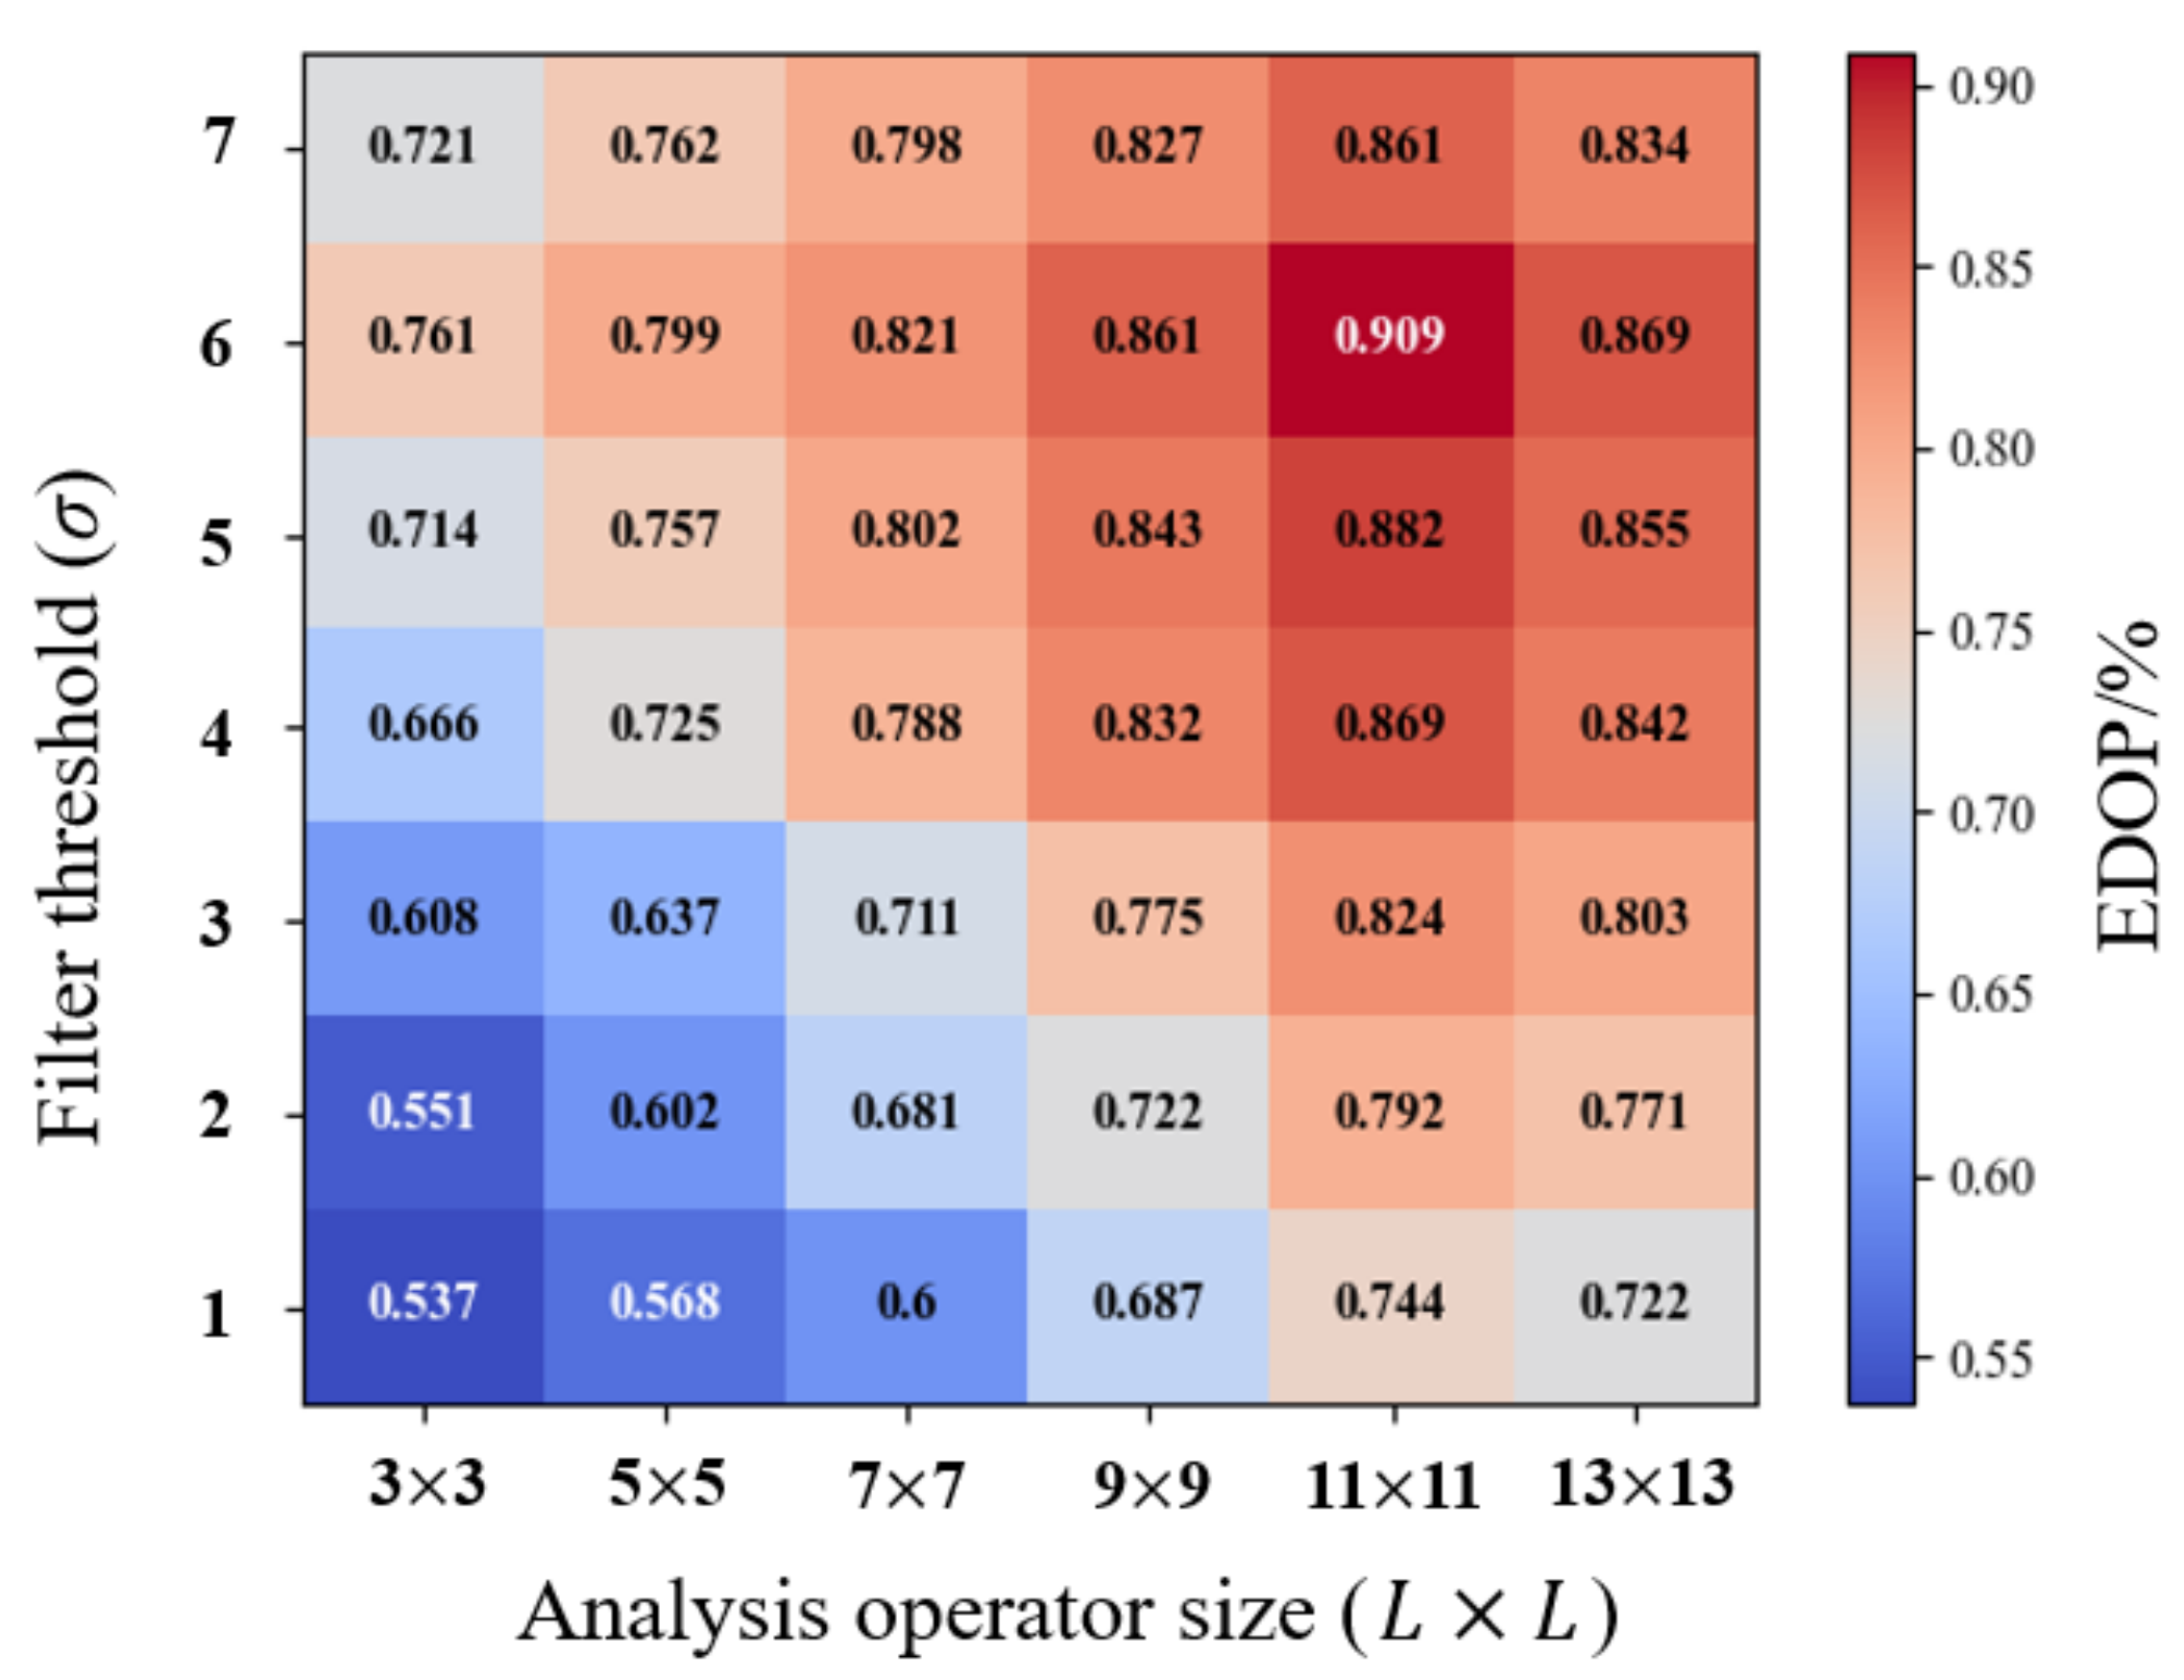
5.2.2. Parameter L and σ

In the shoulder line extraction, the interference of the parameter values in the extraction results was inevitable [15,23,24]. From the tests in the study area, it was determined that the extraction accuracy of the shoulder line was strongly impacted by the extraction parameter analysis operator size (L) and filter threshold (σ).
This paper employed the analysis operator to calculate the slope variation matrix. To obtain window analysis results that were closer to the real terrain, this paper aimed to select the optimal value of parameter L according to the unique topographic conditions on the Loess Plateau. Zhou [15] applied L = 7 when using the analysis operator to extract positive and negative terrain. However, it was found that L is related to the different erosion agents affecting the test area. In areas where gravity erosion was dominant and with cliffs or dissected valleys as the landform type, the extraction results were minimally affected by L. However, in areas where hydraulic erosion dominated and the slope was relatively flat, the extraction results were greatly influenced by L. Specifically, the extraction accuracy increased and then decreased with increasing L. The main explanation is that in areas with cliffs, the shoulder line was more obvious and the extraction results were minimally influenced by L (Figure 14a), while in areas with a relatively gentle slope, it can be concluded that when L was small, the analysis operator could not completely reflect the slope of the real terrain, and the extraction accuracy was poor (Figure 14b). With increasing L, the fitting degree of the analysis operator to the slope began to increase, the extraction accuracy was significantly improved, and an extraction accuracy peak was reached at this moment; when L continued to increase, the landscape of the slope bottom or loess tableland began to interfere with the detection (Figure 14c), and the accuracy began to decrease again, so it is necessary to select the optimal value of parameter L via tests.
The parameter σ is the filter threshold of the slope variation points (candidate units). At the beginning of the test, based on the definition of the shoulder line, we selected σ = 1 and aimed to extract units with the highest slope variation in each group of raster profiles as candidate units of the shoulder line, but the accuracy of the extraction results was not satisfactory. According to a field survey, the reason for this situation was the existence of loess terraces in the study area, and the topography near the terraces also exhibited a slope change, whose extension direction was the same as the development direction of the loess shoulder line, resulting in the interference of the extracted shoulder line by the terraces. Therefore, the increase in parameter σ in this paper mainly eliminated the influence of loess terraces on the extraction accuracy, and σ was mainly controlled by the number of terraces in the study area. In an area with greater terrace development, parameter σ should be increased, while in contrast, parameter σ should be reduced to avoid generating more candidate points and increasing the difficulty of error elimination.
To select the optimal parameters L and σ, this paper used EDOP20 for evaluation, and the calculation of EDOP is shown in Figure 10. When EDOP20 is larger, a better extraction effect is achieved, and the parameter corresponding to the maximum EDOP20 is the optimal parameter. Tests were conducted with the Bianjiagou watershed as an example, and the results for different parameter values were visualized in a two-factor heatmap (Figure 15). It could be concluded that the proposed method in this paper attained the best extraction effect for L = 11 and σ =6.

5.3. Accuracy and Efficiency Assessment

At present, there are two methods most recognized by researchers in shoulder line extraction: the multidirectional hill-shading method [24] and the P-N method [15]. The shoulder lines in the three test areas were automatically extracted using the above two methods and the proposed method, and the extraction results are shown in Figure 15. In terms of the extraction accuracy, the accuracy obtained by the three different extraction methods was computed via the assessment method shown in Figure 11.
Table 4 lists the results of the extraction accuracy of the three methods in the three watersheds. The accuracy of the multidirectional hill-shading method and the proposed method was high, close to 90%, while the accuracy of the P-N method was lower, below 80%, which made it difficult to reach the needs of scientific research. The main reason for this is that the P-N method (Figure 16c) filters all pixels that meet the filtering criteria as candidate points for the shoulder line during the extraction process. Although this method is simple to apply, the extraction results are greatly influenced by the slope variation threshold, making it difficult to develop an adaptive threshold acquisition algorithm. The proposed method (Figure 16a) mitigates this shortcoming, as after obtaining ridge and valley lines, the candidate units of the shoulder line are extracted from continuous profiles, which not only greatly reduces the number of errors but also improves the continuity of the shoulder line, and the accuracy is thus greatly improved over the P-N method. The multidirectional hill-shading method (Figure 16b) improves on the bidirectional shading method, significantly increasing the applicability of the landscape and improving the accuracy, but the extraction effect located in high steep hills or wide and flat gully bottoms needs further improvement.
Among the different watersheds on the Dongzhi Plateau, the accuracy of the extraction results also differed. The specific performance indicated that the extraction effect was better in the Nanxiaohe watershed and Chuanhegou watershed, while the extraction effect accuracy was relatively low in the Bianjiagou watershed. This occurred because in some areas on the plateau, the geomorphic features of the shoulder line were not obvious, and there was no obvious slope difference between the two sides of the shoulder line, causing extraction errors. Chen [5] and Na [23] encountered the same problem in extraction, and it was difficult to produce shadows in these areas when simulating light, resulting in inaccurate extraction. With the development of image recognition technology and deep learning, combining high-precision images to improve accuracy constitutes the direction of future development.
In terms of the extraction efficiency, this paper used a workstation with an Intel core [email protected] GHz CPU, 4 GB RAM, and the Windows 10 64-bit operating system for calculation, and the results are summarized in Table 5. By comparing the performance efficiency of the three methods, the P-N method needed the shortest time, which could be attributed to the simplicity of its algorithm principle. The average times between the multidirectional hill-shading method and the proposed method were close, but the proposed method attained improvements in both the extraction of the high steep hills and wide gully bottoms. Hence, the proposed method could better meet the application demands in scientific research. If the slow computation was caused by the large area of the study area, the parallel algorithm proposed by Song [15] can provide a scientifically feasible idea, as different regions do not interfere with each other in the calculation; thus, the total task can be divided into different subtasks, which can further improve the efficiency of the extraction algorithm in this paper and increase the possibility of achieving an accurate and complete extraction of the shoulder line of the Loess Plateau.

6. Conclusions

In response to the many problems in the shoulder line extraction process in previous studies, such as an unclear geological significance, poor topographic application, and low efficiency of algorithms, this paper proposed a new shoulder line extraction method. The main conclusions are as follows:
  • Based on the geomorphic definition of the shoulder line, a new shoulder line extraction method was proposed, which mainly included three main steps: topographic feature line extraction based on the GIS hydroanalysis method, calculation of the slope variation matrix for the test area, and filtering and error elimination of the candidate units.
  • Through parameter analysis in the test area, it was concluded that the extraction accuracy of the proposed method was optimal for L = 11 and σ = 6.
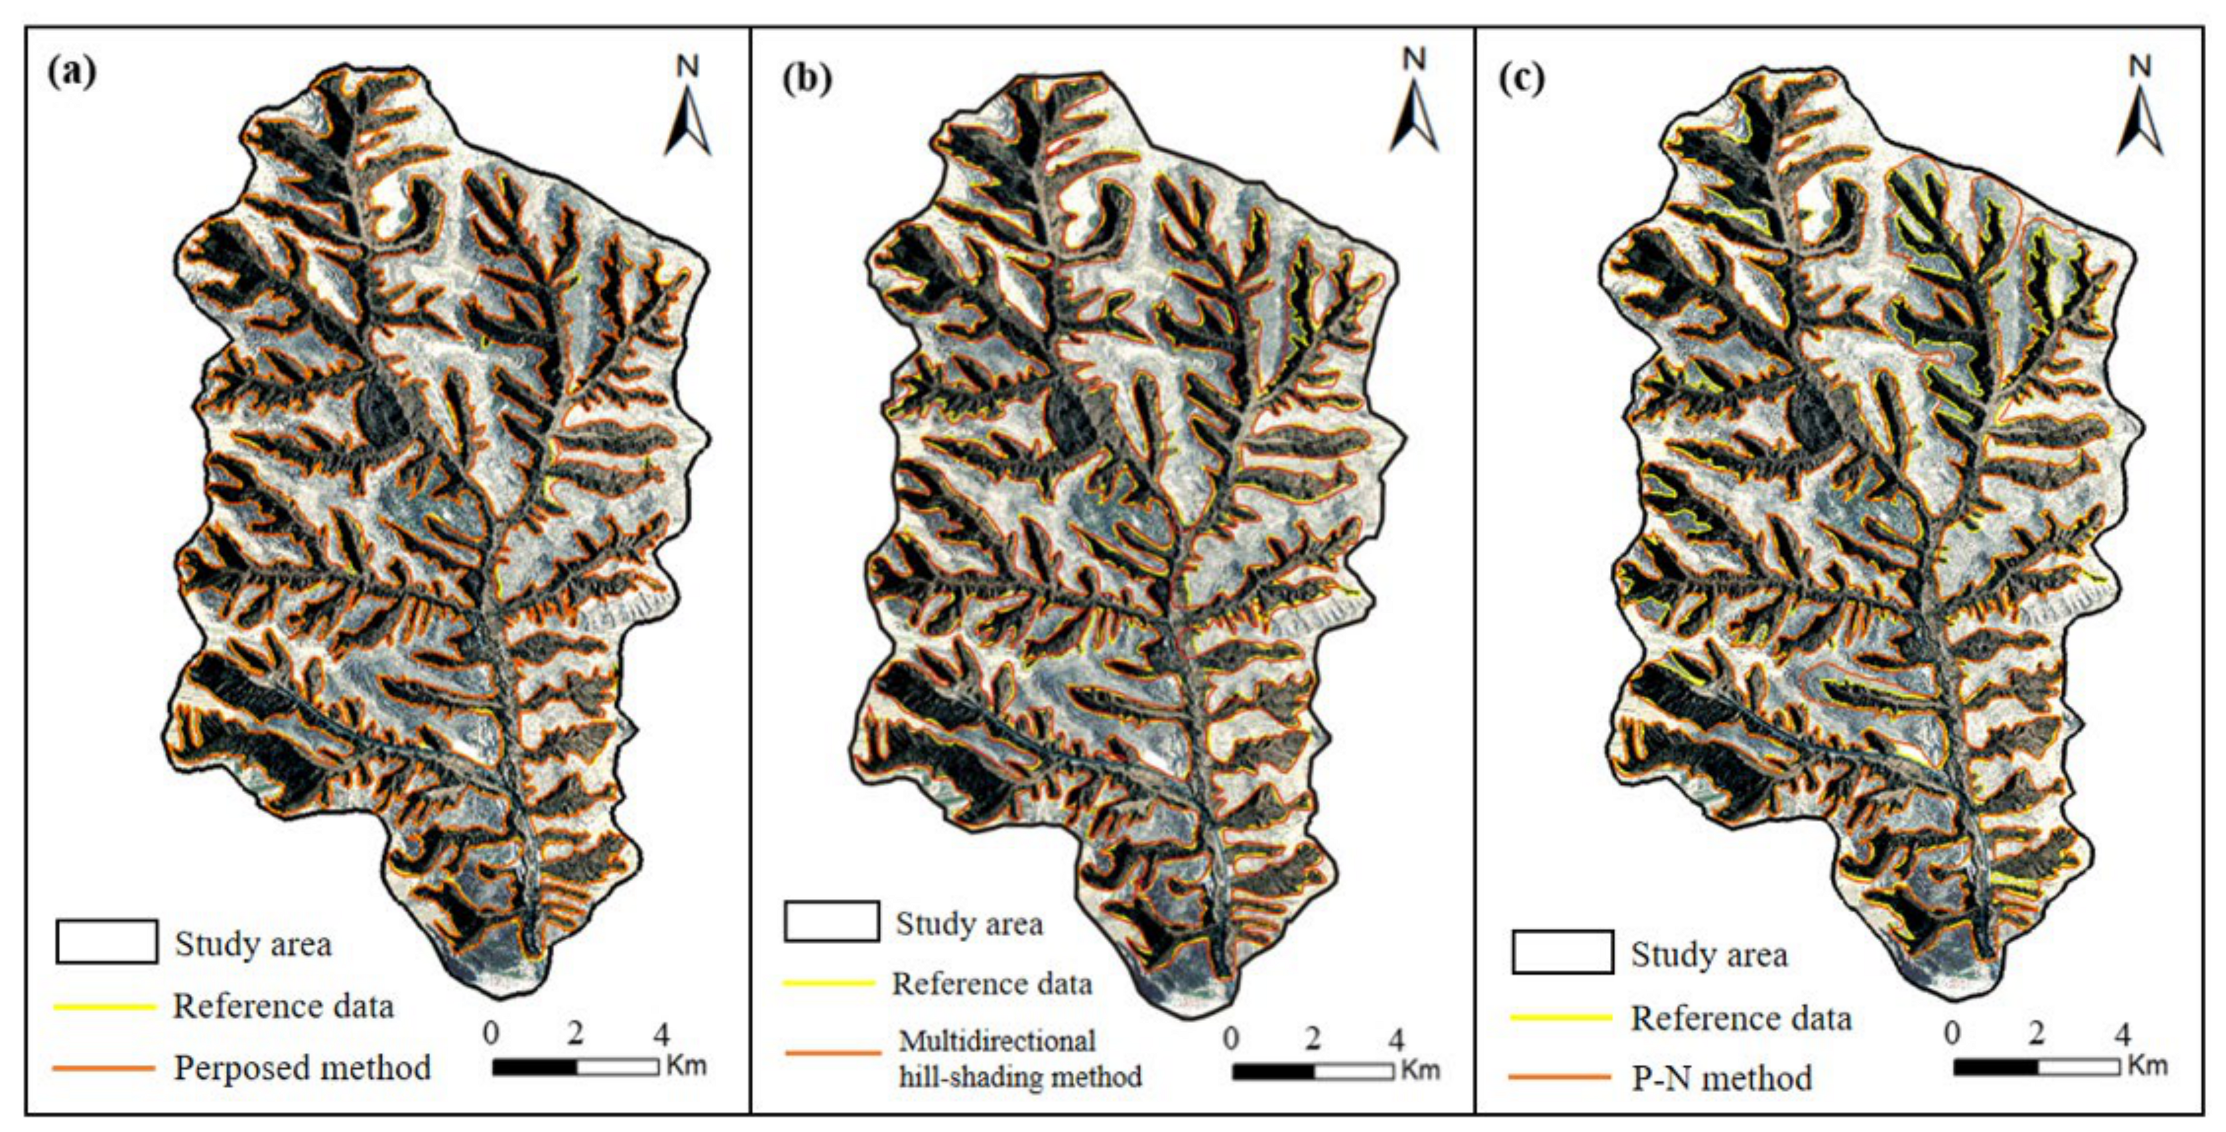
  • The accuracy of the extraction results of the proposed method was assessed based on the EDOP index, and the previous evaluation method was improved on the basis of SfM-MVS. The proposed method overcame the problems of discontinuous shoulder line extraction and difficulty in extracting terrace areas. The average accuracy across the three test areas was 89.3%, which is higher than that of the multidirectional hill-shading and P-N methods. In addition, the efficiency was assessed in three areas of the watershed. It could be concluded that the test area size imposed a slight influence on the extraction efficiency, and the proposed method could achieve a favorable robustness. This increases the possibility of shoulder line extraction in large areas and complex landscapes on the Loess Plateau.

Author Contributions

Conceptualization, S.Y., W.F., and C.J.; methodology, S.Y., W.F., and C.J.; validation, S.Y., W.F., and C.J.; formal analysis, S.Y. and W.F.; writing—original draft preparation, S.Y.; investigation, S.Y. and C. J.; resources, S.Y. and W.F.; data curation, S.Y.; writing—review and editing, S.Y., W.F., and C.J.; supervision, W.F.; project administration, W.F.; funding acquisition, W.F. All authors have read and agreed to the published version of the manuscript.

Funding

This research was funded by the International Cooperation and Exchange Program of the National Natural Science Foundation of China (grant number: 42220104005) and Ministry of Science and Technology Key R&D Program Projects (grant number: 2022YFC3003400).

Institutional Review Board Statement

Not applicable.

Informed Consent Statement

Not applicable.

Data Availability Statement

Not applicable.

Conflicts of Interest

The authors declare no conflict of interests.

References

  1. Zhao, G.; Mu, X.; Wen, Z.; Wang, F.; Gao, P. Soil Erosion, Conservation, and Eco-Environment Changes in the Loess Plateau of China. Land Degrad. Dev. 2013, 24, 499–510. [Google Scholar] [CrossRef]
  2. Zheng, K.; Wei, J.-Z.; Pei, J.-Y.; Cheng, H.; Zhang, X.-L.; Huang, F.-Q.; Li, F.-M.; Ye, J.-S. Impacts of climate change and human activities on grassland vegetation variation in the Chinese Loess Plateau. Sci. Total Environ. 2019, 660, 236–244. [Google Scholar] [CrossRef] [PubMed]
  3. Zhuang, J.; Peng, J.; Wang, G.; Javed, I.; Wang, Y.; Li, W. Distribution and characteristics of landslide in Loess Plateau: A case study in Shaanxi province. Eng. Geol. 2018, 236, 89–96. [Google Scholar] [CrossRef]
  4. Markovic, S.B.; Stevens, T.; Kukla, G.J.; Hambach, U.; Fitzsimmons, K.E.; Gibbard, P.; Buggle, B.; Zech, M.; Guo, Z.T.; Hao, Q.Z.; et al. Danube loess stratigraphy-Towards a pan-European loess stratigraphic model. Earth-Sci. Rev. 2015, 148, 228–258. [Google Scholar] [CrossRef] [Green Version]
  5. Chen, H.; Zhang, X.; Abla, M.; Lu, D.; Yan, R.; Ren, Q.; Ren, Z.; Yang, Y.; Zhao, W.; Lin, P.; et al. Effects of vegetation and rainfall types on surface runoff and soil erosion on steep slopes on the Loess Plateau, China. Catena 2018, 170, 141–149. [Google Scholar] [CrossRef]
  6. Sun, W.; Shao, Q.; Liu, J.; Zhai, J. Assessing the effects of land use and topography on soil erosion on the Loess Plateau in China. Catena 2014, 121, 151–163. [Google Scholar] [CrossRef]
  7. Zhou, J.; Fu, B.; Gao, G.; Lu, Y.; Liu, Y.; Lu, N.; Wang, S. Effects of precipitation and restoration vegetation on soil erosion in a semi-arid environment in the Loess Plateau, China. Catena 2016, 137, 1–11. [Google Scholar] [CrossRef]
  8. Belayneh, M.; Yirgu, T.; Tsegaye, D. Current extent, temporal trends, and rates of gully erosion in the Gumara watershed, Northwestern Ethiopia. Glob. Ecol. Conserv. 2020, 24, e01255. [Google Scholar] [CrossRef]
  9. Jiang, C.; Fan, W.; Yu, N.; Nan, Y. A New Method to Predict Gully Head Erosion in the Loess Plateau of China Based on SBAS-InSAR. Remote Sens. 2021, 13, 421. [Google Scholar] [CrossRef]
  10. Li, J.; Na, J.; Yang, X.; Cao, J.; Dai, W.; Tang, G. Application of the Hilbert-Huang transform for recognition of active gully erosion sites in the Loess Plateau of China. Trans. GIS 2019, 23, 137–157. [Google Scholar] [CrossRef]
  11. Vanmaercke, M.; Panagos, P.; Vanwalleghem, T.; Hayas, A.; Foerster, S.; Borrelli, P.; Rossi, M.; Torri, D.; Casali, J.; Borselli, L.; et al. Measuring, modelling and managing gully erosion at large scales: A state of the art. Earth-Sci. Rev. 2021, 218, 103637. [Google Scholar] [CrossRef]
  12. Conforti, M.; Aucelli, P.P.C.; Robustelli, G.; Scarciglia, F. Geomorphology and GIS analysis for mapping gully erosion susceptibility in the Turbolo stream catchment (Northern Calabria, Italy). Nat. Hazards 2011, 56, 881–898. [Google Scholar] [CrossRef]
  13. Dai, W.; Yang, X.; Na, J.; Li, J.; Brus, D.; Xiong, L.; Tang, G.; Huang, X. Effects of DEM resolution on the accuracy of gully maps in loess hilly areas. Catena 2019, 177, 114–125. [Google Scholar] [CrossRef]
  14. Liu, K.; Na, J.; Fan, C.; Huang, Y.; Ding, H.; Wang, Z.; Tang, G.; Song, C. Large-Scale Detection of the Tableland Areas and Erosion-Vulnerable Hotspots on the Chinese Loess Plateau. Remote Sens. 2022, 14, 1946. [Google Scholar] [CrossRef]
  15. Zhou, Y.; Tang, G.a.; Yang, X.; Xiao, C.; Zhang, Y.; Luo, M. Positive and negative terrains on northern Shaanxi Loess Plateau. J. Geogr. Sci. 2010, 20, 64–76. [Google Scholar] [CrossRef]
  16. Tang, G.; Xiao, C.; Jia, D.; Yang, X. DEM based investigation of loess shoulder-line. In Proceedings of the 15th International Conference on Geoinformatics, Nanjing, China, 25–27 May 2007. [Google Scholar]
  17. Yan, S.; Tang, G.; Li, F.; Dong, Y. An Edge Detection Based Method for Extraction of Loess Shoulder-Line from Grid DEM. Geomat. Inf. Sci. Wuhan Univ. 2011, 36, 363–367. [Google Scholar]
  18. Yan, S.-J.; Tang, G.A.; Li, F.-Y.; Zhang, L. Snake Model for the Extraction of Loess Shoulder-line from DEMs. J. Mt. Sci. 2014, 11, 1552–1559. [Google Scholar] [CrossRef]
  19. Song, X.; Tang, G.; Li, F.; Jiang, L.; Zhou, Y.; Qjan, K. Extraction of loess shoulder-line based on the parallel GVF snake model in the loess hilly area of China. Comput. Geosci. 2013, 52, 11–20. [Google Scholar] [CrossRef]
  20. Zhu, H.; Huang, W.; Zhao, Y.; Xu, X. The Loess Terrain Automatic Segmentation and Gully Head Recognition Method Based on DEM Image Analysis. Geogr. Geo-Inf. Sci. 2017, 33, 74. [Google Scholar]
  21. Evans, M.; Lindsay, J. High resolution quantification of gully erosion in upland peatlands at the landscape scale. Earth Surf. Process. Landf. 2010, 35, 876–886. [Google Scholar] [CrossRef]
  22. Ke, W.; Cheng, W.; Qingfeng, Z.; Kailong, D. Loess shoulder line extraction based on openness and threshold segmentation. Acta Geod. Et Cartogr. Sin. 2015, 44, 67. [Google Scholar]
  23. Na, J.; Yang, X.; Dai, W.; Li, M.; Xiong, L.; Zhu, R.; Tang, G. Bidirectional DEM relief shading method for extraction of gully shoulder line in loess tableland area. Phys. Geogr. 2018, 39, 368–386. [Google Scholar] [CrossRef]
  24. Yang, X.; Li, M.; Na, J.; Liu, K. Gully boundary extraction based on multidirectional hill-shading from high-resolution DEMs. Trans. GIS 2017, 21, 1204–1216. [Google Scholar] [CrossRef]
  25. Jiang, C.; Fan, W.; Yu, N.; Liu, E. Spatial modeling of gully head erosion on the Loess Plateau using a certainty factor and random forest model. Sci. Total Environ. 2021, 783, 147040. [Google Scholar] [CrossRef] [PubMed]
  26. Meinen, B.U.; Robinson, D.T. Where did the soil go? Quantifying one year of soil erosion on a steep tile-drained agricultural field. Sci. Total Environ. 2020, 729, 138320. [Google Scholar] [CrossRef] [PubMed]
  27. Tribe, A. Automated recognition of valley heads from digital elevation models. Earth Surf. Process. Landf. 1991, 16, 33–49. [Google Scholar] [CrossRef]
  28. Zhou, W.; Peng, R.; Dong, J.; Wang, T. Automated extraction of 3D vector topographic feature line from terrain point cloud. Geocarto Int. 2018, 33, 1036–1047. [Google Scholar] [CrossRef]
  29. Hu, J.; Luo, M.; Bai, L.; Duan, J.; Yu, B. An Integrated Algorithm for Extracting Terrain Feature-Point Clusters Based on DEM Data. Remote Sens. 2022, 14, 2776. [Google Scholar] [CrossRef]
  30. Qingsheng, G.; Zuqiao, Y.; Ke, F.J.G. Exctracting topographic characteristic line from contours. Geomat. Inf. Sci. Wuhan Univ. 2008, 33, 253–256. [Google Scholar]
  31. Zhao, M.; Wang, J. A new method of feature line integration for construction of DEM in discontinuous topographic terrain. Environ. Earth Sci. 2022, 81, 397. [Google Scholar] [CrossRef]
  32. Huang, F.; Tao, S.; Chang, Z.; Huang, J.; Fan, X.; Jiang, S.-H.; Li, W. Efficient and automatic extraction of slope units based on multi-scale segmentation method for landslide assessments. Landslides 2021, 18, 3715–3731. [Google Scholar] [CrossRef]
  33. Wang, K.; Zhang, S.; DelgadoTellez, R.; Wei, F. A new slope unit extraction method for regional landslide analysis based on morphological image analysis. Bull. Eng. Geol. Environ. 2019, 78, 4139–4151. [Google Scholar] [CrossRef]
  34. Li, S.; Li, K.; Xiong, L.; Tang, G. Generating Terrain Data for Geomorphological Analysis by Integrating Topographical Features and Conditional Generative Adversarial Networks. Remote Sens. 2022, 14, 1166. [Google Scholar] [CrossRef]
  35. Allender, E.; Chauhan, A.; Datta, S. Depth-first search in directed planar graphs, revisited. Acta Inform. 2022, 59, 289–319. [Google Scholar] [CrossRef]
  36. Wang, J.; Xie, Y.; Xie, S.; Chen, X. Cooperative particle swarm optimizer with depth first search strategy for global optimization of multimodal functions. Appl. Intell. 2022, 52, 10161–10180. [Google Scholar] [CrossRef]
  37. Candido, B.M.; James, M.; Quinton, J.; de Lima, W.; Naves Silva, M.L. Sediment source and volume of soil erosion in a gully system using UAV photogrammetry. Rev. Bras. De Cienc. Do Solo 2020, 44, e0200076. [Google Scholar] [CrossRef]
  38. Meinen, B.U.; Robinson, D.T. Mapping erosion and deposition in an agricultural landscape: Optimization of UAV image acquisition schemes for SfM-MVS. Remote Sens. Environ. 2020, 239, 111666. [Google Scholar] [CrossRef]
  39. Stoecker, C.; Eltner, A.; Karrasch, P. Measuring gullies by synergetic application of UAV and close range photogrammetry-A case study from Andalusia, Spain. Catena 2015, 132, 1–11. [Google Scholar] [CrossRef]
  40. Frankl, A.; Poesen, J.; Haile, M.; Deckers, J.; Nyssen, J. Quantifying long-term changes in gully networks and volumes in dryland environments: The case of Northern Ethiopia. Geomorphology 2013, 201, 254–263. [Google Scholar] [CrossRef] [Green Version]
  41. Guo, M.; Yang, B.; Wang, W.; Chen, Z.; Wang, W.; Zhao, M.; Kang, H. Distribution, morphology and influencing factors of rills under extreme rainfall conditions in main land uses on the Loess Plateau of China. Geomorphology 2019, 345, 106847. [Google Scholar] [CrossRef]
  42. Castillo, C.; Perez, R.; James, M.R.; Quinton, J.N.; Taguas, E.V.; Gomez, J.A. Comparing the Accuracy of Several Field Methods for Measuring Gully Erosion. Soil Sci. Soc. Am. J. 2012, 76, 1319–1332. [Google Scholar] [CrossRef] [Green Version]
  43. Terryn, L.; Calders, K.; Bartholomeus, H.; Bartolo, R.E.; Brede, B.; D’Hont, B.; Disney, M.; Herold, M.; Lau, A.; Shenkin, A.; et al. Quantifying tropical forest structure through terrestrial and UAV laser scanning fusion in Australian rainforests. Remote Sens. Environ. 2022, 271, 112912. [Google Scholar] [CrossRef]
  44. Creus, P.K.; Sanislav, I.V.; Dirks, P.H.G.M. Application of SfM-MVS for mining geology: Capture set-up and automated processing using the Dugald River Zn-Pb-Ag mine as a case study. Eng. Geol. 2021, 293, 106314. [Google Scholar] [CrossRef]
  45. Miller, J.; Morgenroth, J.; Gomez, C. 3D modelling of individual trees using a handheld camera: Accuracy of height, diameter and volume estimates. Urban For. Urban Green. 2015, 14, 932–940. [Google Scholar] [CrossRef]
  46. Smith, M.W.; Carrivick, J.L.; Quincey, D.J. Structure from motion photogrammetry in physical geography. Prog. Phys. Geogr.-Earth Environ. 2016, 40, 247–275. [Google Scholar] [CrossRef] [Green Version]
  47. Frankl, A.; Stal, C.; Abraha, A.; Nyssen, J.; Rieke-Zapp, D.; De Wulf, A.; Poesen, J. Detailed recording of gully morphology in 3D through image-based modelling. Catena 2015, 127, 92–101. [Google Scholar] [CrossRef] [Green Version]
  48. Tavani, S.; Pignalosa, A.; Corradetti, A.; Mercuri, M.; Smeraglia, L.; Riccardi, U.; Seers, T.; Pavlis, T.; Billi, A. Photogrammetric 3D Model via Smartphone GNSS Sensor: Workflow, Error Estimate, and Best Practices. Remote Sens. 2020, 12, 3616. [Google Scholar] [CrossRef]
  49. Wang, R.; Zhang, S.; Pu, L.; Yang, J.; Yang, C.; Chen, J.; Guan, C.; Wang, Q.; Chen, D.; Fu, B.; et al. Gully Erosion Mapping and Monitoring at Multiple Scales Based on Multi-Source Remote Sensing Data of the Sancha River Catchment, Northeast China. Int. J. Geo-Inf. 2016, 5, 200. [Google Scholar] [CrossRef] [Green Version]
  50. Lane, S.N.; Gentile, A.; Goldenschue, L. Combining UAV-Based SfM-MVS Photogrammetry with Conventional Monitoring to Set Environmental Flows: Modifying Dam Flushing Flows to Improve Alpine Stream Habitat. Remote Sens. 2020, 12, 3868. [Google Scholar] [CrossRef]
  51. Li, S.; Dai, W.; Xiong, L.; Tang, G. Uncertainty of the morphological feature expression of loess erosional gully affected by DEM resolution. J. Geo-Inf. Sci. 2020, 22, 338–350. [Google Scholar]
Figure 1. Location of the study area in Qingyang, Gansu Province, China, and the three test areas.
Remotesensing 15 00380 g001
Figure 2. Demarcation basis of the shoulder line: (a) geomorphic features of the shoulder line; (b) spatial distribution of the shoulder line; (c) land use of the shoulder line; (d) jagged erosion; (e) palm-shaped erosion.
Remotesensing 15 00380 g002
Figure 3. Location of the shoulder line in a typical profile: (a) planar graph provided by Google Earth; (b) a typical profile.
Remotesensing 15 00380 g003
Figure 4. Flow chart of the principle of the automatic extraction of the shoulder line.
Remotesensing 15 00380 g004
Figure 5. Automatic shoulder line extraction flow chart.
Remotesensing 15 00380 g005
Figure 6. Schematic diagram of the terrain feature lines: (a) ridge line; (b) valley line.
Remotesensing 15 00380 g006
Figure 7. Schematic diagram of raster profile extraction: (a) at the gully sidewalls; (b) at the gully head.
Remotesensing 15 00380 g007
Figure 8. Parallel algorithm flow chart.
Remotesensing 15 00380 g008
Figure 9. Analysis operator (size 7 ∗ 7 pixels).
Remotesensing 15 00380 g009
Figure 10. UAV data processing technology based on SfM-MVS: (a) route flight module; (b) SfM-MVS workflow.
Remotesensing 15 00380 g010
Figure 11. Proposed method of accuracy verification.
Remotesensing 15 00380 g011
Figure 12. Result of automatic extraction: (a) remote sensing image map of the test area (acquired from Google Earth); (b) digital elevation model (DEM) of the test area; (c) 3D surface reconstruction of the test area; (d) jagged erosion; (e) palm-shaped erosion.
Remotesensing 15 00380 g012
Figure 13. Comparison of the satellite and UAV images: (a) UAV image based on SfM-MVS (31 October 2021); (b) satellite image acquired from Google Earth (12 October 2021).
Remotesensing 15 00380 g013
Figure 14. Influence of terrain factors on extraction: (a) areas with cliffs; (b) areas with gentle slopes; (c) areas with increasing size of the analysis operator.
Remotesensing 15 00380 g014
Figure 15. Two-factor heatmap of the effect of different values of L and σ on the extraction accuracy.
Remotesensing 15 00380 g015
Figure 16. Extraction results of the shoulder line with the three methods: (a) proposed method; (b) multidirectional hill-shading method; (c) P-N method.
Remotesensing 15 00380 g016
Table 1. Study area data types and description.
DataData SourcesArea(km2)Resolution(m)Data Used
DEM in digital contours*Digital topographic map100.25Automatic Extraction
DEM in UAVSfM-MVS technology100.1Assessment
DOM in UAVSfM-MVS technology100.1Assessment
Satellite imageryGoogle Earth image100.21Assessment
* DEM data are based on contour lines to generate Triangulated irregular network (TIN), where 1:10,000 contour lines support 5 m resolution DEM.
Table 2. Measured data verification.
Data TypesGully HeadsShoulder Points Per Gully HeadTotal Validations Total Corrects
101010099
Table 3. Summary of the parameters in SfM-MVS.
DateArea
(km2)
Number of ImagesDense Cloud PointsNumber of GCPsRMSE
(X/Y/Z)(m)
12 October 2021. 5.36634150365400.021/0.012/0.019
Table 4. Accuracy assessment of the three methods.
EDOP20 (%)
MethodNanxiaoheBianjiagouChuanhegouMean
P-N method80.375.982.679.6
Multidirectional
Hill-shading method
88.187.290.088.4
Proposed method90.186.891.289.3
Table 5. Efficiency assessment of the three methods.
Run time (s) *
WatershedArea
(km2)
P-N
Method
Multidirectional
Hill-Shading Method
Proposed
Method
Nanxiaohe37.910.333.133.7
Bianjiagou29.38.923.728.8
Chuanhegou33.09.628.030.8
Mean33.49.628.331.1
* A shorter run time suggests a higher extraction efficiency.
Disclaimer/Publisher’s Note: The statements, opinions and data contained in all publications are solely those of the individual author(s) and contributor(s) and not of MDPI and/or the editor(s). MDPI and/or the editor(s) disclaim responsibility for any injury to people or property resulting from any ideas, methods, instructions or products referred to in the content.

