Article

Investigating the Quality of UAV-Based Images for the Thermographic Analysis of Buildings

Institute for Industrial Production, Karlsruhe Institute of Technology, 76187 Karlsruhe, Germany
*
Author to whom correspondence should be addressed.
Remote Sens. 2023, 15(2), 301; https://doi.org/10.3390/rs15020301
Submission received: 2 November 2022 / Revised: 29 December 2022 / Accepted: 31 December 2022 / Published: 4 January 2023
(This article belongs to the Section Urban Remote Sensing)

Abstract

:
Thermography for building audits is commonly carried out by means of terrestrial recording processes with static cameras. The implementation of drones to automatically acquire images from various perspectives can speed up and facilitate the procedure but requires higher recording distances, utilizes changing recording angles and has to contend with the effects of movement during image capture. This study investigates the influence of different drone settings on the quality of thermographic images for building audits in comparison to ground-based acquisition. To this end, several buildings are photographically captured via unmanned aerial vehicle and classical terrestrial means to generate a dataset of 968 images in total. These are analyzed and compared according to five quality criteria that are explicitly chosen for this study to establish best-practice rules for thermal image acquisition. We discover that flight speeds of up to 5 m/s have no visible effects on the image quality. The combination of smaller distances (22 m above a building) and a 45° camera angle are found to allow for both the qualitative and quantitative analysis of rooftops as well as a qualitative screening of building façades. Greater distances of 42 m between camera and building may expedite the acquisition procedure for larger-scaled district coverage but cannot be relied upon for thermal analyses beyond qualitative studies.

1. Introduction

Infrared thermography has gained prominence in the field of remote sensing due to the technology’s reliability and versatility as well as non-contact and non-destructive qualities. It is implemented throughout a wide range of applications, including e.g., agricultural data collection, gas detection, industry monitoring, as well as identifying humans and animals [1,2,3].
Thermography has also proven to be very useful for the detection of thermal irregularities, air leakages and moisture abnormalities on building envelopes [4]. To this day, static setups or hand-held cameras are most common in the analysis of buildings [5]. However, performing thermography with a terrestrial camera reaches its limits in larger-scale projects due to its time-consuming nature [6] and inability to cover certain areas of the building envelope, such as the high façade elements of tall buildings [7]. It has therefore become increasingly popular for thermographic building audits on city- or district-scale to be performed by means of aircrafts, such as Unmanned Aerial Vehicles (UAVs) [5].
Aside from bypassing the aforementioned limitations of ground-based procedures, aerial methods additionally have the potential to streamline building auditing in the future scenarios, such as smart cities. Embedded into the broader context of urban data collection and processing approaches, they can improve the general sustainability of urban areas by providing vital information to governments and stakeholders, thus expediting lengthy decision-making processes [8]. UAVs can be used as relay stations for multiple Internet of Things devices, not just thermographic cameras. By including various kinds of sensors, a broad range of environmental data can be collected, analyzed and communicated to a central station for reasons such as determining levels of pollution [9,10].
For these reasons, many recent scientific publications focus on establishing best practice rules for the recording and processing of UAV-based thermographic images. While numerous studies are devoted to identifying the various drone settings suitable for auditing buildings, they oftentimes fail to provide comprehensive information on the quality of the acquired images and assessment thereof. Krawczyk et al. [11], for instance, used UAV-based thermography to inspect a single-family house and named the aerial acquisition method the “optimum solution for inspections of buildings” because it permitted fast image recording and access to rooftops. However, the authors did not detail their chosen flight speeds nor any other drone settings, all of which greatly influenced the results. Entrop and Vasenev [12] studied various flight settings with the aim of reducing cost and time involved in drone-based thermography. They chose distances of between 5 m and 10 m to the object under scrutiny and a flight speed of 1.5 m/s, which they were later forced to lower to 1.0 m/s due to insufficient image quality. While they provided recommendations for UAV settings, they failed to specify the criteria used to assess the quality of their thermal images. The influence of certain flight settings on specific aspects of quality therefore remains unknown, making the discoveries difficult to transfer to other scenarios. Rakha and Gorodetsky [13] investigated suitable drone settings to create thermographic 3D models of buildings. They examined various parameters, such as flight path, overlap and distance between infrared camera and the building in question. While various flight heights of 18 m, 22 m, 27 m and twice the building height were all found to be suitable, the optimal set-up uses a 12 m distance to the building and a strip pattern flight path. Although the paper identifies new best practice rules for the creation of 3D models, it also fails to examine their concrete influence on the quality of the recorded thermographic data. Another paper to study the generation of 3D building models using UAV-based thermal images was conducted by Daffara et al. [14]. They performed drone flights at a distance of 10 m to the building façade and a maximum flight height of 8 m. No information was provided on the influence of their flight settings on image quality. The same can be said of Dahaghin et al. [15], who assessed the suitability of UAV-based thermal images in generating 3D models of building rooftops. Their images cover two different areas at comparatively large flight heights of 48.6 m and 160 m. Hou et al. [16] also developed a method to fuse point cloud data to create 3D thermal building models. The UAV flights for image acquisition were performed at different flight heights (60 m and 35 m above ground), angles (45° and 30°) and flight paths (mesh grid and Y path). The authors found that greater distances between camera and building induced more errors, while a 45° angle could capture more façade detail than the 30° alternative. Benz et al. [17] present a concept for the UAV-based assessments of buildings by estimating façade U-values from a generated 3D building model. Without providing an explanation for their choice of settings, they performed all flights at a 15 m distance to the building under scrutiny. They found that the quality of UAV-based thermography needs to be improved to allow for precise U-value calculations. Mayer et al. [18] developed a procedure for identifying, classifying and evaluating thermal bridges of buildings by means of drone-mounted thermographic camera. The images were acquired at heights of between 60 m and 80 m above ground. Using these settings, the authors were able to manually identify 14 different types of thermal bridges in the dataset. They found that thermal imaging performed in near parallel to a building façade (acute angle) often caused the thermal anomalies to be misinterpreted. For this reason, they excluded images that were recorded at a small angle (<70°) to the object under scrutiny. Another author to discuss thermal building anomalies is Zahradník [19], who showcased a UAV-based method for rooftop leakage detection. The data were acquired in nadir flight (camera pointing straight down) at a speed of 2 m/s and a constant distance of 20 m to the ground. Again, the reasoning for these specific settings was not provided in the paper. Mirzabeigi and Razkenari [20] explored a method for detecting thermal bridges on building envelopes which takes both UAV-based and terrestrial images into account. For aerial acquisition, they chose a rectangular trajectory (strip pattern flight path) at a 6.5 m distance to the building. They failed to indicate on what grounds they assessed the quality of the thermal images acquired using the aforementioned methods. Gómez and Tascón [21] detailed best practice rules for using UAVs to detect thermal anomalies on agricultural building envelopes. The developed protocol is tested and validated on thermal video recordings of a new case study. The façade was inspected at a distance of 10 m and a flight height of 5 m above ground, the rooftop through images acquired at 20 m above the maximum building height and strip pattern flights. The authors defined these flight settings as suitable for their specific research aim without detailing the effects they had on image quality. Owing to the numerous and diverging recommendations for UAV set-ups provided in all manner of published thermographic case studies, Gómez and Tascón [21] concluded no generally applicable standard for best practices existed with regards to distance between UAV and object under scrutiny. Instead, they stated that flight settings must be chosen according to the specific objectives at hand.
Table 1 gives an overview of the aforementioned most recent studies concerned with building envelope analysis using UAV-based thermographic images. It also shows what, if any, information is provided on the chosen settings of the experimental flights conducted for said publications.
A review of the cited papers revealed a considerable literary gap in the comprehensive assessment of the quality of thermal images and how they were influenced by various recording parameters. None of the named studies provide detailed descriptions of their thermographic images or criteria for evaluating their quality.
As high quality is of the utmost importance for the correct interpretation and quantitative assessment of the information provided in thermal images, this work aims to identify the benefits and drawbacks of different drone flight settings to formulate best practice rules for thermography in building auditing. Using a case study, we examine the impact of different modes of acquisition at varying camera speeds, recording angles and distances to the buildings under scrutiny to determine how these parameters influence the resulting images. To do so, we define and evaluate three qualitative and two quantitative criteria to indicate how recorded thermal information changes with different acquisition settings. This study builds on Mayer et al.’s [22] prospective conference contribution, which introduced four qualitative and one quantitative criteria for evaluating a small, exemplary dataset of automatically recorded UAV-based thermographic images as well as comparative images acquired by hand-held thermal camera. In total, Mayer et al. [22] analyzed 21 aerial and 24 terrestrial images in detail. The authors found image quality to be independent of flight speeds of up to 3 m/s. Moreover, the study provides evidence that temperature values recorded in UAV-based thermographic images can significantly deviate from the values acquired by hand-held camera. Owing to the small case study size they did not, however, provide a comprehensive quantitative analysis to evaluate these findings in more detail.
Identifying the optimal settings for high quality thermography-based building audits requires a more in-depth, large-scaled analysis. This study therefore extends Mayer et al. [22] on four counts: (1) the new dataset is much broader, consisting of a significantly larger number of images collected in ideal weather conditions (complete absence of drizzle and rain); (2) an additional method of image acquisition—namely manual UAV flight—is included in the comparison; (3) the assessment is enhanced by a more quantitative-based set of criteria; and (4) mode-dependent recording times are examined to assess and compare the general efficiency of UAV-based and manual acquisition methods. In doing so, this paper aims to contribute an improved set of tools for assessing the quality of UAV-based thermographic building audits. It shows the comparative results of these applied to an extensive new case study, including images captured by three different means of acquisition. The results are discussed and compared to literature.

2. Materials and Methods

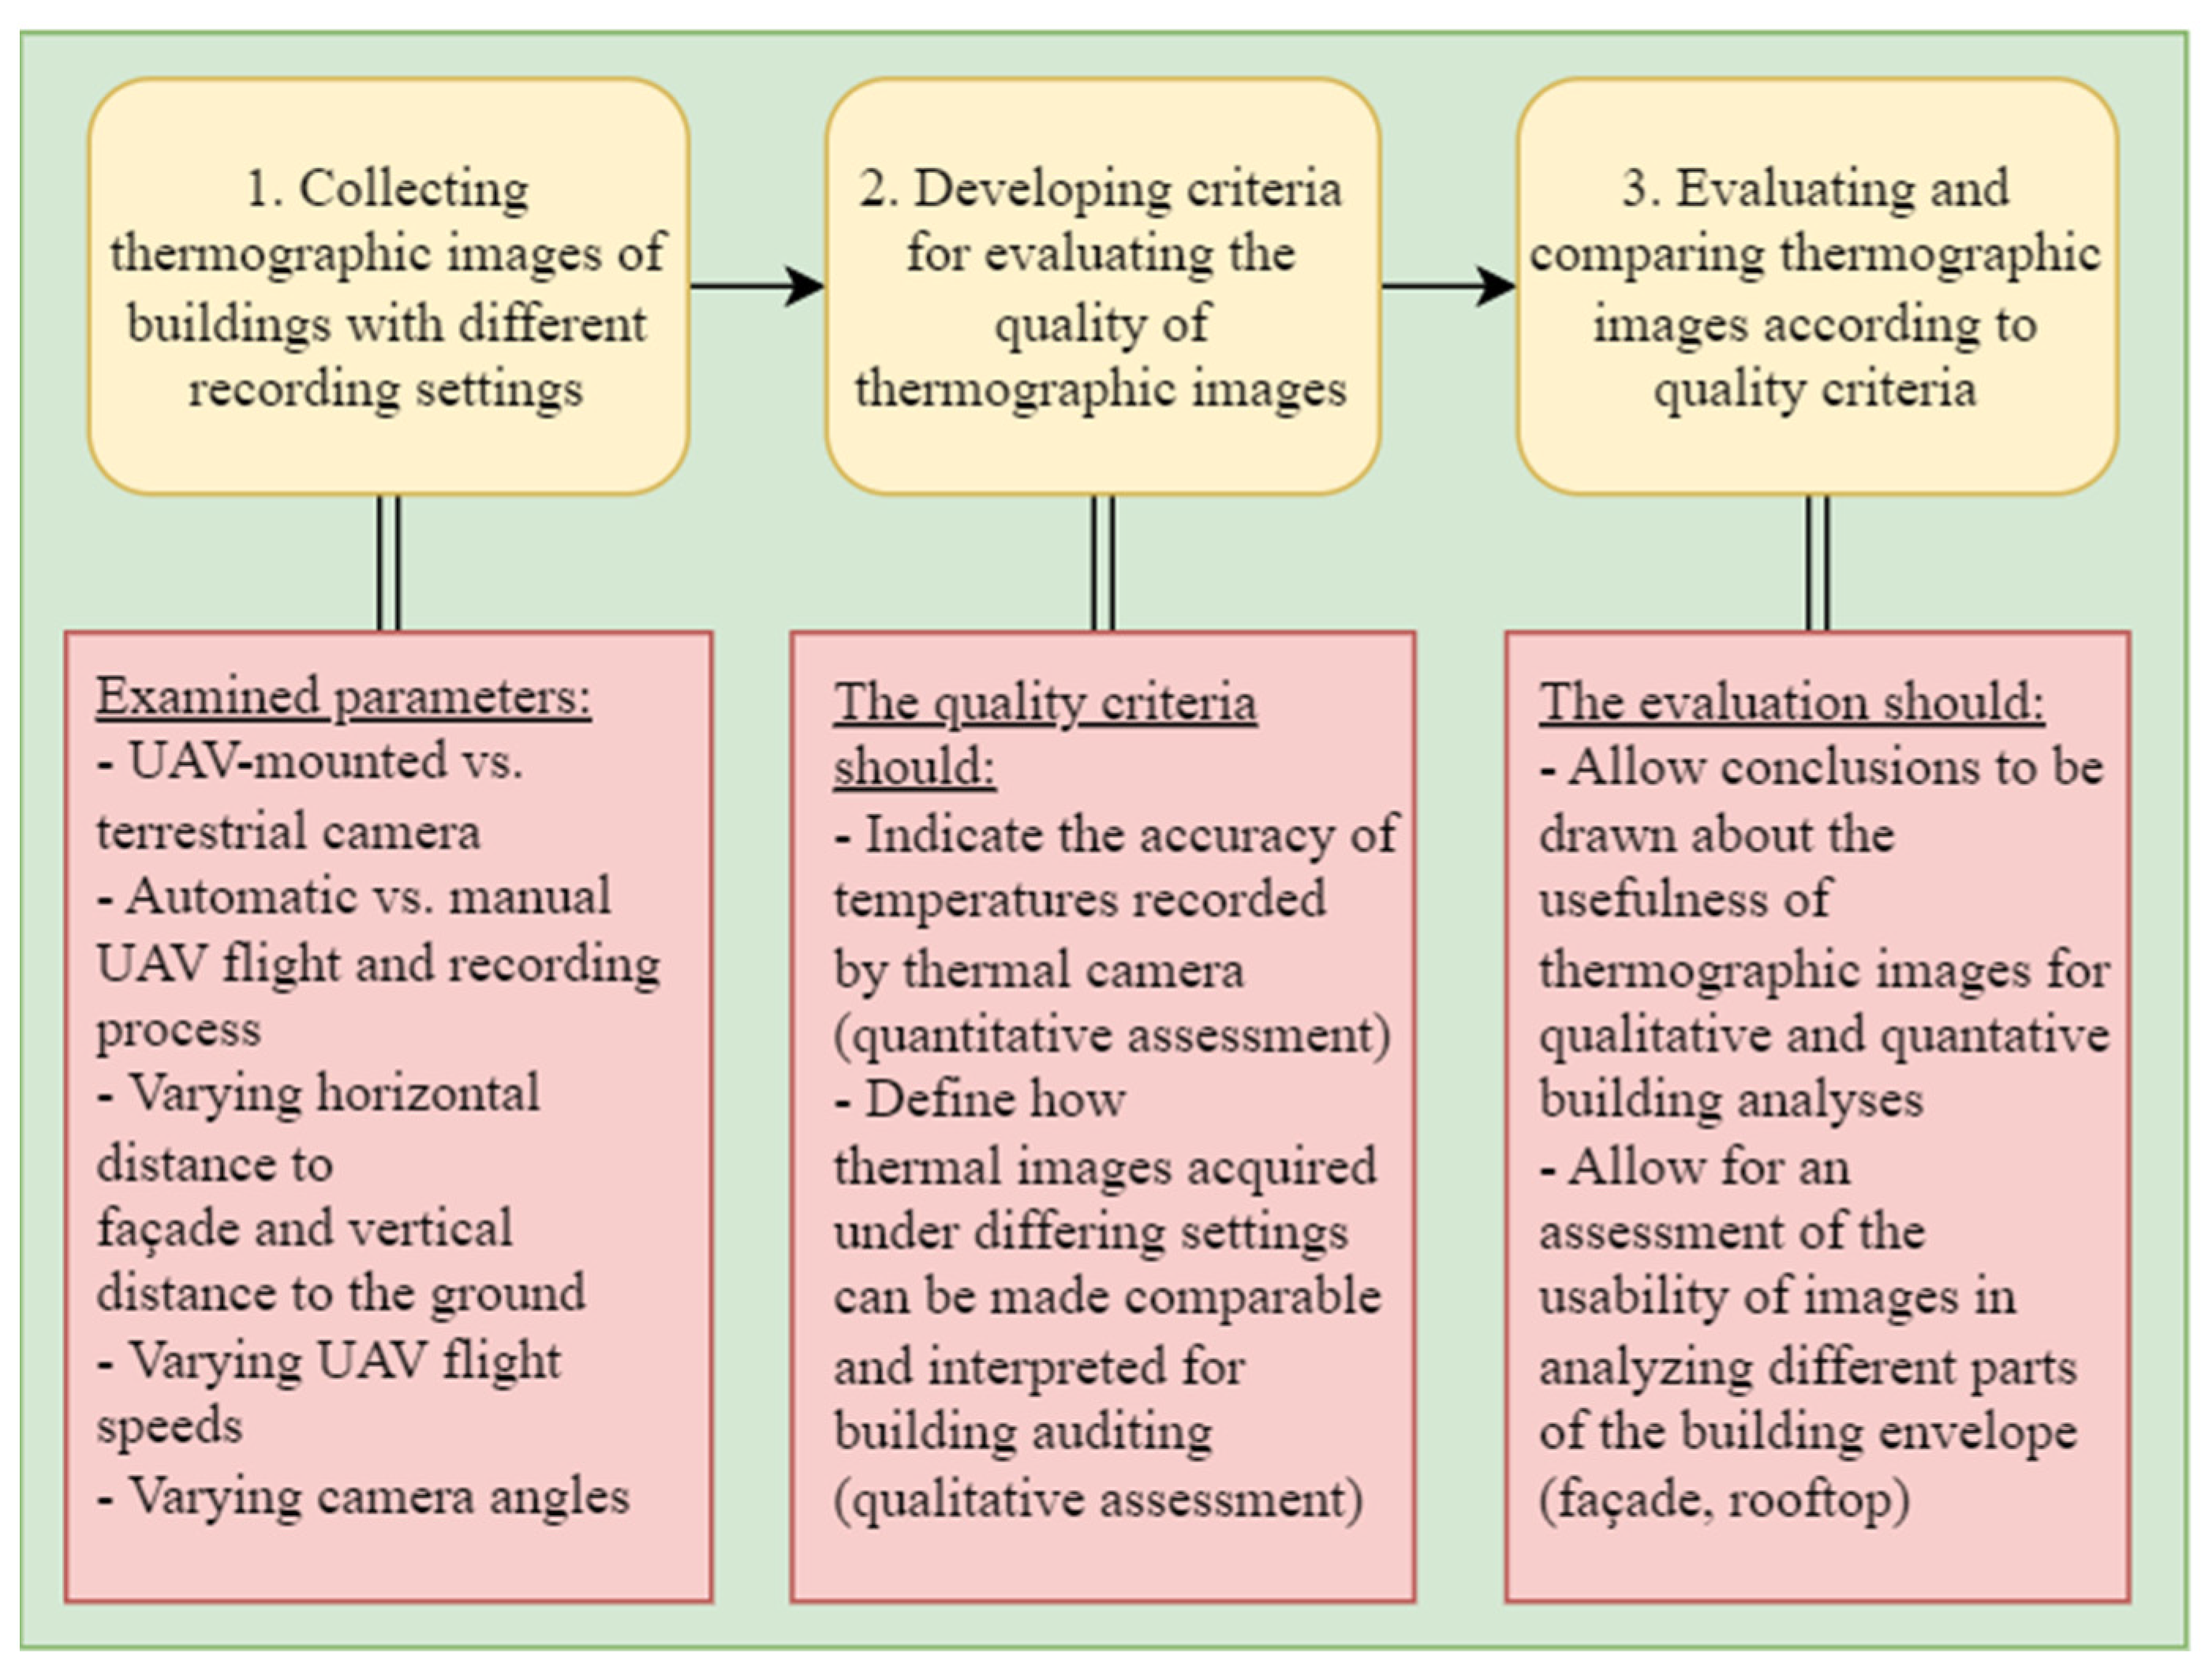
2.1. Research Approach

This study is split into three procedural parts, which are described in detail in the subsequent Section 2.2, Section 2.3 and Section 2.4. In a first step, data are acquired. The thermal images were collected by hand-held and UAV-based cameras using varying recording settings to cover four residential buildings. Next, quality criteria are defined to assess the usability of the recorded images for both a quantitative and qualitative analysis of the building envelopes. In a third step, the collected images are analyzed and compared according to the defined criteria. This allows for conclusions to be drawn about the benefits and drawbacks of the various tested settings for the thermal assessment of building envelopes. This research approach is illustrated in a flow chart in Figure 1.

2.2. Data Collection

The analyzed dataset consists of 968 thermal images: 693 captured on the ground and 275 via UAV. Of the aerial images, 139 were recorded manually and 136 in automatic flight mode. As indicated in Figure 2, the case study covers four multi-family buildings in the German city of Karlsruhe, which belong to the local municipal housing association Volkswohnung Karlsruhe GmbH. The buildings are located in Sophienstr. 201–203, Volzstr. 2, Wichernstr. 4 and Wichernstr. 10–18. They were all constructed in the 1950s, stand 18 m tall and comprise between 12 and 47 apartments, all of which were fully rented out at the time of image acquisition.
The aerial images were acquired using a “DJI Matrice 300” UAV [24] equipped with the “Zenmuse XT2”, a combination of FLIR’s “Duo Pro R” thermal and RGB camera technology and DJI’s gimbal [25]. All thermal images were recorded in FLIR’s proprietary image format RJPEG. The terrestrial thermographic images were acquired using a “FLIR T200” hand-held camera [26] in the standard JPEG format. The emissivity was set to 0.95 throughout to remain within the recommended range of 0.90 to 0.98 [27].
Image acquisition took place on 28 February and 1 March 2022 between 8 p.m. and 1 a.m. On 28 February, the outside air temperature registered at between 1 °C and 3 °C. Wind speeds reached a maximum of 17 km/h. The sky was cloudless both during the flights and in the preceding 24 h. A maximum temperature of 11 °C was recorded by local weather stations in that time period. Very similar weather conditions were present on 1 March. The outside air temperature was recorded as being between −1 °C and 5 °C during acquisition, with wind speeds of max. 11 km/h. Again, the sky was entirely clear both during the flights and in the preceding 24 h, with a maximum temperature of 9 °C present in that time period. The sun set at around 6:10 p.m. on both days [28].
The meteorological conditions present during these UAV flights therefore align with Lucchi’s [29] and Fouad and Richter’s [27] recommendations: The temperature difference between indoor and outdoor areas was sufficiently high (Assuming a standard indoor room temperature of 19 °C [30], the requirement of a delta of more than 10 K was met.), and the recommended maximum outside temperature of 5 °C was not exceeded. Terrestrial and aerial images of the same building were recorded consecutively and on the same day to ensure near identical weather conditions, thus establishing a basis for comparisons between images and acquisition methods.
For a succinct comparison of UAV-based recording methods, nine different flight settings of varying speed (1 m/s, 3 m/s and 5 m/s), flight height (4 m to 60 m above ground), and camera angle (45°, 90°/nadir and 0°/facing the façade) were selected. Six of these nine flights (flights 1 to 6) were carried out automatically; the rest (flights 7 to 9) were executed manually by a professional UAV pilot. All flight settings are summarized in Table 2.
During automatic flights, a 45° camera angle was used to capture the façade (flights 1 to 4) and 90° (flights 5 and 6) to record rooftops. The flight heights were set to 60 m above the ground (flights 4 and 6)—corresponding to 42 m above the buildings—and 40 m (flights 1, 2, 3 and 5)—corresponding to 22 m above the buildings. Smaller distances proved impossible to realize due to the presence of natural obstacles, such as trees. To examine contrasting literary conclusions about the influence of camera velocity on image quality, the UAV’s flight speed was set to 1 m/s (flight 1) based on the experience of Entrop and Vasenev [12] and 3 m/s (flights 2, 4, 5, 6) as well as 5 m/s (flight 3) based on the findings of Mayer et al. [22] A strip pattern flight path was used for all automated flights (flights 1 to 6) with a constant side and frontal overlap of 10%. Higher overlap is primarily required for tie point computations in the creation of mosaics or 3D models and is thus outside the scope of this work. The UAV-based thermal image dataset discussed in subsequent chapters consists of a pre-sorted selection of all images that were automatically captured along the flight route. Only those images depicting relevant building parts are included.
Operating the UAV in manual flight mode, as was done during flights 7 to 9, allows for much smaller flight heights and distances to the area of interest. It means entire building façades can be captured in close range without changing perspective. The lack of surrounding obstacles in Wichernstr. 4 and 10–18 allowed those buildings’ façades to be recorded at varying distances of 4 m, 8 m and 15 m. These images were taken in static flight, meaning the UAV was brought to a full-stop mid-air to avoid camera movement during acquisition. Terrestrial images were recorded at the same distances of 4 m, 8 m and 15 m to the buildings. The datasets from close-up acquisition methods are larger simply because each image only covers a small area, and therefore, a greater amount is required to capture a building envelope in its entirety.
FLIR’s “Thermal Studio” software [31] was utilized in the processing and analysis of all thermographic images. The temperature scale was chosen based on Fouad’s [32] recommendation to visualize thermal data using a range of at least 15 K. Set at −8 °C to +13 °C, it encompasses both the building’s warmest and coldest regions as well as the given surrounding temperatures. Color is assigned universally according to the “signal linear” function, which forces the color scale into a linear adaptation of the raw camera signals [33].
Figure 3 shows exemplary images acquired under the previously described settings of varying height, angle and recording method. Images depicting the same object at an identical angle and distance may still vary owing to the different lenses of hand-held versus UAV-mounted thermal cameras. The full dataset being discussed in this paper is publicly available on Zenodo [34].

2.3. Evaluation Criteria

This study presents select quantative and qualitative criteria that can be used to compare and evaluate the quality of diversly acquired thermal images. To date, the authors know of no established set of criteria with which to assess the qualitative and quantitative usability of thermal images in building auditing and to make varying methods truly comparable. We therefore define them based on criteria common to photography and thermography, as described below. While the qualitative criteria are meant as tools to provide a general assessment of the achievable level of detail in thermal images, the quantitative criteria give insight specifically into the accuracy of temperature values recorded by the thermal camera in question. In addition to the aforementioned, the time required for image acquisition is taken into account as a separate indicator due to the relevance it has for the economic efficiency of a given method. The criteria can be influenced by constant parameters like those pertaining to the involved technology (This includes the thermal camera as well as implemented UAV technology.) and dynamic ones, such as camera speed, position in relation to the object of interest and atmospheric conditions as described by Fouad and Richter [27] (see Section 2.2).
Three qualitative criteria are defined for comparing the influence of different acquisition methods and settings on the visibility of details (such as thermal bridges) within the resulting thermal images. These are motion blur, feature discernibility and accessibility (of areas under scrutiny). While partially derived from Mayer et al. [22], these refined criteria place additional emphasis on an acquisition method’s ability to reach all areas of interest. This is an aspect that must be considered for building auditing because if a method lacks the capability of capturing a building in its entirety, any adeptness it may have of capturing highly detailed images will be offset by the incompleteness of the resulting dataset and potential omission of important anomalies. The qualitative criteria used to evaluate the image dataset are:
-
Motion blur: Motion blur occurs when a camera moves during the image recording process, resulting in stripe-like, blurred areas [35]. Camera speed, shutter speed and distance to the captured scene all influence how the effect manifests itself [35]. Camera speed and distance correlate in their influence on motion blur, particularly in UAV-based applications: The same amount of blur can be caused by a slower, close-up movement as well as a faster flight at greater distance [36]. Motion blur affects the detectability of thermally relevant areas and can falsify temperatures shown on thermographic images [35].
-
Feature discernibility: The precise identification of thermal anomalies as part of the thermographic building auditing process vastly depends on the level of detail discernible within the recorded images. This aspect can be described on a qualitative level using the term spatial resolution: A common concept in remote sensing, it eludes to “the smallest object [or imaged ground area] that can be resolved by [a] sensor” [37]. Finer or greater spatial resolution means a higher level of detail is displayed in comparison to coarse or low resolution [38]. The size of recordable detail in a given scene depends on the instantaneous field of view (the camera-dependent angle through which radiation can be received) and the variable distance between camera and object of scrutiny [38]. The camera angle plays an influential role as well since the absolute distance to an object increases as soon as the optical axis is not perpendicular to its surface. Although such a change in perspective increases the capturable building surface area, it comes at the cost of lower resolution of the details being portrayed.
-
Accessibility (of an area under scrutiny): While the previous factors describe the influences on the visibility of thermal anomalies in building auditing, this third criterion lays emphasis on what areas are even accessible to the various image acquisition methods. This depends on the camera pose and angle in relation to the inspected object as well as surface features and form. If the camera’s optical axis is almost parallel to the building surface, the identification of thermal bridges will be nearly impossible. Similarly, a building part might simply be inaccessible due to positional constraints or surface elements blocking the camera’s view. This aspect is particularly relevant when the acquisition’s aim lies in assessing the entire envelope of a given structure.
Additionally, two quantitative criteria strive to evaluate the recorded temperature values influenced by the different recording settings and means of acquisition. These are calculated through the thermal comparison of identical regions of interest in images acquired under varying settings. Quantitative analysis, as presented by Mayer et al. [22], is extended to further inspect the thermal difference between anomalies in comparison to the given surroundings and background. The two criteria are:
-
Comparative temperature difference: As the name suggests, the comparative temperature difference means to indicate variations in recorded thermal values across different settings and acquisition methods. Quantifying this value allows the thermal images to be evaluated with regards to their usability in calculating U-values or energy losses [22]. The difference is defined as the delta in temperature of a certain area of interest across two comparable thermographic images:
Δ T i , j , k , l A = T i , k A T j , l A ,
where T i , k A corresponds to the maximum temperature of an area of interest A (a thermal anomaly) recorded at a distance i of up to 15 m (terrestrial and manual UAV), 22 m or 42 m (automatic UAV) to the building. The camera angle k is defined as either t (terrestrial), o (oblique/45°), n (nadir/90°) or m (manual/0°). T j , l A is the maximum temperature of the same area of interest A within a second thermal image taken at a distance j of up to 15 m (terrestrial and manual UAV), 22 m or 42 m (automatic UAV) to the building and the camera angle l —again defined as either t, o, n or m. Changes in distance to the target object may lead to distortions in temperatures recorded by a thermal camera owing to intermediate air particles absorbing parts of the emitted infrared radiation [27]. Such atmospheric influences will likely have a noticeable effect as—according to Fouad and Richter [27]—the resulting temperature distortion remains neglectable only at distances of up to 20 m. In addition, the viewing angle k or l can further influence the calculated thermal difference. Emissivity decreases significantly at angles of more than 45°, thus causing larger temperature differences [39]. Quantifying the comparative temperature difference is important because it allows information to be derived about the ways in which thermographic UAV imagery can be used, e.g., in calculating U-values or energy losses [22].
-
Comparative contrast: Contrast indicates differences in brightness and color within an image [40]. According to Ortiz-Sanz et al. [39] and Filippeschi and Leccese [41], this factor is mainly influenced by camera distance and angle to the object under scrutiny. A decrease in quantitative thermal contrast can be caused by signal degradation and increased reflections associated with lower emissivity levels [27,29]. For its use in thermal building auditing, contrast in an individual image can be defined as the temperature difference between a thermal anomaly (area of interest) and its surroundings (reference area). We, therefore, specify the comparative quantitative contrast as the difference in contrast of a specific area of interest between two thermographic images as follows:
Δ T i , j , k , l C = Δ T i , k C Δ T j , l C ,
where Δ T i , k C and Δ T j , l C correspond to the quantitative contrasts of a thermal anomaly found in images recorded with different settings i, k and j, l (see comparative temperature difference). The contrast values themselves are defined as:
Δ T i , k C = T i , k A T i , k R A ,
Δ T j , l C = T j , l A T j , l R A .
T i , k A and T j , l A thereby describe the temperatures of an area of interest A , while T i , k R A and T j , l R A represent the values measured at an adjacent reference area R A . The reference area is chosen as the nearest point to an area of increased temperature that is thermally monotonous, in other words constitutes an unaffected part of the building. The distances i and j between camera and building vary between up to 15 m for terrestrial and manually piloted UAV, as well as 22 m or 42 m for automatic UAV-based recordings. The camera angles k and l can once more be defined as either t, o, n or m.

2.4. Evaluation Procedure

This study examines 112 areas of increased temperature (e.g., thermal bridges) located on windows, (glazed) doors, roofs, façades, balconies, building bases, chimneys and vent openings. Examples of some of the inspected areas of interest are shown in Figure 4. A summary of all analysed thermal hotspots and their respective building parts is presented in Table 3.
For the two qualitative criteria, both of which relate to thermal differences, the maximum temperature of each of these areas of interest is utilized as a basis for the assessment. FLIR Thermal Studio’s “ellipse” feature allows a user to trace anomalous areas within thermographic images and can determine said maximum. The nearest neighboring point that is part of the thermal background or surrounding average defines the reference temperature used to calculate the comparative quantitative contrast. As Fouad and Richter [27] found the effects of distance-dependent temperature distortions to be negligible at up to 20 m, we consolidate all terrestrial and manually piloted UAV acquisitions into two respective groups for the following quantitative analyses.

3. Results

Identified areas of interest must be analyzed according to the previously introduced quantitative and qualitative criteria to allow for conclusions to be drawn about the quality of the thermal images present in this case study dataset. The following results can be derived in doing so:
-
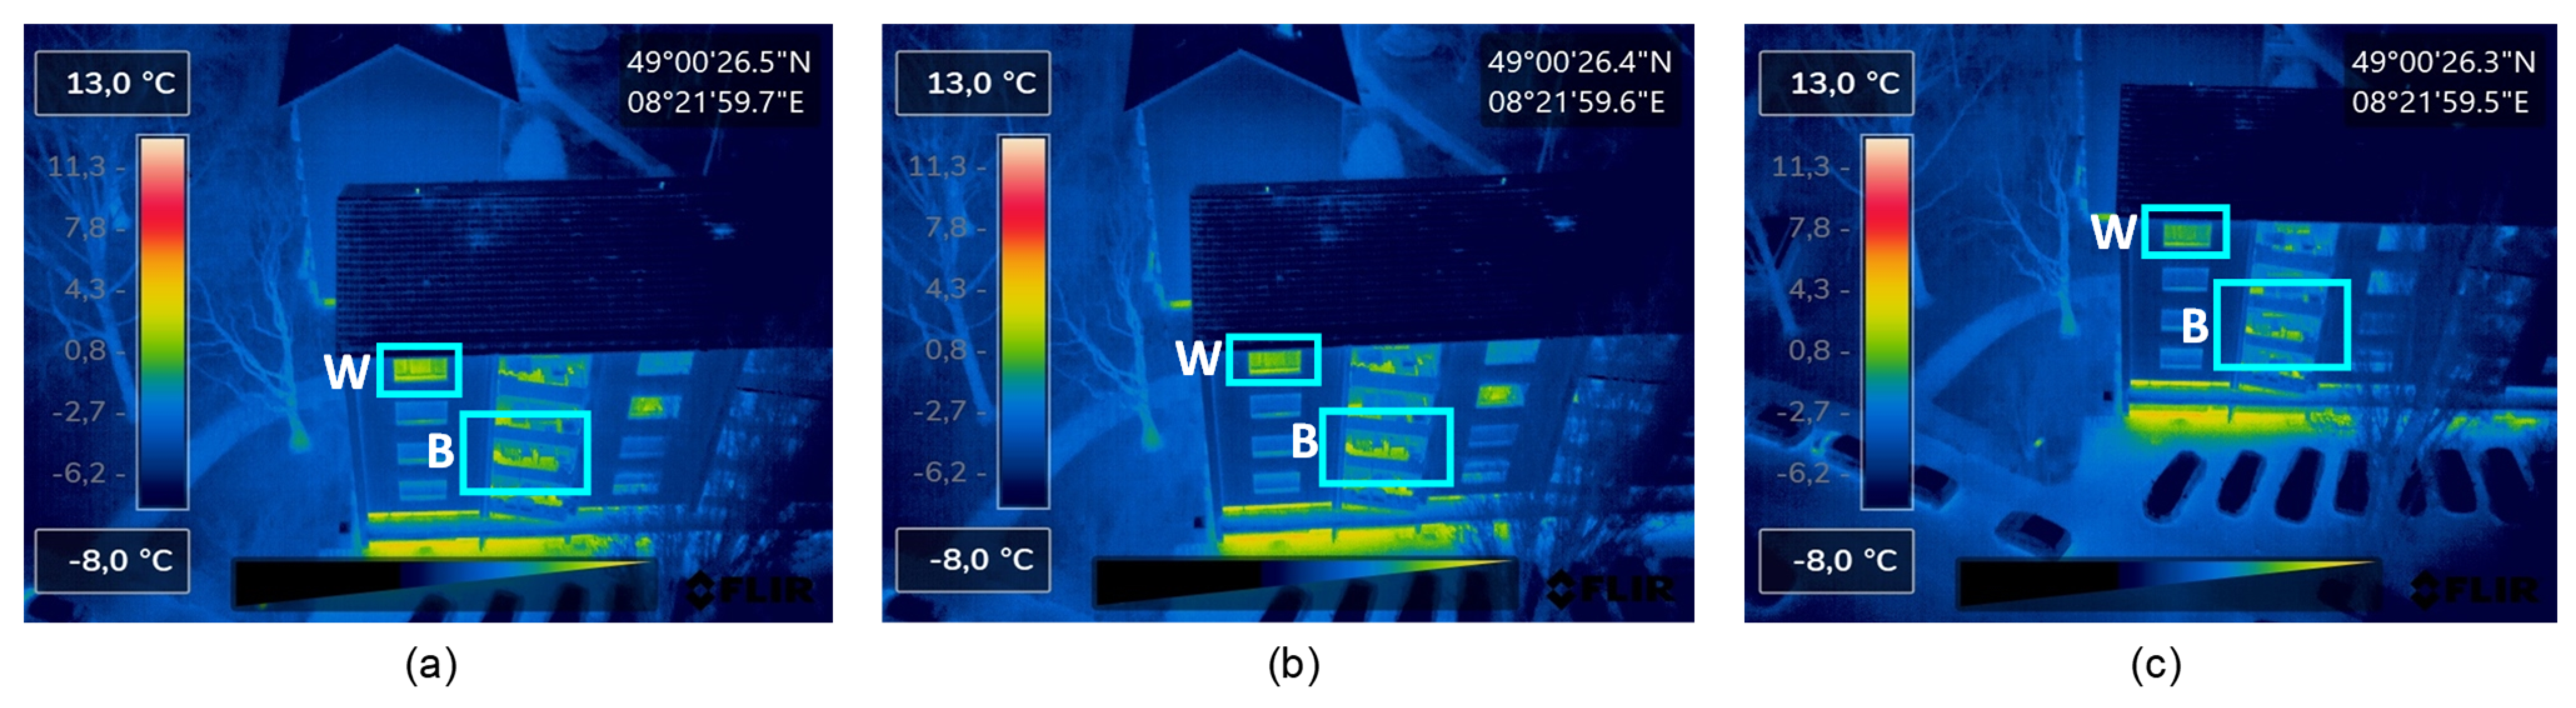
Motion blur: Motion blur stems from movements of either the camera or objects in the field of view, making this criterion solely relevant to dynamic acquisition modes, seeing as the objects under scrutiny—namely buildings—are immobile. Acquisition via hand-held terrestrial camera or UAV in manual mode is considered static and therefore unaffected. In contrast, automatic UAV flight mode can be susceptible to motion blur. An evaluation of the case study images, however, shows that flight speeds of up to 5 m/s do not cause any visible blurring in all analyzed images. Figure 5 illustrates the absence of blurring effects in three exemplary images of the dataset.
-
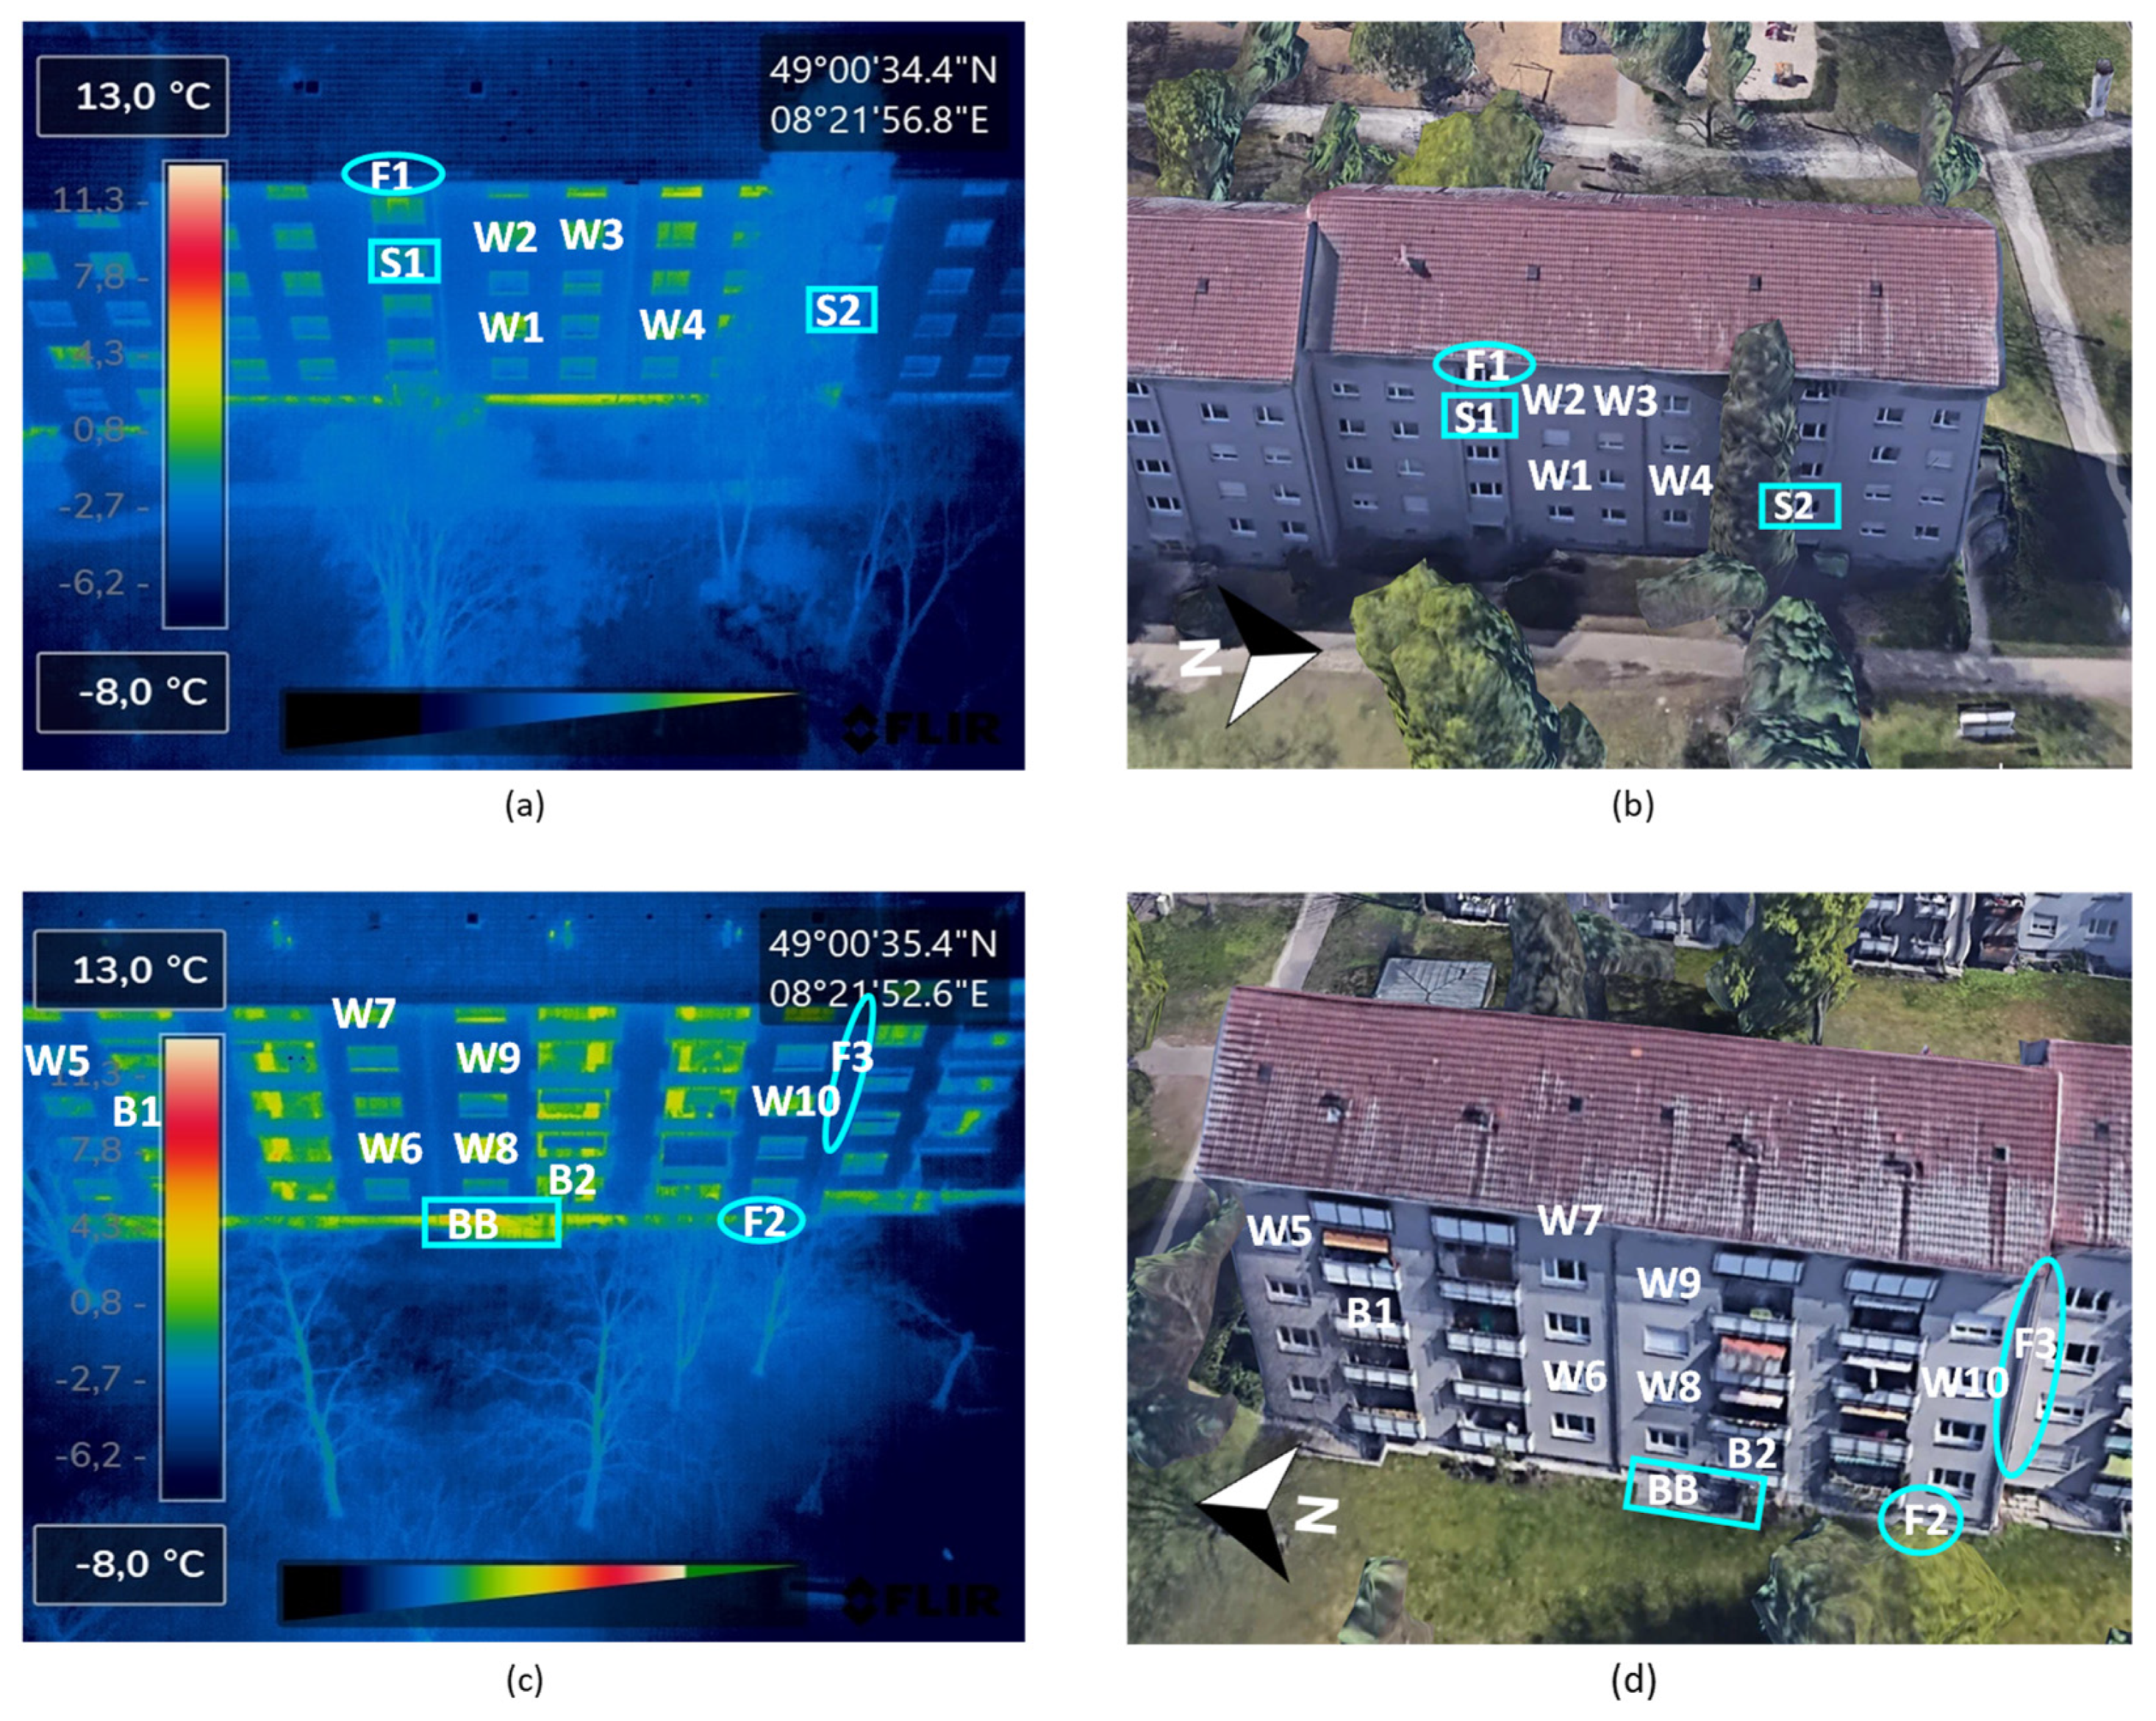
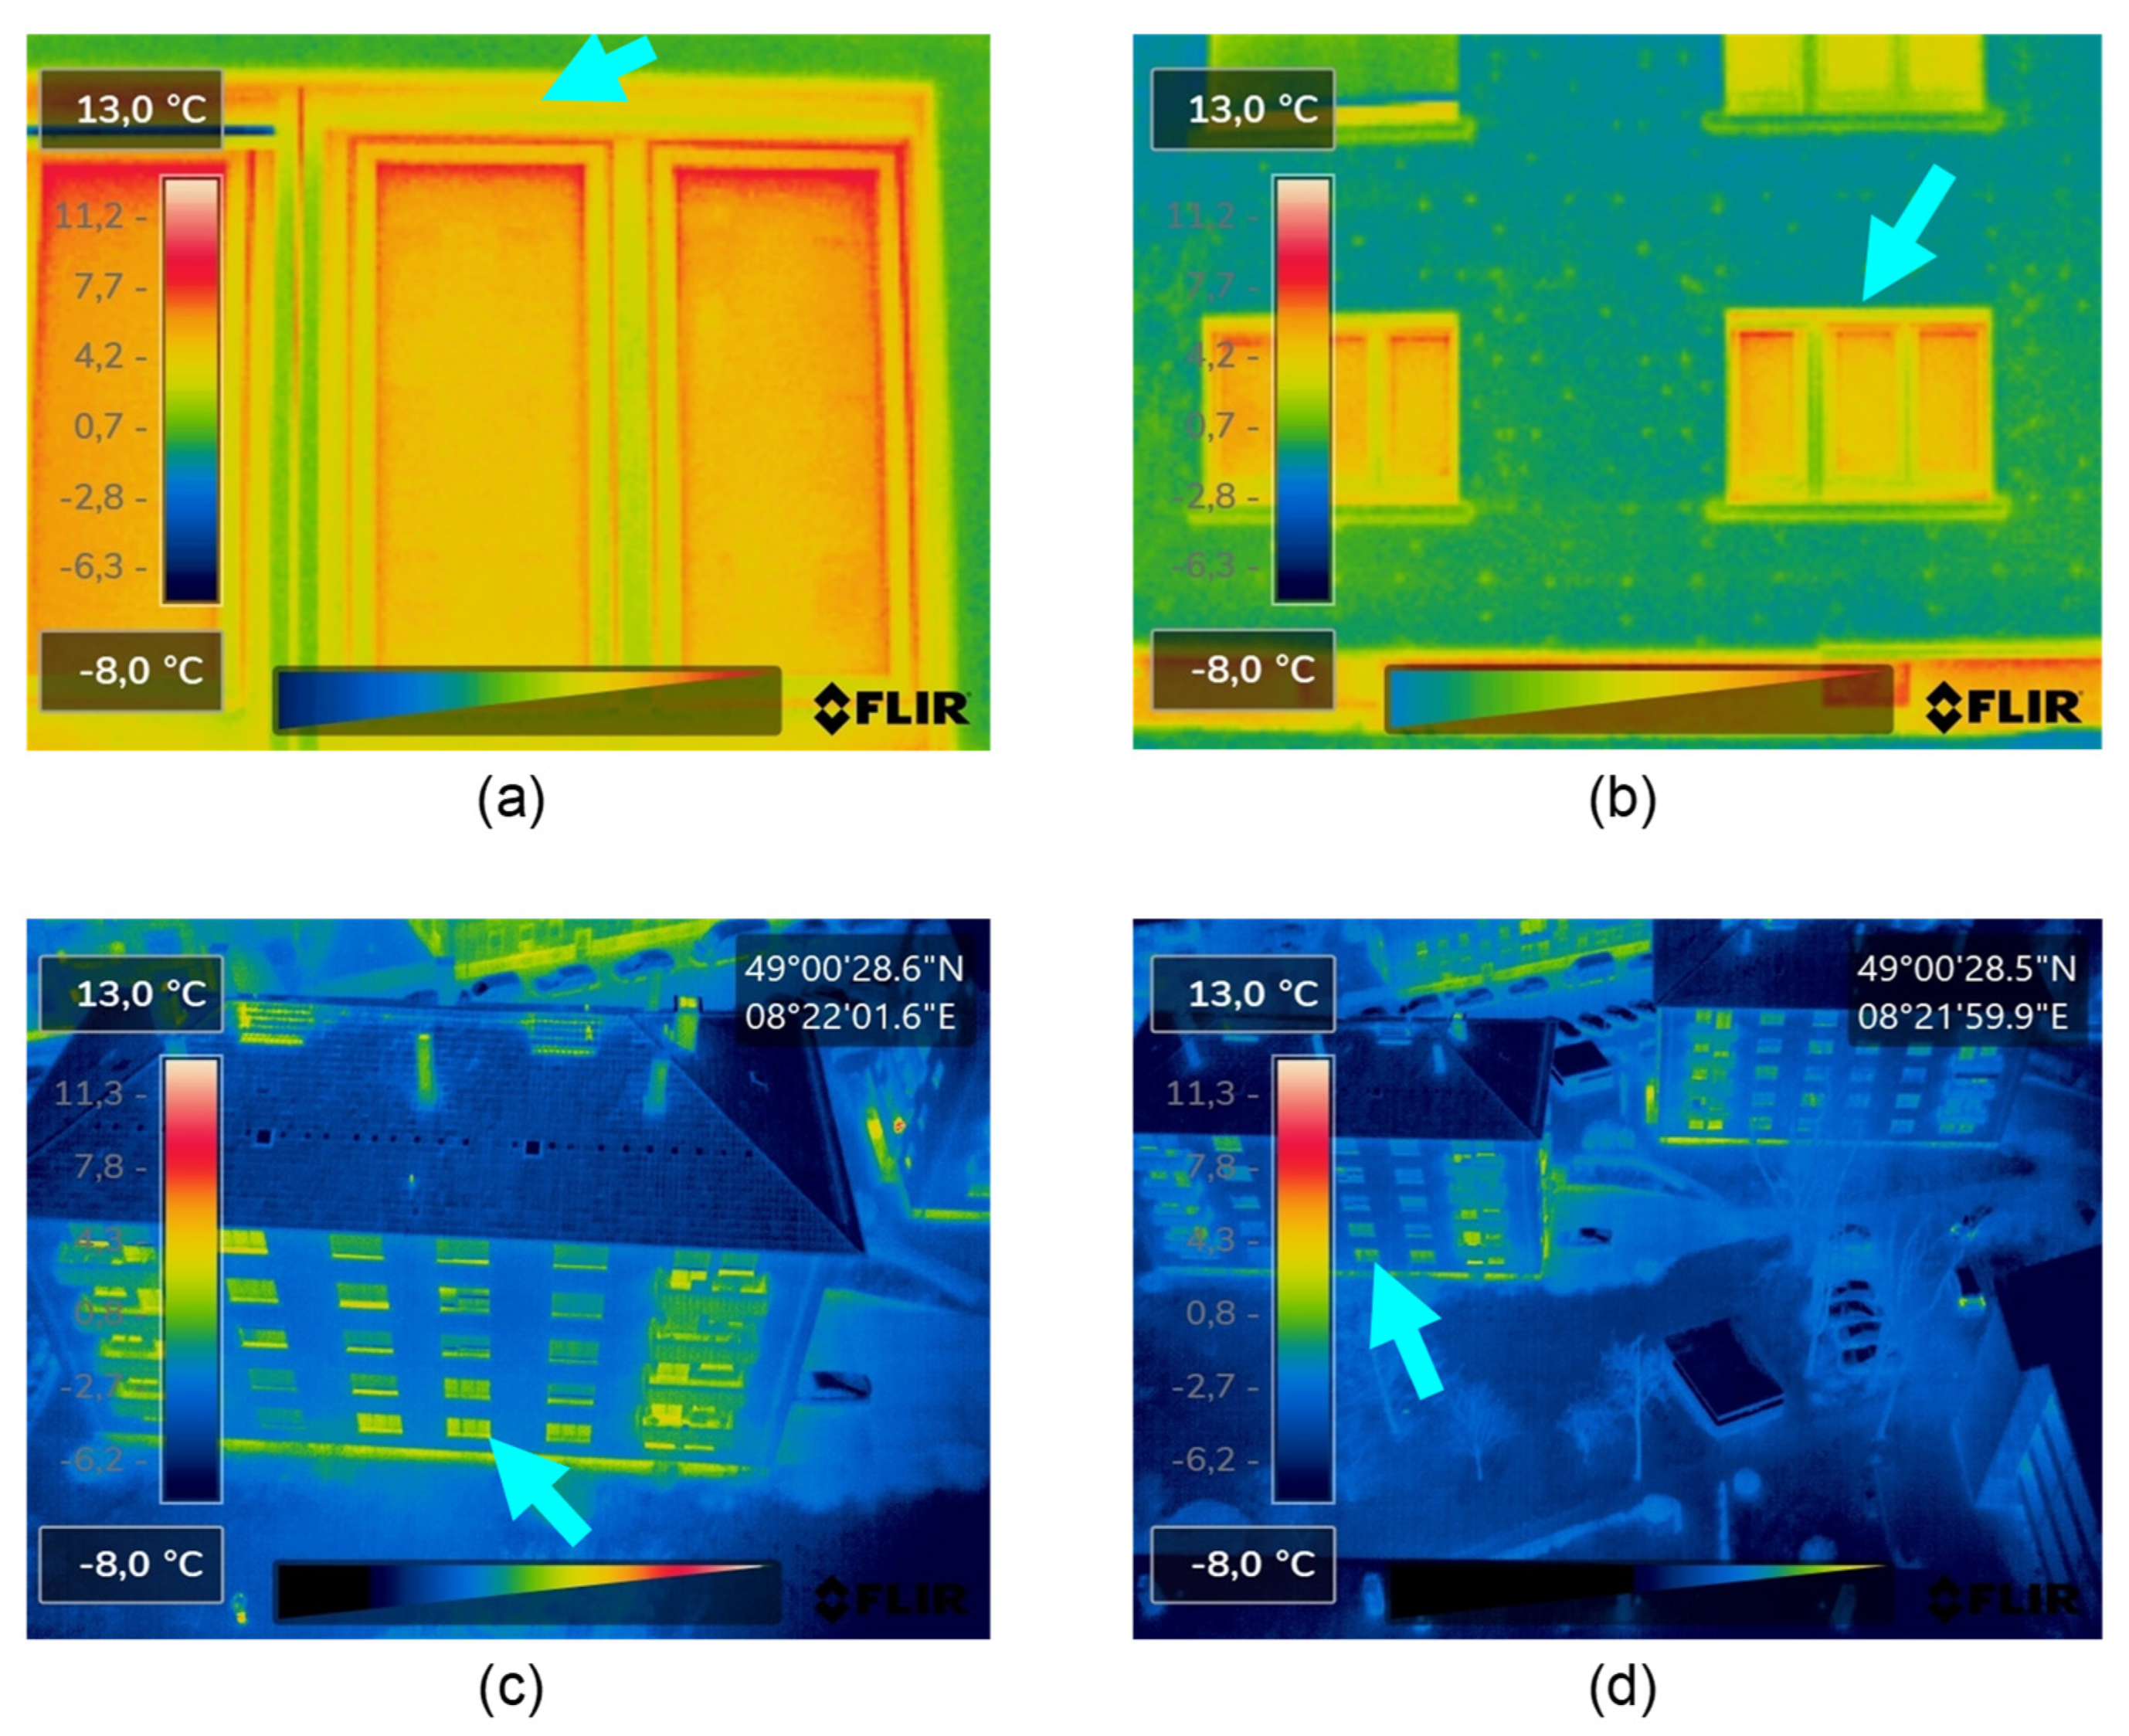
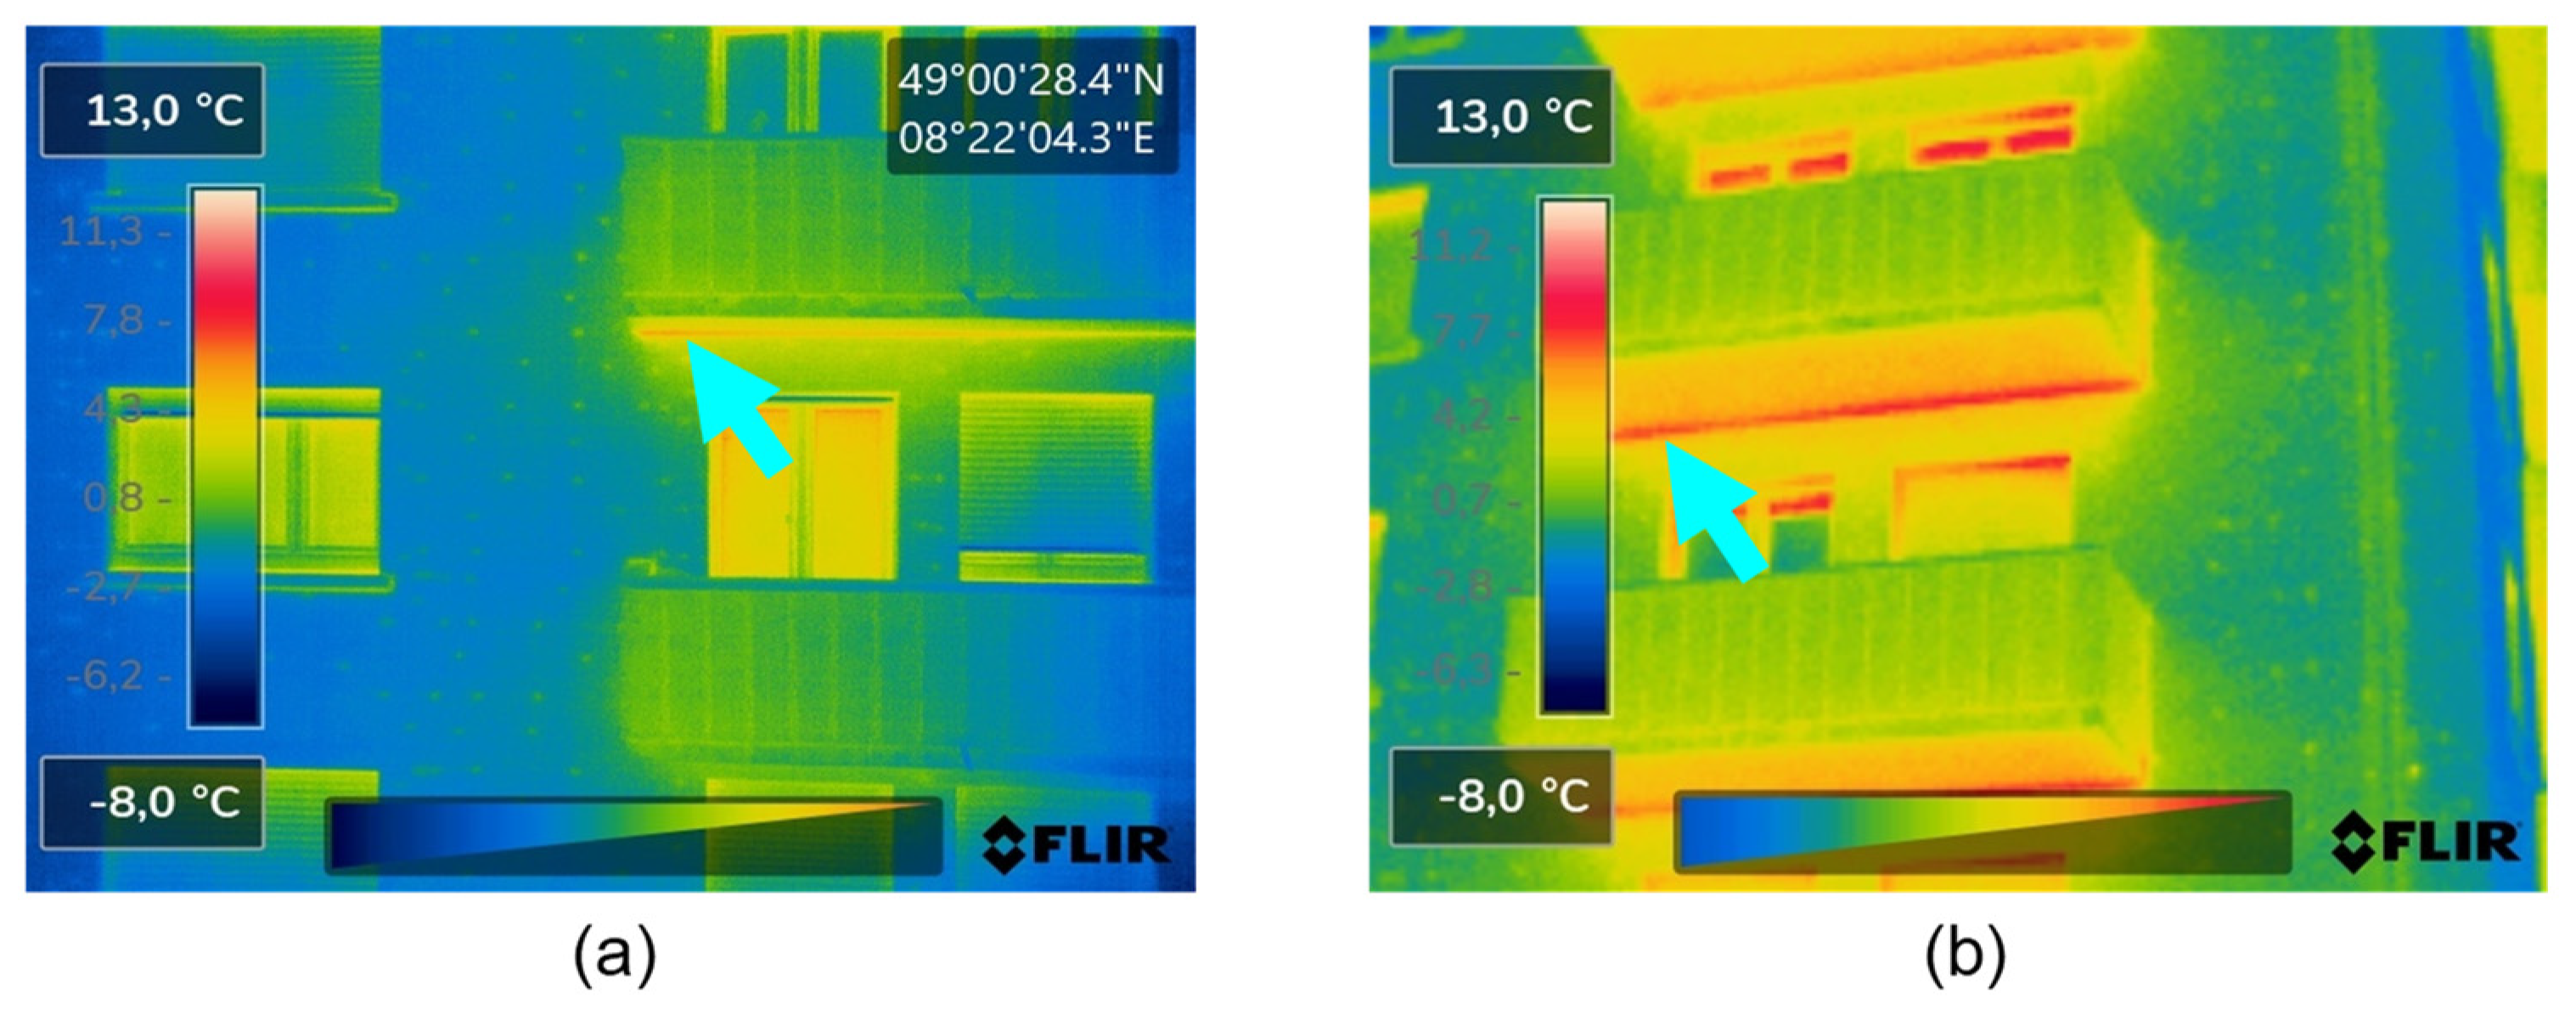
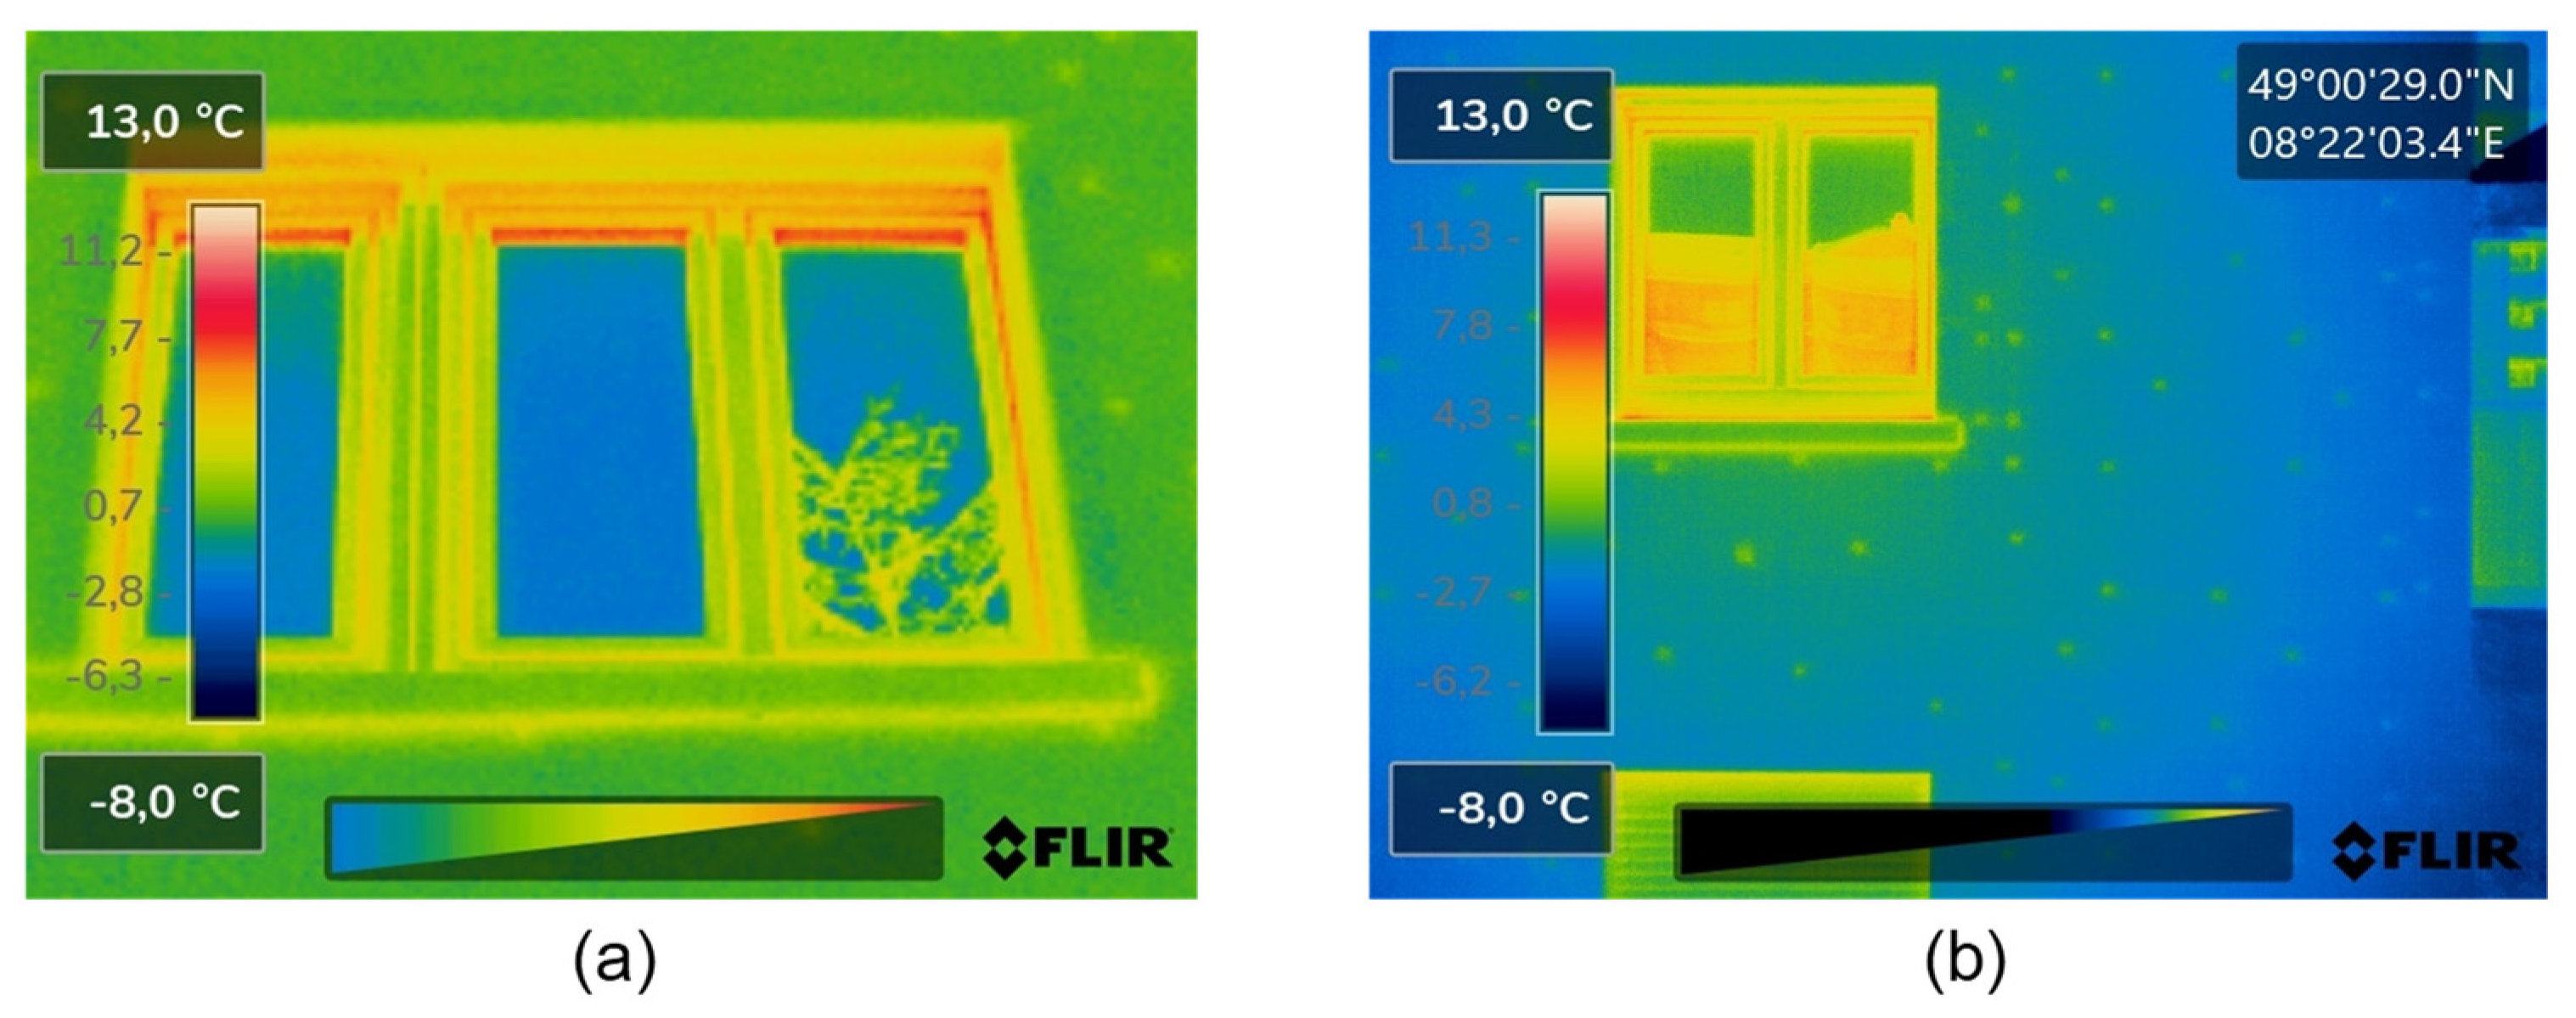
Feature discernibility: The distance between camera and target object, the angle and intrinsic camera-related properties all significantly influence resolution and the visibility of image details. This impact varies based on the mode of acquisition and implemented settings. UAV-based thermal images, recorded at a height of 22 m to 42 m above a building at a 45° camera angle, display discernible outlines of basement exits, base areas, windows, balconies and doors. However, a visibly greater accuracy can be achieved at a 22 m distance in comparison to 42 m with regards to details on windows and balconies. Thermal anomalies on window frames, sills and balconies, while clear at a closer range, are indistinguishable in images recorded at a distance of 42 m. Figure 6 exemplifies this observation by depicting the same building window captured through various methods and settings. As the same figure also demonstrates, such building elements can be seen in even greater detail in manually recorded images and terrestrial images owing to the smaller distances of 4 m to 15 m. On a ground-level altitude, hand-held cameras can capture images of comparable detail to a manual UAV-based camera at the same distance to the building. However, while manually piloted UAVs can cover upper areas of a building envelope with the same constant spatial resolution, the terrestrial acquisition mode requires changes in angle, thus causing a loss of discernible details. Nevertheless, a comparative analysis of the case study images shows that the terrestrial hand-held camera-based method records the following areas in greatest detail: geometric thermal bridges on balcony slabs, walls, between the building base and its façade, small windows close to ground level, window frame structures, air leakages between door and frame as well as window and sill and accumulated heat in upper window parts.
-
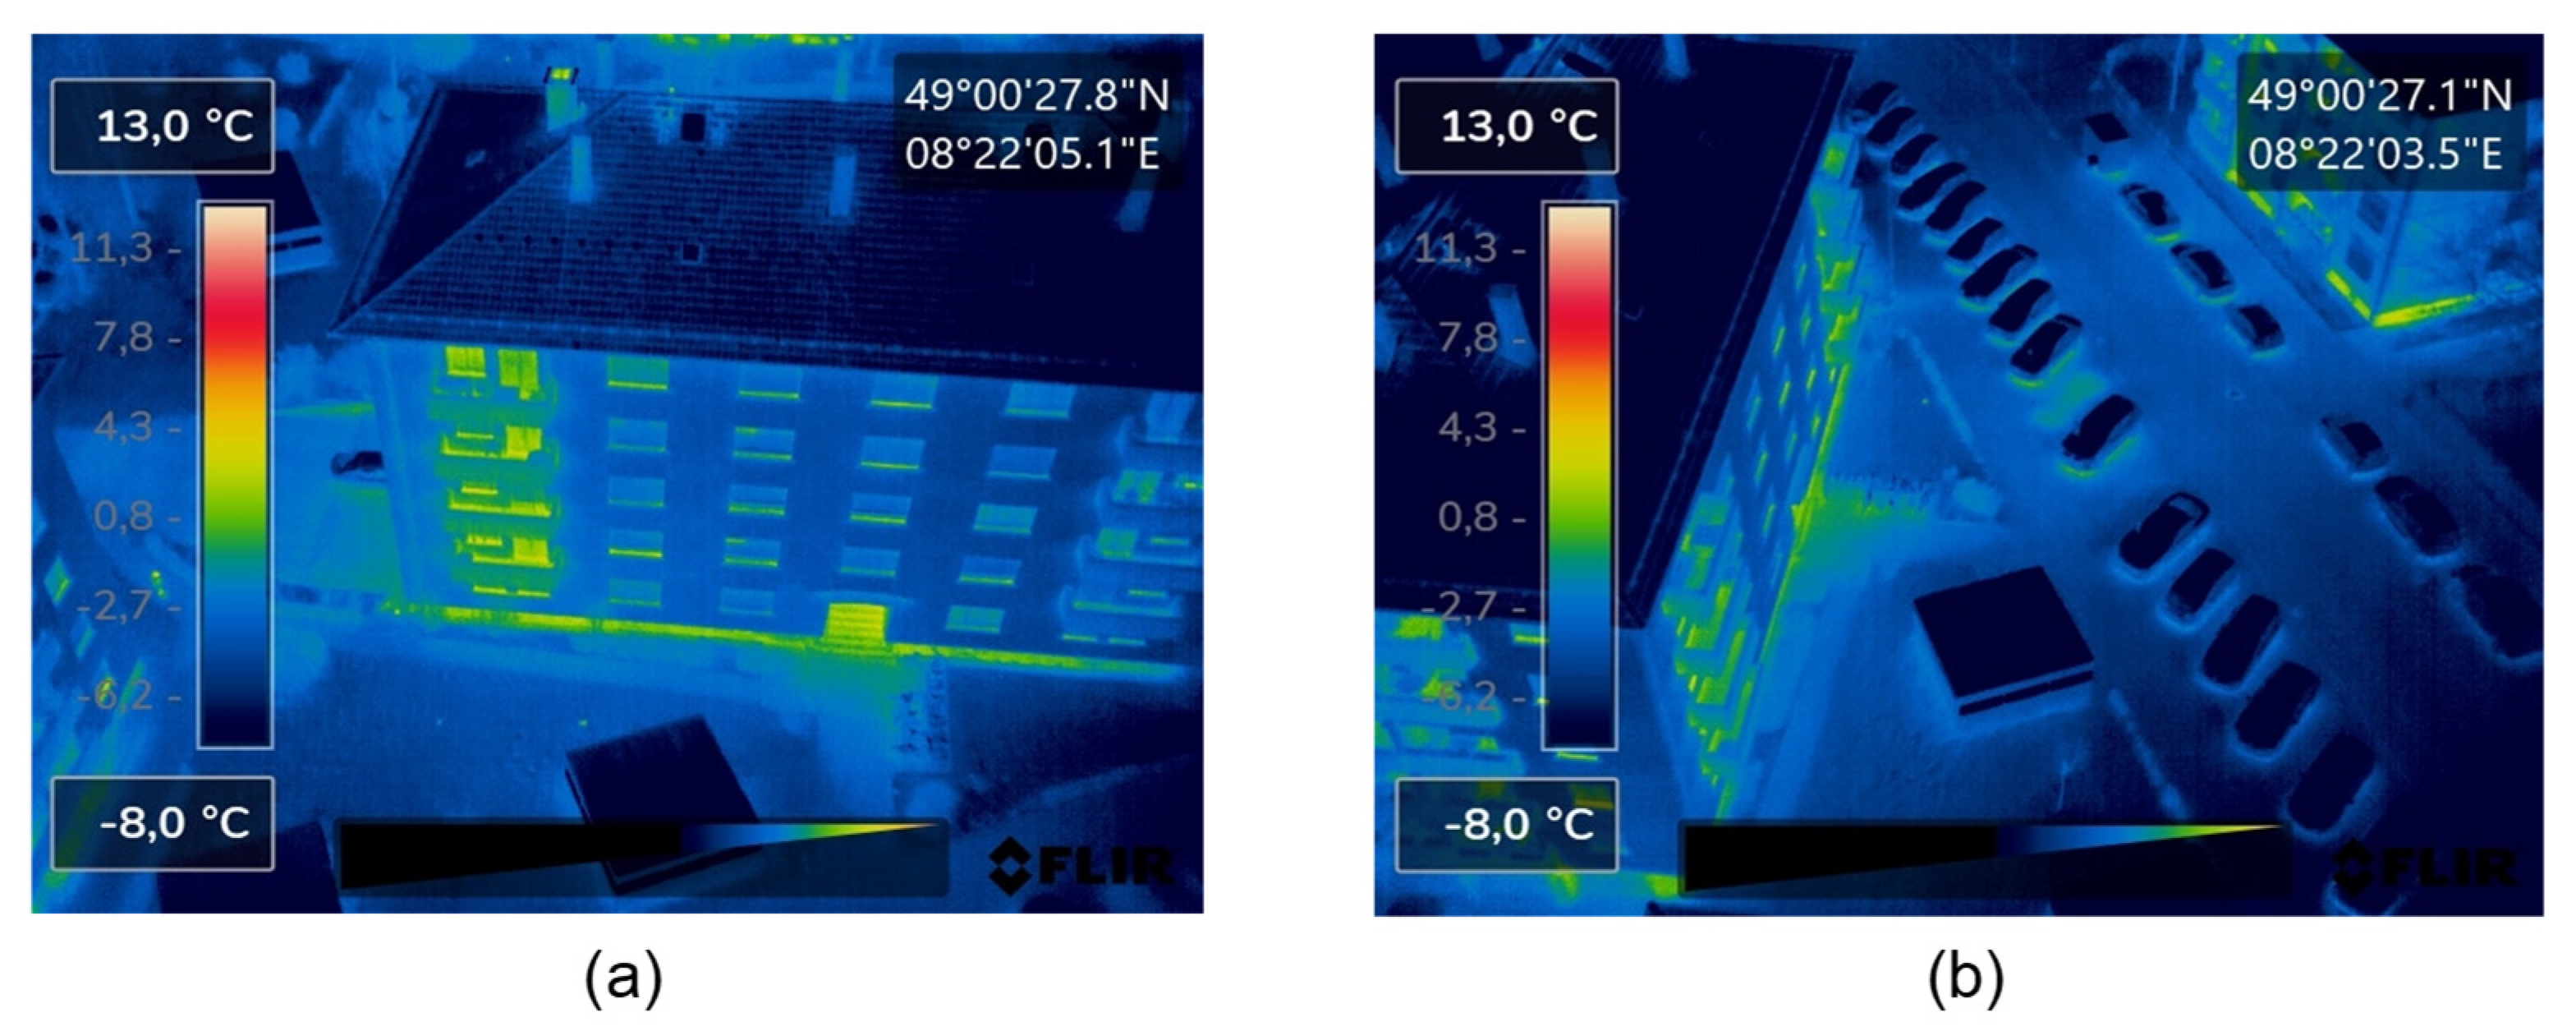
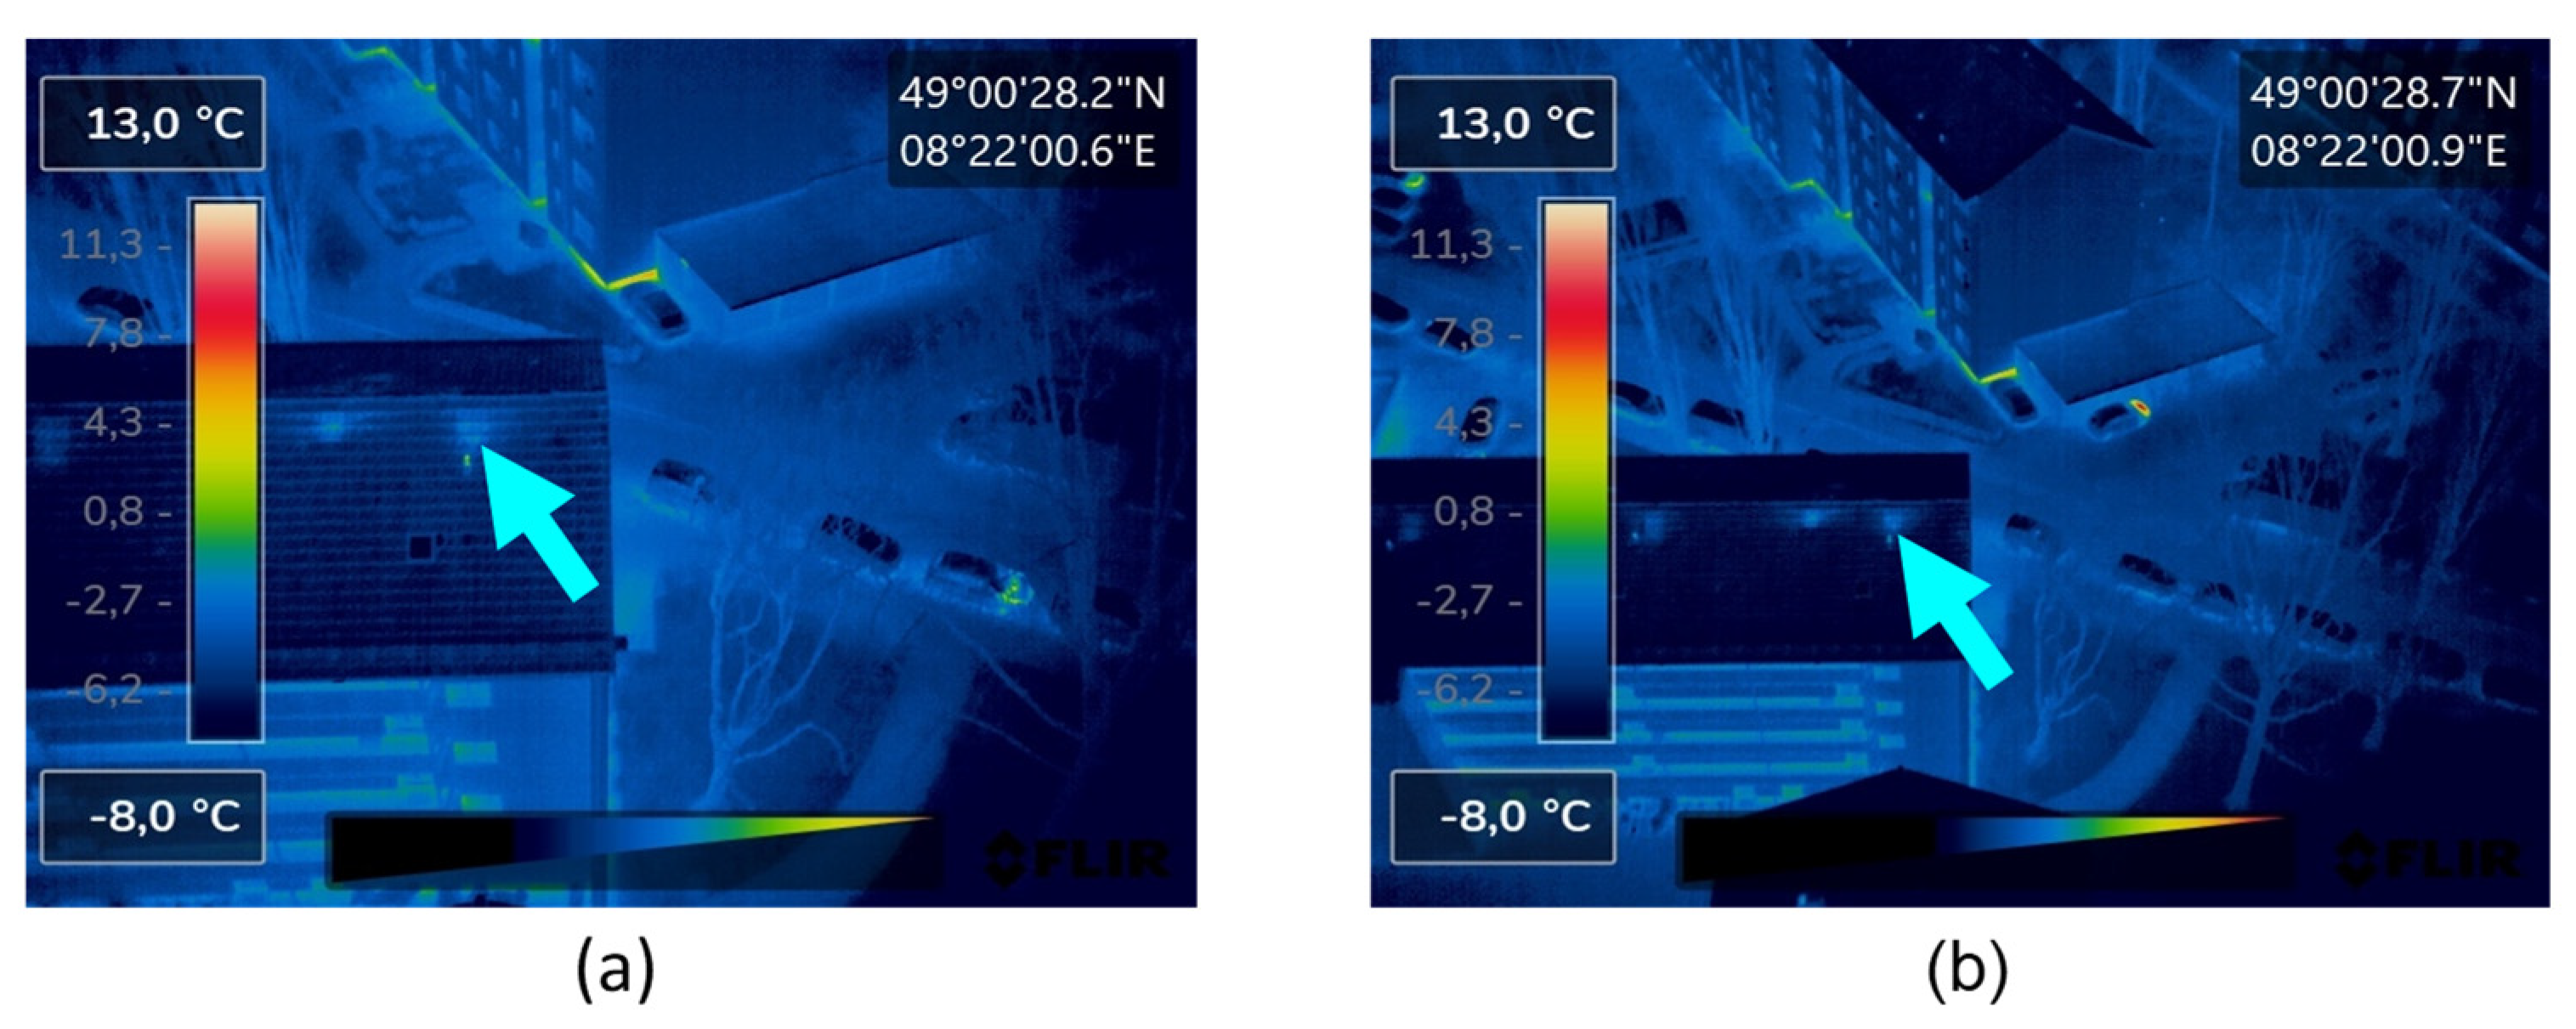
Accessibility: The areas of a building’s envelope that can be captured by thermal camera depend on the acquisition method and the achievable position-based field of view. The nadir perspective, while allowing for a detailed view of rooftops, is ineffective at recording a building’s façade, owing to the perpendicular angle between optical axis and normal on such a wall. In contrast, UAV-based images acquired automatically with a 45° pitch camera angle do show these kinds of details. In theory, this method allows for almost (Excepting minor blind spots such as those caused by building elements (like balconies) obscuring small façade parts from view) the entire building envelope to be screened. It must be noted, however, that the choice of flight pattern also plays an important role in how well the various building façades can be captured. As depicted in Figure 7a, a heading angle perpendicular to a wall will allow for the above described to be achieved with regards to this particular façade. However, assuming a rectangular building shape, the same angle will allow near to no clear view or access to both neighboring walls (s. Figure 7b). Flying solely with a strip pattern at such a heading angle needs to be cautioned against. Choosing a crosshatch pattern instead will ensure all four building façades are recorded with the same level of detail.
Acquisition by means of manually piloted UAV does not suffer from this methodological drawback, as the heading angle can be adapted to always assume the perpendicular to the wall in question. A combination of front-facing camera (0° pitch angle), small distance and the high degree of flexibility permitted by the UAV allow for the entire building envelope to be screened without similar blind spots occurring.
Compared to UAV-based images, hand-held cameras are far more restricted in their access to a building’s envelope as they fail to capture rooftops of buildings as high as these. This means an entire area of the envelope may oftentimes be out of range for this acquisition method. Additionally, attaining views of areas higher up becomes more difficult the smaller the absolute distance between camera and building grows, owing to building features, such as balconies, obscuring the field of view. While this does improve at larger distances such as 8 m and 15 m, Figure 8 exemplifies how windows and their sills still remain concealed from the ground-based camera’s view in comparison to images acquired by manual UAV. However, such an upward facing angle can also be advantageous for the inspection of eaves or the bottom of balcony slabs—for which Figure 8 shows the terrestrial method excels. Easily detectable areas by hand-held camera also include geometric anomalies in the joint area of two buildings between roof and façade, on side walls, and on the inside walls of balconies. However, the aforementioned limitation impacts these analyses with regards to areas of interest further above the ground.
-
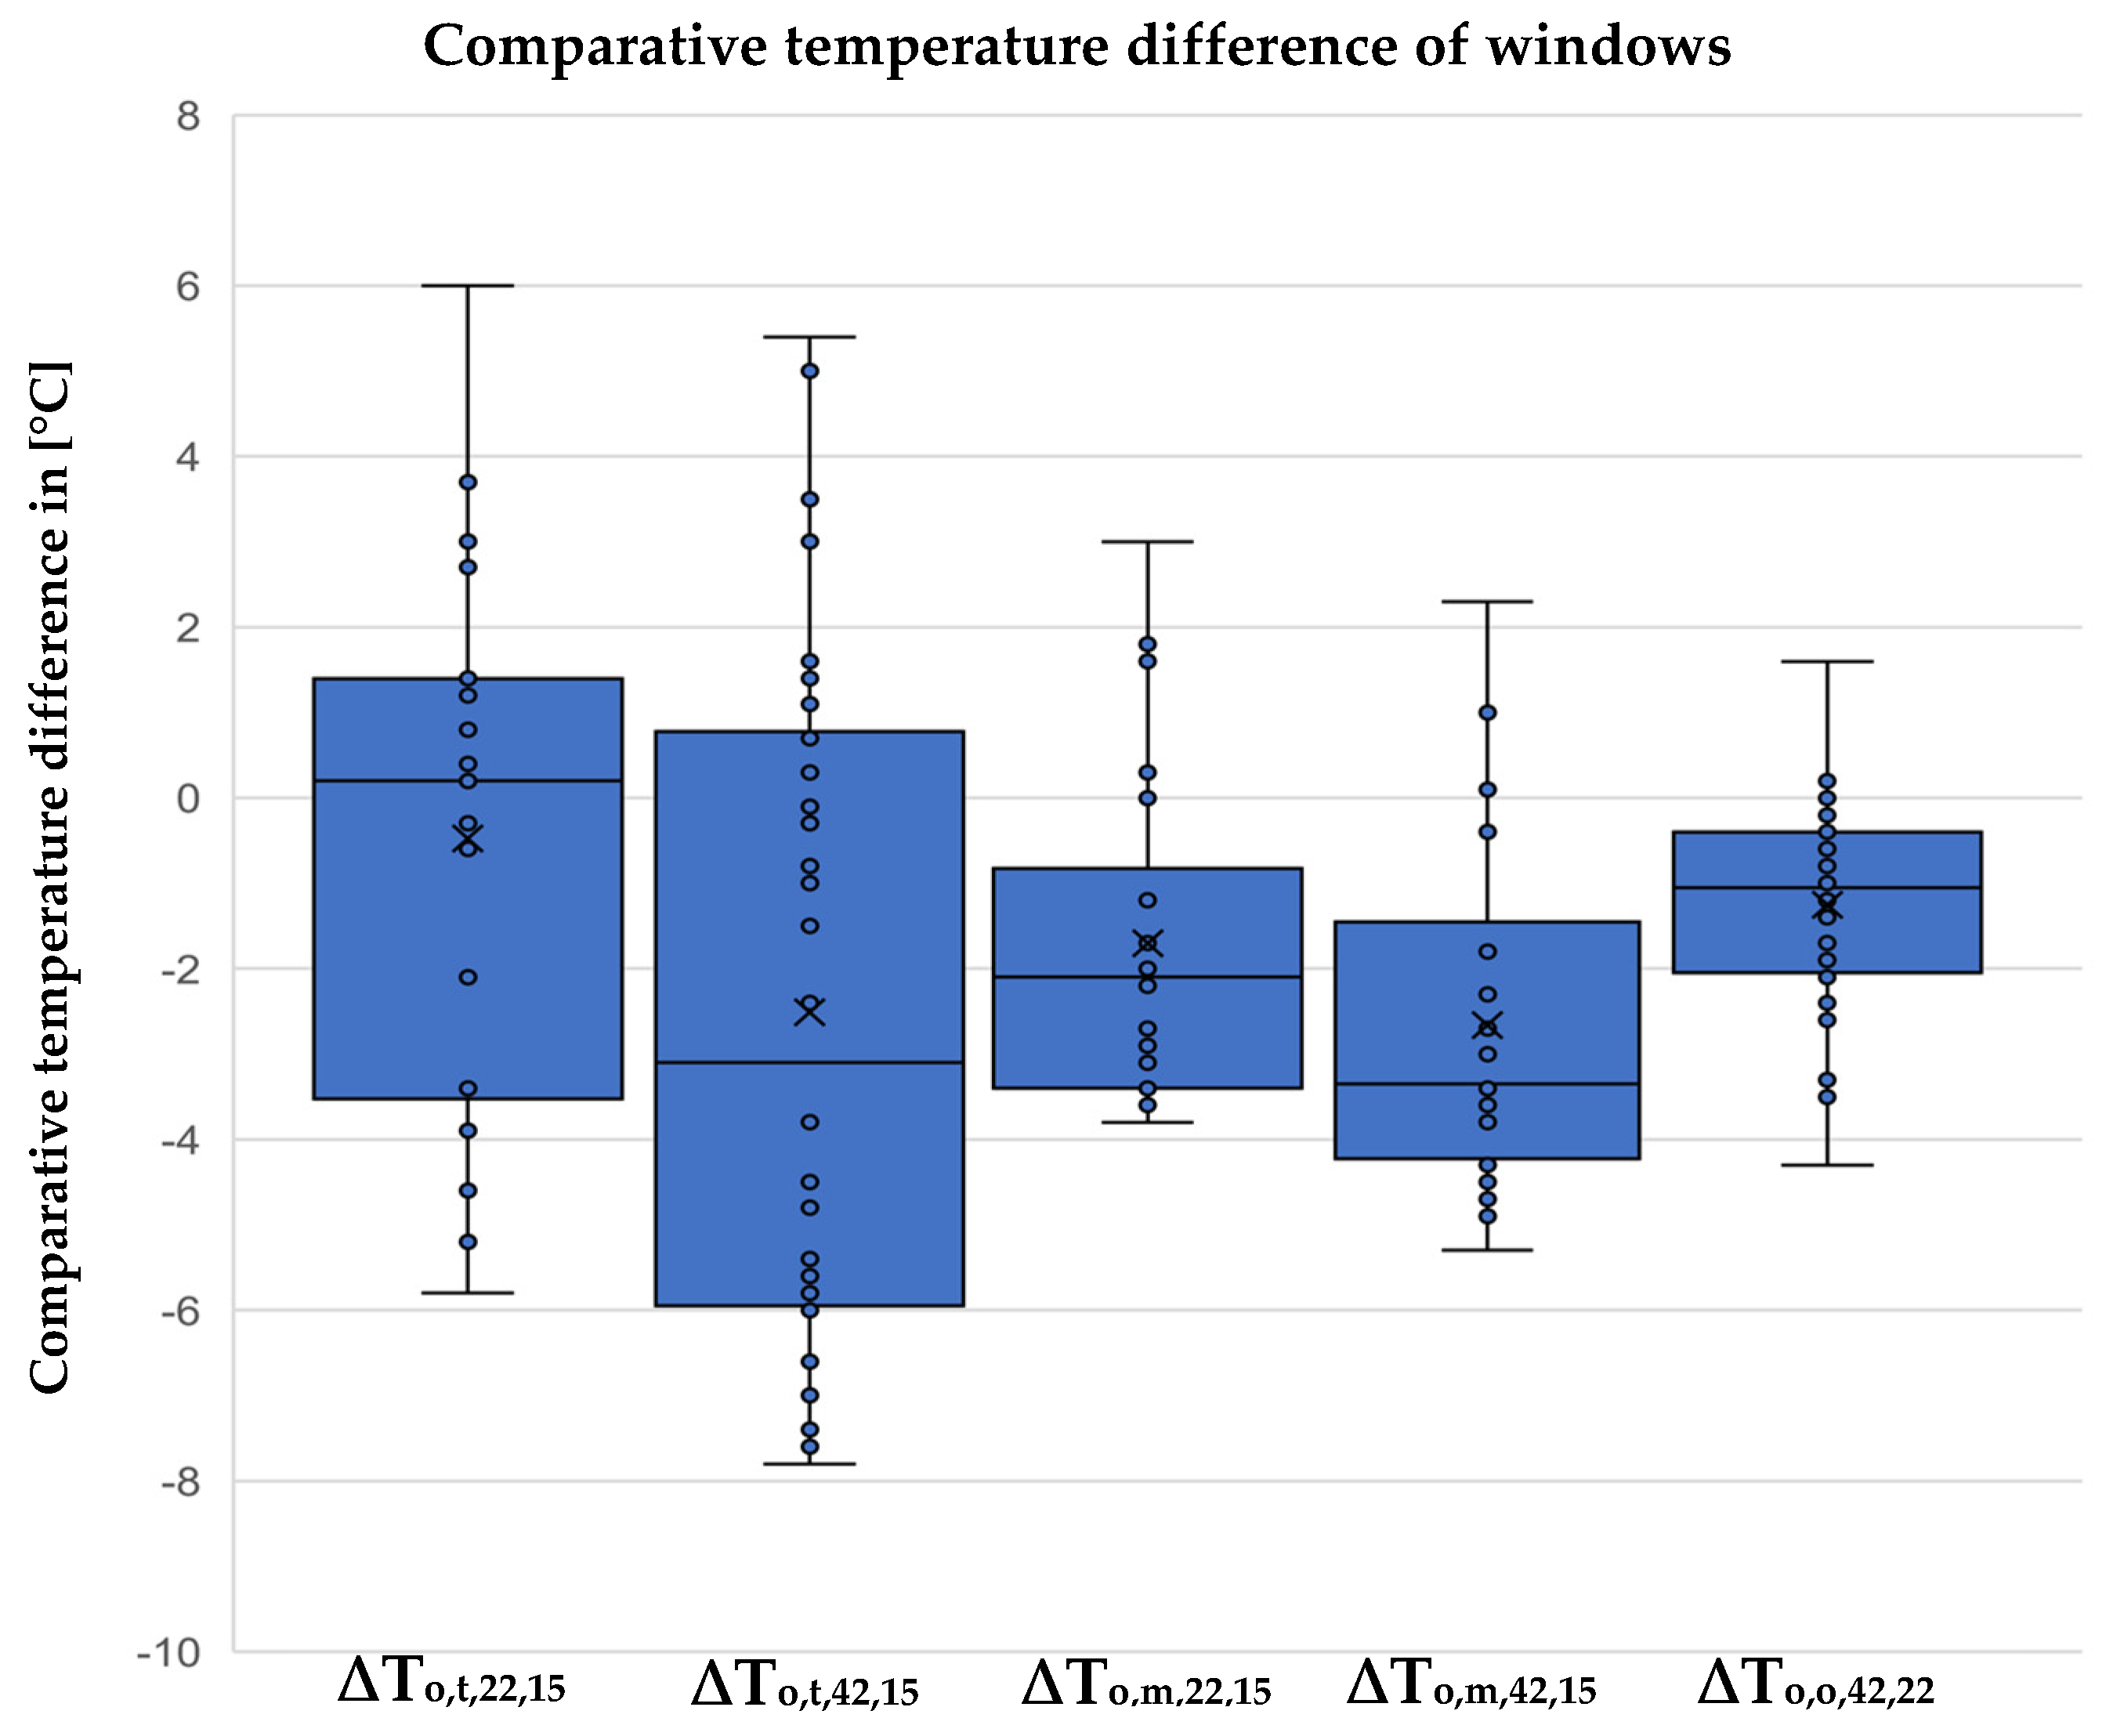
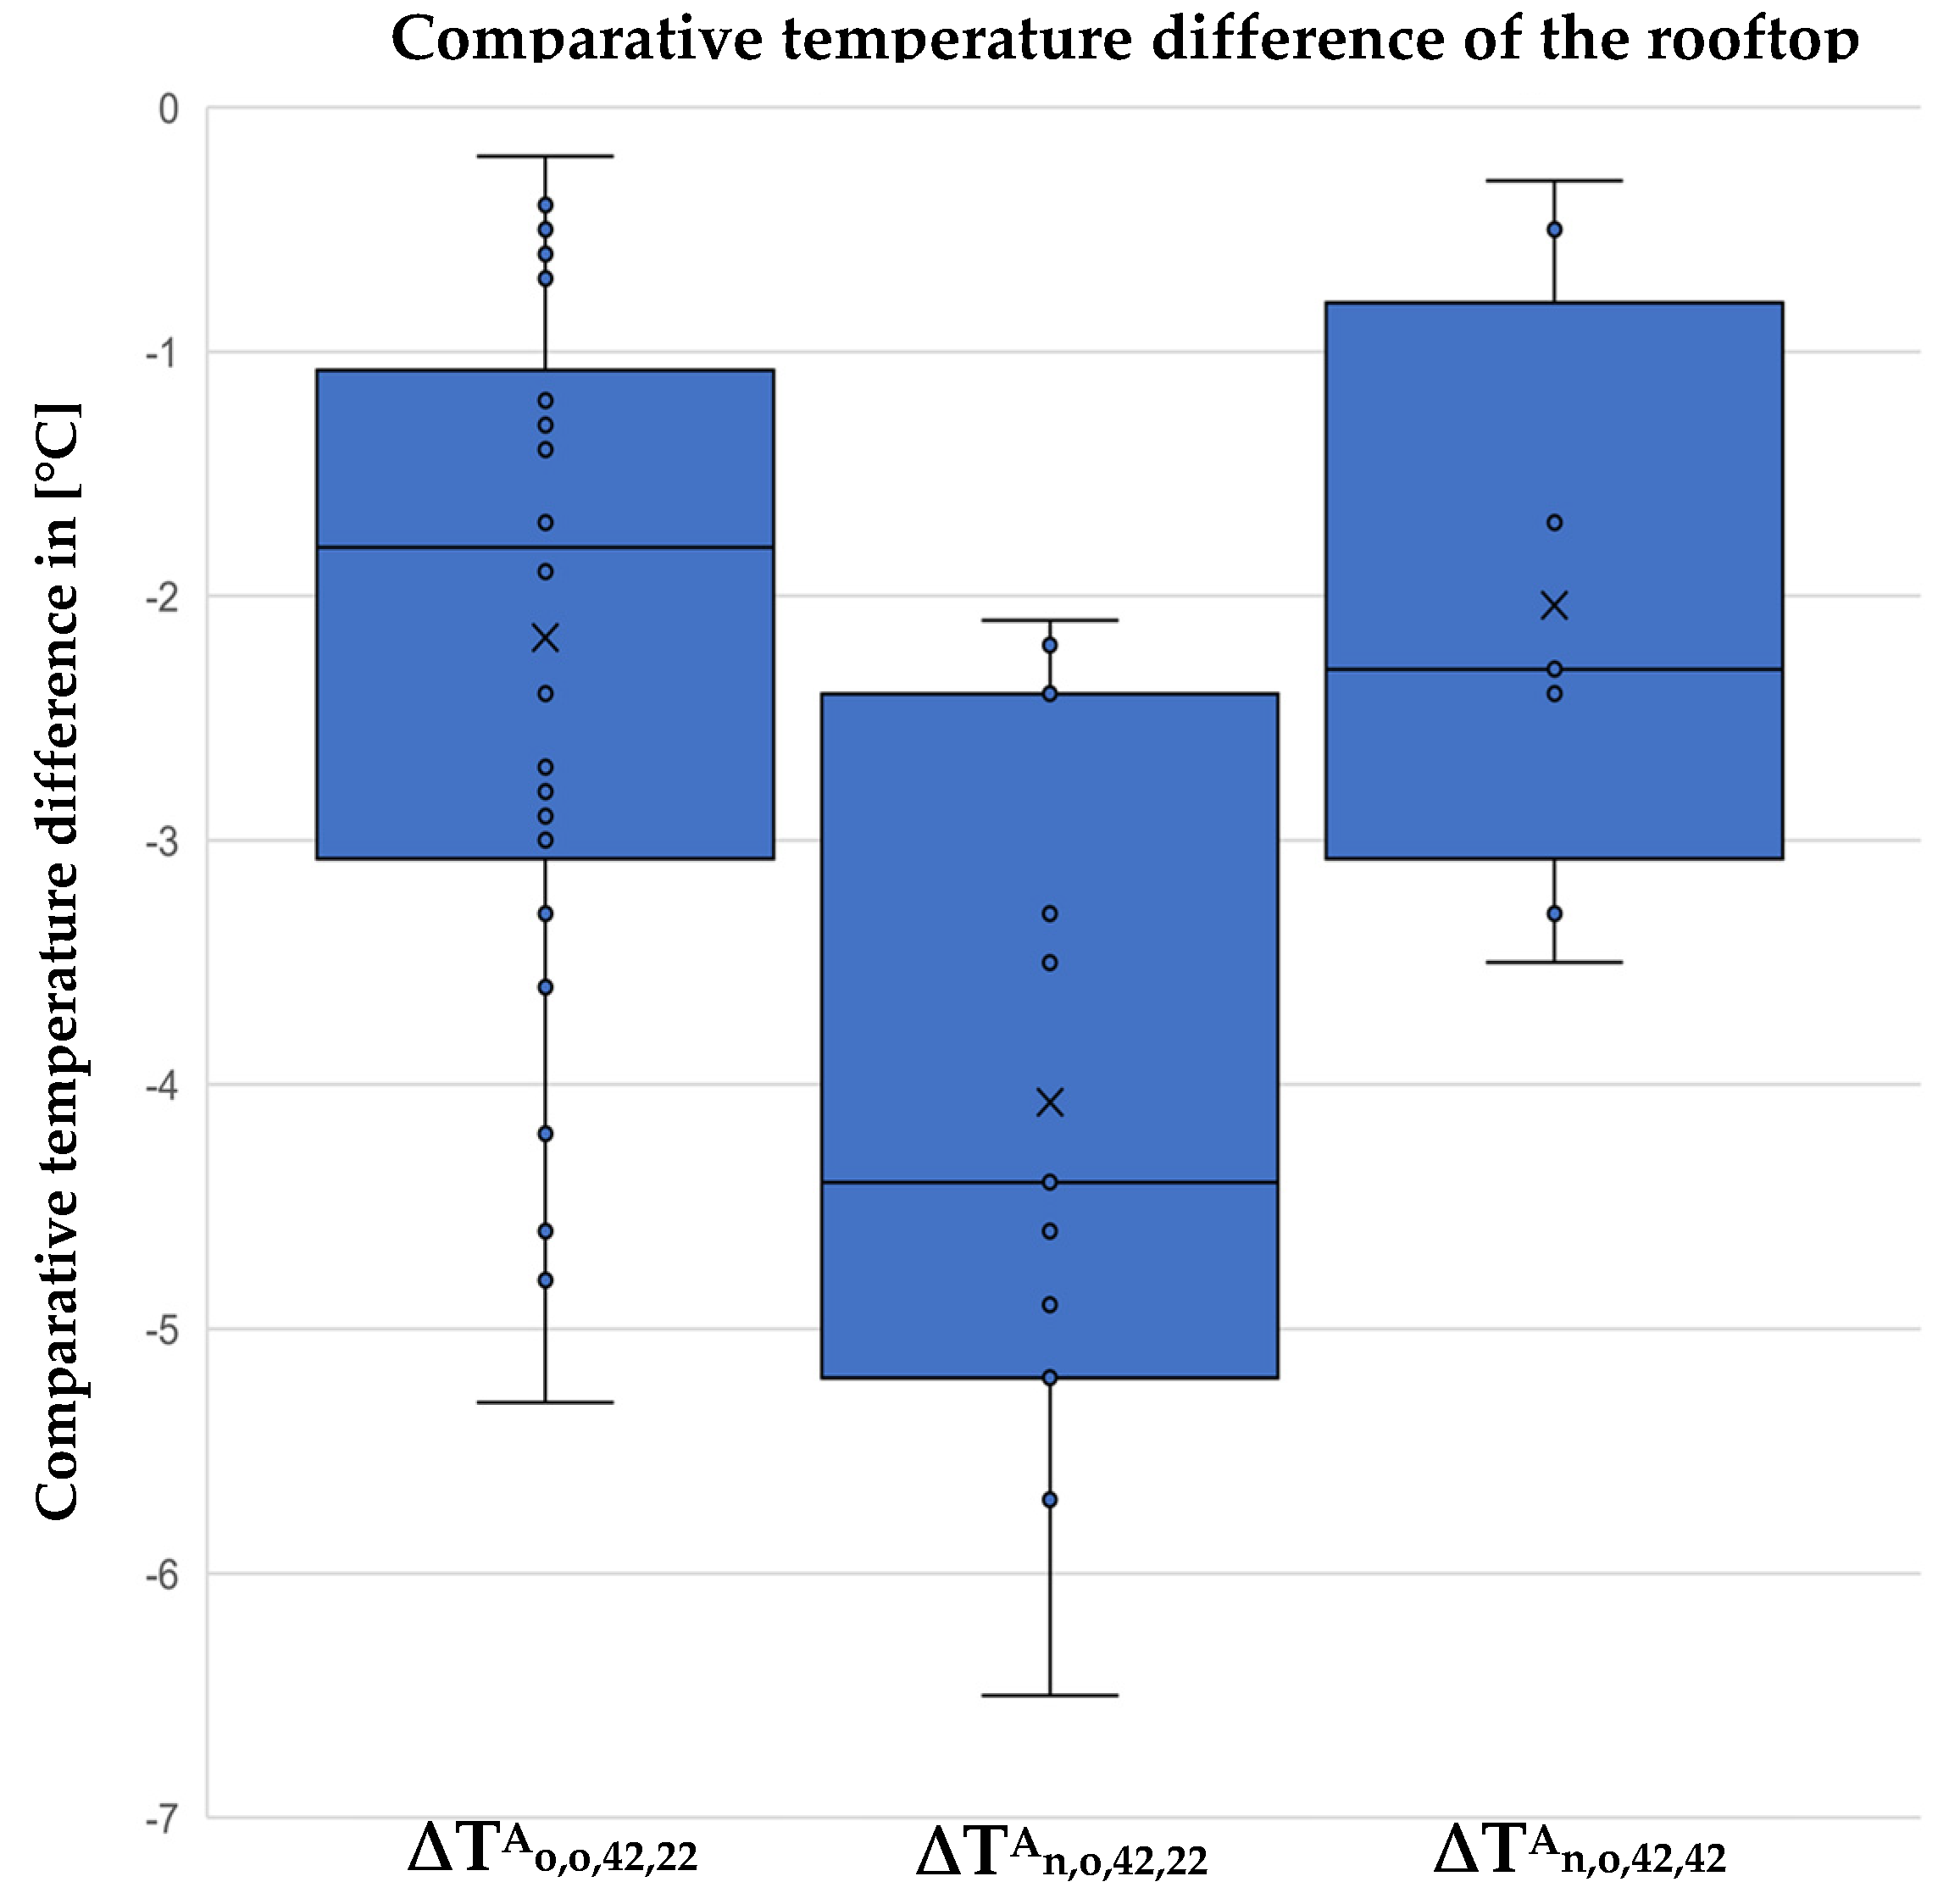
Comparative temperature difference: In addition to being influenced by camera-intrinsic parameters and atmospheric conditions, the measured temperature values can vary depending on the thermal camera’s distance and angle to the object under scrutiny [27]. The following box plots show a comparison of the acquisition methods (automatic and manual UAV-based and hand-held camera) at varying distances. While all plots in Figure 9 display both positive and negative temperature differences, the values are concentrated in the negative regions. This alludes to a general trend of decreasing distances leading to an increased recorded temperature.
The box for Δ T o , o , 42 , 22 A (comparison of automatic UAV-based oblique images recorded at different heights of 22 m and 42 m) shows on average negative temperature differences. The positive temperature differences of Δ T o , o , 42 , 22 A may be a result of either a steep camera angle to the façade or a slight vignetting present in the collected images.
The box plots for images from manual and automatic UAV flights at different distances show both positive and negative comparative temperature values. Positive values of up to +6 °C for Δ T o , t , 22 , 15 A are caused by window reflections as well as inexplicable distortions within manually UAV-based images. The negative values can be attributed to the variations in distance between camera and building.
The final box plots again depict both negative and positive values with the negative maximum reaching −7.8 °C. This maximum of Δ T o , t , 42 , 15 A is likely caused by the largest possible difference in camera distance (UAV-based recording being at 42 m compared to terrestrial at up to 15 m). The positive temperature difference values between the terrestrial and UAV-based images ( Δ T o , t , 22 , 15 A , Δ T o , t , 42 , 15 A ) are again caused by window reflections which reduce recorded window temperatures in thermal images.
Overall, it can be observed that larger differences in distance cause higher negative temperature deviations to occur. Additionally, the most conspicuous difference is found in the comparison of hand-held and UAV-based cameras. The more extreme ranges of both Δ T o , t A in comparison to the Δ T o , m A plots allude to the fact that distance itself might not be the only contributing factor—the different make and model of hand-held and UAV-based cameras as well as variations in angle and thus perspective of the ground-based acquisition method could be a cause for these observable variations.
Figure 9. Box plots for the comparative temperature differences of windows: Comparative temperature differences between areas of interest of UAV-based images and terrestrial images.
Remotesensing 15 00301 g009
Figure 10 illustrates a similar analysis of building rooftops, depicting the comparison of temperature differences in images acquired by oblique and nadir UAV-based methods. The calculated differences are found to be solely negative, which can again be explained by the camera’s disposition of recording lower temperatures at higher distances. Figure 11, for example, shows the same rooftop as having a different temperature when recorded at varying distances. Δ T o , o , 42 , 22 A exemplifies this fact as well, showing that a sole change in distance still causes a negative temperature difference. Another influencing factor can be determined when regarding the other box plots. Despite comparing the same distances, Δ T n , o , 42 , 22 A shows significantly lower temperature differences of up to −6.5 °C. Simultaneously, Δ T n , o , 42 , 42 A displays differences between 0.3 °C and −3.5 °C, despite this being a purely methodological, distance- and camera-independent comparison. The temperature deviations occurring in Δ T n , o , 42 , 42 A must result from the only parameter that is varied here: the camera angle. This can be explained by the fact that the angle in nadir perspective lies outside the optimal angle range for image acquisition as defined by Ortiz-Sanz et al. [39]. Our findings therefore confirm Ortiz-Sanz et al.’s [39]: Reflections such as the aforementioned lead to the falsification of temperature values recorded in thermal images. Additionally, the increased negative temperature differences of Δ T n , o , 42 , 22 A occur both due to the change in distance to building as well as angle of camera.
In summary, it can be said that the recorded temperature is influenced by distance. Precise quantitative statements about the influence of the recording settings on temperature distortions cannot be made on the basis of the small amount of analyzed data, even if a general trend has been identified. Smaller temperature deviations result from smaller changes in distance, such as in the comparison between 15 m and 22 m as opposed to 42 m. Window reflections are found to cause quantitative distortions within terrestrial thermographic recordings and manually flown UAV-based thermal images. It should be noted that the quantitative analysis of the rooftops using UAV-based images (at 22 m to 42 m flight height) seems more reliable than façade analyses at these distances, as the temperature deviations caused by camera distance are smaller in thermal rooftop anomalies than the inspected façade elements.
-
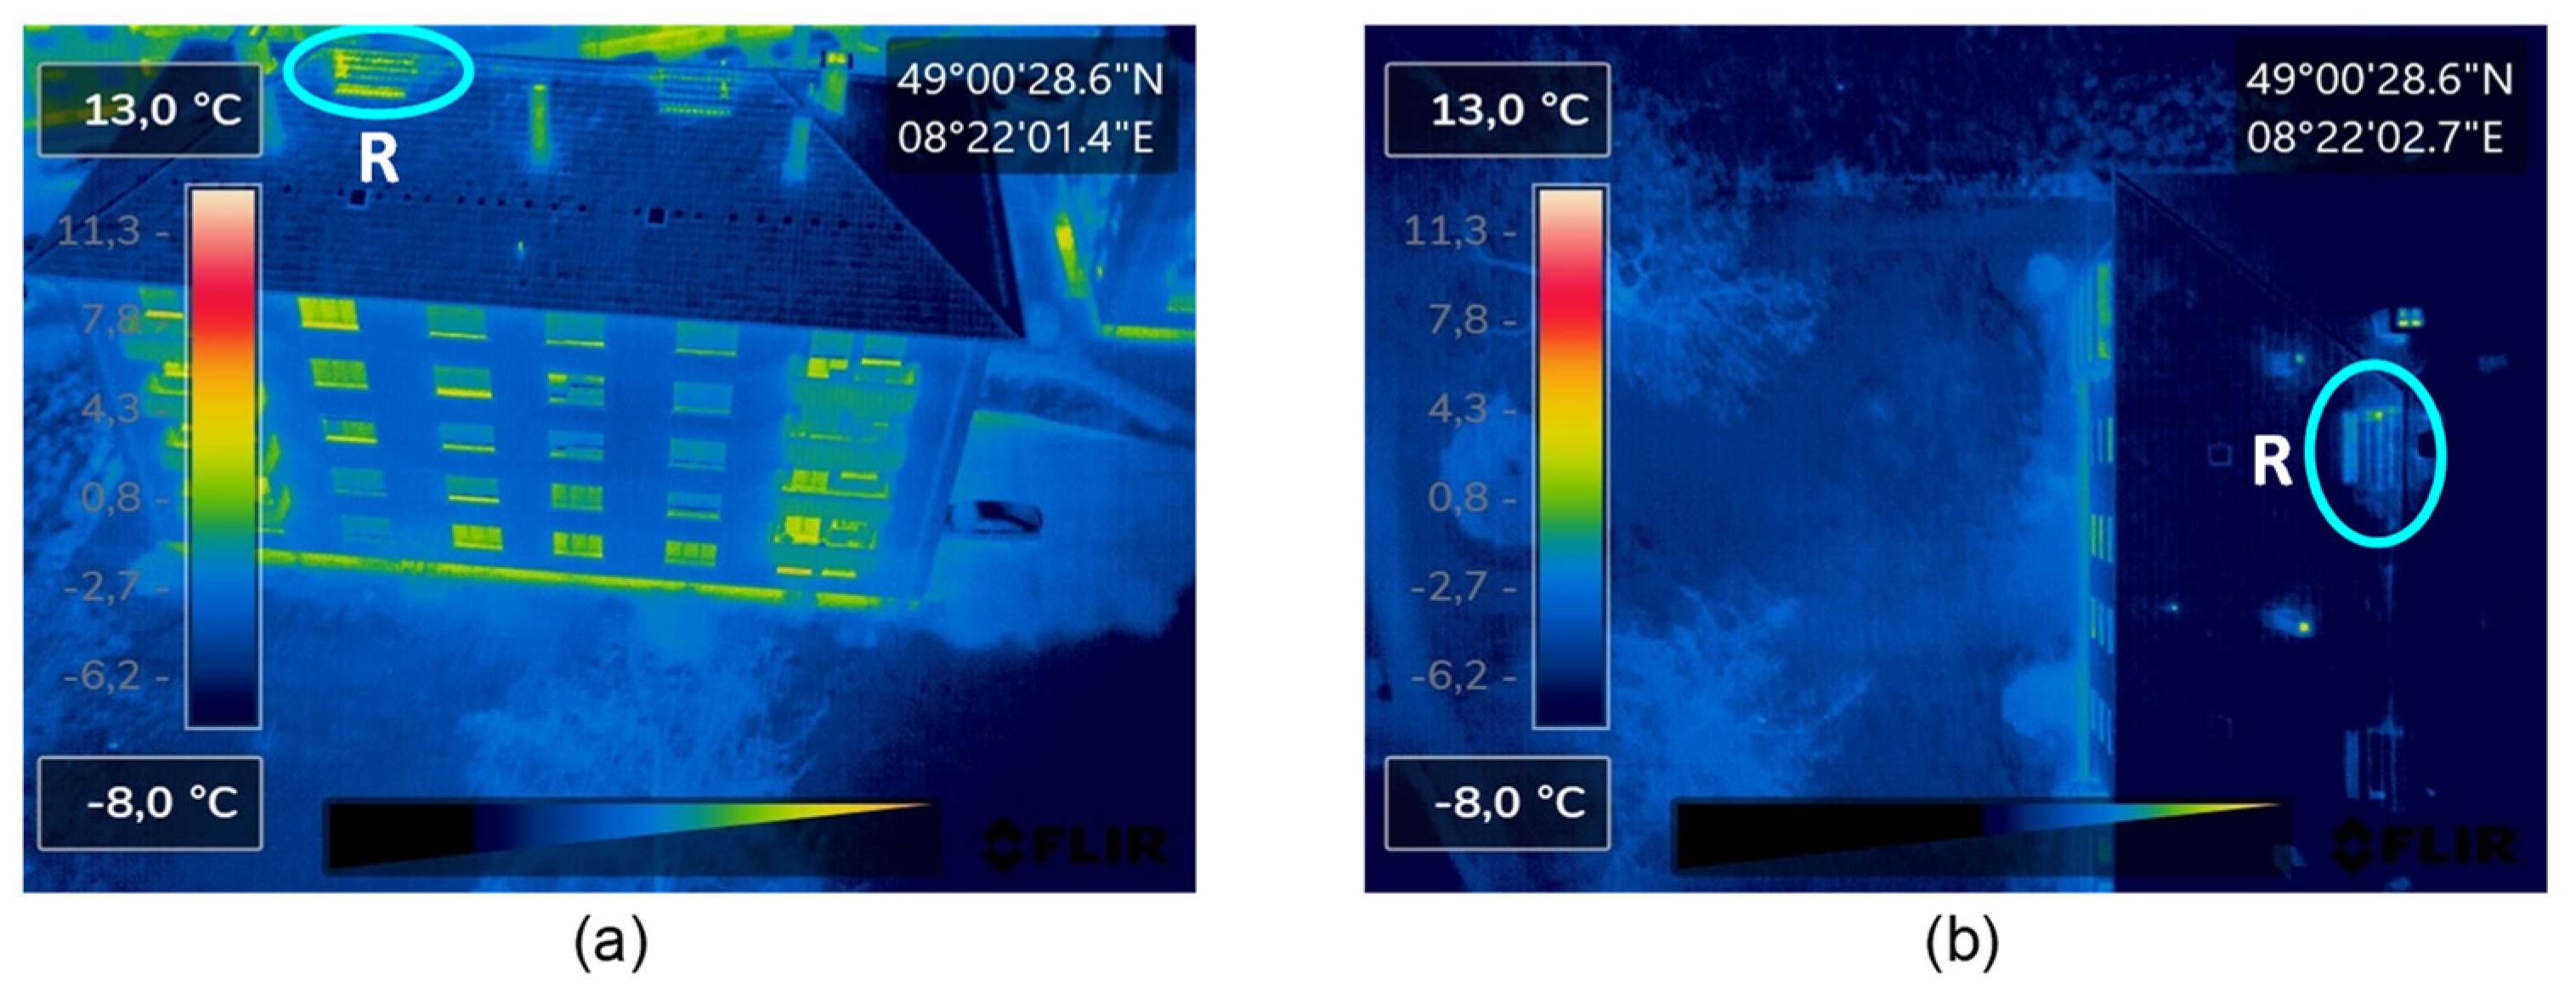
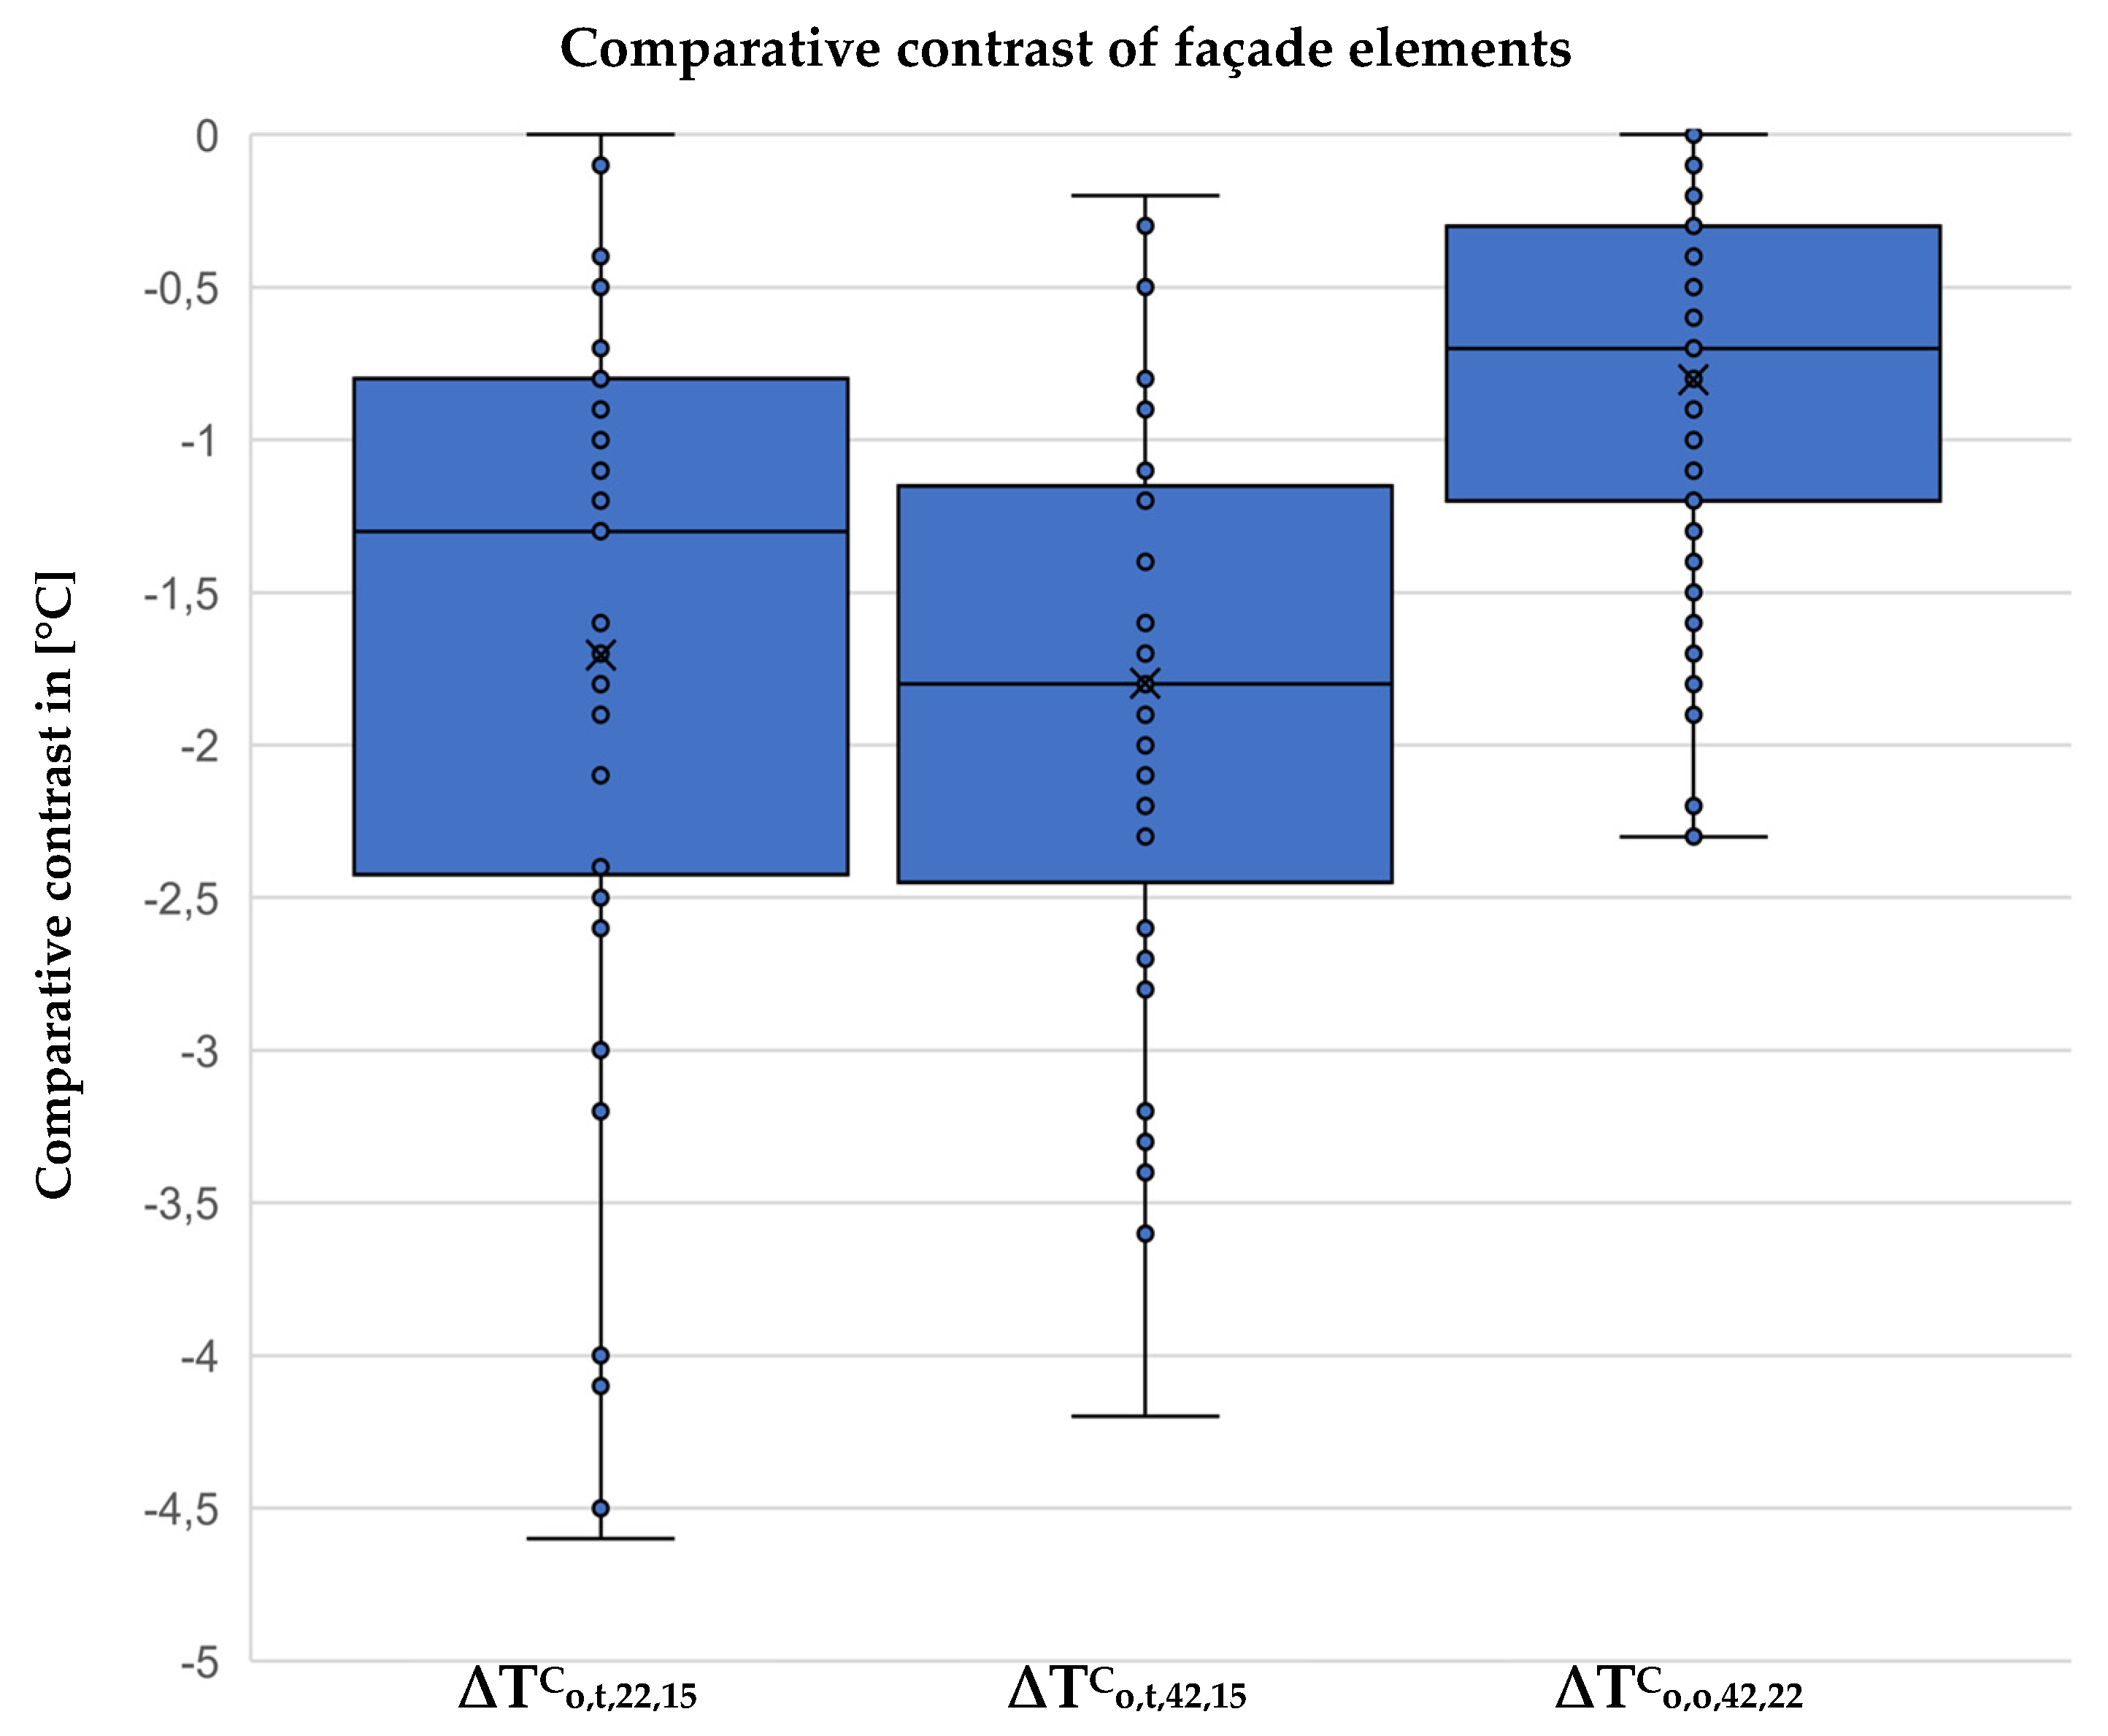
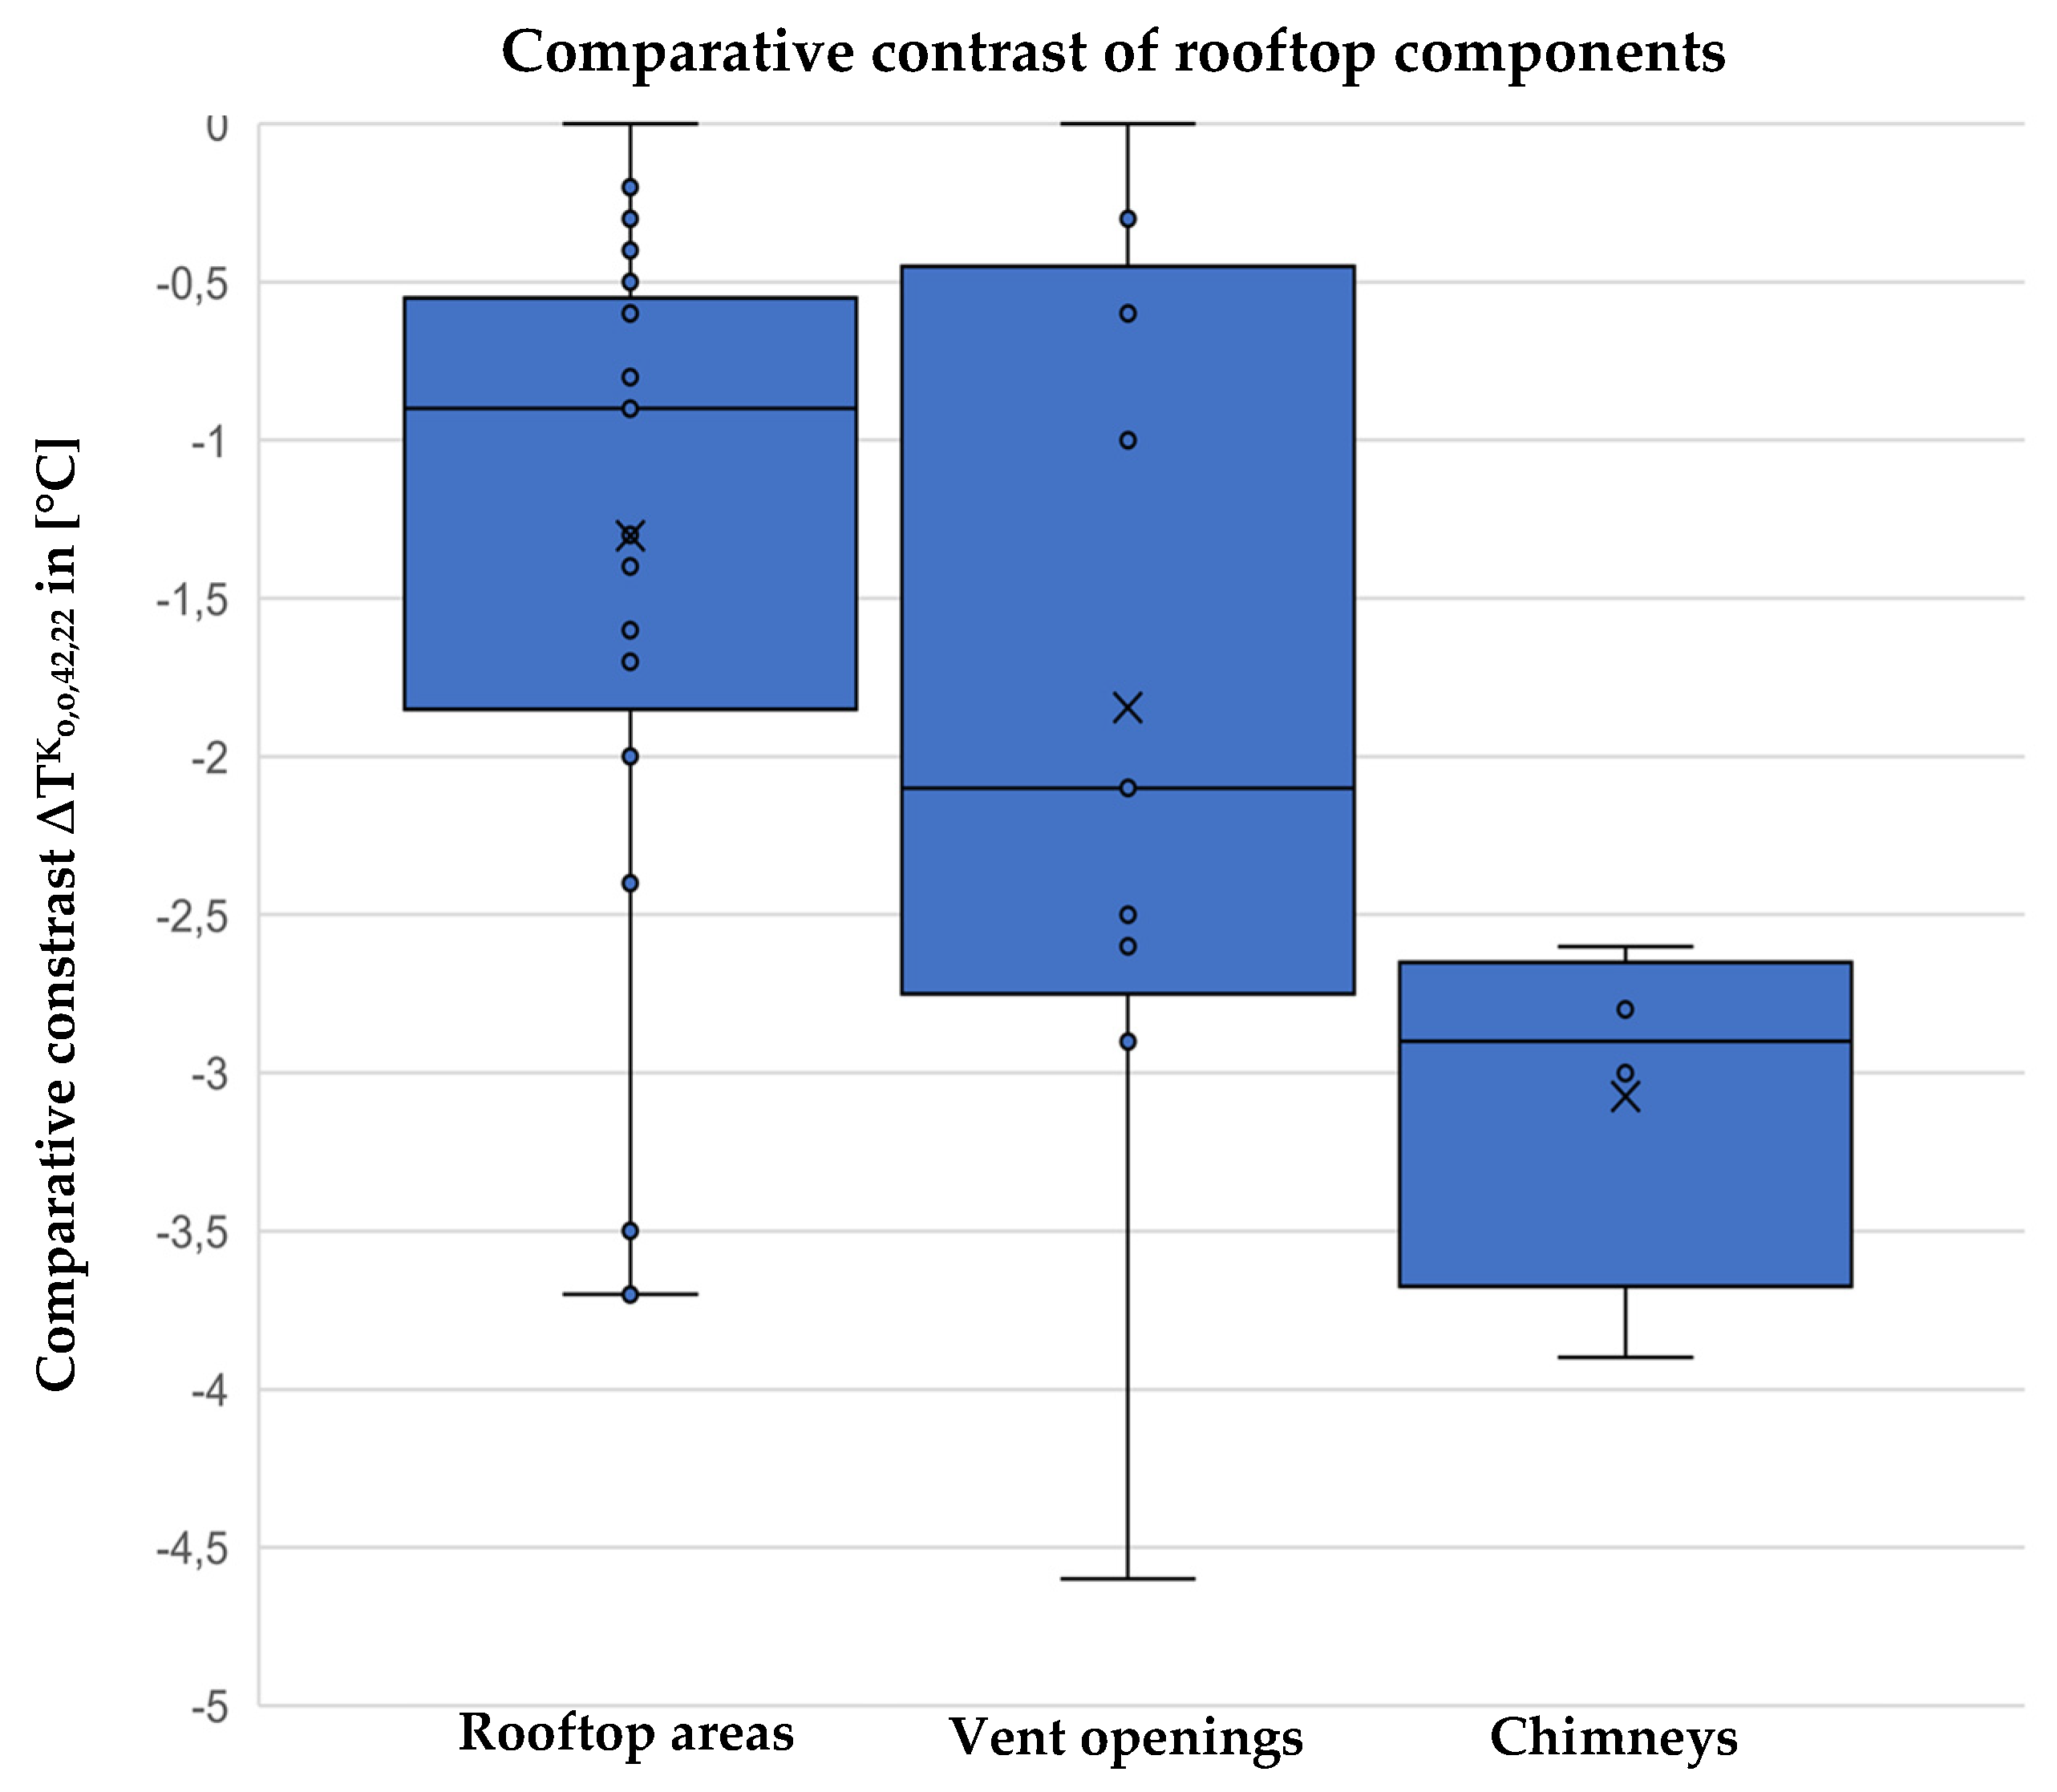
Comparative contrast: The main factors that influence the contrast of thermographic images are camera angle and distance to the building under scrutiny. The effect of the camera angle becomes noticeable when comparing rooftops captured in nadir and 45° angle flight, with thermal anomalies displaying less contrast in images acquired at 90°. The cause of this lies with the prevalent weather conditions: clear, cloudless nights lead to increased reflections on rooftops [42]. As a result, the emissivity decreases and the contrast diminishes along with it. Figure 12 illustrates the described effect as it was observed on the rooftop of the building in Volzstr. 2.
Windows can be similarly susceptible to angle-dependent reflections. These stem from surrounding buildings, trees and the sky itself, causing distortions in the calculated thermal contrast. However, such details are found to only be discernible in manually recorded UAV- or ground-based images—in other words at distances of 15 m and less to the building façade. In these modes of acquisition, more perceptible reflections are found to occur when recording images from below windows or on eye-level (at a 4 m distance), while no reflections are visible in images taken of a window from above. Figure 13 exemplifies the effects of window reflections depending on different camera angles.
While a change in distance between camera and target alters the perceived window reflections and therefore their effect as mentioned above, it also has a more general influence on thermal contrast. Measurable contrast is found to weaken with increasing distance. A comparison of automatic UAV-based images exemplifies this: The same windows, roof anomalies and other building elements are shown in greater contrast in images recorded at 22 m above the building than at a 42 m distance. In terrestrial images taken at distances of up to 15 m, this effect is even more pronounced, with thermal anomalies and bridges, balconies and windows displaying far greater contrast than at distances of both 22 m and 42 m.
Figure 14 and Figure 15 show box plots of the comparative quantitative contrasts of the aforementioned areas of interest. Figure 14 depicts only negative values and values equal to zero for all three comparisons ( Δ T o , t , 22 , 15 C , Δ T o , t , 42 , 15 C , and Δ T o , o , 42 , 22 K ), indicating lower contrasts with increased distance. This reemphasizes the pronounced effect that higher distances can have on recorded infrared radiation by thermal cameras as described by Fouad and Richter [27]. Values sink as low as −4.6 °C for façade elements ( Δ T o , t , 22 , 15 K in Figure 14) and rooftop vent openings ( Δ T o , o , 42 , 22 K in Figure 15). Figure 15 and Δ T o , o , 42 , 22 C additionally demonstrate how images taken with the same oblique angle suffer less from changes in contrast compared to those acquired with the camera pointing straight down. This supports previous observations of a nadir perspective, resulting in higher contrast deviations.
For the rooftop components in Figure 15, we find that differences of the quantitative contrast between the rooftop covering, vent openings and chimneys are caused by the fact that the roof vent openings and chimneys have much higher thermal losses associated with high temperatures and are therefore more sensitive to changing camera distance. The highest thermal losses are recorded in the chimneys. Accordingly, the greatest deviations in quantitative contrast are caused by changes in camera distance.
As with the comparative temperature difference, contrast is found to be vastly influenced by distance and angle, with greater distances causing decreases in contrast. For rooftops, the contrast is diminished by reflections from the sky occurring in nadir flight mode. Reflections in windows can also have a negative influence. It must again be noted that the aforementioned observations are merely visible trends, not absolute, quantitative statements on influence of the various recording settings, as these would be difficult to make based solely on the analysis of a single dataset.
A final point of contention in thermographic building auditing is the economic feasibility of the implemented method. This is, amongst others, defined by the amount of time involved in image acquisition as it requires a paid expert to do so. A detailed overview of all thermal image acquisitions performed for this case study is provided in Appendix A. Unsurprisingly, the automatically recorded UAV-based method took the least amount of time to record great quantities of images as the flight path was pre-programmed with comparatively high flight speeds. However, the strip flight pattern (which was required to ensure full building coverage) as well as the preparation time for UAV setup both considerably increase the method’s duration. Additionally, due to software inaccuracies, some UAV flights were found to take inexplicably longer despite shorter routes (Inaccuracies of the implemented DJI Go 4 App caused recordings at 42 m above ground to take just as long or longer than acquisitions at 22 m, despite shorter distances.). These drawbacks, as well as the necessity for a “stop-and-go” recording process, made the manually UAV-based acquisition mode less time-efficient than even terrestrial acquisition.

4. Conclusions

4.1. Comparison of Acquisition Methods and General Recommendations

Using thermographic UAV-based images for building auditing creates new possibilities for the fast, large-scale energetic assessment of residential districts. The presented study evaluated a dataset of 968 UAV- and ground-based thermal images to identify influences of various methodological implementations on the quality of such images. These included 112 areas of interest with increased temperatures, which were analyzed and evaluated according to five defined quality criteria as well as an additional measure of time efficiency. We evaluated the effects of flight speed, camera distance and angle on the quality of UAV-based thermal images compared to those acquired through classical hand-held camera recordings.
Our case study allows for conclusions to be made regarding the previously mentioned parameters: While flight speeds of up to 5 m/s did not cause any qualitative changes to the thermal images, increasing distances between camera and target objects and changing angles are seen to have a significant negative impact, in particular on UAV-based acquisition methods. These parameter-specific insights influence the outcome of the quality criteria in their assessment of images from each acquisition method.
Previous sections discussed both the three image recording methods implemented in this case study as well as their quality-based evaluation according to the five chosen criteria. This set of tools and the assessment contingent upon them enables a methodological comparison. Table 4 shows such an overview for the three previously discussed methods.
A conclusion can be drawn from the presented overview for the choice of best thermal image acquisition method with regards to building auditing. First and foremost, the above comparison emphasizes how versatile UAV-based acquisition methods are owing to the third degree of freedom they allow. While both the manual and automatic form of implementation have drawbacks with regards to some criteria, combined they fulfill all requirements for a successful and economical thermography-based building assessment. Manual UAV flights can cover entire building envelopes at close and constant distances without influences in angle, thus guaranteeing images of high quality and contrast. The time-consuming nature of the method limits its economical use to the assessment of individual buildings. When inspecting entire districts, it is therefore prudent to choose the fastest method of acquisition (automatic UAV flights) which, while incapable of offering similarly detailed images, provides enough information to narrow down areas of interest that may require further scrutiny via manual UAV flights. Ground-based thermography via hand-held camera is unable to match the aforementioned owing to the missing degree of freedom that prohibits access to building envelopes of a certain size, such as the ones given in this case study. Its use can therefore not be recommended, unless it is for the inspection of known areas of interest close to the ground.

4.2. Favorable Settings for UAV-Based Acquisition and Specific Recommendations

Automatic UAV-based thermal imaging was found to be most time efficient owing to preprogrammed flight paths and dynamic acquisition although the impact of increased distances and UAV preparation are not to be disregarded. When comparing UAV-based images at flight speeds between 1 and 5 m/s, neither motion blur nor image distortion is found to have occurred. In contrast to observations by Entrop and Vasenev [12] and Zahradník [19], we can therefore conclude that flight speeds of more than 1.5 m/s or 2 m/s are possible with the equipment used in this study. Flight speeds of more than 5 m/s require further investigation and should be examined in future studies, owing to their potential to further increase time efficiency.
Different flight heights and angles lead to deviations in temperature, contrast and the amount of discernible features owing to reflections of infrared radiation or reduced emissivity. Specifically, increased distances between camera and target as well as camera angles of more than 45° are found to negatively influence thermal image quality in the aforementioned aspects. This confirms findings by Fouad and Richter [27] and Ortiz-Sanz et al. [39], respectively.
Evaluating the effects of various camera angles (oblique and nadir) and flight heights (60 m and 48 m) on thermal images acquired in automatic UAV flight leads to the following conclusions: The nadir perspective, while granting detailed views of building rooftops, fails to be of use in the thermal analysis of façades and is associated with increased temperature distortions. Additionally, radiation reflection on rooftops leads to a reduced contrast in nadir images, thus making it more difficult to record thermally conspicuous areas of interest within them. In contrast, recording at a 45° camera angle to the ground enables the analysis of both rooftops and façades. Nadir flights produce thermal images of lower quality, thus deeming the 45° camera angle is more preferable for thermography-based auditing via automatic UAV flight. A camera height of 42 m above the target building allows larger areas to be covered more quickly, but the resulting images suffer from more temperature-related distortions and reduced contrast of both rooftop and façade compared to those acquired at closer distances (such as 22 m). With increasing distance, less thermal anomalies become discernible on the building’s envelope.
Based on these observations, we recommend a 45° camera angle and a 22 m distance for the qualitative analysis of buildings using UAVs. However, performing quantitative thermographic studies with the aforementioned settings remains inadvisable due to the distinct temperature and contrast distortions perceptible for instance in window panes. We can therefore only recommend the use of UAV-based thermography for quantitative purposes (such as obtaining U-values) when flying at close range or piloting the drone manually. Table 5 summarizes our suggestions based on the findings of our study with regards to UAV-based thermal image acquisition.

4.3. Critical Review

To conclude, we want to critically reflect on our work. The evaluation of the dataset is influenced by various factors. Overall, the study is limited to data recorded with nine different flight settings on two recording days. For a more comprehensive database, a larger dataset with images from different times of the day and weather conditions could be beneficial. Also, the number of areas of interest considered in the study could be increased. Future studies should additionally examine more flight settings, such as higher flight speeds (>5 m/s), smaller distances (e.g., 20 m) and different camera angles (e.g., 30°). However, it should be noted that some UAV models, like the one implemented in this study, do not allow automatic aerial surveys with the camera angled at less than 40° to the ground. Performing similar studies with other UAVs might therefore be beneficial. Limitations to the flight path caused by the presence of obstacles in a building’s vicinity might also be circumvented by using a drone capable of detecting and avoiding such obstructions. In order to increase the number of usable thermographic images, the UAV’s path should be aligned to each building’s position instead of choosing a heading angle at random to merely cover the area. Furthermore, using different features of FLIR’s Thermal Studio software would allow a more balanced assessment of various image aspects. The choice of color distribution along with palette range, for instance, affects the brightness of the thermographic images. In this case, the distribution function “signal linear” was selected to preserve contrast and reduce background effects. However, a simultaneously elicited darkening of the images makes the detection of thermal anomalies more difficult. Implementing other functions that induce contrasting effects, such as “histogram equalization”, could further augment the analysis.
Several assumptions of technical and experimental nature need to be addressed as well. First, the use of two different thermal cameras (hand-held and UAV-based) cannot be neglected as a potential source for differences in temperature. However, an exemplary comparison of images recorded with both camera models showed no perceptible distortions to exist—apart from a generally lower resolution apparent in the ground-based images. Other influencing factors depend on the form of image acquisition, such as a slight vignetting indicated by the images’ darkened corners and edges of the images collected by drone. Vignetting is caused by variations in temperature between camera components [43]. This makes the effect a common occurrence in UAV-based acquisition because a drone’s propellers induce a lens-cooling slipstream that clashes with the heat internally generated by electronics and gimbal motor [43]. Another observable distortion is a slight drift in temperature caused by a temperature drop during the acquisition time frame. However, the effects from this were found to be negligible for the analysis and aforementioned comparisons. As we opted for a more qualitative-based assessment, the precise distances and angles between camera and building envelope surfaces were not calculated for the case study images. Future studies may therefore elevate the analysis by using photogrammetry to determine such values. This includes pinpointing the exact camera position with relation to the object under scrutiny to identify the precise influence of distance and angle on thermal image quality.
Overall, this work contributes to the joint fields of remote thermography and building auditing by providing a set of tools with which thermal image quality can be assessed. Additionally, specific recommendations are made for various acquisition modes and settings for individual building and district auditing. In the future, we anticipate an increase in quantitative studies to further substantiate current observations regarding the effects of camera distance, angle and speed.

Author Contributions

Conceptualization, Z.M. and A.E.; methodology, Z.M., A.E. and E.V.; formal analysis, Z.M. and A.E.; investigation, Z.M. and A.E.; resources, Z.M., A.E. and E.V.; data curation, A.E.; writing—original draft preparation, Z.M., E.V. and A.E.; writing—review and editing, R.V. and F.S.; visualization, Z.M. and A.E.; supervision, R.V. and F.S. All authors have read and agreed to the published version of the manuscript.

Funding

We acknowledge support by the KIT-Publication Fund of the Karlsruhe Institute of Technology.

Data Availability Statement

All data was obtained in own experiments. All data used for the study can be requested from the authors and is published online at Zenodo.org (accessed on 1 January 2020) [34].

Acknowledgments

The authors appreciate the support of Marinus Vogl (Air Bavarian GmbH) in acquiring the thermal images via UAV. Moreover, they thank Harald Schneider (Karlsruhe Institute of Technology) for his advice and assistance. Lastly, they gratefully acknowledge the consent and support of Karlsruher Volkswohnung GmbH within this research project.

Conflicts of Interest

The authors declare no conflict of interest.

Appendix A

Table A1. Overview of thermal image recording parameters.
FlightBuildingRecording Angle
[°]
Height above Building
[m]
Distance to Façade
[m]
Flight Speed
[m/s]
Side and Front Overlap
[%]
Flight/Recording Time
[min]
Recorded Area
[m2]
Number of Images 1
[-]
Image Rate [Images/min]Flight Route Length
[m]
1Sophienstr. 201–2034522-11043250013032730
2Sophienstr. 201–2034522-3102025001306.62730
3Sophienstr. 201–2034522-510132500130102730
4Sophienstr. 201–2034542-31025 225001044.22730 3
5Sophienstr. 201–20390 422-310-2500---
6Sophienstr. 201–2039042-310-2500---
1Volzstr. 24522-1102920001053.62275
2Volzstr. 24522-3101320001058.12275
3Volzstr. 24522-51072000105152275
4Volzstr. 24542-310212000904.32275
5Volzstr. 29022-310-2000--
6Volzstr. 29042-310-2000--
1Wichernstr. 44522-1103417001203.52045
2Wichernstr. 44522-31015170012082045
3Wichernstr. 44522-51011170012010.92045
4Wichernstr. 44542-310181700985.42650
5Wichernstr. 49022-310-1700---
6Wichernstr. 49042-310-1700---
1Wichernstr. 10–184522-1104036001453.63870
2Wichernstr. 10–184522-3101936001457.63870
3Wichernstr. 10–184522-51012360014512.13870
4Wichernstr. 10–184542-3102236001175.33870
5Wichernstr. 10–189022-310-3600---
6Wichernstr. 10–189042-310-3600---
7 5Wichernstr. 40-4--15180231.5- 6
8Wichernstr. 40-8--30520481.6-
9Wichernstr. 40-15--14520 7221.6-
9Wichernstr. 10–180-15--29900461.6-
1 This refers to all recordings, including those that do not show any areas of interest or are unsuitable for the analysis and were thus sorted out. 2 As a result of inaccuracies in the DJI Go 4 UAV software for areas smaller than 20,000 m2 (2 ha), the duration of a flight at 42 m is longer than at 22 m. This stands in contrast to the fact that a greater distance should allow for the comparatively smaller object to be captured in less time. 3 As a result of inaccuracies in the DJI Go 4 UAV software for small areas, the distance that needs to covered for a flight at 42 m height is just as long as for 22 m, even though a greater distance between camera and target should allow for the comparatively smaller object to be captured by means of a shorter flight path. 4 The recordings in nadir (90° camera angle) were carried out simultaneously with the recordings at a 45° camera angle and 3 m/s flight speed. Therefore, there is no separate information on flight times. 5 Flights 7 to 10 refer to manual UAV-based thermal image acquisition. All other flights were carried out automatically via UAV. 6 Precise route information is not available because the recordings were completed by hand and cover only parts of the building envelope. 7 The area of the façade was determined for this flight. For flights 1 to 6, on the other hand, the area corresponds to the built-up area of the building. In this context, the built-up area is the area covered by the building [44].

References

  1. Gade, R.; Moeslund, T.B. Thermal cameras and applications: A survey. Mach. Vis. Appl. 2014, 25, 245–262. [Google Scholar] [CrossRef] [Green Version]
  2. Osornio-Rios, R.A.; Antonino-Daviu, J.A.; de Jesus Romero-Troncoso, R. Recent Industrial Applications of Infrared Thermography: A Review. IEEE Trans. Ind. Inform. 2018, 15, 615–625. [Google Scholar] [CrossRef]
  3. Sarawade, A.A.; Charniya, N.N. Infrared Thermography and its Applications: A Review. In Proceedings of the 2018 3rd International Conference on Communication and Electronics Systems (ICCES), Coimbatore, India, 15–16 October 2018; pp. 280–285. [Google Scholar] [CrossRef]
  4. Kirimtat, A.; Krejcar, O. A review of infrared thermography for the investigation of building envelopes: Advances and prospects. Energy Build. 2018, 176, 390–406. [Google Scholar] [CrossRef]
  5. Martin, M.; Chong, A.; Biljecki, F.; Miller, C. Infrared thermography in the built environment: A multi-scale review. Renew. Sustain. Energy Rev. 2022, 165, 112540. [Google Scholar] [CrossRef]
  6. Bitelli, G.; Conte, P.; Csoknyai, T.; Franci, F.; Girelli, V.A.; Mandanici, E. Aerial Thermography for Energetic Modelling of Cities. Remote Sens. 2015, 7, 2152–2170. [Google Scholar] [CrossRef] [Green Version]
  7. Previtali, M.; Barazzetti, L.; Brumana, R.; Roncoroni, F. Thermographic analysis from UAV platforms for energy efficiency retrofit applications. J. Mob. Multimed. 2013, 9, 66–82. [Google Scholar] [CrossRef] [Green Version]
  8. Yin, C.; Xiong, Z.; Chen, H.; Wang, J.; Cooper, D.; David, B. A literature survey on smart cities. Sci. China Inf. Sci. 2015, 58, 1–18. [Google Scholar] [CrossRef]
  9. Alsamhi, S.H.; Almalki, F.A.; Ma, O.; Ansari, M.S.; Lee, B. Predictive Estimation of Optimal Signal Strength From Drones Over IoT Frameworks in Smart Cities. IEEE Trans. Mob. Comput. 2021, 22, 402–416. [Google Scholar] [CrossRef]
  10. Sharma, R.; Arya, R. UAV based long range environment monitoring system with Industry 5.0 perspectives for smart city infrastructure. Comput. Ind. Eng. 2022, 168, 108066. [Google Scholar] [CrossRef]
  11. Krawczyk, J.; Mazur, A.; Sasin, T.; Stokłosa, A. Infrared building inspection with unmanned aerial vehicles. Trans. Inst. Aviat. 2015, 240, 32–48. [Google Scholar] [CrossRef]
  12. Entrop, A.G.; Vasenev, A. Infrared drones in the construction industry: Designing a protocol for building thermography procedures. Energy Procedia 2017, 132, 63–68. [Google Scholar] [CrossRef]
  13. Rakha, T.; Gorodetsky, A. Review of Unmanned Aerial System (UAS) applications in the built environment: Towards automated building inspection procedures using drones. Autom. Constr. 2018, 93, 252–264. [Google Scholar] [CrossRef]
  14. Daffara, C.; Muradore, R.; Piccinelli, N.; Gaburro, N.; De Rubeis, T.; Ambrosini, D. A Cost-Effective System for Aerial 3D Thermography of Buildings. J. Imaging 2020, 6, 76. [Google Scholar] [CrossRef]
  15. Dahaghin, M.; Samadzadegan, F.; Javan, F.D. Precise 3D extraction of building roofs by fusion of UAV-based thermal and visible images. Int. J. Remote Sens. 2021, 42, 7002–7030. [Google Scholar] [CrossRef]
  16. Hou, Y.; Chen, M.; Volk, R.; Soibelman, L. Investigation on performance of RGB point cloud and thermal information data fusion for 3D building thermal map modeling using aerial images under different experimental conditions. J. Build. Eng. 2022, 45, 103380. [Google Scholar] [CrossRef]
  17. Benz, A.; Taraben, J.; Debus, P.; Habte, B.; Oppermann, L.; Hallermann, N.; Voelker, C.; Rodehorst, V.; Morgenthal, G. Framework for a UAS-based assessment of energy performance of buildings. Energy Build. 2021, 250, 111266. [Google Scholar] [CrossRef]
  18. Mayer, Z.; Heuer, J.; Volk, R.; Schultmann, F. Aerial Thermographic Image-Based Assessment of Thermal Bridges Using Representative Classifications and Calculations. Energies 2021, 14, 7360. [Google Scholar] [CrossRef]
  19. Zahradník, D. Roof Leak Detection by Thermography of As-Built Bim. Int. Arch. Photogramm. Remote Sens. Spat. Inf. Sci. 2022, 46, 251–256. [Google Scholar] [CrossRef]
  20. Mirzabeigi, S.; Razkenari, M. Automated Vision-Based Building Inspection Using Drone Thermography. In Proceedings of the Construction Research Congress, Arlington, VA, USA, 9–12 March 2022; pp. 737–746. [Google Scholar] [CrossRef]
  21. Gómez, J.; Tascón, A. Protocolo para el uso de vehículos aéreos no tripulados en la inspección de edificios agroindustriales. Inf. Constr. 2021, 73, e421. [Google Scholar] [CrossRef]
  22. Mayer, Z.; Epperlein, A.; Volk, R.; Vollmer, E.; Schultmann, F. Comparison of building thermography approaches using terrestrial and aerial thermographic images. IOP Conf. Ser. Earth Environ. Sci. 2022, 1078, 012026. [Google Scholar] [CrossRef]
  23. Google Earth. Karlsruhe. 2022. Available online: https://earth.google.com/web/@49.0073106,8.36729178,115.40952834a,389.61303477d,35y,16.33359823h,59.7531201t,-0r (accessed on 12 August 2022).
  24. DJI. Matrice 300—DJI. 2022. Available online: https://www.dji.com/de/matrice300 (accessed on 10 January 2022).
  25. FLIR. FLIR XT2 Product Information (Wilsonville, USA). 2021. Available online: https://www.flir.de/products/xt2/ (accessed on 10 January 2022).
  26. FLIR. FLIR T-Series (Wilsonville, USA). 2021. Available online: https://www.flir.com/instruments/t-series/ (accessed on 10 January 2022).
  27. Fouad, N.A.; Richter, T. Leitfaden Thermografie im Bauwesen: Theorie, Anwendungsgebiete, Praktische Umsetzung; Fraunhofer IRB Verlag: Stuttgart, Germany, 2012; ISBN 3816784569. [Google Scholar]
  28. Timeanddate. Wetter im Februar 2022 in Karlsruhe, Baden-Württemberg, Deutschland. 2022. Available online: https://www.timeanddate.de/wetter/deutschland/karlsruhe/rueckblick?month=2&year=2022 (accessed on 12 March 2022).
  29. Lucchi, E. Applications of the infrared thermography in the energy audit of buildings: A review. Renew. Sustain. Energy Rev. 2018, 82, 3077–3090. [Google Scholar] [CrossRef]
  30. DIN 4108-2; Wärmeschutz und Energie-Einsparung in Gebäuden—Teil 2: Mindestanforderungen an den Wärmeschutz (May Be Translated as: Thermal Protection and Energy Economy in Buildings—Part 2: Minimum Requirements to Thermal Insulation). Deutsches Institut für Normung: Berlin, Germany, 2013.
  31. FLIR Systems Inc. User’s Manual Flir Thermal Studio. 2022. Available online: https://www.sahkonumerot.fi/6708162/doc/operatinginstructions/ (accessed on 12 August 2022).
  32. Fouad, N. Bauphysik-Kalender; (May Be Translated as: Building Physics Calendar); Ernst. Wilhelm & Sohn (Verlag): Berlin, Germany, 2010; ISBN 978-3-433-02938-1. [Google Scholar]
  33. FLIR Systems Inc. What Happens When I Select Histogram Equalization as the Image Representation in FLIR Tools? 2022. Available online: https://www.flir.com/support-center/Instruments/what-happens-when-i-select-histogram-equalization-as-the-image-presentation-in-flir-tools/ (accessed on 10 October 2022).
  34. Mayer, Z.; Epperlein, A.; Vollmer, E.; Volk, R. Aerial and Terrestrial Thermal Images of German Multi-Family Buildings Version 1.0; Zenodo: Geneva, Switzerland, 2022. [Google Scholar] [CrossRef]
  35. Sieberth, T.; Wackrow, R.; Chandler, J.H. Motion blur disturbs—The influence of motion-blurred images in photogrammetry. Photogramm. Rec. 2014, 29, 434–453. [Google Scholar] [CrossRef]
  36. O’Connor, J.; Smith, M.J.; James, M.R. Cameras and settings for aerial surveys in the geosciences. Prog. Phys. Geogr. Earth Environ. 2017, 41, 325–344. [Google Scholar] [CrossRef] [Green Version]
  37. Liang, S.; Li, X.; Wang, J. Advanced Remote Sensing: Terrestrial Information Extraction and Applications; Elsevier Science & Technology: San Diego, CA, USA, 2012; ISBN 9780123859556. [Google Scholar]
  38. Government of Canada. Spatial Resolution, Pixel Size, and Scale. 2015. Available online: https://www.nrcan.gc.ca/maps-tools-and-publications/satellite-imagery-and-air-photos/tutorial-fundamentals-remote-sensing/satellites-and-sensors/spatial-resolution-pixel-size-and-scale/9407 (accessed on 30 September 2022).
  39. Ortiz-Sanz, J.; Gil-Docampo, M.; Arza-García, M.; Cañas-Guerrero, I. IR Thermography from UAVs to Monitor Thermal Anomalies in the Envelopes of Traditional Wine Cellars: Field Test. Remote Sens. 2019, 11, 1424. [Google Scholar] [CrossRef]
  40. Böhringer, J.; Bühler, P.; Schlaich, P.; Sinner, D. Kompendium der Mediengestaltung: Konzeption und Gestaltung. I; Springer Vieweg: Berlin/Heidelberg, Germany, 2014. [Google Scholar] [CrossRef]
  41. Filippeschi, S.; Leccese, F. Infrared thermography to visualize the texture of historical buildings in Tuscany. In Proceedings of the 8th International Conference on Non-Destructive Investigations and Microanalysis for the Diagnostics and Conservation of the Cultural and Environmental Heritage, Lecce, Italy, 15–19 May 2005; Available online: https://www.academia.edu/29499780/Infrared_Thermography_to_Visualize_the_Texture_of_Historical_Buildings_in_Tuscany (accessed on 1 January 2023).
  42. Vollmer, M.; Möllmann, K. Infrared Thermal Imaging Fundamentals, Research and Applications; Wiley-VCH. ePDF: Weinheim, Germany, 2017; ISBN 978-3-527-69332-0. [Google Scholar]
  43. Teledyne FLIR. Halo or Vignetting Image on a Vue, Vue Pro, Vue Pro R, Duo, Duo Pro, Duo Pro R, XT or XT2. 2022. Available online: https://flir.custhelp.com/app/answers/detail/a_id/3494/related/1/session/L2F2LzEvdGltZS8xNjY1NjU3Njc0L2dlbi8xNjY1NjU3Njc0L3NpZC9mVW12VnJQZ2lRM0xfZ1NXT3FUYldVaUxLYnExUE16dzBfZERHbjB3TEJaY1lnbE9VTkV2bUFzRSU3RXRUb0RSWTNFaXpTbk9hTk5ZaUU3a1FYd0dzendFbHVYdzI1TWFCdkRtWkUxN2hXU1RnelFHRE1FTkh0OVVxdyUyMSUyMQ%3D%3D (accessed on 30 September 2022).
  44. DIN 277:2021-08: DIN 277; Grundflächen und Rauminhalte im Hochbau. (May Be Translated as: Floor Areas and Volumes in Building Construction). Deutsches Institut für Normung: Berlin, Germany, 2013.
Figure 1. Flow chart of the research approach in this study.
Remotesensing 15 00301 g001
Figure 2. Audited buildings in Sophienstr. 201–203, Volzstr. 2, Wichernstr. 4 and Wichernstr. 10–18, located in Karlsruhe, Germany [23].
Remotesensing 15 00301 g002
Figure 3. Thermographic images: (ad) automatic UAV-based images; (eg) terrestrial images; (hj) manual UAV-based images; (a) oblique from 40 m above ground; (b) oblique from 60 m above ground; (c) nadir from 40 m above ground; (d) nadir from 60 m above ground; (e) 4 m distance; (f) 8 m distance; (g) 15 m distance; (h) 4 m distance; (i) 8 m distance; (j) 15 m distance.
Remotesensing 15 00301 g003
Figure 4. Example images: Areas of interest in Sophienstr. 201–203; left the thermographic images and right the corresponding RGB images from Google Earth [23]; (a,b) depict the east side of the building; (c,d) the west side; B1 and B2 show balconies; W1 to W10 windows; BB a building base; S1 and S2 staircases; F1 to F3 façade points.
Remotesensing 15 00301 g004
Figure 5. Comparison of thermographic images recorded at different flight speeds; (ac) south side of Volzstr. 2; (a) at 1 m/s; (b) at 3 m/s; (c) at 5 m/s; B balcony; W window; B and W show no blur.
Remotesensing 15 00301 g005
Figure 6. Comparison of the same window recorded with different settings; (a,b) terrestrial images recorded with a horizontal distance of (a) 4 m and (b) 15 m to the façade; (c,d) automatically recorded UAV images at a flight height of (c) 22 m and (d) 42 m above the building.
Remotesensing 15 00301 g006
Figure 7. Flight with different heading angles relative to a building’s façades/sides: (a) perpendicular to long side (b) perpendicular to short side (long side is obscured).
Remotesensing 15 00301 g007
Figure 8. Thermographic images of a thermal bridge of a balcony slab recorded at an 8 m distance from a manual UAV’s (a) and a ground-based hand-held camera’s (b) perspective. Windows are more obscured in (b), while the thermal bridge under the balcony slab is more prominent. The same thermal bridge is inaccessible through automatically recorded aerial images.
Remotesensing 15 00301 g008
Figure 10. Box plots for the comparative temperature differences of rooftops: Comparative temperature differences between areas of interest of UAV-based images.
Remotesensing 15 00301 g010
Figure 11. Thermographic images of the same rooftop recorded automatically with an oblique angle at (a) 22 m and (b) 42 m flight height above the building.
Remotesensing 15 00301 g011
Figure 12. Influence of the camera angle on the contrast of drone-based thermographic images based on a roof anomaly R in Volzstr. 2; (a) in front view; (b) in nadir perspective. The contrast of R in (b) is weaker than in (a) due to increased reflections from the sky.
Remotesensing 15 00301 g012
Figure 13. Window reflections recorded (a) with the terrestrial camera and (b) manually with the UAV-mounted camera at 4 m distance to the building façade.
Remotesensing 15 00301 g013
Figure 14. Box plots for the comparative contrasts of façade elements (window, balcony, door, base, insulation).
Remotesensing 15 00301 g014
Figure 15. Box plots for the comparative contrasts Δ T o , o , 42 , 22 C between UAV-based images recorded from a height of 42 m and 22 m of rooftop elements (rooftop areas, vent openings, chimneys).
Remotesensing 15 00301 g015
Table 1. Overview of recent studies in the field of UAV-based thermal building inspections [11,12,13,14,15,16,17,18,19,20,21].
PublicationYearUAV Flight Settings
Krawczyk et al. [11]2015No information provided
Entrop and Vasenev [12]20175–10 m vertical distance to building roof, 1 m/s flight speed
Rakha and Gorodetsky [13]201812 m horizontal distance to building façade, 45° and 10° camera angle
Daffara et al. [14]202010 m horizontal distance to building façade, 0° camera angle
Dahaghin et al. [15]202148–218 m vertical distance to ground
Hou et al. [16]202260 m and 35 m vertical distance to ground, 45° and 30° camera angles
Benz et al. [17]202115 m distance to the building
Mayer et al. [18]202160–80 m vertical distance to ground
Zahradník [19]202220 m vertical distance to ground, 90° camera angle, 2 m/s flight speed
Mirzabeigi and Razkenari [20]20226.5 m distance to building, ground-based terrestrial camera for comparision
Gómez and Tascón [21]202110 m horizontal distance to building façade, 20 m vertical distance to building rooftop peak
Table 2. Flight settings for the case study (the presence of obstacles allowed only the buildings on Wichernstr. to be recorded via manual flights 7–9).
FlightBuildingAutomatically/Manually Performed Flight RouteCamera Angle
[°]
Height above Ground
[m]
Height above Building
[m]
Distance to Façade
[m]
Flight Speed
[m/s]
1Full areaAutomatically45 (oblique)4022-1
2Full areaAutomatically45 (oblique)4022-3
3Full areaAutomatically45 (oblique)4022-5
4Full areaAutomatically45 (oblique)6042-3
5Full areaAutomatically90 (nadir)4022-3
6Full areaAutomatically90 (nadir)6042-3
7Wichernstr. 4Manually0 (manual)4 to 12-4-
8Wichernstr. 4Manually0 (manual)4 to 12-8-
9Wichernstr. 4, 10–18Manually0 (manual)4 to 12-15-
Table 3. List of areas of interest for the case study per building and building part.
BuildingSophienstr. 201–203Volzstr. 2Wichernstr. 4Wichernstr. 10–18
Building Part
Balcony2874
Building base1-2-
Chimney--2-
Door-1--
Façade3426
Glass façade-2--
Rooftop-347
Staircase21-3
Vent opening-222
Window104199
Total18253831
Table 4. Comparison of the strengths and weaknesses of image acquisition methods implemented in this case study by means of previously discussed quality criteria.
Acquisition
Method
Automatic UAV FlightsManual UAV FlightsHand-Held, Ground-Based Capture
Criterion
Motion blurUnaffected
(at up to 5 m/s)
Unaffected
(stationary)
Unaffected
(stationary)
Feature discernibilityMedium
(façades less detailed, large distances necessary)
High
(same detail throughout, small distances possible)
Medium
(non-eye-level areas less details, small distances possible)
AccessibilityMedium
(with crosshatch only minor blind spots, inaccessibility of balcony slabs)
High
(no blind spots, all areas accessible)
Low
(large blind spots, entire envelope parts like rooftops hardly accessible, good accessibility of balcony slabs)
Comp. temperature differenceWeak
(large distances necessary)
Strong
(small distances possible)
Strong
(small distances possible)
Comp. contrastWeak
(though no window reflections, large distances necessary)
Strong
(despite pronounced window reflections, small distances possible)
Strong
(despite pronounced window reflections, small distances possible)
Time efficiencyMedium
(long setup, scalable approach)
Low
(long setup and stop-and-go image capture)
Low
(stop-and-go image capture on foot)
OverallFastest method but with least detailSlowest method but constant, high detailEnough detail but accessibility issues
Table 5. Recommendations for UAV settings in UAV-based thermal image acquisition for building auditing deduced from the results and framework conditions of our study; * The usefulness of performing manual flights for rooftop analyses depends on the shape of the rooftop and can make sense in individual cases. If a slanted roof is scanned at a perpendicular angle to the building façade, temperature distortions can be expected to occur, depending on the slant angle.
Automated FlightsManual Flights/Recordings
12 m height above building,
45° camera angle
22 m height above building,
45° camera angle
42 m height above building,
45° camera angle
42 m height above building,
90° camera angle
Up to 15 m horizontal distance,
0° camera angle
Qualitative analysis of the rooftopRecommendedRecommendedRecommended only for overviewsRecommended only for overviewsNot studied *
Qualitative analysis of the façadeRecommendedRecommendedRecommended only for overviewsNot recommendedRecommended
Quantitative analysis of the rooftopRecommendedNot recommendedNot recommendedNot recommendedNot studied *
Quantitative analysis of the façadeNot recommendedNot recommendedNot recommendedNot recommendedRecommended
Disclaimer/Publisher’s Note: The statements, opinions and data contained in all publications are solely those of the individual author(s) and contributor(s) and not of MDPI and/or the editor(s). MDPI and/or the editor(s) disclaim responsibility for any injury to people or property resulting from any ideas, methods, instructions or products referred to in the content.

