Article

Uvsq-Sat NG, a New CubeSat Pathfinder for Monitoring Earth Outgoing Energy and Greenhouse Gases

by
Mustapha Meftah
1,*,†,
Cannelle Clavier
1,2,†,
Alain Sarkissian
1,†,
Alain Hauchecorne
1,†,
Slimane Bekki
1,†,
Franck Lefèvre
1,†,
Patrick Galopeau
1,†,
Pierre-Richard Dahoo
1,†,
Andrea Pazmino
1,†,
André-Jean Vieau
1,†,
Christophe Dufour
1,†,
Pierre Maso
1,†,
Nicolas Caignard
1,†,
Frédéric Ferreira
1,†,
Pierre Gilbert
1,†,
Odile Hembise Fanton d’Andon
2,†,
Sandrine Mathieu
2,†,
Antoine Mangin
2,†,
Catherine Billard
1,† and
Philippe Keckhut
1,†
1
LATMOS, Centre National de la Recherche Scientifique (CNRS), Université de Versailles Saint-Quentin-en-Yvelines (UVSQ), Université Paris-Saclay, Sorbonne Université (SU), 11 Boulevard d’Alembert, 78280 Guyancourt, France
2
ACRI-ST—CERGA, 10 Avenue Nicolas Copernic, 06130 Grasse, France
*
Author to whom correspondence should be addressed.
These authors contributed equally to this work.
Remote Sens. 2023, 15(19), 4876; https://doi.org/10.3390/rs15194876
Submission received: 18 August 2023 / Revised: 30 September 2023 / Accepted: 6 October 2023 / Published: 8 October 2023

Abstract

:
Climate change is undeniably one of the most pressing and critical challenges facing humanity in the 21st century. In this context, monitoring the Earth’s Energy Imbalance (EEI) is fundamental in conjunction with greenhouse gases (GHGs) in order to comprehensively understand and address climate change. The French Uvsq-Sat NG pathfinder mission addresses this issue through the implementation of a Six-Unit CubeSat, which has dimensions of 111.3 × 36.6 × 38.8 cm in its unstowed configuration. Uvsq-Sat NG is a satellite mission spearheaded by the Laboratoire Atmosphères, Observations Spatiales (LATMOS), and supported by the International Satellite Program in Research and Education (INSPIRE). The launch of this mission is planned for 2025. One of the Uvsq-Sat NG objectives is to ensure the smooth continuity of the Earth Radiation Budget (ERB) initiated via the Uvsq-Sat and Inspire-Sat satellites. Uvsq-Sat NG seeks to achieve broadband ERB measurements using state-of-the-art yet straightforward technologies. Another goal of the Uvsq-Sat NG mission is to conduct precise and comprehensive monitoring of atmospheric gas concentrations (CO 2 and CH 4 ) on a global scale and to investigate its correlation with Earth’s Outgoing Longwave Radiation (OLR). Uvsq-Sat NG carries several payloads, including Earth Radiative Sensors (ERSs) for monitoring incoming solar radiation and outgoing terrestrial radiation. A Near-Infrared (NIR) Spectrometer is onboard to assess GHGs’ atmospheric concentrations through observations in the wavelength range of 1200 to 2000 nm. Uvsq-Sat NG also includes a high-definition camera (NanoCam) designed to capture images of the Earth in the visible range. The NanoCam will facilitate data post-processing acquired via the spectrometer by ensuring accurate geolocation of the observed scenes. It will also offer the capability of observing the Earth’s limb, thus providing the opportunity to roughly estimate the vertical temperature profile of the atmosphere. We present here the scientific objectives of the Uvsq-Sat NG mission, along with a comprehensive overview of the CubeSat platform’s concepts and payload properties as well as the mission’s current status. Furthermore, we also describe a method for the retrieval of atmospheric gas columns (CO 2 , CH 4 , O 2 , H 2 O) from the Uvsq-Sat NG NIR Spectrometer data. The retrieval is based on spectra simulated for a range of environmental conditions (surface pressure, surface reflectance, vertical temperature profile, mixing ratios of primary gases, water vapor, other trace gases, cloud and aerosol optical depth distributions) as well as spectrometer characteristics (Signal-to-Noise Ratio (SNR) and spectral resolution from 1 to 6 nm).

1. Introduction

Climate change is a critical challenge of the 21st century, marked by the long-term alteration of global weather patterns. This transformation encompasses various phenomena, including temperature rise, extreme weather events, sea level rise, and changes in precipitation in many areas. The primary driver of these changes is the unprecedented increase in anthropogenic greenhouse gas (GHG) emissions since the mid-20th century, primarily carbon dioxide (CO 2 ), methane (CH 4 ), nitrous oxide (N 2 O), and fluorinated gases [1,2]. Changes in atmospheric composition, driven by anthropogenic emissions of GHGs, ozone precursors, aerosols, and their precursors, have a significant impact on climate by perturbing the Earth’s Radiation Budget (ERB). Simultaneously, alterations in land use also influence climate dynamics. The ERB, representing the balance of energy between incoming and outgoing radiation at the top of the atmosphere (TOA), plays a pivotal role in this complex interplay. The increase in GHG concentrations results in a rise in temperature at the surface and in the lower atmosphere by limiting the escape of emitted terrestrial infrared (IR) radiation. This phenomenon leads to global warming, which is necessary for re-establishing the Earth’s radiation balance. Monitoring GHG emissions from space is of utmost importance. It allows for the accurate tracking of current GHG levels, trends, and budgets (sources and sinks) [3], deepening our understanding of the processes that drive GHG levels. Accurately monitoring the ERB [4] and its various components, notably the IR one, from space is also crucial for understanding radiative changes and to assess the Earth’s Energy Imbalance (EEI).
Currently, two key parameters are closely monitored for understanding climate change: the concentration of CO 2 and the Earth’s surface temperature. However, the strong link between increases in surface temperatures and GHG levels is complicated by other climate forcings and several feedback processes, in particular linked to the hydrological cycle, that are not yet well understood. Also, surface temperature trends can be unreliable indicators of climate change over shorter time scales due to the ocean’s ability to absorb, store, and redistribute most of this excess heat vertically on longer time scales. To gain a comprehensive understanding of climate change, it is important to be able to monitor the EEI, i.e., the difference between the incoming solar radiation absorbed by the Earth and the Outgoing Longwave Radiation (OLR) emitted by the Earth (IR radiation). The EEI represents the excess of heat accumulated in the Earth’s system from the increased longwave trapping by GHGs and hence is a direct driver of global warming. The global energy imbalance is not constant in time; it is influenced by natural climate forcings (e.g., volcanic, solar) and by modes of climate variability. For instance, the El Niño–Southern Oscillation (ENSO) recurring climate pattern causes fluctuations in heat storage in the ocean, leading to temporary global warming during El Niño phases (recent major events: 1982–1983, 1997–1998, and 2014–2016) when the ocean surface warms up in the central and eastern tropical Pacific Ocean, removing heat by radiating it back to space. Since May 2023, negative OLR anomaly values indicate the return of El Niño to the tropical Pacific after seven years. Observing the EEI and OLR in conjunction with GHGs and temperatures allows us to assess different steps in the global warming mechanism and, consequently, gain a better understanding of climate change. While the levels of GHGs, such as CO 2 and CH 4 , are an indicator of anthropogenic global warming, the EEI is a better and broader indicator of actual climate change because it is a measure of the existing overall energy imbalance in the Earth’s system. The EEI accounts for not only the GHG effect but also other climate forcings and natural variability, which also impact the amount of heat accumulated in the ocean–atmosphere system. This knowledge is valuable for formulating effective strategies to mitigate global warming and its consequences on weather patterns, ecosystems, and human societies [5].
While the greenhouse effect’s mechanism and the contributions of various anthropogenic GHGs to Earth’s surface warming are well established, some interactions and feedback involving clouds, polar ice [6], and oceans remain less understood. Observations and model simulations reveal that the direct warming caused by GHGs is further amplified by climate feedbacks, such as the melting of the very reflective Arctic sea ice, which exposes more ocean to the Sun and hence enhances solar radiation absorption. Overall, the simultaneous observation of multiple climate parameters, the so-called Essential Climate Variables (ECVs), is important for better characterizing all the aspects of climate change.
Satellite-based observations provide a potent tool for monitoring the key ECVs simultaneously with possibly global coverage and consistency. On top of large instrumented satellites, small-sized affordable nanosatellites like CubeSats represent promising complementary platforms for monitoring GHGs levels and Earth’s outgoing energy with miniaturized instruments. In addition to typically short development phases, their very low costs make it possible to deploy a large constellation of phased CubeSats in Low Earth Orbit. Such a configuration attracts increasing attention in the context of climate change observation, as it enables a global and much more continuous spatio-temporal coverage of the Earth than a single large satellite does.
SmallSats are increasingly becoming indispensable tools for Earth observation [7], underscoring their vital role in enhancing our understanding of the planet. They have the potential to fundamentally revolutionize our approach for monitoring climate change from space by introducing a new paradigm, which involves coordinated plans for multiple satellites, each equipped with diverse instrument payloads. Leveraging the agility of these small satellites, characterized by their swift maneuverability, enables dynamic adjustments of viewing angles to capture swiftly evolving phenomena. This framework is tailored for real-time operations, ensuring both high spatial resolution and remarkable revisit capabilities.
To study the feasibility of monitoring GHGs and the ERB with a SmallSats constellation, a new spacecraft named Uvsq-Sat NG is being specifically designed for such purposes and will be placed in Low Earth Orbit (LEO) between Q2 2025 and Q1 2026. Uvsq-Sat NG fits into the continuity of CubeSats that have already been launched by LATMOS, namely, Uvsq-Sat on 24 January 2021 [8] and Inspire-Sat 7 on 15 April 2023 [9]. Both are still operating successfully in LEO. The goal is to go a step further by deploying a more complex satellite with a fully active Attitude Determination and Control System (ADCS) to address a wider range of intricate scientific needs in climate change research. Uvsq-Sat NG is a 6U CubeSat (10.0 cm × 36.6 cm × 22.6 cm) containing several scientific payloads. It carries Earth Radiative Sensors (ERSs) to measure outgoing solar radiation (from 100 to 3000 nm) and outgoing infrared radiation (from 3 to 100 μ m). These measurements must be in the continuity of those carried out with Uvsq-Sat [10] and Inspire-Sat 7, with the objective of establishing a multi-year time series of outgoing shortwave radiation (OSR) and OLR data. Uvsq-Sat NG also has a miniaturized Near-Infrared (NIR) Spectrometer (aperture of 15 mm, spectral range from 1200 to 2000 nm, spectral resolution of 6 nm, field of view of 0.15°) designed to map variations in the concentrations of the key GHGs, specifically CO 2 and CH 4 . Furthermore, Uvsq-Sat NG has a high-definition camera (focal length of 70.5 mm, F/2.2, spectral range transmission from 390 to 690 nm, complementary metal oxide semiconductor (CMOS) sensor of 2048 × 1536 pixels, pixel size of 3.2 μ m, field of view of 13°) to acquire images of observed scenes in the visible spectrum. The post-processing of the images should enable high-precision geolocation, which is necessary for analyzing Uvsq-Sat NG NIR Spectrometer observations and interpreting GHG concentration maps. This camera will also be used to observe the Earth at the limb.
Uvsq-Sat NG is a SmallSat belonging to the International Satellite Program in Research and Education (INSPIRE) series of satellite missions. The INSPIRE program is a collaborative effort among multiple universities aimed at creating a constellation of SmallSats for pioneering space and Earth science research. This initiative also encompasses the establishment of a global ground station network and educational programs encompassing spacecraft design, systems engineering, operations and data analysis. The advancements achieved through the Uvsq-Sat NG program contribute also to enhancing our educational curriculum (SIMIS Professional Bachelor (Mantes-en-Yvelines, France), Master NewSpace Paris-Saclay (Guyancourt, France), etc.), enabling the training of students in space technology, as well as space sciences.
The general objective of this paper is to present the Uvsq-Sat NG mission and logic and to describe the instruments including the NIR Spectrometer and its data processing. Section 2 explains the scientific purposes of the mission. Section 3 describes the Uvsq-Sat NG nanosatellite, its current status, its Calibration and Validation (Cal/Val) process, and its Concept of Operations (ConOps). Section 4 presents an initial analysis of the expected results on GHG retrieval from future Uvsq-Sat NG observations based on numerical simulations. A radiative model is used to relate the observed transmittance functions to the concentrations of the atmospheric gases. A Levenberg–Marquardt algorithm iteratively adjusts the gas concentrations and inputs to the model, to minimize the differences between measured and simulated transmittance functions depending on assumed environmental parameters. The estimation of gases concentrations (CO 2 , CH 4 , O 2 , H 2 O) and their associated uncertainties is largely based on a Monte Carlo approach, performing multiple simulations with randomized model inputs within specified uncertainty bounds.

2. Scientific Objectives

ECVs are identified as the key variables for understanding and characterizing Earth’s climate. Together, they provide a comprehensive view of the evolving global climate system and serve as essential indicators for guiding climate mitigation and adaptation measures, assessing climate risks, attributing climatic events to their root causes, and supporting climate services. The Global Climate Observing System currently identifies 54 ECVs. Satellite data address about 60% of these variables, making satellites a vital component for monitoring and understanding our planet’s climate.
A trailing constellation (multiple satellites orbiting on the same path) of Sun-synchronous satellites would enable an overall shorter revisit period (time elapsed between observations of the same point from a satellite of the train) and hence ECVs observations at different local solar times of the same scenes. It would provide real-time observations on diurnal timescales for all points of the globe, including those that are difficult to access from the ground (polar regions). This cannot be achieved with a single satellite on a Sun-Synchronous Orbit, which samples a specific location at always the same local solar time at a specific location. A single satellite cannot provide any information or constraints on diurnal variations in emissions. It is a major limitation for numerous emission sources. In addition, measurements of these interconnected ’agile’ small satellites could be anchored in flight to more accurate measurements of the larger satellites. In other words, it would be possible to use accurate measurements, notably from large satellite platforms, to check the calibration of the small satellites every time the small and large satellites are in coincidence, looking at the same scenes. In return, such a constellation could also relay valuable information, such as the diurnal components of emissions, to the larger satellites for further investigation and detailed analysis. This synergy between CubeSat constellations and large satellite platforms represents a relatively new paradigm for Earth observation.

2.1. Earth’s Radiation Budget

Several space missions have been focused on the measurement of the Earth’s Radiation Budget (ERB). Satellites’ measurements from both the earlier Earth Radiation Budget Experiment (ERBE) sensors and the current-generation Clouds and the Earth’s Radiant Energy System (CERES) sensors [11] form the foundation of a multi-decadal record of the ERB at the TOA. Among these, the CERES sensors are currently considered the most dependable and consistent in providing accurate measurements of the radiative components at the top of the atmosphere. The Geostationary Earth Radiation Budget (GERB) aboard EUMETSAT’s Meteosat Second Generation geostationary satellites is another satellite instrument that provides valuable data on the ERB component at the TOA. From 2028, the future Libera NASA mission will continuously measure the energy leaving Earth’s atmosphere on a daily basis, extending the ERB record. Libera will acquire spectrally integrated radiance over the CERES heritage broad spectral bands in the shortwave (0.3–5.0 μ m), longwave (5.0–50.0 μ m), and total band (0.3–beyond 100.0 μ m) and will add a split-shortwave band (0.7–5.0 μ m) to provide deeper insight into shortwave energy deposition [12]. This will help us to maintain a data record spanning several decades, taking advantage of the CERES instruments. There are also ERB observations from other satellites which are obviously of interest and serve as points of comparison to consolidate the observations and trends.
One of the objectives of the Uvsq-Sat NG mission is to measure the ERB components, including OLR and OSR, with increasing accuracy with respect to the previous LATMOS CubeSat missions (Uvsq-Sat and Inspire-Sat 7). The scientific value of ERB observations obviously depends on their accuracies [8,9], which are critical in the derivation of the EEI. Table 1 provides the current ERB requirements for the different missions (Uvsq-Sat, Inspire-Sat 7, Uvsq-Sat NG, Terra-F constellation) developed by LATMOS.
The ERB measurements requirements for the hypothetical satellite constellation Terra-F presented in Table 1 represent the best-case scenario. So far, existing satellite instruments have not been able to measure the solar and terrestrial radiative fluxes accurately enough to directly determine the absolute value of the EEI, though there is more confidence in the derivation of the EEI’s relative changes. Currently, satellite-based determinations of the EEI are usually anchored to ocean heat content data, which provide a better indicator of the absolute magnitude of the EEI [13].
A recent study dating back to 2021 highlighted that both satellite and oceanic data reveal a marked increase in the EEI [14]. The results demonstrate that independent observations from satellites and in situ measurements produced statistically similar decadal increases in the EEI from mid-2005 to mid-2019, amounting to approximately 0.50 ± 0.47 Wm 2 per decade (5–95% confidence interval). This trend is primarily driven by an increase in absorbed solar radiation caused by reduced reflection from clouds and sea ice, as well as a decrease in OLR due to rising levels of GHGs. These changes together outweigh a positive trend in OLR associated with the overall increase in global mean temperatures. Using additional data from a Moderate-Resolution Imaging Spectroradiometer (MODIS) aboard the Terra and Aqua satellites, Cloud–Aerosol Lidar and Infrared Pathfinder Satellite Observation (CALIPSO), CloudSat, and reanalysis, Loeb et al. (2023) [15] also show once again that the rise in the EEI can be attributed to reduced cloud and sea ice reflection, leading to a significant increase in absorbed solar radiation [15]. Additionally, the increase in trace gases and water vapor contributes to a decrease in OLR. This demonstrates the importance of conducting these measurements to monitor the ERB components at various time scales. The ultimate goal is to ensure the seamless continuity of the ERB climate data records. The present development of an autonomous and cost-effective observing system inspired by Uvsq-Sat and Inspire-Sat 7 is a contribution towards that goal.

2.2. Carbon Dioxide and Methane

Table 1 also presents GHGs’ scientific requirements related to Uvsq-Sat NG and the Terra-F hypothetical French satellite constellation. Keep in mind that Terra-F is currently a conceptual mission and has not yet entered its development phase. However, achieving this level of precision with such a constellation would accomplish several key objectives regarding mapping the global distribution of CO 2 and CH 4 concentrations with high spatio-temporal resolution. This would allow us to monitor the variability and co-evolution in CO 2 and CH 4 concentrations over different regions on a wide range of temporal scales (e.g., from diurnal to seasonal timescales) and to constrain the quantification of their sources and sinks. This would contribute to a better understanding of the carbon cycle and its role in climate change. The main challenge in understanding CH 4 source and sink processes lies in the absence of accurate global measurements of atmospheric CH 4 . Existing ground-based in situ observations are limited due to the coarse measurement network, making it difficult to adequately sample key source regions like the Arctic permafrost, boreal forests, and tropical wetlands. Space-borne measurements are essential in order to achieve comprehensive global coverage with high precision.
Various space missions have been dedicated to the measurement and continuous monitoring of GHGs in the Earth’s atmosphere. One can mention the Environmental Satellite (ENVISAT) and its Scanning Imaging Absorption Spectrometer for Atmospheric Chartography (SCIAMACHY) [16,17], Greenhouse Gases-Observing Satellite (GOSAT) [18,19] and its Thermal and Near-Infrared Sensor for Carbon Observation Fourier Transform Spectrometer (TANSO-FTS), TanSat (also known as CarbonSat), or even Orbiting Carbon Observatory-2 (OCO-2) [20] and OCO-3. Most of these satellites are equipped with sophisticated spectrometers that can precisely measure the GHG concentrations in the Earth’s atmosphere. For example, OCO-2 uses an NIR/shortwave infrared grating spectrometer with multiple bands (0.76 μ m for O 2 , 1.61 μ m and 2.06 μ m for CO 2 ). Its spatial resolutions are 1.29 km (cross-track) and 2.25 km (along-track), making it suitable for precise GHG monitoring. It is the second successful high-precision CO 2 -observing satellite (better than 0.3%), after GOSAT. Other satellites currently under development aim to improve these measurements and to precisely quantify atmospheric gas emissions, a wide range of spatial scales, from the global to specific point sources [21]. Examples of such space missions are MicroCarb (2024), GOSAT-3 (2024), MethaneSAT (2024), GeoCarb (2025), CO2M (2025), or even Merlin (2028). As an illustration, the MicroCarb mission [22] is designed to measure CO 2 columns using a high-spectral-resolution infrared grating spectrometer (with a resolving power of ∼25,000). This spectrometer operates in lines specific to CO 2 (at 1.6 and 2.0 μ m) and O 2 (at 0.76 and 1.27 μ m), providing a spatial resolution of 250 × 400 km. A recent study [23] also explored the potential of observing GHGs from CubeSats [24]. Such SmallSats, especially in constellation, could play an important role in GHG remote sensing, despite their compact and mass limitations. One of the Uvsq-Sat NG mission’s objectives is to assess the feasibility of measuring the atmospheric GHG (CO 2 , CH 4 ) columns using a miniaturized spectrometer aboard a CubeSat. On the top of ERB measurements, Uvsq-Sat NG aims to develop and validate an in-orbit demonstrator of GHG observations at lower spectral resolutions. The satellite’s successful implementation will pave the way for future high-resolution satellite constellations. State-of-the-art codes and procedures will have to be carried out in order to assess the quality and precision of the satellite measurements, ensuring their adherence to scientific standards.

3. Description of the Uvsq-Sat NG Space-Based Mission

Uvsq-Sat NG is a French cutting-edge CubeSat developed by LATMOS in collaboration with the international INSPIRE team. This project is integrated into the “Académie spatiale d’Île-de-France” initiative, which was selected in the 2023 call for proposals of the “Appel à manifestation d’intérêt Compétences et Métiers d’Avenir” (expression of interest for future skills and professions for France 2030). Uvsq-Sat NG is designed for scientific and technological exploration but also as an educational tool since students can gain practical skills in satellite design, construction, and operation, fostering a deeper understanding of space sciences and engineering principles.
The Uvsq-Sat NG space program consists of both a ground segment and a space segment. The ground segment includes all the infrastructure and facilities that are used to control and manage the space missions. It includes the LATMOS UHF/VHF stations (Hermès and Elsa) located at Observatoire de Versailles Saint-Quentin-en-Yvelines (OVSQ, France), enabling radio communication with the Uvsq-Sat NG CubeSat. Another station located in the French Riviera at Grasse (France) will be used and operated by ACRI-ST to facilitate satellite data downlink in the S-band. The space segment, on the other hand, comprises the Uvsq-Sat NG CubeSat, which plays a pivotal role in fulfilling the mission’s objectives and transmitting crucial data back to Earth for analysis and informed decision making. Figure 1 shows the satellite’s architecture.

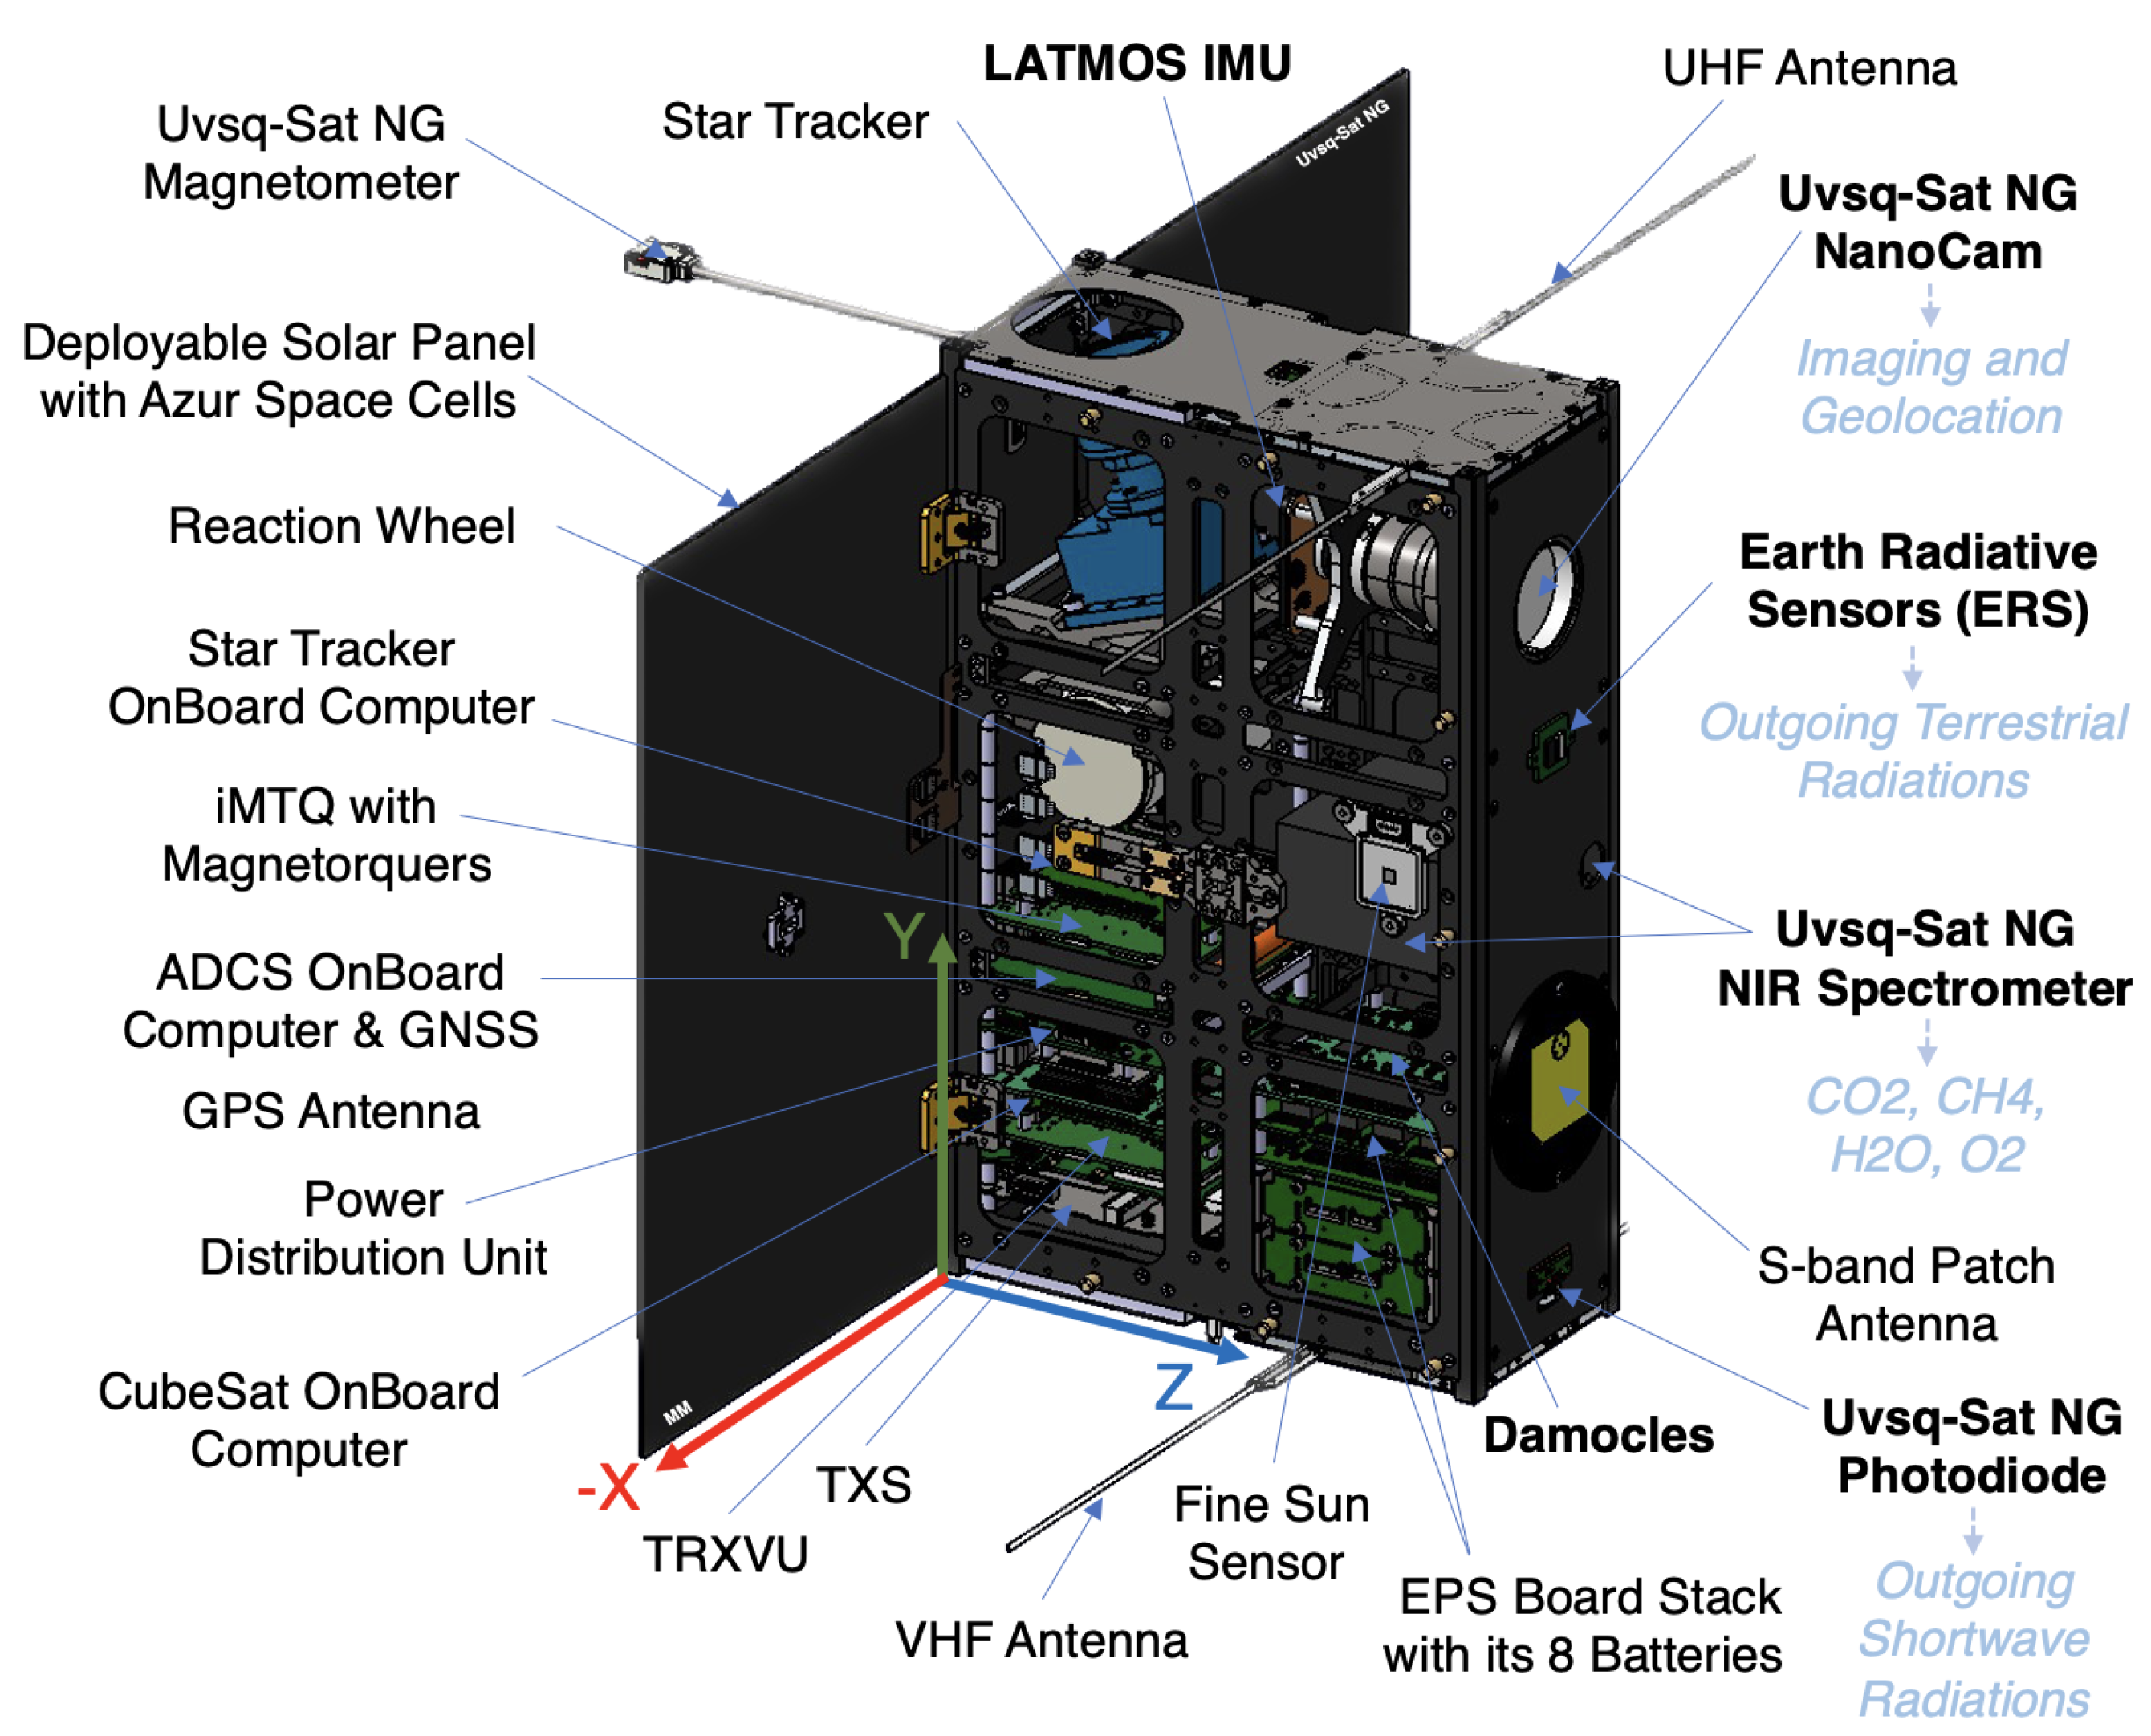
3.1. Description of the Uvsq-Sat NG Satellite and Its Payloads

Uvsq-Sat NG (Figure 1) is a three-axis stabilized satellite of the Six-Unit class CubeSat, with an overall size of 111.3 × 36.6 × 38.8 cm (unstowed configuration) and a maximum mass budget constraint of 10 kg. The projected mission duration is at least 2 years, which includes the commissioning phase. During this period, the satellite will collect crucial data of the ERB and GHGs. Uvsq-Sat NG is a complex system composed of various subsystems.
Many subsystems of Uvsq-Sat NG have already been used in Uvsq-Sat and Inspire-Sat 7. They are described in detail in the articles dedicated to these satellites [8,9].
The Uvsq-Sat NG Command and Data Handling Subsystem (C&DHS) plays a pivotal role in ensuring the spacecraft’s successful operation and management by serving various important objectives. The main component of the C&DHS Subsystem is the CubeSat OnBoard Computer (OBC), which executes ground commands for various functions; manages data processing, storage, and transmission; collects telemetry data for monitoring; enables autonomous operations and fault management; handles scheduling and power distribution; implements security measures; and manages software updates and validation.
The Uvsq-Sat NG Electrical Power Subsystem (EPS) is tasked with generating, storing, regulating, and distributing electrical power necessary for operating the various subsystems and instruments onboard. It ensures a consistent and dependable power supply throughout the satellite’s mission in space. The essential components and functions of this subsystem encompass an EPS board stack with its eight batteries, the deployable solar panels with Azur Space cells, the power distribution unit, regulation, management, and thermal control.
The Uvsq-Sat NG communication subsystem is tasked with establishing and maintaining communication links between the satellite and ground stations. Its primary goal is to enable the smooth transmission of data, commands, and telemetry information to and from the satellite. The key components of this subsystem include the TRXVU communication device (UHF/VHF band), the UHF/VHF antennas, the TXS high-data-rate S-band transmitter, and the S-band patch antenna. The S-band downlink, with the platform oriented towards Nadir, falls within the frequency allocation of 2200 to 2290 MHz. The Isispace VHF Receiver (RX) operates in the commercial frequency range of 148 to 150.5 MHz, and for amateur frequency coordination, it operates within the frequency range of 145.8 to 146.0 MHz. On the other hand, the Isispace VHF Transmitter (TX) covers the commercial frequency range of 400.15 to 402.0 MHz and, for amateur usage, it spans the range of 435.0 to 438.0 MHz. An audio transponder will also be used with the amateur radio community.
Uvsq-Sat NG carries multiple payloads, including the ERSs that have been previously used in our earlier missions (Uvsq-Sat and Inspire-Sat 7). The detailed characteristics of these sensors dedicated to ERB observations are provided in [8,9]. A miniaturized spectrometer dedicated to GHG observation is also onboard. This NIR Spectrometer fits within a volume of less than 1 unit (10 × 10 × 10 cm) and has a 15 mm aperture. It is composed of a 300 groves/mm grating and an Indium Gallium Arsenide (InGaAs) linear image sensor equipped with a Peltier thermoelectric cooler, offering integration times ranging from 0.5 to 4 s. Improved results (GHG observations) can be achieved if the Uvsq-Sat NG NIR Spectrometer temperature is maintained below −5 °C. Finally, a high-definition camera is used to ensure the geolocation of observations and to achieve secondary scientific objectives. With a frame rate of 12 frames per second, the imaging CMOS sensor enables a complete capture within a total time of 84 milliseconds. Table 2 provides the key features of the different payloads. As for Table 3, it provides the general characteristics of the satellite that ensure the mission’s performance.
The scientific objectives of the mission require a satellite capable of accurately pointing to an observation area. Furthermore, Uvsq-Sat NG must possess both agility and swiftness to rapidly align itself with the target area. This is important, especially during calibration phases (atmospheric corrections), where it will be necessary to rapidly observe a target area (Nadir, Earth’s limb) from various angles. These calibrations will also require rapid payloads data acquisitions to mitigate the satellite’s motion effect (∼6 km s 1 ). These various objectives led us to implement a complex ADCS system to meet our requirements.
The Uvsq-Sat NG ADCS subsystem is tasked with precisely determining and managing the satellite’s orientation or attitude in space. It can achieve an absolute pointing error of 0.1 degrees or even higher precision, along with an attitude knowledge error of 0.05 degrees, in accordance with the mission’s requirements. Several elements contribute to ensuring this performance. The essential components of this subsystem encompass an ADCS OnBoard Computer, a Star Tracker OnBoard Computer, sensors (Uvsq-Sat NG photodiode, Fine Sun Sensor, Uvsq-Sat NG magnetometer, Star Tracker, LATMOS Inertial Measurement Unit (IMU) with its gyroscopes and magnetometers), and actuators (Reaction Wheel, iMTQ with magnetorquers), as shown in Figure 1. Coarse and Fine Sun Sensors are used to detect the Sun’s direction, contributing to determining the satellite’s orientation with respect to the Sun. Magnetometers measure the local magnetic field, assisting in establishing the satellite’s orientation in relation to Earth’s magnetic field. Gyroscopes are utilized to measure angular rates, furnishing insights into changes in the satellite’s attitude. The Star Tracker is used for star identification and tracking, allowing for the determination of the satellite’s orientation relative to known star positions. The IMU combines accelerometers and gyroscopes to furnish precise attitude information. Magnetic Torquers create torque by interacting with Earth’s magnetic field, allowing for controlled adjustments in orientation. Reaction Wheels employ spinning wheels to generate angular momentum, enabling controlled rotations with precision. Figure 2 depicts the general control loop of the Uvsq-Sat NG ADCS.
At its core, the fundamental International Geomagnetic Reference Field (IGRF) and Simplified General Perturbations 4 (SGP4) models, which have demonstrated their effectiveness in flight, are utilized for magnetic field modeling and accurate orbit propagation, aiding in predicting a satellite’s trajectory over time by accounting for various gravitational perturbations and forces. In advanced high-performance platforms such as Uvsq-Sat NG (utilizing a Global Navigation Satellite System (GNSS) and a Global Positioning System (GPS) antenna), models are substituted with GNSS inputs for position, velocity, and timing. Attitude Determination relies on a sophisticated Unscented Kalman Filter that leverages non-linear dynamics and fuses sensor information from all available sources, enabling optimal estimations of spacecraft attitude and angular rate. Attitude Control employs a range of controllers, including B-dot, magnetic-only pseudo three-axis control, and a quaternion-feedback Proportional–Integral–Derivative (PID) controller. These functionalities are accessed through specific operational modes, facilitating initial spacecraft detumbling, magnetometer-based angular rate estimation, comprehensive attitude and angular rate estimation, and three-axis control directed towards inertial and rotating reference frames. The Two-Line Element set (TLE) is commonly used for tracking and predicting the orbits of satellites. Therefore, the position and velocity vectors calculated from TLEs will be compared to the measurements conducted via the Uvsq-Sat NG onboard GPS receiver, which is capable of reaching a precision close to 2 m.
Numerous ADCS modes are available (including Initial Mode, Safe Mode, Detumbling Mode, Rate Estimation Mode, Attitude Determination Mode, Nadir Pointing Mode, Ground Point Tracking Mode, and Sun Tracking Mode) to ensure that the Uvsq-Sat NG satellite will maintain its desired orientation in orbit, tailored to the specific operational demands.
Table 4 provides the Uvsq-Sat NG external area usage on each satellite side, which enables the identification of satellite elements not depicted in Figure 1.
Uvsq-Sat NG will integrate the Damocles new electronic board, which is designed to deactivate Uvsq-Sat NG’s power sources at the conclusion of the satellite’s operational lifespan. The incorporation of this technology is of paramount importance, as it will isolate the satellite’s power sources and discharge its batteries (Panasonic NCR18650B batteries) to mitigate the potential for in-orbit explosions. The development of Damocles is aimed at mitigating the proliferation of space debris. It also serves as a function to comply with the French Space Operations Act.
One benefit of the CubeSat approach lies in the accessibility of readily available commercial off-the-shelf (COTS) components, which serves to lower expenses and expedite development timelines while being reliable.

3.2. Calibration and Validation—Cal/Val

Cal/Val constitutes a vital phase in assuring the precision and dependability of the Uvsq-Sat NG’s measurements and observations. Figure 3 depicts the observation principle of the Uvsq-Sat NG satellite.
Hereafter is a detailed description of the Uvsq-Sat NG Cal/Val process. It consists of the following phases.
  • Pre-Launch Calibration: Before Uvsq-Sat NG is launched, its payloads (ERSs, NIR Spectrometer, and NanoCam) will be calibrated in controlled laboratory conditions in a clean-room class 1000. Calibration involves exposing the instruments to known physical parameters, such as temperature, radiation, and light sources, and comparing the instrument’s response to the expected values. In this stage, reference standards are used to determine the instrument’s sensitivity, linearity, and accuracy.
  • Pre-Launch Validation: It encompasses testing and validating the satellite’s data processing algorithms through simulated data and mimicking real-world measurements, processed with mission algorithms and compared against known outcomes for data processing accuracy.
  • In-Orbit Calibration: Following its launch and early operations, In-Orbit Calibration is conducted to optimize the instrument’s calibration. This involves using internal calibration sources (laser light source for the Uvsq-Sat NG Spectrometer calibration, for instance) or external known references (Sun, Moon, stars, use of the Lunar Laser facility at Calern (Observatoire de la Côte d’Azur, France), or specific Earth locations, such as Palm Jumeirah in the United Arab Emirates, for satellite instrument calibration). The calibration coefficients are validated and adjusted as needed by comparing the In-Orbit Calibration data with the Pre-Launch Calibration results.
  • In-Orbit Validation: Once the satellite is operational, its data undergo validation through a comparison with measurements taken from models, ground-based measurements, or data from other satellite missions. This process will be implemented to validate the quality and consistency of the future Uvsq-Sat NG data. Cross-validation with data from independent sources is essential for establishing the credibility of the Uvsq-Sat NG measurements and for detecting any potential biases or errors.

3.2.1. ERSs for Ongoing ERB Measurements from Uvsq-Sat and Inspire-Sat 7

A first pre-launch absolute calibration of each ERS will be performed using the LATMOS BX-500 blackbody, which provides a broad field of view that enables sensor calibration. The LATMOS blackbody, which has a diameter of 57 mm, an emissivity of 0.95, and a minimum distance of approximately 40 mm from the sensors, will be used at various temperature set-points incremented at 5 K, ranging from 323 K to 343 K.
The pre-launch absolute calibration of each ERS in the satellite will also be conducted using the BB 3200pg blackbody of Physikalisch-Technische Bundesanstalt (PTB, Braunschweig, Germany) as the primary standard [25,26]. The BB 3200pg blackbody, with an aperture area of 111.4 mm 2 and a minimum distance of about 700 mm from the Uvsq-Sat NG proto-flight model, will be operated at various temperatures ranging from 2800 K to 3150 K.
Another ground test will be conducted at LATMOS using an Intra Solar Tracker (OWEL GmbH, Davos, Switzerland), which is a mechanical system that aims to follow the path of the Sun with an angular resolution of 0.038°. The satellite will be integrated into a container that will be attached to the solar tracker mount. The objective of this test is to perform a calibration of the ERSs using the Sun as a source. During this test, calibrated pyranometers will also be used to obtain reference values according to international standards. For this purpose, we will use two ground-based pyranometers, namely, the Kimo SAM30 (operating in the range of 400 to 1100 nm, unidirectional, measuring from 1 to 1300 Wm 2 ) and the Kipp & Zonen SMP6-V (covering 270 to 3000 nm, with a 180° field of view, measuring from 0 to 1600 Wm 2 with an uncertainty of ±20 Wm 2 ).
Based on all ground tests conducted via LATMOS on its ERSs, it is anticipated that the pre-launch absolute uncertainty for OSR and OLR will be around ±3 Wm 2 (1 σ ).

3.2.2. Uvsq-Sat NG NIR Spectrometer for Monitoring GHG Concentrations in the Atmosphere

Satellite observations provide the concentration of a respective GHG from the TOA down to the surface, referred to as the column average. On the other hand, ground-based in situ stations measure concentrations close to the surface. Both observations are valuable; however, they cannot be directly compared or used for cross-Cal/Val purposes. Satellites conduct accurate observations while being at altitudes of at least 500 km. When observing GHGs far from their sources and sinks, they must be capable of detecting very small variations in GHG concentrations, often lower than 0.5%. To measure such faint signals accurately, meticulous calibration and validation are crucial. This highlights the importance of implementing precise Pre-Launch Calibrations for satellite observations. The following description outlines the Pre-Launch Calibrations intended for Uvsq-Sat NG and its spectrometer.
  • The characterization of the spectrometer’s pixels to accurately deduce the incident irradiance based on the digital signal output from specific pixels. This is to be performed because each pixel of the InGaAs linear image sensor of the Uvsq-Sat NG Spectrometer has a specific dark current, dark offset, and gain and might respond non-linearly to change in irradiance.
  • Photosensitivity and Quantum Efficiency (QE) as a function of wavelength of each pixel to be able to convert digital signal from the InGaAs linear image sensor of the Uvsq-Sat NG Spectrometer into input irradiance at a given wavelength.
  • The Measurement of Spectral Response Function (SRF) of the Uvsq-Sat NG Spectrometer to assess the weighting of a continuous light source via sensor response. This test will be performed using the LATMOS/OVSQ iHR320 monochromator (Horiba, Palaiseau, France), equipped with a holographic grating in the spectral range of 400–1300 nm (1200 grove/mm, blaze wavelength of 630 nm) and a ruled grating in the spectral range of 1000–2500 nm (600 g/mm, blaze wavelength of 1500 nm). The iHR320 monochromator will be positioned before an NIR lamp that requires cooling. At the exit of the iHR320 monochromator, a beamsplitter will divide the light, directing it towards both the Uvsq-Sat NG Spectrometer and a sensor reference.
  • The absolute calibration of the Uvsq-Sat NG Spectrometer using secondary standards for spectral irradiance. For this measurement, an absolute reference lamp will be placed directly in front of the Uvsq-Sat NG Spectrometer. To eliminate stray light, a mask will be used between the spectrometer and the lamp. A test will also be conducted at PTB to validate the absolute measurements.
  • The verification of the inverse square law for confirming the principle that the intensity of light from a source decreases as the square of the distance from the source increases.
  • The Bidirectional Reflectance Distribution Function (BRDF) and angular responses that help us to predict how light will be reflected or transmitted at varying angles.
  • The characterization of the stray light, which is essential for maintaining the sensitivity, dynamic range, and spectral resolution of the Uvsq-Sat NG Spectrometer.
  • Thermal characterization efforts will be included to examine how the Uvsq-Sat NG NIR Spectrometer’s response varies with temperature.
The significance of these calibrations lies in obtaining an insight into the precision required for the upcoming GHG measurements, while also instilling confidence in the prospective data observations from space. As an example, GOSAT observations entail systematic uncertainties of 4 ppm for XCO 2 (column average) and 34 ppb for XCH 4 , at a spatial resolution of 1000 km over land. GOSAT-2 has improved the precision of measurements with systematic uncertainties of 0.5 ppm for XCO 2 and 5 ppb for XCH 4 , achieving resolutions of 500 km over land and 2000 km over the ocean [27]. For OCO-2/3, the resolution is around 0.3% (1 ppm) for XCO 2 . The accuracies achieved with these satellites are excellent. They underline the importance of having stable instruments and implementing excellent corrections (due to systematic and random biases). Indeed, satellite retrievals may encounter spatial bias, which could result from environmental and/or instrumental factors, as well as temporal drift in the satellite sensor. Addressing both spatial bias and temporal drift is essential. Moreover, passive methods face a significant challenge as undetected aerosol layers or thin ice clouds can lead to systematic measurement errors of uncertain magnitude. These errors arise due to the intricacy of retrieval algorithms and limited access to independent measurements for validation. This observation approach also highlights the necessity of having known solar spectra with good accuracy [28,29,30]. Significant angles for the calibration and correction of atmospheric effects in remote sensing include solar azimuth and viewing azimuth.
It is important to address and correct various biases resulting from surface albedo, aerosols, clouds, interfering gases, airglow, the CO 2 ’Ring effect’, viewing geometry, sensor drift, and stray light. In the context of the Uvsq-sat NG mission, certain specific biases could be evaluated through specific in-flight calibrations (rapid rotation of the satellite to capture the quasi-same scene from multiple angles) associated with the satellite’s attitude due to its ADCS. Others can be estimated and corrected. Another issue is related to the aging of instruments in orbit, which represents a significant problem. To mitigate such effects, the Uvsq-Sat NG NIR Spectrometer will have an in-flight calibration system that can illuminate the spectrometer linear image sensor with known irradiance to assess instrument aging and correct the data. Several laser sources will enable the execution of this task.
The goal of Uvsq-Sat NG is not to surpass the accuracy of OCO-2 but rather to achieve comparable accuracy using a significantly more cost-effective SmallSat platform. This approach opens the possibility of establishing a constellation with measurements taken at different local times. The initial SmallSat serves as a demonstrator, proving the feasibility of precise CO 2 measurements from a SmallSat. The objective with the constellation is to compile a regional-scale climatology of CO 2 concentrations to identify sources and sinks of CO 2 from both natural and anthropogenic origins. One of the most challenging experimental issues is to demonstrate carbon sequestration on a given ecosystem. The validation process will involve a comparison of the satellite data with ground-based CO 2 measurements obtained from networks such as the Total Carbon Column Observing Network (TCCON). This validation will help us to identify any potential regional biases and to enhance the retrieval algorithm. The expected performance within the scope of the Uvsq-Sat NG mission as well as that of the future constellation are detailed in Table 1. Uvsq-Sat NG is expected to achieve accurate and stable GHG measurements over time (absolute measurements of ±4.0 ppm with an annual stability of ±1.0 ppm for CO 2 , absolute measurements of ±25.0 ppb with an annual stability of ±10.0 ppb for CH 4 ). Uvsq-Sat NG will be able to rely on TCCON, which is the current reference network for the satellite Calibration and Validation of GHG observations. With a narrow field of view, the Uvsq-Sat NG NIR Spectrometer will enable the observation of ground scenes with a ground footprint diameter of approximately 5 km.

3.2.3. Uvsq-Sat NG NanoCam for Observing the Earth in the Visible Range

The camera is used to capture images of the Earth at Nadir and limb. It allows for high-precision geolocation in orbit, necessary for the post-processing of Uvsq-Sat NG data observations. Several Pre-Launch Calibrations of the NanoCam will be necessary for ensuring high-quality images, such as dark current calibration (100 e-/pixel/s at 55 °C), flat-field calibration, SNR (43 dB maximum), dynamic range (61 dB), geometric calibration, radiometric calibration, white balance calibration, focusing calibration, exposure calibration, alignment calibration, vignetting correction, temporal calibration, resolution calibration, sensor uniformity calibration, or even point spread function (psf) characterization.

3.2.4. Pre-Launch Validation of the ADCS

Validating the ADCS ensures that the satellite’s instruments can accurately capture data, perform measurements, and achieve the mission’s scientific objectives. To validate the Uvsq-Sat NG ADCS on the ground, a new test facility (Helsa) was developed by LATMOS with the support of SATT Paris-Saclay. One use of the Helsa test facility with its Helmholtz cage is to effectively cancel out the Earth’s magnetic field for the tuning and characterization of the Uvsq-Sat NG ADCS sensors. The Helsa Helmholtz cage allows for the adjustment and manipulation of the magnetic field within its volume. The Helsa air-bearing table is another tool used to test the Uvsq-Sat NG’s ADCS on the ground, simulating ’zero-g’ conditions. The combination of these two items allows us to perform Attitude Control testing of the Uvsq-Sat NG satellite in an environment which simulates operation in space. Here is a step-by-step description of the test process: set up the Helsa Helmholtz cage, prepare the Uvsq-Sat NG proto-flight model, verify that the satellite is not magnetized, calibrate all sensors, establish the Helsa air-bearing table, initialize satellite systems, perform orientation tests, test Reaction Wheels, perform magnetic field testing, and conduct Fine Sun Sensor and Star Tracker tests. The functionality of the Star Tracker in the satellite will be validated using another setup, which relies on a star simulator and a screen that projects stars onto the Star Tracker.

3.3. Concept of Operations—ConOps

The Uvsq-Sat NG ConOps is similar to the one implemented in Uvsq-Sat [8] and Inspire-Sat 7 [9]. It outlines the entire operational concept, from the Pre-Launch Phase to the satellite’s end of life. The implementation of this new satellite must take into account the lessons learned in orbit from the LATMOS satellites currently in orbit and still operational (Uvsq-Sat and Inspire-Sat 7). For example, and based on our lessons learned, the Uvsq-Sat NG design flight software must be capable of automatically managing a complete power cycle (e.g., implemented as part of an FDIR mechanism) for restoring the TRXVU RX micro-controller unit, if it becomes ’stuck’, given that the TRXVU is the only Tele-Command uplink available on the satellite. The Uvsq-Sat NG ConOps is described below.
  • Pre-Launch Phase: The ConOps starts with a clear statement of the satellite’s mission objectives, including its communication and education goals (Mission Objectives). Detailed requirements for the satellite system, payloads, and ground infrastructure are identified and documented (System Requirements). The satellite system, including the spacecraft bus, payloads, power subsystem, communication subsystem, and ADCS, is designed and integrated (System Design). This is the current status of the Uvsq-Sat NG mission as of September 2023. The upcoming tasks to be completed include full satellite integration and initial functional testing, environmental testing (vibration, thermal vacuum thermal cycling), ADCS validation, Pre-Launch Cal/Val, magnetic cleanliness verification of the satellite, software testing, communication tests, as well as power and energy testing. Additional tasks should be completed, including a possible satellite test in a vacuum chamber using an external Heliostat to redirect solar light onto Uvsq-Sat NG. This phase will conclude with the final checks and inspections of Uvsq-Sat NG, launch readiness review, and launch campaign planning.
  • Launch and Early Operations: The satellite will be launched into orbit using Falcon 9, Vega-C, Zéphyr or a similar rocket launcher. The final choice has not been determined yet. For Early Operations in orbit, the satellite’s subsystems will be initialized and checked to ensure they are functioning as expected in ’INIT’ Mode. The satellite’s position and orbit will be determined accurately using our ground-based tracking stations (Hermès and Elsa). Based on our experience, we will feature an automated procedure for its Early Operations. The following chronological steps will be implemented:
    From T0 to T0 + 30 min: deployment of the two solar panels, deployment of the UHF/VHF antennas, and deployment of the main Uvsq-Sat NG magnetometer.
    At T0 + 40 min: The satellite switches to ’Detumbling’ mode by relying on its ADCS. The iMTQ board is activated for 10 min to stabilize the CubeSat.
    At T0 + 45 min: The satellite switches to ’Stand-by mode’ and awaits the first Tele-Command (TC) from the LATMOS ground station. If no TC is received within 4 days, the initialization procedure restarts in ’debugging’ mode (UHF/VHF antennas deployment), repeated every 4 days until the first TC is received.
    At T0 + 4 days: the satellite switches to ’Nominal mode’ using a TC from the LATMOS ground stations.
  • Nominal Operations: The satellite establishes communication links with ground stations to downlink data and receive commands for mission operations (Communication). The ADCS is used to maintain the satellite’s desired orientation (Nadir Pointing Mode) for optimal data collection (Attitude Control). The Uvsq-Sat NG payloads are switched on for collecting data according to the mission’s scientific or observation plan (Payloads Operation). Telemetry data, including the satellite’s health status, are continuously transmitted to the ground stations, while commands from the ground are sent to the satellite for various operations (Telemetry and Command).
  • Calibration Operations: The ADCS is active during these operations. The payloads operate according to several ADCS modes (Ground Point Tracking Mode, Sun Tracking Mode, Earth’s limb, deep space). Sequences of rapid satellite rotation are planned to study the significance of atmospheric effects on ECVs measurements and to correct the data. Other observations such as Boresight Solar Zenith Angle or Pitch Angle Adjustment are planned. Lastly, the optimization campaigns of the Uvsq-Sat NG Spectrometer are scheduled, focusing on SNR versus exposure time measurements.
  • Anomaly Detection and Recovery: The satellite’s systems continuously monitor for any anomalies or deviations from expected behavior, and any anomalies are quickly identified (Anomaly Detection). Procedures are in place to diagnose and recover from anomalies, including contingency plans for different scenarios (Anomaly Recovery).
  • End of Mission: A plan for end-of-life Uvsq-Sat NG disposal is executed to prevent orbital debris. Using the Damocles unit, the satellite must be passivated, ensuring that no energy sources (batteries) can disrupt or contaminate outer space.
  • Ground Segment: A network of ground stations is established to communicate with the satellite and collect data (ground stations from LATMOS and ACRI-ST). A dedicated facility manages all aspects of satellite operations, including commanding, monitoring, and data processing (Mission Operations Center from LATMOS and ACRI-ST). A LATMOS scientific facility is responsible for managing and coordinating the scientific operations and activities of the Uvsq-Sat NG educational and scientific mission (Scientific Operations Center).
  • Regulatory Compliance: The ConOps ensures that the Uvsq-Sat NG mission adheres to all relevant international space treaties, national regulations (Loi des Opérations Spatiales (LOS)—French Space Operations Act), and space debris mitigation guidelines.

4. Methodology for Determining ERB and GHGs with Uvsq-Sat NG

The methods used for determining the ERB components from ERSs were explained in [8,9,10]. This section will therefore focus on the methodology used for determining GHGs’ mixing ratios with Uvsq-Sat NG. Greenhouse gases (CO 2 , CH 4 ) as well as H 2 O present absorption lines [29] in the spectral range measured via the Uvsq-Sat NG Spectrometer. This is also the case for O 2 around 1270 nm that is used as a reference due to its 21% (0.21) constant mixing ratio in the dry atmosphere. The total column of each of the four gases can be determined by fitting the observed spectra with simulated spectra using the Levenberg–Marquardt (L-M) algorithm and the Monte Carlo method.
Here is a description of the method employed to determine the atmospheric gas concentrations that the Uvsq-Sat NG mission is set to observe.
Step 1
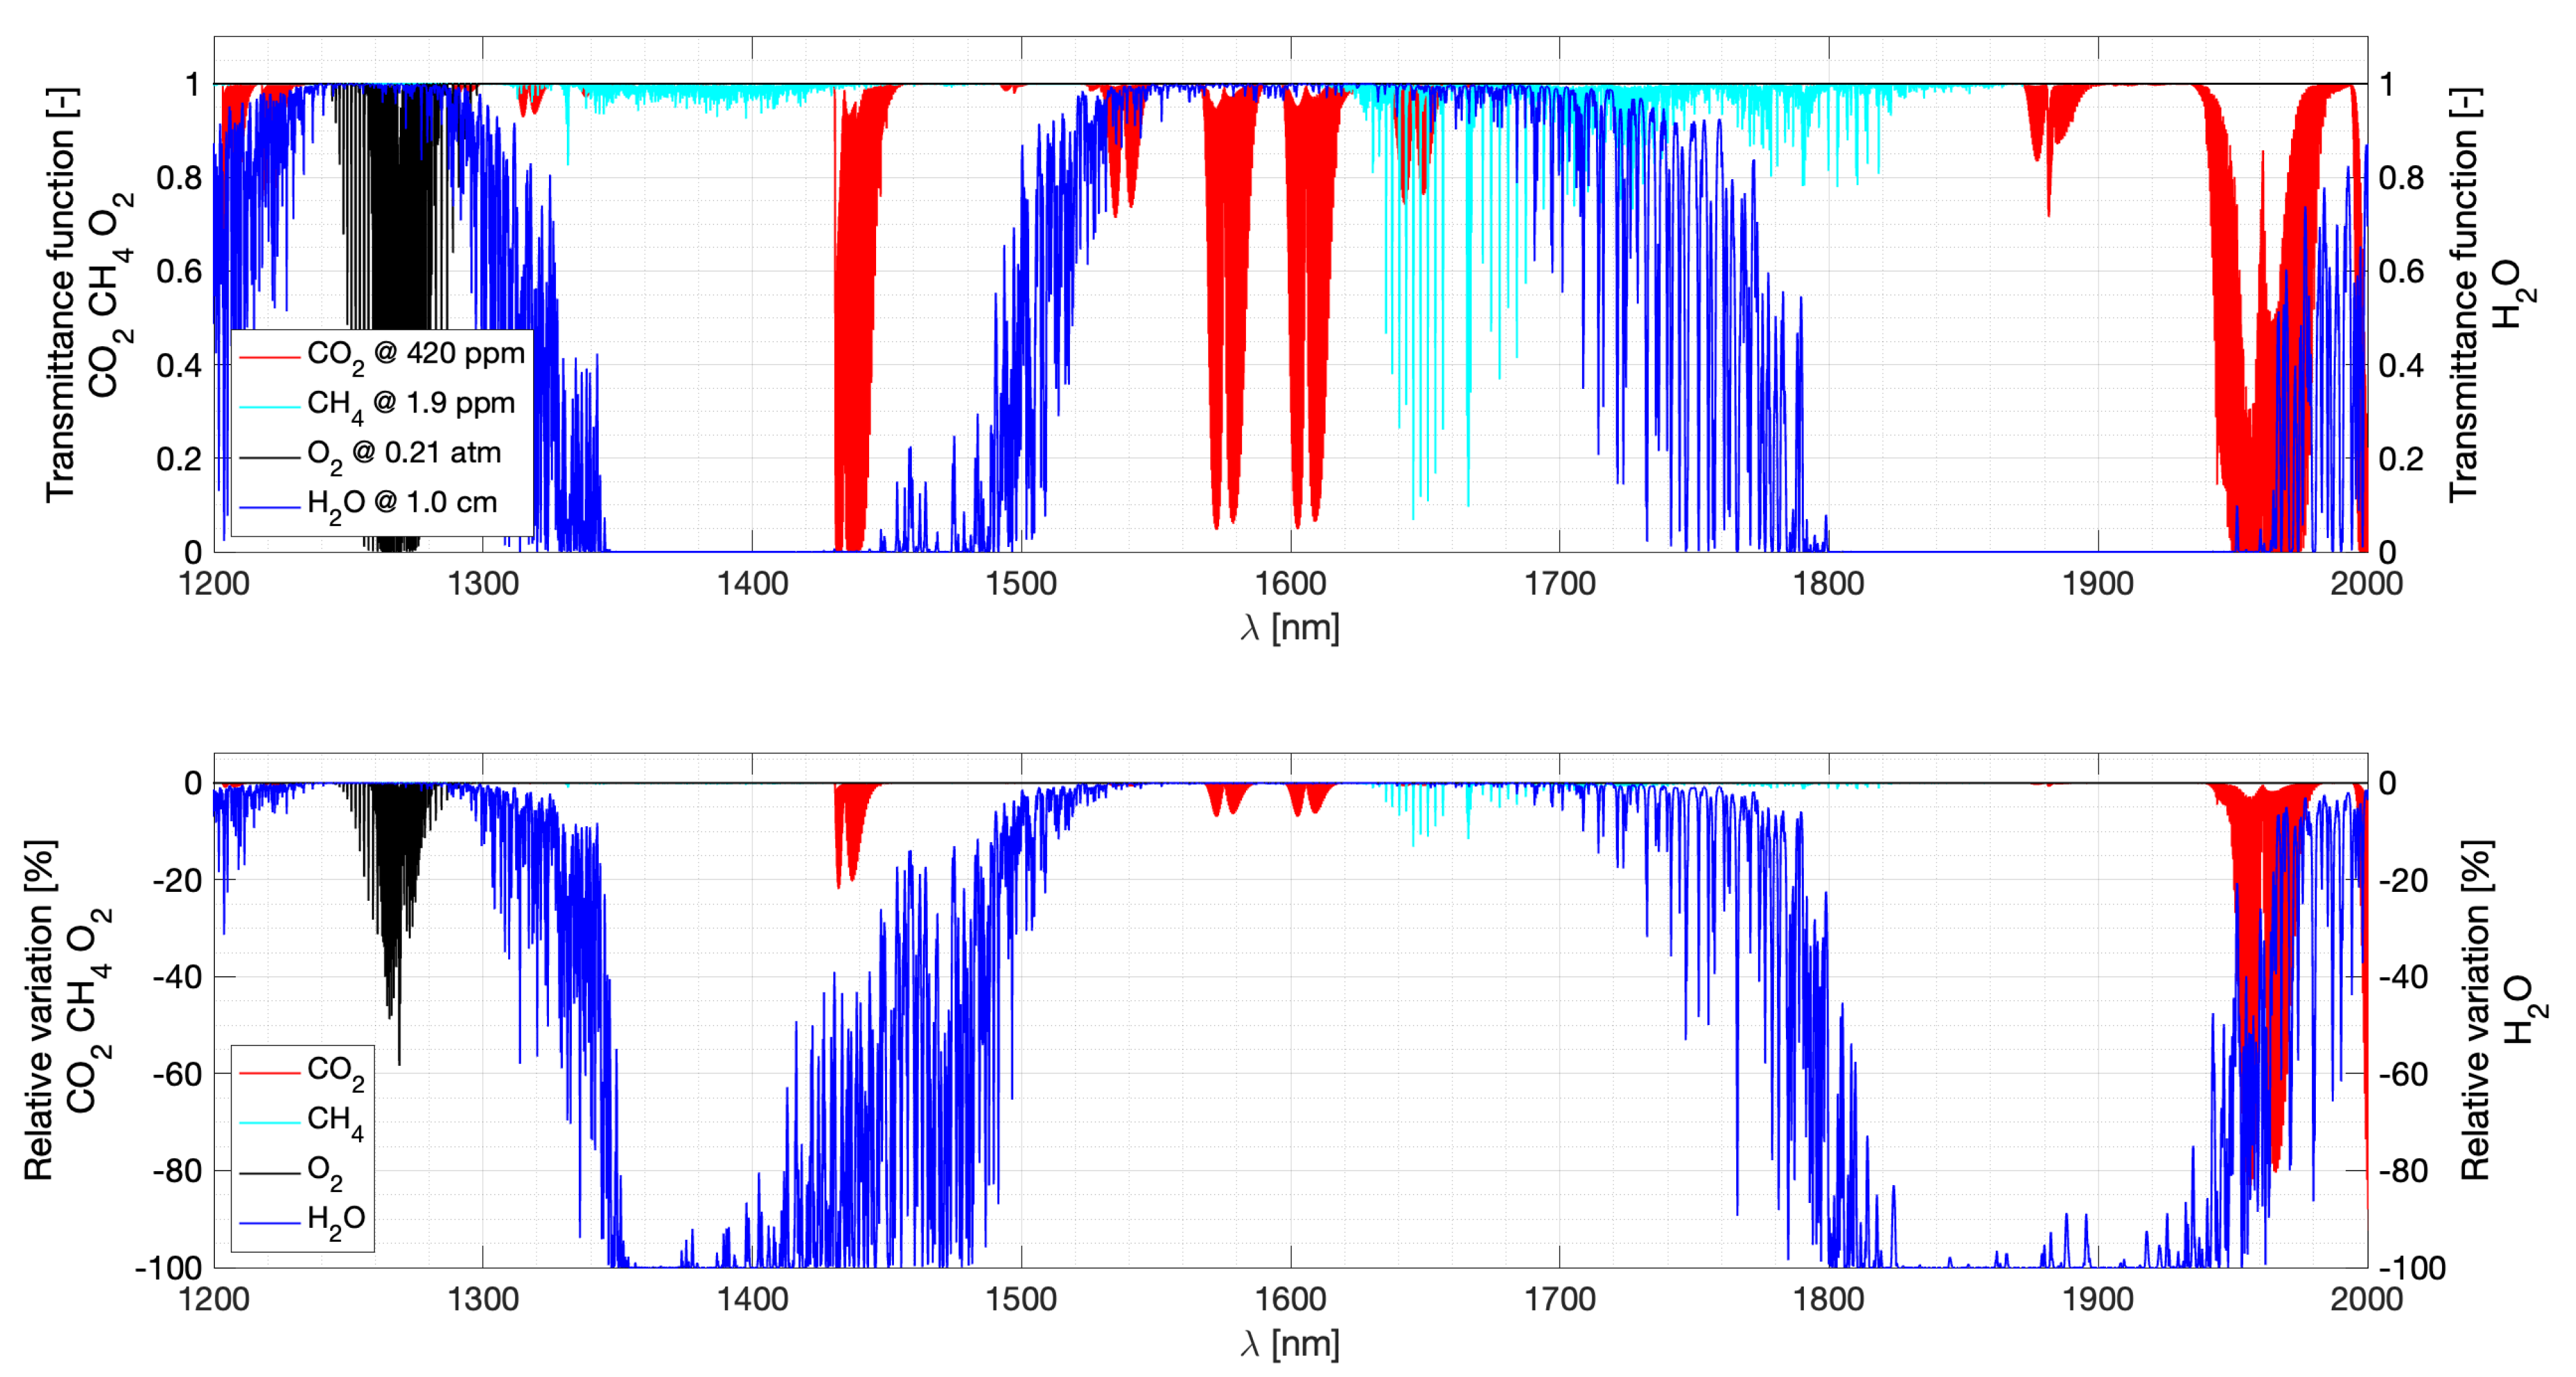
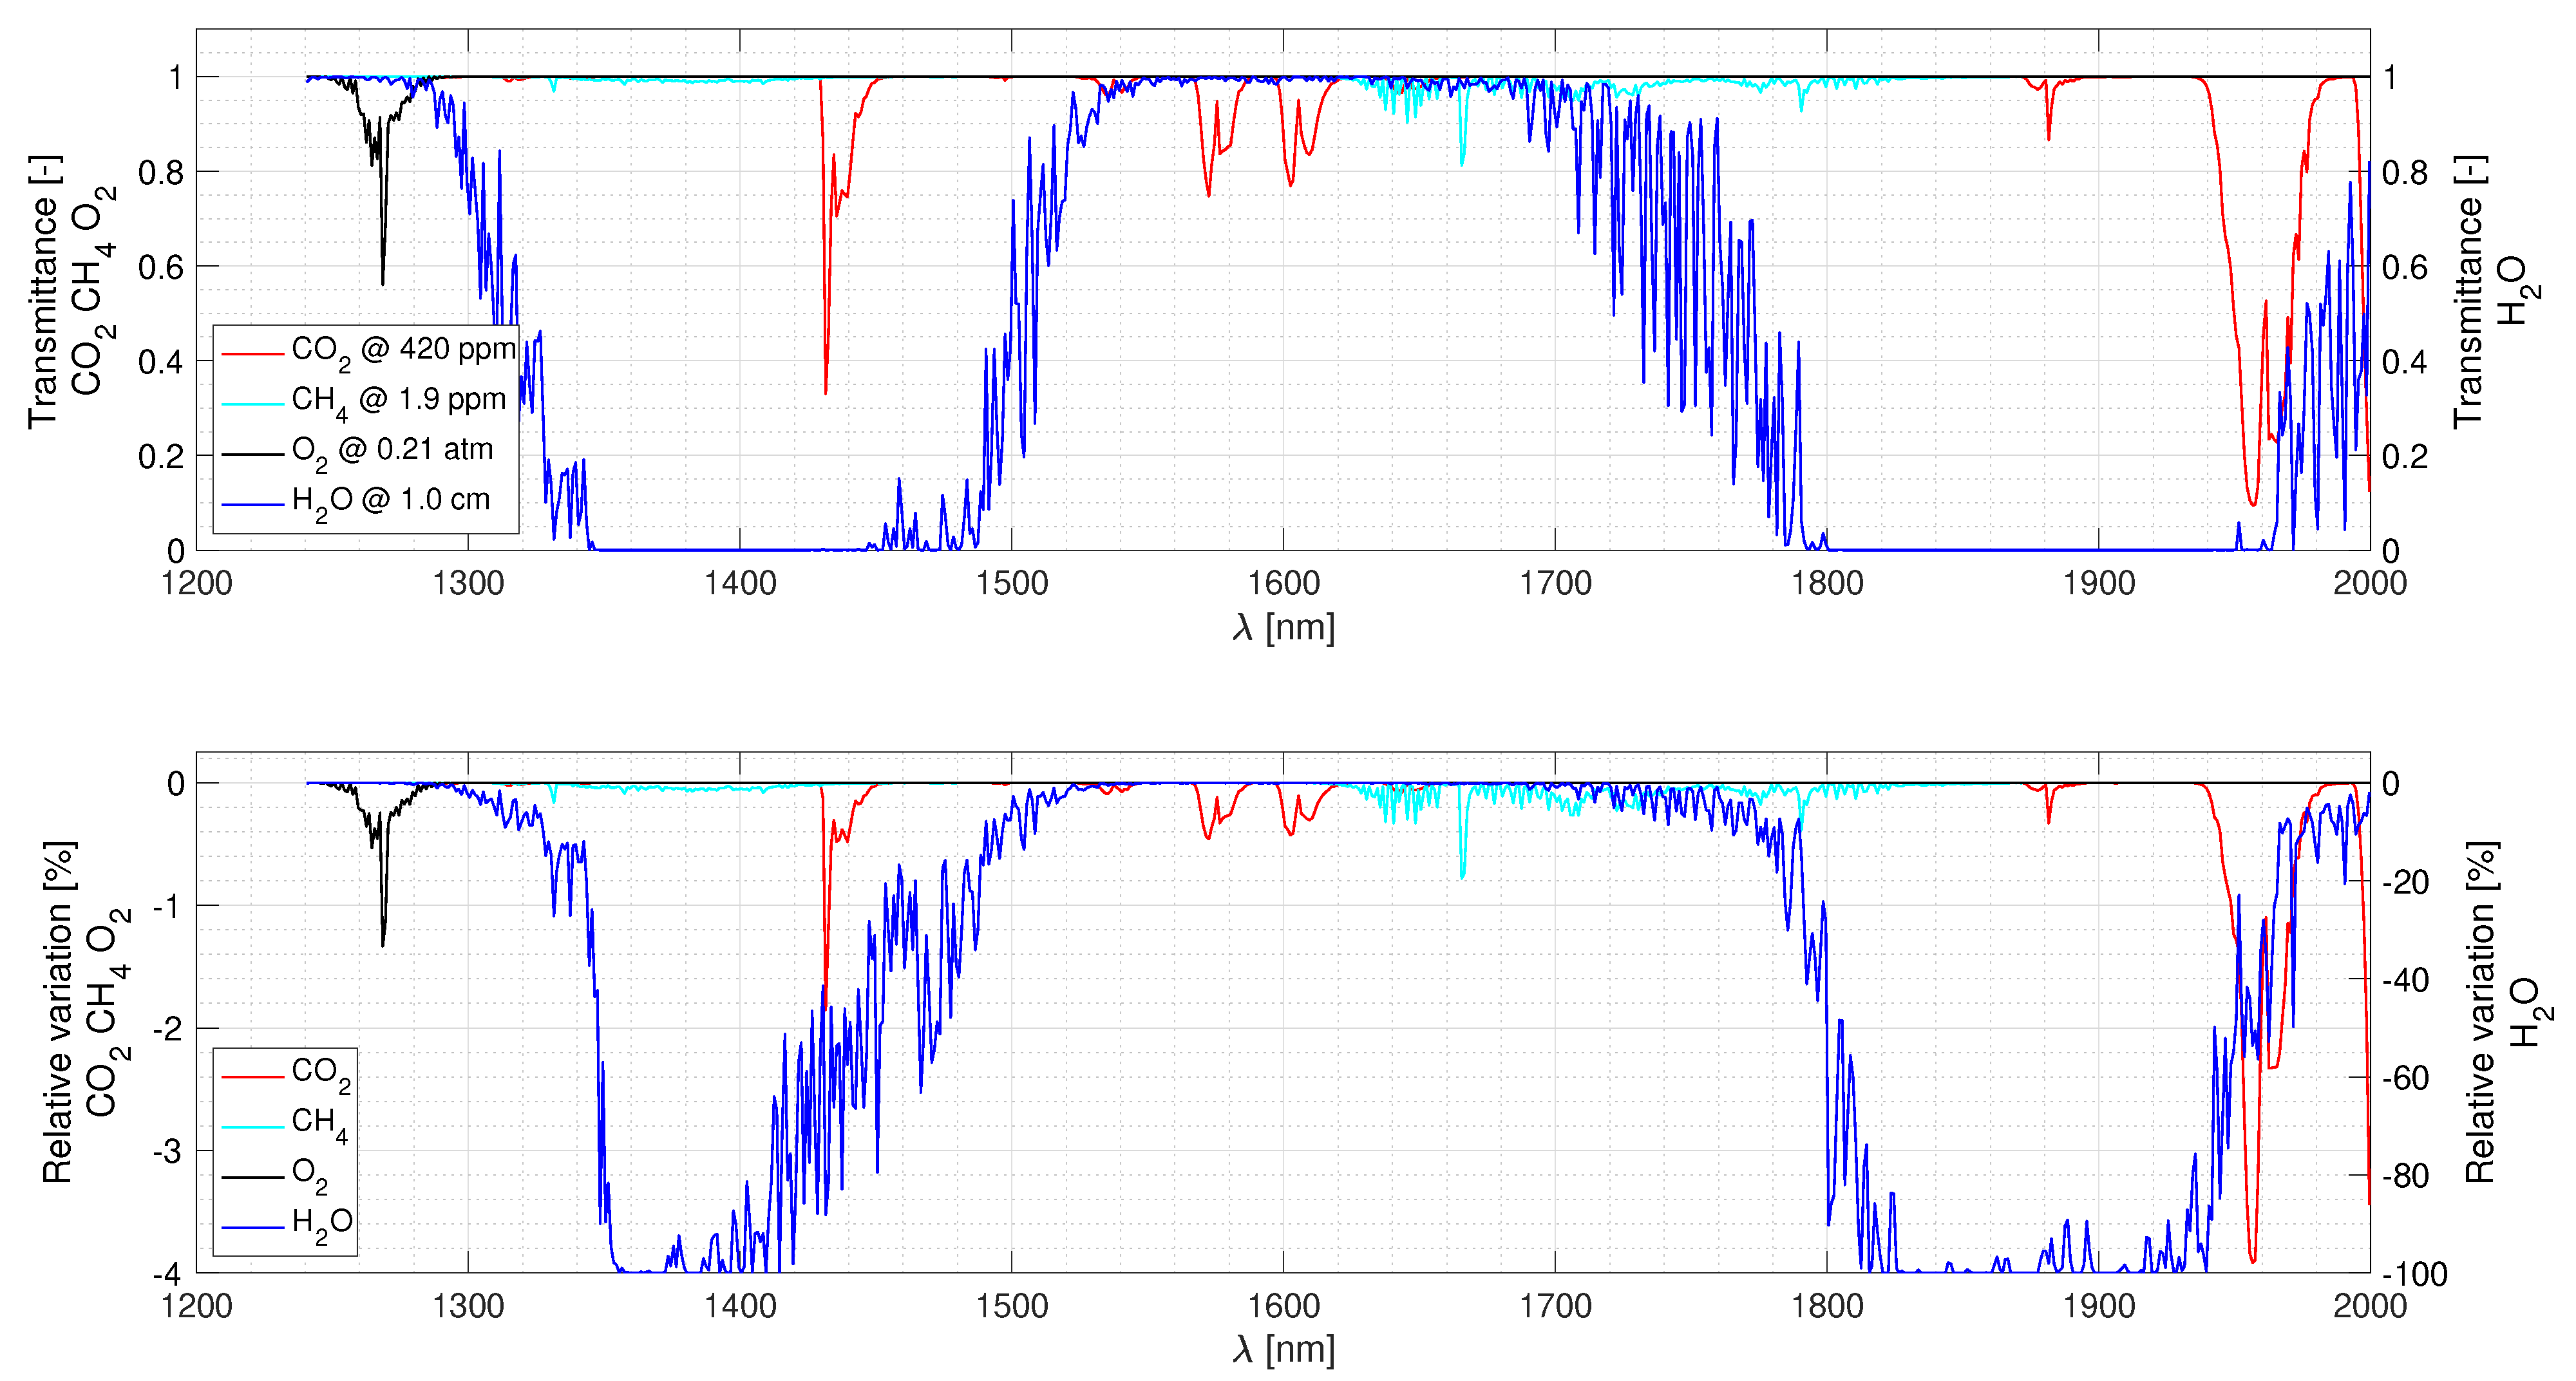
Recovering the atmospheric transmittance functions data files (CO 2 , CH 4 , O 2 , H 2 O at different concentrations). NIR transmission spectra are simulated using the High-Resolution Transmission Molecular Absorption (HITRAN) Database [31]. Spectra are computed at very high resolution ( Δ ν = 0.005 cm 1 ) in the wavenumber ( ν ) interval 4500 to 10,000 cm 1 . For CO 2 , CH 4 , and O 2 that are well mixed in the atmosphere, the pressure (P) is set to 500 hPa, which represents an average value between the bottom and the top of the atmosphere. For H 2 O, which is more abundant in the lower atmospheric layers, the pressure is set to 800 hPa. The temperature (T) is 250 K and a Voigt profile is considered for the HITRAN simulation. The optical path of length (L) of the simulation is different for each gas (for instance, under nominal mixing conditions, the values considered are 6.228 m for CO 2 , 0.028 m for CH 4 , 3113.840 m for O 2 , and 16.161 m for H 2 O). The absorption coefficient ( K N a ) is used for each gas. It represents a normalization of the absorption coefficient K a by the number N (cm 3 ) of absorbing molecules per unit gas volume. The dimensionless transmittance function ( TR ) for each gas is given by Equation (1).
TR ( ν , T , P , L ) = exp ( K N a ( ν , T , P ) · L )
Figure 4 (top panel) depicts the NIR dimensionless transmittance functions of various gases ( TR ( ν , T , P , L ) ) for a nominal mixing ratio (420 ppm for CO 2 , 1.9 ppm for CH 4 , 0.21 for O 2 , and 1.0 precipitable cm for H 2 O) as a function of wavelength ( λ ). Other dimensionless transmittance functions have been computed using different mixing ratios (for instance, 430 ppm for CO 2 , 2.0 ppm for CH 4 , 0.22 for O 2 , and 1.1 precipitable cm for H 2 O).
Figure 4 (bottom panel) displays dimensionless transmittance functions’ relative variations from a ’maximum’ mixing ratio to a nominal mixing ratio for each gas (CO 2 , CH 4 , O 2 , and H 2 O). To determine the sensitivity of the dimensionless transmittance functions to a change in the mixing ratio of a given gas, we compute the absorption spectrum for a nominal mixing ratio and for a mixing ratio with an increment added to this value (CO 2 (420 to 430 ppm), CH 4 (1.9 to 2.0 ppm), O 2 (0.21 to 0.22), and H 2 O (1.0 to 1.1 precipitable cm)).
Step 2
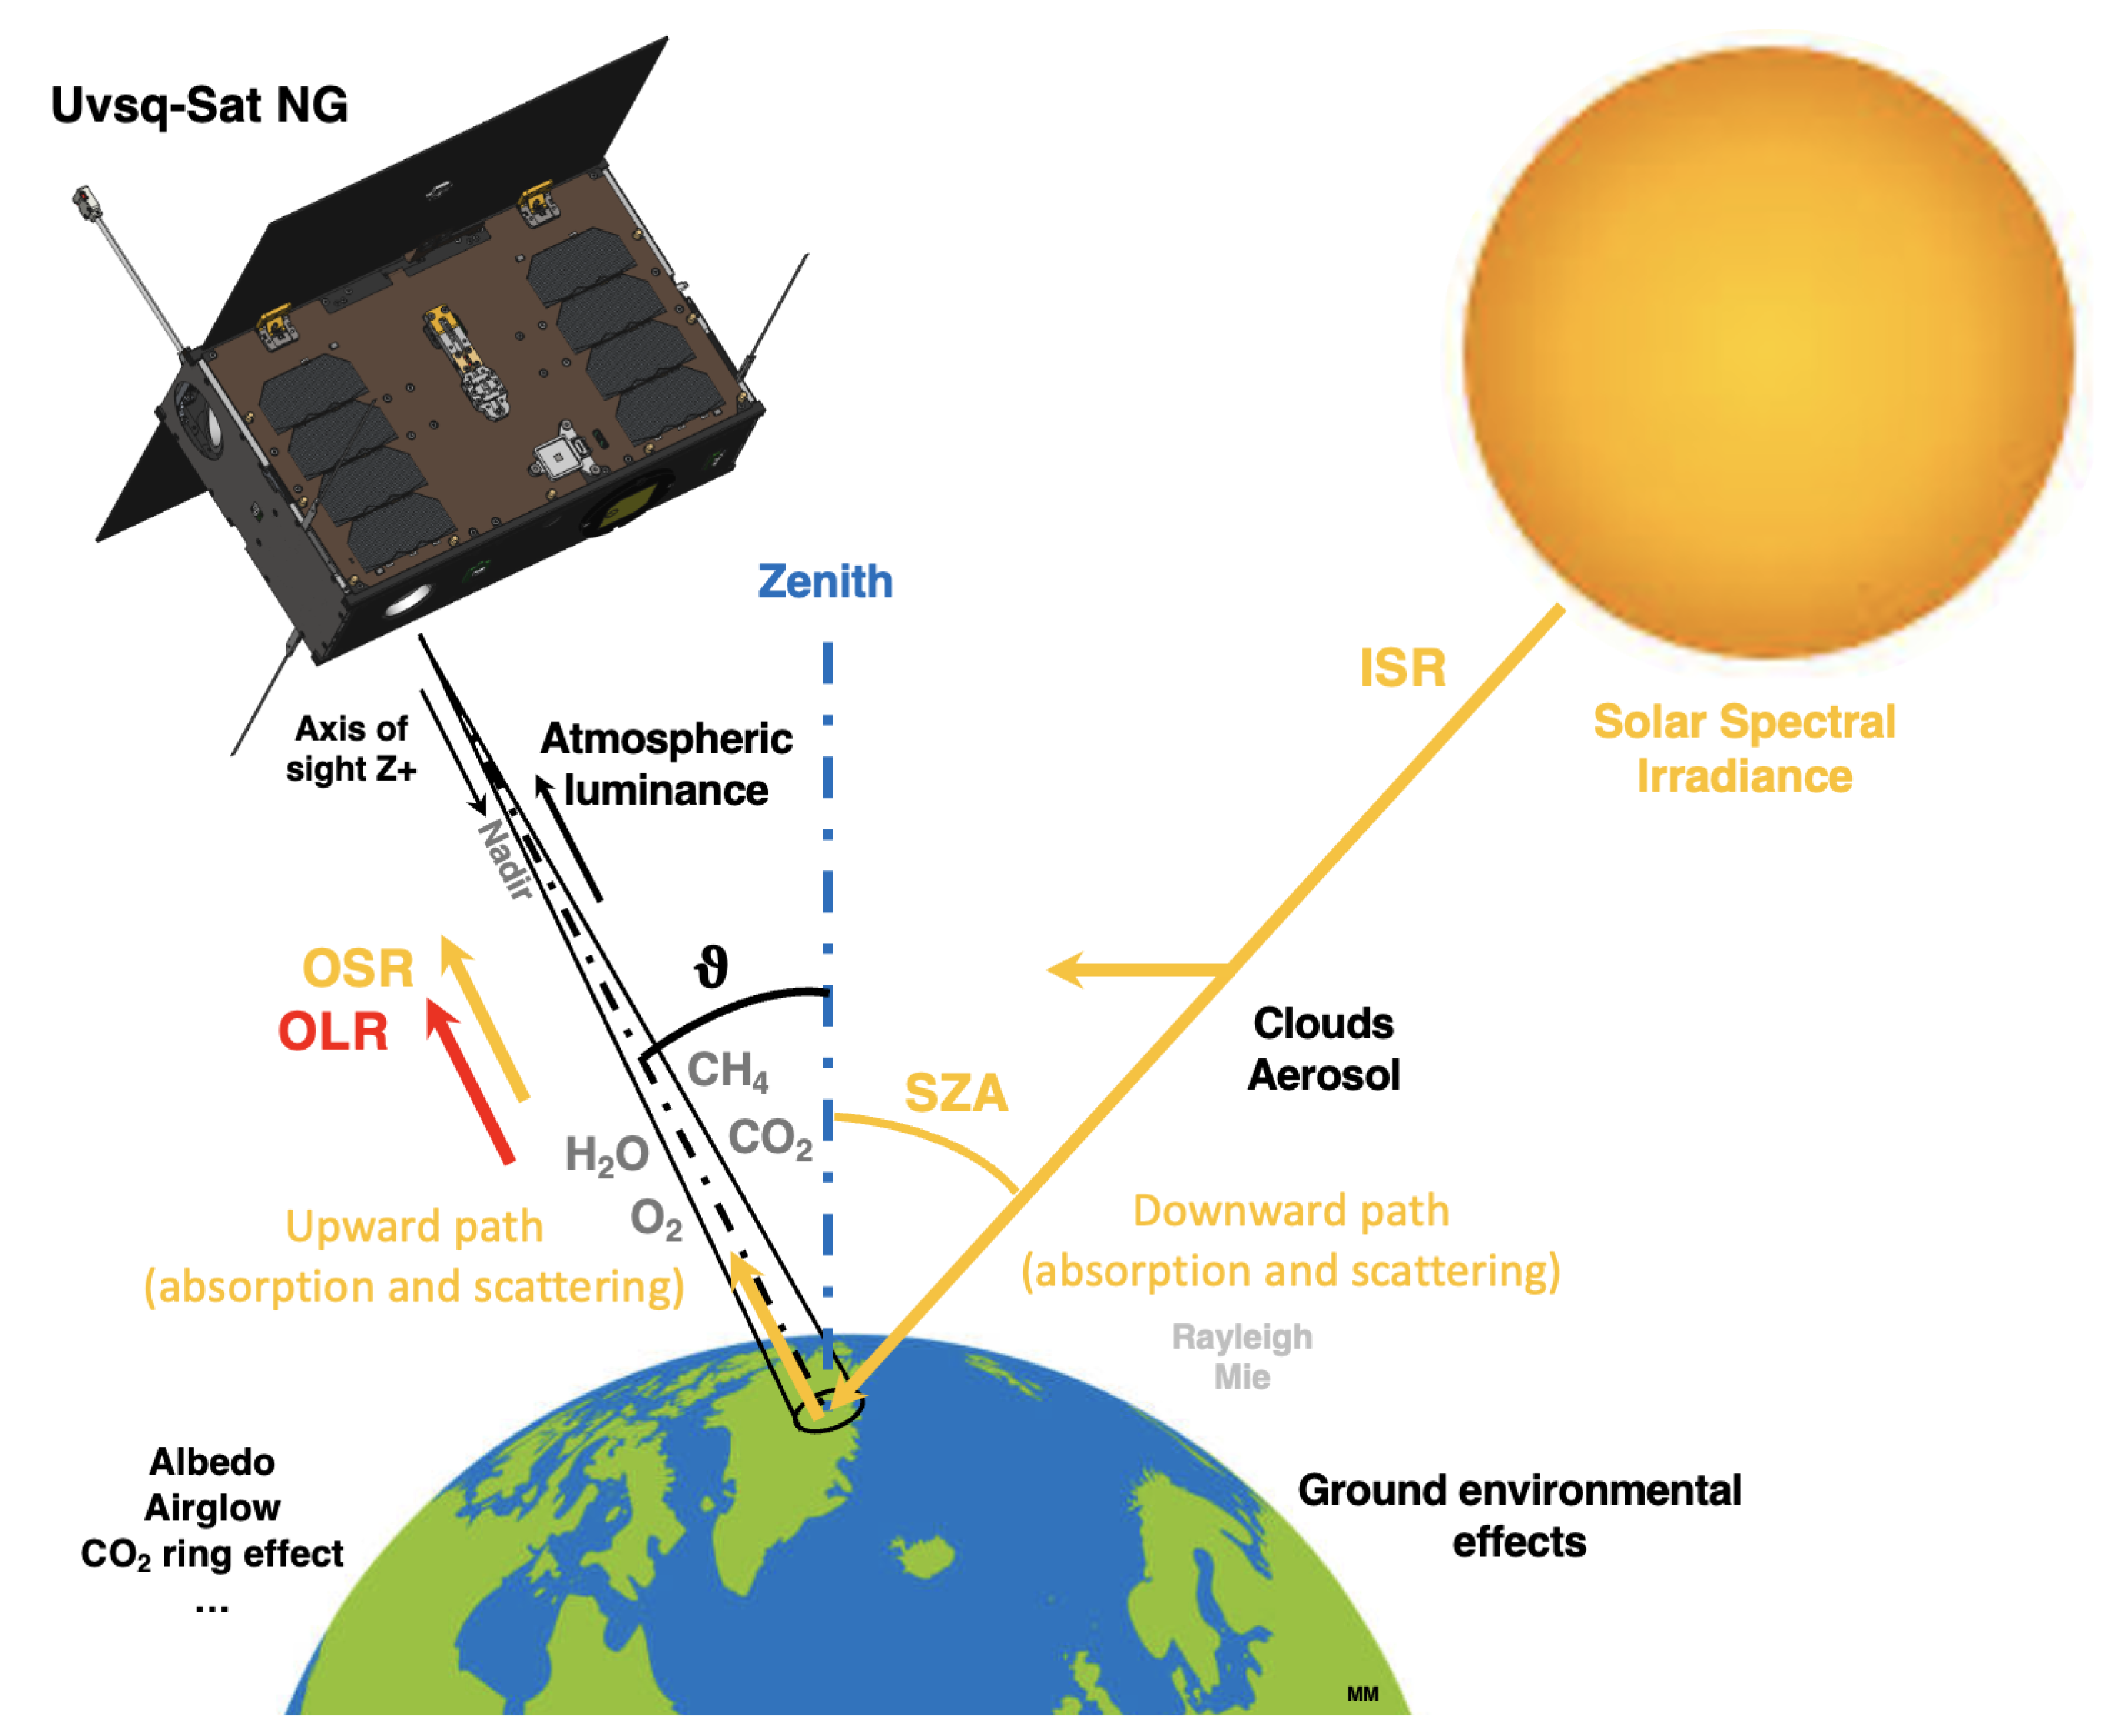
Normalization and convolution of atmospheric data to the Uvsq-Sat NG Spectrometer’s resolution. The data series are normalized, taking into account the Solar Zenith Angle ( S Z A ) and the satellite pointing axis ( θ ) between the Nadir and the Zenith (Equation (2)), as depicted in the diagram illustrated in Figure 3.
TR n ( λ , T , P , L ) = TR ( λ , T , P , L ) 1 cos ( θ ) + 1 cos ( S Z A )
The high-resolution dimensionless transmittance functions ( TR n ( λ , T , P , L ) ) must be degraded to the resolution of the Uvsq-Sat NG NIR Spectrometer. Indeed, the spectrometer has a finite bandpass (or resolution), which is determined with the sensitivity of the spectrometer. The bandpass is defined as the Full Width at Half Maximum (FWHM) of the spectrometer’s spectral response of the slit function ( S f L o R e s ), which depends on the wavelength ( λ ). The spectrometer slit functions and FWHM (assumed to fall within the range of 1 to 6 nm) will need to be measured accurately during ground-based calibration and Cal/Val as explained in Section 3.2.2. The convolution of the TR n ( λ , T , P , L ) high-resolution dimensionless transmittance functions via the Uvsq-Sat NG NIR Spectrometer slit functions ( S f L o R e s ) is given by the integral described in Equation (3). The integration interval ( Δ λ ) is defined using the width of the slit functions. This approach allows us to obtain dimensionless transmittance functions (Figure 5) at the spectrometer’s resolution ( TR n ( λ , T , P , L ) L o R e s ).
TR n ( λ ) L o R e s = TR n ( λ , T , P , L ) S f L o R e s = TR n ( λ , T , P , L ) · S f L o R e s ( λ λ ) d λ
Figure 5 shows that the spectral characteristics of the four gases remain distinguishable at the Uvsq-Sat NG NIR Spectrometer’s resolution, despite the attenuation and smoothing of absorption lines. These gases include O 2 near 1270 nm, CO 2 near 1600 nm, CH 4 near 1650 nm, and H 2 O at various wavelengths.
Step 3
Determination of the total dimensionless resulting transmittance function from the considered values of the gas mixing ratio. The total dimensionless resulting transmittance function ( TR n T o t ( λ , T , P , L ) , simplified to TR n T o t ( λ ) ) is obtained from Equation (4). It depends on the desired mixing ratio, the nominal mixing ratio and the ’maximum’ mixing ratio of each gas.
TR n T o t ( λ ) = TR n C O 2 ( λ ) · TR n C H 4 ( λ ) · TR n O 2 ( λ ) · TR n H 2 O ( λ ) Using the following linear interpolations : TR n C O 2 ( λ ) = TR n C O 2 = 420 ( λ ) + C 1 · TR n C O 2 = 430 ( λ ) TR n C O 2 = 420 ( λ ) TR n C H 4 ( λ ) = TR n C H 4 = 1.9 ( λ ) + C 2 · T R n C H 4 = 2.0 ( λ ) TR n C H 4 = 1.9 ( λ ) TR n O 2 ( λ ) = TR n O 2 = 0.21 ( λ ) + C 3 · TR n O 2 = 0.22 ( λ ) TR n O 2 = 0.21 ( λ ) TR n H 2 O ( λ ) = TR n H 2 O = 1.0 ( λ ) + C 4 · TR n H 2 O = 1.1 ( λ ) TR n H 2 O = 1.0 ( λ )
where C 1 , C 2 , C 3 , and C 4 are normalized coefficients between 0 and 1 that determine a desired mixing ratio of the different gases. Considering that C 1 , C 2 , C 3 , and C 4 are all equal to 0.5, this results in initial corresponding mixing ratios of 425 ppm for CO 2 , 1.95 ppm for CH 4 , 0.215 for O 2 , and 1.05 precipitable cm for H 2 O.
Step 4
Determination of the Uvsq-Sat NG NIR Spectrometer theoretical normalized dimensionless transmittance function. The Uvsq-Sat NG NIR Spectrometer has its own instrumental characteristics and a SNR that limit its performance. The ’true’ dimensionless signal that will be observed ( TR n T o t ( λ ) in this scenario) will therefore be affected by the observations made via the spectrometer. In order to assess the anticipated performance of the Uvsq-Sat NG NIR Spectrometer, Gaussian noise is subsequently introduced to the simulated spectra ( TR n T o t ( λ ) ) prior to conducting the Levenberg–Marquardt spectral inversion. This inversion is performed while considering an adjustable SNR within the range of 50 to 5000. Equation (5) allows us to determine the dimensionless signal ( TR S p e c t r o ( λ ) ) as it can be observed via the Uvsq-Sat NG NIR Spectrometer, considering its spectral resolution (between 1 and 6 nm) and SNR (around 2000, which would correspond to an excellent value).
TR S p e c t r o ( λ ) = TR n T o t ( λ ) + TR n T o t ( λ ) S N R ( λ ) · N ( 0 , 1 )
where N ( 0 , 1 ) represents a random Gaussian noise with a mean of 0 and a standard deviation of 1.
Step 5
Utilization of the Levenberg–Marquardt algorithm to determine normalized coefficients C 1 , C 2 , C 3 , and C 4 , which correspond to the concentrations of the four gases as they could be observed via the Uvsq-Sat NG Spectrometer. From the dimensionless signal ( TR S p e c t r o ( λ ) ), the interpolation coefficients ( C 1 , C 2 , C 3 , and C 4 ) are determined using the Levenberg–Marquardt algorithm, which is commonly used for solving non-linear least squares problems. Here is a description of the method:
  • Initialization: Start with an initial estimate of the interpolation coefficients C 1 , C 2 , C 3 , and C 4 (all values are set to 1), as well as the parameter β (regularization factor). Choose a starting value for β (typically a small value).
  • Residual Calculation: Use the current interpolation coefficients to calculate the model predictions. Then, subtract these predictions from the observed data to obtain the residuals.
  • Jacobian Matrix Calculation: It represents the partial derivatives of the residuals with respect to the interpolation coefficients. It quantifies how each coefficient contributes to the residuals.
  • Hessian Matrix Calculation: Calculate the Hessian matrix, which is the second derivative matrix of the residuals with respect to the coefficients. It helps adjust the weighting between the model terms and regularization.
  • Coefficient Update Calculation: Calculate the coefficient update using the formula of the Levenberg–Marquardt algorithm:
    Δ C = J T J + β · diag ( J T J ) 1 · J T · R
    where J is the Jacobian matrix and R is the residuals function. The β · diag ( J T J ) helps to enhance and stabilize the matrix, while noise will be incorporated into R.
  • Evaluation of Improvement: Calculate the potential improvement by comparing the norm of residuals before and after the coefficient update. If the improvement is significant, accept the update. Otherwise, adjust β and repeat.
  • Iterative Repetition: Repeat stages 2 (Initialization) through 6 (Evaluation of Improvement) until the residuals either converge to a minimum or meet a stopping criterion. Such criteria can include reaching a maximum number of iterations or observing only minor variations in the coefficients.
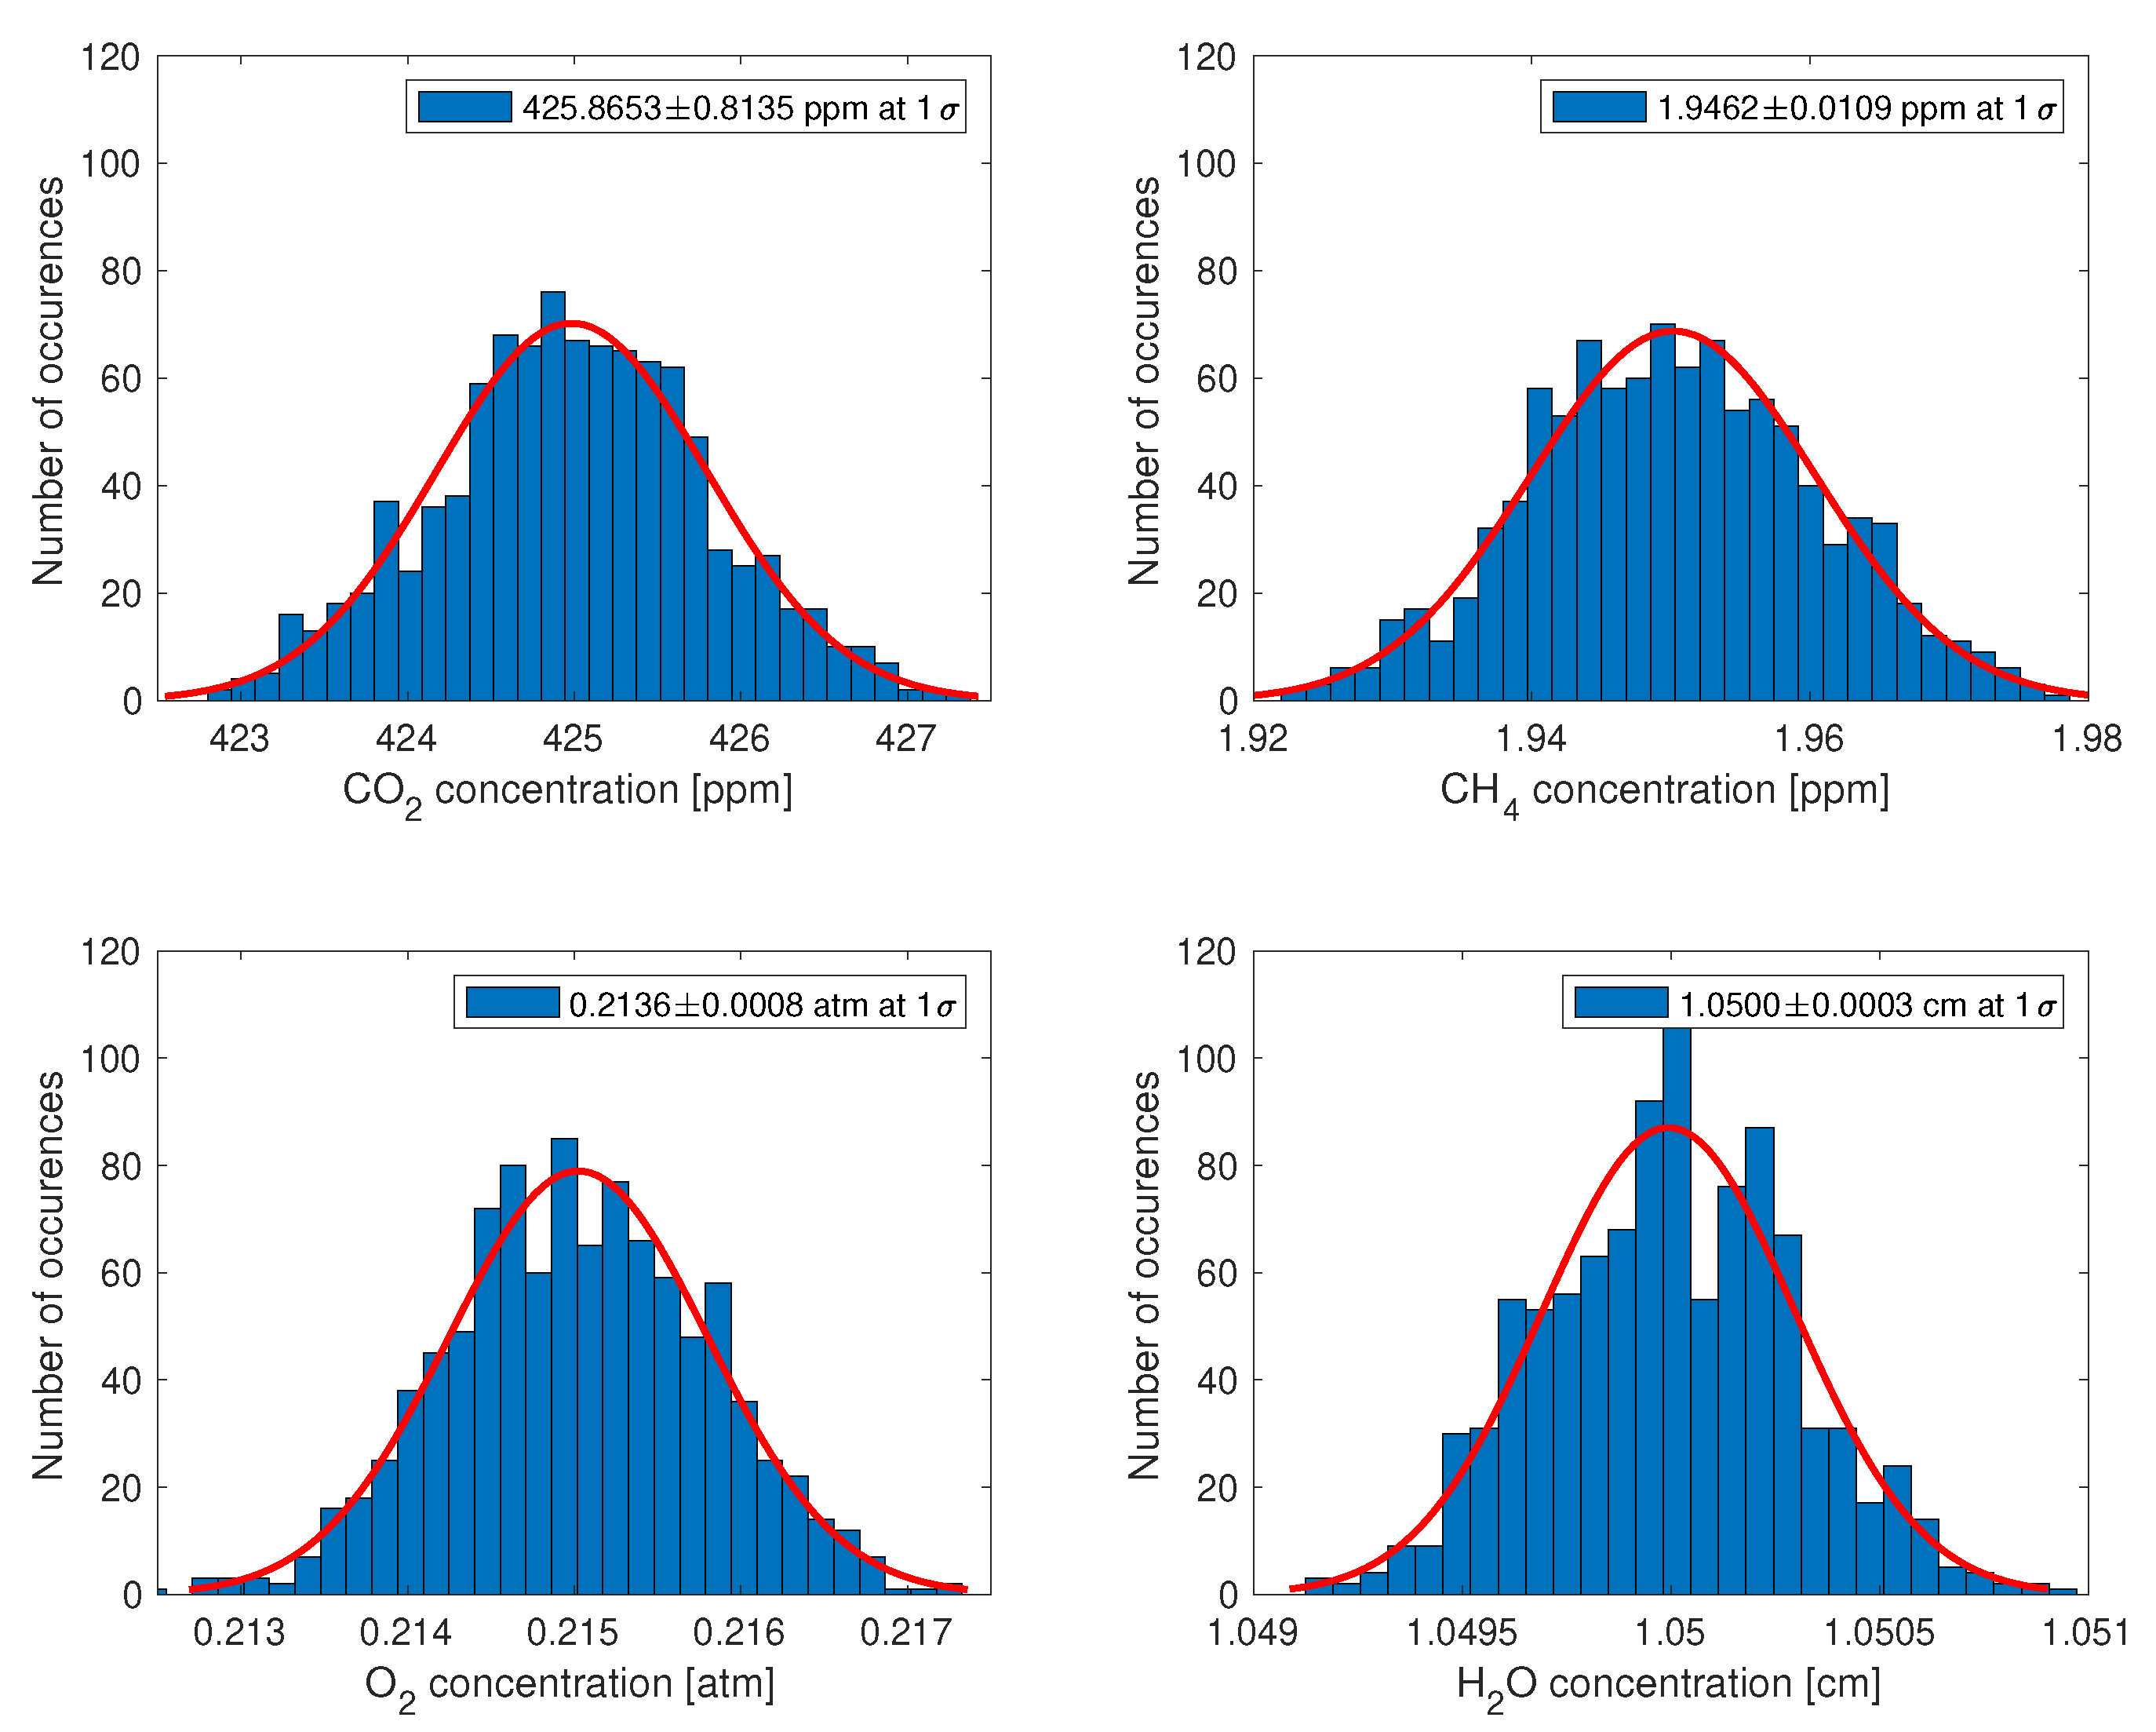
The Levenberg–Marquardt algorithm combines aspects of stochastic gradient and Gauss–Newton methods to perform iterative coefficient updates while managing regularization with β . This allows for finding optimal coefficients that minimize the differences between model predictions and observed data while avoiding overfitting. Figure 6 presents an example of data retrieval from the simulated Uvsq-Sat NG Spectrometer (spectral resolution of 1 nm and SNR of 50), as achieved through the Levenberg–Marquardt algorithm.
Step 6
Quantification of uncertainties on the concentrations of gases as they can be observed via the Uvsq-Sat NG NIR Spectrometer (Figure 7).
The Monte Carlo method is used to estimate the uncertainties of the normalized coefficients C 1 , C 2 , C 3 , and C 4 . It represents a powerful tool for addressing the uncertainties problem. The Levenberg–Marquardt algorithm is iteratively used in a loop to obtain multiple different sets of coefficients. In each iteration, a different random Gaussian noise is added. This procedure enables us to plot the associated Gaussians for each coefficient, contributing to the determination of the parameter corresponding to the uncertainty in the sought measurement. Finally, the normalized coefficients C 1 , C 2 , C 3 , and C 4 are converted into physical values to provide the gas concentrations (CO 2 , CH 4 , O 2 , and H 2 O), as they could be observed via the Uvsq-Sat NG Spectrometer from its dimensionless signal ( TR S p e c t r o ( λ ) ). This approach allows us to obtain the uncertainties in gas concentrations determination with a 1–Sigma confidence level.
Figure 7 depicts an illustrative case of extracting the concentrations of the four analyzed gases (CO 2 , CH 4 , O 2 , and H 2 O) from the simulated Uvsq-Sat NG Spectrometer (spectral resolution of 1 nm and SNR of 50).
The uncertainties in the concentrations retrieval of different atmospheric gases are significant (±11.3 ppm for CO 2 , ±120.2 ppb for CH 4 ), considering the extremely low SNR values of the Uvsq-Sat NG NIR Spectrometer. A lower SNR signifies that the noise can obscure or distort the signal, leading to less dependable observations. In contrast, a higher SNR implies that the strength of the desired signal is considerably higher than the level of unwanted noise, resulting in more accurate and precise measurements.
Another analysis was conducted to investigate the impact of the spectrometer’s spectral resolution and the influence of the SNR on the retrieval of gas concentrations. Table 5 provides a summary of these results, which emphasize the importance of having a spectrometer with a SNR of at least 1000, when its spectral resolution is 6 nm. In all the conducted simulations, the SNR is assumed to remain constant across wavelengths. A sensitivity analysis could be performed by allowing the SNR to change across different wavelengths.
Considering that the Uvsq-Sat NG NIR Spectrometer can have a spectral resolution of 6 nm and a SNR of 2000, the retrieval of greenhouse gases (CO 2 and CH 4 ) using the proposed method is fully compatible with the scientific requirements stated in Section 2. Figure 8 illustrates the results obtained with such a configuration. The retrieval of concentrations for the other gases also remains excellent with this instrumental configuration.
Parsing out specific details from this intricate dataset, such as the concentration of a particular greenhouse gas, is challenging. Inversion methods offer mathematical techniques to dissect this convoluted signal, but the intricacies of the atmospheric interactions and the sheer complexity of the data make these methods intricate and demanding.
Additional research could be undertaken to explore the inversion outcomes when clouds and aerosols are present, as they have the potential to introduce biases in the determination of GHG concentrations (CO 2 and CH 4 ) observed via the Uvsq-Sat NG NIR Spectrometer. The Uvsq-Sat NG measurements can also be affected by airglow, which is a light emitted by oxygen molecules in the high atmosphere. The oxygen airglow spectrum at 1.27 μ m closely resembles the O 2 absorption spectrum, which is used to estimate the sunlight atmospheric path and serves as a proxy for airmass. For instance, in the case of the MicroCarb mission, two wavelength bands are used for CO 2 concentration measurement normalization: the O 2 A band (0.76 μ m) and the absorption band at 1.27 μ m. The O 2 A band (0.76 μ m) is used to derive the O 2 column, which contributes in understanding the atmospheric path length and scattering effects [32]. This information is crucial for accurately estimating the concentration of CO 2 , given that the CO 2 absorption band occurs at a distinct wavelength (1.6 μ m). The spectral distance between the O 2 A band and the CO 2 absorption band introduces uncertainties due to varying aerosol properties and atmospheric scattering effects. However, using the O 2 absorption band at 1.27 μ m, which is closer to the CO 2 band, can help to mitigate some of these uncertainties. In the context of MicroCarb, the instrument’s spectral resolution clearly enables the differentiation of airglow absorption, which disturbs the measurement of O 2 by filling the absorption lines. However, this capability is not achievable with Uvsq-Sat NG due to the insufficient spectral resolution of its spectrometer (1 to 6 nm in the wavelength range of 1200 to 2000 nm). This correction for the Uvsq-Sat NG NIR Spectrometer needs to be carried out using the Reactive Processes Ruling the Ozone Budget in the Stratosphere (REPROBUS) 3D chemistry transport model [33]. Airglow can also be evaluated using Uvsq-Sat NG measurements over the ocean, which has a very low albedo. For all satellites measuring CO 2 in Nadir mode as Uvsq-Sat NG, the goal is not to perform inversions in the presence of clouds but rather to conduct a screening to eliminate all measurements with clouds. The onboard Uvsq-Sat NG NanoCam precisely provides the information about ‘the sky’s condition’.

5. Conclusions

Uvsq-Sat NG is designed to enable observations of Earth’s Radiation Budget and greenhouse gases such as carbon dioxide or methane. Regarding Earth’s Radiation Budget, the measurements from this satellite will continue the work already conducted with Uvsq-Sat (launched on January 2021) and Inspire-Sat 7 (launched on April 2023). Although Uvsq-Sat NG is the third SmallSat, it only shares some subsystems with the first two. It will also carry an NIR Spectrometer to assess GHGs’ atmospheric concentrations through observations in the wavelength range of 1200 to 2000 nm. Thus, Uvsq-Sat NG will focus on the restitution of the concentration of certain gases in the atmosphere (CO 2 , CH 4 , O 2 , and H 2 O). A methodology has been devised to extract greenhouse gas concentrations (carbon dioxide and methane) from the forthcoming observations of the Uvsq-Sat NG NIR Spectrometer. The results obtained emphasize the importance of having a spectrometer with specific instrumental characteristics (a SNR of at least 1000 with a spectral resolution of 6 nm) to ensure the performance of the conducted measurements. They also highlight the importance of ground calibrations, in-orbit calibrations, and models (REPROBUS) to correct the data and mitigate biases in the determination of greenhouse gas concentrations. Uvsq-Sat NG thus drives technological advancements through miniaturization and a cost-effective platform, offering a way to deploy an affordable constellation dedicated to Essential Climate Variables.

Author Contributions

All authors formulated and directed the methodology and results analysis and prepared the manuscript. All authors have read and agreed to the published version of the manuscript.

Funding

This work received funding from Centre National de la Recherche Scientifique (CNRS, France), Université de Versailles Saint-Quentin-en-Yvelines (UVSQ, France), Académie de Versailles (78, France), Département des Yvelines (78, France), Communauté d’Agglomération de Saint-Quentin-en-Yvelines (SQY, France), and Centre Paris-Saclay des Sciences Spatiales (CPS3, France).

Data Availability Statement

The solar reference spectra used in this work are available at https://cdsarc.cds.unistra.fr/viz-bin/cat/VI/159—data accessible since 6 September 2023.

Acknowledgments

The Uvsq-Sat NG team acknowledges support from the Centre National de la Recherche Scientifique (CNRS, France), the Université Paris-Saclay (France), the Sorbonne Université (SU, France), the Université de Versailles Saint-Quentin-en-Yvelines (UVSQ, France), the Académie de Versailles (78, France), the Communauté d’Agglomération de Saint-Quentin-en-Yvelines (SQY, France), the Département des Yvelines (78, France), the Laboratory for Atmospheric and Space Physics (Dan Baker, LASP, USA), the National Central University (Loren Chang, NCU, Taiwan), the Nanyang Technological University (Amal Chandran, NTU, Singapore), the South African National Space Agency (Martin Snow, SANSA, South Africa), and the Committee on Space Research (Jean-Claude Worms, COSPAR, France). The authors also thankfully acknowledge the Ministère de l’Enseignement supérieur et de la Recherche (MESR, France) for their support. This work is supported by the Programme National Soleil Terre (PNST, France) of CNRS/INSU (France) co-funded by Centre National d’Études Spatiales (CNES, France) and Commissariat à l’énergie atomique (CEA, France). The Uvsq-Sat NG team thanks all students who contributed to the emergence of this scientific and educational program.

Conflicts of Interest

The authors declare no conflict of interest.

References

  1. Friedlingstein, P.; O’Sullivan, M.; Jones, M.W.; Andrew, R.M.; Gregor, L.; Hauck, J.; Le Quéré, C.; Luijkx, I.T.; Olsen, A.; Peters, G.P.; et al. Global Carbon Budget 2022. Earth Syst. Sci. Data 2022, 14, 4811–4900. [Google Scholar] [CrossRef]
  2. McCarthy, M.P.; Best, M.J.; Betts, R.A. Climate change in cities due to global warming and urban effects. Geophys. Res. Lett. 2010, 37, L09705. [Google Scholar] [CrossRef]
  3. Lamb, W.F.; Wiedmann, T.; Pongratz, J.; Andrew, R.; Crippa, M.; Olivier, J.G.J.; Wiedenhofer, D.; Mattioli, G.; Khourdajie, A.A.; House, J.; et al. A review of trends and drivers of greenhouse gas emissions by sector from 1990 to 2018. Environ. Res. Lett. 2021, 16, 073005. [Google Scholar] [CrossRef]
  4. Stephens, G.L.; Li, J.; Wild, M.; Clayson, C.A.; Loeb, N.; Kato, S.; L’Ecuyer, T.; Stackhouse, P.W.; Lebsock, M.; Andrews, T. An update on Earth’s energy balance in light of the latest global observations. Nat. Geosci. 2012, 5, 691–696. [Google Scholar] [CrossRef]
  5. Rising, J.; Tedesco, M.; Piontek, F.; Stainforth, D.A. The missing risks of climate change. Nature 2022, 610, 643–651. [Google Scholar] [CrossRef]
  6. Douville, H. Robust and perfectible constraints on human-induced Arctic amplification. Commun. Earth Environ. 2023, 4, 283. [Google Scholar] [CrossRef]
  7. Bryce and Space Technology. SmallSat by the Numbers. 2022. Available online: https://brycetech.com/reports/report-documents/Bryce_Smallsats_2022.pdf (accessed on 28 September 2022).
  8. Meftah, M.; Damé, L.; Keckhut, P.; Bekki, S.; Sarkissian, A.; Hauchecorne, A.; Bertran, E.; Carta, J.P.; Rogers, D.; Abbaki, S.; et al. UVSQ-SAT, a Pathfinder CubeSat Mission for Observing Essential Climate Variables. Remote Sens. 2019, 12, 92. [Google Scholar] [CrossRef]
  9. Meftah, M.; Boust, F.; Keckhut, P.; Sarkissian, A.; Boutéraon, T.; Bekki, S.; Damé, L.; Galopeau, P.; Hauchecorne, A.; Dufour, C.; et al. INSPIRE-SAT 7, a Second CubeSat to Measure the Earth’s Energy Budget and to Probe the Ionosphere. Remote Sens. 2022, 14, 186. [Google Scholar] [CrossRef]
  10. Meftah, M.; Boutéraon, T.; Dufour, C.; Hauchecorne, A.; Keckhut, P.; Finance, A.; Bekki, S.; Abbaki, S.; Bertran, E.; Damé, L.; et al. The UVSQ-SAT/INSPIRESat-5 CubeSat Mission: First In-Orbit Measurements of the Earth’s Outgoing Radiation. Remote Sens. 2021, 13, 1449. [Google Scholar] [CrossRef]
  11. Wielicki, B.A.; Barkstrom, B.R.; Harrison, E.F.; Lee, R.B., III; Smith, G.L.; Cooper, J.E. Clouds and the Earth’s Radiant Energy System (CERES): An Earth Observing System Experiment. Bull. Am. Meteorol. Soc. 1996, 77, 853–868. [Google Scholar] [CrossRef]
  12. Pilewskie, P.; Hakuba, M.; Stephens, G. The Future of Earth Radiation Budget Observations Beyond CERES: Libera and Continuity of the ERB Climate Data Record. In Proceedings of the EGU General Assembly Conference Abstracts, Vienna, Austria, 23–28 April 2023. No. EGU–17097. [Google Scholar] [CrossRef]
  13. von Schuckmann, K.; Palmer, M.D.; Trenberth, K.E.; Cazenave, A.; Chambers, D.; Champollion, N.; Hansen, J.; Josey, S.A.; Loeb, N.; Mathieu, P.P.; et al. An imperative to monitor Earth’s energy imbalance. Nat. Clim. Chang. 2016, 6, 138–144. [Google Scholar] [CrossRef]
  14. Loeb, N.G.; Johnson, G.C.; Thorsen, T.J.; Lyman, J.M.; Rose, F.G.; Kato, S. Satellite and Ocean Data Reveal Marked Increase in Earth’s Heating Rate. Geophys. Res. Lett. 2021, 48, e93047. [Google Scholar] [CrossRef]
  15. Loeb, N.; Thorsen, T.; Ham, S.H.; Rose, F.; Kato, S. Observational Assessment of Changes in Earth’s Energy Imbalance Since 2000. In Proceedings of the EGU General Assembly Conference Abstracts, Vienna, Austria, 23–28 April 2023. No. EGU–2962. [Google Scholar] [CrossRef]
  16. Burrows, J.; Hölzle, E.; Goede, A.; Visser, H.; Fricke, W. SCIAMACHY—Scanning imaging absorption spectrometer for atmospheric chartography. Acta Astronaut. 1995, 35, 445–451. [Google Scholar] [CrossRef]
  17. Bovensmann, H.; Burrows, J.P.; Buchwitz, M.; Frerick, J.; Noël, S.; Rozanov, V.V.; Chance, K.V.; Goede, A.P.H. SCIAMACHY: Mission Objectives and Measurement Modes. J. Atmos. Sci. 1999, 56, 127–150. [Google Scholar] [CrossRef]
  18. Kuze, A.; Kikuchi, N.; Kataoka, F.; Suto, H.; Shiomi, K.; Kondo, Y. Detection of methane emission from a local source using GOSAT target observations. Remote Sens. 2020, 12, 267. [Google Scholar] [CrossRef]
  19. Janardanan, R.; Maksyutov, S.; Tsuruta, A.; Wang, F.; Tiwari, Y.K.; Valsala, V.; Ito, A.; Yoshida, Y.; Kaiser, J.W.; Janssens-Maenhout, G.; et al. Country-scale analysis of methane emissions with a high-resolution inverse model using GOSAT and surface observations. Remote Sens. 2020, 12, 375. [Google Scholar] [CrossRef]
  20. Chen, Y.; Cheng, J.; Song, X.; Liu, S.; Sun, Y.; Yu, D.; Fang, S. Global-Scale Evaluation of XCO2 Products from GOSAT, OCO-2 and CarbonTracker Using Direct Comparison and Triple Collocation Method. Remote Sens. 2022, 14, 5635. [Google Scholar]
  21. Jacob, D.J.; Varon, D.J.; Cusworth, D.H.; Dennison, P.E.; Frankenberg, C.; Gautam, R.; Guanter, L.; Kelley, J.; McKeever, J.; Ott, L.E.; et al. Quantifying methane emissions from the global scale down to point sources using satellite observations of atmospheric methane. Atmos. Chem. Phys. 2022, 22, 9617–9646. [Google Scholar] [CrossRef]
  22. Pasternak, F.; Bernard, P.; Georges, L.; Pascal, V. The microcarb instrument. In Proceedings of the International Conference on Space Optics— ICSO 2016, Biarritz, France, 18–21 October 2016; Cugny, B., Karafolas, N., Sodnik, Z., Eds.; International Society for Optics and Photonics, SPIE: Bellingham, WA, USA, 2017; Volume 10562, p. 105621P. [Google Scholar] [CrossRef]
  23. Mayorova, V.; Morozov, A.; Golyak, I.; Golyak, I.; Lazarev, N.; Melnikova, V.; Rachkin, D.; Svirin, V.; Tenenbaum, S.; Vintaykin, I.; et al. Determination of Greenhouse Gas Concentrations from the 16U CubeSat Spacecraft Using Fourier Transform Infrared Spectroscopy. Sensors 2023, 23, 6794. [Google Scholar] [CrossRef]
  24. Jallad, A.H.; Marpu, P.; Abdul Aziz, Z.; Al Marar, A.; Awad, M. MeznSat—A 3U CubeSat for Monitoring Greenhouse Gases Using Short Wave Infra-Red Spectrometry: Mission Concept & Analysis. Aerospace 2019, 6, 118. [Google Scholar] [CrossRef]
  25. Sperfeld, P.; Metzdorf, J.; Galal Yousef, S.; Stock, K.D.; Möller, W. Improvement and extension of the black-body-based spectral irradiance scale. Metrologia 1998, 35, 267. [Google Scholar] [CrossRef]
  26. Sperfeld, P.; Galal Yousef, S.; Metzdorf, J.; Nawo, B.; Möller, W. The use of self-consistent calibrations to recover absorption bands in the black-body spectrum. Metrologia 2000, 37, 373. [Google Scholar] [CrossRef]
  27. Kuze, A.; Suto, H.; Nakajima, M.; Hamazaki, T. Thermal and near infrared sensor for carbon observation Fourier-transform spectrometer on the Greenhouse Gases Observing Satellite for greenhouse gases monitoring. Appl. Opt. 2009, 48, 6716–6733. [Google Scholar] [CrossRef] [PubMed]
  28. Meftah, M.; Damé, L.; Bolsée, D.; Hauchecorne, A.; Pereira, N.; Sluse, D.; Cessateur, G.; Irbah, A.; Bureau, J.; Weber, M.; et al. SOLAR-ISS: A new reference spectrum based on SOLAR/SOLSPEC observations. A&A 2018, 611, A1. [Google Scholar] [CrossRef]
  29. Meftah, M.; Sarkissian, A.; Keckhut, P.; Hauchecorne, A. The SOLAR-HRS New High-Resolution Solar Spectra for Disk-Integrated, Disk-Center, and Intermediate Cases. Remote Sens. 2023, 15, 3560. [Google Scholar] [CrossRef]
  30. Meftah, M.; Sarkissian, A.; Reberac, A. SOLAR-HRS: The HRS High-Resolution Extraterrestrial Solar Reference Spectra for Disk-Integrated, Disk-Center, and Intermediate Cases; LATMOS: Paris, France, 2022. [Google Scholar] [CrossRef]
  31. Gordon, I.; Rothman, L.; Hargreaves, R.; Hashemi, R.; Karlovets, E.; Skinner, F.; Conway, E.; Hill, C.; Kochanov, R.; Tan, Y.; et al. The HITRAN2020 molecular spectroscopic database. J. Quant. Spectrosc. Radiat. Transf. 2022, 277, 107949. [Google Scholar] [CrossRef]
  32. Bertaux, J.L.; Hauchecorne, A.; Lefèvre, F.; Bréon, F.M.; Blanot, L.; Jouglet, D.; Lafrique, P.; Akaev, P. The use of the 1.27 μm O2 absorption band for greenhouse gas monitoring from space and application to MicroCarb. Atmos. Meas. Tech. 2020, 13, 3329–3374. [Google Scholar] [CrossRef]
  33. Lefèvre, F.; Figarol, F.; Carslaw, K.S.; Peter, T. The 1997 Arctic Ozone depletion quantified from three-dimensional model simulations. Geophys. Res. Lett. 1998, 25, 2425–2428. [Google Scholar] [CrossRef]
Figure 1. Computer-aided design of the Uvsq-Sat NG satellite with its platform and its scientific payloads (NIR Spectrometer, NanoCam, Earth Radiative Sensors, photodiodes).
Remotesensing 15 04876 g001
Figure 2. General ADCS control loop of the Uvsq-Sat NG CubeSat. Earth-Centered Earth-Fixed (ECEF) is a coordinate system that defines positions in relation to the Earth’s center while considering the Earth’s rotation. It provides a fixed reference frame for navigation and positioning calculations.
Remotesensing 15 04876 g002
Figure 3. Schematic illustration of radiation transfer in passive remote sensing, applied to Uvsq-Sat NG. The observation approach of the Uvsq-Sat NG NIR Spectrometer relies on measuring spectra of sunlight scattered back via the Earth’s surface and atmosphere in the NIR spectral range.
Remotesensing 15 04876 g003
Figure 4. (top) Dimensionless transmittance functions ( TR ( ν , T , P , L ) ) for CO 2 , CH 4 , O 2 , and H 2 O as a function of wavelength and for nominal mixing. (bottom) Dimensionless transmittance functions’ relative variations from a ’maximum’ mixing ratio (430 ppm for CO 2 , 2.0 ppm for CH 4 , 0.22 for O 2 , and 1.1 precipitable cm for H 2 O) to a nominal mixing ratio.
Remotesensing 15 04876 g004
Figure 5. (top) Dimensionless transmittance functions at the Uvsq-Sat NG Spectrometer resolution assuming a spectral resolution of 1 nm (FWHM) for the spectrometer. A Gaussian convolution filter is used. (bottom) Relative variation between ’maximum’ mixing ratio and nominal mixing ratio.
Remotesensing 15 04876 g005
Figure 6. Uvsq-Sat NG NIR Spectrometer data retrieval of the dimensionless signal ( TR S p e c t r o ( λ ) ) as it can be observed via the spectrometer (spectral resolution of 1 nm and SNR of 50). The dark stars (noised data) represent data of the dimensionless signal (Step 4). The blue curve represents the best fit obtained using the Levenberg–Marquardt algorithm (Step 5).
Remotesensing 15 04876 g006
Figure 7. Restitution of the concentration of gases observed via the Uvsq-Sat NG NIR Spectrometer. In this simulation, the spectrometer has a resolution of 1 nm and a SNR of 50.
Remotesensing 15 04876 g007
Figure 8. Restitution of the concentration of gases observed via the Uvsq-Sat NG NIR Spectrometer. In this simulation, the instrument has a resolution of 6 nm and a SNR of 2000.
Remotesensing 15 04876 g008
Table 1. Scientific requirements for satellite observations of ERB and GHG concentrations—Uvsq-Sat, Inspire-Sat 7, Uvsq-Sat NG, and the future Terra-F constellation. Terra-F also focuses on determining Total Solar Irradiance (TSI) with good accuracy.
Requirements for Uvsq-Sat—Launched on 24 January 2021 from Cape Canaveral, Florida, USA
ECVAbsolute accuracyStability per yearSpatial resolutionTemporal resolution (global map)
OSR±10.00 Wm 2 ±5.00 Wm 2 2500 km per element30 days with one CubeSat
OLR±10.00 Wm 2 ±1.00 Wm 2 2500 km per element30 days with one CubeSat
Requirements for Inspire-Sat 7—Launched on 15 April 2023 from Vandenberg, California, USA
ECVAbsolute accuracyStability per yearSpatial resolutionTemporal resolution (global map)
OSR±5.00 Wm 2 ±1.00 Wm 2 2500 km per element10 days with two CubeSats
OLR±5.00 Wm 2 ±1.00 Wm 2 2500 km per element10 days with two CubeSats
Requirements for Uvsq-Sat NG—Launch Date in 2025 or in 2026
ECVAbsolute accuracyStability per yearSpatial resolutionTemporal resolution (global map)
OSR±3.00 Wm 2 ±1.00 Wm 2 2500 km per element5 days with three CubeSats
OLR±3.00 Wm 2 ±1.00 Wm 2 2500 km per element5 days with three CubeSats
CO 2 ±4.0 ppm±1.0 ppm2–10 km per pixel>30 days
CH 4 ±25.0 ppb±10.0 ppb2–10 km per pixel>30 days
Requirements for a Hypothetical Satellite Constellation Named Terra-F—Horizon 2035
ECVAbsolute accuracyStability per decadeSpatial resolutionRevisit time
TSI±0.54 Wm 2 ±0.14 Wm 2 24 h
OSR±1.00 Wm 2 ±0.10 Wm 2 10–100 km per pixel3 h
OLR±1.00 Wm 2 ±0.10 Wm 2 10–100 km per pixel3 h
EEI±1.00 Wm 2 ±0.10 Wm 2 24 h
CO 2 ±1.0 ppm±1.5 ppm1–5 km per pixel3 h
CH 4 ±10.0 ppb±7.0 ppb1–5 km per pixel3 h
Table 2. Values of the main parameters of the various payloads of the Uvsq-Sat NG satellite.
ParameterSpectrometerNanoCamERSs
Field of view0.15°13°180°
Aperture/surface15 mm32 mm10 × 10 mm
Spectral range1200–2000 nm390–690 nm0.1–3.0  μ m | 0.1–100.0  μ m
Image size1 × 256 pixels2048 × 1536 pixels1 × 1 element
Pixel size250 × 50  μ m3.2 × 3.2  μ m10 × 10 mm
Spectral resolution1 to 6 nm
Spatial resolution<2 km per pixel<30 m per pixel2500 km per element
Ground footprint∼5 km (Ø)∼77 km (diagonal)∼2500 km (Ø)
Table 3. Characteristics of the Uvsq-Sat NG spacecraft.
PropertiesValueComments
OrbitSun-Synchronous Orbit (SSO)Maximum altitude of 600 km, LTAN of 06:30
Design life timeMinimum of 2 years in LEO3 years desired
Launch dateBetween Q2 2025 and Q1 2026Launch vehicle: Falcon 9, Vega-C or Zéphyr
Launch adapterQuadPack or EXOpod deployerPayload mass up to 12 kg
CubeSat type6U XLEasy-to-assemble modular design
Launch mass10.0 kg  1 Maximum with margins
Dimensions10.0 cm × 36.6 cm × 22.6 cmStowed along X, Y, and Z axes
111.3 cm × 36.6 cm × 38.8 cmUnstowed including all deployable elements
PayloadsTwo Earth Radiative Sensors (ERSs)Outgoing terrestrial radiation measurements
Six Uvsq-Sat NG photodiodesOutgoing shortwave radiation
One Uvsq-Sat NG SpectrometerGreenhouse gases monitoring
One Uvsq-Sat NG NanoCamImaging and geolocation
One Audio transponderFM live retransmission (amateur radio)
One LATMOS IMUThree-axis accelerometer/gyroscope/compass
PowerUp to 35 W generation at 1 AU  2 Two deployable solar panels on the Z− side
52 solar cells on multiple sides3G30A solar cells provided by Azur Space
Batteries of 90 Wh @ 16 V8 Panasonic batteries (NCR18650B) with heaters
Power of 15.0 W generatedOAP in LEO with LTAN of 09:00
Power of 10.0 W consumedDay average—nominal operations
CDHS and OBCCubeSat OnBoard ComputerIsispace
400 MHz, 32-bit ARM9Processor
64 GByteStorage
I 2 C/CAN/SPI/USART/UARTData bus
Thermal control systemPassive designCoatings
120 Ohms at 16 VHeaters for batteries protection
CommunicationUplink of 9.6 kbpsVHF (G3RUH FSK, Ax25) — 148.0 MHz  3
Uplink data of 0.3 MbyteMaximum during a day
Downlink of 9.6 kbps|4.3 MbpsUHF (BPSK) — 401.0 MHz  3 | S-band — 2245 MHz  3
Downlink data of 150.0 MbyteMaximum during a day with the S-band
Contact station of ∼1 h per dayLATMOS and ACRI-ST ground stations
Electric propulsion10 to 350  μ N of thrustEnpulsion, Exotrail, or no subsystem
Pointing and ADCSADCS OnBoard ComputerIsispace, Cortex-M7 ARM micro-processor
Magnetorquer board (iMTQ)Isispace
Deployable magnetometeriMTM from Isispace
Fine Sun SensorLens R&D
Reaction WheelsAstrofein
Star Tracker and its OBCSodern (including Isispace processing unit)
Three-axis magnetometerMeasurements of the local Earth magnetic field
Three-axis magnetorquer0.2 Am  2 magnetic dipole (per actuator)
Six SLCD-61N8 photodiodesCoarse estimation of the Sun’s direction ( θ )
< 0.10 degree for all three axesAbsolute Performance Error (Roll, Pitch, Yaw)
< 0.02 degree for all three axesPerformance Drift Error (Roll, Pitch, Yaw)
Time and positionGNSS receiverNovatel
GNSS patch antennaIsispace
∼20 ns rmsTiming accuracy
<2 m rmsOrbit position determination accuracy
<0.03 ms 1 rmsOrbit velocity determination accuracy
Maximum slew rate of 10  s 1 Depending on CubeSat moment of inertia
ModesB-dot modeDetumbling phase
Scientific modesNadir, zenith, Earth’s limb, Sun, deep space
1 Mass at the boundary between nano and microsat. 2 One astronomical unit (149,597,870,700 m). 3 To be confirmed.
Table 4. Uvsq-Sat NG external area usage and number of solar cells employed on each satellite side.
Satellite SideElement
X+8 Azur Space solar cells
One hold-down-and-release mechanism of the Z−/X+ deployable panel
One Fine Sun Sensor and one Uvsq-Sat NG photodiode
X−8 Azur Space solar cells
One hold-down-and-release mechanism of the Z−/X− deployable panel
One Fine Sun Sensor and one Uvsq-Sat NG photodiode
Y+One Star Tracker aperture
One Uvsq-Sat NG photodiode
Y−4 Azur Space solar cells
One Uvsq-Sat NG photodiode
Z+Uvsq-Sat NG NIR Spectrometer aperture
Uvsq-Sat NG NanoCam aperture
2 Earth Radiative Sensors
S-band patch antenna
One Uvsq-Sat NG photodiode
Z−The Z−/X+ deployable panel with 16 Azur Space solar cells
The Z−/X+ deployable panel with 16 Azur Space solar cells
One GNSS patch antenna
One deployable Uvsq-Sat NG magnetometer
One Fine Sun Sensor and one Uvsq-Sat NG photodiode
Table 5. Uncertainties of atmospheric gas concentrations (1–Sigma) for various data retrievals based on different instrumental characteristics.
Uvsq-Sat NG NIR Spectrometer Spectral Resolution: 1 nm
SNR50100250500100020005000
CO 2 [ppm]10.9985.6022.2041.1300.5750.2770.110
CH 4 [ppb]125.02866.20925.24512.3026.6253.1081.294
O 2 [Ratio]11.024  ×   10 3 5.921  ×   10 3 2.433  ×   10 3 1.165  ×   10 3 0.636  ×   10 3 0.299  ×   10 3 0.120  ×   10 3
H 2 O [cm]4.746  ×   10 3 2.271  ×   10 3 0.877  ×   10 3 0.441  ×   10 3 0.207  ×   10 3 0.114  ×   10 3 0.045  ×   10 3
Uvsq-Sat NG NIR Spectrometer Spectral Resolution: 6 nm
SNR50100250500100020005000
CO 2 [ppm]33.97416.7206.4263.1541.6740.8080.339
CH 4 [ppb]431.491198.87788.92640.97321.59311.3174.146
O 2 [Ratio]33.139  ×   10 3 16.209  ×   10 3 5.657  ×   10 3 3.169  ×   10 3 1.588  ×   10 3 0.850  ×   10 3 0.313  ×   10 3
H 2 O [cm]12.474  ×   10 3 5.933  ×   10 3 2.518  ×   10 3 1.236  ×   10 3 0.609  ×   10 3 0.284  ×   10 3 0.124  ×   10 3
Disclaimer/Publisher’s Note: The statements, opinions and data contained in all publications are solely those of the individual author(s) and contributor(s) and not of MDPI and/or the editor(s). MDPI and/or the editor(s) disclaim responsibility for any injury to people or property resulting from any ideas, methods, instructions or products referred to in the content.

