

Forest-PointNet: A Deep Learning Model for Vertical Structure Segmentation in Complex Forest Scenes


Abstract
:1. Introduction
2. Materials and Methods
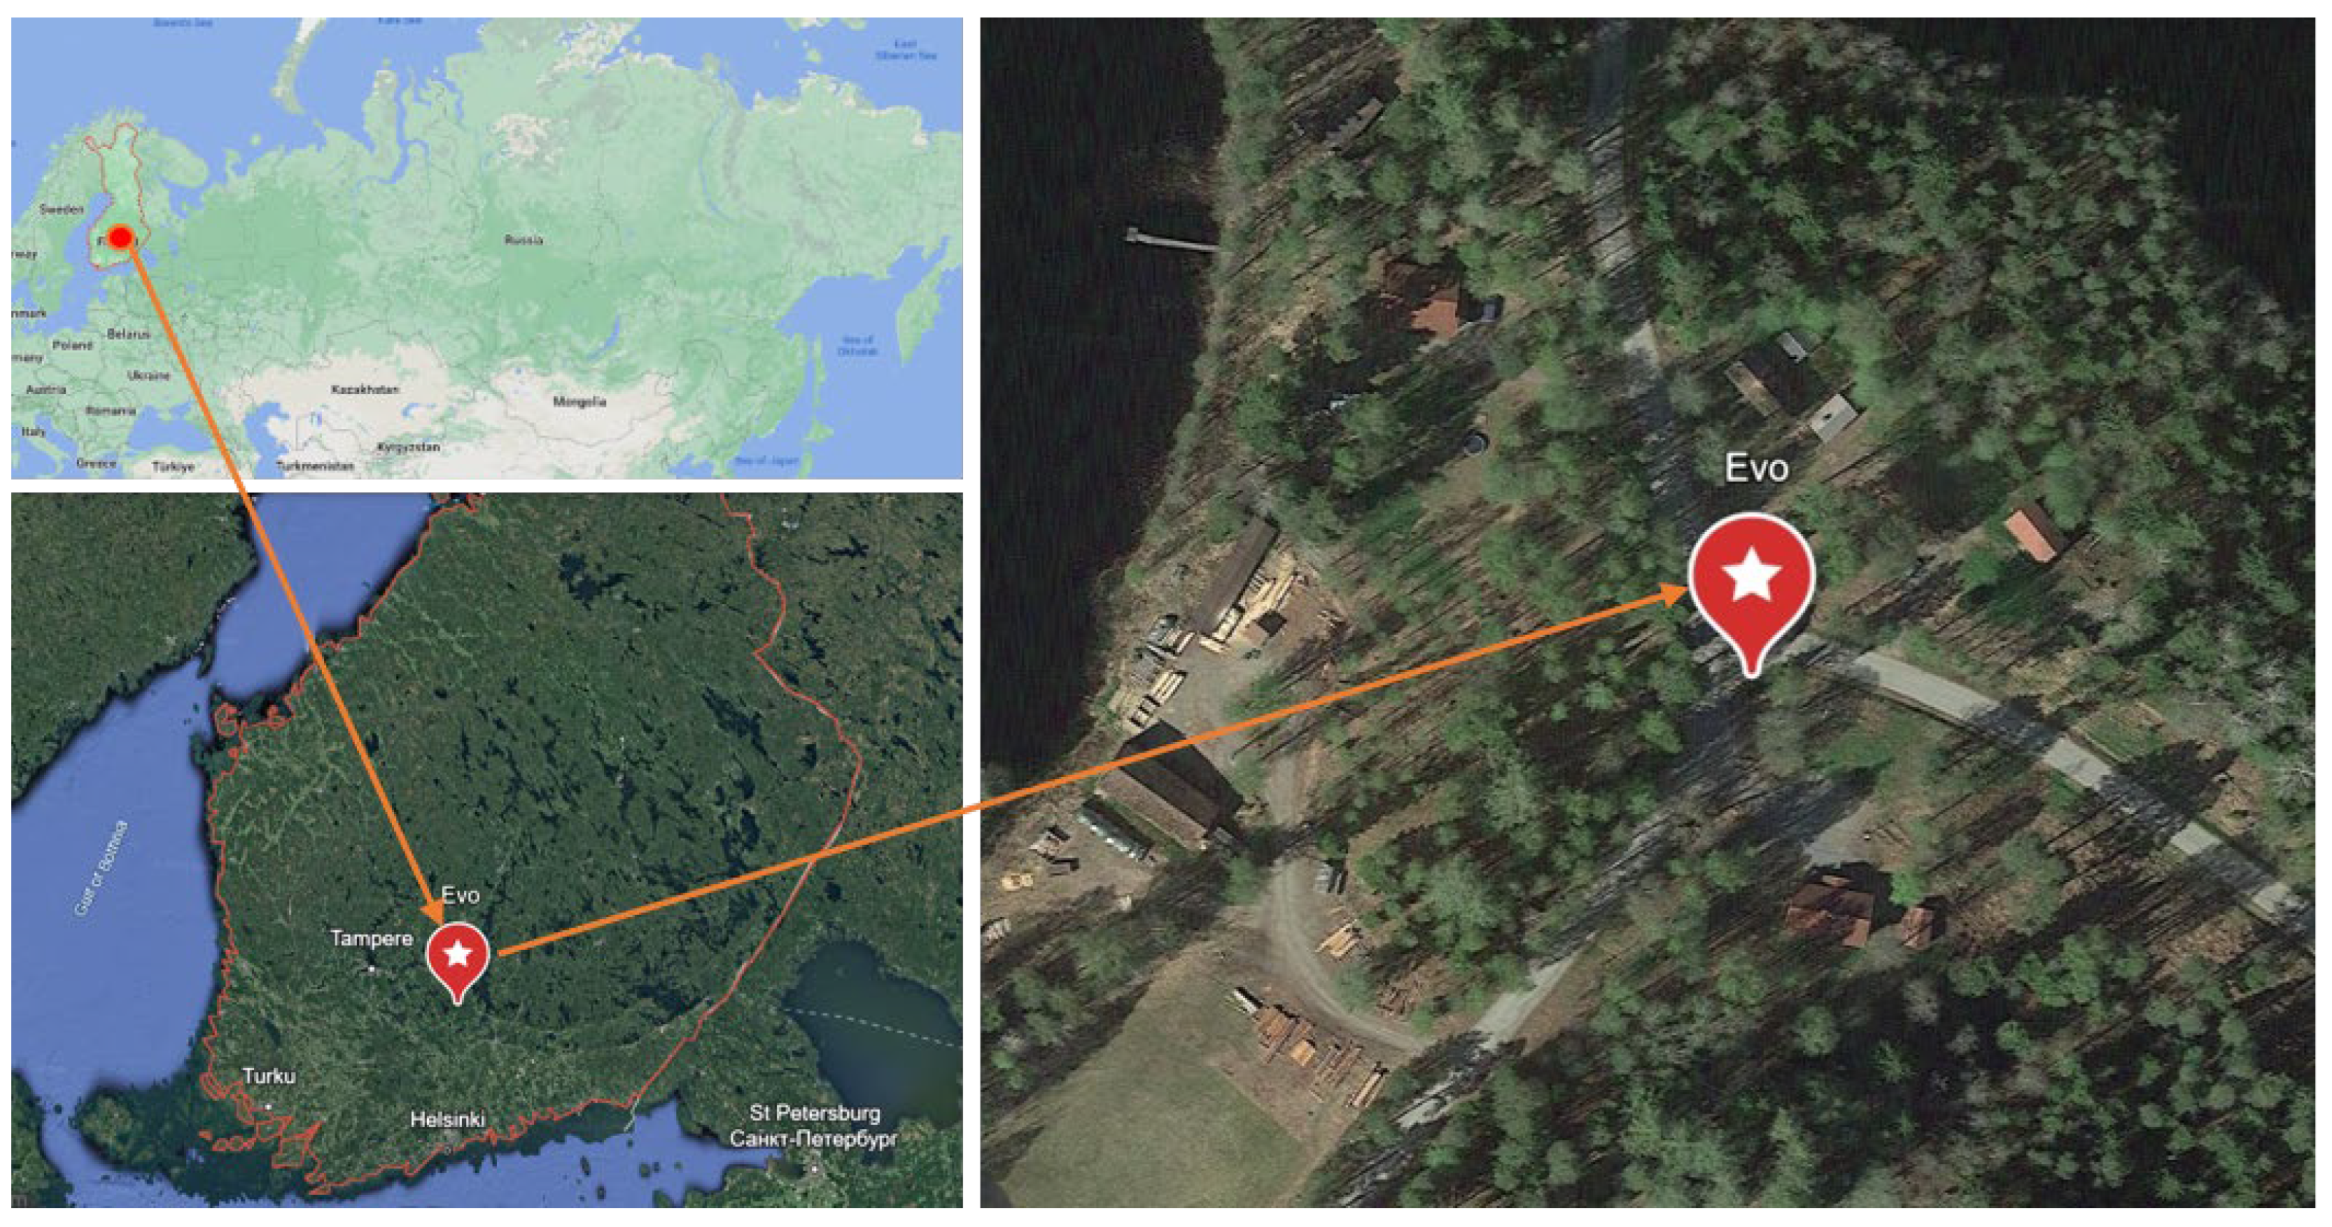
2.1. Study Area and Sample Plots
2.2. Validation Data
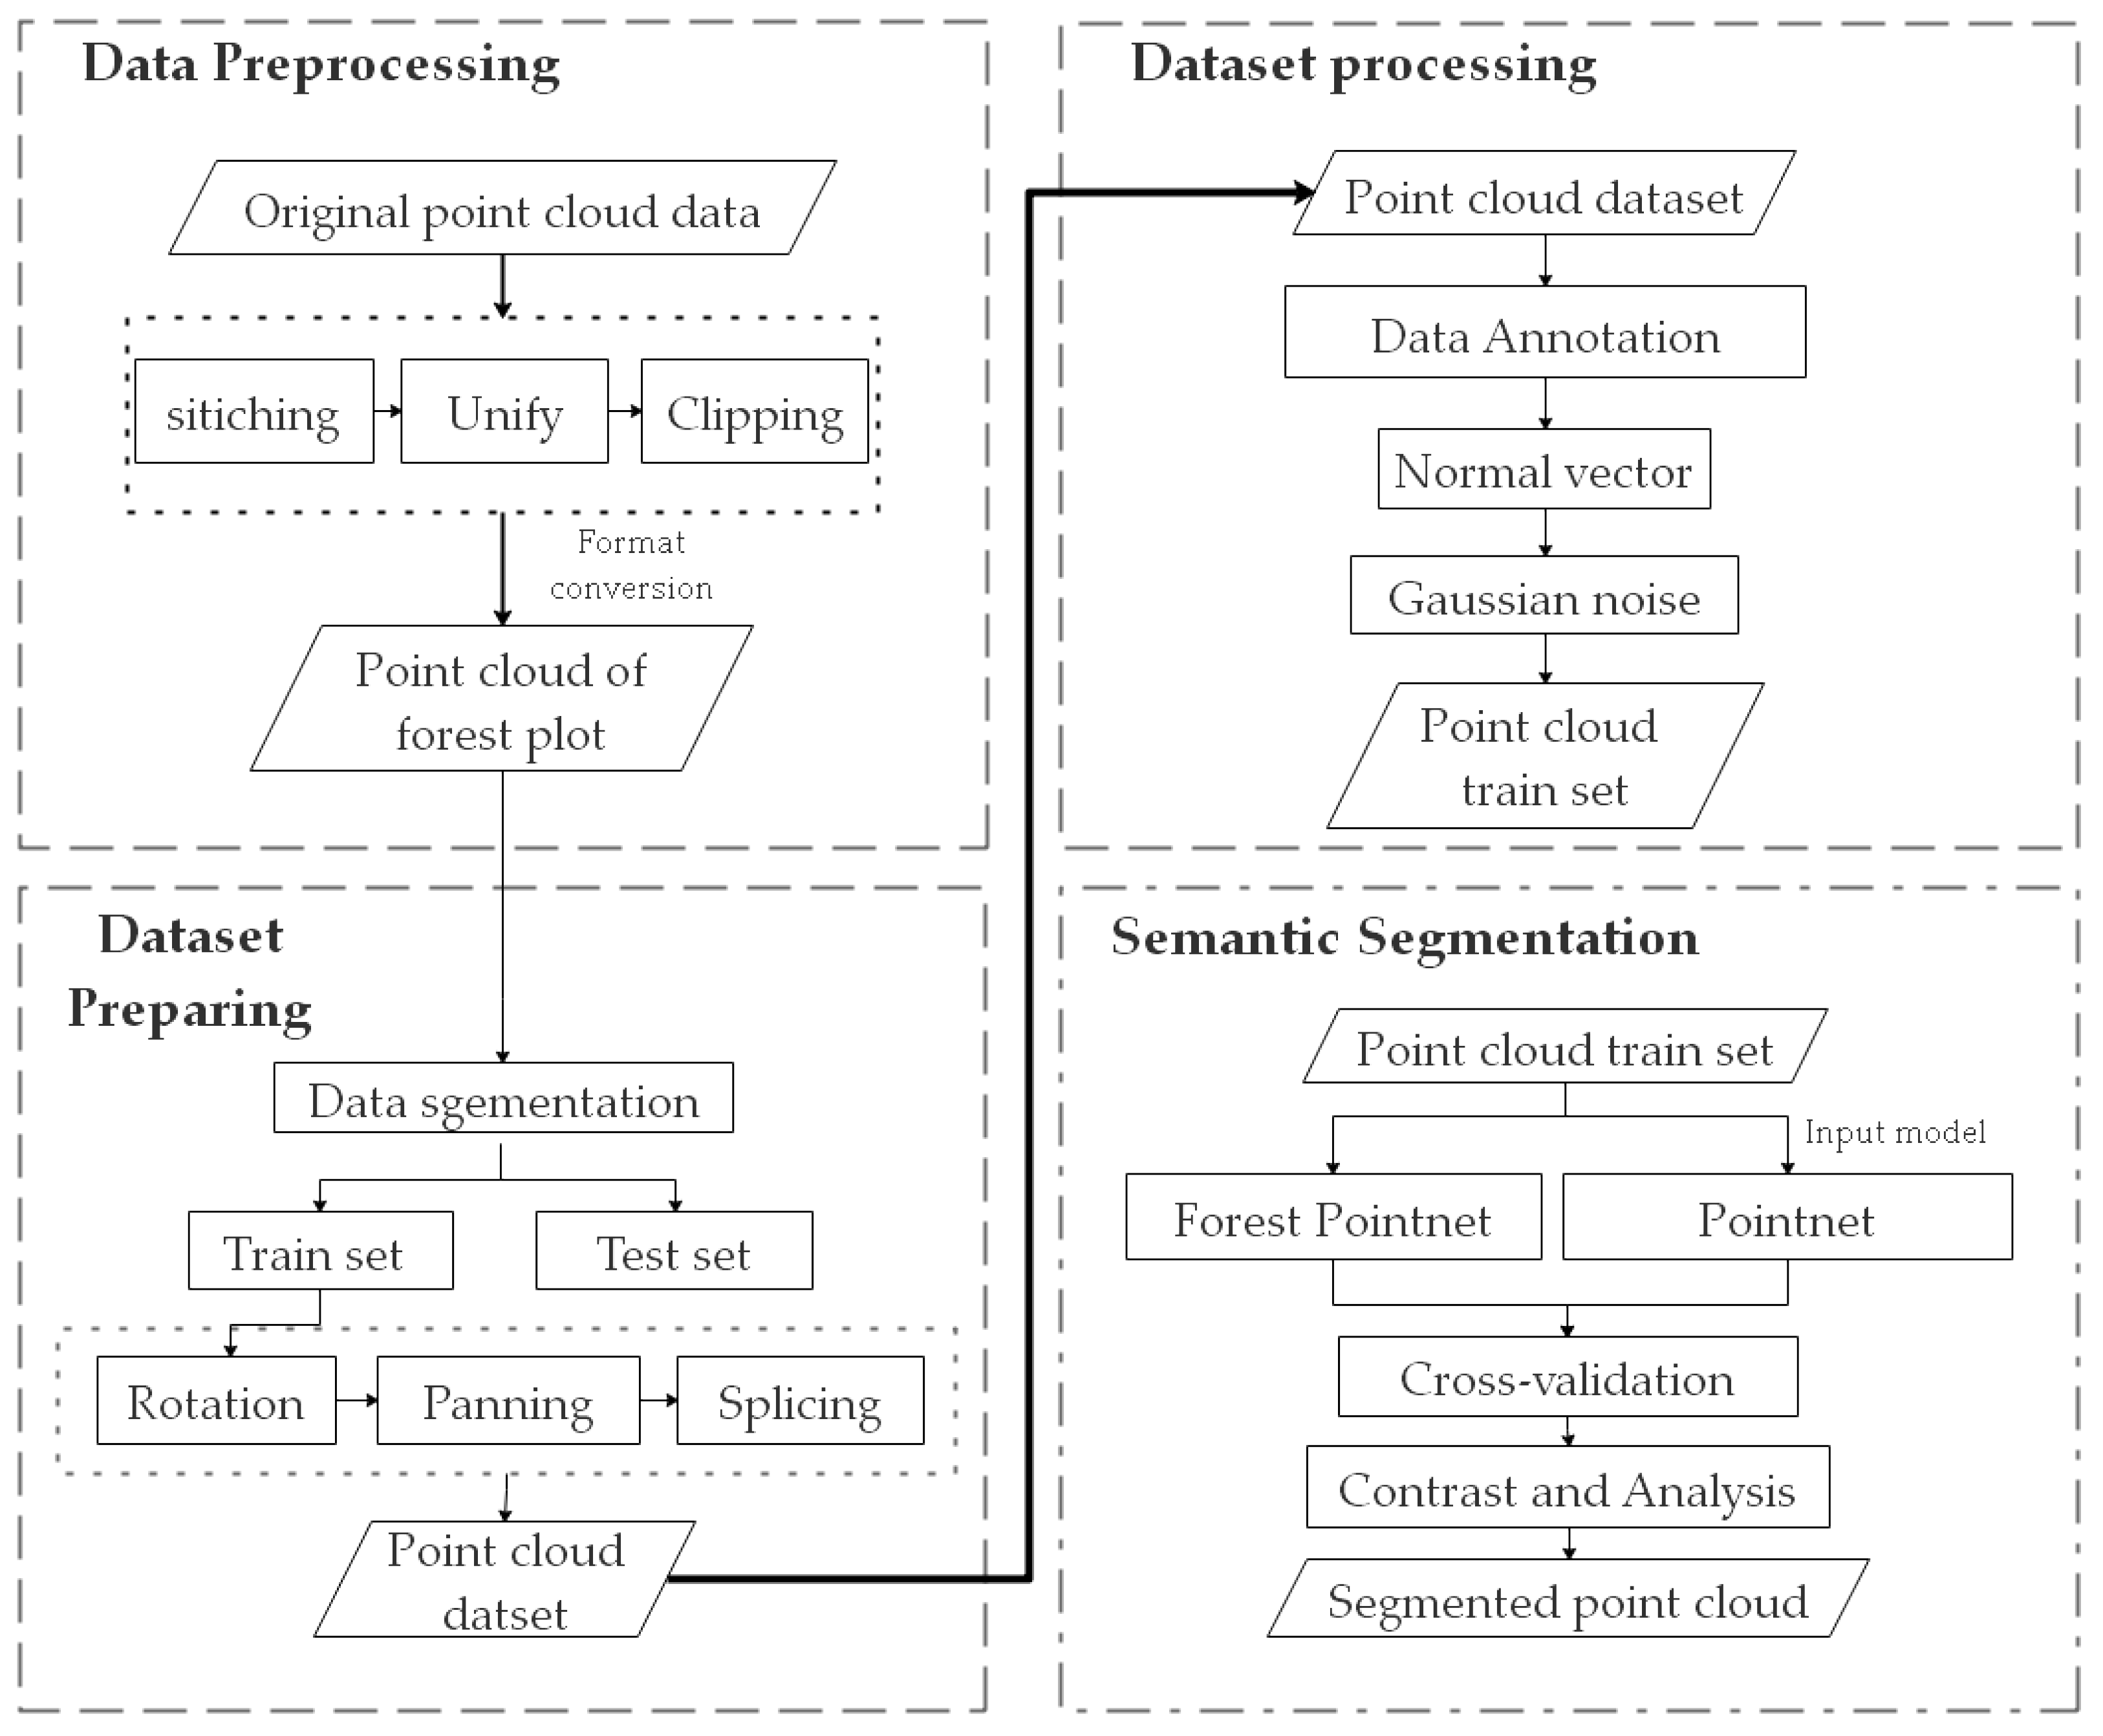
2.3. General Methodology
2.4. Data Preprocessing
2.5. Forest-PointNet
2.6. Experimental Environment and Parameters
2.7. Assessment Method
3. Results
4. Discussion
4.1. The Advantages of Our Approach
4.2. Comparison with Existing Methods
4.3. Limitations and Potential Improvements
5. Conclusions
Author Contributions
Funding
Data Availability Statement
Conflicts of Interest
References
- Li, S.; Wang, T.; Hou, Z.; Gong, Y.; Feng, L.; Ge, J. Harnessing terrestrial laser scanning to predict understory biomass in temperate mixed forests. Ecol. Indic. 2021, 121, 107011. [Google Scholar] [CrossRef]
- Brunner, A.; Houtmeyers, S. Segmentation of conifer tree crowns from terrestrial laser scanning point clouds in mixed stands of Scots pine and Norway spruce. Eur. J. For. Res. 2022, 141, 909–925. [Google Scholar] [CrossRef]
- Itakura, K.; Hosoi, F. Automatic individual tree detection and canopy segmentation from three-dimensional point cloud images obtained from ground-based lidar. J. Agric. Meteorol. 2018, 74, 109–113. [Google Scholar] [CrossRef]
- Wei, H.; Xu, E.; Zhang, J.; Meng, Y.; Wei, J.; Dong, Z.; Li, Z. BushNet: Effective semantic segmentation of bush in large-scale point clouds. Comput. Electron. Agric. 2022, 193, 106653. [Google Scholar] [CrossRef]
- Reitberger, J.; Schnörr, C.; Krzystek, P.; Stilla, U. 3D segmentation of single trees exploiting full waveform LIDAR data. ISPRS J. Photogramm. Remote Sens. 2009, 64, 561–574. [Google Scholar] [CrossRef]
- Briechle, S.; Krzystek, P.; Vosselman, G. Classification of tree species and standing dead trees by fusing uav-based lidar data and multispectral imagery in the 3d deep neural network pointnet++. ISPRS Ann. Photogramm. Remote Sens. Spat. Inf. Sci. 2020, 2, 203–210. [Google Scholar] [CrossRef]
- Liu, G.; Wang, J.; Dong, P.; Chen, Y.; Liu, Z. Estimating Individual Tree Height and Diameter at Breast Height (DBH) from Terrestrial Laser Scanning (TLS) Data at Plot Level. Forests 2018, 9, 398. [Google Scholar] [CrossRef]
- Panagiotidis, D.; Abdollahnejad, A.; Slavík, M. Assessment of Stem Volume on Plots Using Terrestrial Laser Scanner: A Precision Forestry Application. Sensors 2021, 21, 301. [Google Scholar] [CrossRef]
- Guo, Z.; Feng, C.C. Using multi-scale and hierarchical deep convolutional features for 3D semantic classification of TLS point clouds. Int. J. Geogr. Inf. Sci. 2020, 34, 661–680. [Google Scholar] [CrossRef]
- Zhang, J.; Wang, J.; Liu, G. Vertical Structure Classification of a Forest Sample Plot Based on Point Cloud Data. J. Indian Soc. Remote Sens. 2020, 48, 1215–1222. [Google Scholar] [CrossRef]
- Zhang, J.; Wang, J.; Dong, P.; Ma, W. Tree stem extraction from TLS point-cloud data of natural forests based on geometric features and DBSCAN. Geocarto Int. 2022, 37, 10392–10406. [Google Scholar] [CrossRef]
- Sun, Y.; Liang, X.; Liang, Z.; Welham, C.; Li, W. Deriving Merchantable Volume in Poplar through a Localized Tapering Function from Non-Destructive Terrestrial Laser Scanning. Forests 2016, 7, 87. [Google Scholar] [CrossRef]
- Wu, B.; Zheng, G.; Chen, Y. An Improved Convolution Neural Network-Based Model for Classifying Foliage and Woody Components from Terrestrial Laser Scanning Data. Remote Sens. 2020, 12, 1010. [Google Scholar] [CrossRef]
- Lin, W.; Fan, W.; Liu, H.; Xu, Y.; Wu, J. Classification of Handheld Laser Scanning Tree Point Cloud Based on Different KNN Algorithms and Random Forest Algorithm. Forests 2021, 12, 292. [Google Scholar] [CrossRef]
- Wang, Y.; Weinacker, H.; Koch, B. A Lidar Point Cloud Based Procedure for Vertical Canopy Structure Analysis And 3D Single Tree Modelling in Forest. Sensors 2008, 8, 3938–3951. [Google Scholar] [CrossRef] [PubMed]
- Lu, X.; Guo, Q.; Li, W.; Flanagan, J. A bottom-up approach to segment individual deciduous trees using leaf-off lidar point cloud data. ISPRS J. Photogramm. Remote Sens. 2014, 94, 1–12. [Google Scholar] [CrossRef]
- Seidel, D.; Albert, K.; Fehrmann, L.; Ammer, C. The potential of terrestrial laser scanning for the estimation of understory biomass in coppice-with-standard systems. Biomass-Bioenergy 2012, 47, 20–25. [Google Scholar] [CrossRef]
- Beyene, S.M.; Hussin, Y.A.; Kloosterman, H.E.; Ismail, M.H. Forest Inventory and Aboveground Biomass Estimation with Terrestrial LiDAR in the Tropical Forest of Malaysia. Can. J. Remote Sens. 2020, 46, 130–145. [Google Scholar] [CrossRef]
- Wang, D. Unsupervised semantic and instance segmentation of forest point clouds. ISPRS J. Photogramm. Remote Sens. 2020, 165, 86–97. [Google Scholar] [CrossRef]
- Liu, L.; Pang, Y.; Li, Z.; Si, L.; Liao, S. Combining Airborne and Terrestrial Laser Scanning Technologies to Measure Forest Understorey Volume. Forests 2017, 8, 111. [Google Scholar] [CrossRef]
- Pu, L.; Xv, J.; Deng, F. An Automatic Method for Tree Species Point Cloud Segmentation Based on Deep Learning. J. Indian Soc. Remote Sens. 2021, 49, 2163–2172. [Google Scholar] [CrossRef]
- Wang, L.; Huang, Y.; Hou, Y.; Zhang, S.; Shan, J. Graph attention convolution for point cloud semantic segmentation. In Proceedings of the IEEE/CVF Conference on Computer Vision and Pattern Recognition, Long Beach, CA, USA, 15–20 June 2019; pp. 10296–10305. [Google Scholar]
- Gao, X.-Y.; Wang, Y.-Z.; Zhang, C.-X.; Lu, J.-Q. Multi-Head Self-Attention for 3D Point Cloud Classification. IEEE Access 2021, 9, 18137–18147. [Google Scholar] [CrossRef]
- Vanian, V.; Zamanakos, G.; Pratikakis, I. Improving performance of deep learning models for 3D point cloud semantic segmentation via attention mechanisms. Comput. Graph. 2022, 106, 277–287. [Google Scholar] [CrossRef]
- Zhang, J.; Zhao, X.; Chen, Z.; Lu, Z. A Review of Deep Learning-Based Semantic Segmentation for Point Cloud. IEEE Access 2019, 7, 179118–179133. [Google Scholar] [CrossRef]
- Chen, X.; Jiang, K.; Zhu, Y.; Wang, X.; Yun, T. Individual Tree Crown Segmentation Directly from UAV-Borne LiDAR Data Using the PointNet of Deep Learning. Forest 2021, 12, 131. [Google Scholar] [CrossRef]
- Liu, B.; Chen, S.; Huang, H.; Tian, X. Tree Species Classification of Backpack Laser Scanning Data Using the PointNet++ Point Cloud Deep Learning Method. Remote Sens. 2022, 14, 3809. [Google Scholar] [CrossRef]
- Jing, Z.; Guan, H.; Zhao, P.; Li, D.; Yu, Y.; Zang, Y.; Wang, H.; Li, J. Multispectral LiDAR point cloud classification using SE-PointNet++. Remote Sens. 2021, 13, 2516. [Google Scholar] [CrossRef]
- Komori, J.; Hotta, K. AB-PointNet for 3D point cloud recognition. In Proceedings of the 2019 Digital Image Computing: Techniques and Applications (DICTA), Perth, Australia, 2–4 December 2019; pp. 1–6. [Google Scholar]
- Aoki, Y.; Goforth, H.; Srivatsan, R.A.; Lucey, S. Pointnetlk Robust & efficient point cloud registration using pointnet. In Proceedings of the IEEE/CVF Conference on Computer Vision and Pattern Recognition, Long Beach, CA, USA, 15–20 June 2019; pp. 7163–7172. [Google Scholar]
- Yrttimaa, T.; Vastaranta, M.; Saarinen, N.; Kankare, V.; Luoma, V.; Hyyppä, J.; University of Eastern Finland. Terrestrial Laser Scanning Point Clouds from Evo Test Site, 80 Sample Plots, Autumn 2021; Metsätieteiden osasto, Version 1; University of Eastern Finland: Joensuu, Finland, 2022. [Google Scholar]
- Fu, H.; Li, H.; Dong, Y.; Xu, F.; Chen, F. Segmenting Individual Tree from TLS Point Clouds Using Improved DBSCAN. Forests 2022, 13, 566. [Google Scholar] [CrossRef]
- Qi, C.R.; Su, H.; Mo, K.; Guibas, L.J. Pointnet: Deep learning on point sets for 3d classification and segmentation. In Proceedings of the IEEE Conference on Computer Vision and Pattern Recognition, Honolulu, HI, USA, 21–26 July 2017; pp. 652–660. [Google Scholar]
- Wagers, S.; Castilla, G.; Filiatrault, M.; Sanchez-Azofeifa, G.A. Using TLS-Measured Tree Attributes to Estimate Aboveground Biomass in Small Black Spruce Trees. Forests 2021, 12, 1521. [Google Scholar] [CrossRef]
- Sanchez, J.; Denis, F.; Coeurjolly, D.; Dupont, F.; Trassoudaine, L.; Checchin, P. Robust normal vector estimation in 3D point clouds through iterative principal component analysis. ISPRS J. Photogramm. Remote Sens. 2020, 163, 18–35. [Google Scholar] [CrossRef]
- Mitra, N.J.; Nguyen, A. Estimating surface normals in noisy point cloud data. In Proceedings of the Nineteenth Annual Symposium on Computational Geometry, San Diego, CA, USA, 8–10 June 2003; pp. 322–328. [Google Scholar]
- Xu, D.; Wang, H.; Xu, W.; Luan, Z.; Xu, X. LiDAR Applications to Estimate Forest Biomass at Individual Tree Scale: Opportunities, Challenges and Future Perspectives. Forests 2021, 12, 550. [Google Scholar] [CrossRef]
- Nurunnabi, A.; Teferle, F.N.; Li, J.; Lindenbergh, R.C.; Parvaz, S. Investigation of pointnet for semantic segmentation of large-scale outdoor point clouds. ISPRS-Int. Arch. Photogramm. Remote Sens. Spat. Inf. Sci. 2021, 46, 397–404. [Google Scholar] [CrossRef]
- Calders, K.; Newnham, G.; Burt, A.; Murphy, S.; Raumonen, P.; Herold, M.; Culvenor, D.; Avitabile, V.; Disney, M.; Armston, J.; et al. Nondestructive estimates of above-ground biomass using terrestrial laser scanning. Methods Ecol. Evol. 2014, 6, 198–208. [Google Scholar] [CrossRef]
- Tchapmi, L.P.; Choy, C.B.; Armeni, I.; Gwak, J.; Savarese, S. SEGCloud: Semantic segmentation of 3d point clouds. In Proceedings of the 2017 International Conference on 3D Vision (3DV), Qingdao, China, 10–12 October 2017; pp. 537–547. [Google Scholar]
- Cabo, C.; Ordóñez, C.; Sáchez-Lasheras, F.; Roca-Pardiñas, J.; de Cos-Juez, J. Multiscale Supervised Classification of Point Clouds with Urban and Forest Applications. Sensors 2019, 19, 4523. [Google Scholar] [CrossRef]
- Liu, M.; Han, Z.; Chen, Y.; Liu, Z.; Han, Y. Tree species classification of LiDAR data based on 3D deep learning. Measurement 2021, 177, 109301. [Google Scholar] [CrossRef]
- Wan, P.; Shao, J.; Jin, S.; Wang, T.; Yang, S.; Yan, G.; Zhang, W. A novel and efficient method for wood–leaf separation from terrestrial laser scanning point clouds at the forest plot level. Methods Ecol. Evol. 2021, 12, 2473–2486. [Google Scholar] [CrossRef]
- Ferrara, R.; Virdis, S.G.; Ventura, A.; Ghisu, T.; Duce, P.; Pellizzaro, G. An automated approach for wood-leaf separation from terrestrial LIDAR point clouds using the density based clustering algorithm DBSCAN. Agric. For. Meteorol. 2018, 262, 434–444. [Google Scholar] [CrossRef]
- Han, T.; Sánchez-Azofeifa, G.A. A Deep Learning Time Series Approach for Leaf and Wood Classification from Terrestrial LiDAR Point Clouds. Remote Sens. 2022, 14, 3157. [Google Scholar] [CrossRef]
- Abd Rahman, M.Z.; Gorte, B.G.H.; Bucksch, A.K. A new method for individual tree delineation and undergrowth removal from high resolution airborne LiDAR. In Proceedings of the ISPRS Workshop Laserscanning 2009, Paris, France, 1–2 September 2009; 38, pp. 283–288. [Google Scholar]
- Wang, D.; Hollaus, M.; Pfeifer, N. Feasibility of machine learning methods for separating wood and leaf points from terrestrial laser scanning data. In Proceedings of the ISPRS Annals of Photogrammetry, Remote Sensing and Spatial Information Sciences, Wuhan, China, 18–22 September 2017; pp. 157–164. [Google Scholar]
- Hui, Z.; Jin, S.; Xia, Y.; Wang, L.; Ziggah, Y.Y.; Cheng, P. Wood and leaf separation from terrestrial LiDAR point clouds based on mode points evolution. ISPRS J. Photogramm. Remote Sens. 2021, 178, 219–239. [Google Scholar] [CrossRef]
- Xi, Z.; Hopkinson, C.; Rood, S.B.; Peddle, D.R. See the forest and the trees: Effective machine and deep learning algorithms for wood filtering and tree species classification from terrestrial laser scanning. ISPRS J. Photogramm. Remote Sens. 2020, 168, 1–16. [Google Scholar] [CrossRef]
- Dechesne, C.; Mallet, C.; Le Bris, A.; Gouet-Brunet, V. Semantic segmentation of forest stands of pure species combining airborne lidar data and very high resolution multispectral imagery. ISPRS J. Photogramm. Remote Sens. 2017, 126, 129–145. [Google Scholar] [CrossRef]
- Kaijaluoto, R.; Kukko, A.; El Issaoui, A.; Hyyppä, J.; Kaartinen, H. Semantic segmentation of point cloud data using raw laser scanner measurements and deep neural networks. ISPRS Open J. Photogramm. Remote Sens. 2021, 3, 100011. [Google Scholar] [CrossRef]


| Parameter | Value |
|---|---|
| NUM_POINT | 2048 |
| NUM_CATEGORY | 8 |
| EPOCH | 100 |
| BATCH_SIZE | 32 |
| OPTIMIZER | Adam |
| LEARNING_RATE | 0.002 |
| DECAY_RATE | 0.0001 |
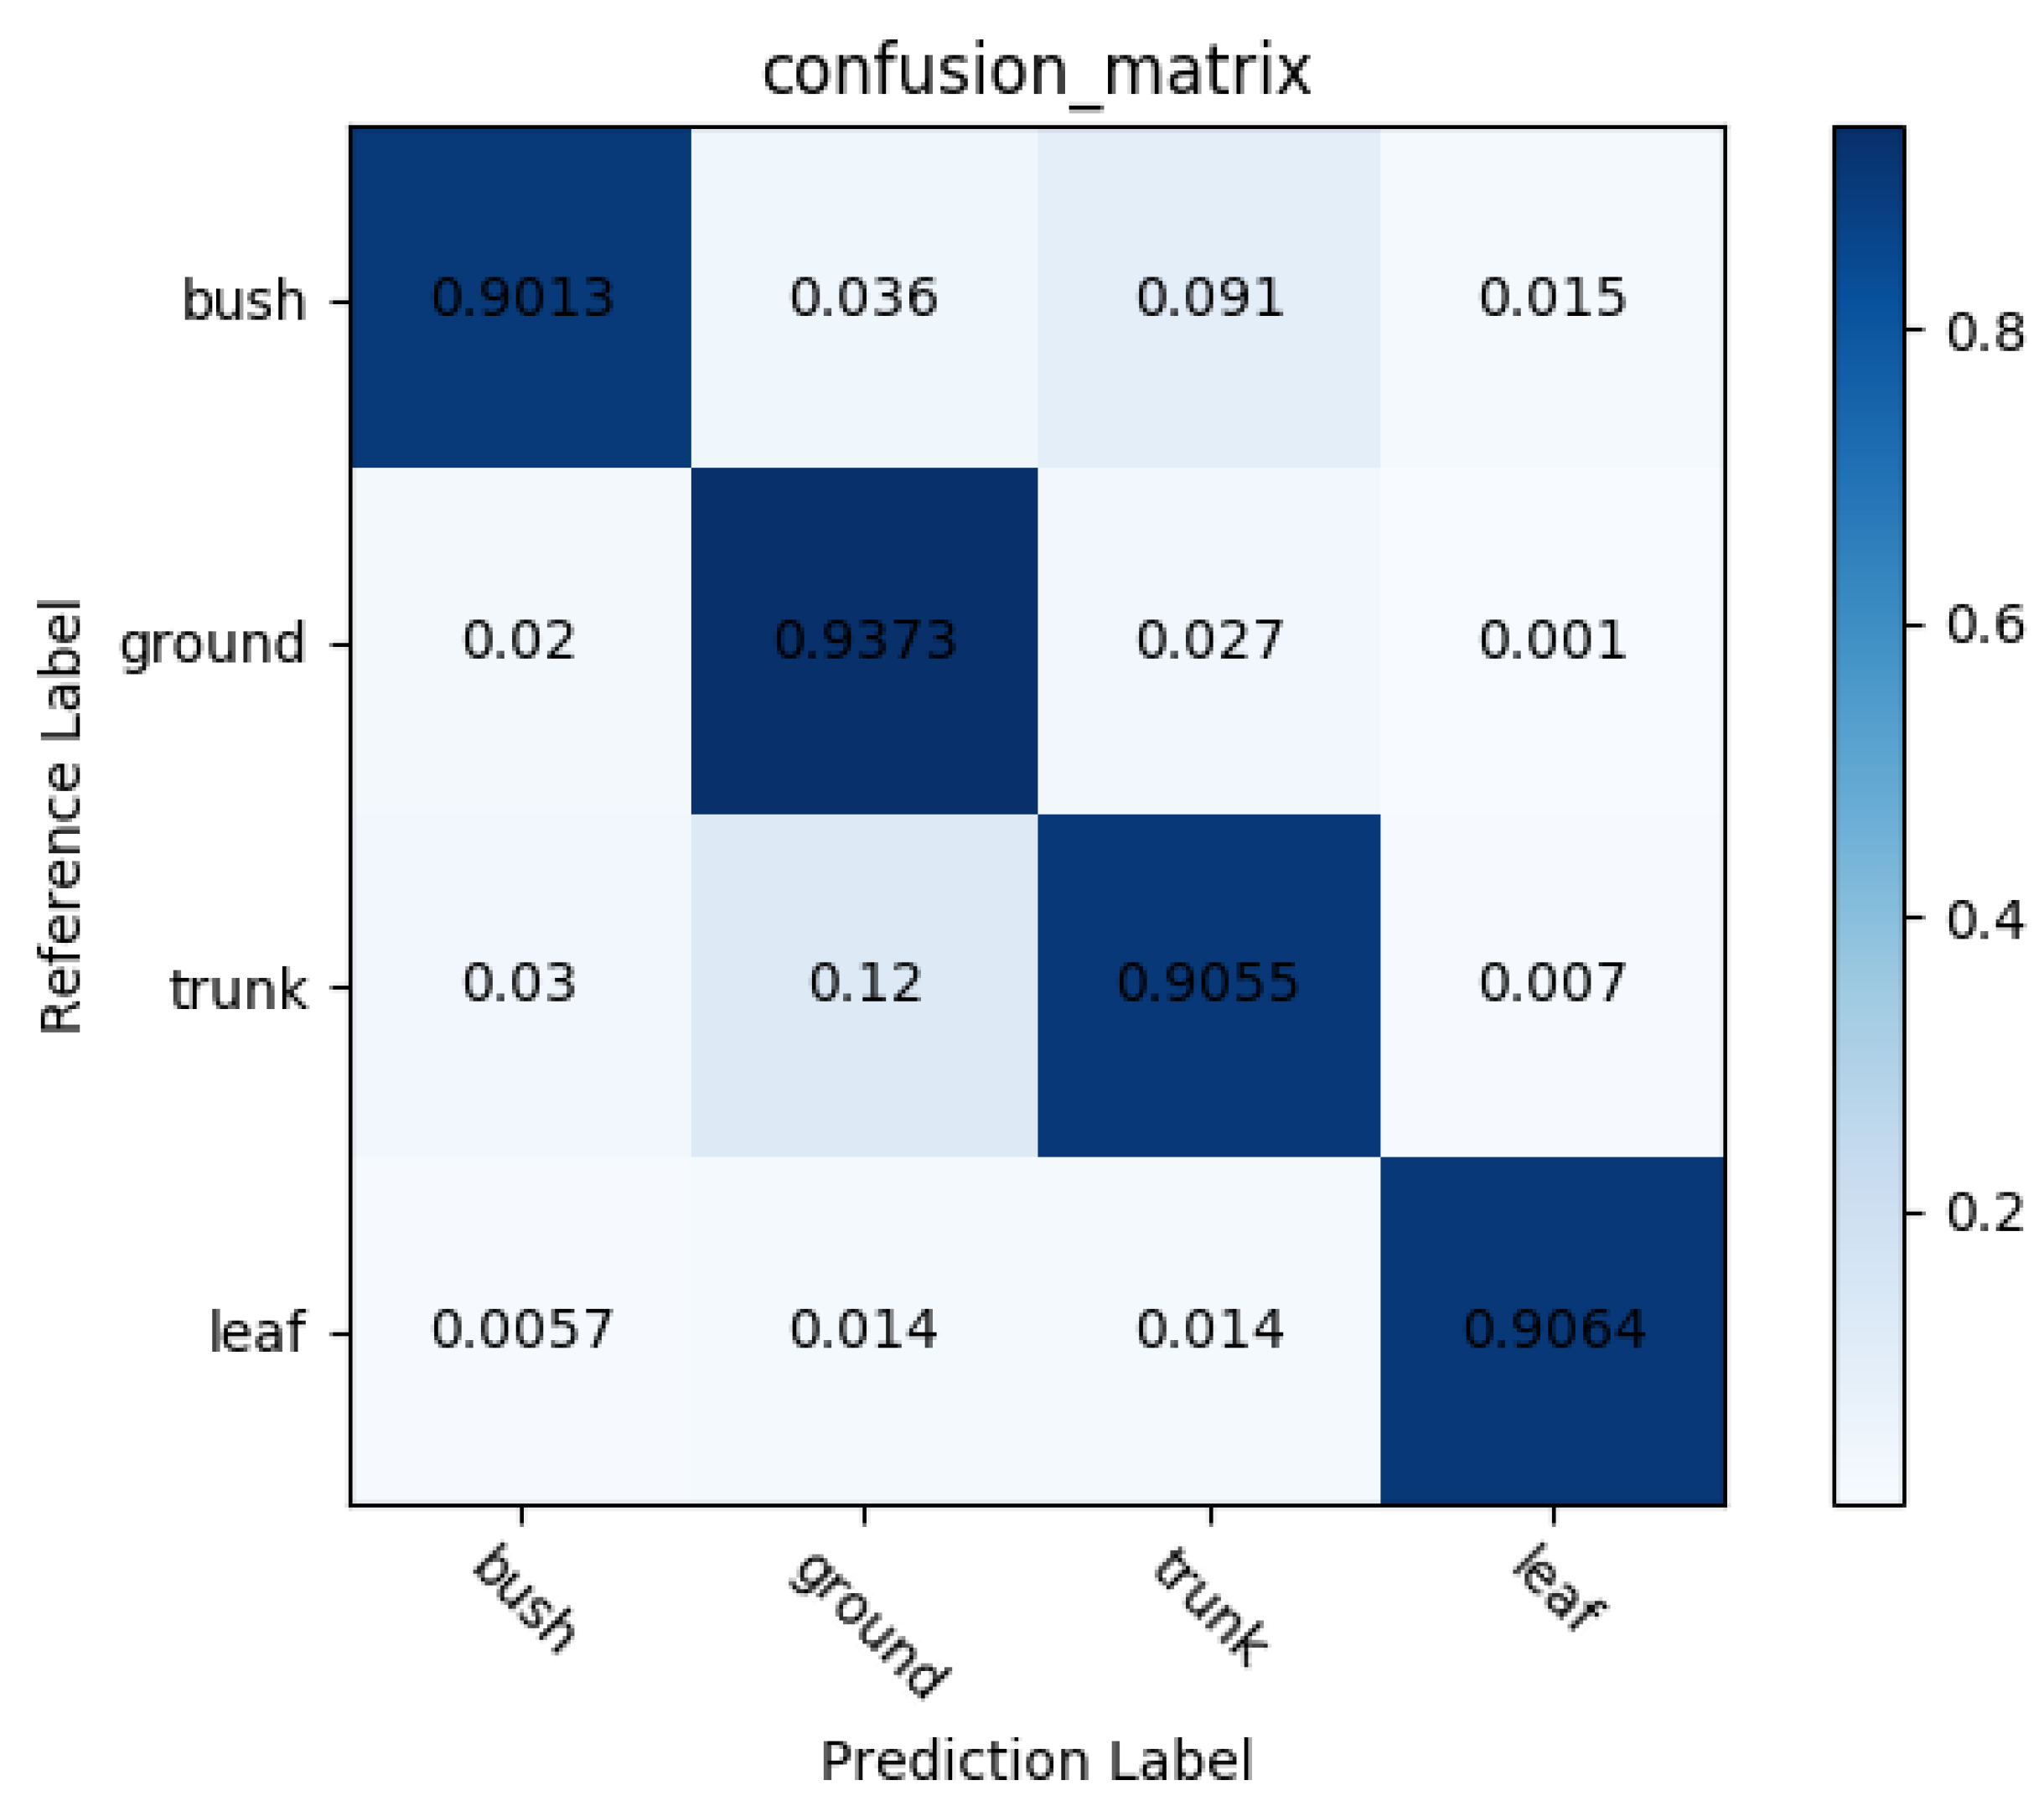
| Point Cloud Class | Forest-PointNet Accuracy | PointNet Accuracy |
|---|---|---|
| Bush | 0.901422 | 0.851690 |
| Ground | 0.937353 | 0.890175 |
| Trunk | 0.905572 | 0.853921 |
| Leaf | 0.906432 | 0.854430 |
| Average Accuracy | 0.909807 | 0.862554 |
| Method | Leaf Precision | Ground Precision | Trunk Precision | Bush Precision | Overall Precision |
|---|---|---|---|---|---|
| PointNet | 0.8544 | 0.8901 | 0.8539 | 0.8516 | 0.862554 |
| PointNet++ | 0.8373 | 0.9020 | 0.6790 | 0.8341 | 0.85195 |
| PointCNN | 0.8833 | 0.8512 | 0.8233 | 0.8500 | 0.853921 |
| Forest-PointNet | 0.9064 | 0.9373 | 0.9055 | 0.9014 | 0.909807 |
Disclaimer/Publisher’s Note: The statements, opinions and data contained in all publications are solely those of the individual author(s) and contributor(s) and not of MDPI and/or the editor(s). MDPI and/or the editor(s) disclaim responsibility for any injury to people or property resulting from any ideas, methods, instructions or products referred to in the content. |
© 2023 by the authors. Licensee MDPI, Basel, Switzerland. This article is an open access article distributed under the terms and conditions of the Creative Commons Attribution (CC BY) license (https://creativecommons.org/licenses/by/4.0/).
Share and Cite
Ma, Z.; Dong, Y.; Zi, J.; Xu, F.; Chen, F. Forest-PointNet: A Deep Learning Model for Vertical Structure Segmentation in Complex Forest Scenes. Remote Sens. 2023, 15, 4793. https://doi.org/10.3390/rs15194793
Ma Z, Dong Y, Zi J, Xu F, Chen F. Forest-PointNet: A Deep Learning Model for Vertical Structure Segmentation in Complex Forest Scenes. Remote Sensing. 2023; 15(19):4793. https://doi.org/10.3390/rs15194793
Chicago/Turabian StyleMa, Zhibin, Yanqi Dong, Jiali Zi, Fu Xu, and Feixiang Chen. 2023. "Forest-PointNet: A Deep Learning Model for Vertical Structure Segmentation in Complex Forest Scenes" Remote Sensing 15, no. 19: 4793. https://doi.org/10.3390/rs15194793
APA StyleMa, Z., Dong, Y., Zi, J., Xu, F., & Chen, F. (2023). Forest-PointNet: A Deep Learning Model for Vertical Structure Segmentation in Complex Forest Scenes. Remote Sensing, 15(19), 4793. https://doi.org/10.3390/rs15194793