Article

EddyDet: A Deep Framework for Oceanic Eddy Detection in Synthetic Aperture Radar Images

1
Institut für Meereskunde, Universität Hamburg, 20146 Hamburg, Germany
2
Key Laboratory of Network Information System Technology (NIST), Institute of Electronics, Chinese Academy of Sciences, Beijing 100190, China
3
The Aerospace Information Research Institute, Chinese Academy of Sciences, Beijing 100094, China
*
Author to whom correspondence should be addressed.
Remote Sens. 2023, 15(19), 4752; https://doi.org/10.3390/rs15194752
Submission received: 9 August 2023 / Revised: 14 September 2023 / Accepted: 18 September 2023 / Published: 28 September 2023

Abstract

:
This paper presents a deep framework EddyDet to automatically detect oceanic eddies in Synthetic Aperture Radar (SAR) images. The EddyDet has been developed using the Mask Region with Convolutional Neural Networks (Mask RCNN) framework, incorporating two new branches: Edge Head and Mask Intersection over Union (IoU) Head. The Edge Head can learn internal texture information implicitly, and the Mask IoU Head improves the quality of predicted masks. A SAR dataset for Oceanic Eddy Detection (SOED) is specifically constructed to evaluate the effectiveness of the EddyDet model in detecting oceanic eddies. We demonstrate that the EddyDet is capable of achieving acceptable eddy detection results under the condition of limited training samples, which outperforms a Mask RCNN baseline in terms of average precision. The combined Edge Head and Mask IoU Head have the ability to describe the characteristics of eddies more correctly, while the EddyDet shows great potential in practice use accurately and time efficiently, saving manual labor to a large extent.

1. Introduction

Oceanic eddies are coherent rotating structures of water that are globally dispersed in the ocean [1,2,3]. The horizontal spatial scales of eddies can range from a few hundred meters to a few hundred kilometers [4,5]. Eddies that possess a diameter smaller than the initial baroclinic Rossby radius of deformation are classified as submesoscale eddies, while those surpassing this radius are identified as mesoscale eddies. These phenomena can travel great distances before fading away, contributing significantly to the transport and mixing of momentum and tracers across the world’s oceans [6,7,8,9,10,11,12]. Furthermore, eddies can manifest along shipping pathways and in offshore areas, thereby impacting human marine activities [13]. Therefore, oceanic eddy study has significant research value in the realms of physical oceanography and ocean exploitation [3,14,15].
Oceanic eddy detection plays a critical role in promoting the progress of eddy science [16,17]. Accurate detection of oceanic eddies is beneficial for monitoring the dynamics of eddies on physical properties, transport, circulation, evolution, decay, and their impact on other ocean processes [18,19,20,21]. However, oceanic eddies can be highly variable due to the influence of ocean currents, sea surface winds, and bottom topography [9,22], making their detection a more difficult task.
Oceanic eddy information was gathered through in situ measurements in the early days [5]. With advancements in satellite sensors, the detection of eddies has become feasible by analyzing abundant remote sensing data like satellite altimetry and Synthetic Aperture Radar(SAR) [4,5,17], or satellite-derived parameters, such as Sea Surface Temperature (SST) [23,24], Ocean Color/Chlorophyll (CHL) [25,26], and Sea Surface Height (SSH) [14]. There is a risk of false positives when using SST and CHL products, since various other ocean phenomena can also affect sea surface temperature and surface ocean color [27]. SSH products utilize extensive spatiotemporal interpolation to fill in gaps between satellite tracks, leading to reduced resolution and uncertainty in undersampled regions [28].
Satellite altimetry has proven to be a robust and effective tool for the worldwide detection, characterization, and tracking of mesoscale eddies [9,29]. Nonetheless, studies focusing on smaller phenomena such as submesoscale eddies require remote sensing data with higher spatial resolution. In this regard, SAR is a preferred sensor due to its capability of providing high spatial resolution and sensitivity of radar signals to natural surfactants on the water surface [4,30,31,32,33,34]. Moreover, SAR images can capture oceanic eddy information under all day and all weather conditions. Therefore, SAR is an ideal and irreplaceable data source for submesoscale eddy detection.
In the previous study, three traditional methods were developed and widely applied for oceanic eddy detection: the Okubo-Weiss (O-W) [35,36,37], Vector-Geometry (V-G) [38,39], and Winding-Angle (W-A) algorithms [40,41,42]. The O-W method needs to manually select suitable thresholds for specific regions. The V-G method needs to scan oceanic data point by point, identify potential vorticity core points, and further filter them based on vortex geometric characteristics, which is very time-consuming. The W-A method tends to detect eddies with larger boundaries and sometimes exhibits sharp and anomalous eddy boundaries [43]. All of these traditional approaches require the definition of eddies as regions that satisfy specific constraint conditions. The morphological structure of oceanic eddies tends to vary under different oceanic conditions [22], making it challenging to establish a universal threshold or fixed constraint condition in advance. Consequently, traditional eddy detection algorithms often encounter issues such as missed detection, false detection, and limited generalization capability.
In recent years, an increasing number of studies have been conducted on the detection of eddies using SAR data [17,27,33,44,45,46]. Among them, several studies have utilized deep learning approaches to automatically detect eddies in SAR images. Huang et al. [27] presented a deep neural network called DeepEddy to acquire the characteristics of ocean eddies using convolutional neural networks (CNN) with Principal Component Analysis (PCA) filters. The primary emphasis of their model was on the eddy classification task. Zhou et al. [46] proposed a Multifeature Fusion Neural Network (MFNN) detector, which was built on ResNet-50 [47] and Atrous Spatial Pyramid Pooling (ASPP), for the purpose of detecting various oceanic phenomena, including eddies. It is noteworthy that the MFNN model does not provide identification for individual instances of eddies. Xia et al. [17] and Khachatrian et al. [45] employed YOLO-based networks [48] to detect the bounding boxes of eddies. However, compared to pixel-wise masks that provide detailed information for each object instance, the limited information provided by bounding boxes may not be sufficient for various downstream tasks, such as eddy parameter inversion.
At present, the development of an end-to-end model that can automatically identify and segment individual objects within an image at the pixel level shows great promise. Furthermore, the lack of properly labeled data poses a significant challenge in the automatic detection of oceanic eddies.
This paper introduces a new oceanic eddy detection network called EddyDet, which aims to identify and segment individual eddies accurately. Unlike existing deep learning techniques for SAR eddy detection, our approach takes into account the crucial role of learning the internal edge information of the eddies. Additionally, we place emphasis on enhancing the quality of instance segmentation masks to contribute to performance improvement.
The organization of the remaining sections in this paper is as follows. In Section 2, we introduce the data collection and the dataset construction process. The EddyDet architecture and experimental results are shown in Section 3. The discussion and insights are presented in Section 4, and the conclusions are presented in Section 5.

2. Dataset

At present, there are no existing open datasets specifically designed for SAR eddy detection, primarily because procuring and interpreting SAR data can be challenging. To tackle this issue, we initially construct a SAR dataset for Oceanic Eddy Detection, namely SOED, aimed at facilitating the study of automated eddy detection.

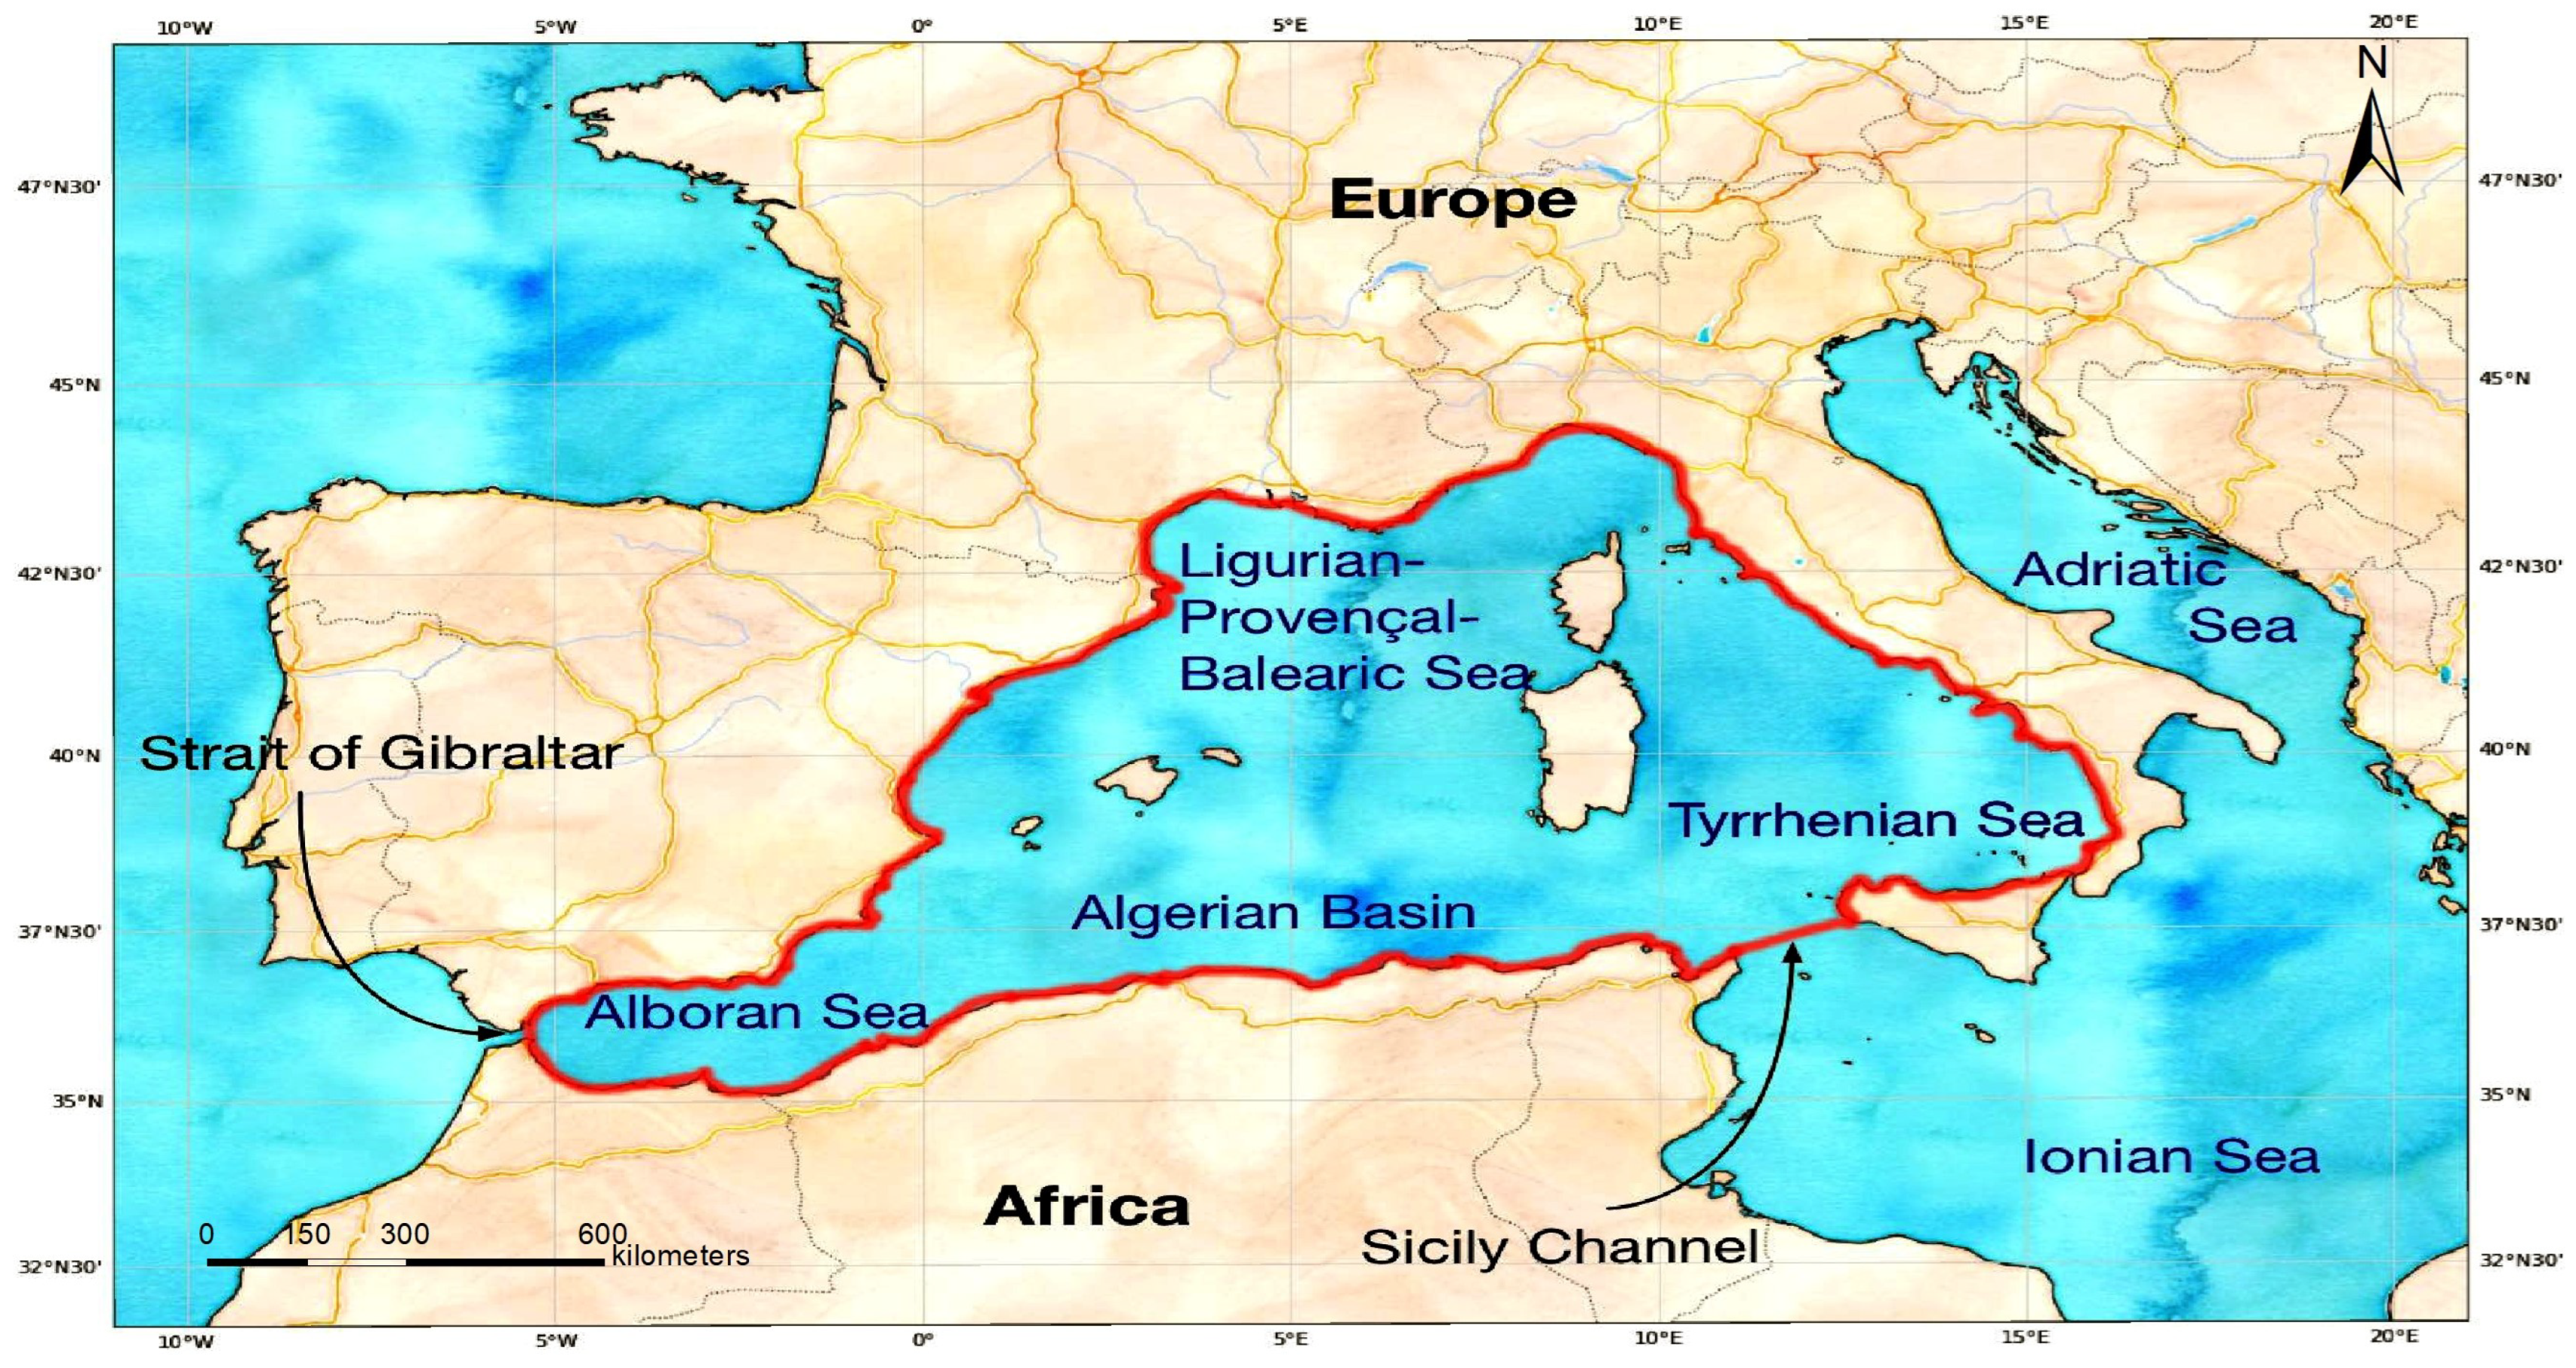
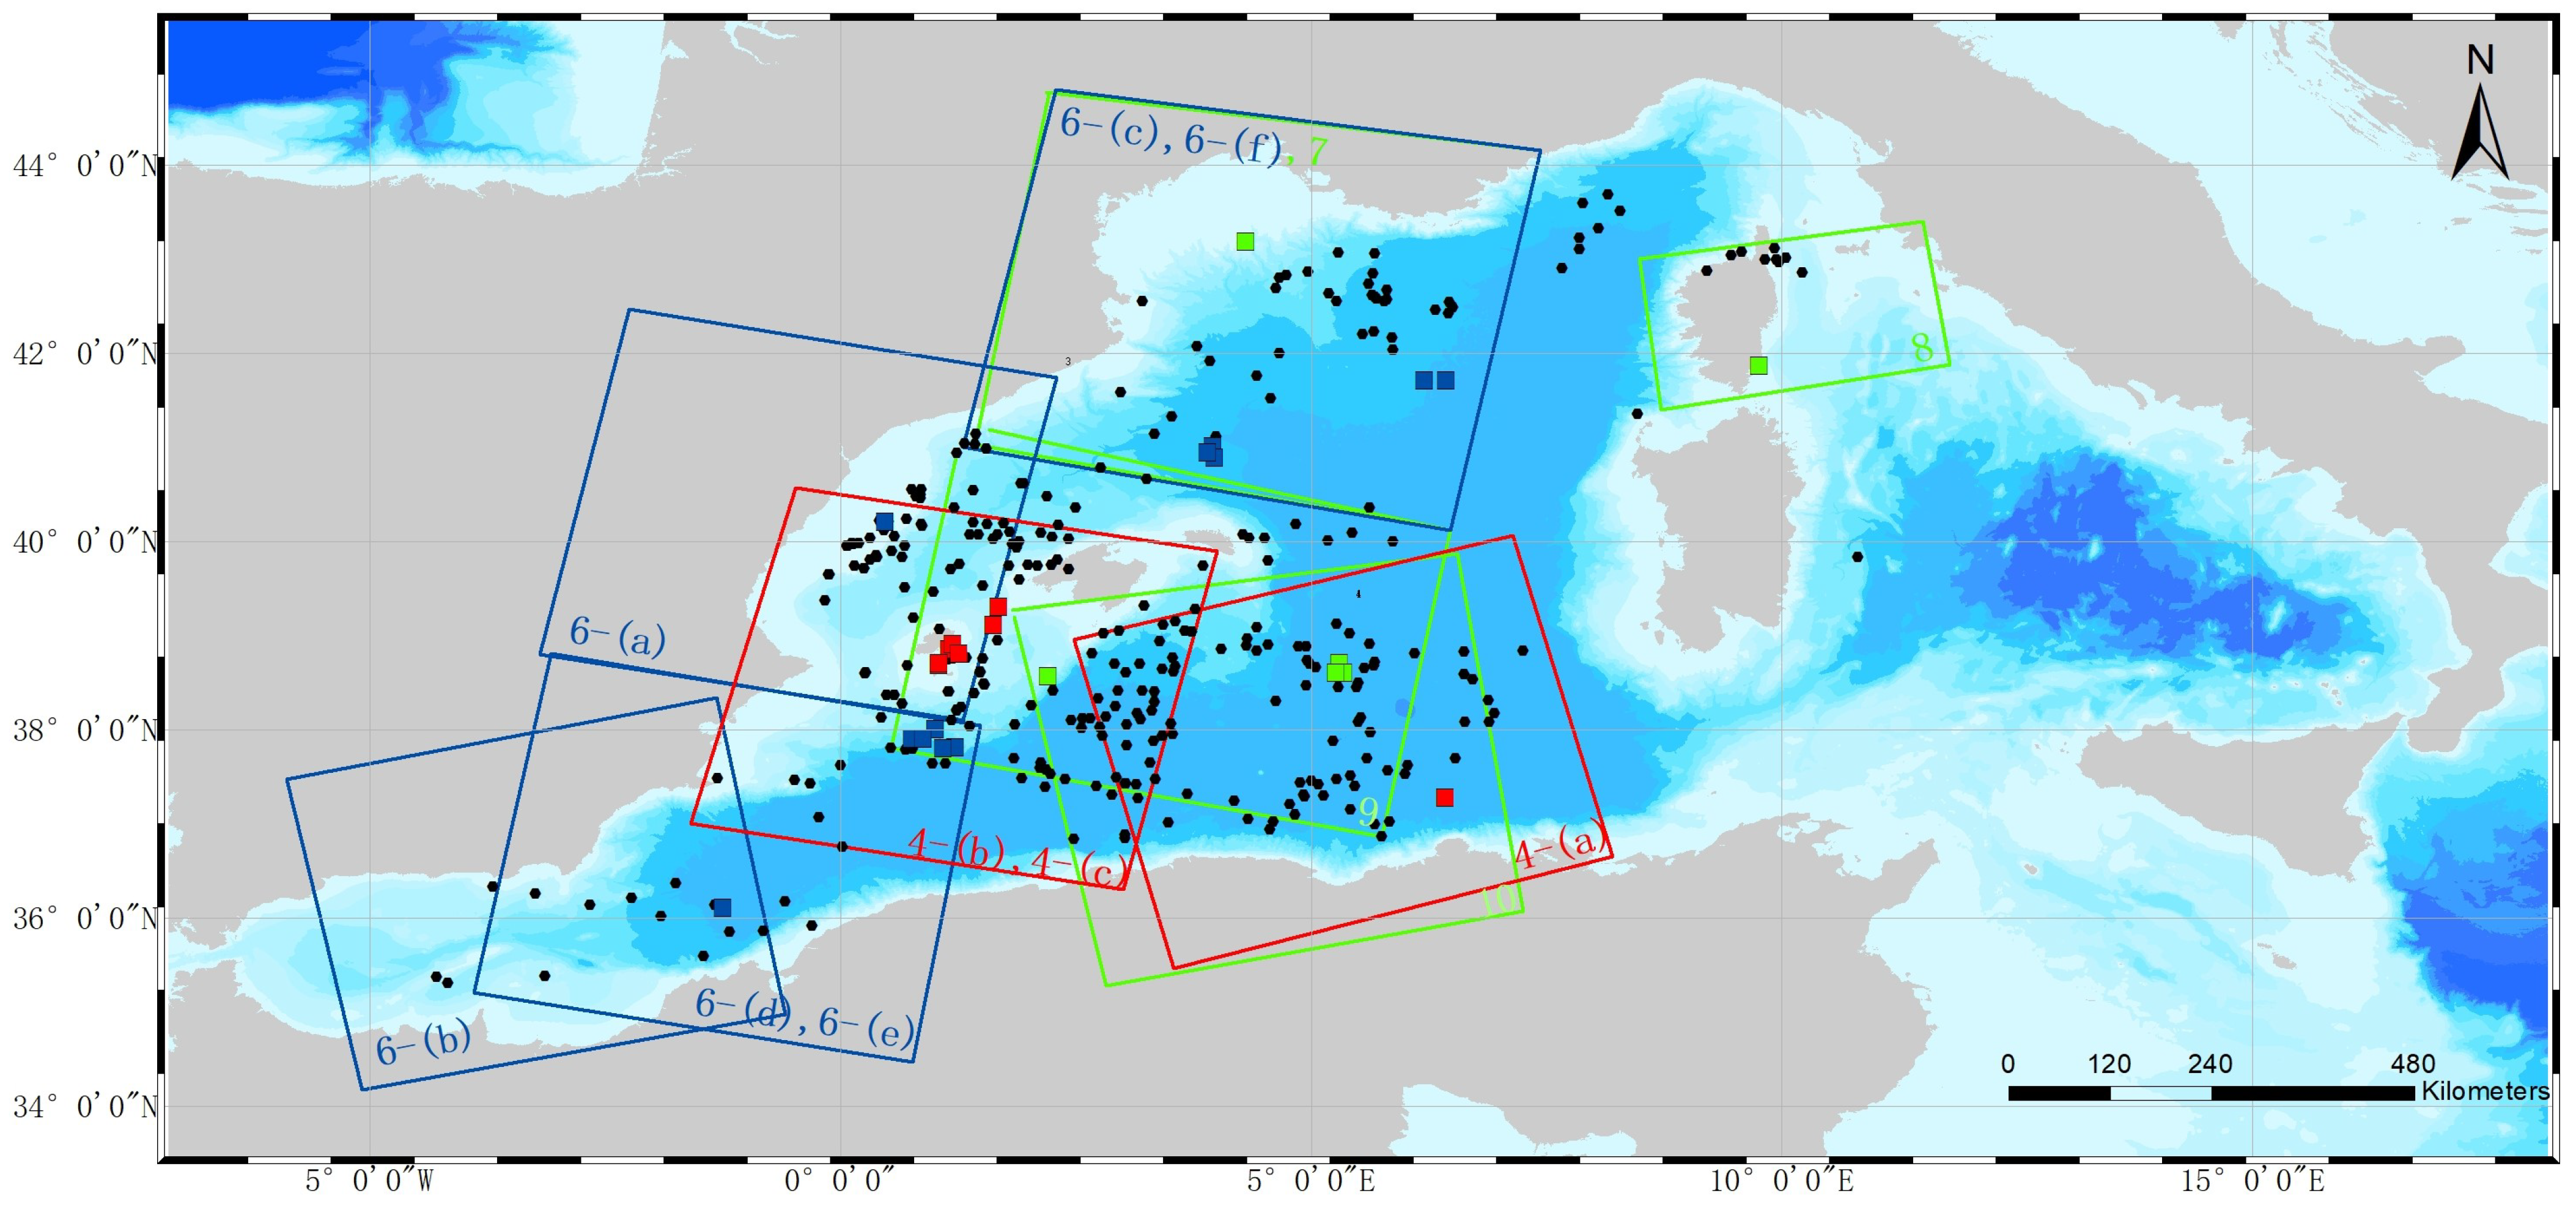
2.1. Data Collection

The data used for SOED is obtained from Sentinel-1A SAR data in the C band. The data are collected from the Western Mediterranean Sea between October 2014 and January 2015, specifically around 06:00 UTC and 18:00 UTC. The study area’s location is depicted in Figure 1.
The Mediterranean Sea, with its intricate circulation characterized by significant variability at the meso- and submesoscale, is an ideal area to study for understanding global-scale processes [49]. The Western Mediterranean Sea is impacted by a combination of factors, including the interaction between inflowing Atlantic waters and the Mediterranean Sea, as well as the intricate bathymetry and configuration of the coastline. These factors collectively give rise to diverse types of eddies and result in the formation of eddy structures exhibiting distinct spatial and temporal characteristics. Compared with the Gulf Stream and Agulhas Current which have been extensively studied, there have been limited studies focusing on investigating submesoscale eddies within the Western Mediterranean Sea.
The original SAR data are sourced from ESA’s Sentinels Scientific Data Hub and is in level 1 product format. For further information regarding the processing level, please refer to [50]. In our study, we downloaded all SAR images in the form of Ground Range Detected (GRD) products, obtained through Interferometric Wide (IW) or Extra Wide (EW) swath mode. On the sea surface, the cross-polarized channels (HV and VH) often exhibit significantly reduced levels in comparison to the co-polarized channels (VV and HH) [51], occasionally approaching the noise floor of the SAR system [52]. As a result, our dataset exclusively comprised co-polarized SAR data for its construction. In the SOED, the majority of eddies fall into the submesoscale category (with a selected radius of 15 km [4]).
The initial eddy annotations were provided by Annika Buck, which were further corrected through visual detection by us. The visual interpretation methods are extensively described in [5]. Following [53], the manifestation of eddies is exclusively attributed to two mechanisms: wave damping caused by surface films [54] and surface roughening resulting from wave-current interaction [55]. Eddies that become discernible due to surface films are referred to as “black” eddies, appearing as dark areas or lines. On the other hand, eddies that become visible due to wave-current interaction mechanisms are termed “white” eddies, manifesting as bright curved lines [53]. It should be emphasized that only “black” eddies are included in the SOED.
The resultant manual annotations are composed of the following essential eddy parameters: positional data (center coordinate), geometric details (one auxiliary coordinate at the outer boundary, maximum and minimum diameter), attribute information (rotation direction, type denoted as “black” or “white”), and SAR imaging particulars (date and time).
Following [5], the center of the eddy in this study is determined by considering the (optical) center of the spiral SAR image feature. The boundary of the eddy is defined based on the outermost features that can be attributed to the spiral feature. By examining the SAR image, the outermost characteristics or structures associated with the spiral feature are identified and used to define the boundary of the eddy.

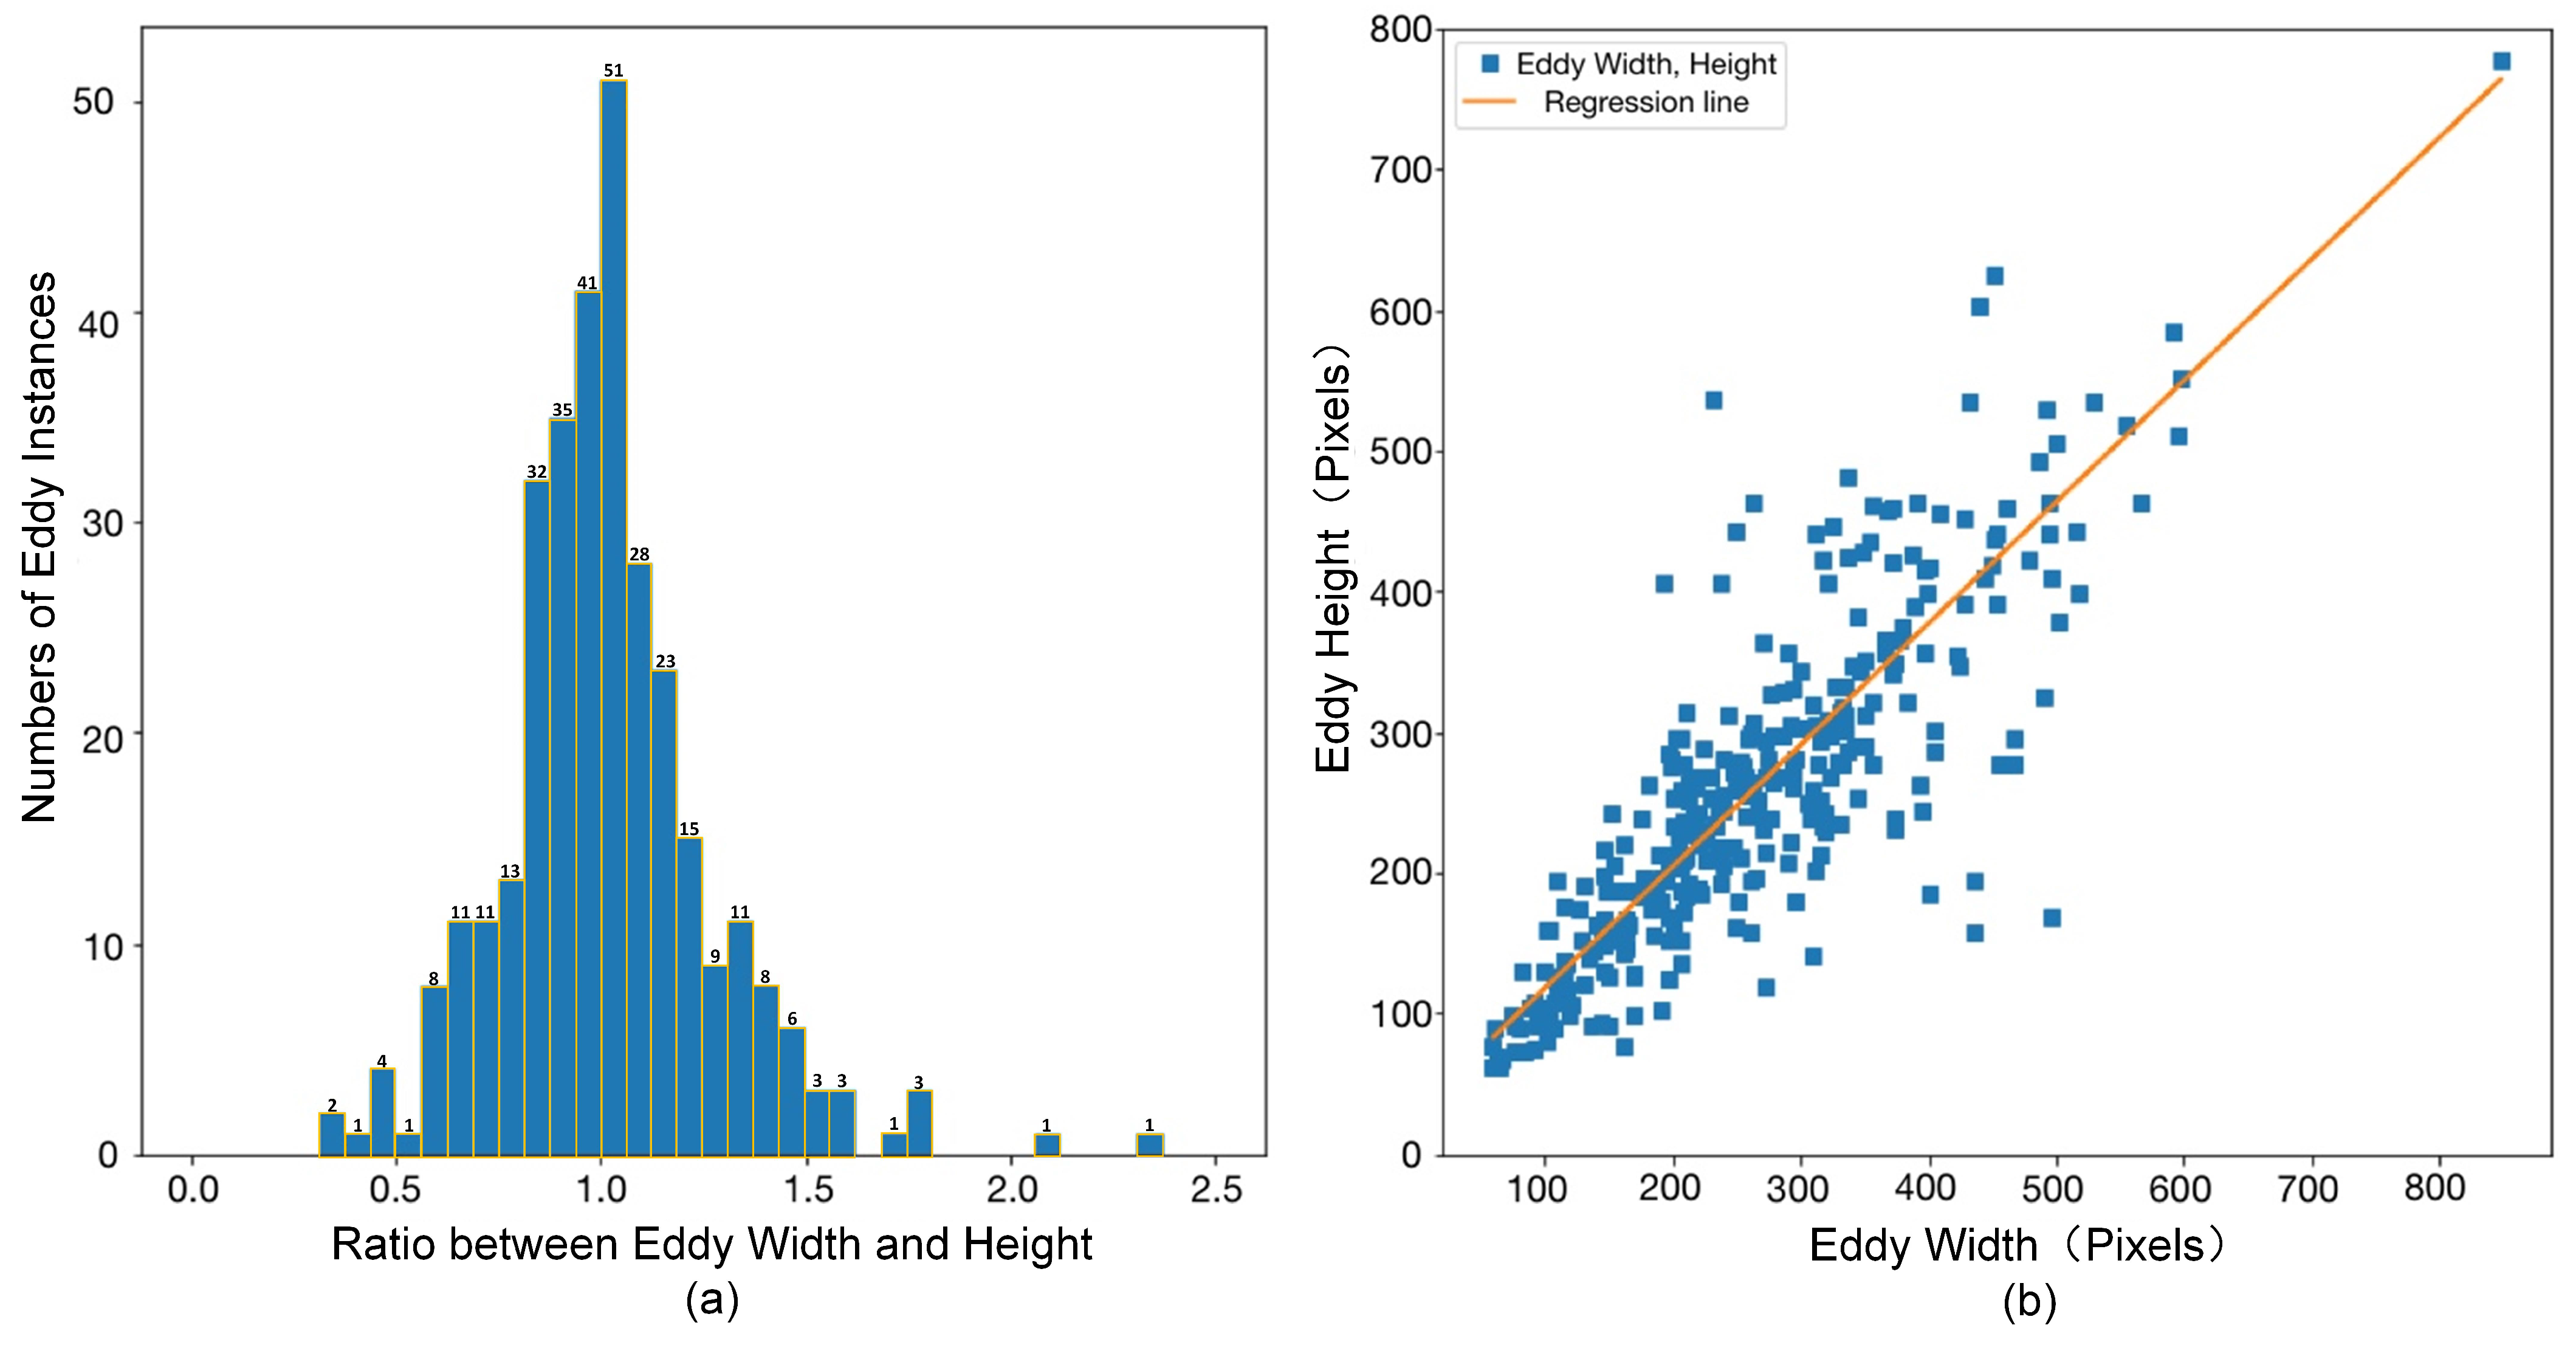
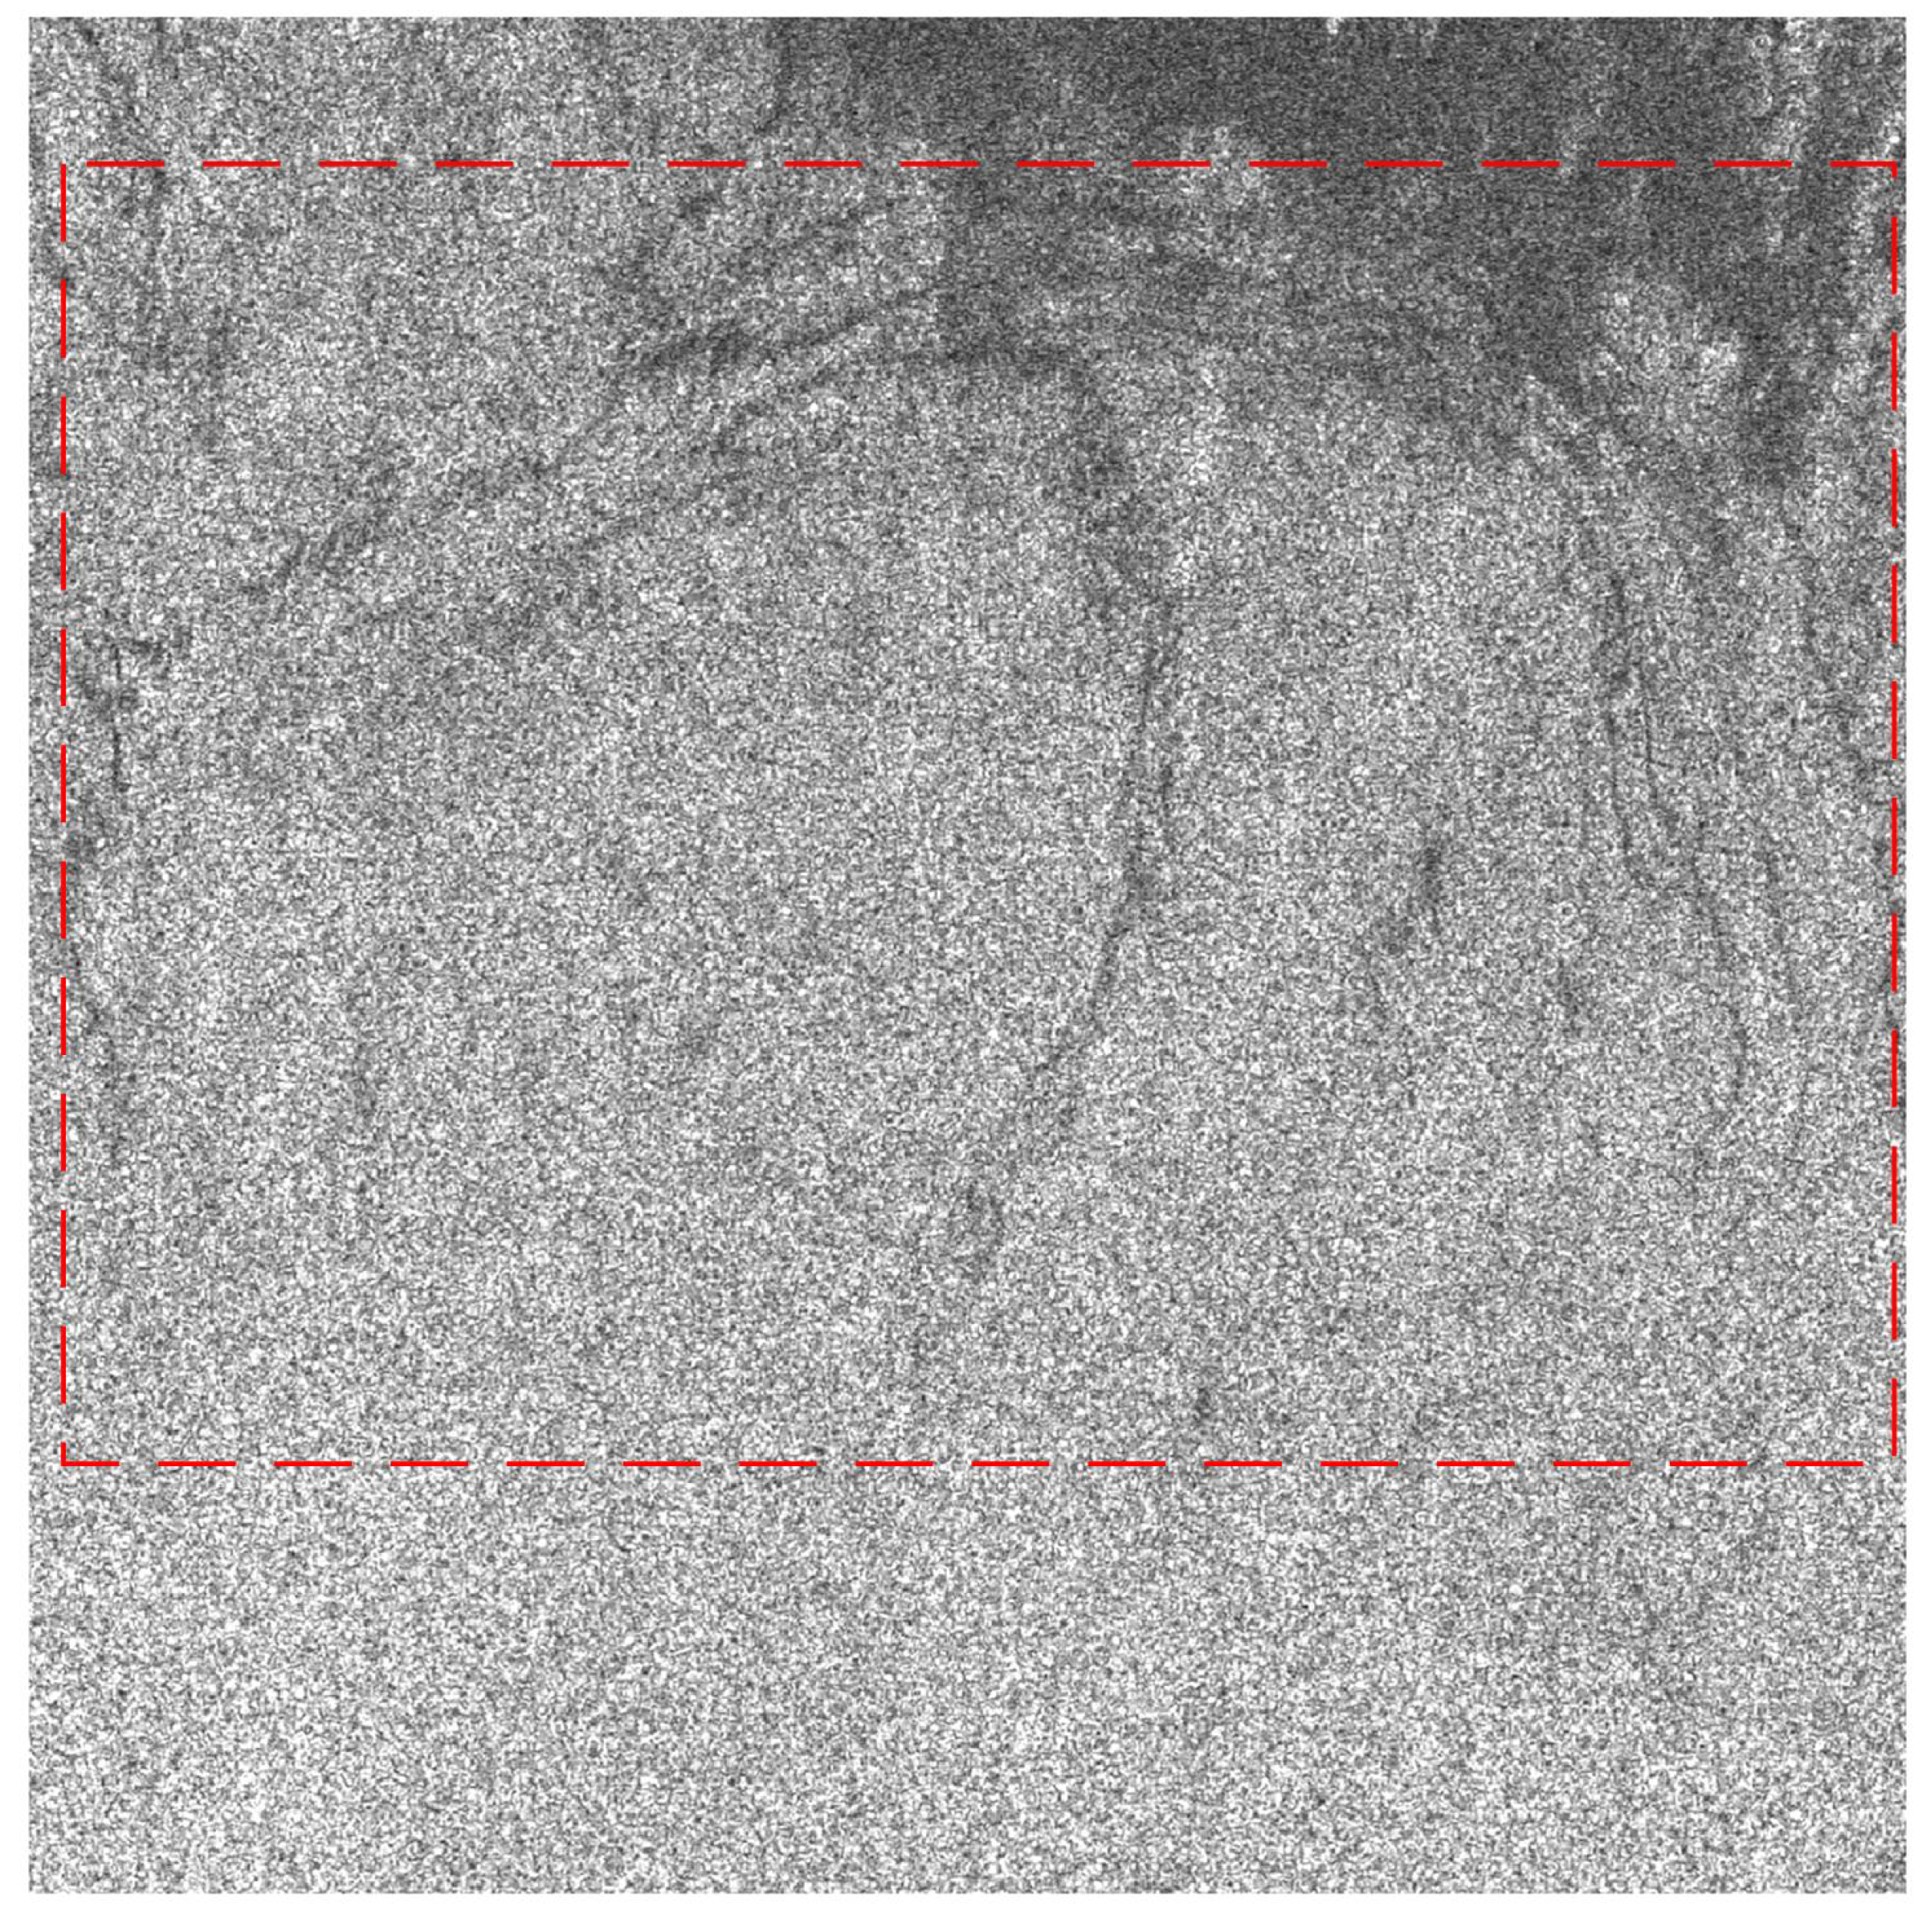
2.2. Dataset Construction

Utilizing the collected data, we outline a customized procedure for constructing our dataset. To begin, we preprocess all the downloaded SAR images using the Sentinel Application Platform (SNAP) Toolbox, which has been developed by the European Space Agency (ESA).
Following the application of the orbit file and radiometric calibration, we proceed with geocoding and land masking operations on the SAR images. Based on the manually annotated data, we extract SAR image subsets from SNAP with varying numbers of eddy instances, using the acquired eddy coordinate information. Next, we utilize contrast-limited adaptive histogram equalization [56] to enhance the SAR image subsets.
We deliberately avoid applying any speckle filters on SAR images to preserve the maximum amount of information. To convert the manual annotations, we employ self-designed Python scripts to automatically transform them into the Common Objects in Context (COCO) format [57]. This format is employed for storing bounding box and pixel-wise classification data, and it is extensively utilized in the field of computer vision.
The SOED is specifically developed for the instance segmentation task [58]. It comprises a set of 160 training images and 40 testing images, which collectively contain 260 and 62 eddy instances, respectively. Notably, the eddies included in the SOED have a wide range of diameters varying from 1.3 km to 15.87 km. In Figure 2, we provide information on the total geospatial coverage of all the eddies and sub-SAR images used in this paper.
The dimensions of SAR sub-images range from approximately 600 × 600 to 1200 × 1200 pixels. Figure 3 illustrates the size distribution of all the eddies. These statistics provide information on the proportions and sizes of the bounding boxes used to encapsulate the eddy instances in the dataset. Based on the distributions, the majority of eddies in the SOED exhibit a nearly circular shape and vary in size from 100 × 100 to 600 × 600 pixels. In Figure 4, we present three sets of eddy samples along with their original SAR images and COCO format annotations. Different colors are assigned to distinguish between different eddy instances.

3. Methodology

The existing Mask RCNN and Edge Enhancement model [59] has demonstrated its effectiveness in automatic oceanic eddy detection. The training process of this model consists of two steps. Firstly, edge features are extracted from the original images. Subsequently, both the detection results and original images are utilized for training deep learning networks.
However, this approach can be seen as a straightforward method to incorporate prior knowledge into deep learning. Other phenomena such as oil spills can also lead to the appearance of dark lines on SAR images. Therefore, it is crucial to develop more adaptable and efficient approaches for integrating prior knowledge.
The manual annotations of eddies are determined by the expert, considering the linear structure and morphological characteristics of the dark regions or lines observed in SAR images. However, it is extremely hard to annotate all of these dark pixels as prior knowledge to help the model learn. We observe that the internal dark areas or lines of eddies are highly related to the eddy boundaries. If we enhance the importance of the boundary pixels, it can help the model focus more on the intern texture morphology of eddies and corresponding learn better features through implicit learning. Additionally, it has been proved that focusing on mask equality improves the performance of instance segmentation tasks [60].
Inspired by the multi-task learning strategy in [61], we present an EddyDet model, which simultaneously learns boundary information and mask qualities. Our model is designed to emphasize instance boundaries [62] and mask scoring [60]. In this section, we will provide a detailed introduction to the EddyDet.

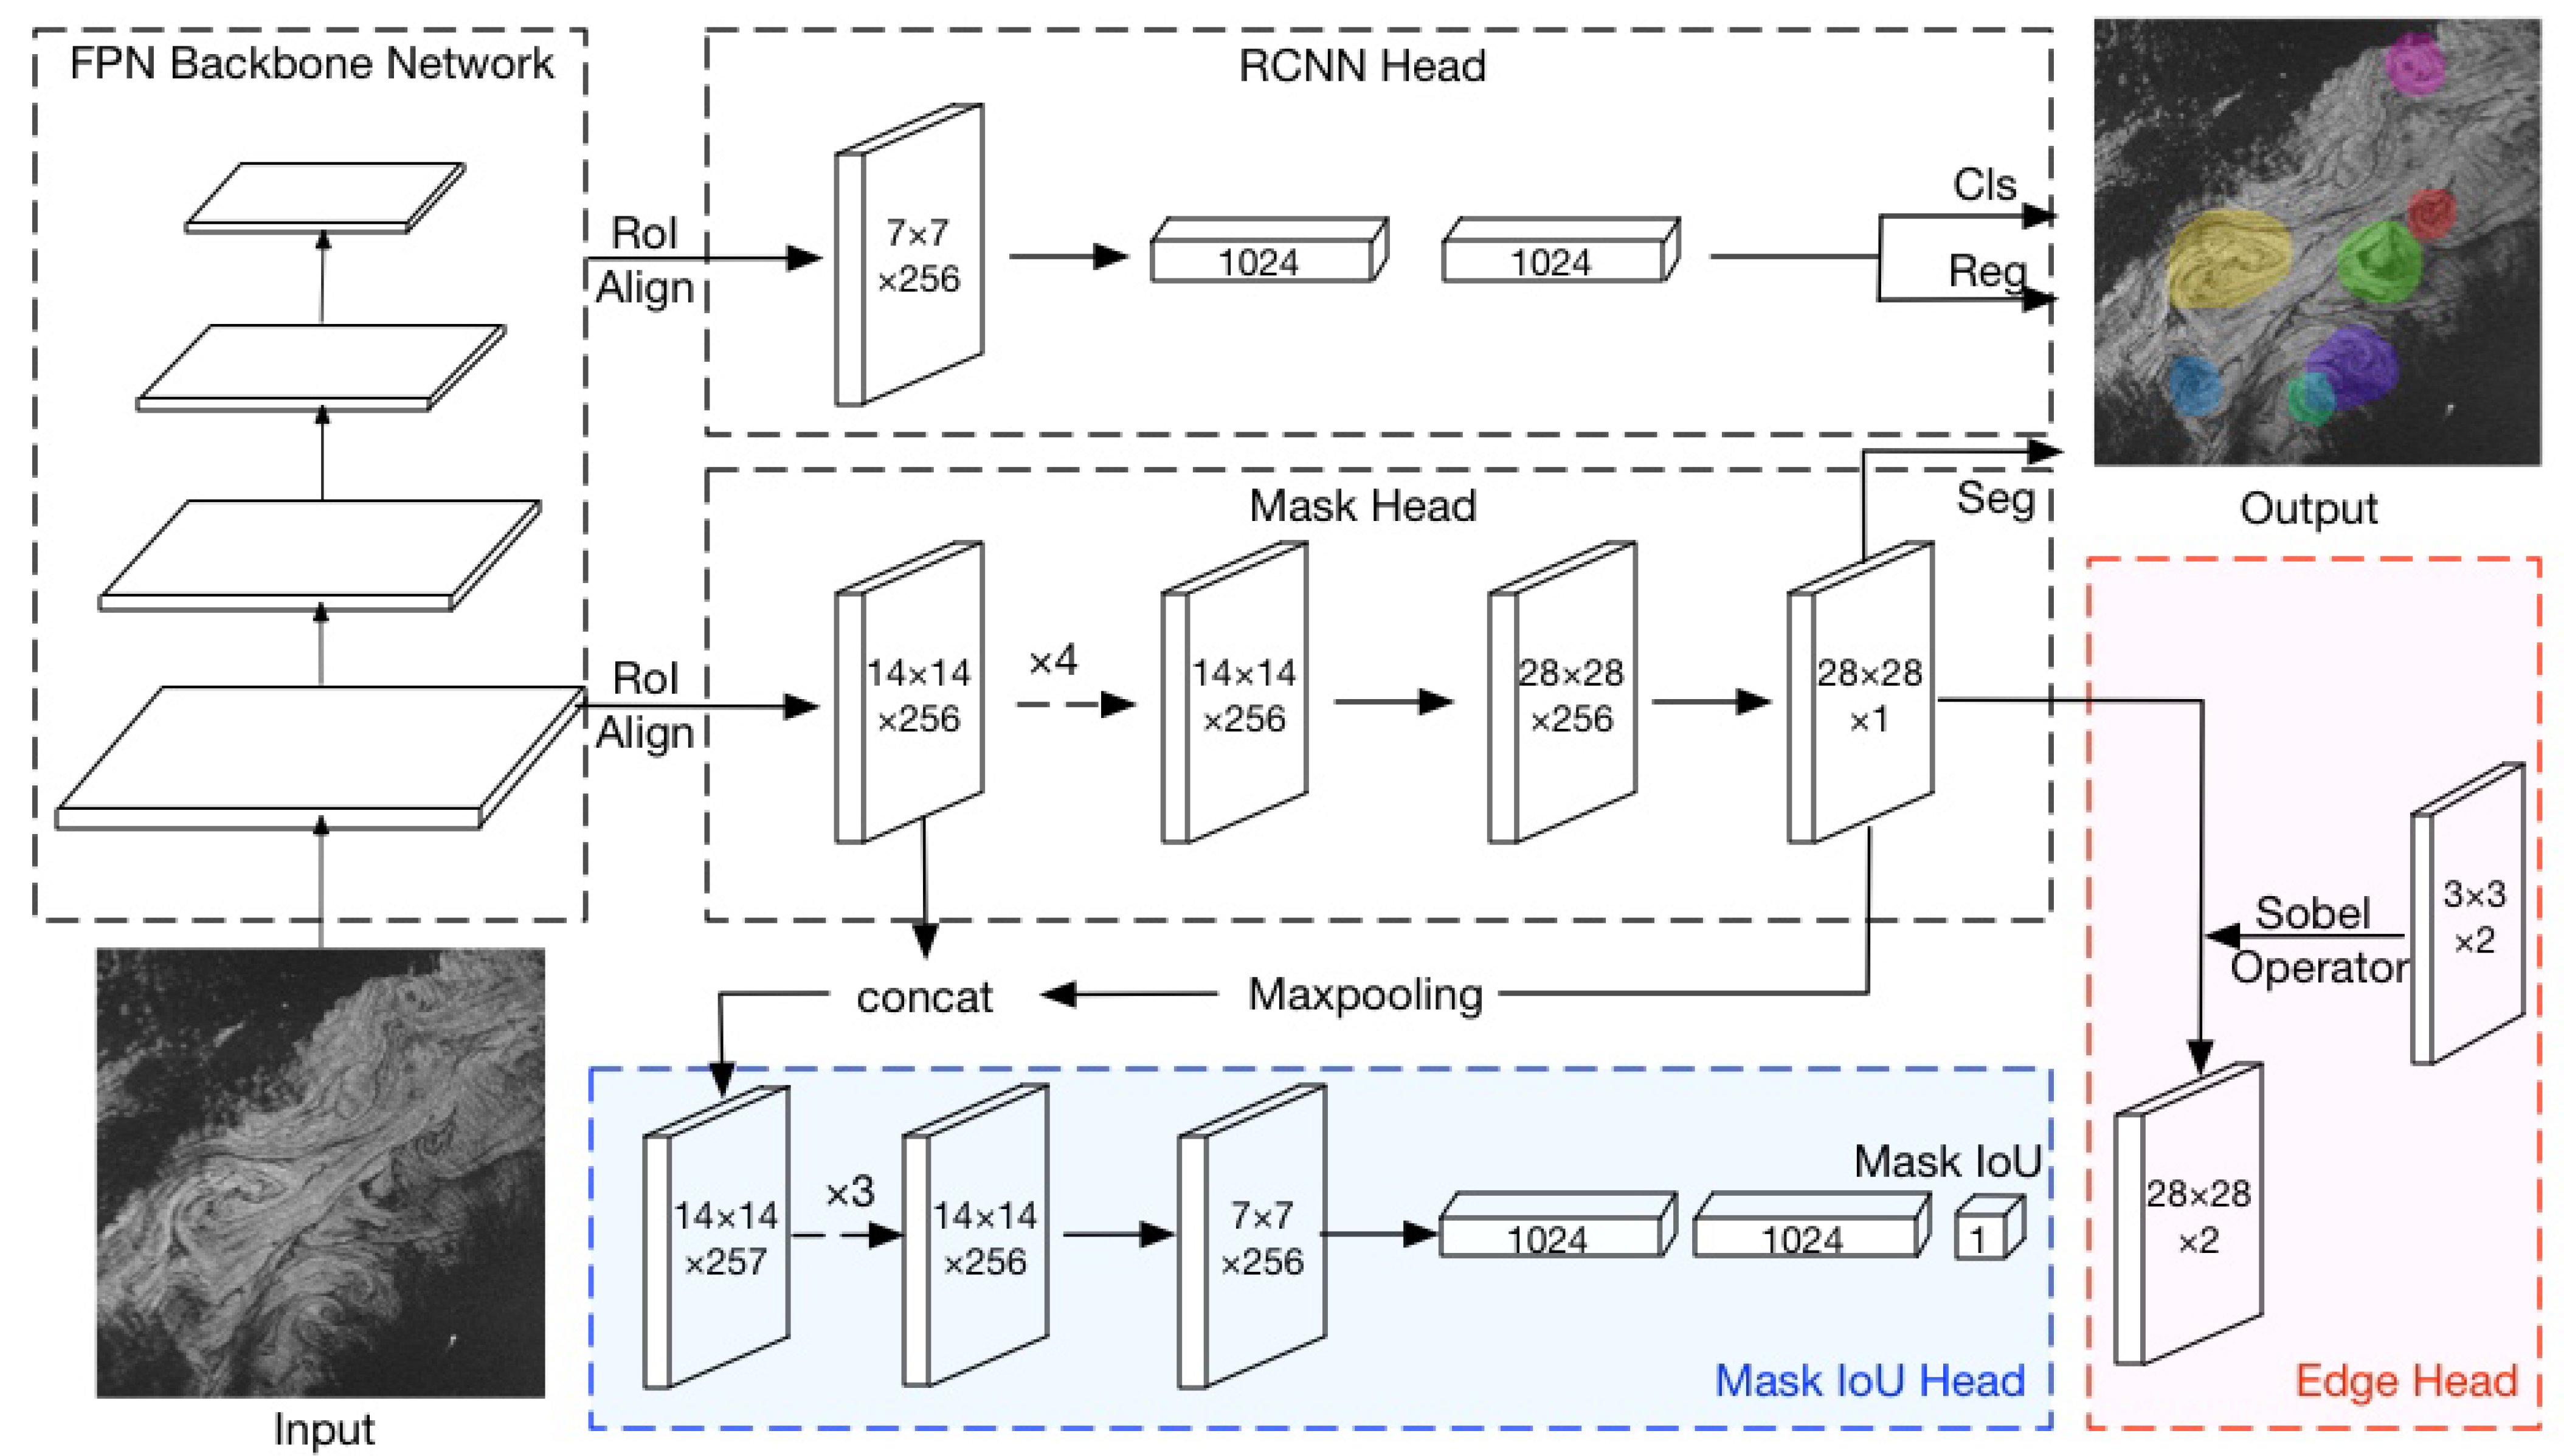
3.1. System Architecture

3.1.1. The Overall Architecture

Figure 5 illustrates the comprehensive structure of EddyDet, comprising five components: an FPN Backbone Network, an RCNN Head, a Mask Head, an Edge Head, and a Mask IoU Head. We adopt a standard segmentation approach, where an object detection module is employed to conduct object-wise segmentation on Region of Interests (ROIs).
First, the SAR images are processed through the FPN backbone network to extract feature maps at various levels. ROI Align is utilized to obtain the ROIs from the region proposals generated by the RPN and the multi-level feature maps. Next, we conduct proposal classification, bounding box regression (using the RCNN head), and mask prediction (using the mask head). Then, the predicted masks are passed to the Mask IoU Head and the Edge Head to estimate the Mask IoU and identify boundary edges, respectively. Finally, during the testing phase, the predicted Mask IoU is utilized to rescore the predicted masks.
Similar to the Mask RCNN [63], EddyDet also employs a multi-task learning approach. In addition to the existing tasks, we introduce two extra tasks, namely boundary learning and mask IoU regression, to enhance feature learning. Inspired by the functional design in Mask RCNN, we incorporate the loss functions for these new tasks. The overall loss is denoted as:
L E d d y D e t = L R P N + L R C N N + L M a s k + α L E d g e + β L M a s k I o U
where L R P N , L R C N N , L M a s k represent the standard losses in the Mask RCNN for the RPN module, RCNN Head, and Mask Head, respectively. The term L E d g e corresponds to the loss of the Edge Head, and L M a s k I o U denotes the loss of the Mask IoU Head. Our goal is to minimize the loss function containing these five components to achieve good performance.

3.1.2. The Edge Head

For the Edge Head, we employ edge detection filters such as Sobel and Laplacian as identity kernel convolutions. Specifically, we utilize a kernel size of 3 for these convolutions.
The Sobel operation consists of two filters: one for the horizontal direction and one for the vertical direction. These filters are employed as a first-order gradient operation. They can be expressed as:
S x = 1 0 1 2 0 2 1 0 1 , S y = 1 2 1 0 0 0 1 2 1
The Edge Head loss function L E d g e based on the Sobel operator can be written as follows:
L E d g e = 1 n i = 1 n ( m i ^ S x m i S x F 2 + m i ^ S y m i S y F 2 )
where n denotes the number of training samples within the Mask Head (considering a threshold of IoU 0.5 between the proposal box and the corresponding ground truth), m i ^ represents the predicted mask and m i signifies the matched ground-truth, · F denotes the Frobenius norm.
The Laplacian operator serves as a second-order gradient operator that identifies edges in an image by examining zero crossings. The Laplacian value L ( x , y ) of an image with pixel values I ( x , y ) is mathematically represented as:
L ( x , y ) = 2 I ( x , y ) x 2 + 2 I ( x , y ) y 2
The discrete Laplacian can be computed by convolving the image with the following kernel:
L = 0 1 0 1 4 1 0 1 0
In our experimental setup, we use an alternative version of the Laplacian operator that incorporates diagonal direction elements in the kernel:
L = 1 1 1 1 8 1 1 1 1
The Edge Head loss function L E d g e based on the Laplacian operator is then formulated as:
L E d g e = 1 n i = 1 n ( m i ^ L m i L F 2 )
where n denotes the number of training samples in the Mask Head. m i ^ represents the predicted mask, m i corresponds to the matched ground-truth mask, and · F denotes the Frobenius norm.
In the field of image processing, it is common practice to apply smoothing methods like Gaussian smoothing before applying detection filters to reduce noise. However, we have found that utilizing Gaussian smoothing does not yield beneficial results. One possible reason is that it also resulted in the loss of important features and details in the eddy structures. As a result, we have chosen to abandon the utilization of Gaussian smoothing.

3.1.3. The Mask IoU Head

For the Mask IoU Head, we employ a combination of ROI feature maps and the predicted mask as inputs. These inputs undergo four convolutions with a kernel size of 3, followed by three fully connected layers. Finally, we obtain the Mask IoU value. To determine the Mask IoU target for each instance, we calculate the IoU between the binary mask and the corresponding matched ground truth. We utilize the L 2 loss for regressing the Mask IoU, which is defined as:
L M a s k I o U = 1 n i = 1 n ( m i o u i ^ m i o u i 2 )
where n represents the number of training samples in the Mask Head, m i o u i ^ denotes the predicted mask IoU by the Mask IoU Head, and m i o u i represents the corresponding Mask IoU target.
Following the scoring system [60], we further break down the mask scoring tasks into two components: mask classification and mask IoU regression, defined as:
s c o r e m a s k = s c o r e c l s · s c o r e i o u
where s c o r e c l s denotes the classification score in the RCNN Head and s c o r e i o u represents the Mask IoU value in the Mask IoU Head. We use s c o r e m a s k as the final confidence score to rank the top-k target masks.

3.2. Evaluation Metrics

We use three COCO evaluation metrics [57] to report the oceanic eddy detection results, which are Average Precisions ( A P ) calculated at a specific IoU threshold. They are widely used for assessing the performance of object detection models.
A P serves as a measure of accuracy in object detection by computing the area under the precision-recall curve. This metric effectively summarizes the model’s capability to accurately identify objects across different confidence levels.
A P 0.5 denotes the average precision calculated at a specific IoU threshold of 0.5. IoU quantifies the overlap between the predicted bounding box and the ground truth bounding box.
A P 0.75 is similar to A P 0.5 , but employs a higher IoU threshold of 0.75. This metric imposes stricter criteria, necessitating higher precision in object detection.
These metrics offer a quantitative assessment of object detection model performance, effectively gauging their ability to detect objects and differentiate them from the background. Higher values of A P , A P 0.5 , and A P 0.75 indicate superior performance in object detection tasks.

3.3. Experimental Setup

Experiments are conducted using an implementation of the reproduced Mask RCNN based on the Keras framework with a TensorFlow backend. For the RPN part, we set five scale { 32 2 , 64 2 , 128 2 , 256 2 , 512 2 } anchors at five stages { P 2 , P 3 , P 4 , P 5 , P 6 } . According to the ratio statistics of the SOED, aspect ratios { 0.5 , 1 , 2 } are adopted in the workflow. We assigned equal values of 1 to both hyperparameters α and β in the loss function.
All training work is carried out on an NVIDIA Pascal Titan X GPU. The model is trained until convergence by using the SGD with a momentum set as 0.9 and a weight decay set as 0.0001. All weights are initialized by a Xavier initialization. The remaining configuration for ResNet-50 was performed following [63]. Under this setup, the training takes up to 2 h. For the testing phase, we use SoftNMS [64] and retain the top-100 score detections for each image.

3.4. Quantitative Results

A comparison of different detectors on the SOED is shown in Table 1. The Mask R-CNN framework serves as a state-of-the-art baseline. All the methods use the ResNet-50-FPN as a backbone. Since COCO evaluation metrics are more strict and comprehensive compared with precision or recall alone, the current values of eddy detection results are acceptable.
We can see that the EddyDet achieves the best results in all A P evaluation metrics, namely A P 0.5 , and A P 0.75 . Particularly, when evaluating with a less strict criterion like A P 0.5 , EddyDet surpasses the baseline by 12.9% and shows an improvement of 10% over Mask RCNN and Edge Enhancement, respectively. Notably, If we only add the Mask IoU Head, the eddy detection results are better than the Mask RCNN baseline in terms of all A P s , which verifies the effects of the Mask IoU Head.
The ablation study results of different Edge Heads are presented in Table 2. In our model, the sober filter outperforms the Laplacian filter, exhibiting a relative improvement of 0.7% in terms of A P . This outcome can be attributed to the two-filter structure of the Sobel filter, which allows the utilization of eddy orientation information during the back-propagation process.
Our model demonstrates the effectiveness of both the Mask IoU Head (including the Mask re-score mechanism during the test phase) and the Edge Head, surpassing the performance of the Mask RCNN baseline. Moreover, combining the Mask IoU Head and the Edge Head leads to better results compared to using either of them individually. This observation highlights the benefits of multi-task learning, as it allows the extraction of valuable representations from the same input images and enables the gradient from both tasks to influence shared feature maps.
To further explore the impact of different weights for the Edge Head and Mask IoU Head, we conducted experiments. Notably, we found that the model achieves the optimal experimental results when both Heads are assigned equal weights.

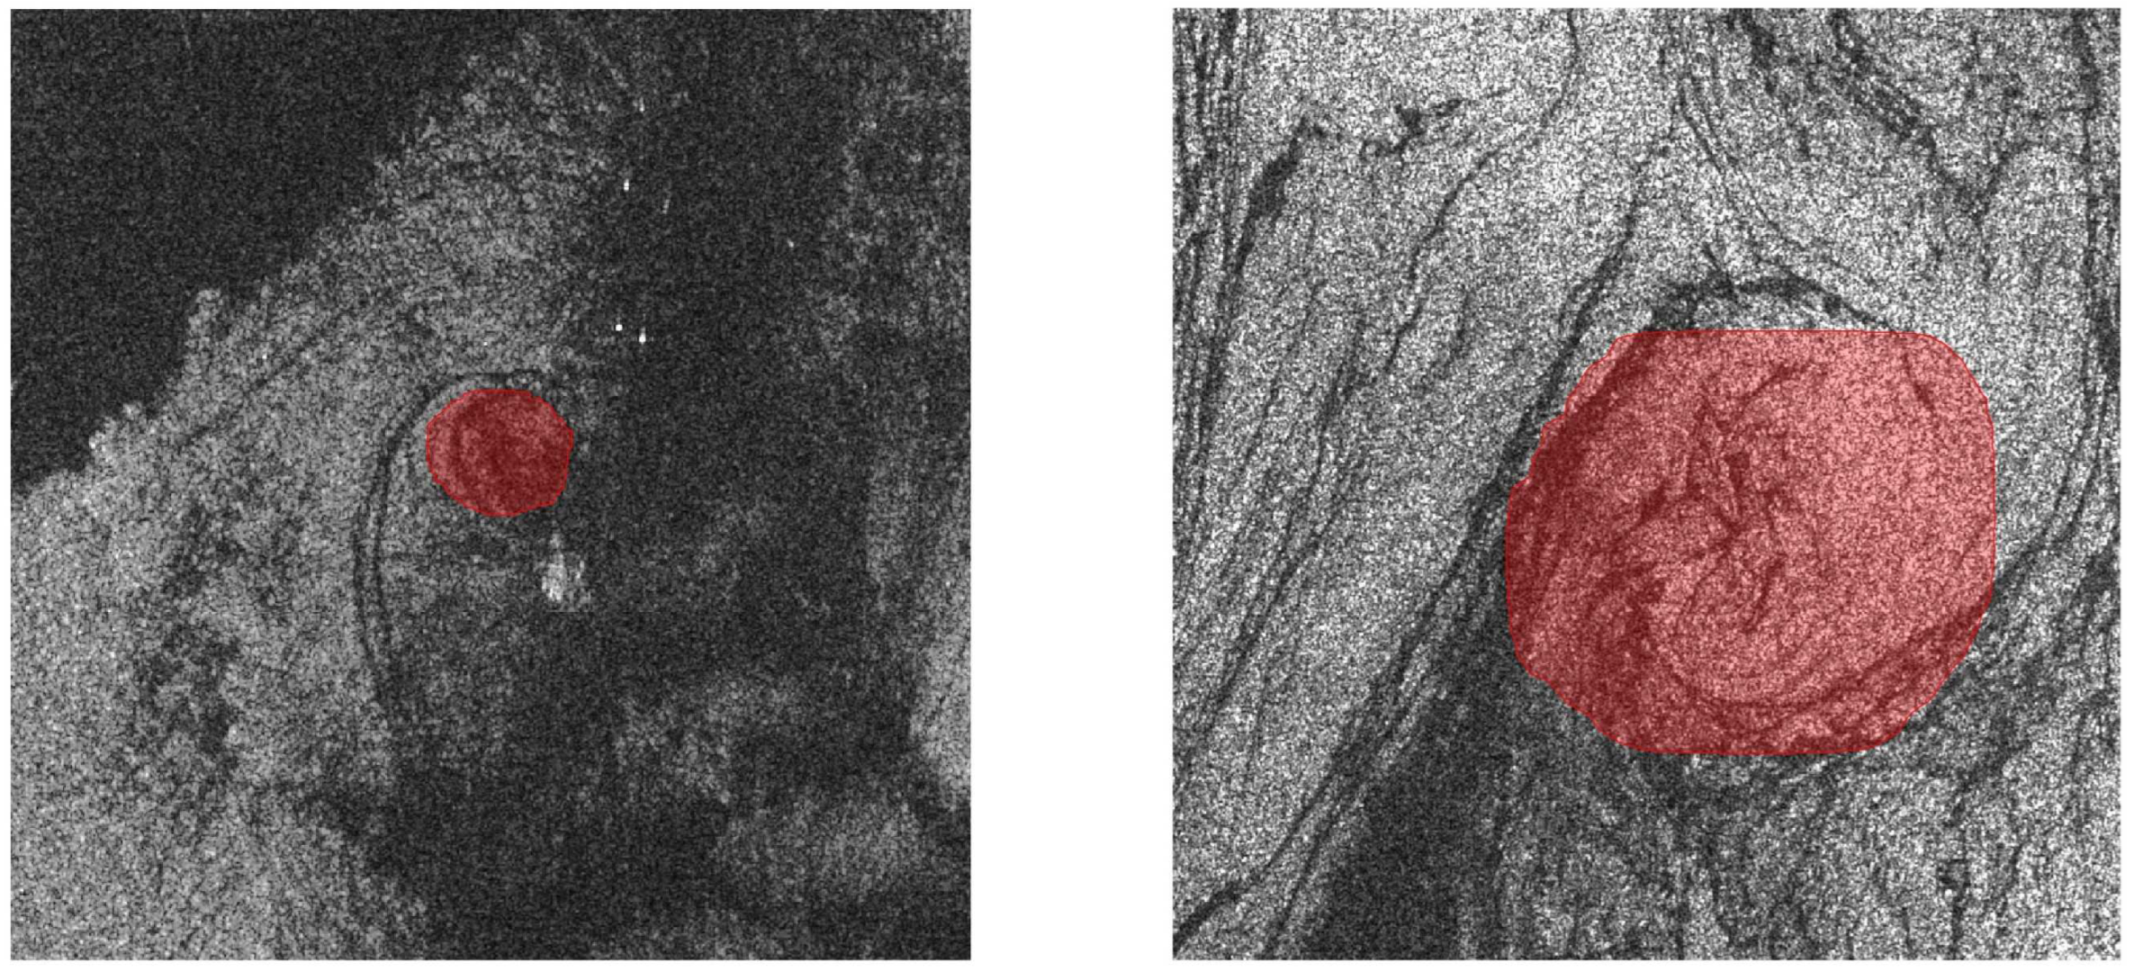
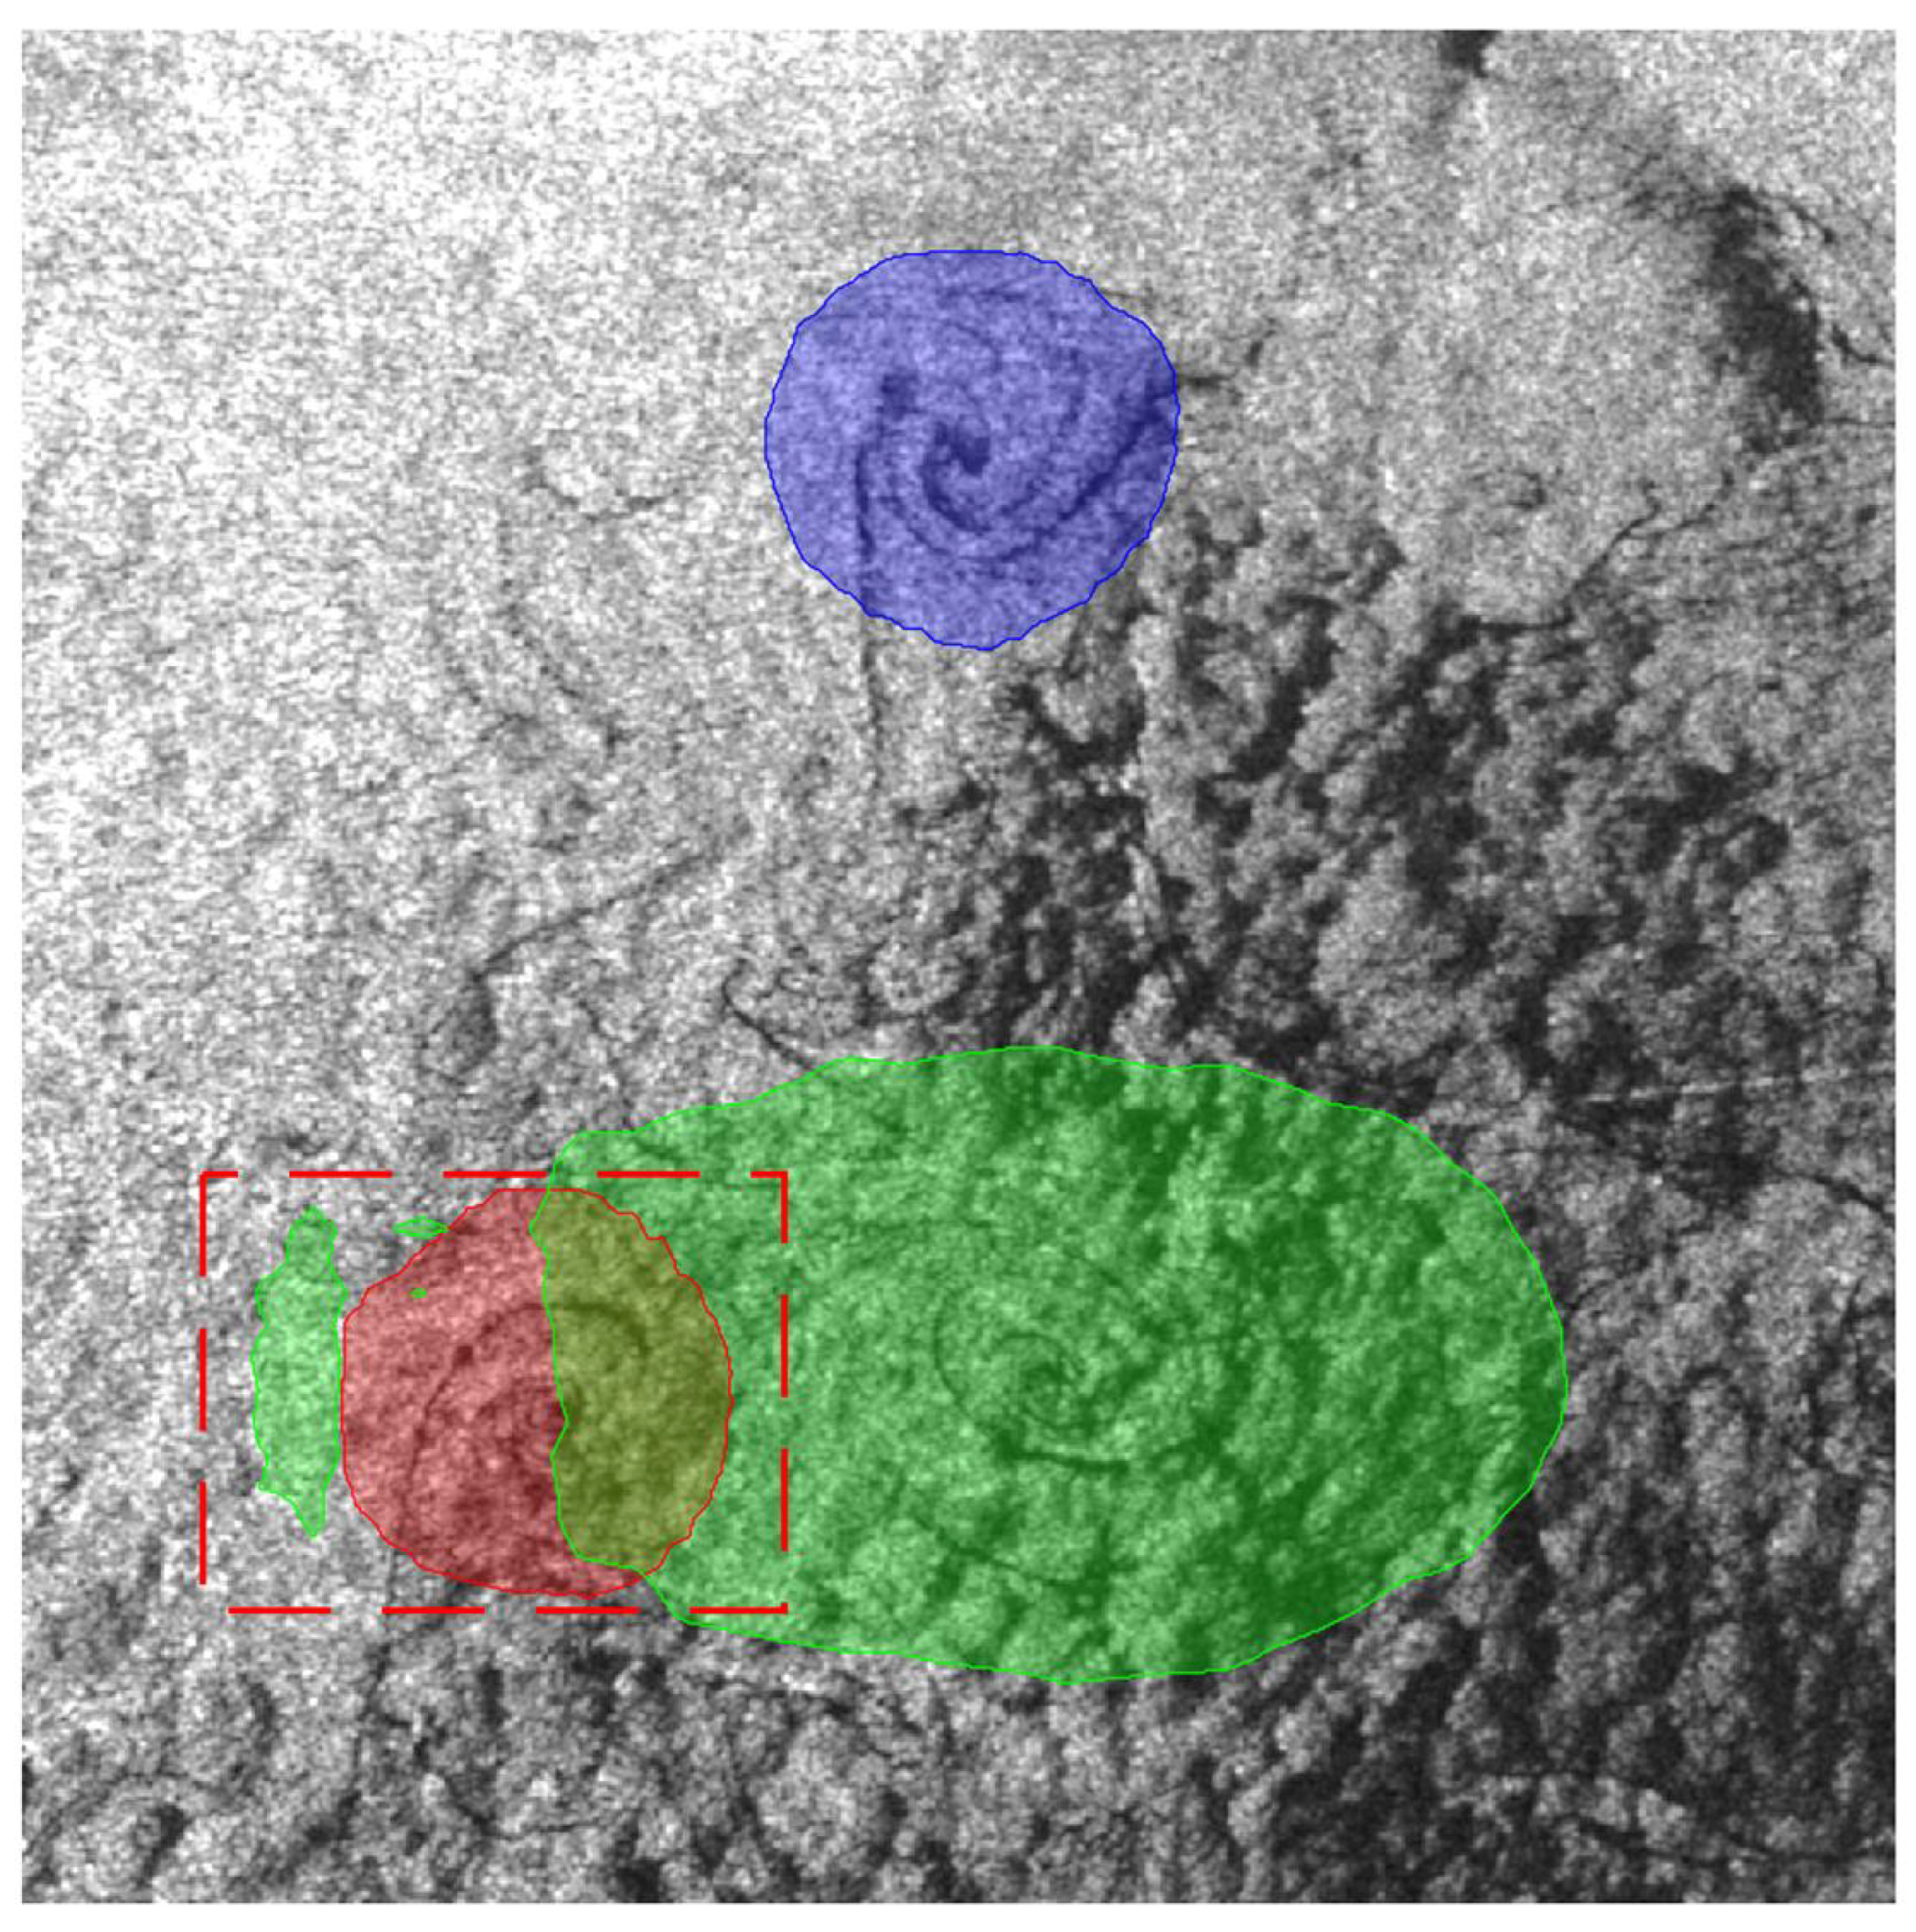
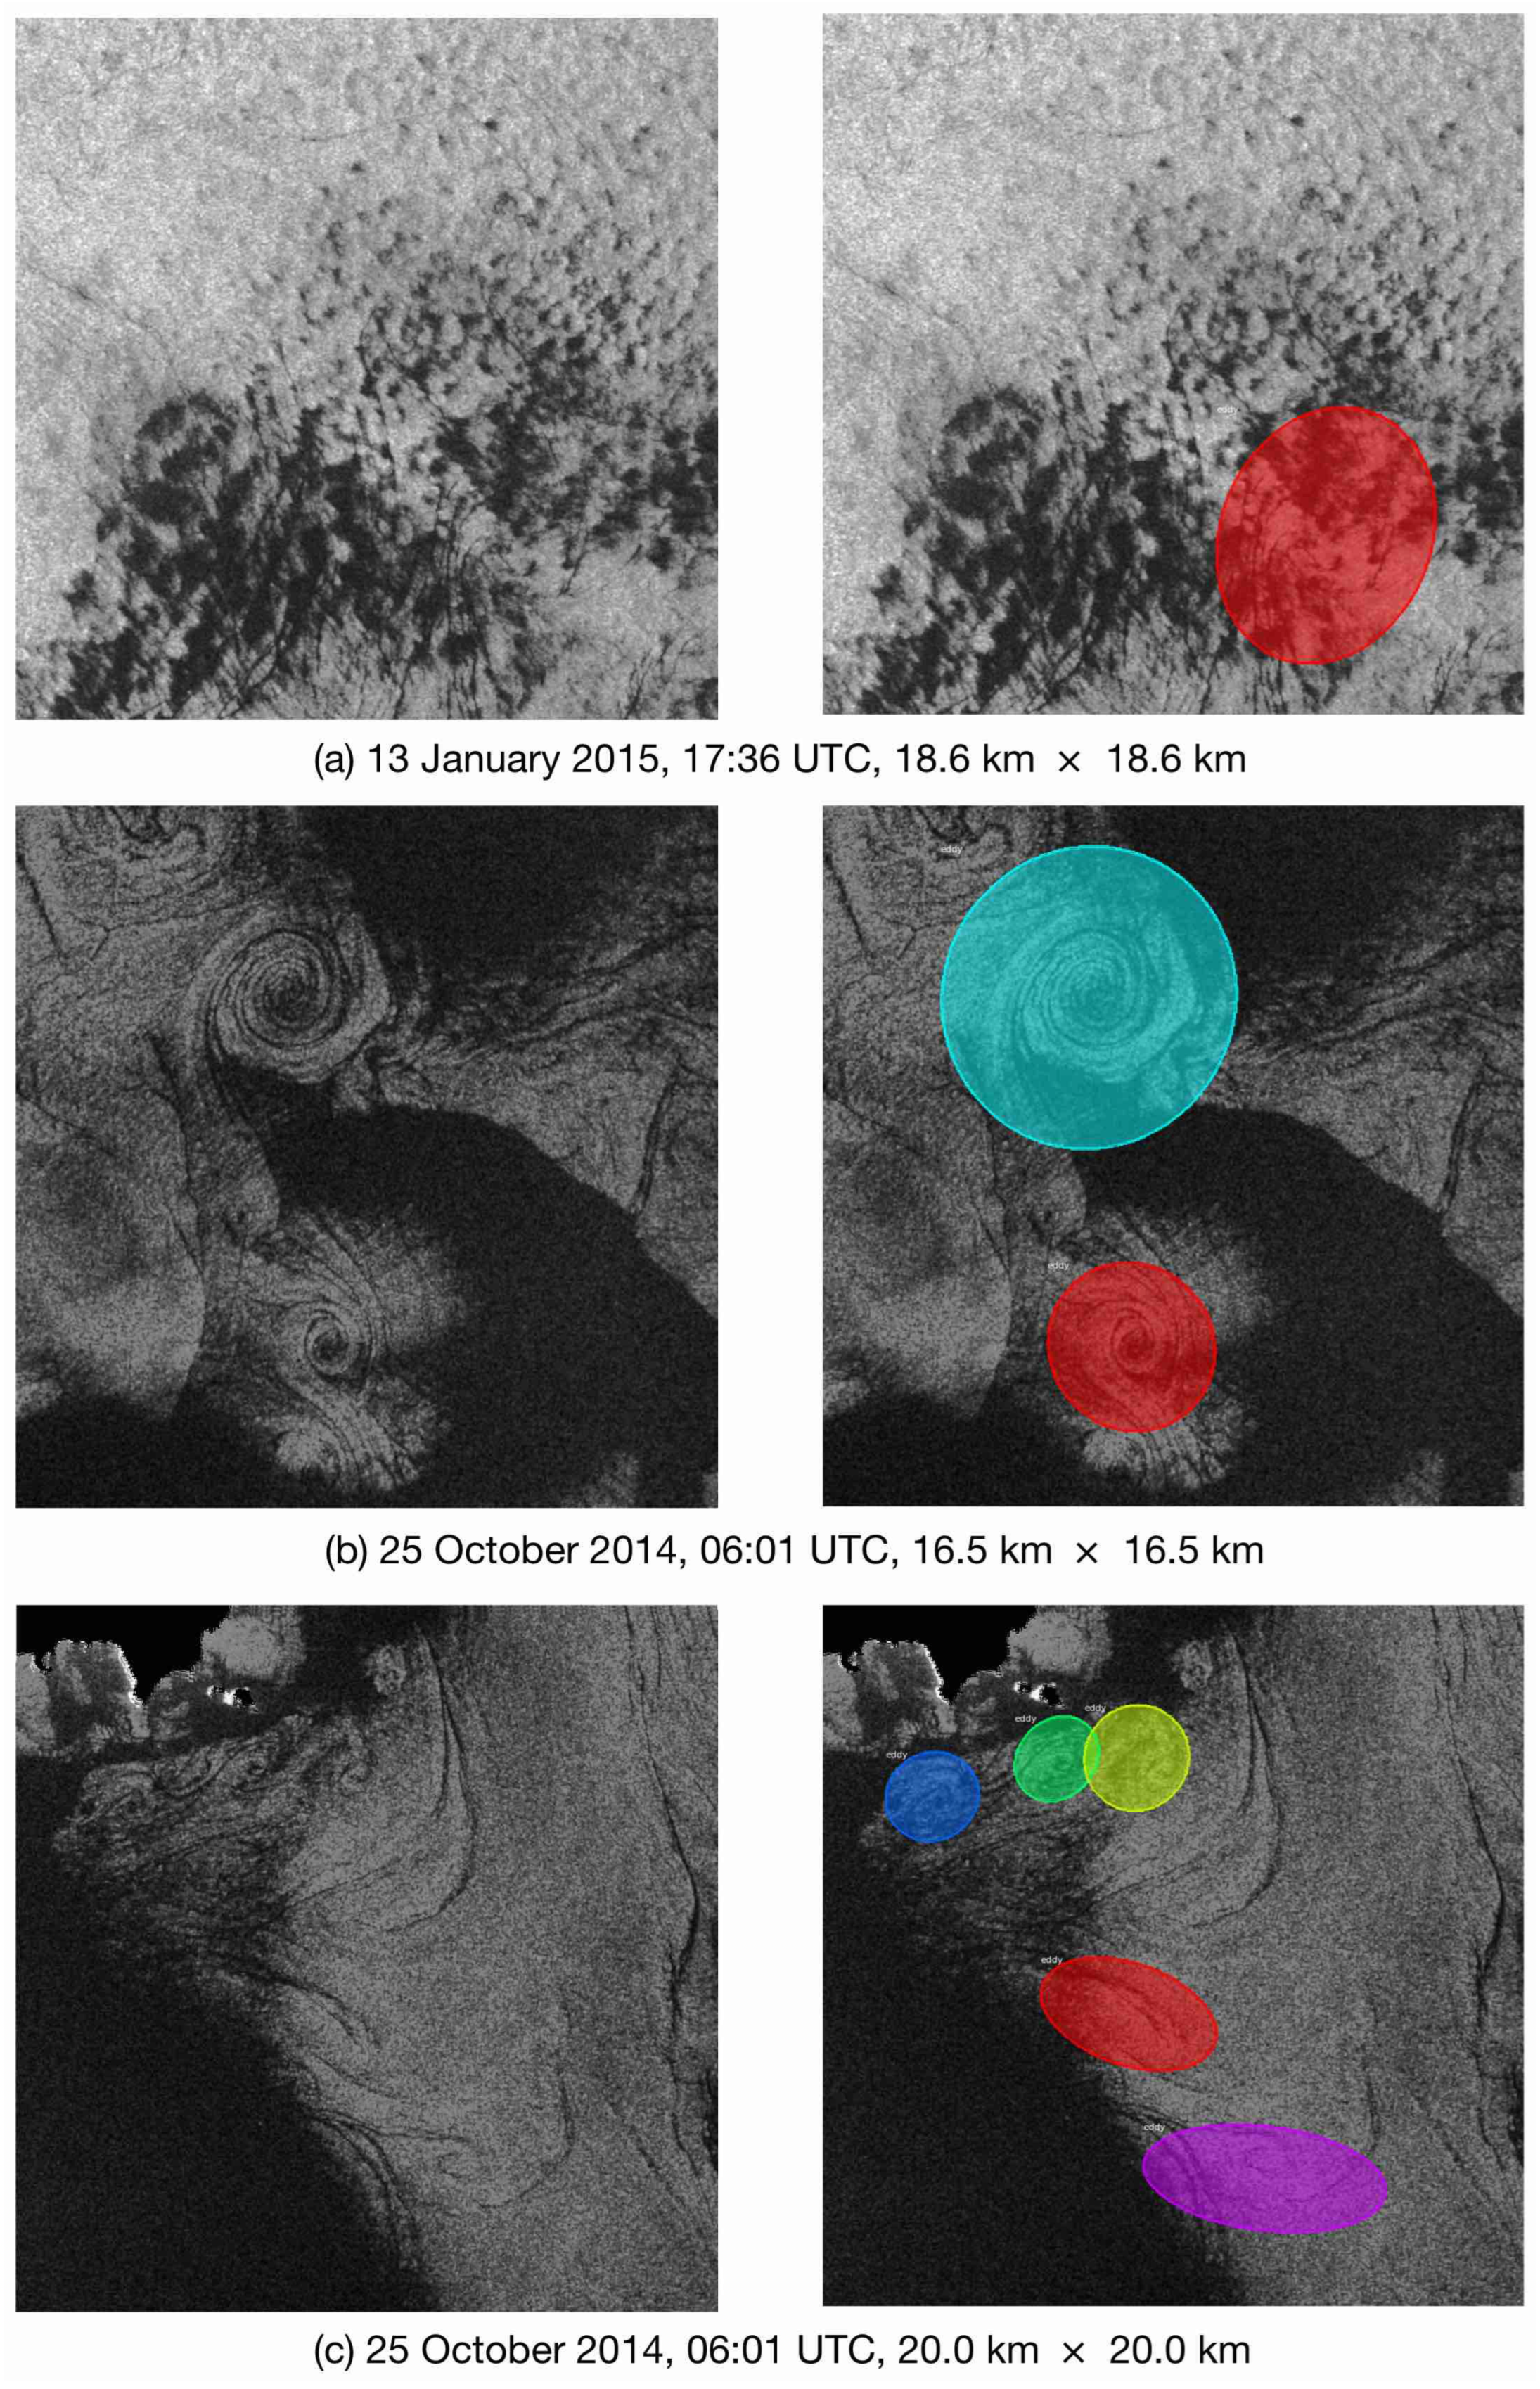
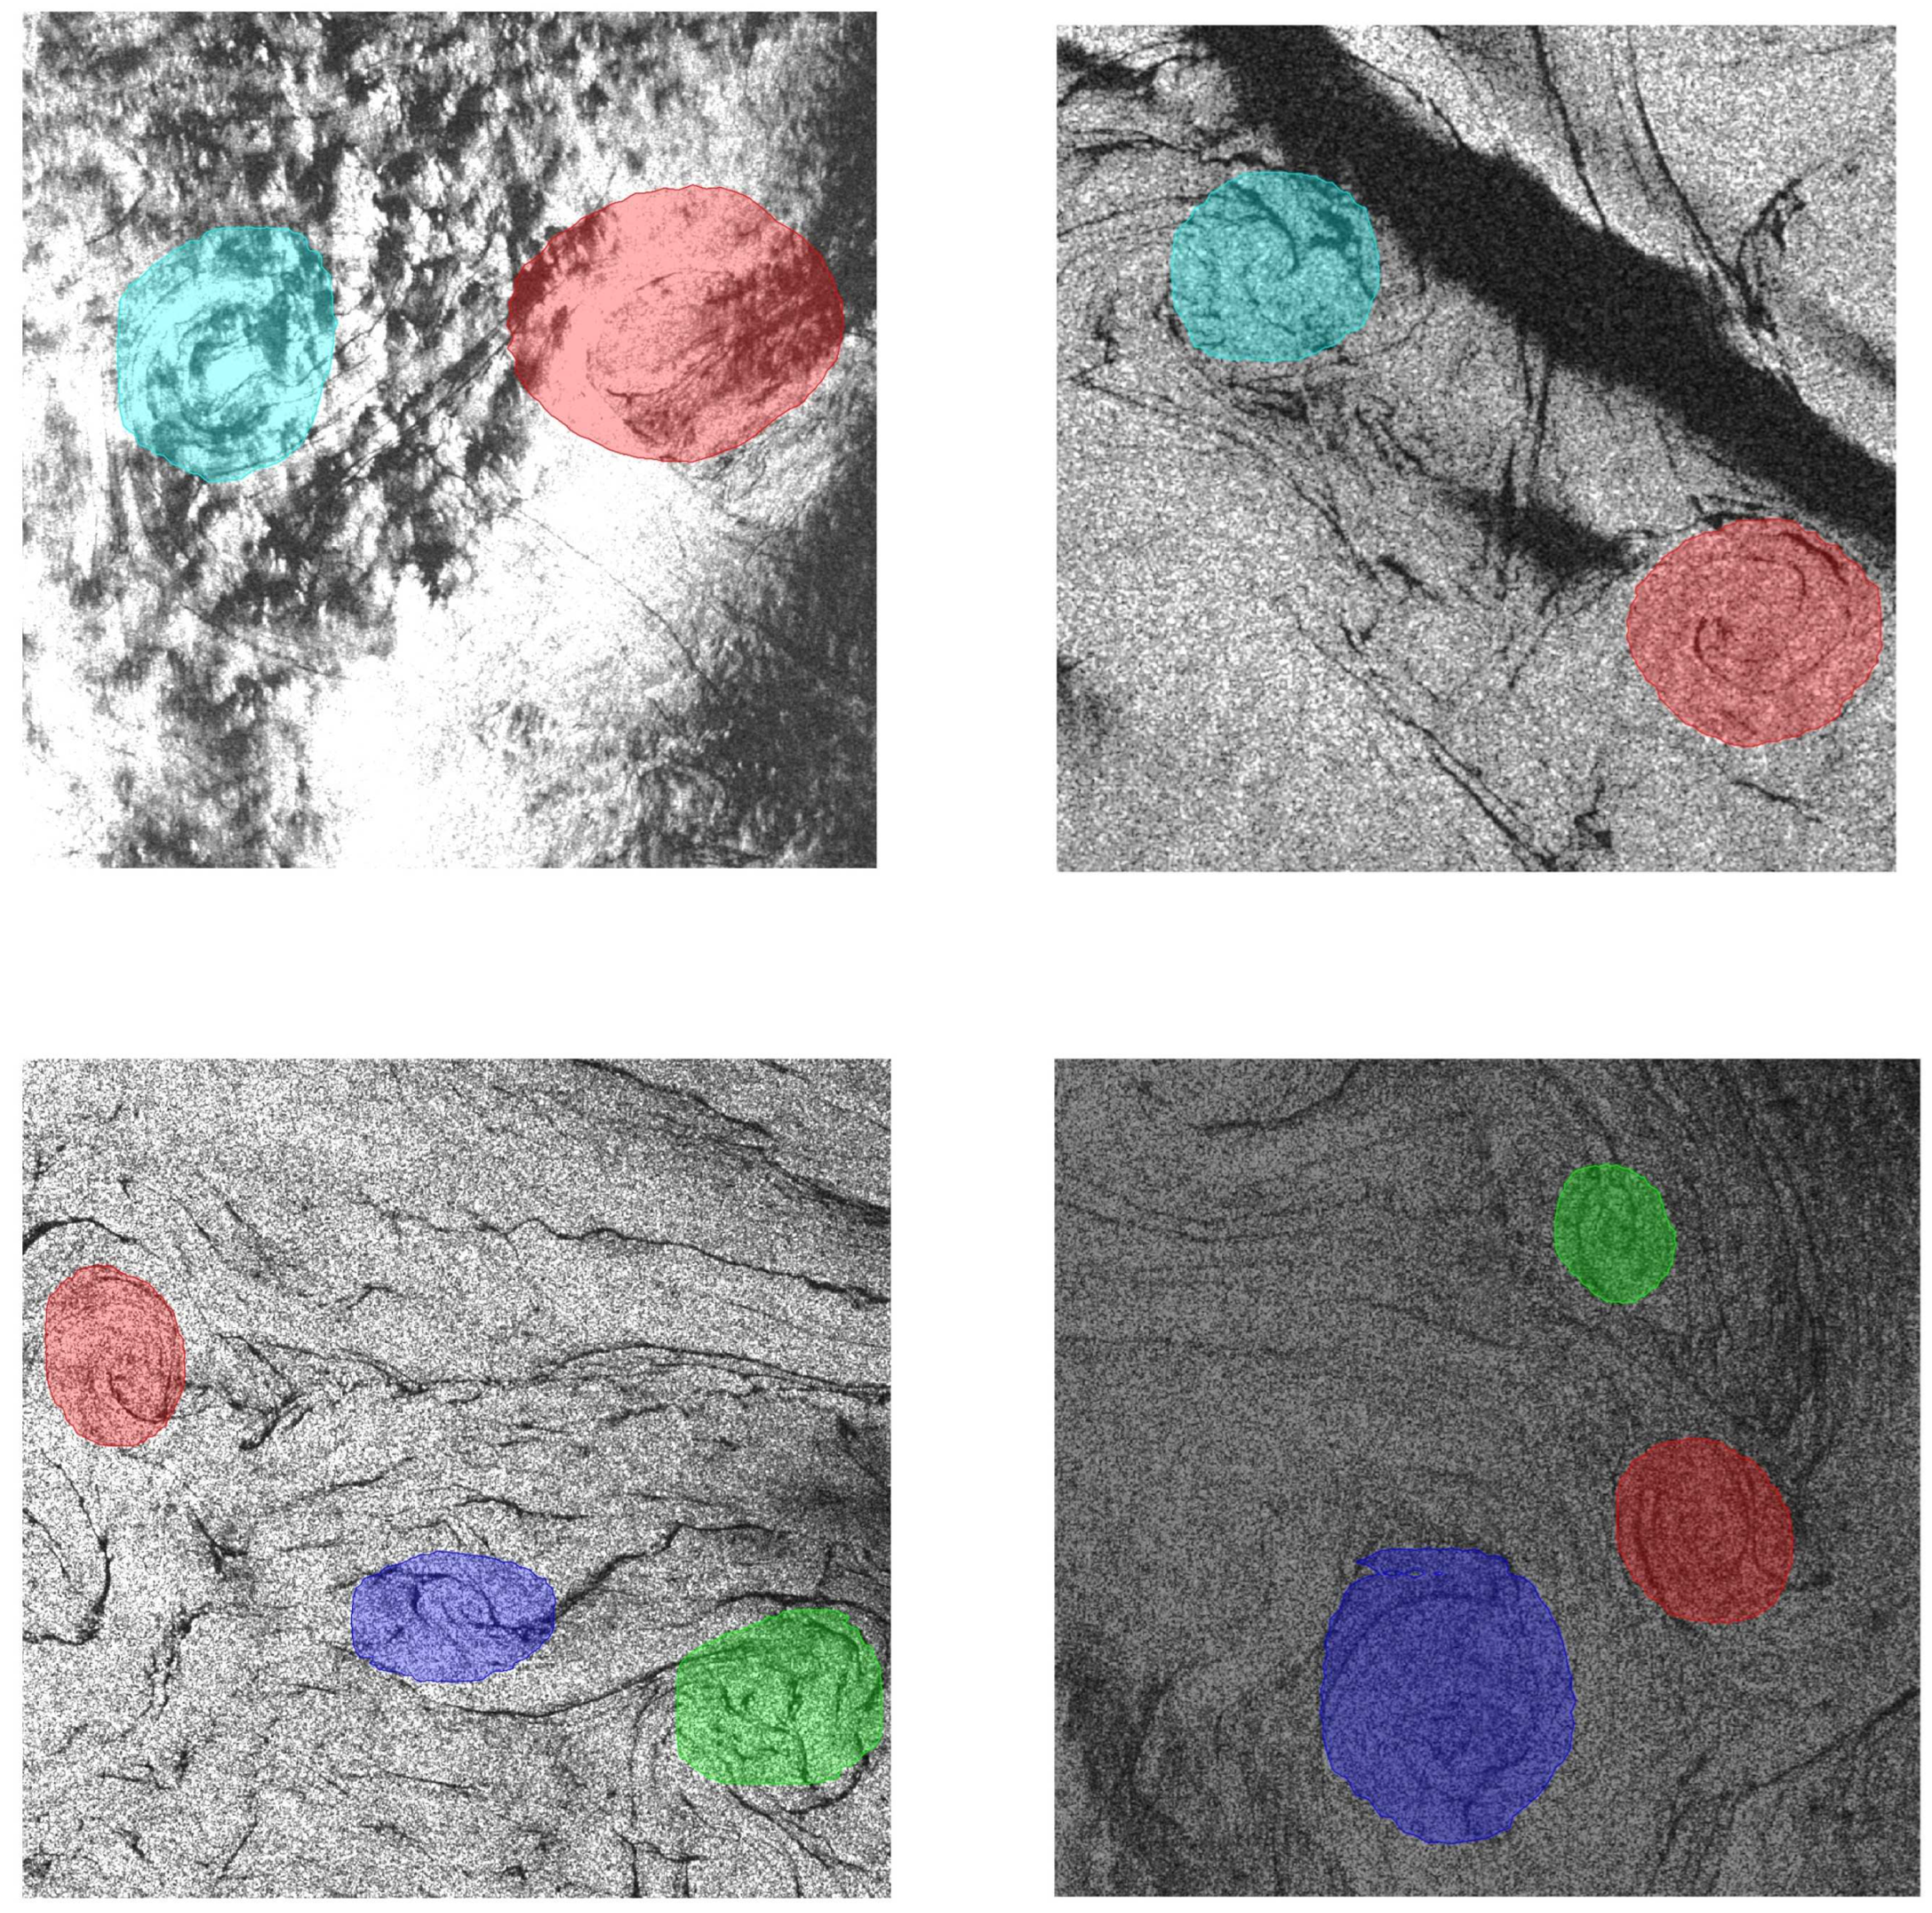
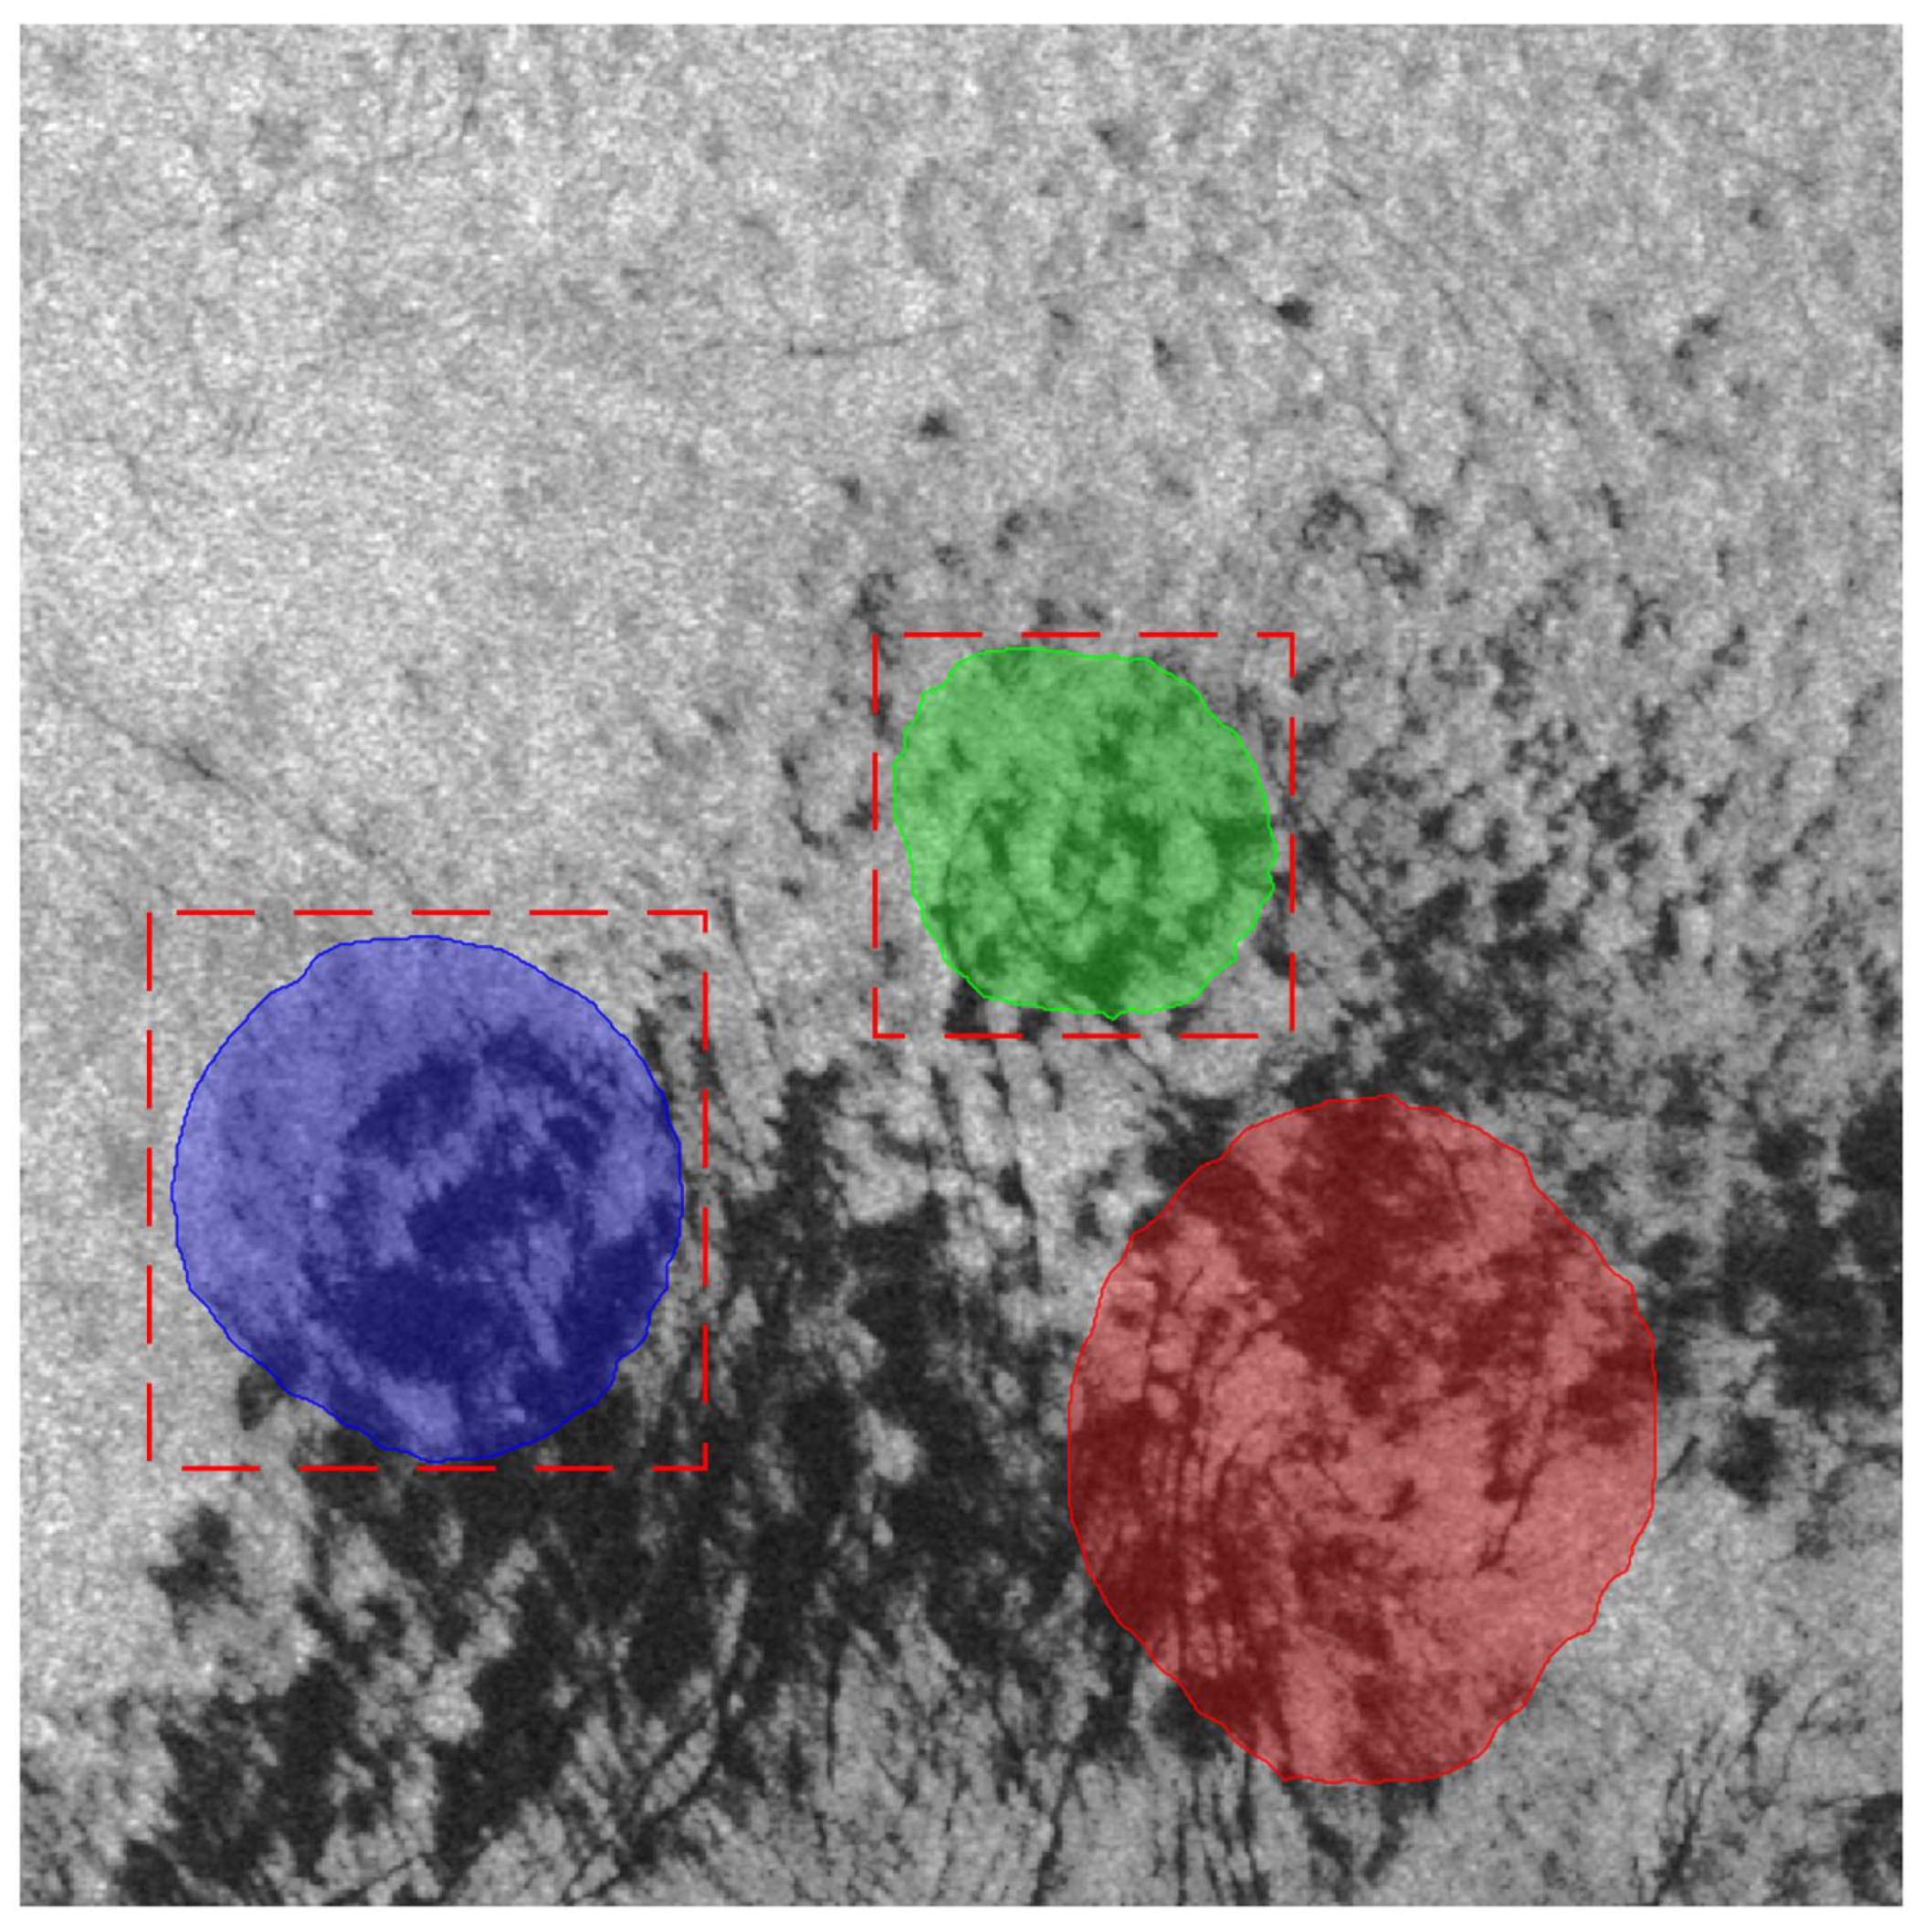
3.5. Visualization Results

Apart from evaluating the accuracy, the visualization of detected eddy samples provides a comprehensive assessment of EddyDet’s efficacy. We employed a confidence score threshold of 0.9 for the predicted eddy mask and applied non-maximum suppression (NMS) with a 0.1 threshold to remove duplication.
Figure 6 illustrates that EddyDet is able to identify SAR oceanic eddies across a wide range of scales, rotational directions, and morphological attributes. The model demonstrates successful eddy detection capabilities even under challenging conditions, including complex ocean backgrounds and indistinct texture information. These conditions are often difficult for human experts to identify, making the model’s performance even more noteworthy.

4. Discussion

The paper presents two main contributions: Firstly, the construction of the SOED facilitates research on SAR oceanic eddy detection using deep learning methods. Experimental results with various deep learning approaches on the SOED demonstrate its potential to achieve reliable eddy detection results even with limited training samples.
Secondly, the paper introduces the EddyDet model, an extension of the Mask RCNN framework featuring two new branches. The Edge Head enables implicit learning of internal texture information, while the Mask IoU Head improves the quality of predicted masks. When using a multi-task strategy, the Edge Head and Mask IoU Head combination proves effective on the SOED.
The excellent performance of the EddyDet model demonstrates the feasibility, effectiveness, and strong potential of the deep learning technique for the detection fields of oceanic phenomena. However, the proposed model is not always very reliable in the processing of eddy detection tasks, where we generate deeper analyses of the limitations and corresponding potential solutions.
The first limitation is the small-scale SAR image datasets. Our EddyDet model is trained and evaluated on the SOED dataset, which comprises only 200 images containing 322 instances of eddies. Even if we were able to collect a larger set of original SAR images, labeling all of them would still be challenging due to their complex properties. The limited size of the labeled SAR dataset restricts the accuracy of the interpretation results.
As depicted in Figure 7, our model fails to detect an eddy due to its unique morphological characteristics. The performances can be further improved by increasing the diversity of SOED or using more realistic settings like few-shot learning [65] and weakly supervised learning [66].
Another problem is that the multi-scale features have not been fully exploited in our model. The multi-scale approach is particularly useful in oceanic eddy detection, since eddies can vary significantly in size on SAR images. As Figure 8 illustrates, the large eddy manifests in open surface structures which are hard for current detectors to identify. While the FPN is already an effective approach, we can explore more effective ways like multi-scale feature learning [67] to address this problem.
In addition, our model has limited capability in detecting densely packed eddy instances. As shown in Figure 9, adjacent mask predictions will affect each other, which results in poor mask qualities and erroneous results, see the eddy instance marked in green. Dynamic refined network [68] and rotated bounding box [69] can be adopted to tackle this problem. Meanwhile, crossline representation [70] can also be introduced to address the challenge of background noise and the potential loss of continuous appearance information within eddies.
Finally, we can also introduce additional modalities and integrate them with SAR images. For instance, sea surface wind speed emerges as a crucial variable. Low local surface wind speeds result in low radar backscatter in SAR images, rendering “black” eddies less detectable. Similarly, high wind speeds cause the disappearance of “black” eddies as the surface films vanish from the sea surfaces. Therefore, leveraging wind speed information can expedite and improve the accuracy of oceanic eddy detection in SAR images.
Figure 10 gives typical examples of false alarms. If we observe the internal texture features of blue and green instances, we can identify that false alarms exhibit connected black spots (potentially influenced by wind or other natural factors), which can lead to confusion for the deep learning model. Hence, it is suggested to incorporate supplementary data such as wind speed in conjunction with SAR images to mitigate the occurrence of false alarms.

5. Conclusions

In this paper, a developed EddyDet model for oceanic eddies detection is proposed and verified. The Edge Head and Mask IoU Head are introduced as two new branches to build the EddyDet model, with the specific purpose of oceanic eddy detection using SAR imagery. This multi-task learning strategy made the model focus on internal texture information of eddy instances and the qualities of predicted masks at the same time.
EddyDet demonstrated superior performance in all APs compared to the Mask RCNN baseline on SOED. The experimental results confirmed the significance of integrating prior knowledge into deep learning models, particularly when dealing with small-scale SAR datasets. This design principle, proven effective in our proposed models, holds the potential for broader application in target detection tasks in SAR images.
In general, we can expect to gradually improve the intelligent SAR eddy detection results. Eventually, with the ongoing development of deep learning and remote sensing, we can bring the manner of oceanic eddy detecting and monitoring to the next level.

Author Contributions

D.Z., W.W. and M.G. conceived and designed the experiments; D.Z. performed the experiments; M.G. provided the SAR data; D.Z. and W.W. analyzed the data; H.Z. revised the EddyDet model theoretically; W.W. and M.G. aided in revising the manuscript. All authors have read and agreed to the published version of the manuscript.

Funding

The authors would like to thank the China Scholarship Council (CSC) for the financial support. This study is supported by the Youth Innovation Promotion Association CAS; grant number 2023137.

Data Availability Statement

Sentinel-1 SAR data are made available by the European Space Agency on the Copernicus Open Access Hub at https://scihub.copernicus.eu.

Acknowledgments

The authors would like to thank the European Commission and European Space Agency (ESA) to share the Sentinel data. Special thanks to Annika Buck for providing the eddies’ manual annotations. The proposed work was performed during Di Zhang’s PhD period at University of Hamburg.

Conflicts of Interest

The authors declare no conflict of interest.

References

  1. Robinson, A.R. Overview and Summary of Eddy Science. In Eddies in Marine Science; Robinson, A.R., Ed.; Springer: Berlin/Heidelberg, Germany, 1983; pp. 3–15. [Google Scholar] [CrossRef]
  2. Munk, W.; Armi, L.; Fischer, K.; Zachariasen, F. Spirals on the sea. Proc. R. Soc. London. Ser. A Math. Phys. Eng. Sci. 2000, 456, 1217–1280. [Google Scholar] [CrossRef]
  3. Dong, C.; Liu, L.; Nencioli, F.; Bethel, B.J.; Liu, Y.; Xu, G.; Ma, J.; Ji, J.; Sun, W.; Shan, H.; et al. The near-global ocean mesoscale eddy atmospheric-oceanic-biological interaction observational dataset. Sci. Data 2022, 9, 436. [Google Scholar] [CrossRef] [PubMed]
  4. Gade, M.; Karimova, S.; Buck, A. Mediterranean Eddy Statistics Based on Multiple SAR Imagery. In Advances in SAR Remote Sensing of Oceans, 1st ed.; Li, X., Guo, H., Chen, K.S., Yang, X., Eds.; CRC Press: Boca Raton, FL, USA, 2018; pp. 257–270. [Google Scholar] [CrossRef]
  5. Stuhlmacher, A.; Gade, M. Statistical analyses of eddies in the Western Mediterranean Sea based on Synthetic Aperture Radar imagery. Remote Sens. Environ. 2020, 250, 112023. [Google Scholar] [CrossRef]
  6. Bourras, D. Response of the atmospheric boundary layer to a mesoscale oceanic eddy in the northeast Atlantic. J. Geophys. Res. 2004, 109, D18114. [Google Scholar] [CrossRef]
  7. Chen, G.; Gan, J.; Xie, Q.; Chu, X.; Wang, D.; Hou, Y. Eddy heat and salt transports in the South China Sea and their seasonal modulations: Eddy Transports in the SCS. J. Geophys. Res. Ocean. 2012, 117, C05021. [Google Scholar] [CrossRef]
  8. Dong, C.; McWilliams, J.C.; Liu, Y.; Chen, D. Global heat and salt transports by eddy movement. Nat. Commun. 2014, 5, 3294. [Google Scholar] [CrossRef]
  9. Faghmous, J.H.; Frenger, I.; Yao, Y.; Warmka, R.; Lindell, A.; Kumar, V. A daily global mesoscale ocean eddy dataset from satellite altimetry. Sci. Data 2015, 2, 150028. [Google Scholar] [CrossRef]
  10. Karimova, S.; Gade, M. Improved statistics of sub-mesoscale eddies in the Baltic Sea retrieved from SAR imagery. Int. J. Remote Sens. 2016, 37, 2394–2414. [Google Scholar] [CrossRef]
  11. Byrne, D.; Münnich, M.; Frenger, I.; Gruber, N. Mesoscale atmosphere ocean coupling enhances the transfer of wind energy into the ocean. Nat. Commun. 2016, 7, ncomms11867. [Google Scholar] [CrossRef]
  12. Cao, L.; Zhang, D.; Zhang, X.; Guo, Q. Detection and Identification of Mesoscale Eddies in the South China Sea Based on an Artificial Neural Network Model—YOLOF and Remotely Sensed Data. Remote Sens. 2022, 14, 5411. [Google Scholar] [CrossRef]
  13. Liu, J.; Piao, S.; Gong, L.; Zhang, M.; Guo, Y.; Zhang, S. The Effect of Mesoscale Eddy on the Characteristic of Sound Propagation. J. Mar. Sci. Eng. 2021, 9, 787. [Google Scholar] [CrossRef]
  14. Chelton, D. Mesoscale eddy effects. Nat. Geosci. 2013, 6, 594–595. [Google Scholar] [CrossRef]
  15. Wang, X.; Wang, H.; Liu, D.; Wang, W. The Prediction of Oceanic Mesoscale Eddy Properties and Propagation Trajectories Based on Machine Learning. Water 2020, 12, 2521. [Google Scholar] [CrossRef]
  16. Chen, X.; Chen, G.; Ge, L.; Huang, B.; Cao, C. Global Oceanic Eddy Identification: A Deep Learning Method From Argo Profiles and Altimetry Data. Front. Mar. Sci. 2021, 8, 646926. [Google Scholar] [CrossRef]
  17. Xia, L.; Chen, G.; Chen, X.; Ge, L.; Huang, B. Submesoscale oceanic eddy detection in SAR images using context and edge association network. Front. Mar. Sci. 2022, 9, 1023624. [Google Scholar] [CrossRef]
  18. Matsuoka, D.; Araki, F.; Inoue, Y.; Sasaki, H. A New Approach to Ocean Eddy Detection, Tracking, and Event Visualization–Application to the Northwest Pacific Ocean. Procedia Comput. Sci. 2016, 80, 1601–1611. [Google Scholar] [CrossRef]
  19. Nian, R.; Cai, Y.; Zhang, Z.; He, H.; Wu, J.; Yuan, Q.; Geng, X.; Qian, Y.; Yang, H.; He, B. The Identification and Prediction of Mesoscale Eddy Variation via Memory in Memory With Scheduled Sampling for Sea Level Anomaly. Front. Mar. Sci. 2021, 8, 753942. [Google Scholar] [CrossRef]
  20. Moschos, E.; Kugusheva, A.; Coste, P.; Stegner, A. Computer Vision for Ocean Eddy Detection in Infrared Imagery. In Proceedings of the 2023 IEEE/CVF Winter Conference on Applications of Computer Vision (WACV), Waikoloa, HI, USA, 2–7 January 2023; pp. 6384–6393. [Google Scholar] [CrossRef]
  21. Liu, Y.; Zheng, Q.; Li, X. Detection and Analysis of Mesoscale Eddies Based on Deep Learning. In Artificial Intelligence Oceanography; Li, X., Wang, F., Eds.; Springer Nature Singapore: Singapore, 2023; pp. 209–225. [Google Scholar] [CrossRef]
  22. Faghmous, J.H.; Le, M.; Uluyol, M.; Kumar, V.; Chatterjee, S. A Parameter-Free Spatio-Temporal Pattern Mining Model to Catalog Global Ocean Dynamics. In Proceedings of the 2013 IEEE 13th International Conference on Data Mining, Dallas, TX, USA, 7–10 December 2013; pp. 151–160. [Google Scholar] [CrossRef]
  23. Qiu, C.; Ouyang, J.; Yu, J.; Mao, H.; Qi, Y.; Wu, J.; Su, D. Variations of mesoscale eddy SST fronts based on an automatic detection method in the northern South China Sea. Acta Oceanol. Sin. 2020, 39, 82–90. [Google Scholar] [CrossRef]
  24. Moschos, E.; Stegner, A.; Schwander, O.; Lapeyre, G.; Tuckerman, L.; Sommeria, J.; Morel, Y. Classification of Eddy Sea Surface Temperature Signatures Under Cloud Coverage. IEEE J. Sel. Top. Appl. Earth Obs. Remote Sens. 2020, 13, 4338–4347. [Google Scholar] [CrossRef]
  25. Zhao, D.; Xu, Y.; Zhang, X.; Huang, C. Global chlorophyll distribution induced by mesoscale eddies. Remote Sens. Environ. 2021, 254, 112245. [Google Scholar] [CrossRef]
  26. Xu, G.; Cheng, C.; Yang, W.; Xie, W.; Kong, L.; Hang, R.; Ma, F.; Dong, C.; Yang, J. Oceanic Eddy Identification Using an AI Scheme. Remote Sens. 2019, 11, 1349. [Google Scholar] [CrossRef]
  27. Huang, D.; Du, Y.; He, Q.; Song, W.; Liotta, A. DeepEddy: A simple deep architecture for mesoscale oceanic eddy detection in SAR images. In Proceedings of the 2017 IEEE 14th International Conference on Networking, Sensing and Control (ICNSC), Calabria, Italy, 16–18 May 2017; pp. 673–678. [Google Scholar] [CrossRef]
  28. Moschos, E.; Schwander, O.; Stegner, A.; Gallinari, P. Deep-SST-Eddies: A Deep Learning Framework to Detect Oceanic Eddies in Sea Surface Temperature Images. In Proceedings of the ICASSP 2020—2020 IEEE International Conference on Acoustics, Speech and Signal Processing (ICASSP), Barcelona, Spain, 4–8 May 2020; pp. 4307–4311. [Google Scholar] [CrossRef]
  29. Chelton, D.B.; Schlax, M.G.; Samelson, R.M. Global observations of nonlinear mesoscale eddies. Prog. Oceanogr. 2011, 91, 167–216, titleTranslation. [Google Scholar] [CrossRef]
  30. Li, Y.; Li, X.; Wang, J.; Peng, S. Dynamical analysis of a satellite-observed anticyclonic eddy in the northern Bering Sea. J. Geophys. Res. Ocean. 2016, 121, 3517–3531. [Google Scholar] [CrossRef]
  31. Dong, D.; Yang, X.; Li, X.; Li, Z. SAR Observation of Eddy-Induced Mode-2 Internal Solitary Waves in the South China Sea. IEEE Trans. Geosci. Remote Sens. 2016, 54, 6674–6686. [Google Scholar] [CrossRef]
  32. Gade, M.; Stuhlmacher, A. Updated Eddy Statistics For The Western Mediterranean Based On Three Years Of Sentinel-1A Sar Imagery. In Proceedings of the IGARSS 2019—2019 IEEE International Geoscience and Remote Sensing Symposium, Yokohama, Japan, 28 July–2 August 2019; pp. 8086–8089. [Google Scholar] [CrossRef]
  33. Du, Y.; Song, W.; He, Q.; Huang, D.; Liotta, A.; Su, C. Deep learning with multi-scale feature fusion in remote sensing for automatic oceanic eddy detection. Inf. Fusion 2019, 49, 89–99. [Google Scholar] [CrossRef]
  34. Wang, W.; Gade, M.; Yang, X. Detection of Bivalve Beds on Exposed Intertidal Flats Using Polarimetric SAR Indicators. Remote Sens. 2017, 9, 1047. [Google Scholar] [CrossRef]
  35. Okubo, A. Horizontal dispersion of floatable particles in the vicinity of velocity singularities such as convergences. Deep Sea Res. Oceanogr. Abstr. 1970, 17, 445–454. [Google Scholar] [CrossRef]
  36. Weiss, J. The dynamics of enstrophy transfer in two-dimensional hydrodynamics. Phys. D Nonlinear Phenom. 1991, 48, 273–294. [Google Scholar] [CrossRef]
  37. Frenger, I.; Münnich, M.; Gruber, N.; Knutti, R. Southern ocean eddy phenomenology. J. Geophys. Res. Ocean. 2015, 120, 7413–7449. [Google Scholar] [CrossRef]
  38. Nencioli, F.; Dong, C.; Dickey, T.D.; Washburn, L.; McWilliams, J.C. A Vector Geometry–Based Eddy Detection Algorithm and Its Application to a High-Resolution Numerical Model Product and High-Frequency Radar Surface Velocities in the Southern California Bight. J. Atmos. Ocean. Technol. 2010, 27, 564–579. [Google Scholar] [CrossRef]
  39. Liu, Y.; Dong, C.; Guan, Y.; Chen, D.; McWilliams, J.; Nencioli, F. Eddy analysis in the subtropical zonal band of the North Pacific Ocean. Deep Sea Res. Part I Oceanogr. Res. Pap. 2012, 68, 54–67. [Google Scholar] [CrossRef]
  40. Ari Sadarjoen, I.; Post, F.H. Detection, quantification, and tracking of vortices using streamline geometry. Comput. Graph. 2000, 24, 333–341. [Google Scholar] [CrossRef]
  41. Chaigneau, A.; Eldin, G.; Dewitte, B. Eddy activity in the four major upwelling systems from satellite altimetry (1992–2007). Prog. Oceanogr. 2009, 83, 117–123. [Google Scholar] [CrossRef]
  42. Chen, G.; Hou, Y.; Chu, X. Mesoscale eddies in the South China Sea: Mean properties, spatiotemporal variability, and impact on thermohaline structure. J. Geophys. Res. 2011, 116, C06018. [Google Scholar] [CrossRef]
  43. Xing, T.; Yang, Y. Three Mesoscale Eddy Detection and Tracking Methods: Assessment for the South China Sea. J. Atmos. Ocean. Technol. 2021, 38, 243–258. [Google Scholar] [CrossRef]
  44. Du, Y.; Liu, J.; Song, W.; He, Q.; Huang, D. Ocean Eddy Recognition in SAR Images With Adaptive Weighted Feature Fusion. IEEE Access 2019, 7, 152023–152033. [Google Scholar] [CrossRef]
  45. Khachatrian, E.; Sandalyuk, N.; Lozou, P. Eddy Detection in the Marginal Ice Zone with Sentinel-1 Data Using YOLOv5. Remote Sens. 2023, 15, 2244. [Google Scholar] [CrossRef]
  46. Yan, Z.; Chong, J.; Zhao, Y.; Sun, K.; Wang, Y.; Li, Y. Multifeature Fusion Neural Network for Oceanic Phenomena Detection in SAR Images. Sensors 2019, 20, 210. [Google Scholar] [CrossRef]
  47. He, K.; Zhang, X.; Ren, S.; Sun, J. Deep Residual Learning for Image Recognition. In Proceedings of the 2016 IEEE Conference on Computer Vision and Pattern Recognition (CVPR), Las Vegas, NV, USA, 27–30 June 2016; pp. 770–778. [Google Scholar] [CrossRef]
  48. Terven, J.; Cordova-Esparza, D. A Comprehensive Review of YOLO: From YOLOv1 and Beyond. arXiv 2023, arXiv:2304.00501. [Google Scholar]
  49. Malanotte-Rizzoli, P.; Artale, V.; Borzelli-Eusebi, G.L.; Brenner, S.; Crise, A.; Gacic, M.; Kress, N.; Marullo, S.; Ribera d’Alcalà, M.; Sofianos, S.; et al. Physical forcing and physical/biochemical variability of the Mediterranean Sea: A review of unresolved issues and directions for future research. Ocean Sci. 2014, 10, 281–322. [Google Scholar] [CrossRef]
  50. Robinson, I.S. Introduction. In Discovering the Ocean from Space; Springer: Berlin/Heidelberg, Germany, 2010; pp. 1–6. [Google Scholar] [CrossRef]
  51. Skrunes, S.; Brekke, C.; Eltoft, T. Characterization of Marine Surface Slicks by Radarsat-2 Multipolarization Features. IEEE Trans. Geosci. Remote Sens. 2014, 52, 5302–5319. [Google Scholar] [CrossRef]
  52. Li, X.; Guo, H.; Chen, K.S.; Yang, X. (Eds.) Advances in SAR Remote Sensing of Oceans; CRC Press: Boca Raton, FL, USA, 2018. [Google Scholar] [CrossRef]
  53. Karimova, S. Spiral eddies in the Baltic, Black and Caspian seas as seen by satellite radar data. Adv. Space Res. 2012, 50, 1107–1124. [Google Scholar] [CrossRef]
  54. Gade, M.; Byfield, V.; Ermakov, S.; Lavrova, O.; Mitnik, L. Slicks as Indicators for Marine Processes. Oceanography 2013, 26. [Google Scholar] [CrossRef]
  55. Johannessen, J.A.; Shuchman, R.A.; Digranes, G.; Lyzenga, D.R.; Wackerman, C.; Johannessen, O.M.; Vachon, P.W. Coastal ocean fronts and eddies imaged with ERS 1 synthetic aperture radar. J. Geophys. Res. Ocean. 1996, 101, 6651–6667. [Google Scholar] [CrossRef]
  56. Reza, A.M. Realization of the Contrast Limited Adaptive Histogram Equalization (CLAHE) for Real-Time Image Enhancement. J. VLSI Signal Process.-Syst. Signal Image Video Technol. 2004, 38, 35–44. [Google Scholar] [CrossRef]
  57. Lin, T.Y.; Maire, M.; Belongie, S.; Hays, J.; Perona, P.; Ramanan, D.; Dollár, P.; Zitnick, C.L. Microsoft COCO: Common Objects in Context. In Computer Vision—ECCV 2014; Fleet, D., Pajdla, T., Schiele, B., Tuytelaars, T., Eds.; Series Title: Lecture Notes in Computer Science; Springer International Publishing: Cham, Switzerland, 2014; Volume 8693, pp. 740–755. [Google Scholar] [CrossRef]
  58. Hafiz, A.M.; Bhat, G.M. A survey on instance segmentation: State-of-the-art. Int. J. Multimed. Inf. Retr. 2020, 9, 171–189. [Google Scholar] [CrossRef]
  59. Zhang, D.; Gade, M.; Zhang, J. SAR Eddy Detection Using Mask-RCNN and Edge Enhancement. In Proceedings of the IGARSS 2020—2020 IEEE International Geoscience and Remote Sensing Symposium, Waikoloa, HI, USA, 26 September–2 October 2020; pp. 1604–1607. [Google Scholar] [CrossRef]
  60. Huang, Z.; Huang, L.; Gong, Y.; Huang, C.; Wang, X. Mask Scoring R-CNN. In Proceedings of the 2019 IEEE/CVF Conference on Computer Vision and Pattern Recognition (CVPR), Long Beach, CA, USA, 15–19 June 2019; pp. 6402–6411. [Google Scholar] [CrossRef]
  61. Zhang, Y.; Yang, Q. A Survey on Multi-Task Learning. IEEE Trans. Knowl. Data Eng. 2022, 34, 5586–5609. [Google Scholar] [CrossRef]
  62. Zimmermann, R.S.; Siems, J.N. Faster training of Mask R-CNN by focusing on instance boundaries. Comput. Vis. Image Underst. 2019, 188, 102795. [Google Scholar] [CrossRef]
  63. He, K.; Gkioxari, G.; Dollar, P.; Girshick, R. Mask R-CNN. In Proceedings of the 2017 IEEE International Conference on Computer Vision (ICCV), Venice, Italy, 22–29 October 2017; pp. 2980–2988. [Google Scholar] [CrossRef]
  64. Bodla, N.; Singh, B.; Chellappa, R.; Davis, L.S. Soft-NMS—Improving Object Detection with One Line of Code. In Proceedings of the 2017 IEEE International Conference on Computer Vision (ICCV), Venice, Italy, 22–29 October 2017; pp. 5562–5570. [Google Scholar] [CrossRef]
  65. Wang, Y.; Yao, Q.; Kwok, J.T.; Ni, L.M. Generalizing from a Few Examples: A Survey on Few-shot Learning. ACM Comput. Surv. 2021, 53, 1–34. [Google Scholar] [CrossRef]
  66. Zhou, Z.H. A brief introduction to weakly supervised learning. Natl. Sci. Rev. 2018, 5, 44–53. [Google Scholar] [CrossRef]
  67. Guo, C.; Fan, B.; Zhang, Q.; Xiang, S.; Pan, C. AugFPN: Improving Multi-Scale Feature Learning for Object Detection. In Proceedings of the 2020 IEEE/CVF Conference on Computer Vision and Pattern Recognition (CVPR), Seattle, WA, USA, 13–19 June 2020; pp. 12592–12601. [Google Scholar] [CrossRef]
  68. Pan, X.; Ren, Y.; Sheng, K.; Dong, W.; Yuan, H.; Guo, X.; Ma, C.; Xu, C. Dynamic Refinement Network for Oriented and Densely Packed Object Detection. In Proceedings of the 2020 IEEE/CVF Conference on Computer Vision and Pattern Recognition (CVPR), Seattle, WA, USA, 13–19 June 2020; pp. 11204–11213. [Google Scholar] [CrossRef]
  69. Yang, X.; Yang, J.; Yan, J.; Zhang, Y.; Zhang, T.; Guo, Z.; Sun, X.; Fu, K. SCRDet: Towards More Robust Detection for Small, Cluttered and Rotated Objects. In Proceedings of the 2019 IEEE/CVF International Conference on Computer Vision (ICCV), Seoul, Republic of Korea, 27 October–2 November 2019; pp. 8231–8240. [Google Scholar] [CrossRef]
  70. Qiu, H.; Li, H.; Wu, Q.; Cui, J.; Song, Z.; Wang, L.; Zhang, M. CrossDet: Crossline Representation for Object Detection. In Proceedings of the 2021 IEEE/CVF International Conference on Computer Vision (ICCV), Montreal, QC, Canada, 10–17 October 2021; pp. 3175–3184. [Google Scholar] [CrossRef]
Figure 1. The Western Mediterranean Sea. The region of interest is delineated by the red line. All the SAR images used in the SOED were selected from this area. ©ESA 2015.
Remotesensing 15 04752 g001
Figure 2. Total geospatial coverage of eddies and sub-SAR images used in this Study. The distribution of the center coordinates of all eddies in our dataset is represented by black dots. The rectangular frames of different colors depict the spatial positions of the entire SAR images, with references to the respective figures. The small solid rectangles of different colors indicate the positions of the sub-SAR images. Red colors correspond to the information presented in Figure 4(a–c), blue colors to that in Figure 6(a–f), and green colors to that in Figures 7–10.©GEBCO 2023.
Remotesensing 15 04752 g002
Figure 3. Data statistics of the eddy samples in the SOED: (a) the distribution of the ratio between the width and height of the bounding boxes; (b) the distribution of the width and height of the bounding boxes.
Remotesensing 15 04752 g003
Figure 4. Three pairs of eddy samples in SOED: original SAR images on the left and their corresponding annotations on the right. We assign different colors for each eddy instance. These eddy samples exhibit variations in terms of shape structure, scale, and direction. SAR images ©ESA 2014–2015.
Remotesensing 15 04752 g004
Figure 5. Network architecture of EddyDet. It consists of five parts: an FPN Backbone Network, an RCNN Head, a Mask Head, an Edge Head (labeled as pink dotted box), and a Mask Intersection over Union (IoU) Head (labeled as blue dotted box). The input SAR image is processed by the FPN Backbone Network to generate Regions of Interest (RoIs) and RoI features using RoIAlign. The RoI features are then passed to both the RCNN Head and the Mask Head. The Edge Head takes the predicted mask and its corresponding ground truth as input and compares their similarity after applying edge filters. The RoI features and the predicted mask are concatenated and inputted into the Mask IoU Head to obtain the Mask IoU value for the eddy class. During training, the binary mask and its corresponding ground truth are used as the Mask IoU target. During testing, the Mask IoU value is utilized to calibrate the scores.
Remotesensing 15 04752 g005
Figure 6. Acceptable visualization results of EddyDet. Different colors are assigned for different detected eddy instances.
Remotesensing 15 04752 g006aRemotesensing 15 04752 g006b
Figure 7. Failed detection results: undetected eddy due to unusual morphological character. The red dotted box denotes the range of the missed detected eddy.
Remotesensing 15 04752 g007
Figure 8. Failed detection results: undetected eddy due to its large size.The red dotted box denotes the range of the missed detected eddy.
Remotesensing 15 04752 g008
Figure 9. Failed detection results: densely packed eddies (see the red dotted box).
Remotesensing 15 04752 g009
Figure 10. Failed detection results: common false alarms (see the red dotted box).
Remotesensing 15 04752 g010
Table 1. Average precisions in percent of different eddy detection methods.
Methods AP AP 0.5 AP 0.75
Mask RCNN18.735.620.1
Mask RCNN and Edge Enhancement21.038.522.2
Mask RCNN and only Mask IoU Head23.345.025.1
Mask-ES-RCNN24.848.527.1
Table 2. Eddy detection results on different design choices of the Mask IoU Head and Edge Head.
BackboneMask IoU HeadLaplace HeadSobel Head AP AP 0.5 AP 0.75
ResNet-50-FPN×××18.735.620.1
××22.944.924.8
××23.646.725.9
×24.848.527.1
Disclaimer/Publisher’s Note: The statements, opinions and data contained in all publications are solely those of the individual author(s) and contributor(s) and not of MDPI and/or the editor(s). MDPI and/or the editor(s) disclaim responsibility for any injury to people or property resulting from any ideas, methods, instructions or products referred to in the content.

