Article

Comparative Verification of Leaf Area Index Products for Different Grassland Types in Inner Mongolia, China

1
National Hulunber Grassland Ecosystem Observation and Research Station, Institute of Agricultural Resources and Regional Planning, Chinese Academy of Agricultural Sciences, Beijing 100081, China
2
Aerospace Science and Industry (Beijing) Spatial Information Application Co., Ltd., Beijing 100070, China
3
College of Ecology and Environment, Inner Mongolia University, Hohhot 010018, China
4
Jiangsu Key Laboratory of Crop Genetics and Physiology/Jiangsu Key Laboratory of Crop Cultivation and Physiology, Agricultural College, Yangzhou University, Yangzhou 225009, China
5
Department of Geography, Environment, and Spatial Sciences, Michigan State University, East Lansing, MI 48824, USA
6
Department of Biology, Pace University, New York, NY 10038, USA
7
Sustainable Agriculture Center, Kazakh National Agrarian Research University, Almaty 050010, Kazakhstan
8
Department of Economics, University of the Humanities, Ulaanbaatar P.O. Box 210646/53, Mongolia
9
EcoGIS Center, National Research University “Tashkent Institute of Irrigation and Agricultural Mechanization Engineers” (NRU-TIIAME), Tashkent 100000, Uzbekistan
10
Institute of General and Experimental Biology, Siberian Branch, Russian Academy of Sciences, Ulan-Ude 670047, Russia
11
School of Ecology, Environment and Resources, Guangdong University of Technology, Guangzhou 510006, China
*
Authors to whom correspondence should be addressed.
Remote Sens. 2023, 15(19), 4736; https://doi.org/10.3390/rs15194736
Submission received: 14 August 2023 / Revised: 14 September 2023 / Accepted: 19 September 2023 / Published: 27 September 2023

Abstract

:
Leaf area index (LAI) is a key indicator of vegetation structure and function, and its products have a wide range of applications in vegetation condition assessment and usually act as important input parameters for ecosystem modeling. Grassland plays an important role in regional climate change and the global carbon cycle and numerous studies have focused on the product-based analysis of grassland vegetation changes. However, the performance of various LAI products and their discrepancies across different grassland types in drylands remain unclear. Therefore, it is critical to assess these products prior to application. We evaluated the accuracy of four commonly used LAI products (GEOV2, GLASS, GLOBMAP, and MODIS) using LAI reference maps based on both bridging and cross-validation approaches. Under different grassland types, the GLASS LAI performed better in meadow steppe (R2 = 0.26, RMSE = 0.41 m2/m2) and typical steppe (R2 = 0.32, RMSE = 0.38 m2/m2); the GEOV2 LAI performed better in desert steppe (R2 = 0.39, RMSE = 0.30 m2/m2). When we assessed their spatial and temporal discrepancies during the period from 2010 to 2019, the four LAI products overall showed a high spatial and temporal consistency across the region. Compared with GLASS LAI, the most consistent to least consistent correlations can be ordered by GEOV2 LAI (R2 = 0.94), MODIS LAI (R2 = 0.92), and GLOBMAP LAI (R2 = 0.87). The largest differences in LAI throughout the year occurred in July for all grassland types. Limited by the location and number of sample plots, we mainly focused on spatial and temporal variations. The spatial heterogeneity of land surface is pervasive, especially in vast grassland areas with rich grassland types, and the results of this study can provide a basis for the application of the product in different grassland types. Furthermore, it is essential to develop highly accurate and reliable satellite-based LAI products focused on grassland from the regional to the global scale according to these popular approaches, which is the next step in our work plan.

1. Introduction

Leaf area index (LAI, defined as one-half of the total green leaf area per unit of ground surface area) is an important vegetation biophysical parameter, used to monitor growth status and to characterize the structure and the function of vegetation [1,2]. It plays an important role in modeling earth-system processes, including the exchanges of energy, water, and carbon between continents and the atmosphere [3,4]. With the advent of satellite data and to meet the needs of many applications, several sets of satellite-derived LAI products have been generated for regional and global scales [5,6]. Various widely used global LAI products, including moderate-resolution imaging spectroradiometer (MODIS), CYCLOPES, global land surface satellite (GLASS), Copernicus VEGETATION (GEOV2), multi-angle imaging spectroradiometer (MISR), and GLOBMAP, are generated from data acquired by advanced very high-resolution radiometer (AVHRR), MODIS, VEGETATION, medium-resolution imaging spectrometer instrument (MERIS) and other sensors through different algorithms [7,8,9,10]. Long-timeseries satellite-derived products are useful for monitoring the condition of vegetation and reflecting dynamic trends and pattern trends in vegetation. A number of studies have focused on exploring the status and changes of vegetation in a region based on LAI products. Jiapaer et al. [11] analyzed the vegetation dynamics in Xinjiang from 1982 to 2012 based on the GLASS LAI dataset. Piao et al. [12] used three different satellite-derived LAI datasets (GIMMS, GLOBMAP, and GLASS) to detect and attribute vegetation greening trends in China over the last three decades. Li et al. [13] applied explainable machine learning to assess global vegetation sensitivity to soil moisture based five satellite-derived LAI datasets (GIMMS3g V1, LTDR V5, GLASS V40, GLOBMAP V3 and GEOV2-AVHRR) over the period 1982–2017. Fang et al. [14] used MODIS LAI and GPP deficits, the differences between actual and historical-maximum values, to describe vegetation and land-cover shifts in response to changing climate conditions in the period 2001–2019 in the Mediterranean region. However, due to the differences in data acquisition, processing, and spatial and temporal resolution of many LAI remote sensing products, there is a great deal of uncertainty in the direct application of these products to analyze grassland vegetation conditions. Therefore, the accuracy and applicability of the products must be evaluated when applying them to analyze the grassland vegetation conditions. In addition, there is an increasing demand for research using LAI as an indicator, such as exploring grassland degradation and vegetation change [15,16].
The authenticity check of satellite-based LAI products is an indispensable part of LAI inversion research and practical application, which is a necessary step to understand the accuracy and applicability of satellite-based LAI products and to improve the accuracy of LAI inversion algorithms. It is essential to evaluate the capability of multiple LAI products to apply them effectively. Evaluation results can help users select base data for a study and help producers further improve the quality of their products. The primary approaches for this are direct validation, indirect validation (also referred to as the bridging method), and cross-validation [9,10,17,18], each of which has advantages and limitations. The acquisition of the “true value” of the image element is the key point and difficulty of the authenticity test of satellite-based LAI products. Direct validation is generally used when vegetation is spatially explicit and relatively homogeneous in type. Data measured directly in the field is used for validation comparisons among LAI products (i.e., point-to-element comparisons), and the results are used to assess the quality of different products quantitatively [19]. Although it is more accurate to utilize the actual data obtained from ground measurements for direct validation, direct validation requires high spatial distribution and quantity of ground sampling data, and the lack of ground data often leads to large errors in the validation results. Meanwhile, due to the limitation of time and resources, the existing validation data cannot represent the spatial and seasonal changes of the vegetation cover very well. For the bridging method, high-resolution imagery from resources such as Landsat or Sentinel are used as a bridge to convert in situ LAI into reference maps, and then satellite-derived products are compared with the reference data [20]. Therefore, when quantifying the accuracy and reliability of different LAI satellite-based products, the “bridge-building method” is often used, i.e., using high-resolution data as an intermediate bridge to scale up the ground-based observations to regional results, and the “bridge-building method” is often used to compare the spatial and temporal differences of long timeseries of different LAI remote sensing products. Cross-validation is usually used when comparing the spatial and temporal differences of different LAI remote sensing products over long timeseries. The limitations of sampling time and the quantity of the validation dataset can make it difficult to assess satellite-derived products in terms of spatial and longtime variations. The cross-validation method assesses the accuracy of the product to be examined relative to the reference product by referencing a satellite-derived product of known accuracy, which shows discrepancies among the products [21]. Because cross-validation can only determine the relative performance of each product and cannot quantify the accuracy of satellite-derived products [9], these validation approaches are often combined with each other for LAI product evaluation. According to the actual situation, appropriate validation methods can be selected to increase the credibility of the validation results. At present, there is no systematic analysis of the performance of satellite-based LAI products on different grassland types in Inner Mongolia grassland, so this chapter uses the “bridge method” and cross-validation to validate them.
In recent years, scholars have conducted numerous product comparisons and evaluations to better characterize the conformance of current LAI products and their respective uncertainties, but they are focused on a single vegetation type; validation in different grassland types is needed. Xiao et al. [5] compared four long timeseries global LAI products to evaluate their spatial and temporal discrepancies, and demonstrated that the GLASS AVHRR LAI values perform better than NCEI AVHRR, GIMMS3g, and GLOBMAP. To assess the continuity, consistency, and accuracy of the GEOV1 product and its performance compared to other existing global products, Fang et al. [6,22] completed a series of metric and qualitative checks. Their results showed that several LAI products are strongly spatially correlated, with the largest areas of uncertainty typically occurring in the ecological zones of an ecosystem. Li et al. [23] assessed the MODIS LAI product using ground measurement data and HJ-1A/1B imagery in meadow steppes. Most such validation activities are either direct validation on a typical network of validation sites or product intercomparison on a regional or global scale. Few have compared and analyzed global LAI products for long-term performance, and none have focused on different grassland types in Inner Mongolia.
In response to the lack of clarity in the performance of satellite-based LAI products in different grassland types and the lack of basis in selecting products for analysis, this paper evaluates the accuracy and uncertainty of current mainstream LAI products in different grassland types in Inner Mongolian grassland based on the actual LAI measurement data collected from field surveys, and gives corresponding recommendations for their use. Based on ground-truth data collected through field experiments and high-resolution imagery data, we used both bridging and cross-validation approaches to assess the accuracy and discrepancies of four commonly used LAI products for the grassland of Inner Mongolia: GEOV2, GLASS, GLOBMAP, and MODIS. Our specific study objectives were to: (1) validate the four LAI products by comparing ground-based LAI measurements using vegetation index–Landsat as the bridge for different grassland types, (2) compare the temporal changes in the period 2010–2019 of the four LAI products, and (3) assess the spatial distributions among the four products. The spatial variability of different grassland types in Inner Mongolia is substantial, and many studies have chosen LAI products to analyze vegetation status, usually without distinguishing between grassland types. There is no basis for choosing among the many products, so the results of the unified validation can provide a reference for this purpose. Meanwhile, the results can provide a basis for developing highly accurate and reliable satellite-based LAI products suitable for different grassland types.

2. Materials and Methods
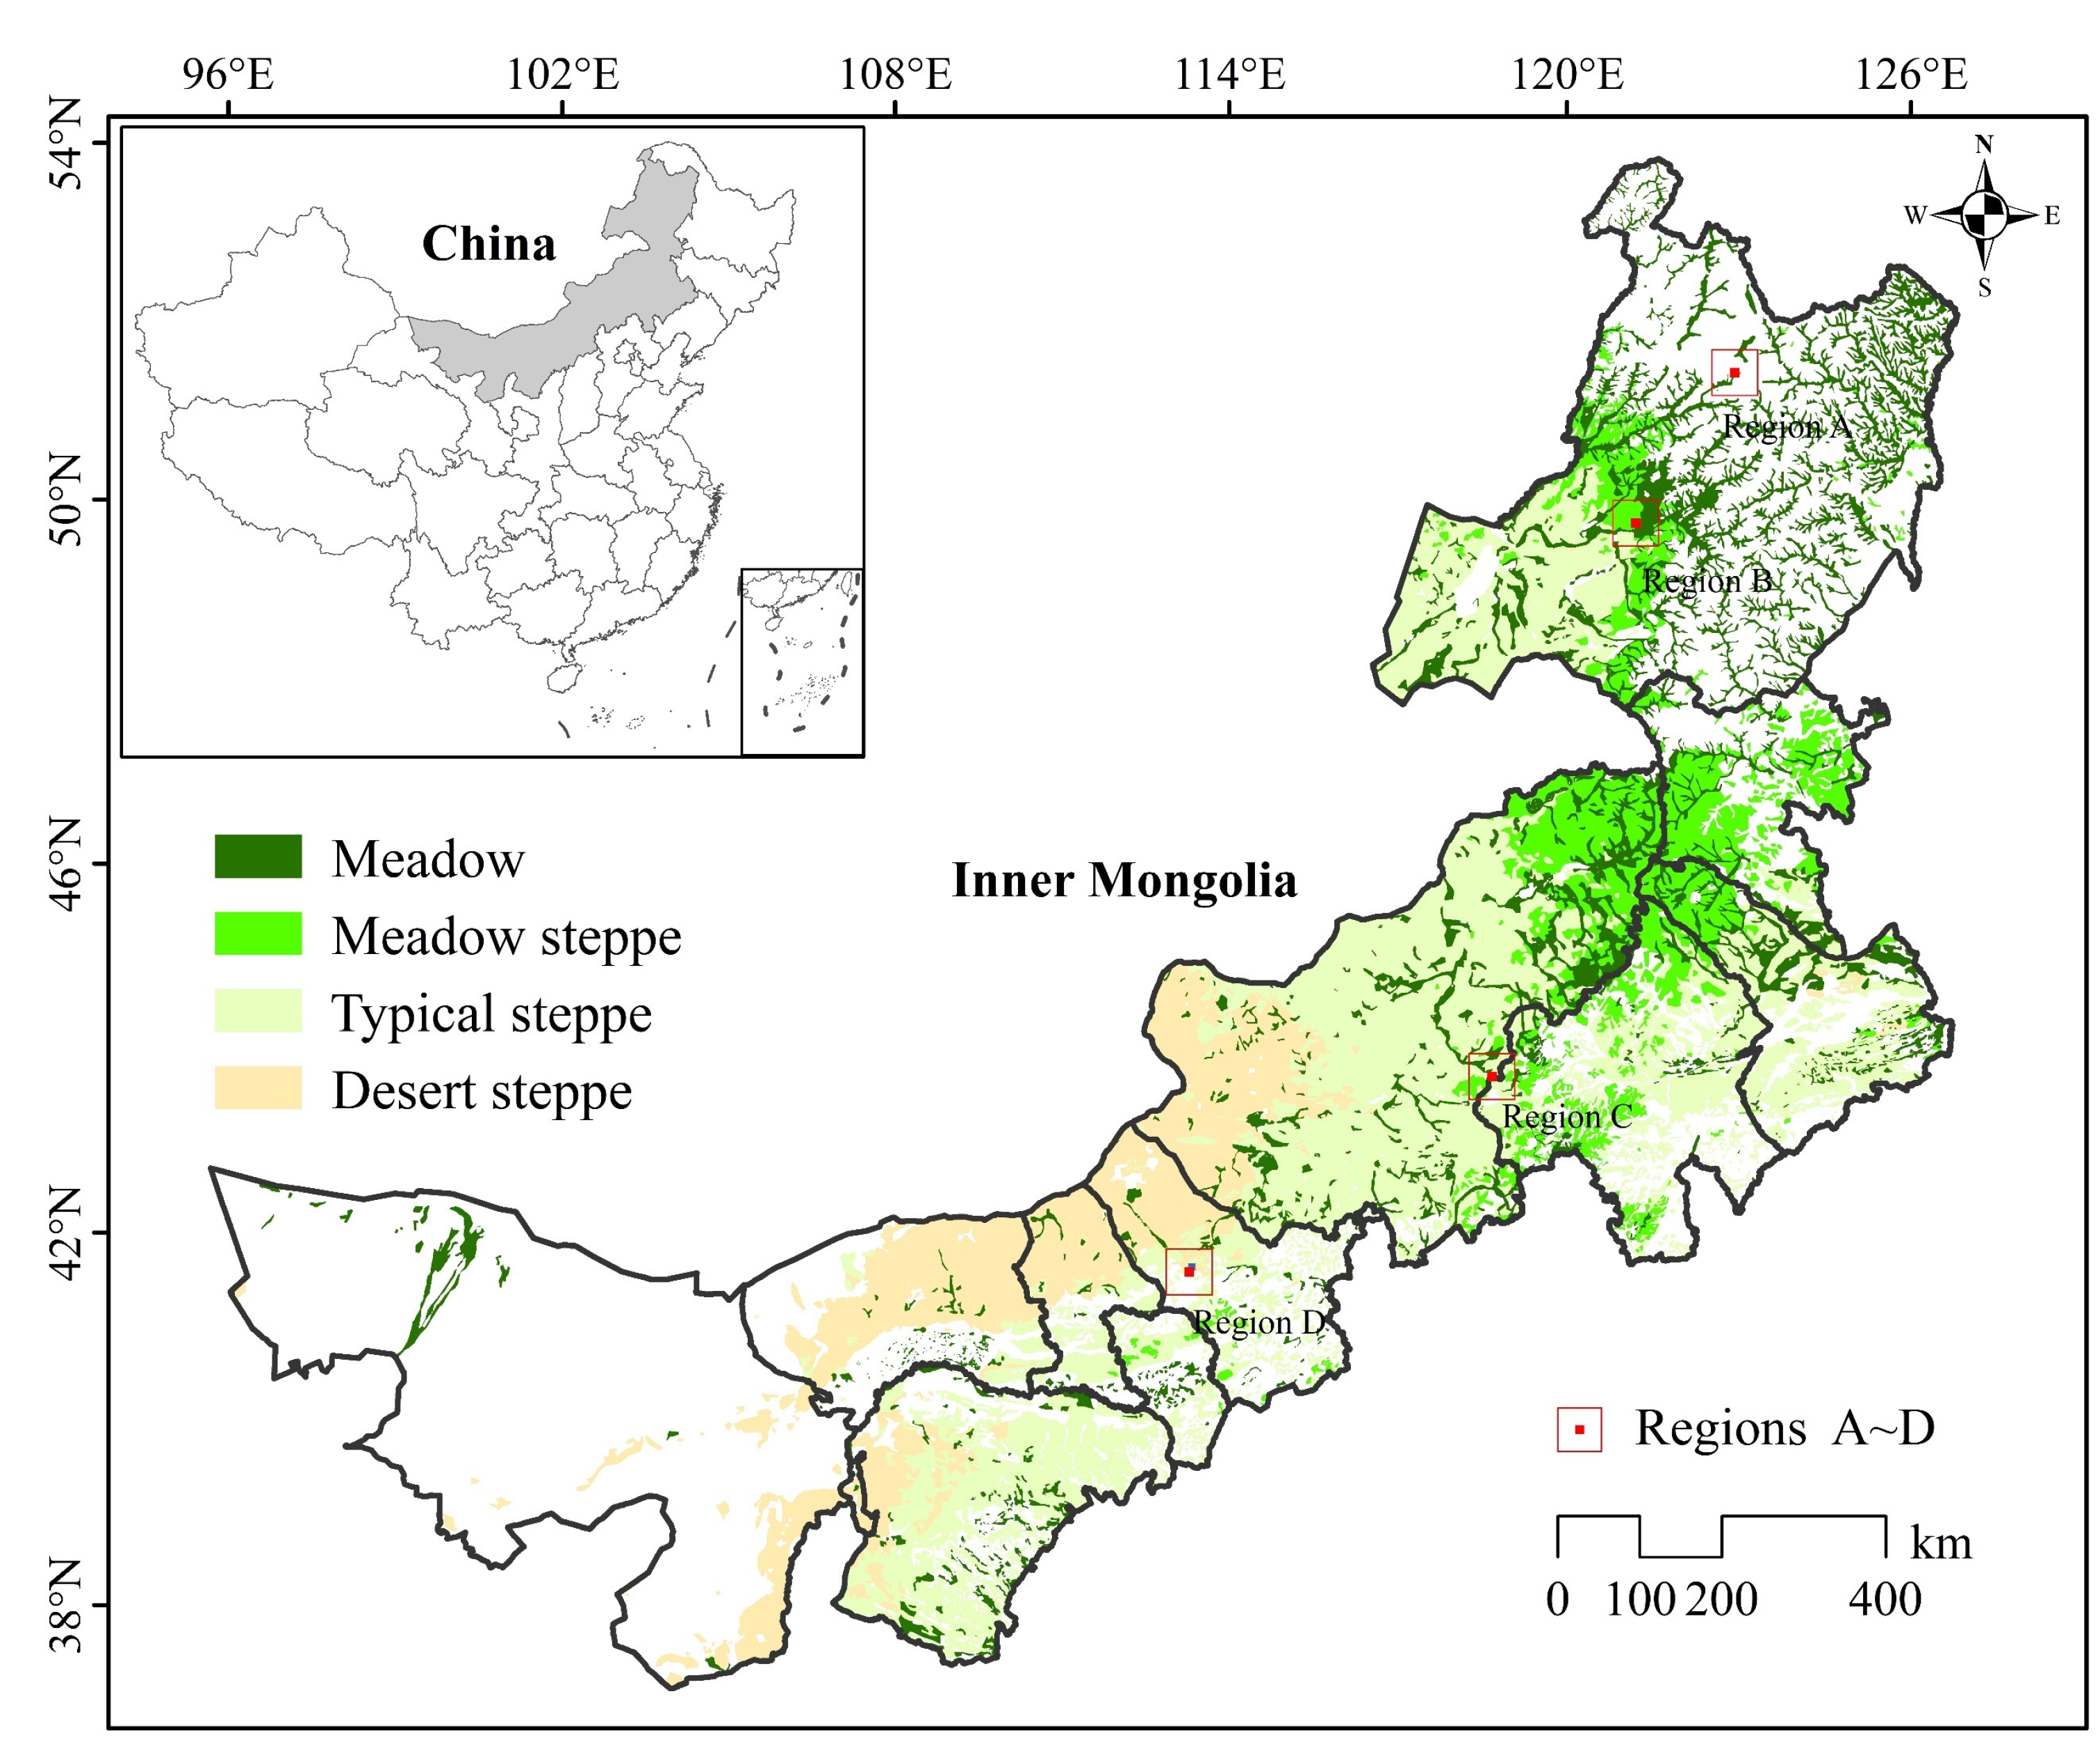
2.1. Study Area

Inner Mongolia (97°12′~126°04′E, 37°34′~53°23′N) in north-central China has a distinct temperate continental climate, decreasing precipitation, and increasing temperature from northeast to southwest, as well as clear lateral zonality. The main natural types in the study area include meadow, meadow steppe, typical steppe, and desert steppe (Figure 1). The meadow steppe is found in the low mountain hills on the east and west of the Daxinganling Mountains, the typical steppe is the dominant natural grassland, and the desert steppe is found in northwestern Xilinguole Plateau, northern Ulanqab and Bayannur plateaus, and central and western regions of the Ordo Plateau. The meadow is scattered patches within the forests or in the riparian areas (rivers and lakes).

2.2. In Situ Leaf Area Index Measurement

For the sample plots used for product validation, experiments were designed following the Test Criteria for Authenticity of Leaf Area Index Remote Sensing Products, comparing the consistency of accuracy and spatial and temporal changes between products. Within a certain range around the ground validation field (station), we chose a flat terrain area to set up different fixed sample plots. Considering the pixel size, pixel offset, and geometric error of the satellite data and parameter products, the size of the sample plots were set to at least 2 km × 2 km. Similarly, 30 m × 30 m large sample squares were set up in the sample plots, and five 1 m × 1 m small-sample vegetation-survey squares were evenly distributed along two diagonal lines in each 30 m × 30 m. According to the spatial distribution characteristics of different grassland types, a 3 km × 3 km experimental sample area was selected at each of the three field stations, namely, (1) Hulunber Meadow Steppe Station, (2) Xilinhot Typical Steppe Station, and (3) Siziwangqi Desert Steppe Station, to obtain the LAI in the peak period of the growing season using the field ground observation method. In situ LAI sample plots were measured using LAI-2200C plant canopy analyzer (Li-Cor, Lincoln, NE, USA) before 10 a.m. or after 4 p.m., or on cloudy days, when the sky condition was suitable for LAI measurement, were used to generate the LAI reference maps based on establishing their relationship with vegetation indices. Each plot was measured six times at a 270° view cap, and the average was used as the sample plot LAI (Figure 2).

2.3. Leaf Area Index Products
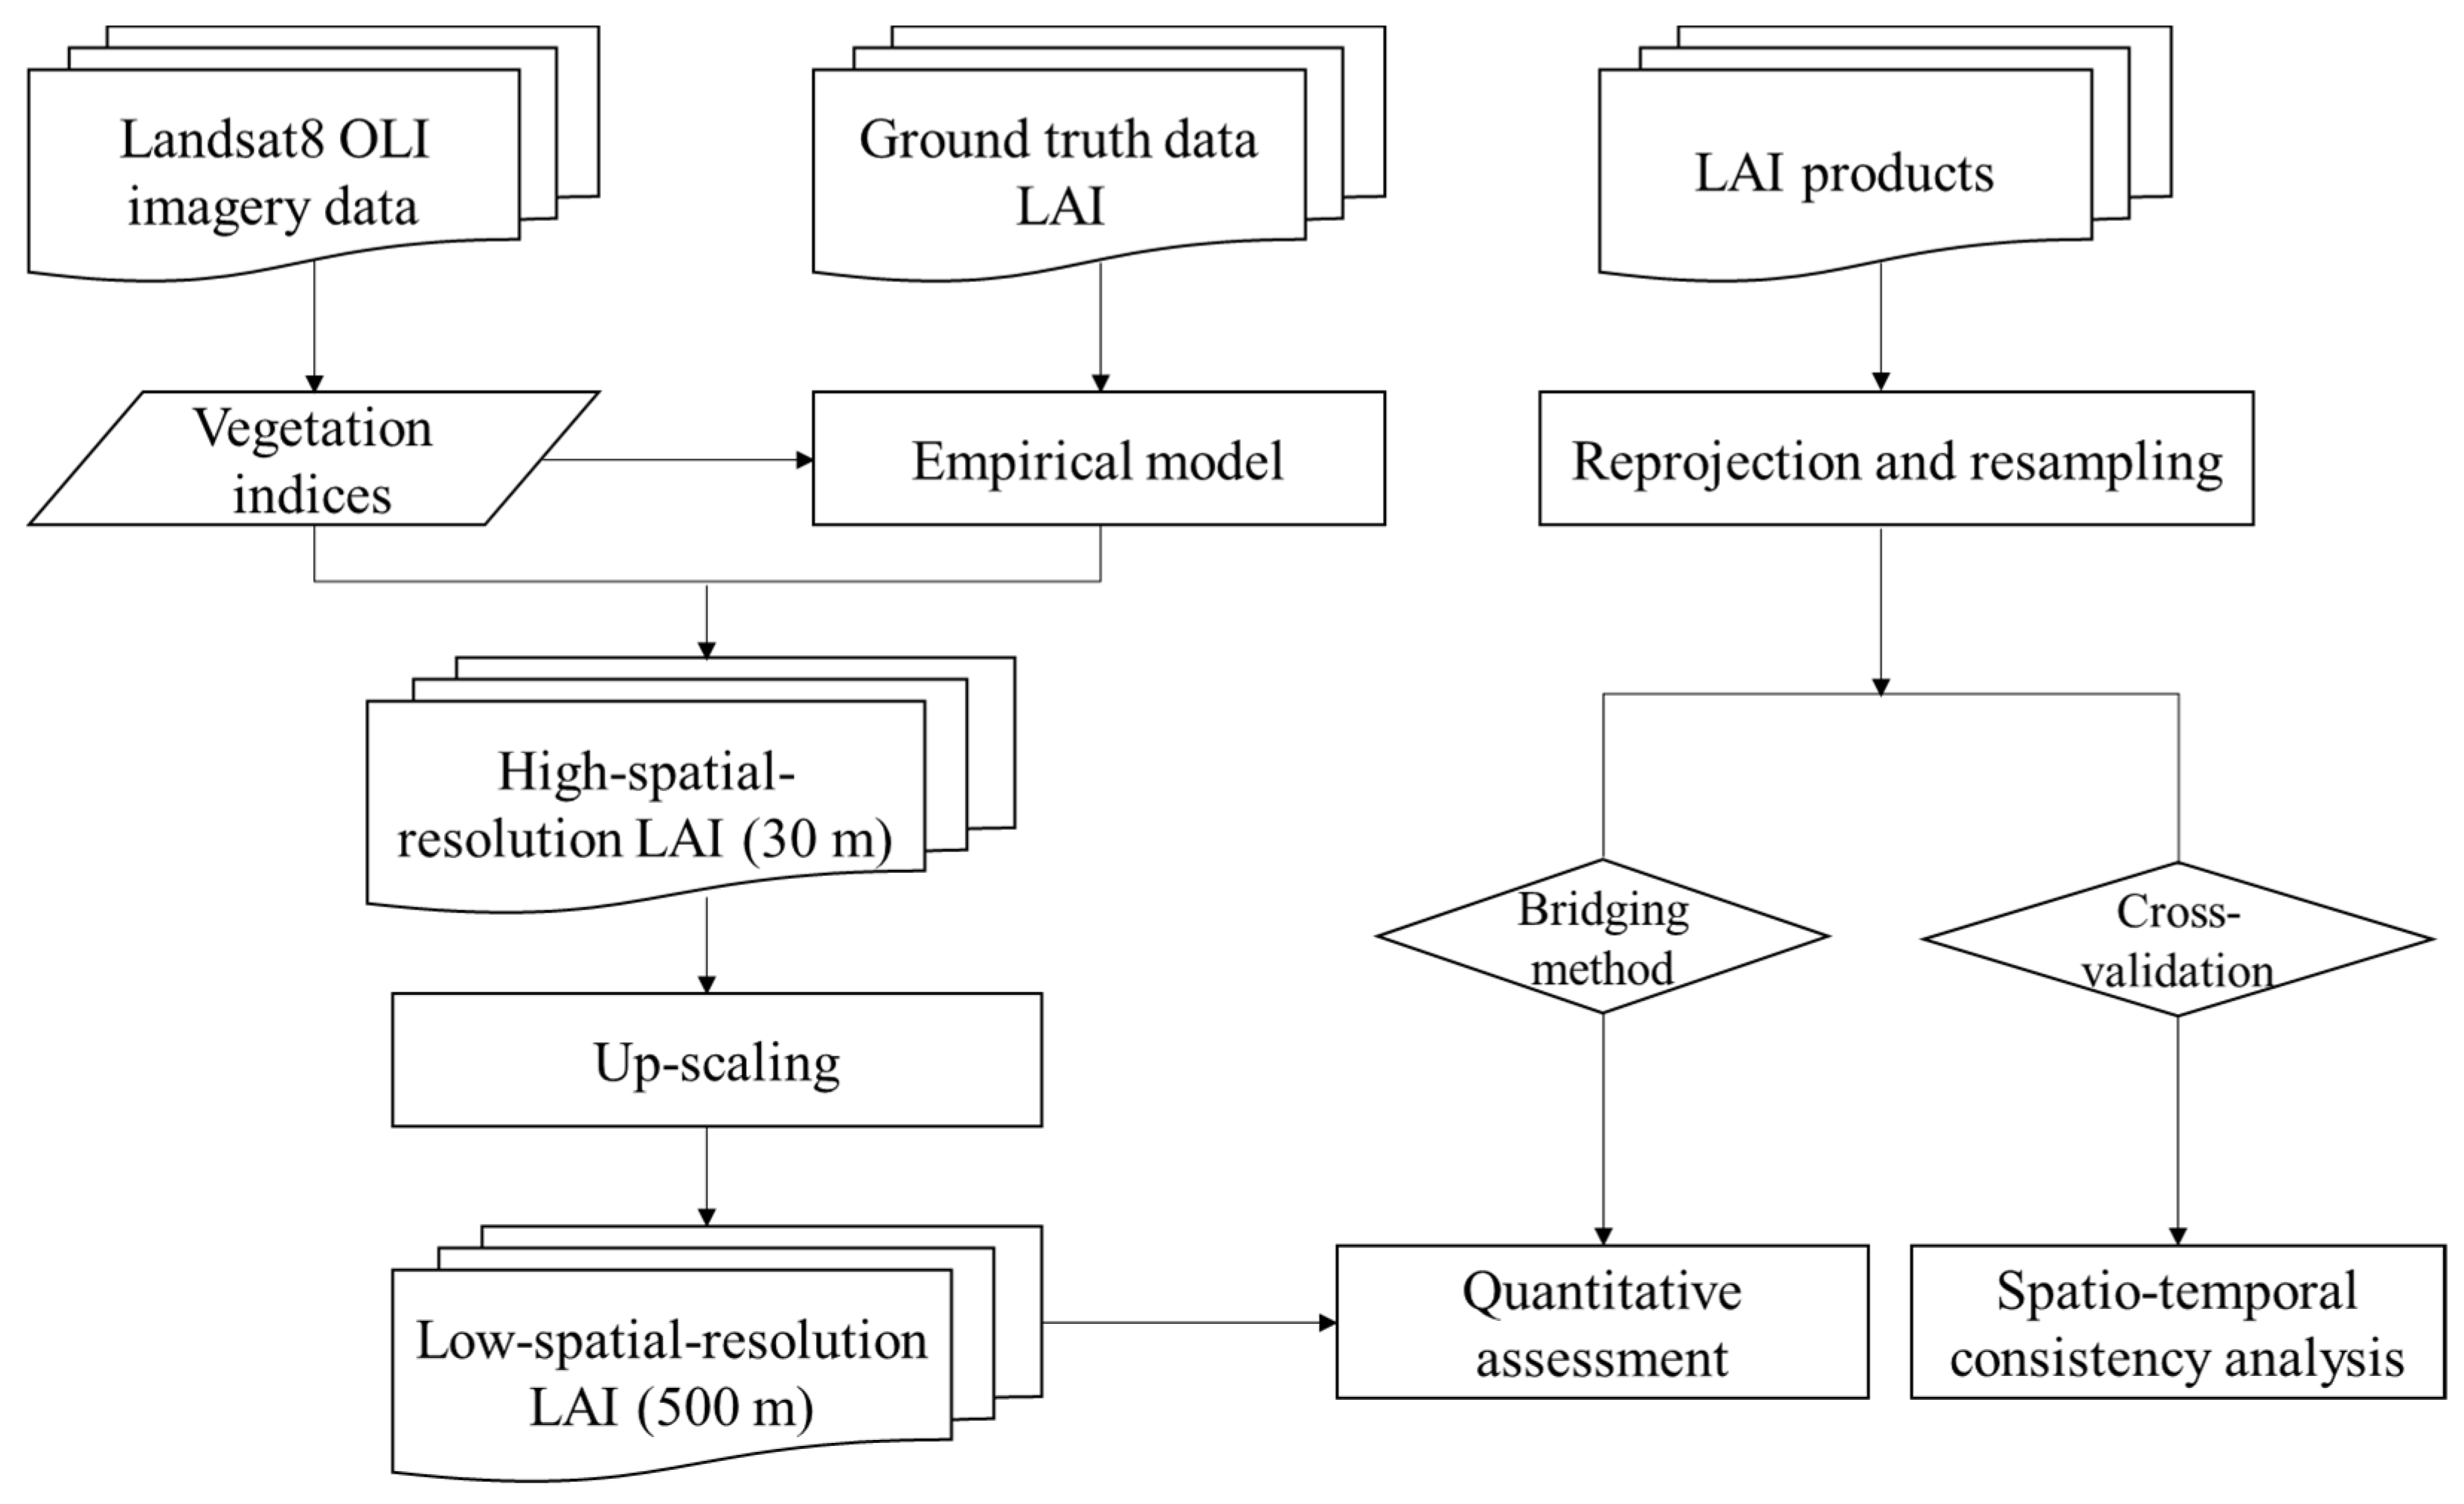
We selected four LAI products for validation: GEOV2, GLASS, GLOBMAP, and MODIS. Their main characteristics are outlined in Table 1. These LAI products have been used in several global vegetation change and carbon and water cycling studies [24,25,26].
The GEOV2 LAI product was available in the Plate Carrée projection at a 10 d temporal resolution and a 300 m or 1 km spatial resolution. It was derived from SPOT/VEGETATION sensor data based on a neural network [7]. First, a training dataset was obtained through a fusion of CYCLOPES and MODIS LAI products, and then the calibrated neural network was used to generate the GEOV2 LAI product. The dataset ranges from 1999 to the present (http://land.copernicus.eu/global/, accessed on 12 October 2020).
The GLASS LAI product was generated and released by the Center for Global Change Data Processing and Analysis of Beijing Normal University, including GLASS MODIS and GLASS AVHRR LAI products [5]. The product fused the CYCLOPES LAI dataset and the MODIS LAI dataset [9]. First, the valid LAI values of the CYCLOPES product were converted to true LAI values using the vegetation aggregation coefficient product, then the respective uncertainties of the two products by vegetation type were determined separately using the BELMANIP global real sites to generate the fused LAI dataset of both, and then the MODIS reflectance of BELMANIP sites and the LAI based on the fusion of CYCLOPES and MODIS re used as the input and output of the training dataset, respectively, to train the generalized regression neural networks (GRNNs) model. Finally, the MODIS/AVHRR reflectance product was put into the neural network to obtain the GLASS LAI product (http://glass-product.bnu.edu.cn/ or http://glcf.umd.edu/, accessed on 26 April 2022).
The GLOBMAP LAI products with long timeseries form different sensor inversions by establishing the relationship between LAI and vegetation indices. First, a MODIS LAI series was generated from MODIS land surface reflectance data (MOD09A1) based on the GLOBCARBON LAI algorithm [27]. Then, the relationships between AVHRR observations and MODIS LAI were established pixel by pixel using two data series during the overlapped period 2000–2006. Finally, the AVHRR LAI back to 1981 was estimated from historical AVHRR observations based on these pixel-level relationships [28]. The dataset ranges from 1999 to 2019 and features different resolutions. We used Version 3, with a spatial resolution of 500 m, in this study (http://land.copernicus.eu/global/, accessed on 26 April 2022).
The MODIS LAI product (MOD15A2H) was provided by the National Aeronautics and Space Administration (NASA). MODIS sensors on the Terra and Aqua satellites can collect information on global land surface LAI changes over long periods of time. The retrieval algorithm consists of a primary algorithm and an alternate algorithm. The primary algorithm was based on a three-dimensional (3D) radiative transfer model and an alternate algorithm for regression relations. The alternate algorithm used an empirical model based on the regression relationship between the normalized difference vegetation index, and LAI. The algorithm chooses the “best” pixel available from all the acquisitions of the Terra sensor from within an 8-day time step. The dataset ranges from 2000 to the present and is provided in the sinusoidal projection at an 8-day temporal resolution and a 500 m spatial resolution (https://ladsweb.nascom.nasa.gov/, accessed on 12 October 2020).

2.4. Methodology

2.4.1. Data Processing

The GLASS, GLOBMAP, and MODIS LAI products were saved in HDF format, and they were reprojected and resampled using the data reprojection tool MRT (MODIS Reprojection Tool). GEOV2 LAI products used batch processing in Arcgis10.2. All the LAI products were reprojected to Albers Conical Equal Area, and the GEOV2 LAI was upscaled to 500 m resolution. In the LAI product processing, the conversion factors varied, with GEOV2 LAI, GLASS LAI, GLOBMAP LAI, and MODIS LAI being 1/30, 1/10, 1/100, and 1/10, respectively. Finally, all LAI products were aggregated separately to a monthly time step by calculating the monthly average of the LAI values for each month.

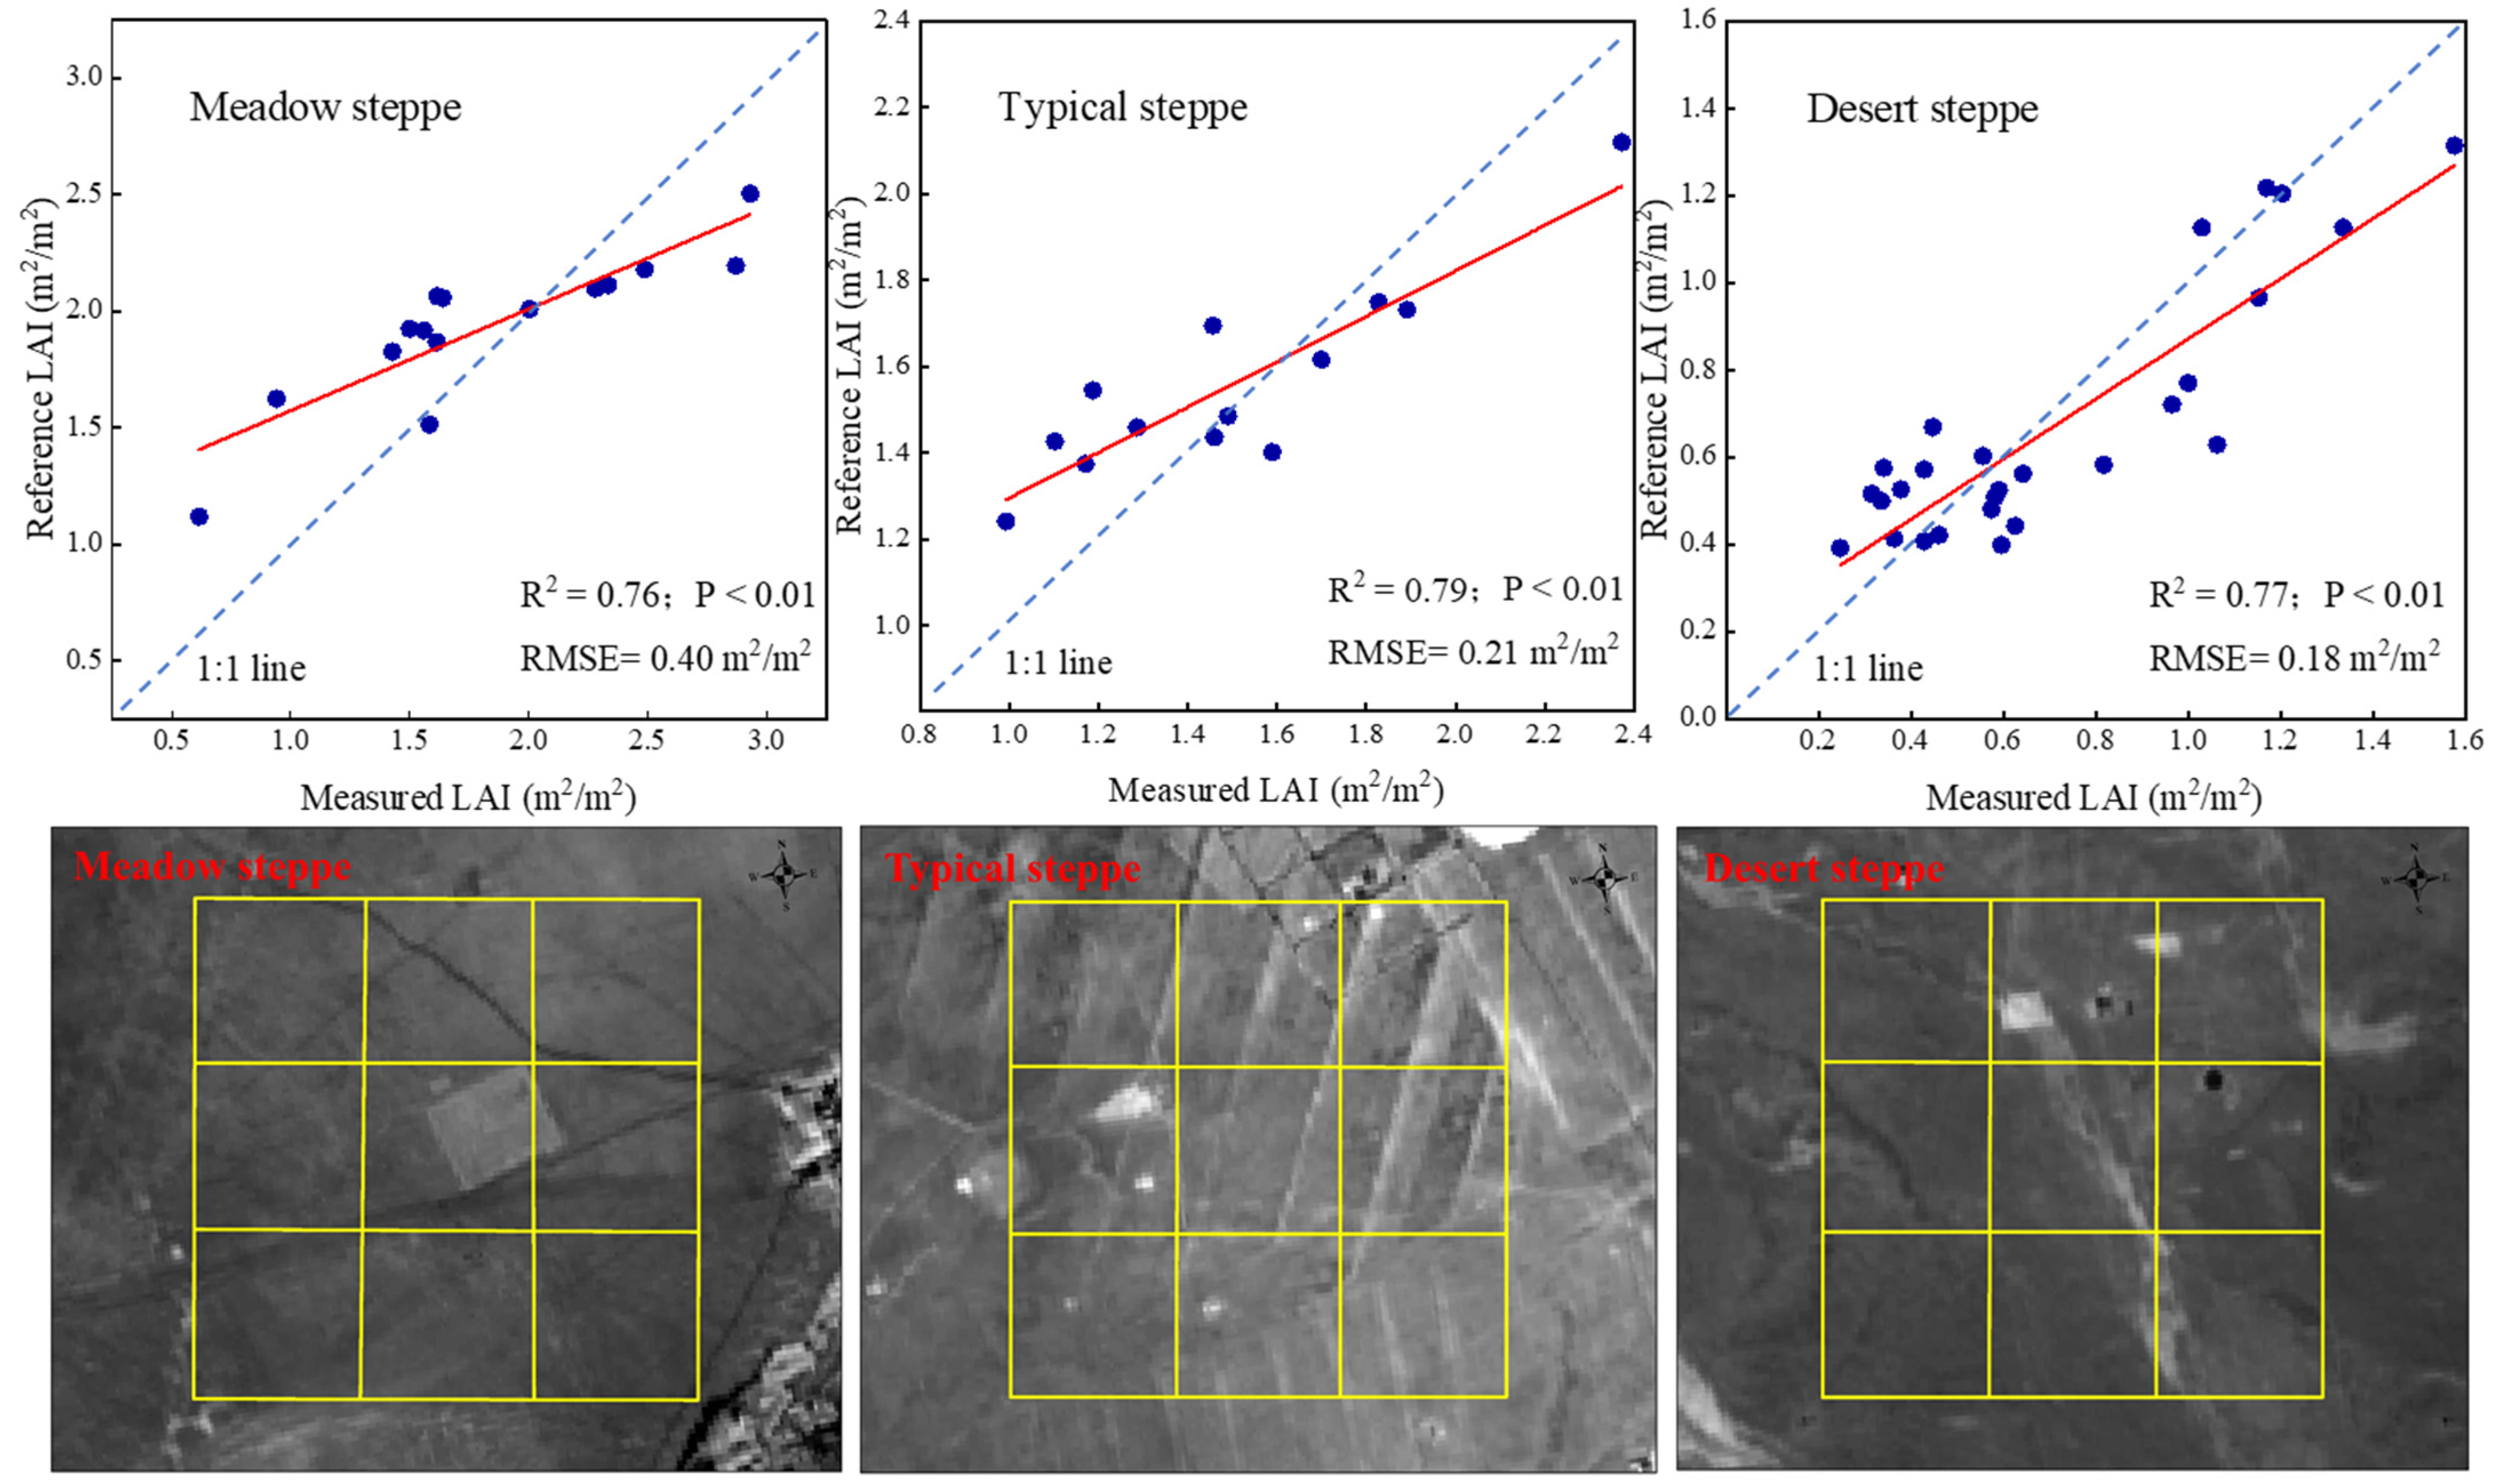
2.4.2. Leaf Area Index Reference Maps

The products were validated with the help of ground-truth data obtained in 2014, 2015 and 2019 across meadow steppe, typical steppe, and desert steppe regions. Yang [29] confirmed that there is no large gap between empirical statistics and radiative transfer model simulations in a small area. Because of the good correlation between vegetation indices and LAI, classical LAI remote sensing inversion methods usually use vegetation indices as the independent variables of statistical models, which were chosen for this study. We selected Landsat8 operational land imager (OLI) images, a widely used and recognized image data source with good quality, to generate the reference maps for different grassland types based on empirical relationships (Table 2). The normalized difference phenology index (NDPI) was chosen to establish the relationship between LAI among different grassland types; we generated LAI reference maps in Google Earth Engine with a spatial resolution of 30 m, which we then upscaled to a spatial resolution of 500 m. The NDPI design differs from the NDVI in that it incorporates the shortwave-infrared (SWIR) band [30]. Our other study also found that NDPI contributed the most to LAI estimation among multiple factors, including vegetation indices, climate factors, soil factors, and topography factors [31]. For each grassland type, 75% of the sampling points were taken for modeling and 25% for validation, respectively, to determine the inversion model to generate LAI reference maps. The NDPI is expressed as follows:
N D P I = ρ n i r ( 0.74 × ρ r e d + 0.26 ρ s w i r ) ρ n i r + ( 0.74 × ρ r e d + 0.26 ρ s w i r )
where ρred, ρnir, ρswir refer to the reflectance in the red, near-infrared, and shortwave infrared bands (corresponding Landsat8 OLI band 4, 5 and 6), respectively.

2.4.3. Validation of Leaf Area Index Products

We used both bridging and cross-validation approaches to assess the four LAI products (Figure 3), The LAI products were each aggregated into a monthly time step by computing the average from the LAI values for each month from 2010 to 2019.
We used the coefficient of determination (R2) and root mean square error (RMSE) to evaluate the performance of these satellite-derived products. For cross-validation among the LAI products, we chose the average LAI values for July to compare and analyze the four products. We calculated the correlation and the comparison of the distribution of the difference between each pair of LAI products to assess the spatial and temporal profiles of the four LAI products.
R 2 = 1 i = 1 n y i y i 2 i = 1 n y i y ¯ i 2
R M S E = 1 n i = 1 n y i y i 2
where y ^ i is the LAI values of multiple satellite-based products, y i is the LAI values of reference maps, y i ¯ is the mean values of LAI reference maps, and n is the number of LAI in the validation dataset.

3. Results

3.1. Indirect Validation Based on Leaf Area Index Reference Maps

A total of 129 in situ LAI sample plots were used to indirect validation, 52 in meadow steppe, 44 in typical steppe, and 33 in desert steppe (Table 3). First, the NDPI of the study area were calculated using remote sensing images, and the statistical model was established by randomly selecting 75% of the ground-measured LAI values and the corresponding point vegetation index values, then the LAI values were obtained by vegetation index inversion according to the statistical relationship, and the remaining 25% of the ground-measured LAI was used for comparison with the Landsat8 OLI-based inversion LAI values. The comparison results are shown in Figure 4, where RMSE = 0.40 for meadow steppe, RMSE = 0.21 for typical steppe, and RMSE = 0.18 for desert steppe, indicating that the models for the three grassland types can estimate the true values better. We used medium to generate LAI reference maps with a spatial resolution of 30 m, and then resampled the 30 m resolution LAI to 500 m spatial resolution. A comparison was made between the scale-transformed ground data and the product LAI values to check the difference between the product and the ground-truth data, giving the basis for selecting the LAI product to analyze the vegetation change.
Results comparing these LAI products with all upscaled LAI values in Inner Mongolia grassland showed that the GLASS LAI performed better in meadow steppe (R2 = 0.26, RMSE = 0.41) and typical steppe (R2 = 0.32, RMSE = 0.38). By contrast, the GEOV2 LAI performed better in desert steppe (R2 = 0.39, RMSE = 0.30) (Table 4). Different products behave differently in different grassland types.

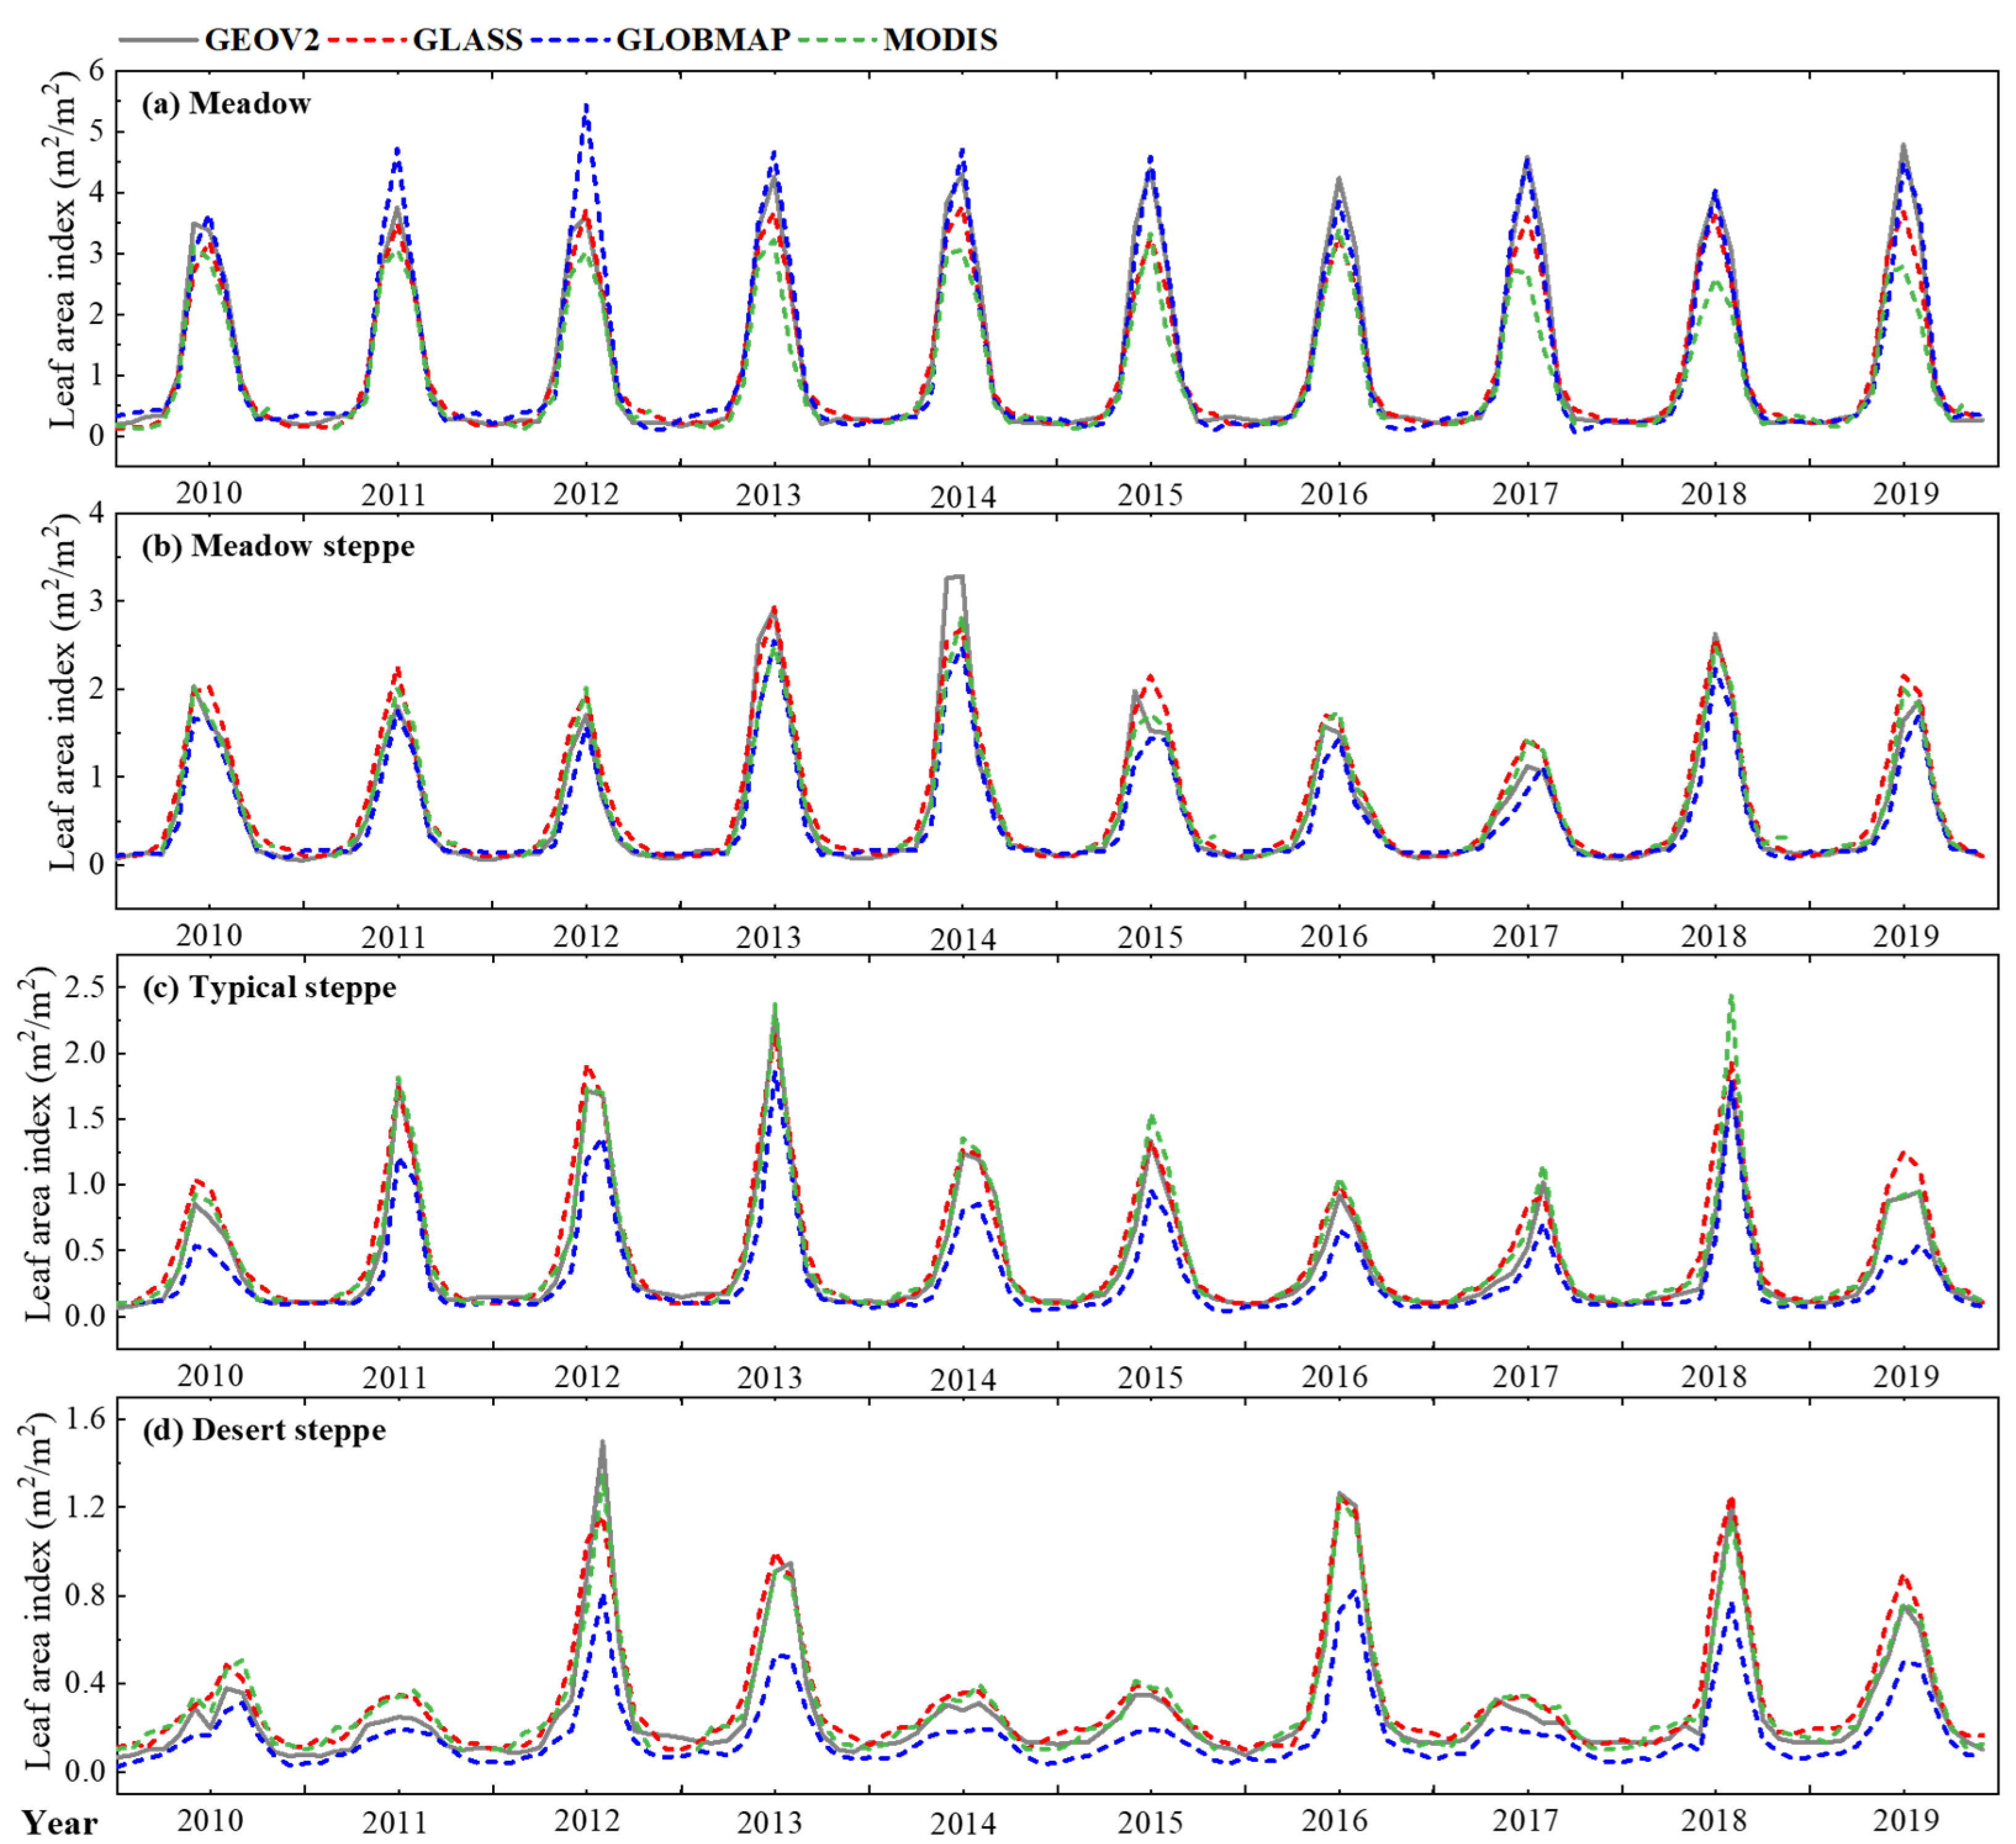
3.2. Temporal Changes of Leaf Area Index by Grassland Types

All four LAI products showed similar temporal trajectories across grassland types, and the seasonal characteristics of the timeseries curves of the four regions A~D were obvious and consistent with the phenological characteristics in Inner Mongolia (Figure 5). In the meadow type, we did not generate LAI reference maps to compare with the LAI products. In terms of timeseries, GLOBMAP is the highest, followed by GEOV2 and GLASS; MODIS is the lowest generally, and GLOBMAP is significantly overestimated in 2011 and 2012, while the other years are more similar (Figure 5a). In meadow steppe, the LAI values of GLASS performed better, and the four LAI products showed a continuous and smooth LAI distribution at the beginning and end of the growing season, except in 2014 (Figure 5b). In typical steppe, the LAI values of GLASS performed better, with GLOBMAP significantly underestimated compared to this product, and MODIS overestimated in most of the years (Figure 5c). In desert steppe, the LAI values of GEOV2 performed better. The GLOBMAP LAI values were consistently the smallest of the four products in the past decade; this confirms higher temporal instability compared to the other products (Figure 5d). For all grassland types, the largest LAI differences appeared in July. The trends of GEOV2 and GLASS were most similar, and their LAI values were closer throughout the study period.

3.3. Spatial Distribution of Leaf Area Index by Grassland Types

Spatial distributions of annual mean LAI among the four LAI products in Inner Mongolia over the period from 2010 to 2019 showed strong consistency, with significantly higher LAI values in the east and lower values in the west (Figure 6). Specifically, the average LAI of Inner Mongolia grassland using GLASS had the highest LAI values (1.08), followed by GEOV2 LAI (1.03), MODIS LAI (0.94), and GLOBMAP LAI (0.84). The LAI at pixel level by grassland type showed within-type variation, including outliers. LAI of GLOBMAP had outliers in all grassland types. Among all grassland types in Inner Mongolia, the LAI of meadow steppe was the highest, with mean LAI values fluctuating between 0.64 and 4.39, followed by meadow steppe, with a relatively large fluctuation range between 0.94 and 2.37, typical steppe between 0.30 and 1.01, and desert steppe between 0.01 and 0.20. LAI from GLASS and MODIS exhibited slightly higher values (0.16, 0.16) than from GEOV2 (0.15) and GLOBMAP (0.14) in desert steppe, while LAI from GLOBMAP exhibited a much higher value (2.38) than the other three products for meadow. The LAI from GLASS (1.85, 0.75) was higher than those from MODIS (1.76, 0.72), GEOV2 (1.67, 0.65), and GLOBMAP (1.78, 0.67) in meadow steppe and typical steppe, respectively.

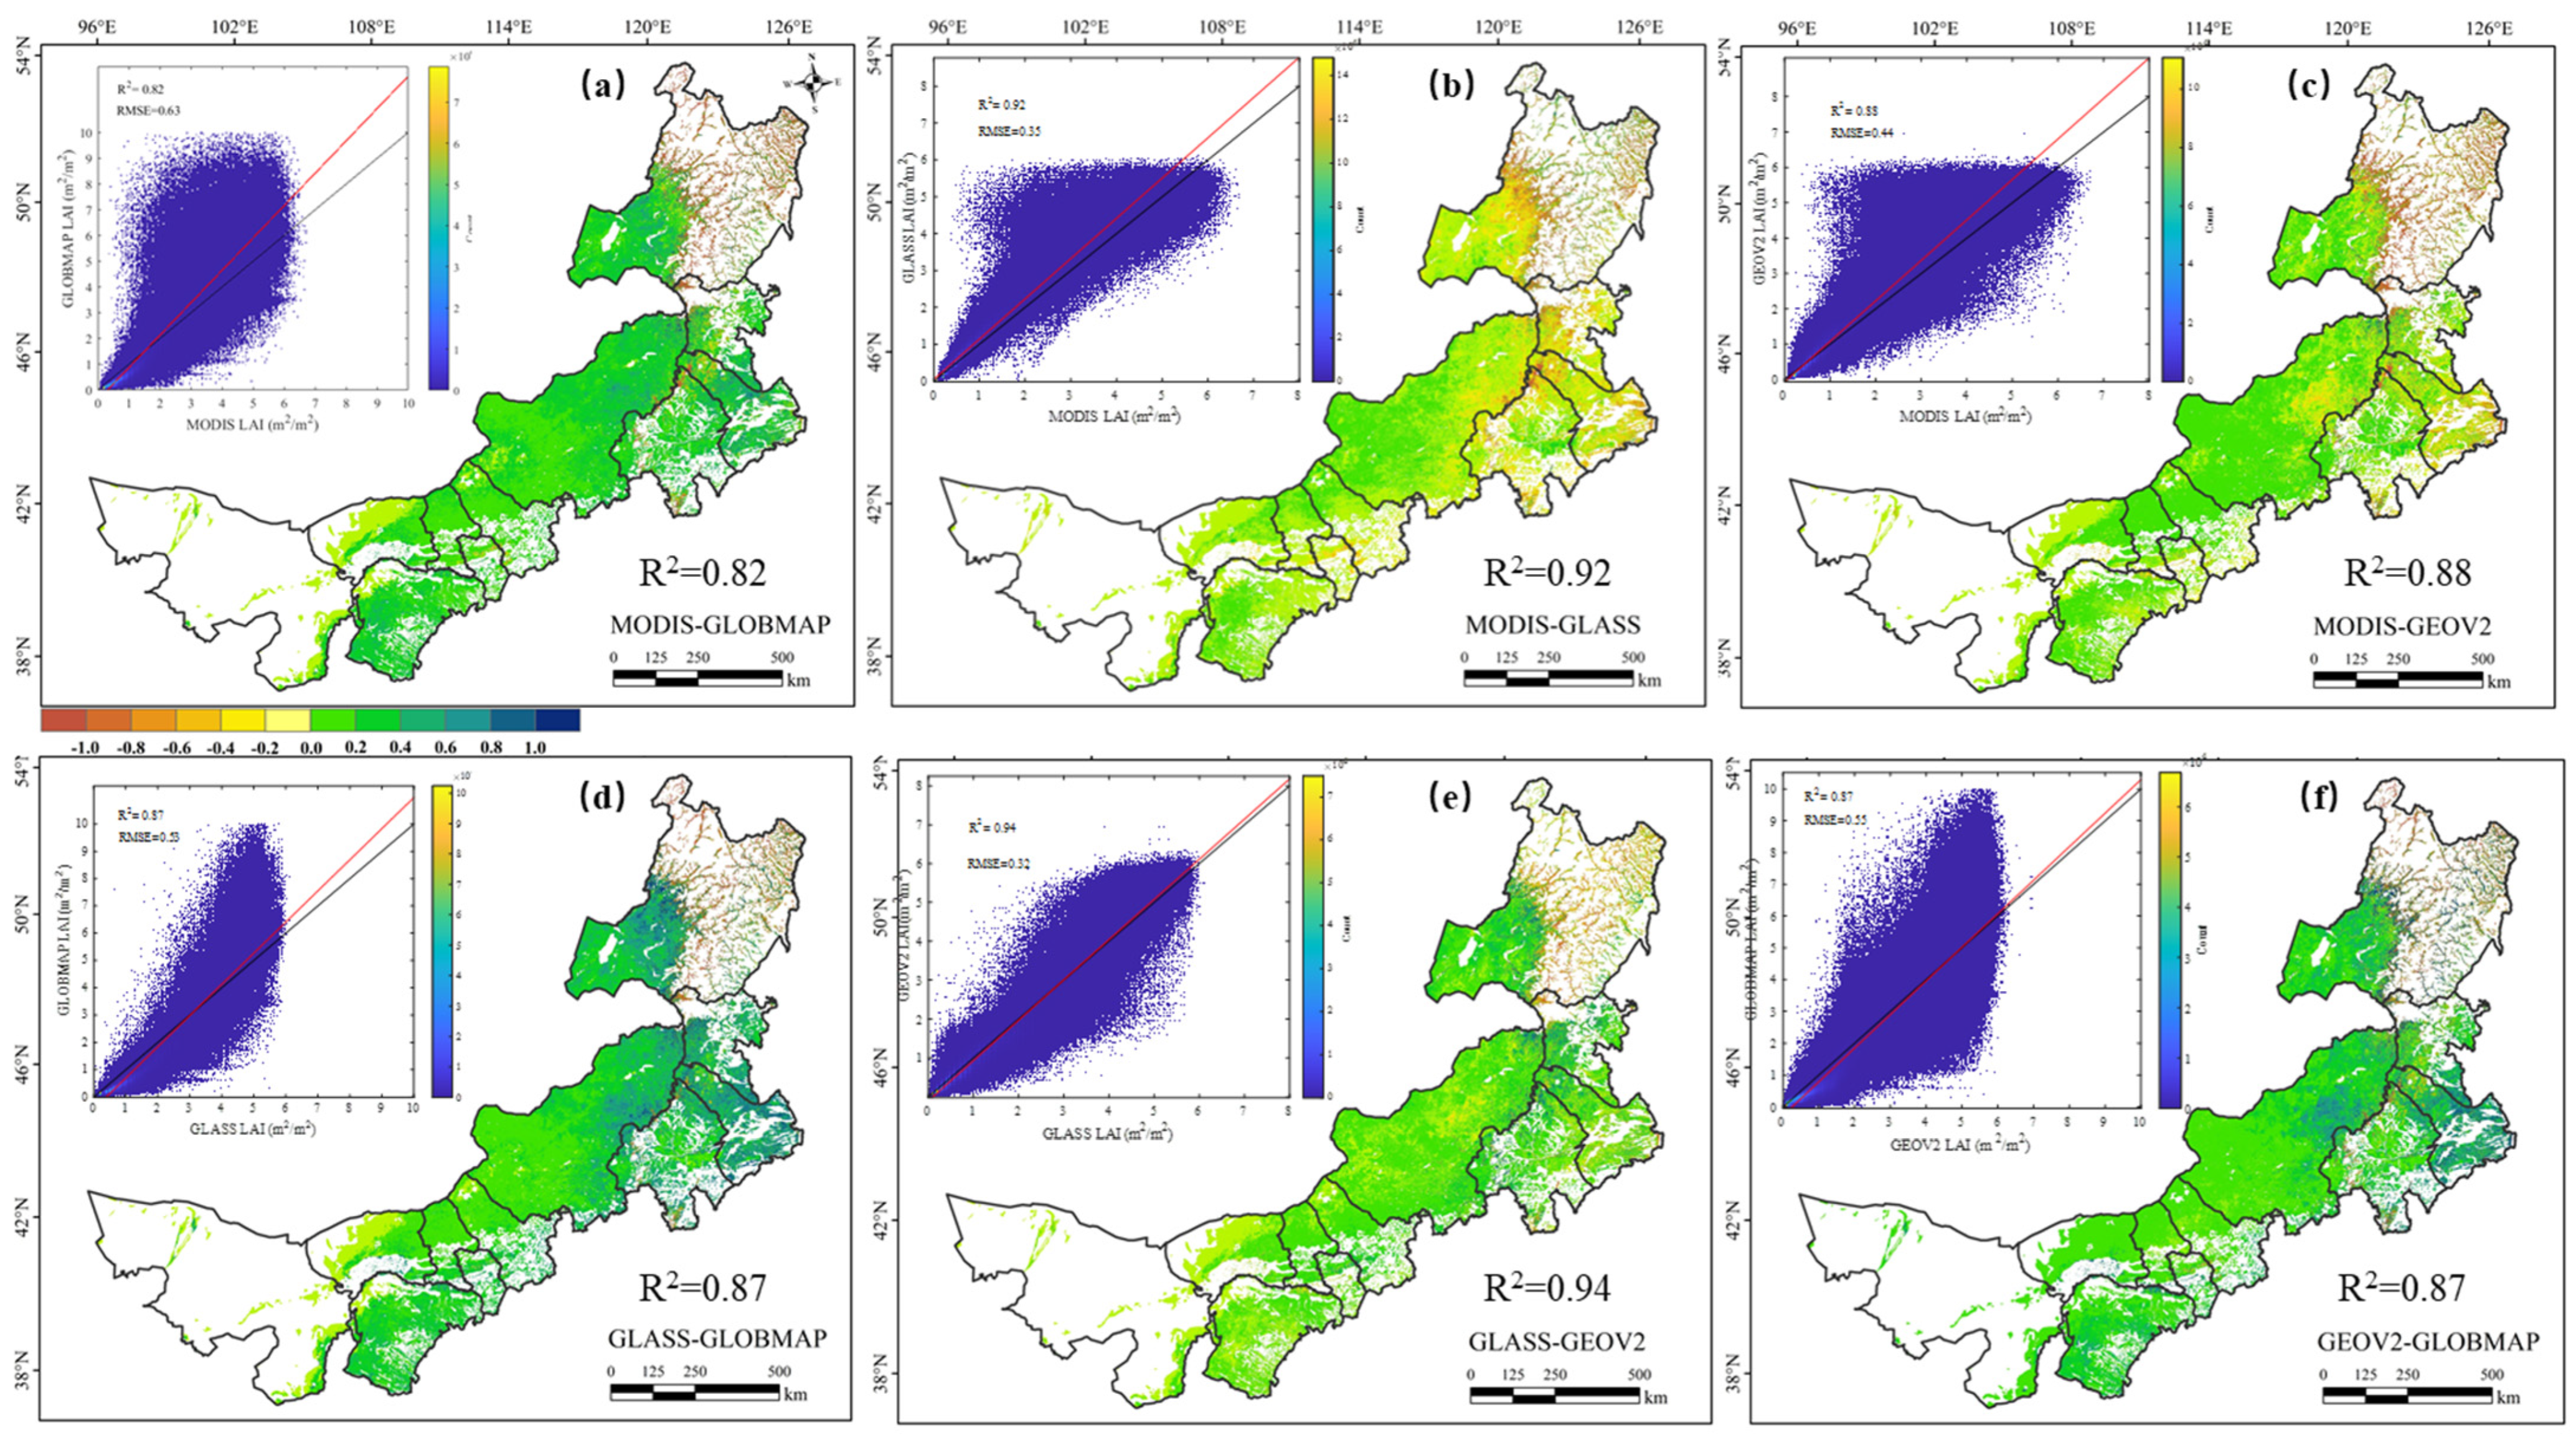
3.4. Comparison among Four Leaf Area Index Products

In the spatial difference between pairs of LAI products, LAI values were more disparate in the northeast, corresponding to meadow, which had the widest range of values and the greatest uncertainty, and GEOV2 LAI generally had the highest LAI. GLASS LAI and GEOV2 LAI had the most similar spatial distribution characteristics (Figure 7). Among the six pairs of LAI products, two pairs have high correlation with R2 > 0.90: GEOV2 LAI vs GLASS LAI (R2 = 0.94) and GLASS LAI vs MODIS LAI (R2 = 0.92). MODIS LAI and GLOBMAP LAI had the lowest correlation values (R2 = 0.82), and the remaining three pairs had moderate correlation values. Compared with GLASS LAI, the correlation can be ordered by GEOV2 LAI (R2 = 0.94), MODIS LAI (R2 = 0.92), and GLOBMAP LAI (R2 = 0.87).

4. Discussion

4.1. Validations in Grassland

Grassland plays an important role in regional climate change and global carbon cycle, and LAI in complex and diverse grassland ecosystems shows large spatial and temporal variability [32]. In situ LAI measurements are time-consuming, complex, and usually only obtain data at small scales [33,34]. By contrast, remotely sensed data has become an effective way to produce large-scale LAI products [8]. Inner Mongolia grassland is a sensitive area for global climate change; it is in the drylands, with rich vegetation types but fragile ecology. Currently, some researchers are focusing on the study of gross primary productivity (GPP), net primary productivity (NPP), and carbon and water simulations [24,35,36]. Satellite-derived LAI products provide data sources and are key inputs for these multiple land-surface models and ecological models, facilitating their effective use. Compared to crop and forest vegetation, grassland has low cover and complex canopy structure, so the distribution of LAI values can be very different, with crop generally ranging from 1 to 7 [37] and forest ranging from 3 to 7. Especially because desert steppe has a very narrow range, from 0 to 0.5, product validation is a very critical aspect for different grassland types. Spatial heterogeneity of land surface is pervasive, especially in vast grassland areas with rich grassland types. The LAI of different grassland types varies greatly, which was again reflected in the magnitude of the GLASS LAI product, which was 2.25 for meadow, 1.85 for meadow steppe, 0.75 for typical steppe, and 0.16 for desert steppe (Figure 6b). For this reason, it is also important to differentiate grassland types to consider vegetation changes. Due to the limitation of the number of validation sites, it is difficult for us to fully assess the performance of LAI products. Evaluation of the performance of LAI products for different grassland types in Inner Mongolia is still lacking, while the evaluation results are necessary for LAI product-application analysis. There are large-scale field studies [6,10,38] based on ground-truth data and intercomparison among the widely used LAI products, but there is less validation in small areas. It is also important to clarify the performance of LAI products in the dryland Inner Mongolia grassland, where LAI range values vary greatly among different grassland types, and it is necessary to develop inversion models applicable to different vegetation types in grassland, which our study has done. The results can give suggestions on multiple LAI products chosen in different grassland types.

4.2. Comparison with Other Similar Studies

We assessed the accuracy of four commonly used satellite-based LAI products (GEOV2, GLASS, GLOBMAP, and MODIS), and analyzed their spatial and temporal consistency and differences during the period from 2010 to 2019 for different grassland types in Inner Mongolia (Table 5, Figure 5, Figure 6 and Figure 7). Several previous studies also compared multiple LAI products. Xiao et al. [5] and Li et al. [17] conducted comparisons of LAI products and found that GLASS LAI showed the best performance. Our results coincide with this conclusion in Inner Mongolia grassland, but they are slightly different for different grassland types. Other studies also showed that the performance of LAI products is different when different study areas are selected [9,39]. Yin et al. [40] evaluated and compared the temporal performance of four LAI products (MOD15A2, MOD15A2H, GEOV1, and GLASS) in grassland on the northeastern Tibetan Plateau. Our study on the timeseries variation is consistent with the results of numerous researchers and is closely related to the vegetation growth curve. In recent years, many new LAI products have been produced. Zhu et al. [38] validated the MERSI GLOBCARBON LAI and MODIS GLOBCARBON LAI for grassland in China and demonstrated that FY-3A/MERSI data for global LAI retrieval shows great potential. Liu et al. [41] generated long-timeseries and high-consistency LAI products by quantitatively fusing AVHRR and MODIS data to solve the inconsistency problem of different sensors. These results provide references for the estimation of LAI. Our results show that GLASS LAI and GEOV2 LAI have good advantages in the analysis of vegetation-status characteristics for application in grassland. In analyzing the status and changes of grassland vegetation in Inner Mongolia, we suggest that these two products can be chosen as the base data. The development of reliable satellite-derived LAI products at regional to global scales is fundamental for accurate estimation of carbon and water fluxes and for discovering climate change over broad scales [24,25,42]. Meanwhile, we need accurate models that can measure grassland vegetation so we can assess socio-economic policy impacts on grassland management more precisely.

4.3. Uncertainties in the Validation

In indirect validation, the first consideration is the uncertainties in the generation of the LAI reference maps. There is a scale mismatch between ground-truth data and moderate resolution pixels. In our study, the resolution of LAI products is 300 m or 500 m, while the resolution of survey sample plots is 30 m. Even when all the sample plots are typical, representative, and homogeneous, the effect of scale effect cannot be eliminated, which also can be found in Ding et al. [43]. The temporal resolution of LAI products is 8 d or 10 d, but the ground sampling time is a particular day, which also adds uncertainty to the generation of reference maps to further de-validate the LAI products. Meanwhile, ground-truth LAI values are generally used to generate high-resolution LAI reference maps by establishing a relationship between in situ LAI values and high-resolution reflectance, such as Landsat8 OLI and Sentinel, and there is also a time difference between sampling time and image time. Even when LAI product values are selected to approximate the ground sampling time, there will be time differences. The uncertainties of the land cover also should be considered. For the period 2010–2019, the same set of grassland-type distribution maps was used, and changes in grassland type and land-use type during the study period were not considered; future studies should explicitly consider these changes. Limited by the location and number of sample plots, we mainly focused on spatial and temporal variations. More importantly, because the LAI values of the ground truth sampling points were below 2.5, the results of the validation indicated a slight underestimation (Figure 4), which will affect the validation results of the four LAI products. In addition, LAI data should be collected for a long period of time across the regions representing the terrestrial surface, which will help ecosystem models be applied on a large scale [8]. At the same time, attention should be paid to the standardized collection of data to ensure that they can be used jointly, to enable data sharing, and to enrich the datasets used for product validation. This study only verifies the representativeness of the products on different grass-type spaces, and more timeseries data will be obtained for the current authenticity test field distribution for product validation. More data are needed for timeseries validation, and we will take more sample points.

5. Conclusions

LAI products are widely used for vegetation condition assessment and model input parameters, but the performance of these products remains unclear. We used both bridging and cross-validation approaches to assess four mainstream LAI products (GEOV2, GLASS, GLOBMAP, and MODIS) for different grassland types in Inner Mongolia. In contrast to previous large-scale product validation, this study focused on the comparative analysis of the performance of four LAI products in different grassland types. The GLASS LAI provided better performance than the GEOV2 LAI, the MODIS LAI, and the GLOBMAP LAI. However, there can be large differences in the performance of these LAI products across grassland types. Among them, we suggest using GEOV2 LAI for desert steppe in Inner Mongolia, and GLASS LAI for meadow steppe and typical steppe. In addition, these four LAI products have spatial and temporal consistency across the region. Compared with GLASS LAI, the correlation can be ordered thus: GEOV2 LAI (R2 = 0.94), MODIS LAI (R2 = 0.92), and GLOBMAP LAI (R2 = 0.87). The results of this study can provide guidance for the selection of LAI products for different grassland types in Inner Mongolia, but the selection of LAI products in other regions needs to be further validated using in situ LAI from those regions. Furthermore, a more refined ground sampling strategy should be designed to obtain more accurate true values and the accuracy of the extant LAI products can be more effectively assessed using direct validation rather than bridging validation methods.

Author Contributions

Conceptualization, B.S. and X.X.; methodology, B.S. and Z.L.; software, J.G. and B.S.; validation, B.S., Z.L. and J.G.; formal analysis, B.S. and X.X.; investigation, X.X. and W.Z.; resources, B.S. and Z.L.; data curation, B.S. and X.X.; writing—original draft preparation, B.S.; writing—review and editing, B.S., J.C., W.F., M.K., A.A., A.P. and O.A.A.; supervision, X.X. and W.Z.; project administration, X.X.; funding acquisition, R.Y. All authors have read and agreed to the published version of the manuscript.

Funding

This research was supported by the National Key Research and Development Program of China (2021YFF0703904, 2021YFD1300500); the National Natural Science Foundation of China (32130070, 31971769, 41771205, 42101372); the Special Funding for Modern Agricultural Technology Systems from the Chinese Ministry of Agriculture (CARS-34); the Fundamental Research Funds Central Non-profit Scientific Institution (1610132021016); the Institute of General and Experimental Biology SB RAS (121030900138-8).

Data Availability Statement

The data presented in this study are available on request from the corresponding author.

Acknowledgments

We are grateful to many colleagues with the Hulunber Grassland Ecosystem Observation and Research Station, Institute of Agricultural Resources and Regional Planning, Chinese Academy of Agricultural Sciences (CAAS). We thank the reviewers and editors for their insightful comments and constructive suggestions.

Conflicts of Interest

The authors declare no conflict of interest.

Abbreviations

Abbreviation of SymbolDescriptionLAI Products
AVHRRAdvanced very high-resolution radiometerAVHRR
GLASSGlobal land surface satelliteGLASS LAI
MODISModerate-resolution imaging spectroradiometerMODIS LAI
GLOBMAPGlobal LAI map of Chinese Academy of SciencesGLOBMAP LAI
GEOV2Geoland2 version 2GEOV2 LAI
MERISMedium-resolution imaging spectrometer instrumentMERIS
MISRMulti-angle imaging spectroradiometerMISR LAI

References

  1. Chen, J.M.; Black, T.A. Defining leaf area index for non-flat leaves. Plant Cell Environ. 1992, 15, 421–429. [Google Scholar] [CrossRef]
  2. Jin, H.A.; Li, A.N.; Wang, J.D.; Bo, Y.C. Improvement of spatially and temporally continuous crop leaf area index by integration of CERES-Maize model and MODIS data. Eur. J. Agron. 2016, 78, 1–12. [Google Scholar] [CrossRef]
  3. Sellers, P.J.; Dickinson, R.E.; Randall, D.A.; Betts, A.K.; Hall, F.G.; Berry, J.A.; Collatz, G.J.; Denning, A.S.; Mooney, H.A.; Nobre, C.A.; et al. Modeling the exchanges of energy, water, and carbon between continents and the atmosphere. Science 1997, 275, 502–509. [Google Scholar] [CrossRef]
  4. Arora, V. Modeling vegetation as a dynamic component in soil-vegetation-atmosphere transfer schemes and hydrological models. Rev. Geophys. 2002, 40, 1006. [Google Scholar] [CrossRef]
  5. Xiao, Z.Q.; Liang, S.L.; Jiang, B. Evaluation of four long time-series global leaf area index products. Agric. For. Meteorol. 2017, 246, 218–230. [Google Scholar] [CrossRef]
  6. Fang, H.L.; Baret, F.; Plummer, S.; Schaepman-Strub, G. An overview of global leaf area index (LAI): Methods, products, validation, and applications. Rev. Geophys. 2019, 57, 739–799. [Google Scholar] [CrossRef]
  7. Baret, F.; Weiss, M.; Lacaze, R.; Camacho, F.; Makhmara, H.; Pacholcyzk, P.; Smets, B. GEOV1: LAI and FAPAR essential climate variables and FCOVER global time series capitalizing over existing products. Part1: Principles of development and production. Remote Sens. Environ. 2013, 137, 299–309. [Google Scholar] [CrossRef]
  8. Myneni, R.B.; Hoffman, S.; Knyazikhin, Y.; Privette, J.L.; Glassy, J.; Tian, Y.; Wang, Y.; Song, X.; Zhang, Y.; Smith, G.R.; et al. Global products of vegetation leaf area and fraction absorbed PAR from year one of MODIS data. Remote Sens. Environ. 2002, 83, 214–231. [Google Scholar] [CrossRef]
  9. Jin, H.A.; Li, A.N.; Bian, J.H.; Nan, X.; Zhao, W.; Zhang, Z.J.; Yin, G.F. Intercomparison and validation of MODIS and GLASS leaf area index (LAI) products over mountain areas: A case study in southwestern China. Int. J. Appl. Earth Obs. Geoinf. 2017, 55, 52–67. [Google Scholar] [CrossRef]
  10. Fang, H.L.; Wei, S.S.; Liang, S.L. Validation of MODIS and CYCLOPES LAI products using global field measurement data. Remote Sens. Environ. 2012, 119, 43–54. [Google Scholar] [CrossRef]
  11. Jiapaer, G.; Liang, S.L.; Yi, Q.X.; Liu, J.P. Vegetation dynamics and responses to recent climate change in Xinjiang using leaf area index as an indicator. Ecol. Indic. 2015, 58, 64–76. [Google Scholar] [CrossRef]
  12. Piao, S.L.; Yin, G.D.; Tan, J.G.; Cheng, L.; Huang, M.T.; Li, Y.; Liu, R.G.; Mao, J.F.; Myneni, R.B.; Peng, S.S.; et al. Detection and attribution of vegetation greening trend in China over the last 30 years. Glob. Chang. Biol. 2015, 21, 1601–1609. [Google Scholar] [CrossRef] [PubMed]
  13. Li, W.T.; Migliavacca, M.; Forkel, M.; Denissen, J.M.C.; Reichstein, M.; Yang, H.; Duveiller, G.; Weber, U.; Orth, R. Widespread increasing vegetation sensitivity to soil moisture. Nat. Commun. 2022, 13, 3959. [Google Scholar] [CrossRef] [PubMed]
  14. Fang, W.; Yi, C.X.; Chen, D.L.; Xu, P.P.; Zhou, T. Hotter and drier climate made the mediterranean europe and northern africa region a shrubbier landscape. Oecologia 2021, 197, 1111–1126. [Google Scholar] [CrossRef]
  15. Li, G.Q.; Zhang, H.Y.; Zhang, L.C.; Wang, Y.Y.; Tian, C.Z. Development and trend of Earth observation data sharing. J. Remote Sens. 2016, 20, 979–990. (In Chinese) [Google Scholar] [CrossRef]
  16. Fang, H.L. Development and validation of satellite leaf area index (LAI) products in China. Remote Sens. Technol. Appl. 2020, 35, 990–1003. (In Chinese) [Google Scholar]
  17. Li, X.L.; Lu, H.; Yu, L.; Yang, K. Comparison of the spatial characteristics of four remotely sensed leaf area index products over China: Direct validation and relative uncertainties. Remote Sens. 2018, 10, 148. [Google Scholar] [CrossRef]
  18. Fang, H.L.; Wei, S.S.; Jiang, C.Y.; Scipal, K. Theoretical uncertainty analysis of global MODIS, CYCLOPES, and GLOBCARBON LAI products using a triple collocation method. Remote Sens. Environ. 2012, 124, 610–621. [Google Scholar] [CrossRef]
  19. Claverie, M.; Vermote, E.F.; Weiss, M.; Baret, F.; Hagolle, O.; Demarez, V. Validation of coarse spatial resolution LAI and FAPAR time series over cropland in southwest France. Remote Sens. Environ. 2013, 139, 216–230. [Google Scholar] [CrossRef]
  20. Roy, D.P.; Wulder, M.A.; Loveland, T.R.; Woodcock, C.E.; Allen, R.G.; Anderson, M.C.; Helder, D.; Irons, J.R.; Johnson, D.M.; Kennedy, R.; et al. Landsat-8: Science and product vision for terrestrial global change research. Remote Sens. Environ. 2014, 145, 154–172. [Google Scholar] [CrossRef]
  21. Weiss, M.; Baret, F.; Garrigues, S.; Lacaze, R. LAI and fAPAR CYCLOPES global products derived from VEGETATION. Part 2: Validation and comparison with MODIS collection 4 products. Remote Sens. Environ. 2007, 110, 317–331. [Google Scholar] [CrossRef]
  22. Fang, H.L.; Jiang, C.Y.; Li, W.J.; Wei, S.S.; Baret, F.; Chen, J.M.; Garcia-Haro, J.; Liang, S.L.; Liu, R.G.; Myneni, R.B.; et al. Characterization and intercomparison of global moderate resolution leaf area index (LAI) products: Analysis of climatologies and theoretical uncertainties. J. Geophys. Res. Biogeosci. 2013, 118, 529–548. [Google Scholar] [CrossRef]
  23. Li, Z.W.; Tang, H.; Xin, X.P.; Zhang, B.H.; Wang, D.L. Assessment of the MODIS LAI product using ground measurement data and HJ-1A/1B imagery in the meadow steppe of Hulunber, China. Remote Sens. 2014, 6, 6242–6265. [Google Scholar] [CrossRef]
  24. Liu, Y.B.; Xiao, J.F.; Ju, W.M.; Zhu, G.L.; Wu, X.C.; Fan, W.L.; Li, D.Q.; Zhou, Y.L. Satellite-derived LAI products exhibit large discrepancies and can lead to substantial uncertainty in simulated carbon and water fluxes. Remote Sens. Environ. 2018, 206, 174–188. [Google Scholar] [CrossRef]
  25. Jiang, C.Y.; Ryu, Y.; Fang, H.L.; Myneni, R.; Claverie, M.; Zhu, Z.C. Inconsistencies of interannual variability and trends in long-term satellite leaf area index products. Glob. Chang. Biol. 2017, 23, 4133–4146. [Google Scholar] [CrossRef]
  26. Zhu, Z.C.; Piao, S.L.; Myneni, R.B.; Huang, M.T.; Zeng, Z.Z.; Canadell, J.G.; Ciais, P.; Sitch, S.; Friedlingstein, P.; Arneth, A.; et al. Greening of the Earth and its drivers. Nat. Clim. Chang. 2016, 6, 791–795. [Google Scholar] [CrossRef]
  27. Deng, F.; Chen, J.M.; Plummer, S.; Chen, M.Z.; Pisek, J. Algorithm for global leaf area index retrieval using satellite imagery. IEEE Trans. Geosci. Remote Sens. 2006, 44, 2219–2229. [Google Scholar] [CrossRef]
  28. Liu, R.G.; Liu, Y. Generation of new cloud masks from MODIS land surface reflectance products. Remote Sens. Environ. 2013, 133, 21–37. [Google Scholar] [CrossRef]
  29. Yang, F. Research on Remote Sensing Based LAI Inversion Using PROSAIL Model in Inner Mongolian Grasslands; Inner Mongolia Normal University: Hohhot, China, 2016. [Google Scholar]
  30. Wang, C.; Chen, J.; Wu, J.; Tang, Y.H.; Shi, P.J.; Black, T.A.; Zhu, K. A snow-free vegetation index for improved monitoring of vegetation spring green-up date in deciduous ecosystems. Remote Sens. Environ. 2017, 196, 1–12. [Google Scholar] [CrossRef]
  31. Shen, B.B.; Ding, L.; Ma, L.C.; Li, Z.W.; Pulatov, A.; Kulenbekov, Z.; Chen, J.Q.; Mambetova, S.; Hou, L.L.; Xu, D.W.; et al. Modeling the leaf area index of Inner mongolia grassland based on machine learning regression algorithms incorporating empirical knowledge. Remote Sens. 2022, 14, 4196. [Google Scholar] [CrossRef]
  32. Geng, Y.B.; Dong, Y.S.; Qi, Y.C. Review about the carbon cycle researches in grassland ecosystem. Prog. Geogr. 2004, 3, 74–81. (In Chinese) [Google Scholar] [CrossRef]
  33. Zeng, Y.L.; Li, J.; Liu, Q.H. Review article: Global LAI ground validation dataset and product validation framework. Adv. Earth Sci. 2012, 27, 165–174. (In Chinese) [Google Scholar]
  34. Jonckheere, I.; Fleck, S.; Nackaerts, K.; Muys, B.; Coppin, P.; Weiss, M.; Baret, F. Review of methods for in situ leaf area index determination: Part I. Theories, sensors and hemispherical photography. Agric. For. Meteorol. 2004, 121, 19–35. [Google Scholar] [CrossRef]
  35. Hou, J.Y.; Zhou, Y.L.; Liu, Y. Spatial and temporal differences of GPP simulated by different satellite-derived LAI in China. Remote Sens. Technol. Appl. 2020, 35, 1015–1027. (In Chinese) [Google Scholar]
  36. Xie, X.Y.; Li, A.N.; Jin, H.A.; Tan, J.B.; Wang, C.B.; Lei, G.B.; Zhang, Z.J.; Bian, J.H.; Nan, X. Assessment of five satellite-derived LAI datasets for GPP estimations through ecosystem models. Sci. Total Environ. 2019, 690, 1120–1130. [Google Scholar] [CrossRef]
  37. Delegido, J.; Verrelst, J.; Meza, C.M.; Rivera, J.P.; Alonso, L.; Moreno, J. A red-edge spectral index for remote sensing estimation of green LAI over agroecosystems. Eur. J. Agron. 2013, 46, 42–52. [Google Scholar] [CrossRef]
  38. Zhu, L.; Chen, J.M.; Tang, S.H.; Li, G.C.; Guo, Z.D. Inter-comparison and validation of the FY-3A/MERSI LAI product over Mainland China. IEEE J. Sel. Topics Appl. Earth Observ. Remote Sens. (JSTARS) 2014, 7, 458–468. [Google Scholar] [CrossRef]
  39. Garrigues, S.; Lacaze, R.; Baret, F.; Morisette, J.T.; Weiss, M.; Nickeson, J.E.; Fernandes, R.; Plummer, S.; Shabanov, N.V.; Myneni, R.B.; et al. Validation and intercomparison of global Leaf Area Index products derived from remote sensing data. J. Geophys. Res. 2008, 113, G02028. [Google Scholar] [CrossRef]
  40. Yin, G.F.; Li, A.N.; Zhang, Z.J.; Lei, G.B. Temporal validation of four LAI products over grasslands in the northeastern Tibetan Plateau. Photogramm. Eng. Remote Sens. 2020, 86, 225–233. [Google Scholar] [CrossRef]
  41. Liu, Y.; Liu, R.G. Retrieval of global long-term leaf area index from LTDR AVHRR and MODIS observations. J. Geo-Inf. Sci. 2015, 17, 1304–1312. [Google Scholar]
  42. Yan, H.; Wang, S.Q.; Billesbach, D.; Oechel, W.; Zhang, J.H.; Meyers, T.; Martin, T.A.; Matamala, R.; Baldocchi, D.; Bohrer, G.; et al. Global estimation of evapotranspiration using a leaf area index-based surface energy and water balance model. Remote Sens. Environ. 2012, 124, 581–595. [Google Scholar] [CrossRef]
  43. Ding, L.; Li, Z.W.; Shen, B.B.; Wang, X.; Xu, D.W.; Yan, R.R.; Yan, Y.C.; Xin, X.P.; Xiao, J.F.; Li, M.; et al. Spatial patterns and driving factors of aboveground and belowground biomass over the eastern Eurasian steppe. Sci. Total Environ. 2022, 803, 149700. [Google Scholar] [CrossRef] [PubMed]
Figure 1. Location of the study area and the regions A~D, which represent the 5 km × 5 km areas used to analyze the timeseries profiles of leaf area index (LAI) (see Section 3.2). The background map shows the grassland types at 1:1,000,000 scale, including meadow, meadow steppe, typical steppe, and desert steppe.
Remotesensing 15 04736 g001
Figure 2. Distribution of sampling plots by grassland types: (a): site locations; field sampling sites (b): meadow steppe, (c): typical steppe, (d): desert steppe. The background map shows the Landsat-8 operational land imager (OLI) false-color composite image.
Remotesensing 15 04736 g002
Figure 3. Flowchart of leaf area index products (GEOV2, GLASS, GLOBMAP, and MODIS) validated in different grassland types using bridging and cross-validation methods.
Remotesensing 15 04736 g003
Figure 4. Modeling and validation of statistical models based on vegetation indices: meadow steppe (left), typical steppe (middle), desert steppe (right).
Remotesensing 15 04736 g004
Figure 5. Temporal changes of the leaf area index (LAI) products from 2010 to 2019. A large sample plot of 5 × 5 km was selected to represent the LAI value of a period after taking the mean value for each of the four grassland types. These include meadow (50.79°N, 122.17°E) and meadow steppe (49.36°N, 120.11°E) at Hulunber, typical steppe (43.54°N, 116.65°E) at Xilinhot, and desert steppe (41.77°N, 111.87°E) at Erlianhot, which can be found in Figure 1.
Remotesensing 15 04736 g005
Figure 6. Spatial distribution and boxplots of annual mean leaf area index (LAI) from four LAI products in July of 2010–2019: (a) GEOV2; (b) GLASS; (c) GLOBMAP and (d) MODIS. The red points in boxplots represent the outliers.
Remotesensing 15 04736 g006
Figure 7. Spatial difference and density scatter plots between each pair of leaf area index (LAI) products in July: (a) the difference between MODIS and GLOBMAP; (b) the difference between MODIS and GLASS; (c) the difference between MODIS and GEOV2; (d) the difference between GLASS and GLOBMAP; (e) the difference between GLASS and GEOV2; (f) the difference between GEOV2 and GLOBMAP. The density scatter plots show the spatial correlations among each pair of LAI products at the pixel scale, and the different colors of the statistical distribution represent different levels of the number of image elements in each classification. A color shift towards yellow indicates higher density, with the densest values in all LAI products occurring mainly on regions with smaller LAI values.
Remotesensing 15 04736 g007
Table 1. The leaf area index products selected to evaluate performance in different grassland types and to compare with one another.
ProductSensorSpatial
Resolution
Temporal
Resolution
AlgorithmsReference
GEOV2MODIS300 m10 dNN (red, NIR, SWIR, SZA)[7]
GLASSSPOT/VEGETATION500 m8 dNN (red, NIR)[9]
GLOBMAPMODIS500 m8 dVI-LAI relationship[8]
MODIS (MOD15A2H)MODIS500 m8 dLUT (red, NIR)[10]
Table 2. Collection of Landsat8 OLI remote sensing images based on ground sampling time and which used to generate LAI reference maps.
Grassland TypesRow/ColumnSatellite Transit Date
(Year-Month-Day)
Experiment Date
(Year-Month-Day)
Meadow steppe123/262014-07-182014-07-18
123/262019-08-012019-08-06
Typical steppe123/302019-08-012019-08-01
123/302015-07-282015-07-23
123/302015-07-262015-07-25
Desert steppe126/312019-08-062019-08-06
126/312019-08-222019-08-20
126/312015-07-262015-07-25
Table 3. The mean and standard deviation (SD) of in situ leaf area index of different grassland types sampled during July and August in 2014, 2015, and 2019.
IndicatorsMeadow SteppeTypical SteppeDesert SteppeInner Mongolia
n524433129
Mean (m2/m2)1.841.160.731.17
SD (m2/m2)0.570.470.420.63
Table 4. Simple linear regression model of normalized difference phenology index–leaf area index.
Grassland TypesModelR2F-StatisticSig. F
Meadow steppey = 7.87x + 0.240.5441.440.000
Typical steppey = 7.89x + 0.270.5653.330.000
Desert steppey = 3.78x + 0.090.6370.490.000
Table 5. The validation of the GEOV2, GLASS, GLOBMAP, and MODIS LAI products in the different grassland types, including R2 and RMSE (m2/m2).
IndicatorsMeadow SteppeTypical SteppeDesert Steppe
a 1b 2c 3d 4abcdabcd
R20.180.260.350.050.210.320.160.310.390.360.020.12
RMSE0.420.410.451.010.400.380.720.490.300.340.510.38
1 a represents the GEOV2 LAI, 2 b represents the GLASS LAI, 3 c represents the GLOBMAP LAI, 4 d represents the MODIS LAI.
Disclaimer/Publisher’s Note: The statements, opinions and data contained in all publications are solely those of the individual author(s) and contributor(s) and not of MDPI and/or the editor(s). MDPI and/or the editor(s) disclaim responsibility for any injury to people or property resulting from any ideas, methods, instructions or products referred to in the content.

