Article

A Method to Suppress Interferences Based on Secondary Compensation with QPC-FDA-MIMO Radar

National Key Laboratory of Radar Signal Processing, Xidian University, Xi’an 710071, China
*
Author to whom correspondence should be addressed.
Remote Sens. 2023, 15(19), 4711; https://doi.org/10.3390/rs15194711
Submission received: 16 August 2023 / Revised: 17 September 2023 / Accepted: 22 September 2023 / Published: 26 September 2023

Abstract

:
The traditional phased array radar is unable to distinguish mainlobe deceptive interference from the true target when they share an identical angle. To address this issue, a method is developed to suppress the interference in the joint transmit–receive–Doppler frequency domain, using secondary compensation and quadratic phase code (QPC) with the frequency diversity array multiple-input multiple-output (FDA-MIMO) radar. The QPC technique is employed by encoding the transmitted pulses in various spatial channels, which extends the degrees-of-freedom (DOFs) of the system. To distinguish and suppress the false targets behind the true target by at least one pulse, Doppler compensation is performed and Doppler filters are employed. To distinguish the fast-generated false targets, which are located in the same pulse with the true target, the spatial frequency compensation is implemented, which equivalently relocates the mainlobe interference to the sidelobes. Via the singular spectrum analysis (SSA) technique and the data-dependent beamforming, the interferences within the ambiguity region are suppressed. Simulation results verify the effectiveness of the method.

1. Introduction

In a complex electromagnetic environment, radar systems face various interferences, severely constraining their accurate acquisition of target information [1,2,3]. Common types of interferences include jamming interference and deceptive interference. Among them, the deceptive interference is widely used due to its strong similarity to the true target [4,5]. False targets can be generated by modulating, delaying and retransmitting the intercepted radar signals in the digital radio frequency memory (DRFM). When the deceptive interference is located within the mainlobe of the beam, the constant false-alarm rate (CFAR) detection technique cannot detect the true target, posing a severe challenge to radar detection. The traditional suppression method, including space–time adaptive processing (STAP), ultra-low sidelobe antennas and generalized sidelobe canceller (GSC) [6,7], can effectively suppress the sidelobe interferences. However, the mainlobe interference could not be suppressed by them.
Currently, researchers conduct several anti-interference studies on mainlobe deceptive interference in the time domain [8,9,10,11], frequency domain [12,13,14,15], spatial domain [16,17,18] and other domains [19]. Ref. [20] used the blind source separation (BBS) technique to suppress mainlobe interference. However, this method assumed that the interference and the true one either have a weak correlation or are independent. Refs. [21,22] combined pulse repetition frequency jitter and frequency agility in waveform transmission to make radar signals difficult to intercept. However, it is challenging to ensure signal correlation between different pulses. The traditional spatial adaptive beamforming methods in [23] required an accurate estimation of the interference-plus-noise covariance matrix. Ref. [24] used feature projection and beamforming to filter out the mainlobe interferences, while [25] suppresses mainlobe interference using a feature projection matrix and covariance reconstruction algorithm. However, both methods were sensitive to errors. By estimating and decomposing the polarization information of the signal, the interference could be suppressed in [26]. Hence, existing anti-interference methods are mostly based on traditional phased array radar systems and have certain limitations in their anti-interference effectiveness.
In recent decades, frequency diversity array (FDA), built upon a phased array, has introduced a rather small frequency increment between array elements, which has great application potential. It incorporated range–domain information of targets into the transmitted steering vector, enabling the system to have range dimensional degrees-of-freedom (DOFs) [27,28,29,30,31,32,33]. By combining multiple-input-multiple-output (MIMO) technology, adaptive and non-adaptive beamforming methods could effectively suppress mainlobe deceptive interference with the spatial frequency differences from the targets [34,35,36,37,38]. Moreover, the suppression method encoding both the array elements and the pulses with Element-Pulse Coding (EPC) could effectively counter mainlobe deceptive interference with range ambiguity [39,40,41]. In [42], deceptive interference was suppressed in the range–angle–Doppler domain of FDA-MIMO by designing a target-free pre-whitening filter, which was constructed by feature-based interference sample selection. Ref. [43] proposed a worst-case performance optimization method, which utilized Eigenspace to reconstruct the covariance matrix to design robust adaptive beamforming in the FDA-MIMO system. Hence, these interference suppression methods were equivalent to operating in the spatial frequency domain [44,45]. However, such methods required the interference and the targets to come from different pulses [46,47]. The aforementioned methods could effectively suppress mainlobe interference in the different pulses with the true target, but it was limited to countering the interference in the identical pulse with the true one.
The discussion about the mainlobe deceptive interference suppression, especially the fast-generated false targets, motivates the study to suppress interference based on secondary compensation in quadratic phase code (QPC)–FDA-MIMO radar. The QPC technique is employed by encoding the transmitted pulses in various spatial channels. To distinguish and suppress the false targets behind the true target by at least one pulse, Doppler compensation and filters are performed and employed, respectively, in the Doppler domain. To distinguish the fast-generated false targets, which are located in the same pulse with the true target, the spatial frequency compensation is implemented to the principle range. In the meanwhile, the spatial compensation relocated the mainlobe interference to the sidelobes. After the singular spectrum analysis (SSA) technique is used to select the samples, the interferences are suppressed by the data-dependent beamforming with minimum variance distortionless response (MVDR). The effectiveness of the proposed jammer suppression method is verified by simulation results.
The developed suppression method has the following summarized innovations:
  • Compared with the traditional FDA-MIMO radar, DOFs are extended to the joint Doppler transmit–receive domain, resulting in suppressing the multiple false targets in the identical pulse with the true one.
  • Based on the QPC technique, the mainlobe deceptive interference and sidelobe barrage jammer are suppressed in FDA-MIMO radar.
This paper is structured as follows. Section 2 presents the signal model of the QPC–FDA-MIMO radar. Section 3 investigates the principle of mainlobe deceptive jammer suppression in QPC–FDA-MIMO radar. In Section 4, numerical results are provided to verify the effectiveness of the proposed methods. Section 5 and Section 6 present the discussion and the conclusion.

2. FDA-MIMO Radar Signal Model

2.1. Transmit Signal Model

As shown in Figure 1, consider a collocated FDA-MIMO radar system with a uniform linear array, consisting of N transmit elements and M receive elements, with d = λ / 2 being the interval between each element [33,44]. We assume the first array as the reference, which has the reference carrier frequency f 0 . With the small frequency increment Δ f f 0 , the carrier frequencies of the m-th ( m = 1 , 2 , , M ) element can be represented as [33]
f m = f 0 + ( m 1 ) Δ f
The transmit signal in the m -th ( m = 1 , 2 , , M ) transmit antenna from k -th pulse is
s m , k ( t ) = E M rect ( t T p ) e j 2 π f m t Φ m ( t ) e j φ k
where e j φ k represents the QPC factor of k-th pulse, rect ( t T p ) = { 1 , | t | T P / 2 0 , e l s e is impulse function, and Φ m ( t ) represents the signal waveform. For simplicity, let us assume that all transmit elements are ideal orthogonal waveforms at any time. Hence, the orthogonality condition must be satisfied, i.e., Φ m ( t ) Φ m * ( t τ ) d t = 0 , m m , m = 1 , 2 , , M , with τ being the time delay, which can be written as
Φ m ( t ) = 1 τ b l = 1 L g m ( l ) r e c t ( t ( l 1 ) τ b τ b ) , l = 1 , , L
where L and τ b = T p L are the number and length of the subpulse, respectively, and g m ( l ) = e j z m ( l ) , z m ( l ) [ 0 , 2 π ] .
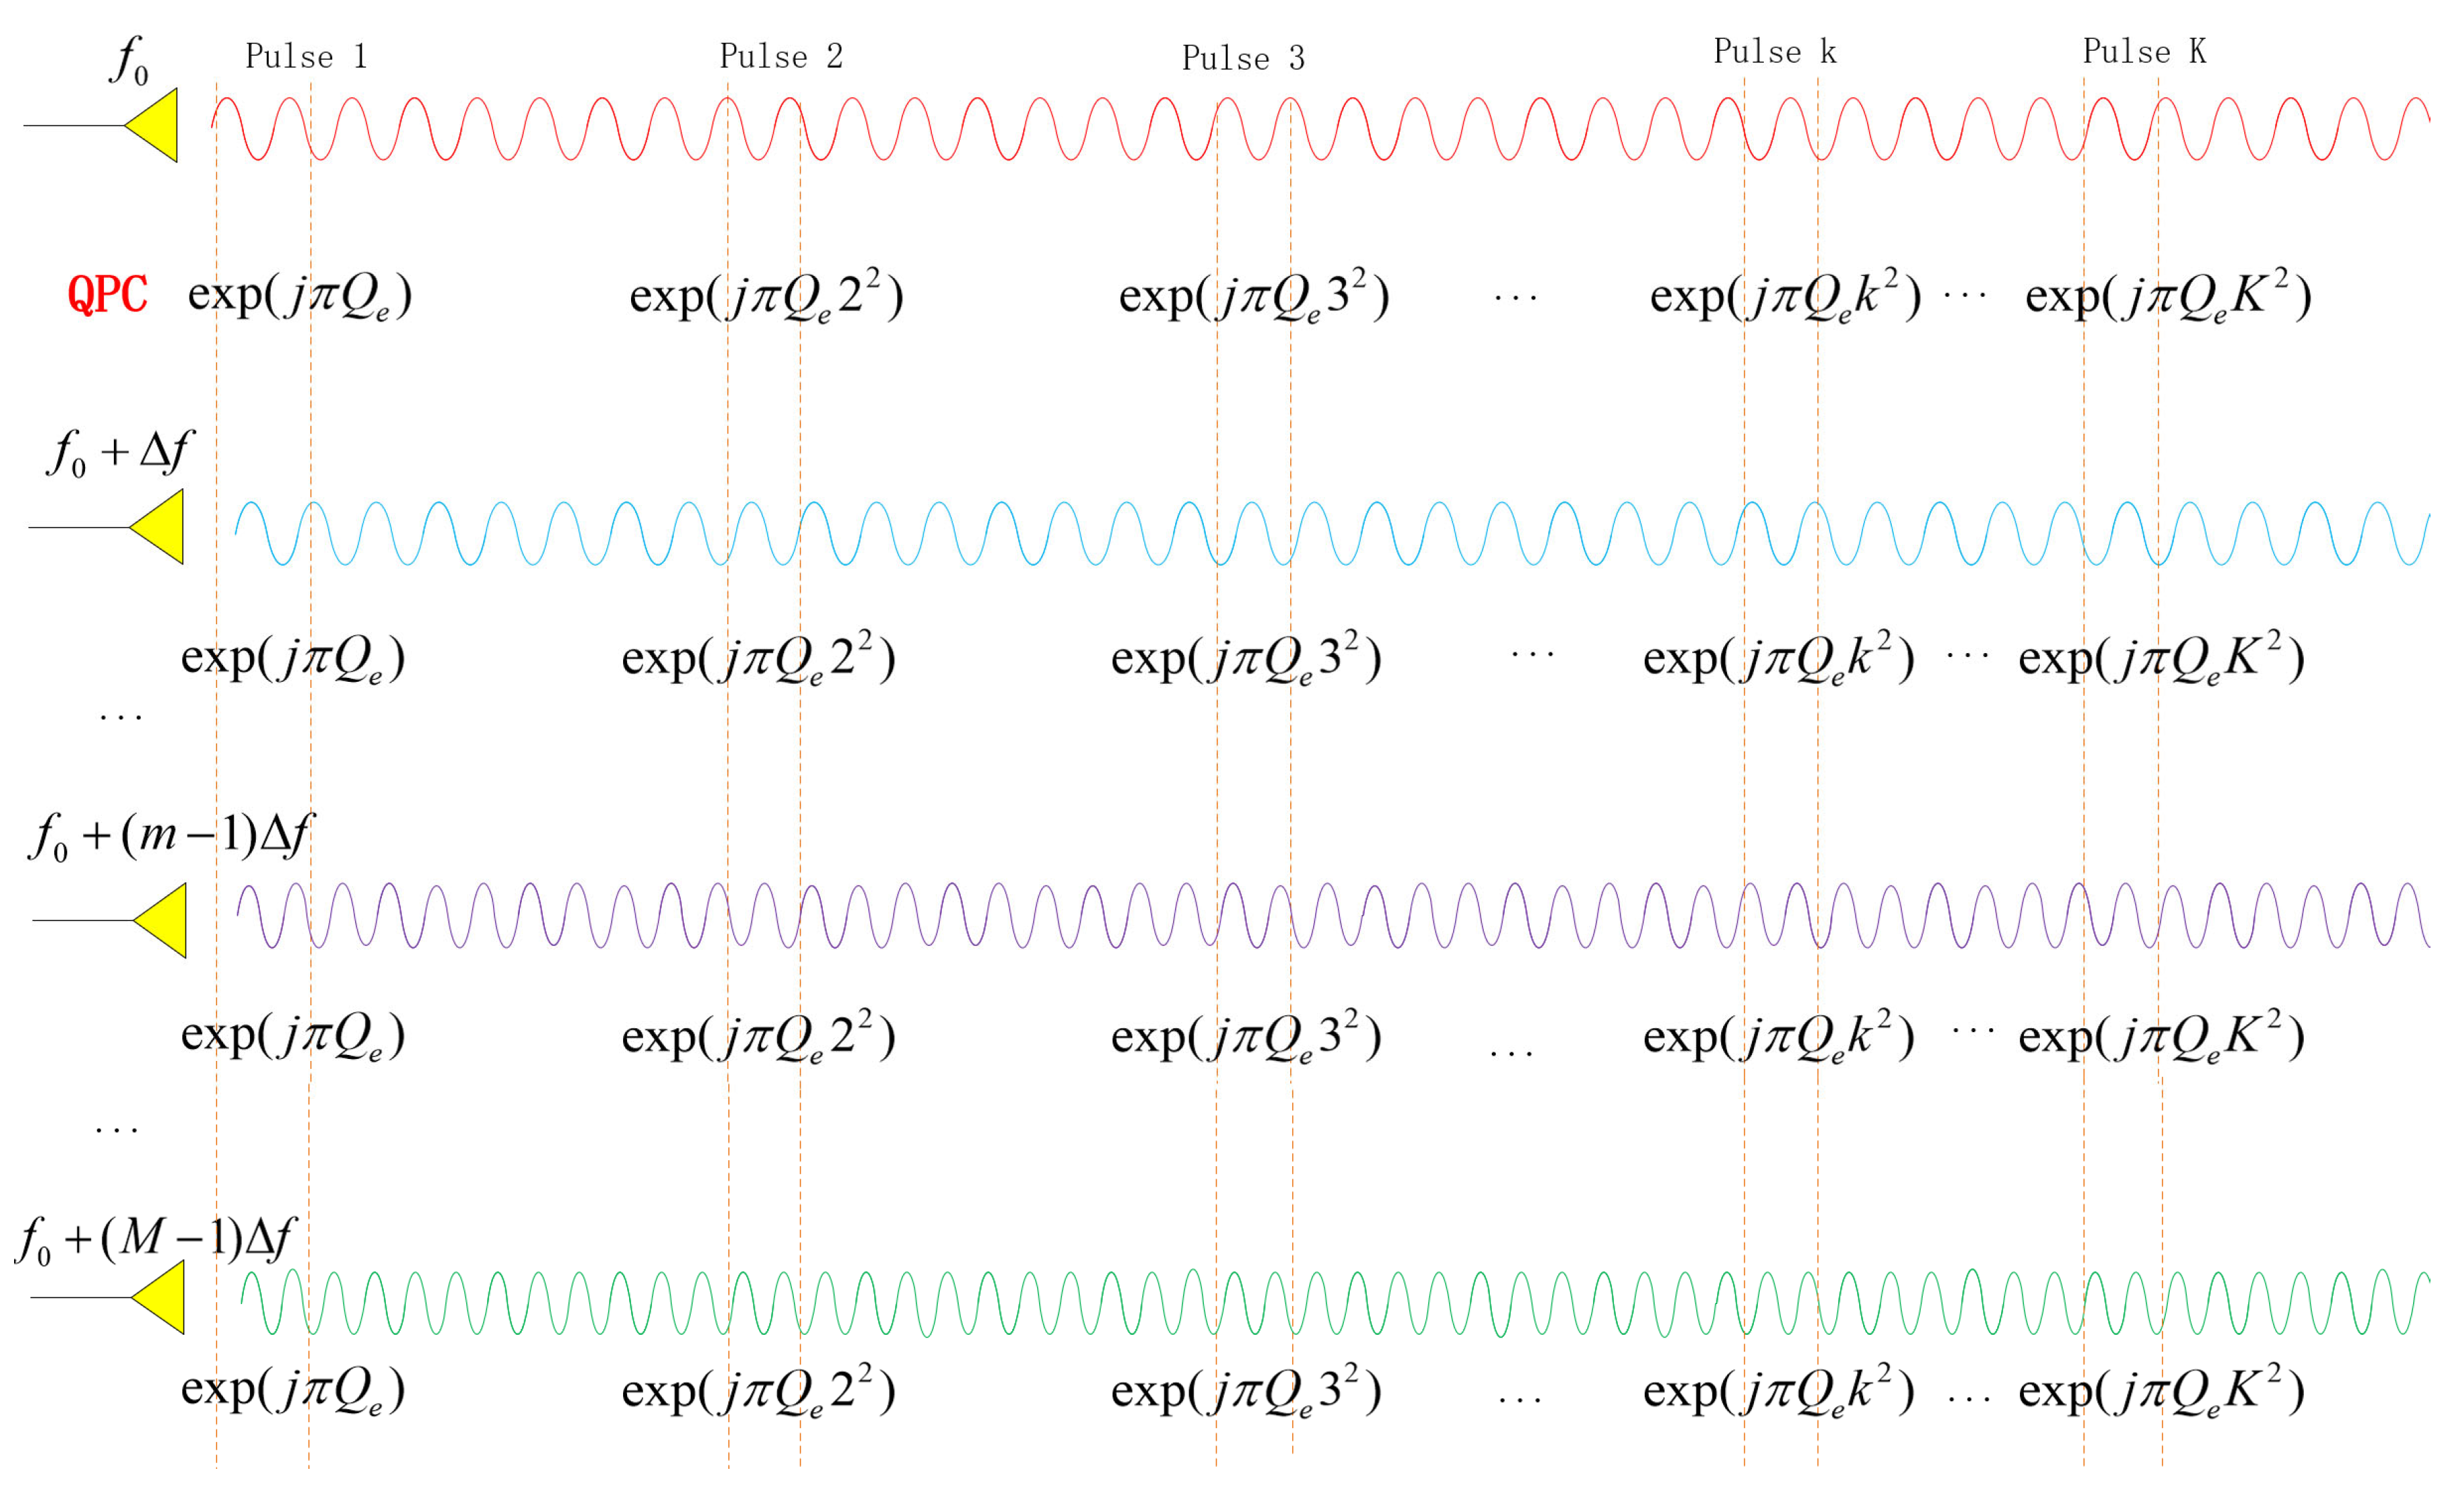
As shown in Figure 2, with the initial phase, the QPC–FDA-MIMO system exhibits distinct characteristics in comparison to conventional FDA-MIMO systems. The QPC φ k is a special space–time code with a quadratic term. The QPC factor of k -th temporal pulse is expressed as
φ k = Q e π ( k 1 ) 2
where Q e denotes the Doppler frequency shift factors. Hence, the QPC vector is
c = [ e j φ 1 , e j φ 2 , , e j φ K ]

2.2. Receive Signal Model

Located in the far-field, the true target is assumed to be point-like with the delayed pulse number q s and angle–range pair ( θ , R s ) . The signal reflected from the target has delayed q s pulses before they are received. That is, the signal, which arrived at the k -th pulse, comes from the k q s -th pulse and has the identical QPC with the k q s -th pulse. Hence, the QPC of the target in k ( k = 1 , , K ) pulse is defined as
φ k s = Q e π ( k q s 1 ) 2
Based on the assumption of the narrow band, the echo corresponding to the n-th ( n = 1 , , N ) received element is
x n , k ( t τ m , n ) ξ rect ( t τ 0 T p ) m = 1 M e j 2 π f 0 ( t τ m , n + ( k 1 ) T r ) e j 2 π Δ f ( m 1 ) ( t τ m , n + ( k 1 ) T r ) e j 2 π f d ( k 1 ) T r Φ m , k ( t τ 0 ) e j φ k s
where ξ is the complex echo amplitude, which accounts for target reflectivity, phase, channel propagation and transmit amplitude effects. τ m , n = τ 0 τ R τ T represents the transmit time, and τ 0 = 2 R s c is the reference time delay, where R s = R u q s + r s is the actual range of the true target with the principle range r s and the maximum unambiguous range R u = c 2 f PRF . τ R = ( n 1 ) d sin ( θ ) c and τ T = ( m 1 ) d sin ( θ ) c represent the wave path differences in receive arrays and in transmit arrays. f d = 2 v s λ 0 represent the Doppler frequencies of the targets with λ 0 and v s being the wavelength and target speed.
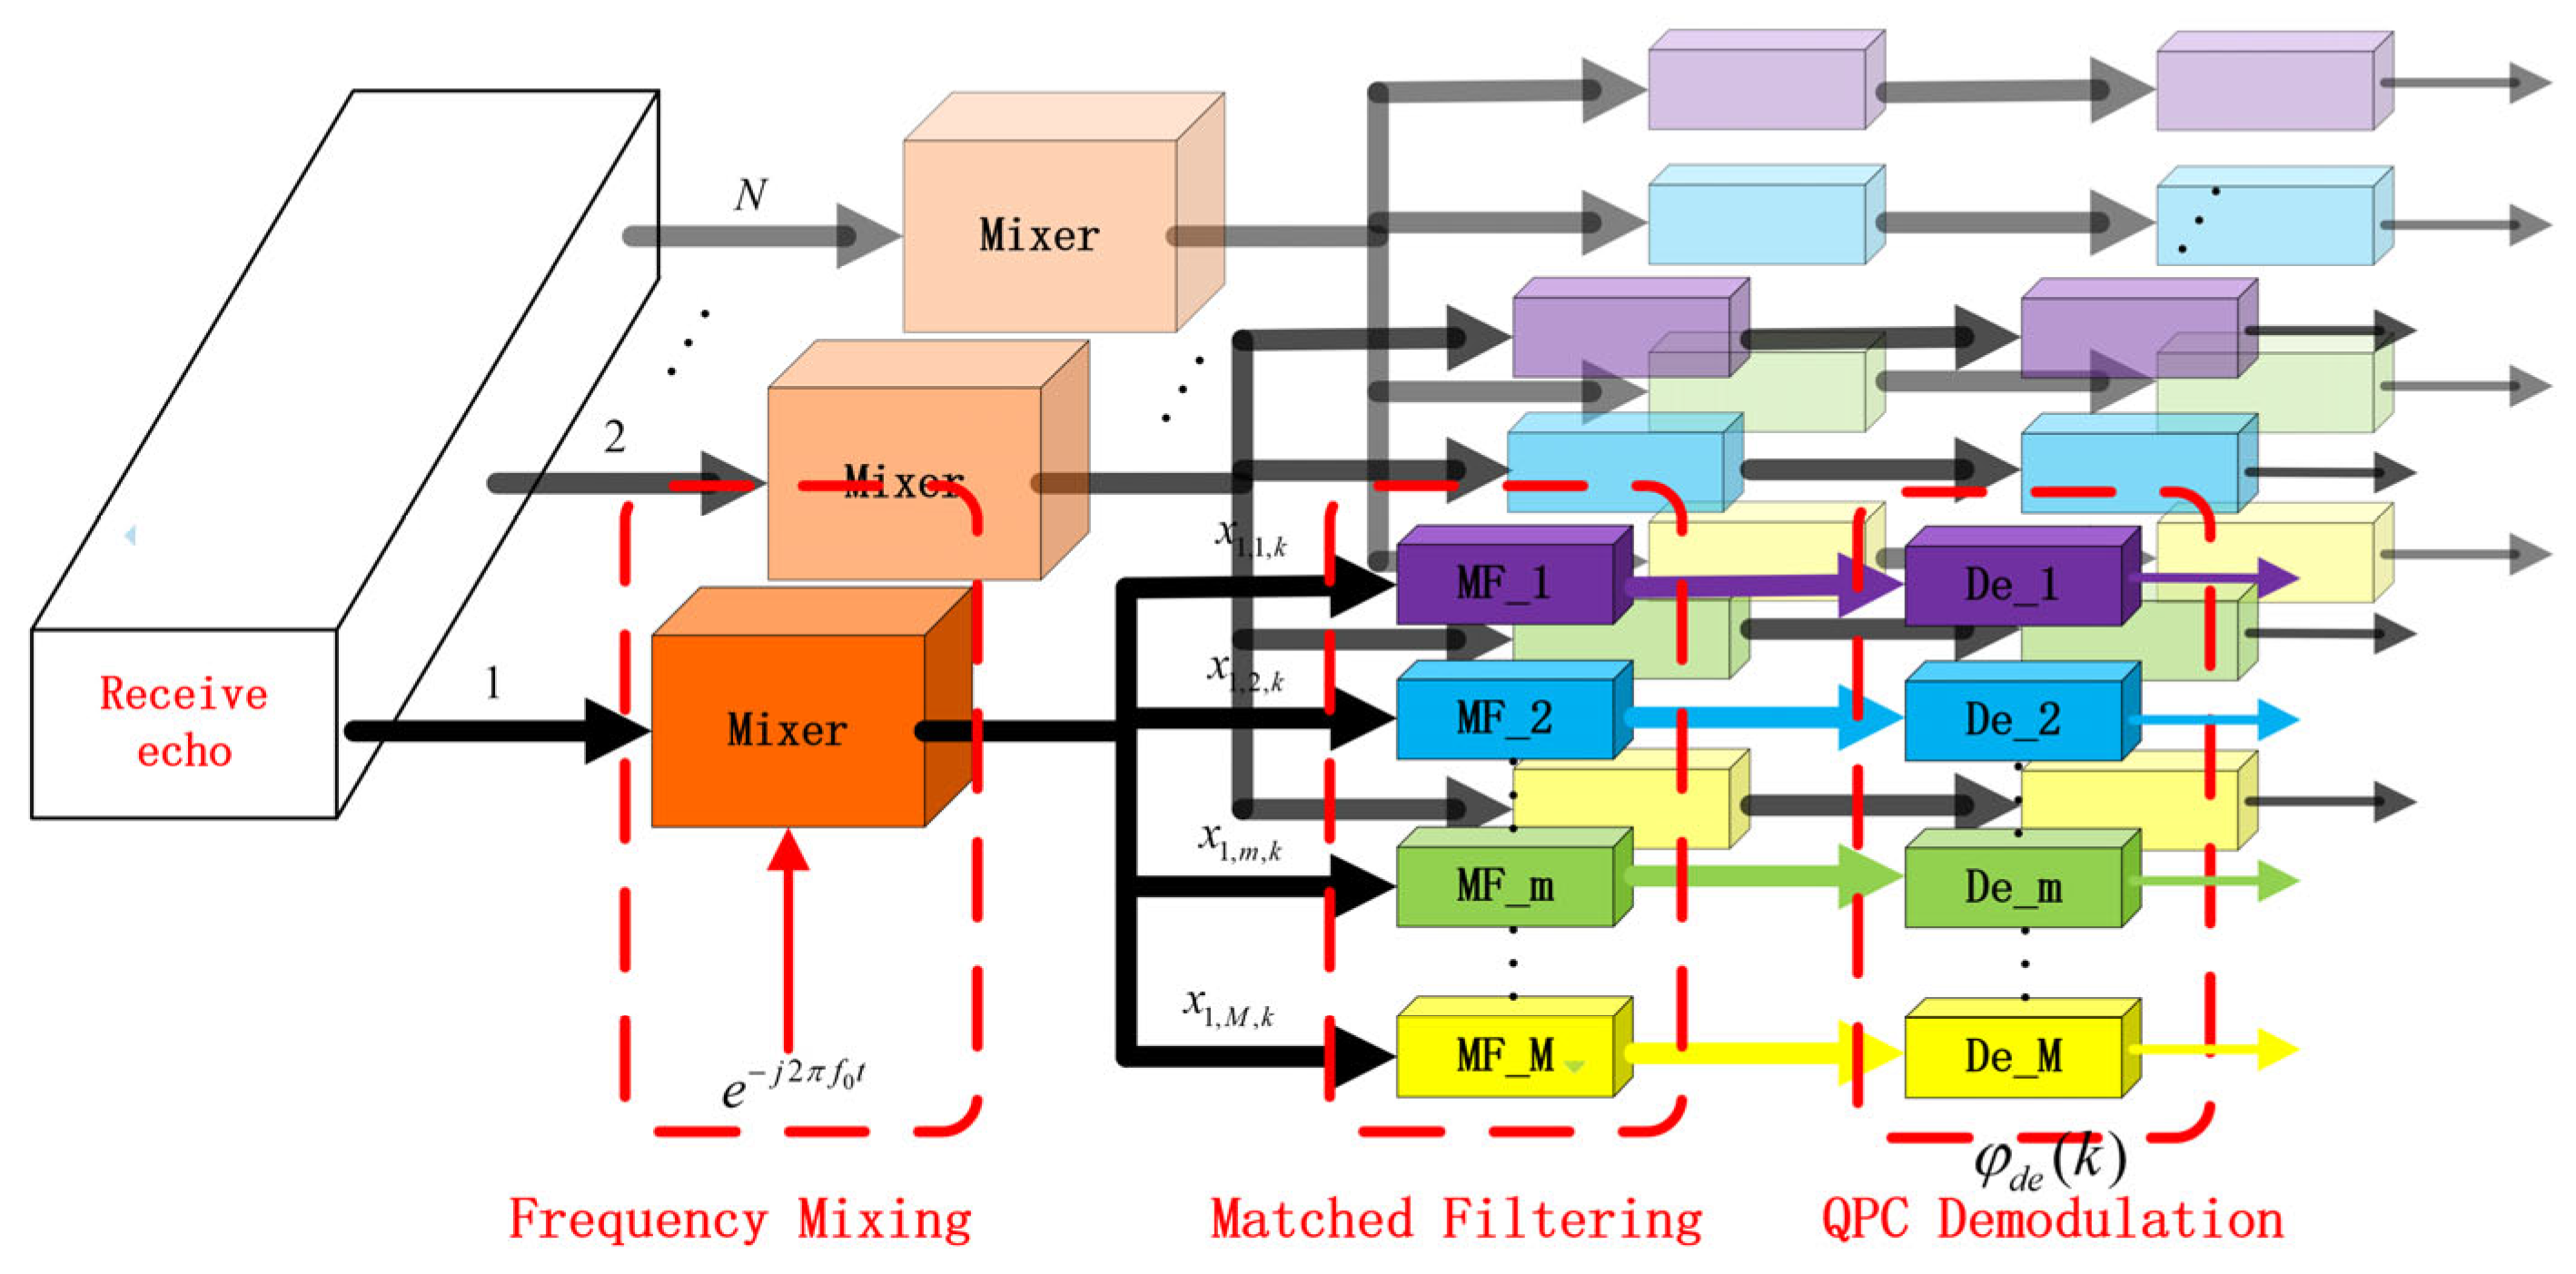
In the receive array, after being down-converted in the mixer, the received signals are matched filtered by groups of M filters. As shown in Figure 3, the signals are multiplied with e j 2 π Δ f ( l 1 ) t to digitally mix the frequency increment. Then, the l -th ( l = 1 , 2 , M ) matched filter, which is denoted as h l ( t ) = x l ( t ) , is utilized to separate transmitted waveforms. The output received by the n-th element can be written as
x n , k ( t ) ξ rect ( t τ 0 T p ) m = 1 M e j 2 π f 0 τ m , n e j 2 π Δ f ( m 1 ) τ m , n e j 2 π f d ( k 1 ) T r sin c ( t τ 0 ) φ k s
Hence, after sampling some interesting range bins, the received echo reflected from the target can be stacked to a M N × K dimensional vector form as [41]
x ( t ) = [ x 1 , 1 , 1 ( t , θ 0 ) , x 1 , 2 , 1 ( t , θ 0 ) , , x n , m , 1 ( t , θ 0 ) , , x N , M , 1 ( t , θ 0 ) ] T { [ 1 , e j 2 π f ds T r , , e j 2 π f ds ( K 1 ) T r ] c } = β 0 r [ b ( θ 0 ) a ( R s , θ 0 ) ] T [ h ( f ds ) c s ]
where r = 1 N r ¯ C M N × 1 denotes the output processed by matched filters with r ¯ = [ r ¯ 1 , r ¯ 2 , , r ¯ M ] T C M × 1 . and are the Kronecker product and the Hadamard product, respectively. h ( f ds ) and c s denote the Doppler vector and the QPC vector of the true target. a ( R s , θ 0 ) C M × 1 and b ( θ 0 ) C N × 1 represent the transmit and receive steering vectors, respectively, which can be arranged as
a ( R s , θ 0 ) = [ 1 , e j 2 π Δ f R s c , , e j 2 π Δ f R s c ( M 1 ) ] T [ 1 , e j 2 π d λ sin θ , , e j 2 π d λ sin θ ( M 1 ) ] T = a ( R s ) a ( θ 0 )
b ( θ 0 ) = [ 1 , e j 2 π d λ sin θ 0 , , e j 2 π d λ sin θ 0 ( N 1 ) ] T
h ( f ds ) = [ 1 , e j 2 π f ds T r , , e j 2 π f ds ( K 1 ) T r ] [ e j π ( Q e ( 1 q s 1 ) 2 ) , e j π ( Q e ( 2 q s 1 ) 2 ) , , e j π ( Q e ( K q s 1 ) 2 ) ] T
c s = [ e j φ 1 s , e j φ 2 s , , e j φ K s ]
where f ds represents the normalized Doppler of the true target.
Along the slow time, the transmitted pulse phase of the received echo is demodulated in different elements. Subsequently, we devise the demodulation factor in the k -th pulse as the form with
φ de ( k ) = exp { j π Q e ( k 1 ) 2 }
Hence, the demodulation vectors are
c de , k = φ de ( k ) 1 M
g k = c de , k 1 N
Demodulated via element by element and pulse by pulse, the output data in the k -th pulse is
y s , k ( t , θ 0 ) = d i a g { g k } x k ( t , θ 0 ) = β 0 e j 2 π f d s ( k 1 ) r ( c de , k 1 N ) [ a s ( R s , θ 0 ) b ( θ 0 ) ] = β 0 e j 2 π f d s ( k 1 ) r { ( b ( θ 0 ) 1 N ) [ c de , k a s ( R s , θ 0 ) ] } = β 0 e j 2 π f d s ( k 1 ) r { ( b ( θ 0 ) a ˜ s ( Q e , R s , θ 0 ) } = e j π q s 2 Q e β 0 e j 2 π ( f d s q s Q e ) ( k 1 ) r { b ( θ 0 ) ) a ( R s , θ 0 ) } = α 0 e j 2 π ( f d s Δ f ds ) ( k 1 ) r { b ( θ 0 ) ) a ( R s , θ 0 ) }
where:
  • a s ( R s , θ 0 ) = a ( R s , θ 0 ) [ φ k s 1 M ] is the transmit steering vector after modulation.
  • a ˜ s ( Q e , R s , θ 0 ) = c de , k a s ( R s , θ 0 ) = e j 2 π q s Q e ( k 1 ) + j π q s 2 Q e [ 1 , e j 2 π Δ f R s c , , e j 2 π Δ f R s c ( M 1 ) ] T [ 1 , e j 2 π d λ sin θ , , e j 2 π d λ sin θ ( M 1 ) ] T C M represents the transmit steering vector after demodulation.
  • α 0 = e j π q s 2 Q e β 0 represents the complex echo coefficient.
  • Δ f ds = q s Q e represents the normalized Doppler shift frequency.

3. Principle of Interference Suppression in QPC–FDA-MIMO

3.1. Generation of Barrage Jammer and Mainlobe Deceptive False Targets

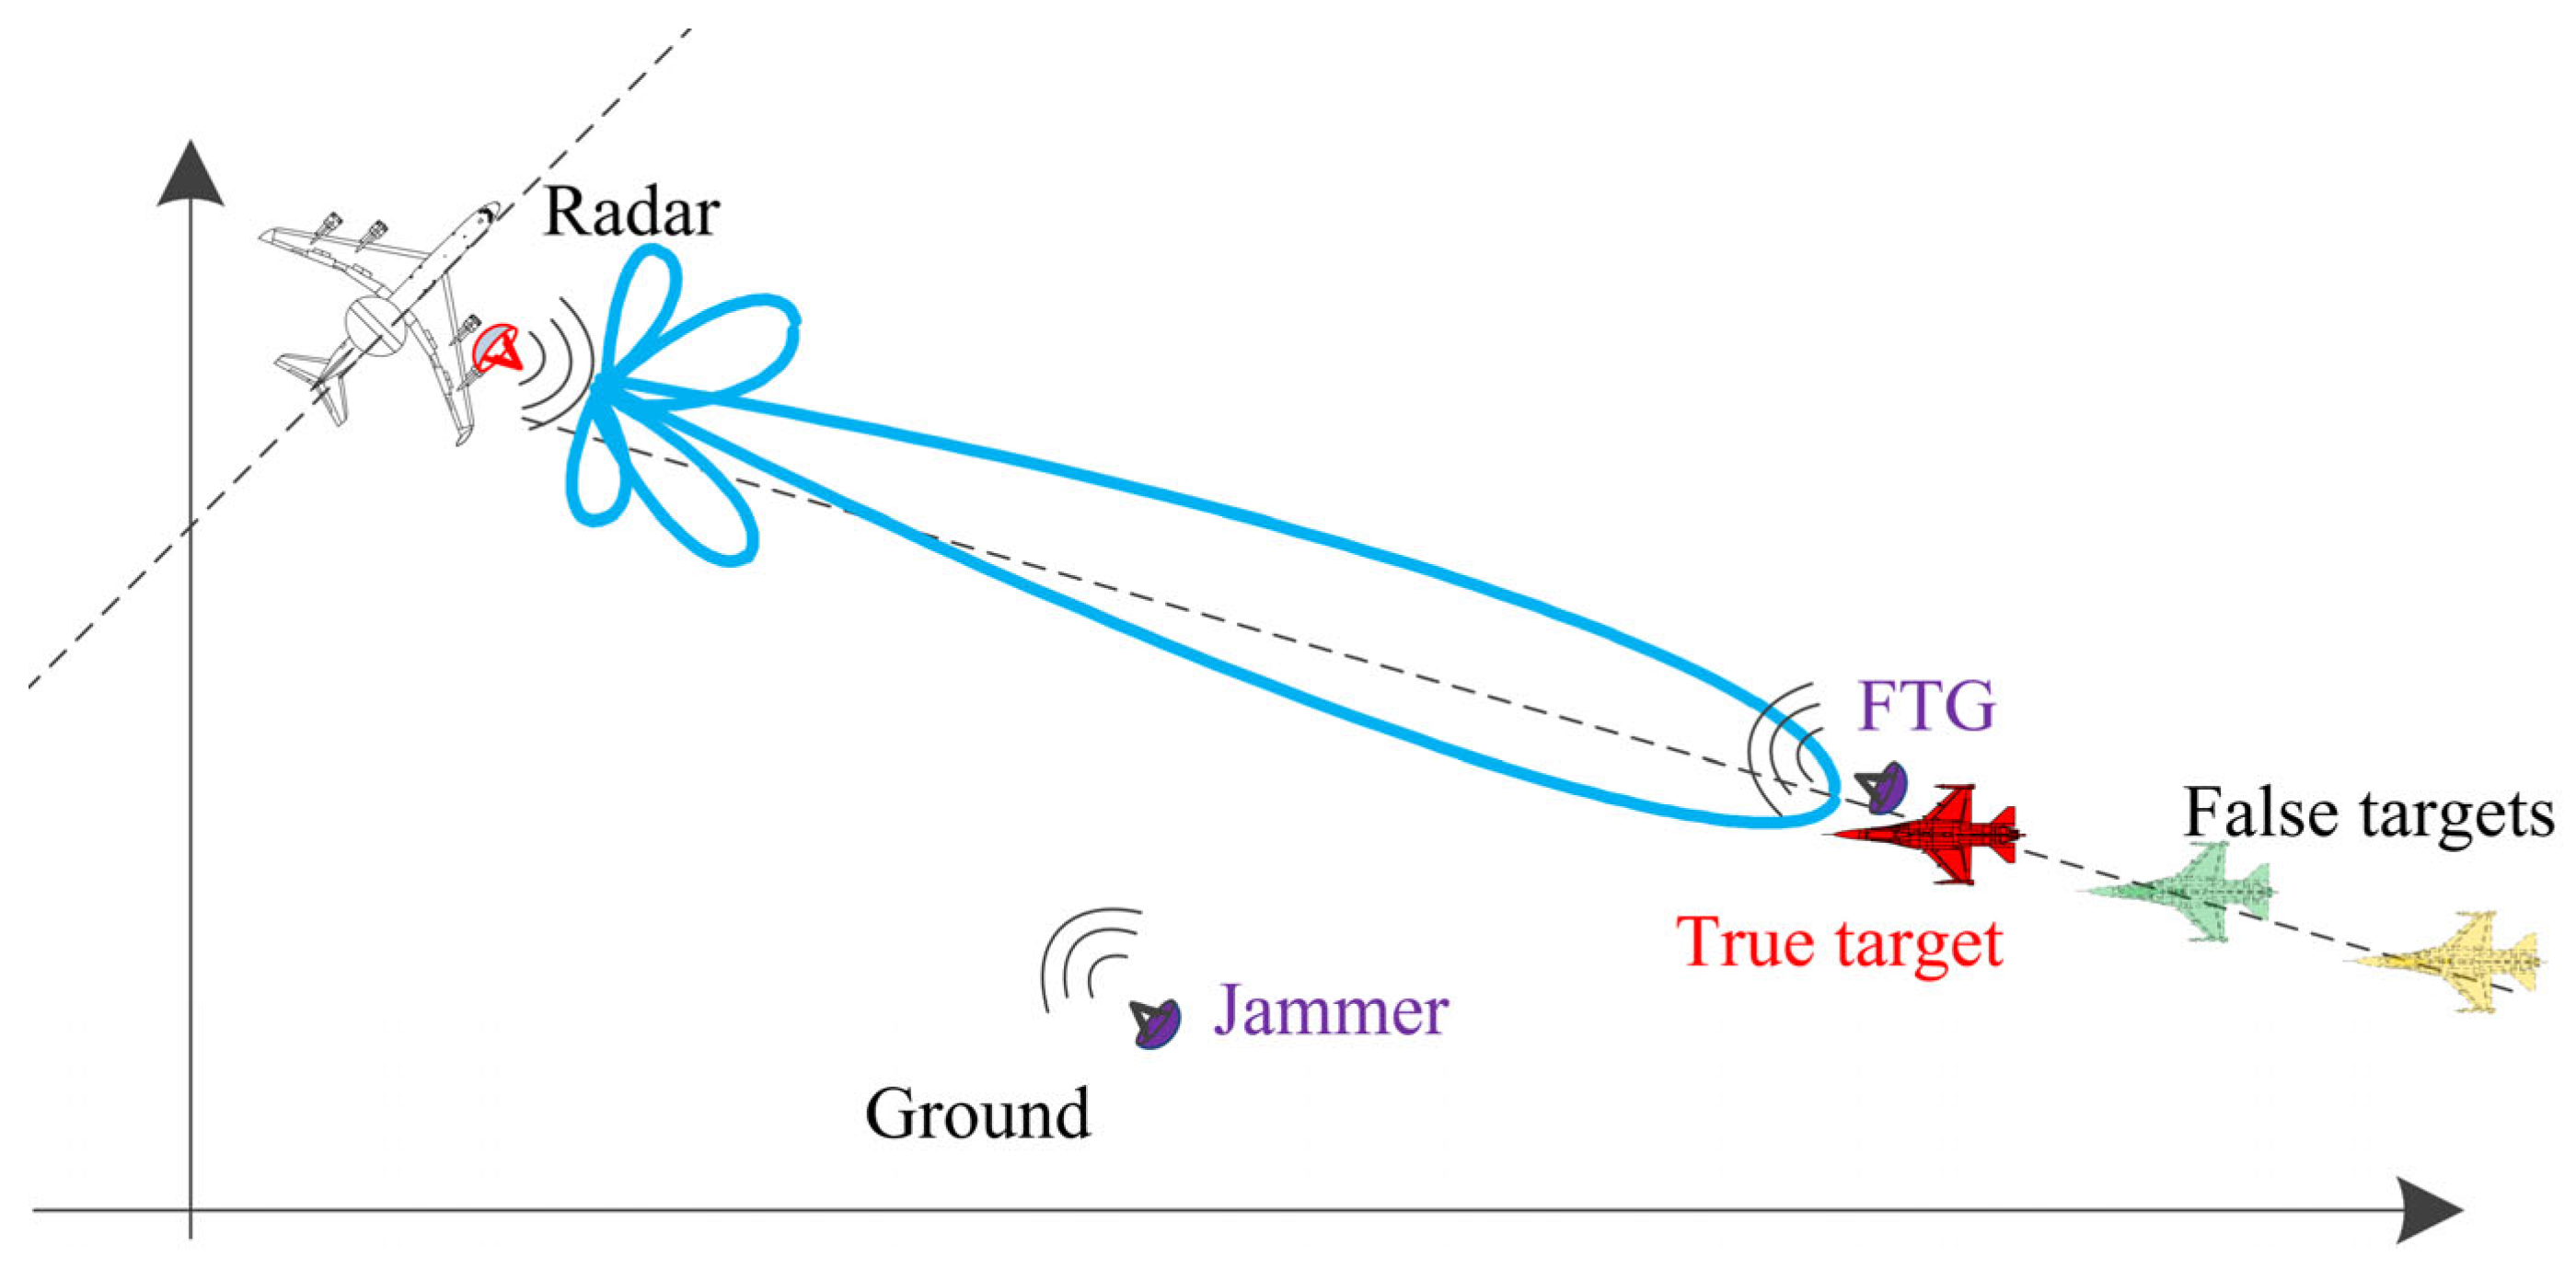
The self-protection mainlobe deceptive interference and sidelobe barrage interference are considered to perform during the tracking phase in this method. The self-protection interference is equipped with a false target generator (FTG) at angle θ s and range R s . As shown in Figure 4, FTG modulates and delays the intercepted target echo signal before retransmitting it to generate multiple pseudo-randomly distributed false targets. To ensure an effective interference, the false targets, at the same angle with the true target, are generated behind the true target via the appropriate delayed time by FTG.
As shown in Figure 5, based on the difference in time delay, the relative range between the false targets and the true target can be either zero, negative or positive. The actual range difference of the false target and the true target is in the form of Δ R = R s R i and R i = R u q i + r i , where r i and q i denote the principle value range and delayed pulse number of the false target.
Below are the conditions of the false-target generation:
(1)
Condition 1: The false target 1 is generated behind the true target with the identical transmit pulse and receive pulse, which locate in range ambiguity 1, i.e., Δ R = r s r i .
(2)
Condition 2: The false target 2 is generated ahead of the true target, where both are located in the same receive pulse and come from different transmit pulses, i.e., the false 2 target corresponds to the previous transmit pulse, i.e., Δ R = p R u + r s r i , where p = | q s q i | is the delayed pulse number difference.
(3)
Condition 3: The false target 3 and the true target are generated in the same range bin, where both are located in the same receive pulse and come from different transmit pulses, i.e., Δ R = p R u
When the time delay is significant, the false targets are formed in the next pulse transmission. In this case, identification can be achieved by comparing the differences in the pulse sequence numbers between the true and false targets. If the delay is minimal, identification can be based on the range differences between the true and false targets within the pulse.
We assume an FTG generating Q mainlobe interferences. Hence, the q -th ( q = 1 , 2 , , Q ) interference signal is denoted as
y q ( θ 0 , R q ) = β q r [ b ( θ 0 ) a q ( θ 0 , R q ) ] h T ( f d , q )
Processed through matched filters and QPC demodulation, the interference signal is written as:
y q , k ( t , θ 0 ) = α q e j 2 π ( f d , q Δ f d , q ) ( k 1 ) r { b ( θ 0 ) ) a ( R q , θ 0 ) }
where:
  • α q = e j π q i 2 Q e β q represents the complex echo coefficient of the q -th false target.
  • Δ f d , q = q i Q e represents the normalized Doppler shift frequency of the q -th false target and f d , q represents the normalized Doppler frequency of the q -th false target.
  • a ( R q , θ 0 ) C M × 1 represents the transmit steering vector, which is in the form of
    a ( R q , θ 0 ) = [ 1 , e j 2 π Δ f R q c , , e j 2 π Δ f R q c ( M 1 ) ] T [ 1 , e j 2 π d λ sin θ , , e j 2 π d λ sin θ ( M 1 ) ] T
By stacking into M N × K -dimensional vectors, the interference signals represent
Y I = α q { r [ b ( θ ) a ( R q , θ ) ] } h T ( f d , q Δ f d , q )
where h ( f d , q Δ f d , q ) C K × 1 represents the Doppler vector of the q -th false target with R q being the actual range, which can be expressed as
h ( f d , q Δ f d , q ) = [ 1 , e j 2 π ( f d , q Δ f d , q ) , , e j 2 π ( f d , q Δ f d , q ) ( K 1 ) ] T
There are Q barrage jammers, which include the Q angle, which are independent of each other and represented in the form of
Y J = q = 1 Q β q b ( θ q ) n T
where q = 1 , 2 , , Q ; the complex Gaussian random variable β q is zero-mean. b ( θ q ) C N × 1 represents the receive steering vector, and n T C M × 1 is the transmit steering vector, with N ~ C N ( 0 , σ 2 I M N ) , i.e., the white Gaussian noise distribution, and 0 C M × 1 .
Furthermore, the received signal, including the barrage interference, the false targets, the true target and the noise component, can be written as
Y = Y s + q = 1 Q Y J + q = 1 Q Y I + N
where N is the white Gaussian noise, i.e., N ~ C N ( 0 , σ 2 I M N ) with the identity matrix I M N C M N × M N , the noise power σ 2 , and the covariance matrix R n = σ 2 I M N .

3.2. Suppression Based on Doppler Frequency Compensation

3.2.1. Distinguishing the Targets in Doppler Domain

We construct the Doppler compensation vector as
y 1 = α 0 [ 1 , e j 2 π ( q s Q e f d s ) , , e j 2 π ( q s Q e f d s ) ( K 1 ) ]
Furthermore, let us construct the Doppler compensation vector as
g d = α 0 1 N 1 M [ 1 , e j 2 π ( q s Q e f d s ) , , e j 2 π ( q s Q e f d s ) ( K 1 ) ]
The receive signal is processed by the Doppler compensation vector in the form of
Y ˜ = Y g d
Then, the Doppler vectors of the false and true targets are, respectively, in the form of
h ^ s ( Q e ) = 1 1 × K C 1 × K
h ^ q ( Q e ) = [ 1 , e j 2 π p Q e , , e j 2 π p Q e ( K 1 ) ] C 1 × K
We then construct the Doppler difference of the targets as
Δ f dis = p Q e = p ( g + b )
Due to the 2 π periodicity, the differences Δ f dis in the Doppler domain depend only on the fractional part b rather than the integer part g . If b 0 and Δ f dis = p Q e Z + exist, the true and false targets can be distinguished in the Doppler spectrum. As shown in Figure 6, after the Doppler compensation, the true and false targets distribute according to the pulse numbers of the targets in the Doppler domain. The true target is located in the point of intersection and the center of the figure. Hence, the true and the false targets in Range ambiguity II can be distinguished in the Doppler domain after the Doppler compensation.

3.2.2. Suppression in Doppler Domain

The equidistant Doppler filter group is used to suppress the false target (such as False target 2 and False target 3 in Figure 5). Equidistant Doppler filters perform very well within a certain interval. The weight vector of the filter is
w k = R ˜ c 1 g ( f k )
where f k   ( k = 1 , 2 , , K ) denotes the average frequency of the passband in the k -th filter. R ˜ c is the compensated interference and noise covariance matrix. The inverse matrix R ˜ c 1 makes the filter adaptively generate nulls at the location of the interference, in order to achieve interference suppression. g ( f k ) represents the average steering vector and can be expressed as
g ( f k ) = [ 1 , exp ( j 2 π f k T r ) , exp ( j 2 π f k 2 T r ) , , exp ( j 2 π f k ( N 1 ) T r ) ]
Further, the detailed explanation of Equation (31) can be formed as
w ¯ i ( k ) = n = 1 N 𝜕 i , n exp ( j 2 π i 1 N k ) sin ( n 1 N ) n 1 N i n
where w ¯ i ( k ) represents the i -th element of the weight vector w k ; 𝜕 i , n represents the i -th row and n -th column element of R ˜ c 1 . After passing through the Doppler filter, the interference and targets of the same Doppler bin are filtered out.

3.3. Suppression Based on Principle Range Frequency Compensation

After the Doppler frequency compensation and suppression in the Doppler domain, the false targets located in the different pulses from the true one can be suppressed. As shown in Figure 5, False target 2 and False target 3 can be suppressed via suppression based on Doppler frequency compensation. However, False target 1 still exists, i.e., it is still unable to differentiate the targets which have the identical number of delayed pulse. To address this, based on the characteristic that the false targets (like False target 1) have the principle ranges greater than the true target, the targets are compensated pulse by pulse and range bin by range bin in transmit spatial frequency. This process aligns the range frequency of the false targets to the first range bin in the next pulse, achieving the range frequency backward shifting.

3.3.1. Distinguishing the Targets in Spatial Domain

Based on the transmit and receive steering vectors in (10) and (11), the transmit and receive spatial frequencies can be represented as follows:
f T , s = 2 Δ f R s c + d T λ 0 sin ( θ )
f T , i = 2 Δ f R i c + d T λ 0 sin ( θ )
The compensation vector is constructed as [39]
y 2 = [ 1 , e j 2 π f c 2 , , e j 2 π f c 2 ( M 1 ) ] T
where the range compensation frequency f c 2 = 2 r a Δ f c depends on principle range r a , which is obtained by the number of the range bin and size.
Then, we construct the receive–transmit joint as
Y ˜ = 1 N × K y 2
Furthermore, the received data can be denoted as
Y = A Y ˜
Accordingly, the transmit spatial frequencies of the targets are reconstructed via spatial frequency compensating range bin by range bin [41], which can be represented as
f ˜ T , s = d T λ 0 sin ( θ )
f ˜ T , i = 2 Δ f R u ( p + d ) c + d T λ 0 sin ( θ )
where d is the spatial frequency shift number, which is performed in the range bins behind the true target. After the spatial frequency compensation, the spatial frequency difference of the targets is
Δ f dif = f ˜ T , s f ˜ T , i = 2 Δ f R u ( p + d ) c = Δ f ( p + d ) f r = ( p + d ) ( b + u ) = ( p + d ) ( b + v M ) , v = 1 , , M 1
where the delayed pulse numbers difference p is zero for the condition 1 in Figure 5. The spatial frequency difference is decided on Δ f and d in Equation (40). f r represents pulse repetition frequency (PRF). After the spatial frequency compensation, the true targets and the false targets lag in identical pulse can be distinguished.
Due to the 2 π periodicity of the exponential term, the difference Δ f dif in the spatial frequency domain depends only on the fractional part u = v M rather than the integer part b = int ( Δ f f r ) . If u 0 exists, the true and false targets can be distinguished in the spatial frequency spectrum. At this point, the mainlobe interference suppression problem is transformed into a sidelobe interference suppression problem.
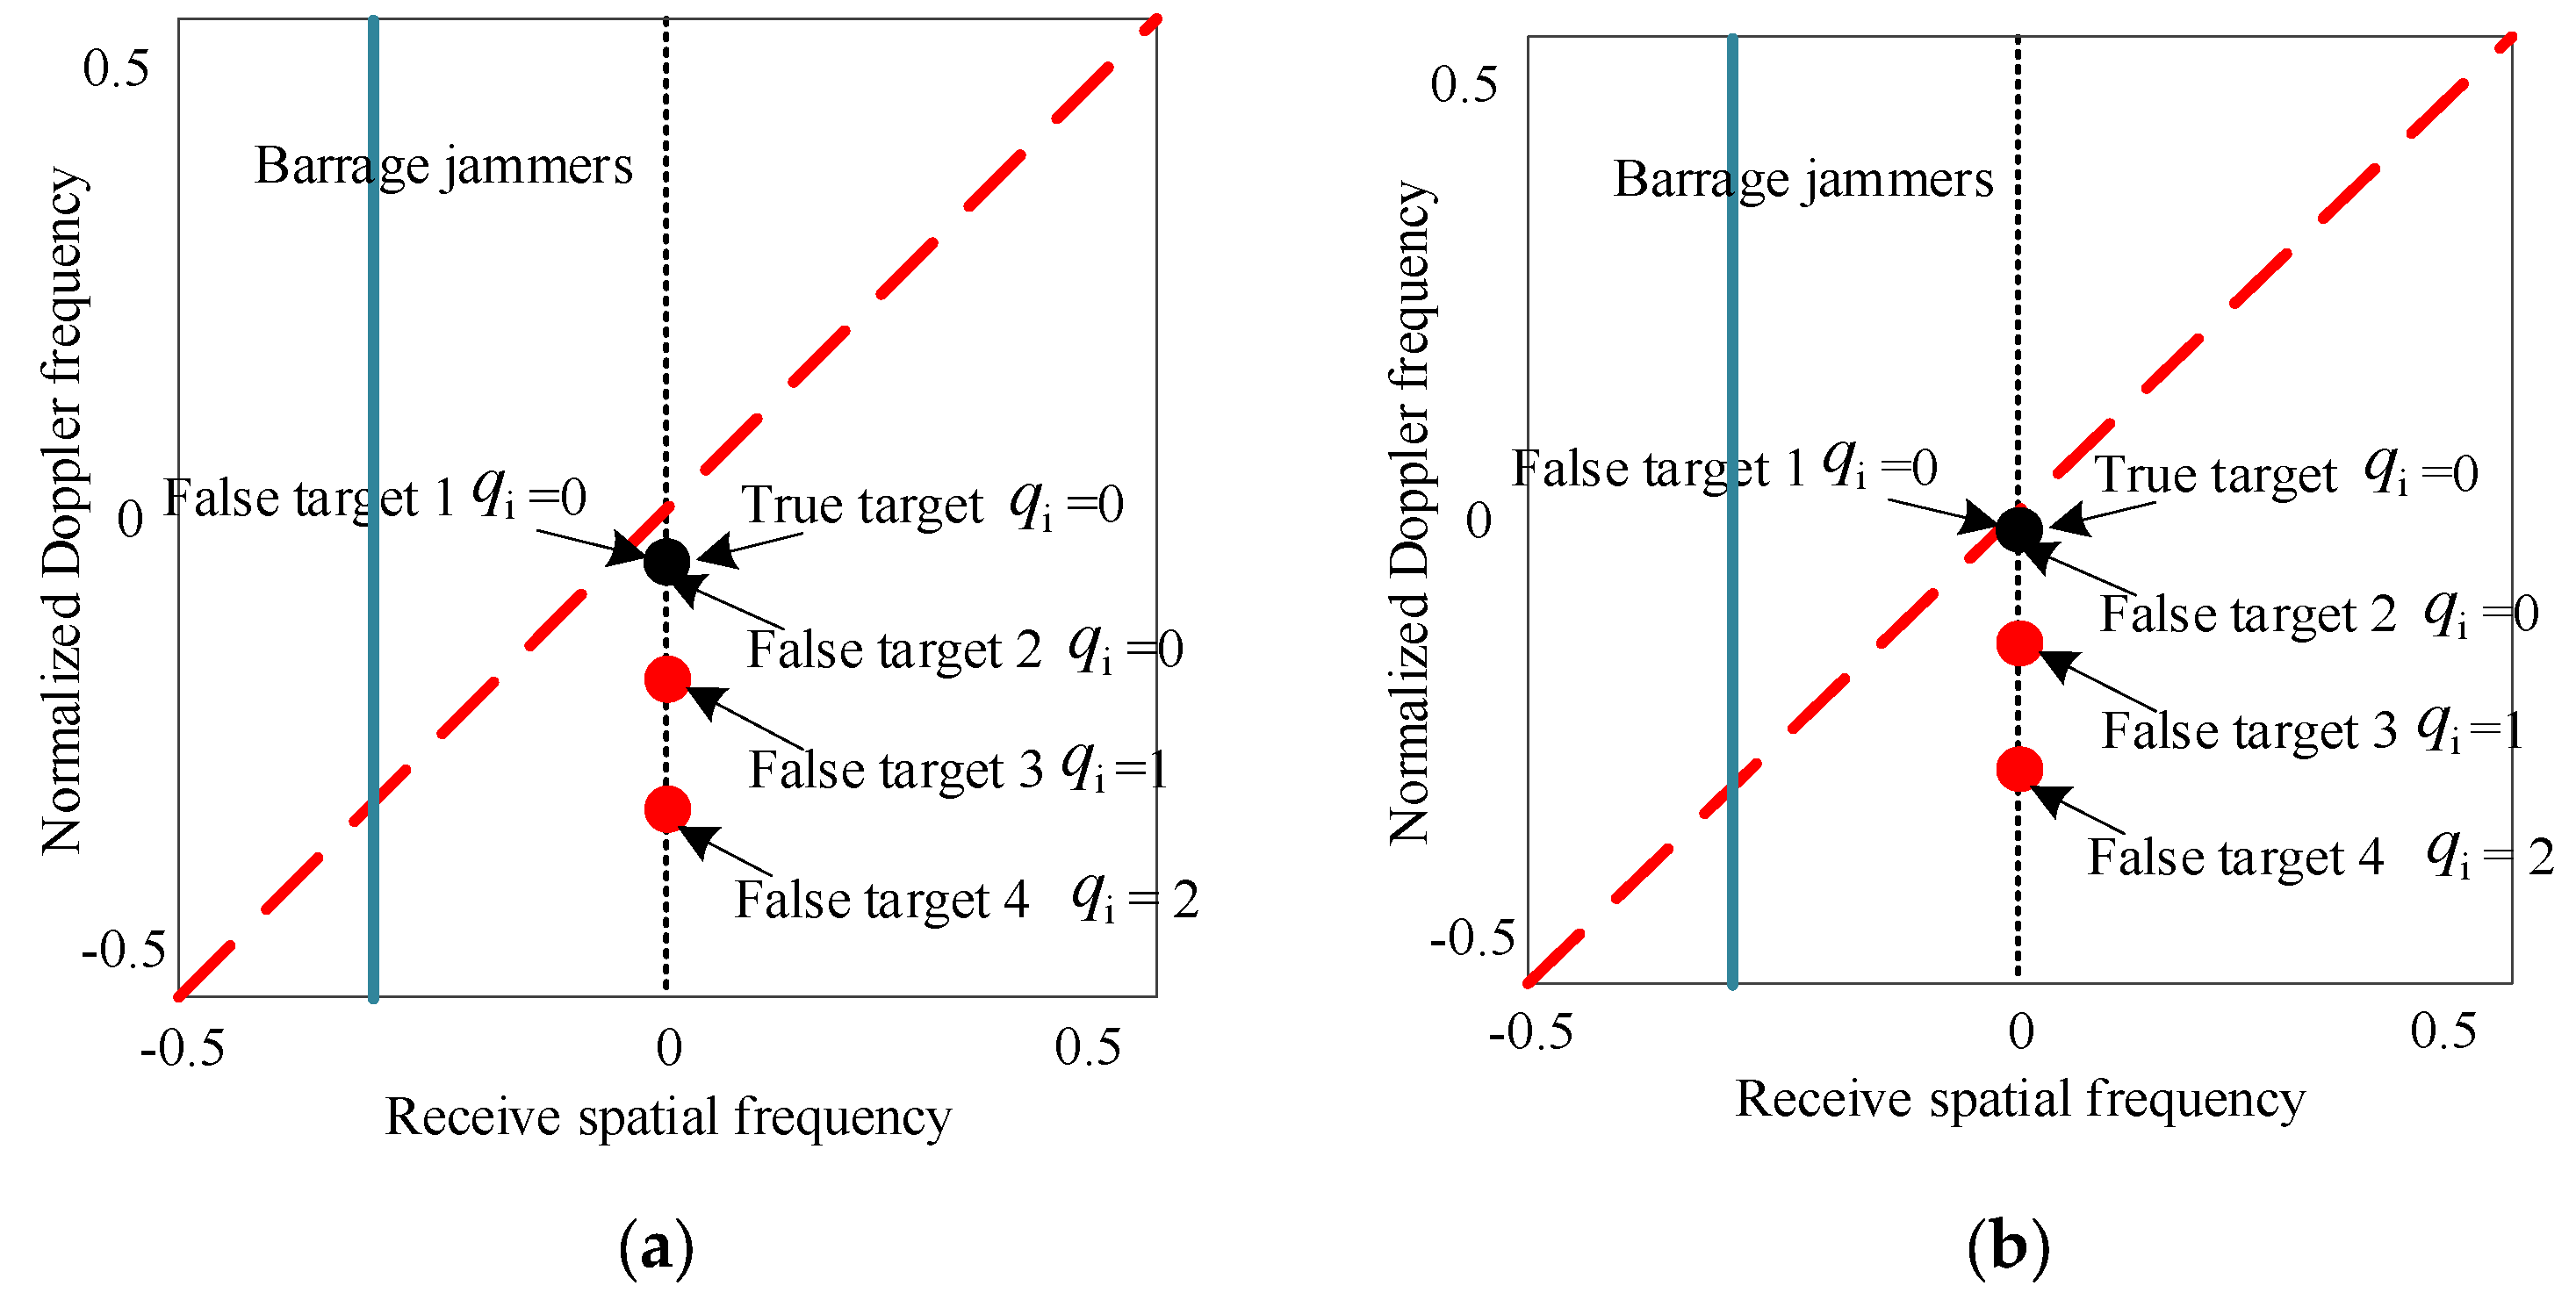
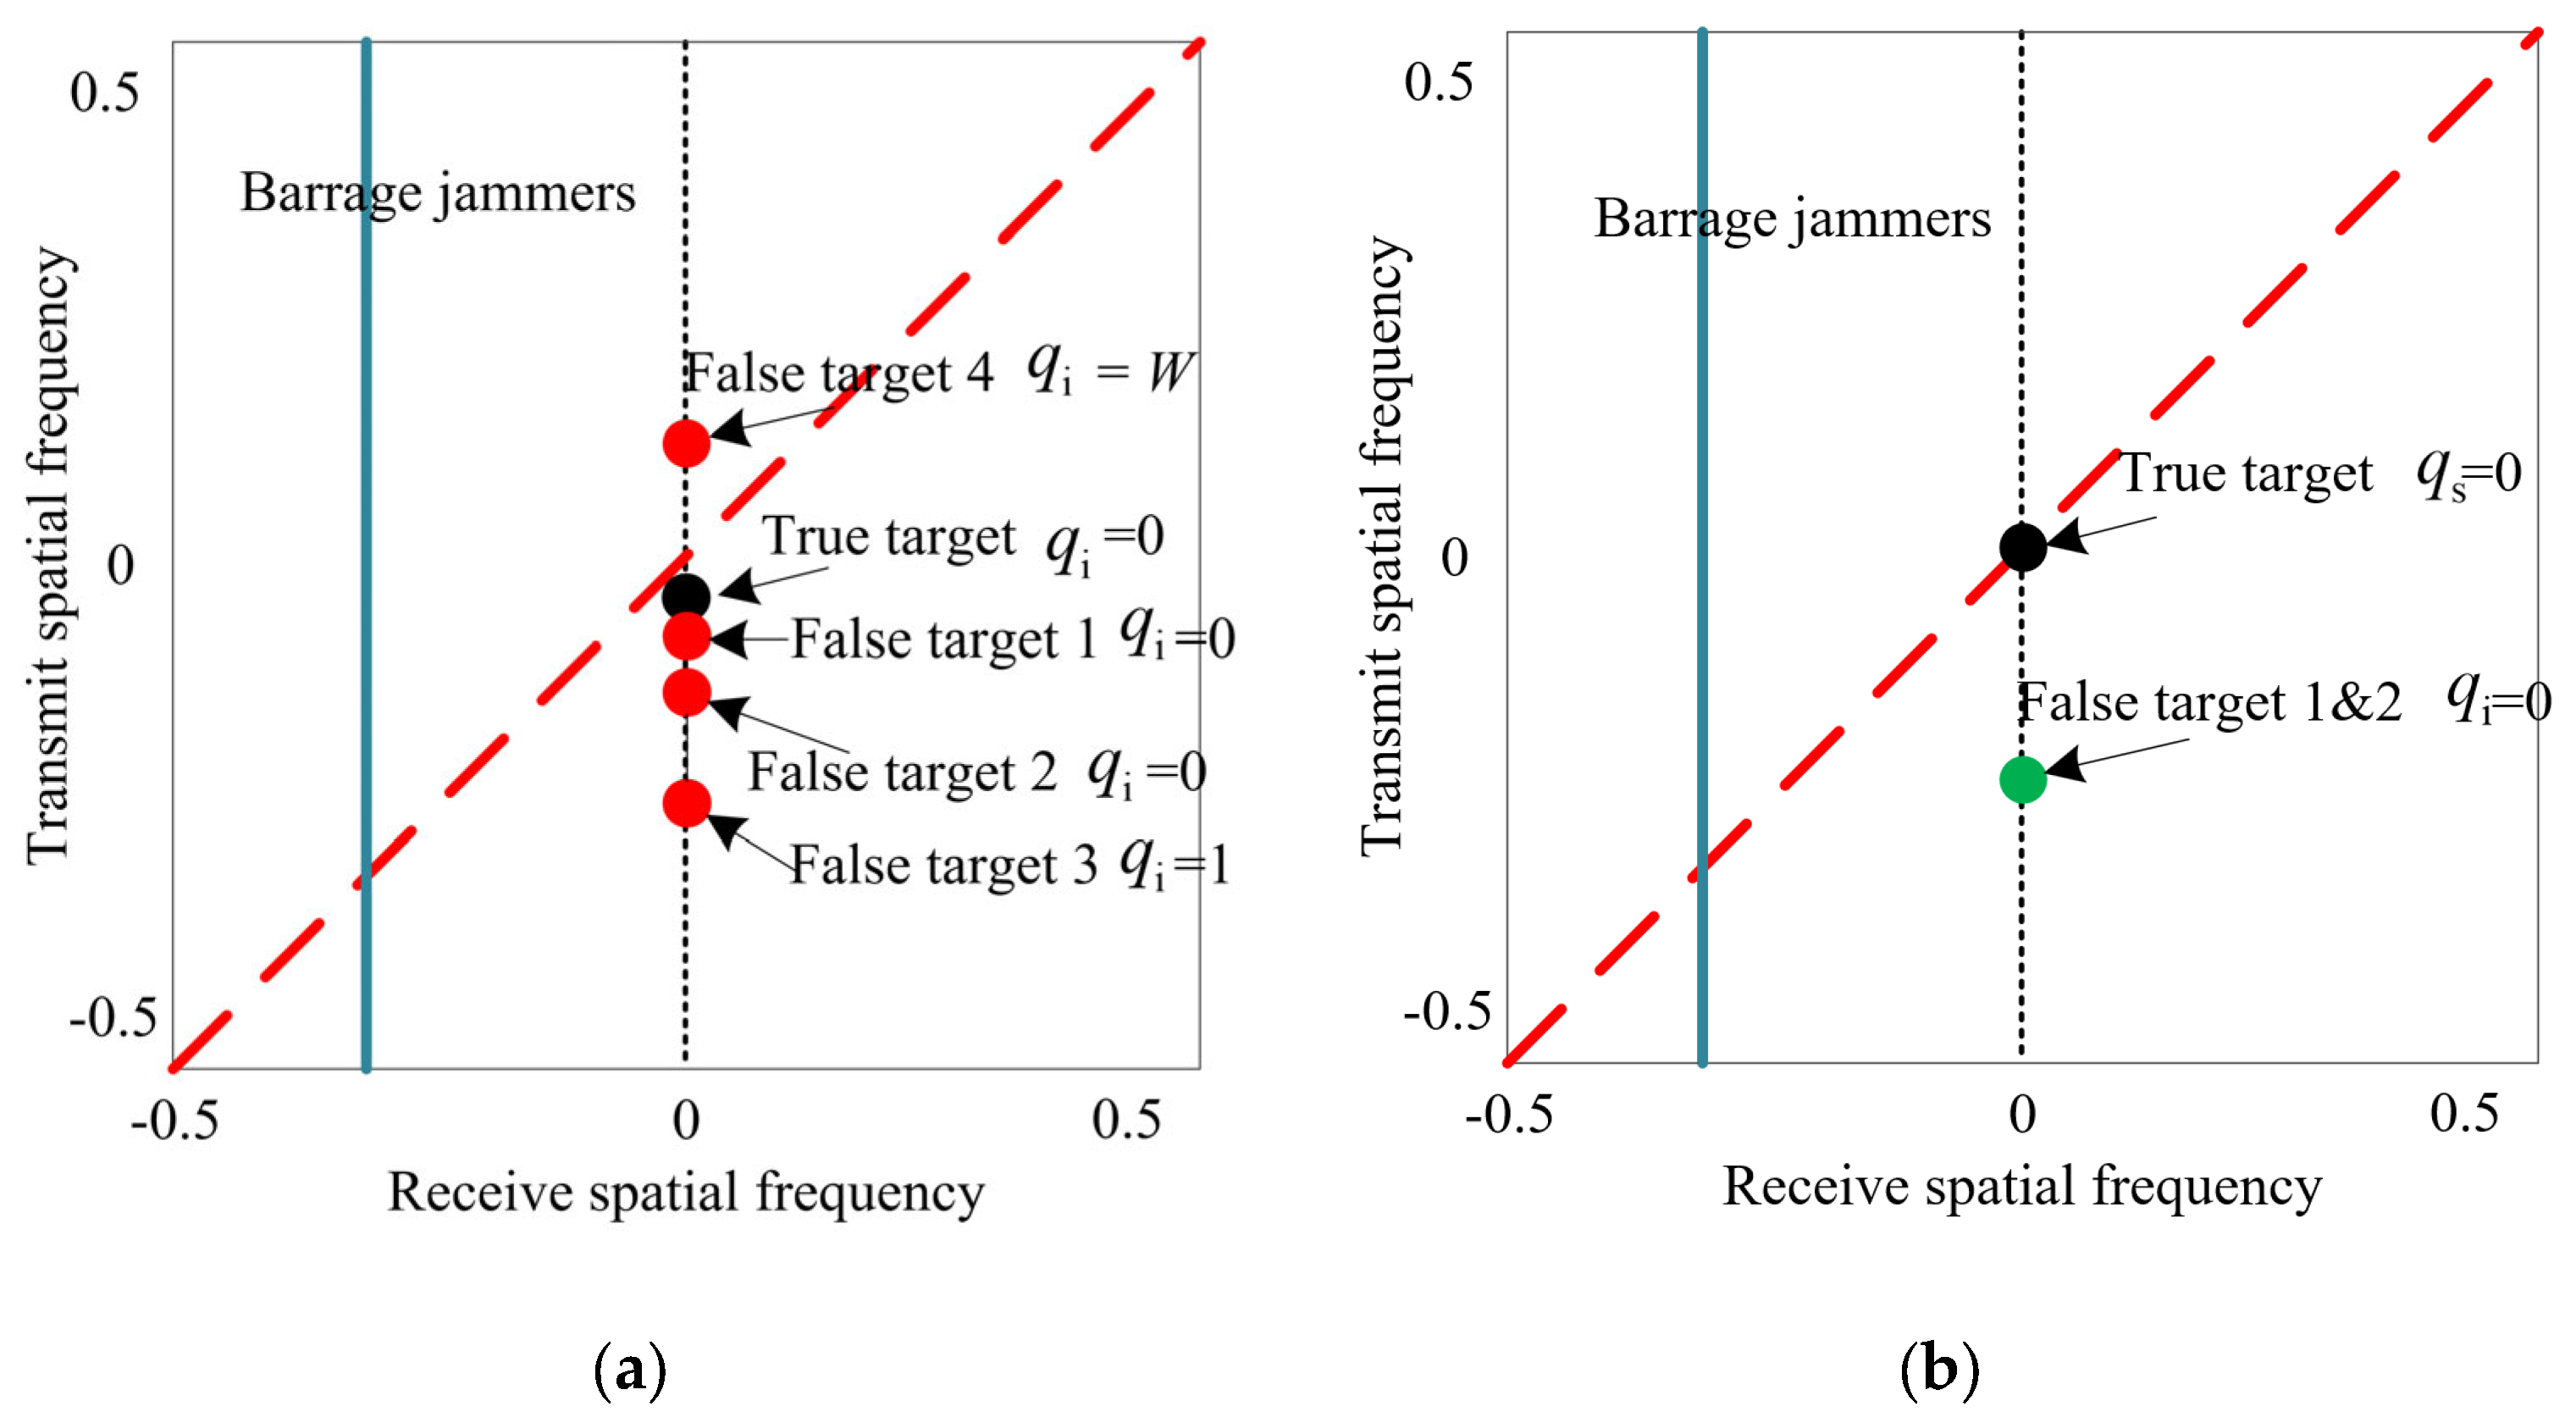
As shown in Figure 7a, without the compensation, the targets distribute in response to range and angle spatial frequency in the joint transmit–receive spatial frequency. Via the Doppler frequency compensation, the false targets, which have different delayed pulse numbers with the true target, have been distinguished and suppressed, i.e., False target 3 and False target 4 can be suppressed in Figure 7a. Via spatial compensation, the true target is diagonally distributed and the false targets in Range ambiguity I can be distinguished from the true one in Figure 7b (the green represents the overlap of the false targets). The barrage jammer signals are received in different angles and located in the sidelobe. Hence, the barrage jammers can be distinguished in the receive spatial frequency domain. The nulls could be generated by adaptive transmit–receive beamforming to suppress the sidelobe barrage jammers.

3.3.2. Samples Selection Based on Singular Spectrum Analysis

After secondary compensation, the true and false targets can be distinguished in the spatial frequency domain. However, in practice, due to the pseudo-random distribution characteristics of false targets and because it is difficult to meet the conditions of independence and identical distribution, it is not possible to obtain an accurate interference and noise covariance matrix. In this regard, the SSA method can be used to select suitable training samples.
Based on the echo information in each range bin, the following multivariate hypothesis testing problem can be constructed:
{ H 0 : Y = s + w H 1 : Y = w H 2 : Y = i + w
where Y represents the echo in a range bin after the secondary compensation, s represents the signal, w represents the noise, and i represents the interference signal. Hypothesis H 0 represents the sample, including true target and noise; hypothesis H 1 represents noise; hypothesis H 2 represents interference and noise. In order to select the hypothesis H 2 , the following two steps are carried out: (1) Select the samples corresponding to the hypothesis H 2 and hypothesis H 0 . (2) Remove the samples containing the target, i.e., the hypothesis H 0 , to obtain the samples corresponding to the hypothesis H 2 . The specific analysis is as follows:
First, based on the received data vectors of each range bin Y l (which represents the number of range bins), the matrix Y l Y l H is constructed. Singular-value decomposition is then performed on Y l Y l H to obtain G singular values λ g , g = 1 , , G .
Secondly, based on the false alarm probability and probability density function, the threshold is designed λ 0 . Then, the λ 0 in each range bin is compared, and when λ g > λ 0 , it means that the range bin corresponds to hypothesis H 0 and hypothesis H 2 , thus obtaining κ singular samples Y 1 , Y 2 Y κ .
Finally, based on the characteristic that the range bin of the false target Range ambiguity I is greater than the actual target in Figure 5, the sample with the minimum range bin is removed from the samples, i.e., the samples corresponding to the hypothesis H 0 are eliminated. Hence, the remaining samples only contain interference and noise, that is, hypothesis H 2 .
After secondary compensation and the suppression in the Doppler domain, construct the covariance matrix of interference and noise, which is based on the selected samples, in the form of
R = 1 κ 1 l = 1 κ 1 Y l Y l H
To maintain the suppression method effect, the sample selection strategies are carried out to ensure the performance of the date-dependent beamforming.

3.3.3. Adaptive Beamforming Based on Distance–Angle Two-dimensional Approach

After sample selection based on singular spectrum analysis, interferences are processed using two-dimensional adaptive beamforming. Hence, the minimum variance distortionless response (MVDR) filter is constructed, i.e.,:
{ min w   w H R w s . t . w H u ( R 0 , θ 0 ) = 1
where w denotes the optimal weight vector, and u ( R 0 , θ 0 ) is the steering vector of the true target after the secondary compensation. Using the Lagrange multiplier method, the weight vector is calculated as
w = μ R 1 u ( R 0 , θ 0 )
where R 1 represents the inverse covariance matrix after SSA. Moreover, the data obtained after compensation undergo processing using the range–angle–Doppler-dependent MVDR beamformer. The resulting output signal can be expressed as
z = w H Y
Hence, the false targets are effectively suppressed by accounting for range mismatches. Secondary compensation anti-interference method can be summarized in Algorithm 1.
Algorithm 1: Secondary Compensation anti-interference method
Input:   φ k   q s   Q e   M   N   f 0   Δ f   k
Output:   z
       Step 1. Construct the signal model in Equation (1) with Δ f and f 0 .
       Step 2. Construct QPC vector c in Equation (5) and demodulation vector g k according to Equation (16).
       Step 3. Obtain the residual vectors y s , k after matched filtering and QPC demodulation according to Equation (17).
       Step 4. Obtain output Y ˜ after Doppler frequency compensation according to Equation (26).
       Step 5. Construct Frequency filter w k according to Equation (31).
       Step 6. Obtain output Y after principle range frequency compensation according to Equation (38).
       Step 7. Obtain the interference plus noise covariance matrix R ˜ after SSA samples selection according to Equation (42).
       Step 8. Obtain the weight vector w via transmit-receive two dimensional beamforming according to Equation (45)
       Step 9. Calculate output z according to Equation (46)

4. Simulations

We conduct numerical simulations and theoretical analysis to evaluate the anti-inference method performance in the QPC–FDA-MIMO radar. Simulation parameters for the radar system are provided in Table 1. A collocated MIMO radar is considered to have 10 kHz pulse repetition frequency and operated at 15 GHz. For simplicity, we consider that the true target is located at angle 0° and the 200th range bins without range ambiguity. Additionally, the self-protection jammer generates false targets, which are located behind the true target, with the same angle. These false targets are, respectively, positioned at 250, 300, 100, 400, 150 and 400 range bins. False target 1 and False target 2 have the same range ambiguity number as the true target, while False targets 3, 4, 5 and 6 are delayed by 2, 2, 3 and 3 transmitted pulses, respectively.
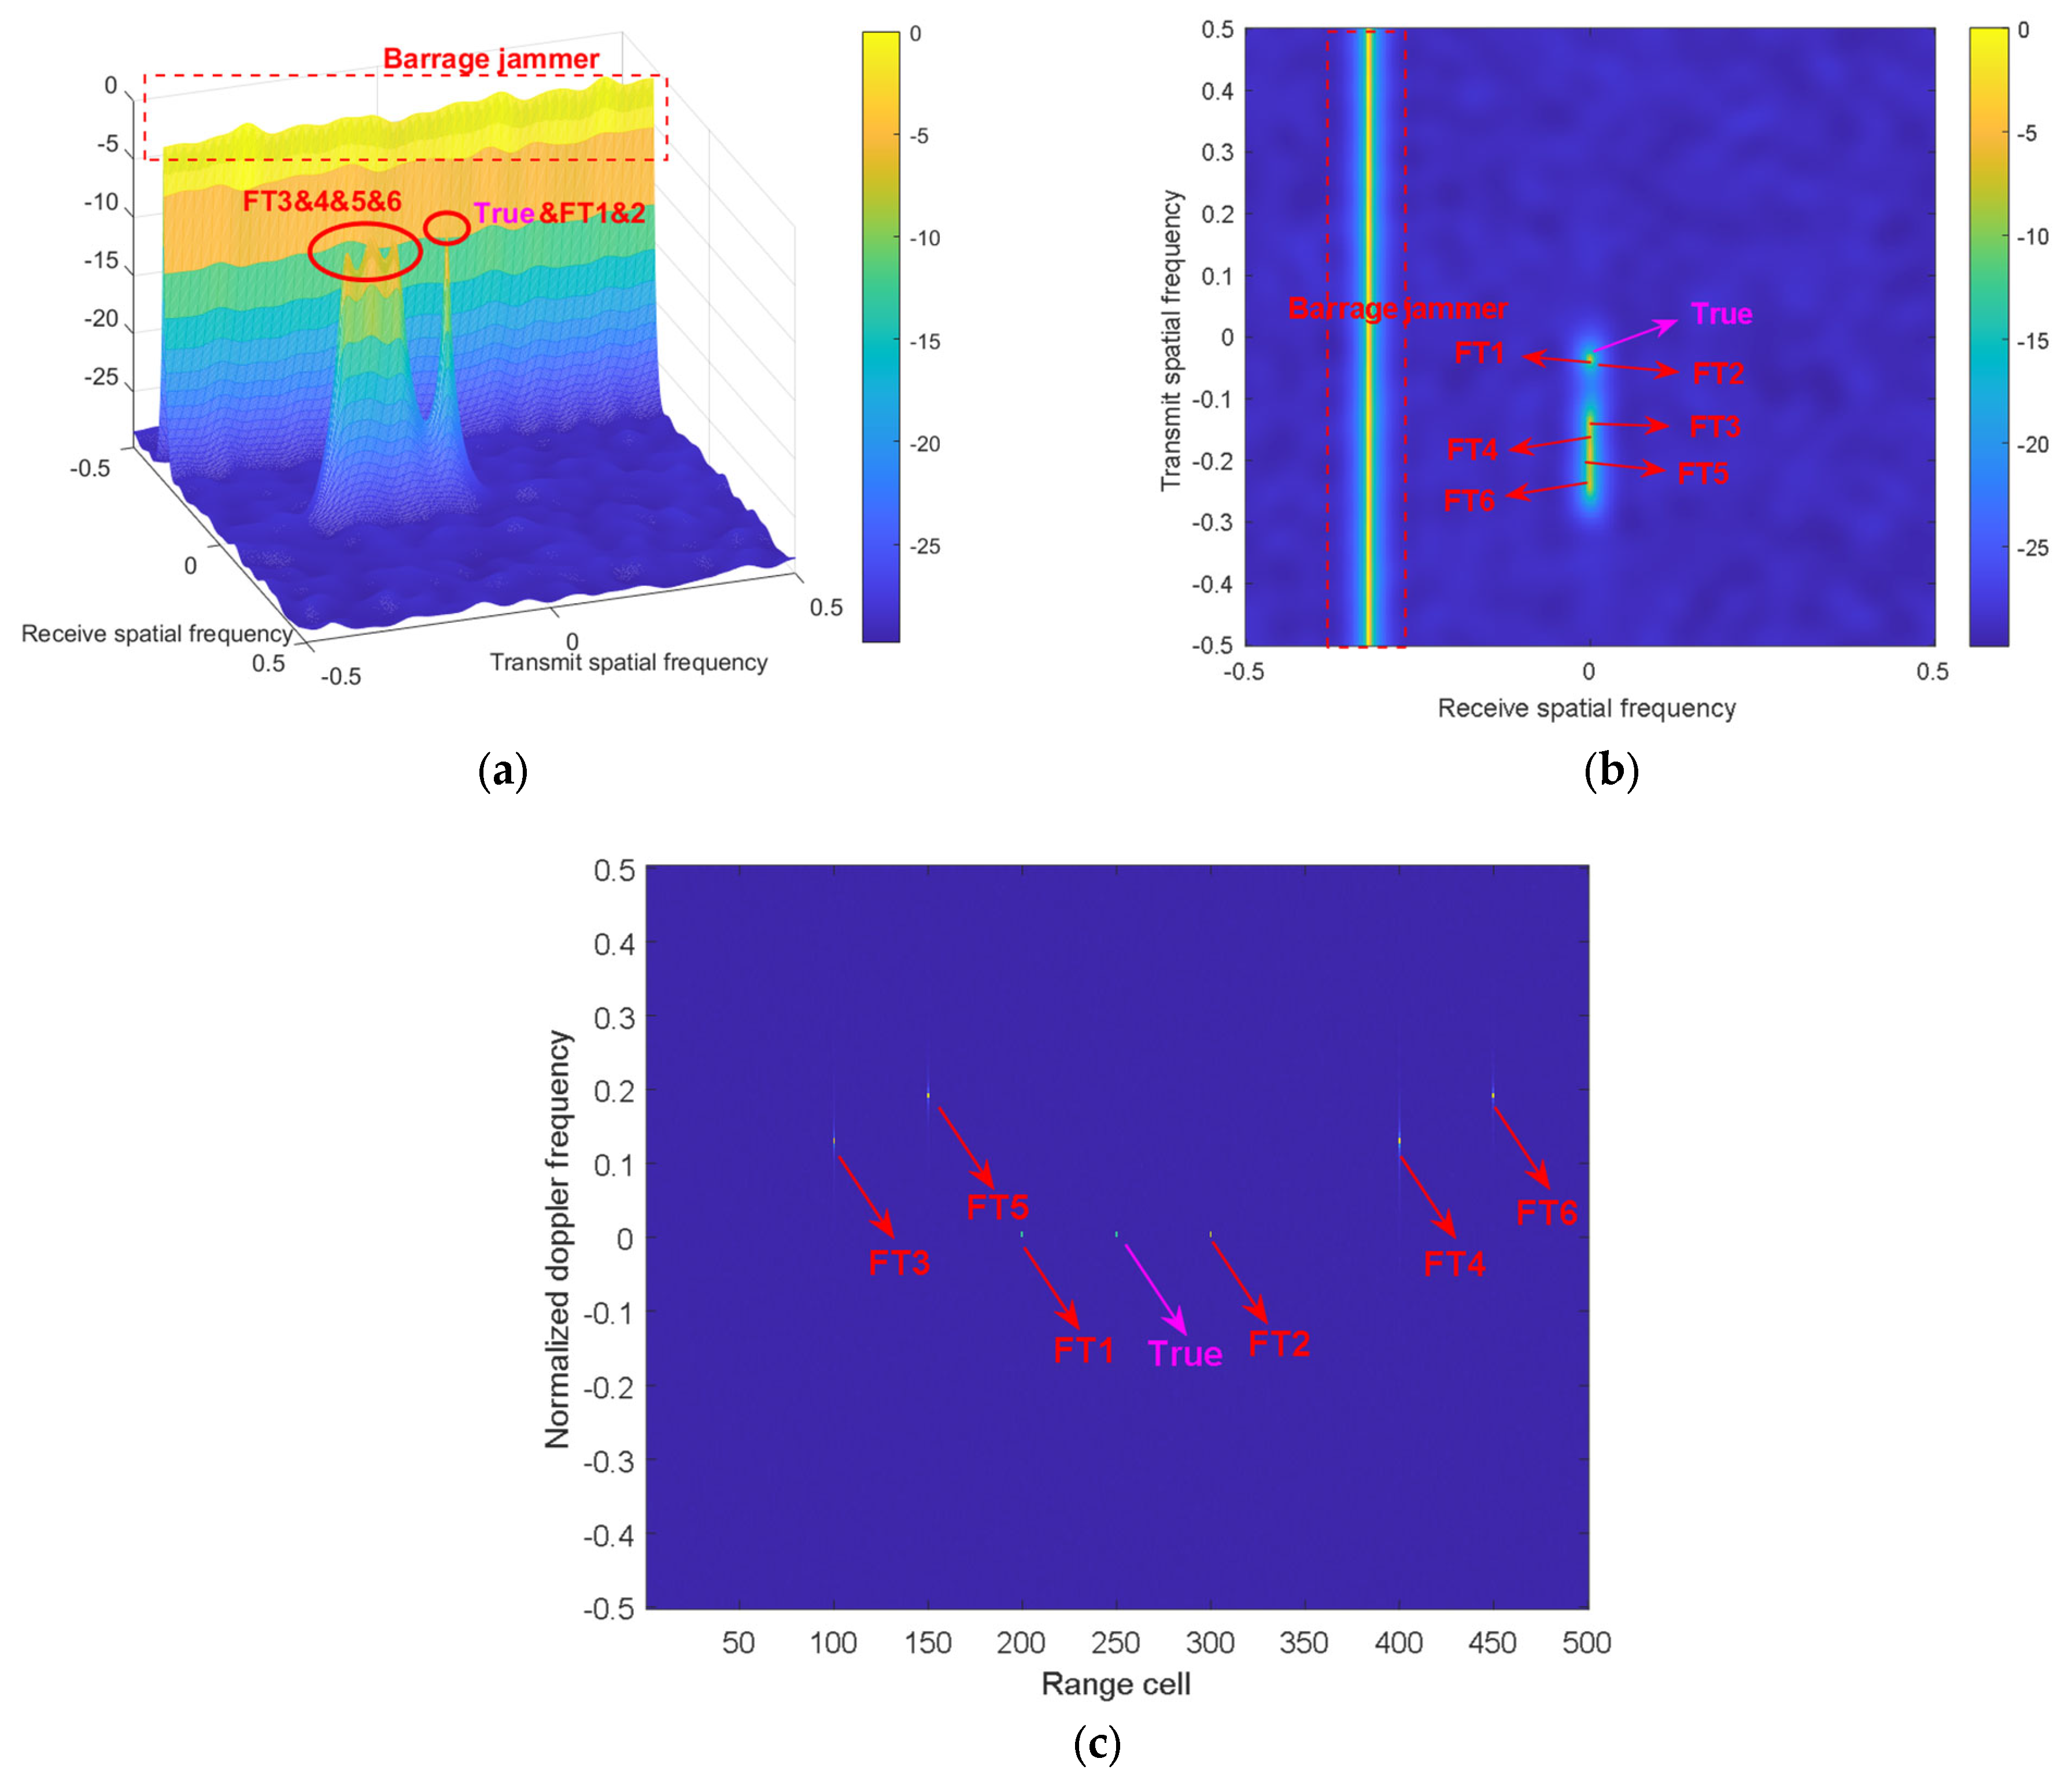
As shown in Figure 8, the spectrum distributions before compensation in QPC–FDA-MIMO radar are presented. In Figure 8a,b, the true target locates in the identical straight line with the false targets for the identical receive spatial frequency and different transmit frequencies. The barrage jammer distribution in the capon spectrum is based on the receive angle, resulting in distinguishable distribution by the receive spatial frequency. In Figure 8c, the location of the targets depends on the delay pulse numbers after QPC decoding, and the false targets in Range ambiguity II (such as FT3, FT4, FT5, FT6) are distinguishable with the true one in the Doppler domain. However, it is invalid to identify the targets with the identical range ambiguity number.
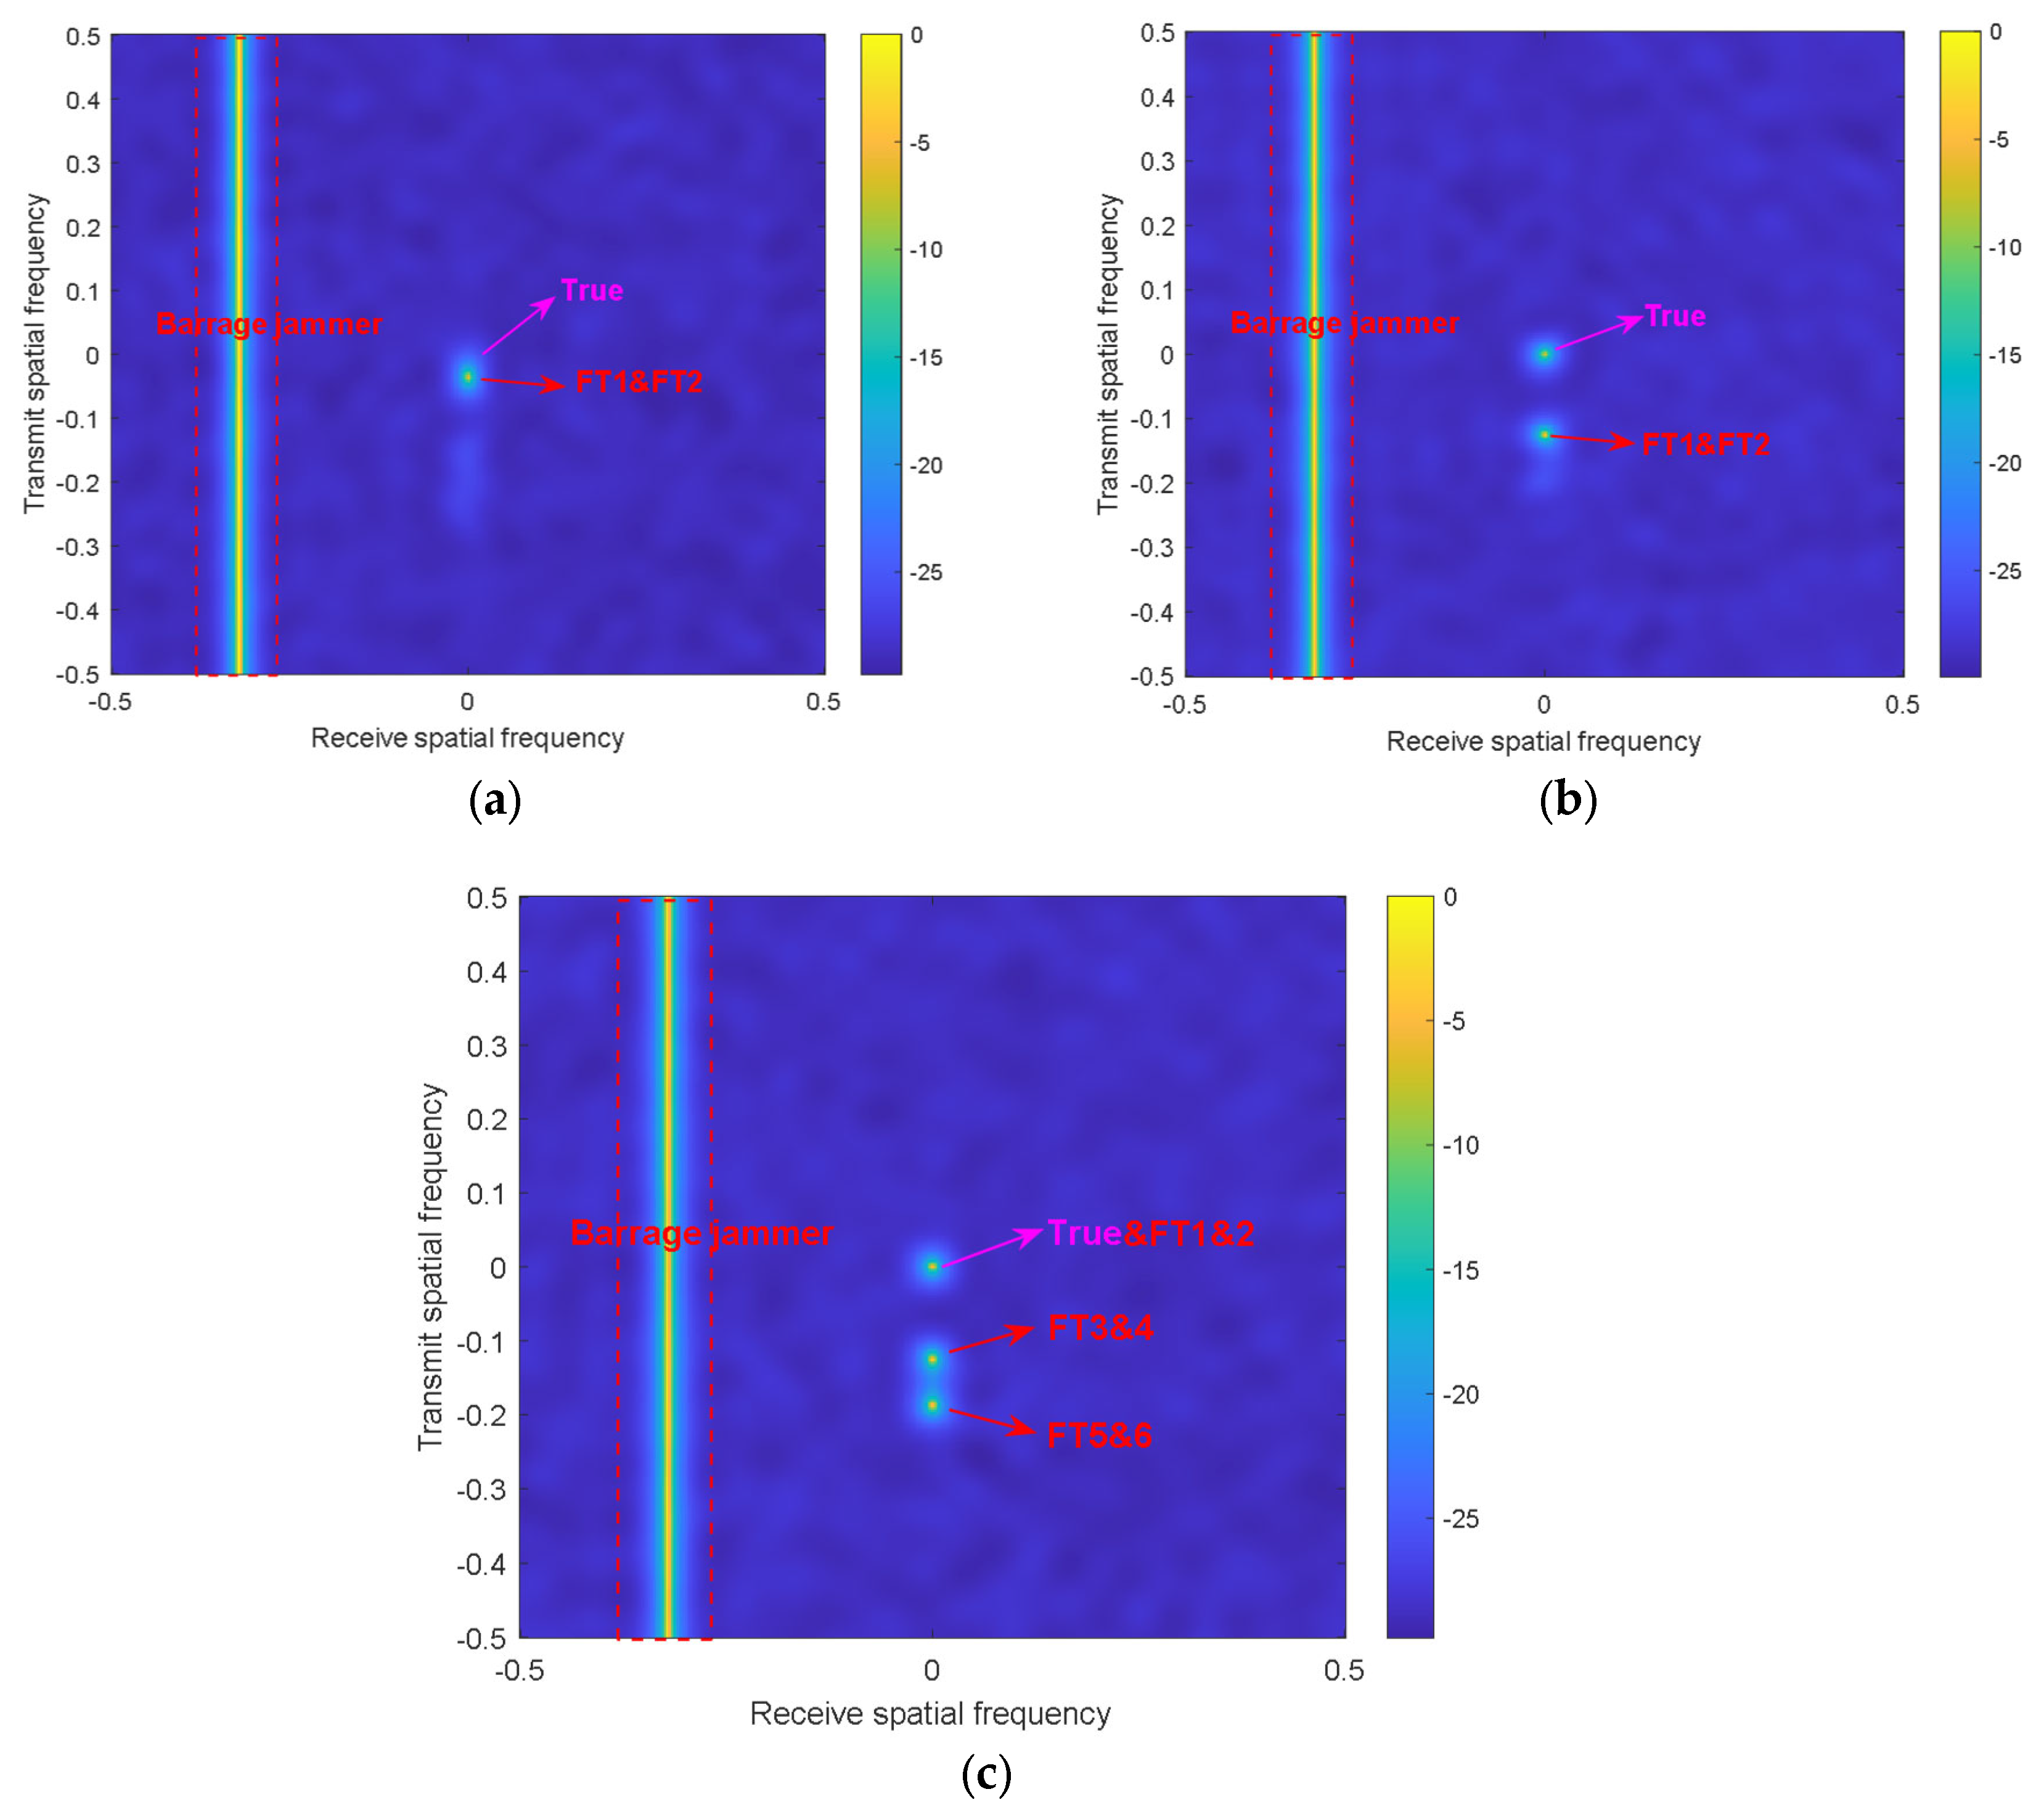
Furthermore, Figure 9 plots the capon spectrum distribution in QPC–FDA-MIMO and FDA-MIMO. In Figure 9a, the false targets in Range ambiguity II (such as FT3, FT4, FT5, FT6) have been suppressed by the equidistant Doppler filter group. The false targets in Range ambiguity I cannot be distinguished for the same range ambiguity numbers. In Figure 9b, after frequency compensations in the Doppler frequency domain and spatial frequency domain, the false targets in Range ambiguity I are translated and can be distinguished from the true target. On the contrary, the distribution of the targets depends on the pulse numbers after principle range compensation, i.e., the false targets in Range ambiguity I are distinguishable from the true one in Figure 9c.
Figure 10 shows the data-dependent beampattern in the transmit–receive domain. As shown in Figure 10a, after the second compensation and data-dependent beamforming, the false targets in Range ambiguity I are suppressed by nulling in the spatial frequency domain due to range mismatch. Hence, the beampattern responds maximally at the position of the true target. There is a notch generated, corresponding to the spatial frequency of the barrage jammer, and the barrage jammer can be suppressed for angle mismatches in QPC–FDA-MIMO. In Figure 10b, after the range compensation, there is still significant null in the mainlobe due to the existence of interferences, resulting in the distortion of the beampattern [47].
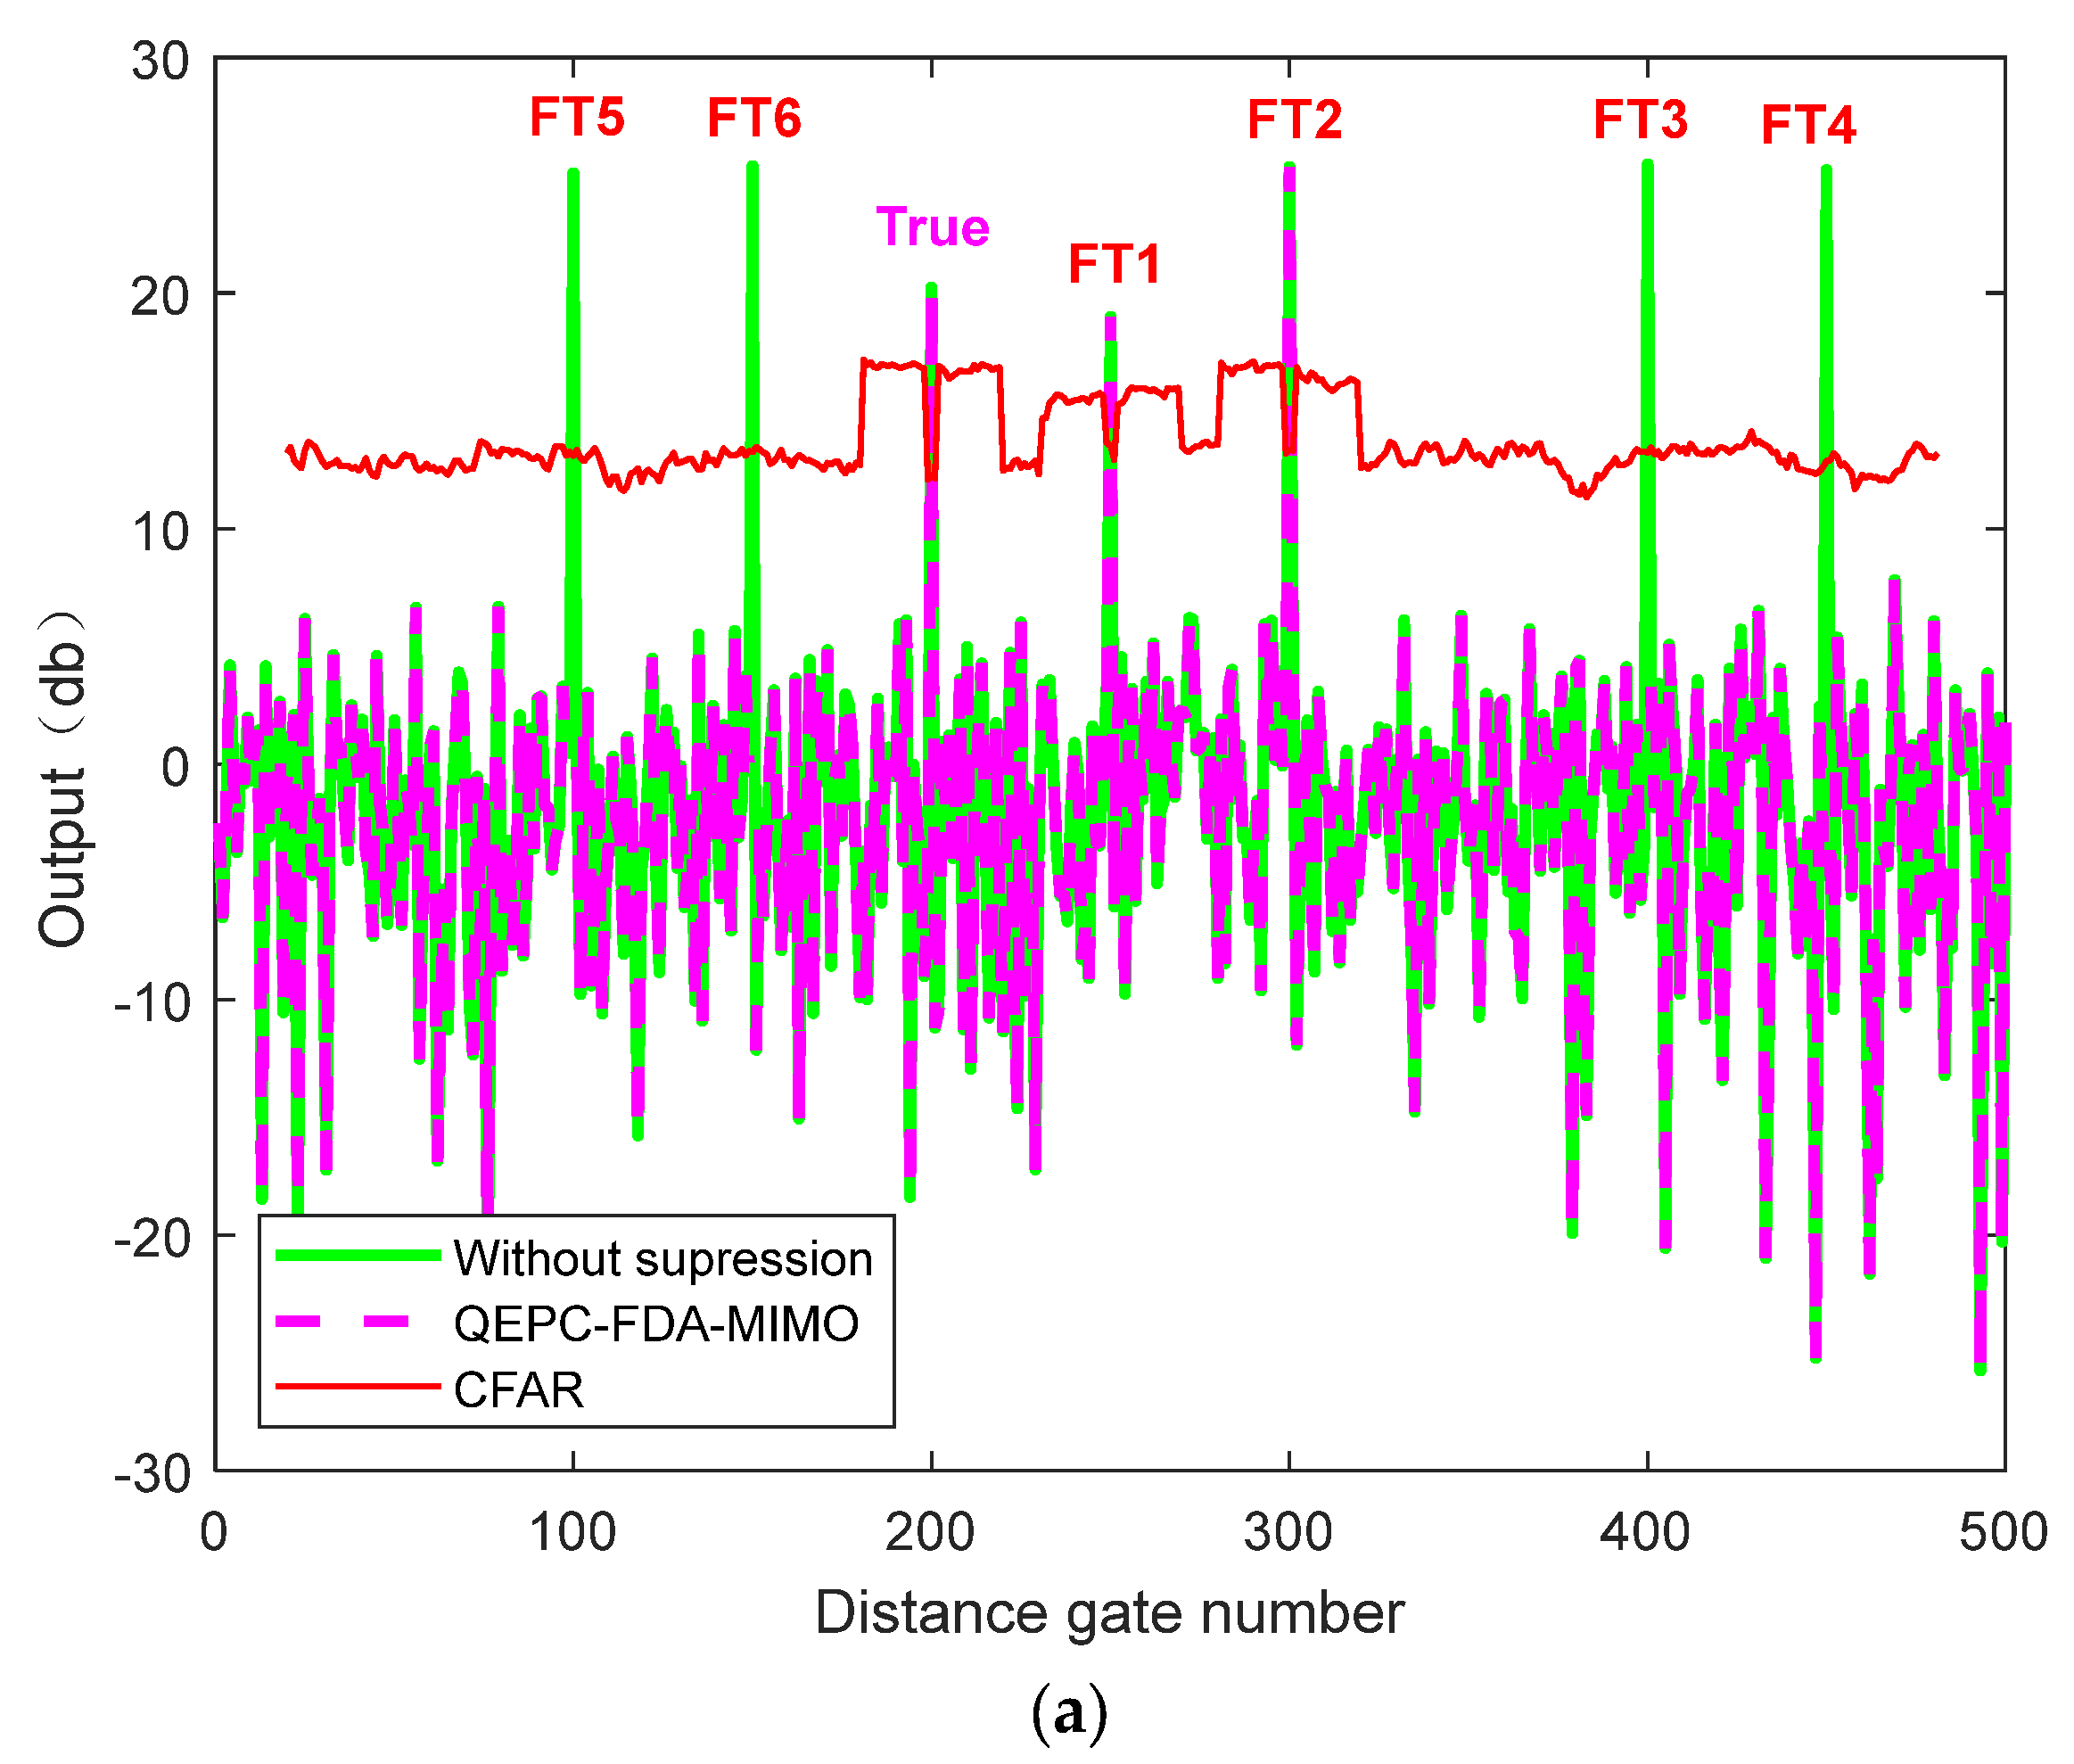
Figure 11 shows the outputs of adaptive filtering after Doppler frequency and spatial frequency compensations. The false targets cannot be separated from the true target after the Doppler frequency compensation as there are still interferences (such as FT1 and FT2), i.e., false alarms appeared after constant false alarm rate (CFAR) detection in Figure 11a. However, after the spatial frequency compensation, the true target and the false targets in Range ambiguity I can be effectively separated, and the false targets are effectively suppressed via adaptive beamforming. Only the true target is detected and has the maximum output power, as shown in Figure 11b.
Figure 12 shows the signal-to-interference-plus-noise ratio (SINR) curves for different suppression strategies. The black line represents the ideal upper bound. The purple line represents the output result with secondary compensation and sample selection using SSA. The green line represents the output result in traditional FDA-MIMO radar, and the blue line represents the output result in EPC-MIMO radar. There still exists interference in Range ambiguity I using the traditional FDA-MINO and EPC-MIMO radar, which leads to a low SINR [47]. However, by conducting the sample selection of SSA after secondary compensation, an interference plus noise covariance matrix can be obtained accurately, achieving better SINR performance that is close to the ideal upper bound.

5. Discussion

It is difficult for a traditional FDA-MIMO radar system to suppress the mainlobe interference, especially the fast-generated false targets located in the identical pulse with the true target. However, the suppression method based on the secondary compensation in QPC–FDA-MIMO radar can filter out the false targets in the ambiguity regain. As shown in Figure 8, the true target and the false targets concentrate in several points, which makes it impossible to distinguish the targets only in the spatial domain. Hence, via QPC encoding and decoding, the DOFs of the system are extended and the suppression is performed in joint the Doppler transmit–receive domain.
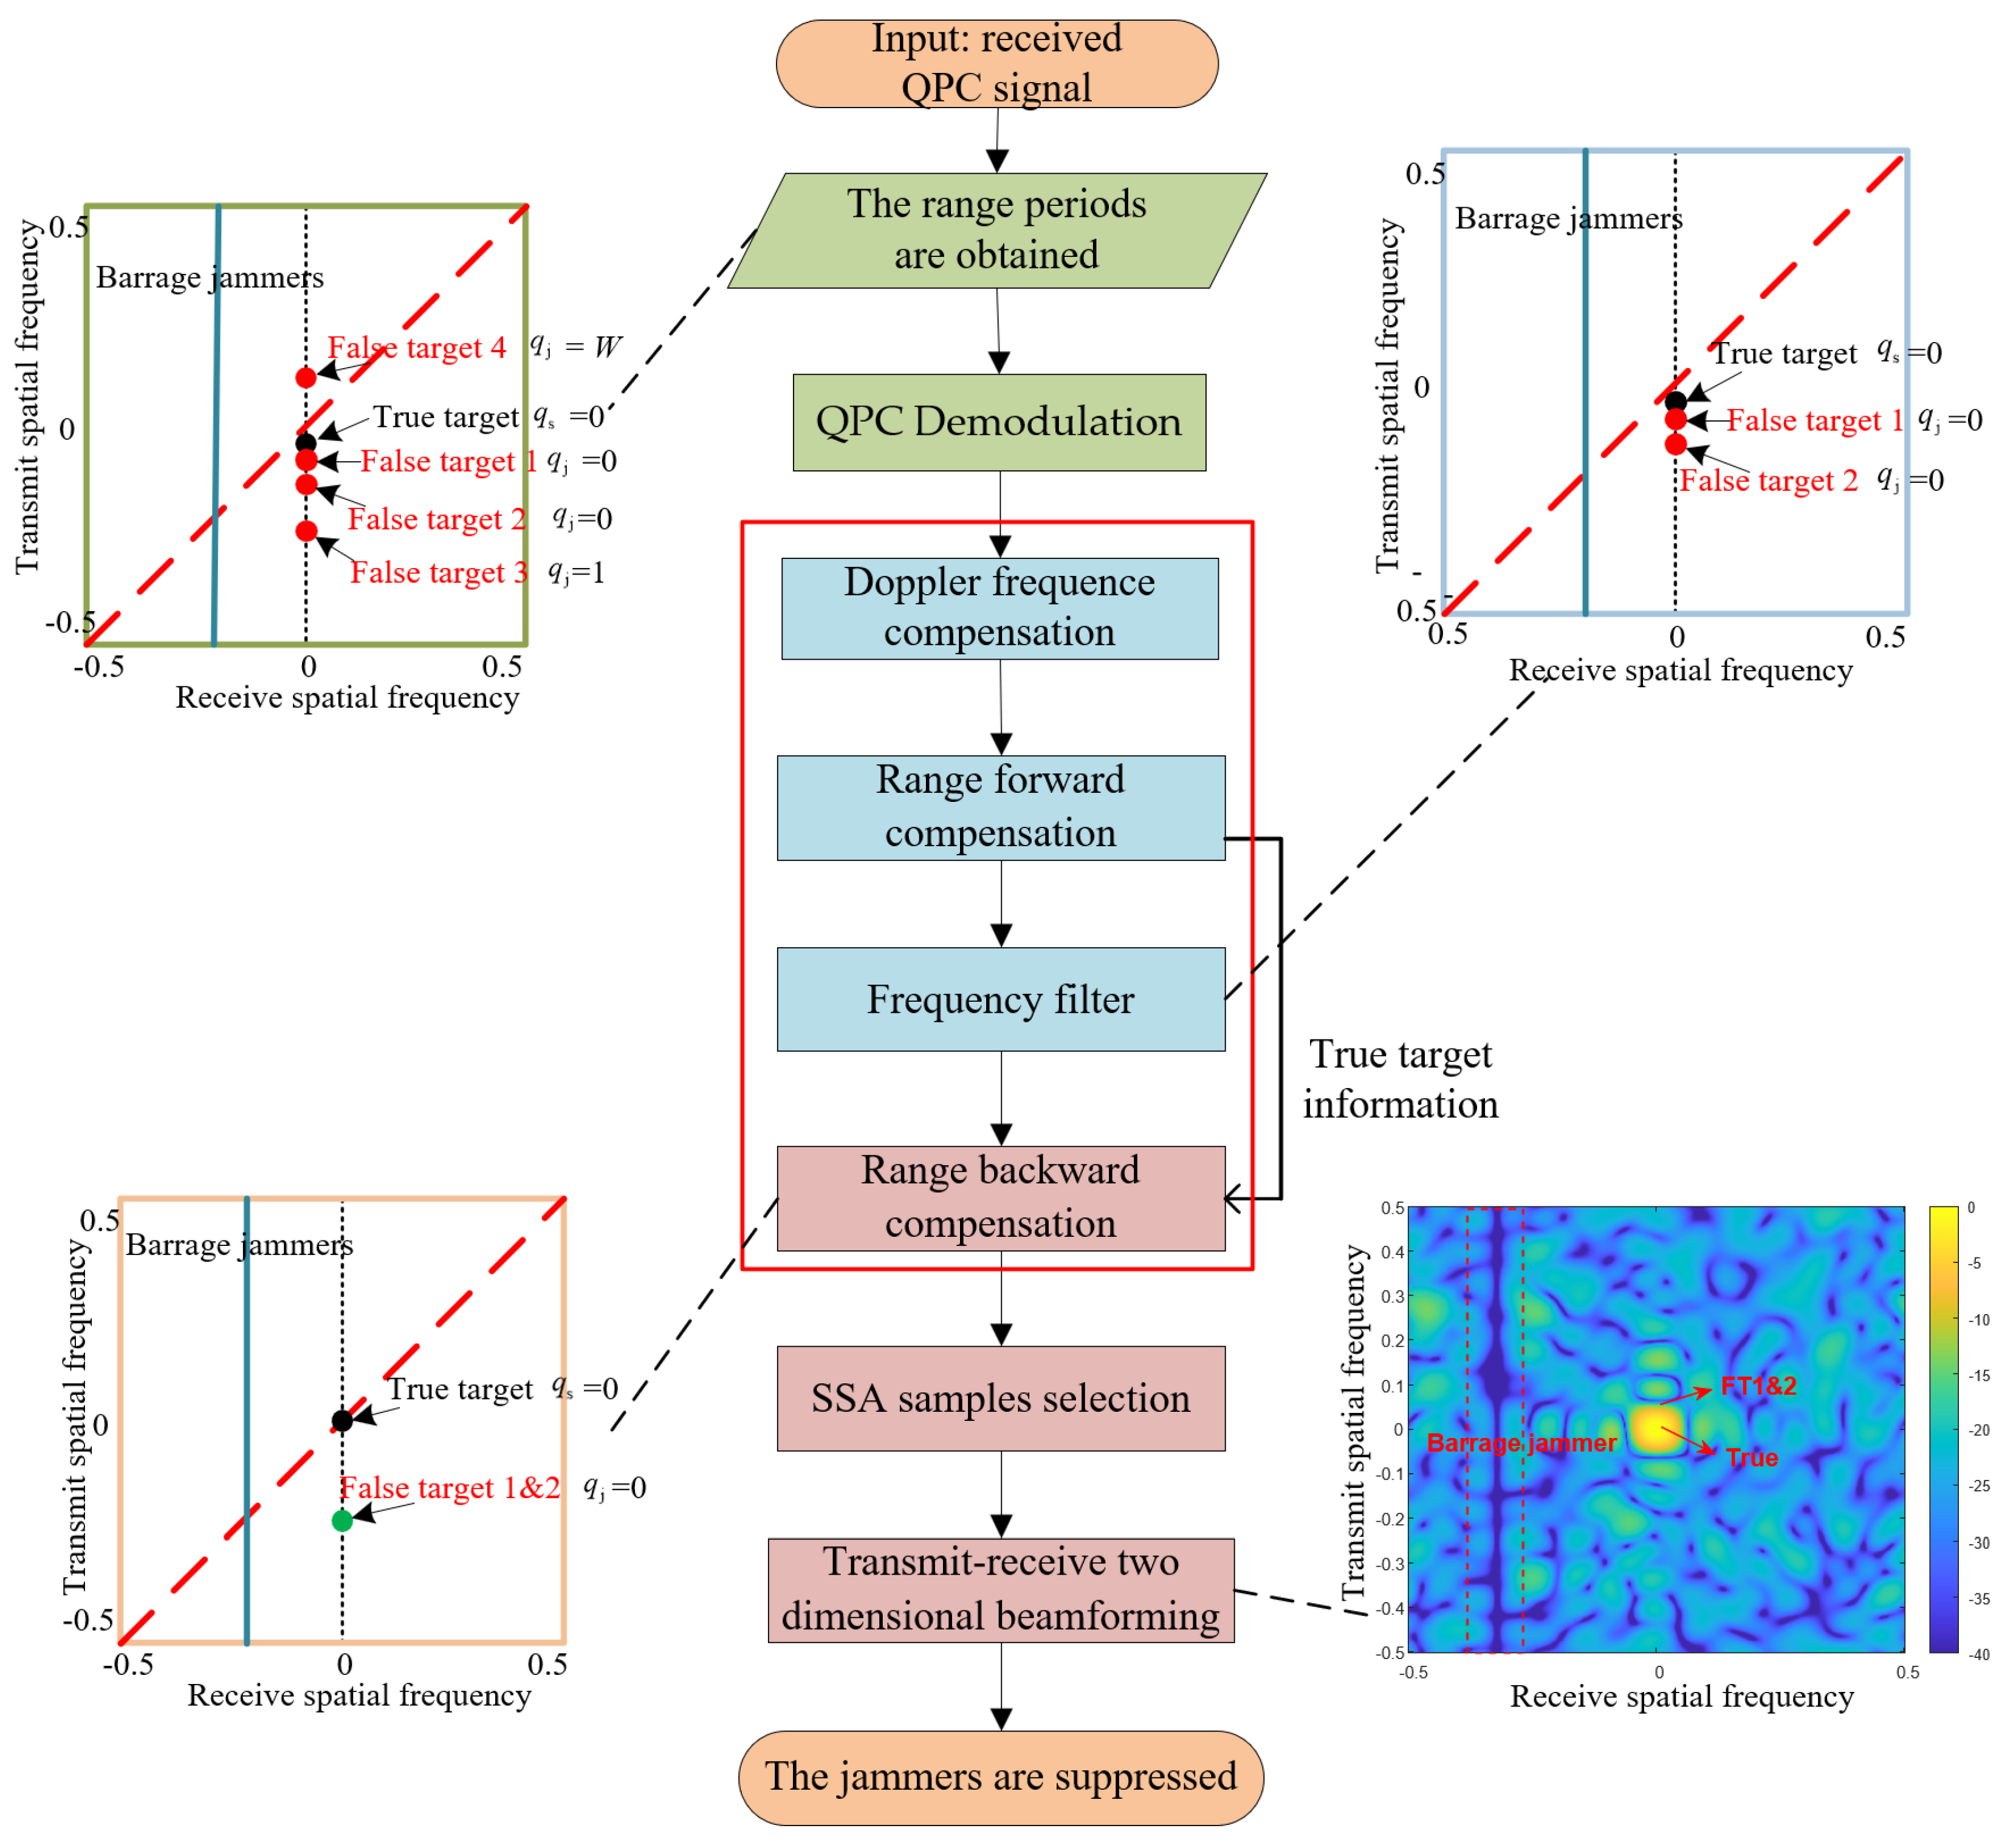
After Doppler frequency compensation, the residual factor is φ res ( k ) = φ mod , s ( k ) φ de ( k ) = e j 2 π Δ f s k e j π q s 2 γ , where the first exponential term is linearly dependent on k . The additional normalized Doppler shift Δ f s = q s γ is constructed and additional DOFs are obtained in the Doppler domain. We can distinguish the targets in Range ambiguity II (like FT3 FT4 FT5 FT6) via the Doppler frequency in Figure 8c. After the suppression via Doppler filter, only the false targets in Range ambiguity I exist in Figure 9a. In the meanwhile, the false targets in front of the true target are suppressed and the location of true target is obtained. After the spatial frequency compensation, the false target in Range ambiguity I can be distinguished from the true one. As shown in Figure 10, there is a notch generated, corresponding to the spatial frequency of the barrage jammer and false targets, which can be suppressed for angle mismatches in QPC–FDA-MIMO. In comparison, the conventional FDA-MIMO cannot distinguish and suppress the false targets from Range ambiguity I in Figure 9c, Figure 10b and Figure 11a. The false targets in the range ambiguity regain are effectively suppressed via adaptive beamforming in Figure 11b. By conducting the sample selection of SSA, an interference plus noise covariance matrix can be obtained accurately, which make the notches accurately align to the false targets. The abovementioned method achieves better SINR performance close to the ideal upper bound, as shown in Figure 12. The flow of the method is shown in Figure 13. Hence, the mainlobe deceptive interference and sidelobe barrage jammer are effectively suppressed via the method.

6. Conclusions

In this paper, the secondary compensation of QPC–FDA-MIMO has been developed to solve the mainlobe deceptive interference and sidelobe jamming suppression problem. The QPC technique has been employed by encoding the transmitted pulses in various spatial channels. To distinguish and suppress the false targets behind the true target by at least one pulse, Doppler compensation and filter have been performed and employed, respectively, in the receive array. To distinguish the fast-generated false targets, the spatial frequency compensation has been implemented to the principle range. In the meanwhile, the compensation relocated the mainlobe interference to the sidelobes. Via the SSA technique to select the samples and using the data-dependent beamforming with MVDR, the interferences have been suppressed. The effectiveness of the proposed jammer suppression method have been verified through the simulation results.

Author Contributions

Conceptualization, Y.Z. and J.X.; methodology, Y.Z. and J.X.; software, L.L.; validation, Y.Z., J.X., G.L. and L.L.; formal analysis, Y.Z. and L.L.; investigation, Y.Z., L.L. and J.X.; resources, G.L.; data curation, Y.Z. and J.X.; writing—original draft preparation, Y.Z.; writing—review and editing, Y.Z., J.X. and L.L.; visualization, Y.Z. and L.L.; supervision, L.L., G.L. and J.X.; project administration, X.Z., L.L., G.L. and J.X.; funding acquisition, X.Z., L.L., G.L. and J.X. All authors have read and agreed to the published version of the manuscript.

Funding

This work was supported in part by the National Nature Science Foundation of China (Nos. 62101402, 61931016, 62071344), Natural Science Basic Research Program of Shaanxi (No. 2023-JC-JQ-55), Innovation Capability Support Program of Shaanxi (No. 2022KJXX-38).

Data Availability Statement

Not applicable.

Conflicts of Interest

The authors declare no conflict of interest.

References

  1. Jin, F.; Cao, S. Automotive radar interference mitigation using adaptive noise canceller. IEEE Trans. Veh. Technol. 2019, 68, 3747–3754. [Google Scholar] [CrossRef]
  2. Jung, H.; Nguyen, B.V.; Song, I.; Kim, K. Design of anti-Jamming waveforms for time-hopping spread spectrum systems in tone jamming environments. IEEE Trans. Veh. Technol. 2020, 69, 728–737. [Google Scholar] [CrossRef]
  3. Huang, Y.; Chen, Z.; Wen, C.; Li, J.; Xia, X.G.; Hong, W. An Efficient Radio Frequency Interference Mitigation Algorithm in Real Synthetic Aperture Radar Data. IEEE Trans. Geosci. Remote Sens. 2022, 60, 1–12. [Google Scholar] [CrossRef]
  4. Huang, Y.; Wen, C.; Chen, Z.; Chen, J.; Liu, Y.; Li, J.; Hong, W. HRWS SAR Narrowband Interference Mitigation Using Low-Rank Recovery and Image-Domain Sparse Regularization. IEEE Trans. Geosci. Remote Sens. 2022, 60, 1–14. [Google Scholar] [CrossRef]
  5. Wang, W.-Q.; So, H.C.; Farina, A. An Overview on Time/Frequency Modulated Array Processing. IEEE J. Sel. Top. Signal Process. 2017, 11, 228–246. [Google Scholar] [CrossRef]
  6. Al-Salehi, A.; Qureshi, I.; Malik, A.; Khan, Z.; Khan, W. Throughput enhancement for dual-function radar-embedded communications using two generalized sidelobe cancellers. IEEE Access 2019, 7, 91390–91398. [Google Scholar] [CrossRef]
  7. Li, Z.; Ye, H.; Liu, Z.; Sun, Z.; An, H.; Wu, J.; Yang, J. Bistatic SAR clutter-ridge matched STAP method for nonstationary clutter suppression. IEEE Trans. Geosci. Remote Sens. 2021, 60, 1–14. [Google Scholar] [CrossRef]
  8. Ting, S.; Yong, G. TDOA estimation of dual-satellites interference localization based on blind separation. J. Syst. Eng. Electron. 2019, 30, 696–702. [Google Scholar] [CrossRef]
  9. Ge, M.; Cui, G.; Kong, L. Main lobe jamming suppression for distributed radar via joint blind source separation. IET Radar Sonar Navig. 2019, 13, 1189–1199. [Google Scholar] [CrossRef]
  10. Lin, Z.; Chen, Y.; Liu, X.; Jiang, R.; Shen, B. Adaptive Beamforming Design of Planar Arrays Based on Bayesian Compressive Sensing. IEEE Sens. J. 2021, 21, 5185–5194. [Google Scholar] [CrossRef]
  11. Gao, S.; Yang, X.; Lan, T.; Han, B.; Sun, H.; Yu, Z. Radar main-lobe jamming suppression and identification based on robust whitening Blind Source Separation and Convolutional Neural Networks. IET Radar Sonar Navig. 2022, 16, 552–563. [Google Scholar] [CrossRef]
  12. Al-Tous, H.; Barhumi, I.; Al-Dhahir, N. Narrow-Band Interference Mitigation Using Compressive Sensing for AF-OFDM Systems. IEEE Trans. Veh. Technol. 2017, 66, 6146–6159. [Google Scholar] [CrossRef]
  13. Tang, Z.; Deng, Y.; Zhang, H. High-fidelity SAR intermittent sampling deceptive jamming suppression using azimuth phase coding. IEEE Geosci. Remote Sens. Lett. 2021, 18, 489–493. [Google Scholar] [CrossRef]
  14. Yang, J.; Thompson, J.; Huang, X.; Jin, T.; Zhou, Z. Random-frequency SAR imaging based on compressed sensing. IEEE Trans. Geosci. Remote Sens. 2013, 51, 983–994. [Google Scholar] [CrossRef]
  15. Xu, G.; Zhang, B.; Yu, H.; Chen, J.; Xing, M.; Hong, W. Sparse Synthetic Aperture Radar Imaging from Compressed Sensing and Machine Learning: Theories, Applications and Trends. IEEE Geosci. Remote Sens. Mag. 2022, 10, 32–69. [Google Scholar] [CrossRef]
  16. Hoang, L.M.; Zhang, J.A.; Nguyen, D.N.; Huang, X.; Kekirigoda, A.; Hui, K.P. Suppression of Multiple Spatially Correlated Jammers. IEEE Trans. Veh. Technol. 2021, 70, 10489–10500. [Google Scholar] [CrossRef]
  17. Amin, M.; Zhan, L.; Lindsey, A. Subspace array processing for the suppression of FM jamming in GPS receivers. IEEE Trans. Aerosp. Electron. Syst. 2004, 40, 80–92. [Google Scholar] [CrossRef]
  18. Lan, L.; Xu, J.; Liao, G.; Zhu, S.; So, H.C. Mainlobe Deceptive Jammer Suppression in SF-RDA Radar: Joint Transmit-Receive Processing. IEEE Trans. Veh. Technol. 2022, 71, 12602–12616. [Google Scholar] [CrossRef]
  19. Zhang, X.; Ma, H.; Wang, J.; Zhou, S.; Liu, H. Game Theory Design for Deceptive Jamming Suppression in Polarization MIMO Radar. IEEE Access 2019, 7, 114191–114202. [Google Scholar] [CrossRef]
  20. Chang, S.; Deng, Y.; Zhang, Y.; Zhao, Q.; Wang, R.; Zhang, K. An Advanced Scheme for Range Ambiguity Suppression of Spaceborne SAR Based on Blind Source Separation. IEEE Trans. Geosci. Remote Sens. 2022, 60, 5230112. [Google Scholar] [CrossRef]
  21. Huang, P.; Dong, S.; Liu, X.; Jiang, X.; Liao, G.; Xu, H.; Sun, S. A Coherent integration method for moving target detection using frequency agile radar. IEEE Trans. Geosci. Remote Sens. Lett. 2019, 16, 206–210. [Google Scholar] [CrossRef]
  22. Quan, Y.; Wu, Y.; Li, Y.; Sun, G.C.; Xing, M.D. Range-Doppler reconstruction for frequency agile and PRF-jittering radar. IET Radar Sonar Navig. 2018, 12, 348–352. [Google Scholar] [CrossRef]
  23. Yang, X.; Zhang, Z.; Zeng, T.; Long, T.; Sarkar, T.K. Mainlobe interference suppression based on eigen-projection processing and covariance matrix reconstruction. IEEE Antennas Wirel. Propag. Lett. 2014, 13, 1369–1372. [Google Scholar] [CrossRef]
  24. Zheng, Z.; Zheng, Y.; Wang, W.; Zhang, H. Covariance matrix reconstruction with interference steering vector and power estimation for robust adaptive beamforming. IEEE Trans. Veh. Technol. 2018, 67, 8495–8503. [Google Scholar] [CrossRef]
  25. Qian, J.; He, Z. Mainlobe interference suppression with eigen-projection algorithm and similarity constraints. Electron. Lett. 2016, 52, 228–230. [Google Scholar] [CrossRef]
  26. Dai, H.; Wang, X.; Li, Y.; Liu, Y.; Xiao, S. Main-Lobe Jamming Suppression Method of using Spatial Polarization Characteristics of Antennas. IEEE Trans. Aerosp. Electron. Syst. 2012, 48, 2167–2179. [Google Scholar] [CrossRef]
  27. Sammartino, P.; Baker, C.; Griffiths, H. Frequency diverse MIMO techniques for radar. IEEE Trans. Aerosp. Electron. Syst. 2013, 49, 201–222. [Google Scholar] [CrossRef]
  28. Lan, L.; Liao, G.; Xu, J.; Xu, Y.; So, H.C. Beampattern Synthesis Based on Novel Receive Delay Array for Mainlobe Interference Mitigation. IEEE Trans. Antennas Propag. 2023, 71, 4470–4485. [Google Scholar] [CrossRef]
  29. Basit, A.; Wang, W.-Q.; Nusenu, S.Y. Adaptive Transmit Array Sidelobe Control Using FDA-MIMO for Tracking in Joint Radar-Communications. Digit. Signal Process. 2020, 97, 102619. [Google Scholar] [CrossRef]
  30. Zhang, Y.; Liao, G.; Lan, L.; Xu, J.; Zhang, X. Suppression of Mainlobe Jammers with Quadratic Element Pulse Coding in MIMO Radar. Remote Sens. 2023, 15, 3202. [Google Scholar] [CrossRef]
  31. Xu, J.; Zhu, S.; Liao, G. Range Ambiguous Clutter Suppression for Airborne FDA-STAP Radar. IEEE J. Sel. Top. Signal Process. 2015, 9, 1620–1631. [Google Scholar] [CrossRef]
  32. Xu, J.; Liao, G.; Zhu, S.; Huang, L.; So, H.C. Joint Range and Angle Estimation Using MIMO Radar with Frequency Diverse Array. IEEE Trans. Signal Process. 2015, 63, 3396–3410. [Google Scholar] [CrossRef]
  33. Wang, W.; So, H.; Farina, A. FDA-MIMO Signal Processing for Mainlobe Jammer Suppression. In Proceedings of the 2019 27th European Signal Processing Conference (EUSIPCO), A Coruna, Spain, 2–6 September 2019; pp. 1–5. [Google Scholar] [CrossRef]
  34. Wen, C.; Huang, Y.; Peng, J.; Wu, J.; Zheng, G.; Zhang, Y. Slow-time FDA-MIMO technique with application to STAP radar. IEEE Trans. Aerosp. Electron. Syst. 2022, 58, 74–95. [Google Scholar] [CrossRef]
  35. Gong, P.; Wang, W.-Q.; Li, F.; So, H.C. Sparsity-aware transmit beamspace design for FDA-MIMO radar. Signal Process. 2018, 144, 99–103. [Google Scholar] [CrossRef]
  36. Zhang, Y.; Liao, G.; Xu, J.; Lan, L. Mainlobe Deceptive Jammer Suppression Based on Quadratic Phase Coding in FDA-MIMO Radar. Remote Sens. 2022, 14, 5831. [Google Scholar] [CrossRef]
  37. Aubry, A.; De Maio, A.; Huang, Y. MIMO Radar Beampattern Design Via PSL/ISL Optimization. IEEE Trans. Signal Process. 2016, 64, 3955–3967. [Google Scholar] [CrossRef]
  38. Basit, A.; Wang, W.-Q.; Wali, S.; Nusenu, S.Y. Transmit beamspace design for FDA–MIMO radar with alternating direction method of multipliers. Signal Process. 2021, 180, 107832. [Google Scholar] [CrossRef]
  39. Xu, J.; Liao, G.; Zhu, S.; So, H.C. Deceptive jamming suppression with frequency diverse MIMO radar. Signal Process. 2015, 113, 9–17. [Google Scholar] [CrossRef]
  40. Xu, J.; Zhang, Y.; Liao, G.; So, H.C. Resolving Range Ambiguity via Multiple-Input Multiple-Output Radar With Element-Pulse Coding. IEEE Trans. Signal Process 2020, 68, 2770–2783. [Google Scholar] [CrossRef]
  41. Lan, L.; Liao, G.; Xu, J.; Zhang, Y.; Zhu, S. Mainlobe deceptive jammer suppression using element-pulse coding with MIMO radar. Signal Process. 2021, 182, 107955. [Google Scholar] [CrossRef]
  42. Wen, C.; Peng, J.; Zhou, Y.; Wu, J. Enhanced Three-Dimensional Joint Domain Localized STAP for Airborne FDA-MIMO Radar under Dense False-Target Jamming Scenario. IEEE Sens. J. 2018, 18, 4154–4166. [Google Scholar] [CrossRef]
  43. Zhao, Y.; Tian, B.; Wang, C.; Gong, J.; Tan, M. Robust adaptive beamforming via improved worst-case performance optimization algorithm based on FDA-MIMO. Multidimens. Syst. Signal Process. 2022, 33, 725–746. [Google Scholar] [CrossRef]
  44. Xu, J.; Liao, G.; Zhang, Y.; Ji, H.; Huang, L. An Adaptive Range-Angle-Doppler Processing Approach for FDA-MIMO Radar Using Three-Dimensional Localization. IEEE J. Sel. Top. Signal Process. 2016, 11, 309–320. [Google Scholar] [CrossRef]
  45. Lan, L.; Marino, A.; Aubry, A.; De Maio, A.; Liao, G.; Xu, J.; Zhang, Y. GLRT-Based Adaptive Target Detection in FDA-MIMO Radar. IEEE Trans. Aerosp. Electron. Syst. 2021, 57, 597–613. [Google Scholar] [CrossRef]
  46. Liu, Q.; Xu, J.; Ding, Z.; So, H.C. Target localization with jammer removal using frequency diverse array. IEEE Trans. Veh. Technol. 2020, 69, 11685–11696. [Google Scholar] [CrossRef]
  47. Lan, L.; Xu, J.; Liao, G.; Zhang, Y.; Fioranelli, F.; So, H.C. Suppression of Mainbeam Deceptive Jammer with FDA-MIMO Radar. IEEE Trans. Veh. Technol. 2020, 69, 11584–11598. [Google Scholar] [CrossRef]
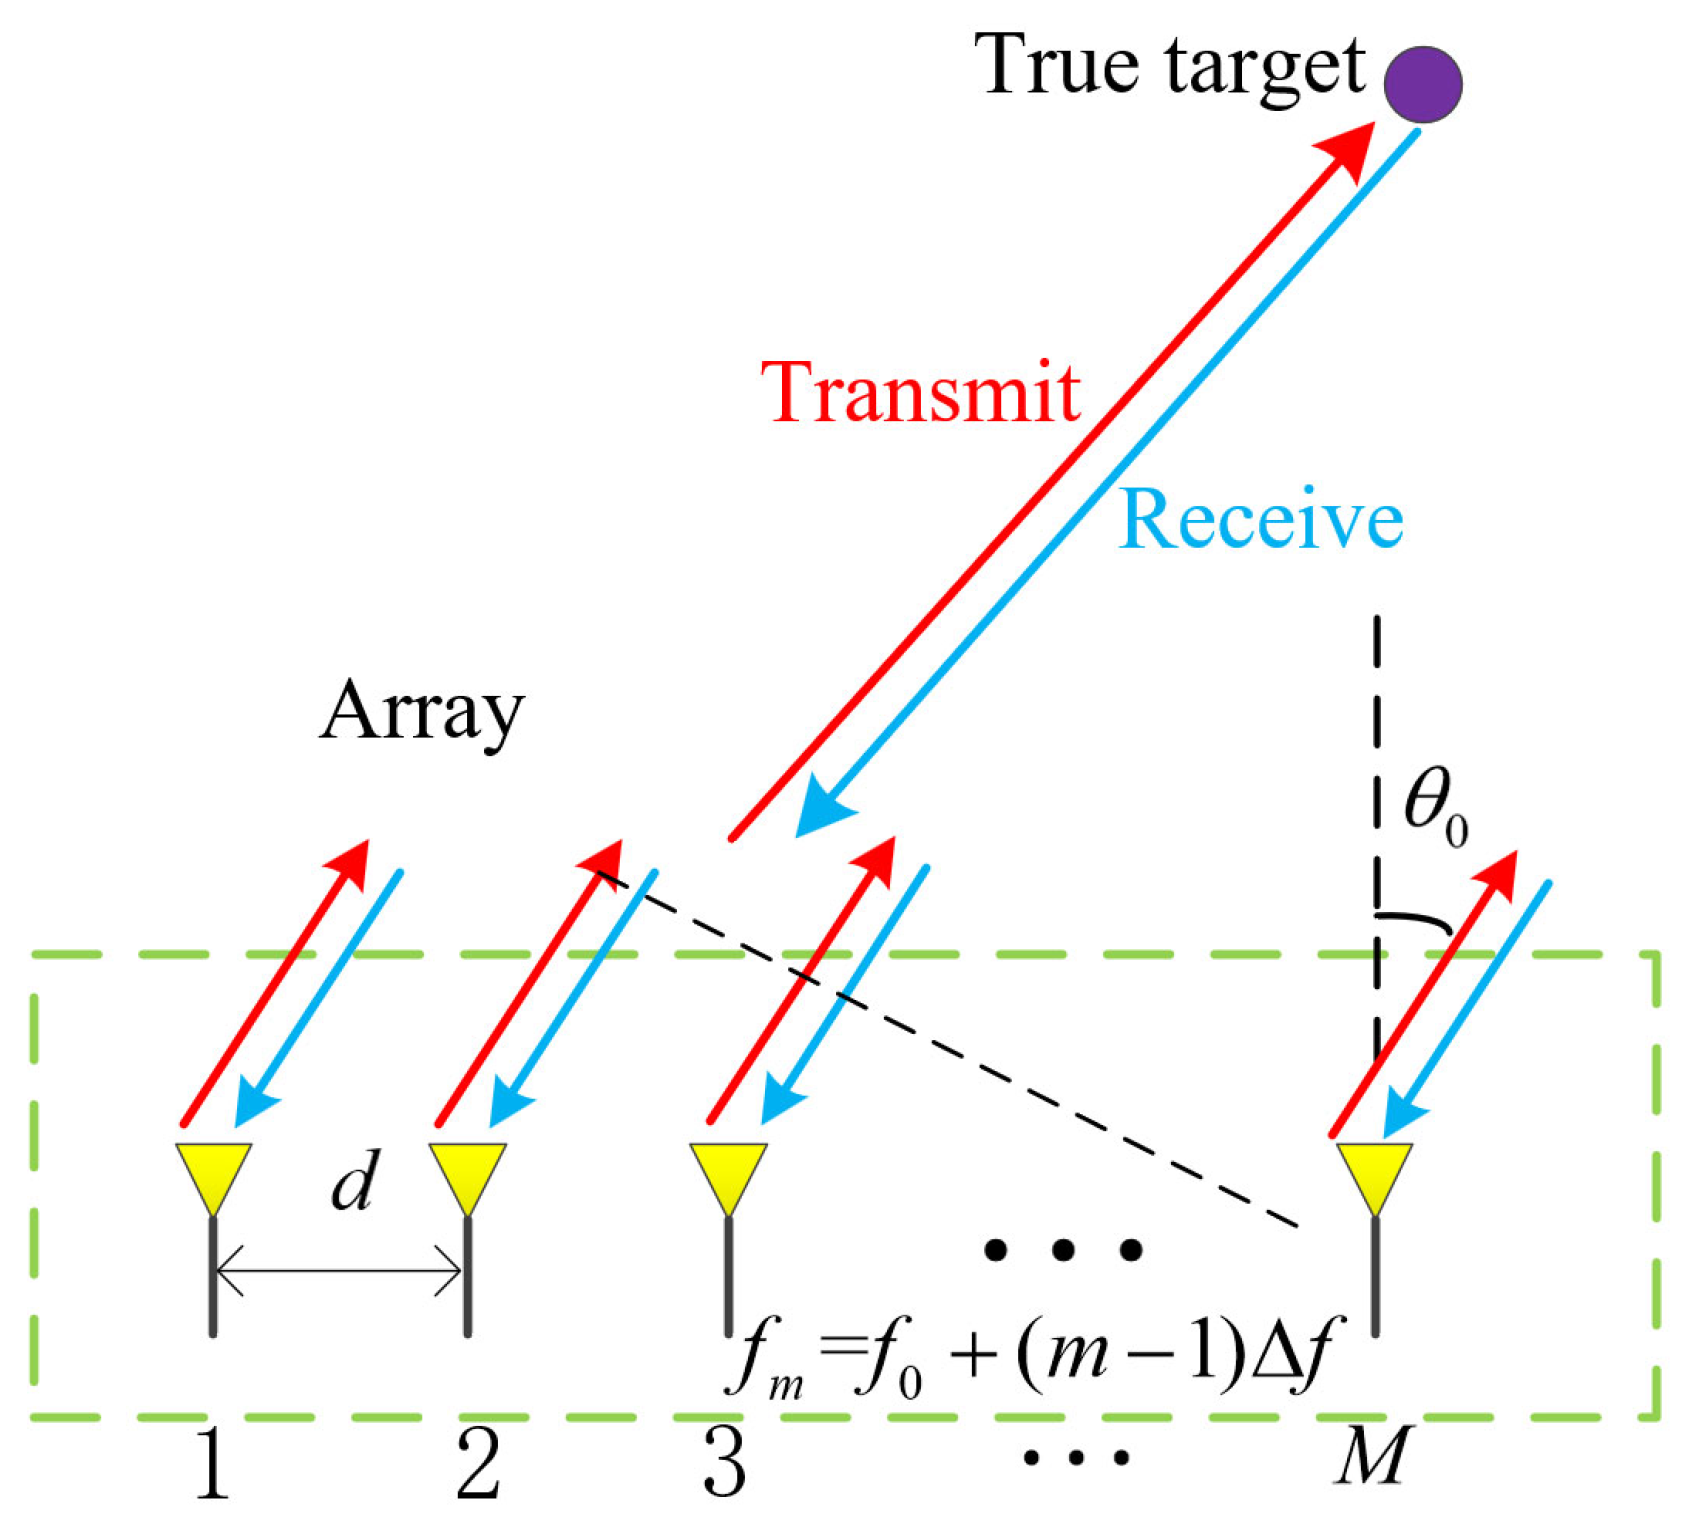
Figure 1. Signal model of QPC–FDA-MIMO system.
Remotesensing 15 04711 g001
Figure 2. Illumination of QPC technique in FDA-MIMO radar.
Remotesensing 15 04711 g002
Figure 3. Signal processing chain in QPC–FDA-MIMO radar.
Remotesensing 15 04711 g003
Figure 4. Schematic diagram of the false-target generation.
Remotesensing 15 04711 g004
Figure 5. Schematic diagram of the false targets’ generation.
Remotesensing 15 04711 g005
Figure 6. Illustration of spectrum distribution in the joint Doppler receive domain. (a) Before Doppler compensation. (b) After Doppler compensation.
Remotesensing 15 04711 g006
Figure 7. Illustration of spectrum distribution in the joint transmit–receive spatial domain. (a) Without compensation. (b) Processed via the secondary compensation.
Remotesensing 15 04711 g007
Figure 8. Spectrum distribution in QPC–FDA-MIMO radar. (a) Three-dimensional transmit–receive plot. (b) Two-dimensional transmit–receive plot. (c) Two-dimensional range–Doppler plot.
Remotesensing 15 04711 g008
Figure 9. Capon spectrum distribution. (a) After first compensation in QPC–FDA-MIMO. (b) After twice compensation in QPC–FDA-MIMO. (c) FDA-MIMO.
Remotesensing 15 04711 g009
Figure 10. Comparison in data-dependent beampatterns. (a) QPC–FDA-MIMO. (b) FDA-MIMO.
Remotesensing 15 04711 g010
Figure 11. Outputs of adaptive filtering. (a) After Doppler compensation. (b) After receive spatial frequency compensation.
Remotesensing 15 04711 g011aRemotesensing 15 04711 g011b
Figure 12. Comparison of output SINR in different methods.
Remotesensing 15 04711 g012
Figure 13. Processing flow chart in QPC–FDA-MIMO.
Remotesensing 15 04711 g013
Table 1. Parameters of QPC–FDA-MIMO system.
True TargetFT 1FT 2FT 3FT 4FT 5FT 6
Angle (°)0000000
Range(km)911.2513.549.56374.2587.75
Range bin200250300100400150450
Time delay (ms)00.0150.030.270.360.4350.525
Velocity (m/s)10101010101010
SNR (dB)20\\\\\\
JNR (dB)\202520252525
Delayed pulse0002233
Disclaimer/Publisher’s Note: The statements, opinions and data contained in all publications are solely those of the individual author(s) and contributor(s) and not of MDPI and/or the editor(s). MDPI and/or the editor(s) disclaim responsibility for any injury to people or property resulting from any ideas, methods, instructions or products referred to in the content.