Article

Black Carbon in a City of the Atacama Desert before and after the Start of the COVID-19 Lockdown: Ground Measurements and MERRA-2 Reanalysis

by
Rafael N. Liñán-Abanto
1,*,
William Patrick Arnott
2,
Guadalupe Paredes-Miranda
2,
Omar Ramos-Pérez
3,
Dara Salcedo
4,
Hugo Torres-Muro
1,
Rosa M. Liñán-Abanto
5 and
Giovanni Carabali
6
1
Departamento de Física, Facultad de Ciencias, Universidad Nacional Jorge Basadre Grohmann, Av. Miraflores s/n, Tacna 230003, Peru
2
Department of Physics, University of Nevada, 1664 N. Virginia Street, Reno, NV 89557, USA
3
Instituto de Ciencias de la Atmósfera y Cambio Climático, Universidad Nacional Autónoma de México (UNAM), Circuito Exterior s/n, Ciudad Universitaria, Ciudad de Mexico 04510, Mexico
4
Unidad Multidisciplinaria de Docencia e Investigación Juriquilla, Facultad de Ciencias, Universidad Nacional Autónoma de México, Boulevard Juriquilla 3001, Col. Juriquilla, Querétaro 76230, Mexico
5
Departamento de Biología, Facultad de Ciencias, Universidad Nacional Jorge Basadre Grohmann, Av. Miraflores s/n, Tacna 230003, Peru
6
Instituto de Geofísica, Universidad Nacional Autónoma de México (UNAM), Circuito Exterior s/n, Ciudad Universitaria, Ciudad de Mexico 04510, Mexico
*
Author to whom correspondence should be addressed.
Remote Sens. 2023, 15(19), 4702; https://doi.org/10.3390/rs15194702
Submission received: 31 July 2023 / Revised: 11 September 2023 / Accepted: 19 September 2023 / Published: 26 September 2023

Abstract

:
In this study, the temporal variations of black carbon (BC) were analyzed from November 2019 to September 2021, in Tacna, Peru. Ground measurements obtained with a photoacoustic extinctiometer (PAX BC) and NASA’s MERRA-2 reanalysis data (MERRA-2 BC) were used. The seasonal concentrations of PAX BC (mean ± standard deviation) were as follows: 0.70 ± 0.35, 0.73 ± 0.46, 0.70 ± 0.39, and 0.85 ± 0.46 µg m−3, for spring, summer, autumn, and winter, respectively; while MERRA-2 BC values were 0.12 ± 0.11, 0.06 ± 0.02, 0.06 ± 0.02, and 0.11 ± 0.06 µg m−3, for the same seasons. We found a large discrepancy between these two techniques, as the PAX BC measurements were an order of magnitude higher than the MERRA-2 BC values. In addition, MERRA-2 did not record urban pollution events and did not present the BC weekend effect. The most frequent wind direction (81%) was from the southwest and the sources of greatest contamination were located to the northeast and southeast. The Mann–Kendall test confirmed a downward trend in PAX BC one week (37%) and two weeks (30%) after the start of the COVID-19 lockdown, and no trend in MERRA-2 BC. These results suggest that MERRA-2 underestimates the BC emissions from local sources.

1. Introduction

Black carbon (BC) is a type of carbonaceous aerosol that is formed mainly in flames, is directly emitted to the atmosphere, and strongly absorbs visible light [1,2,3]. It is considered to be responsible for up to 90% of the total aerosol absorption [4,5], even though its mass fraction usually represents from 5 to 15% of the total mass of particulate matter (PM) in urban areas [6,7,8,9]. BC is produced by the incomplete combustion of fossil fuels, biofuels, and biomass [3,10,11,12], and exists as an aggregate of small carbon spheres formed in flames that rapidly coagulate [1,3]. Due to the high capacity to absorb solar radiation and warming the atmosphere, BC plays an important role in climate change by exerting a positive radiative forcing, even though the forcing from the carbonaceous aerosol as a whole is negative [1,3,13,14] and is the second most crucial anthropogenic climate forcer [15]. Furthermore, BC can directly or indirectly affect the formation of cloud condensation nuclei (CCN) and ice cores, thus influencing the albedo of snow and clouds [2,3,14]. BC’s lifetime is approximately 5.5 days ± 35% (median ± 1 standard deviation) and can be removed from the atmosphere through wet or dry deposition [1,16]. The regional climatic effects of the BC could influence the rainfall distribution, despite having a low chemical reactivity in the atmosphere [2]; moreover, air pollution has been considered a hazard to human health.
Various studies have shown that the size, chemical composition, and surface area of PM determines its potential to cause inflammatory lesions, oxidative damage, and other biological effects [17,18,19,20,21,22]. These studies show that the smaller the size of PM, the greater the toxicity because they can penetrate deeper into the airways of the respiratory tract until and can reach the alveoli, in which 50% are retained [18,20,22,23]. Diesel exhaust particulates (DEP), of which BC is relevant, are considered to be responsible for a large part of the harmful effects of the PM associated with traffic. BC is a more suitable surrogate for DEP exposures than PM, given its association with the volume of diesel traffic [19,24,25,26]. BC is likely to increase oxidative stress in the airways [19,24,25].
Ground-based measurements, numerical simulation, and reanalysis data are the three main methods to obtain the BC concentration in the atmosphere [2,27]. The BC surface concentrations are estimated from direct aerosol light absorption measurements, with photoacoustic and extinction-minus-scattering techniques being the most recommended [4,16]. The integration of in situ and satellite measurements of atmospheric gases and aerosols into numerical simulations of atmospheric chemical transport models (GEOS Chem; WRF Chem) offers the opportunity to generate better forecasts and descriptions of the diffusion, transmission, and transformation of pollutants in the air [2,28]. Satellite monitoring can acquire the BC concentration from aerosol optical depth (AOD) using remote sensing inversion technology [2,29]. Reanalysis is the process in which a data assimilation system is used to reprocess the observations. The process relies on a forecast model to combine disparate observations in a physically consistent way, allowing the production of gridded datasets for various variables [30,31]. Reanalysis products are increasingly used for atmospheric research, climate monitoring, and commercial applications [30]. For example, MERRA-2 is NASA’s reanalysis, which assimilates satellite measurements to make its data more accessible [2]. MERRA-2 simulates the following five types of aerosols: sulfate, dust, sea salt, BC, and organic carbon (OC). The MERRA-2 BC product (BC simulated by MERRA-2 reanalysis) has been used, among other countries, in China [2,27,32], India [33], and Russia [34,35,36]. Likewise, several studies around the world have compared the AOD and absorption AOD (AAOD) from the MERRA-2 reanalysis with ground-based measurements from the Aerosol Robotic Network (AERONET) and found that MERRA-2 underestimates ground measurements [37,38,39]. This suggests that MERRA-2 BC reanalysis need long-term validation and quality ground data to improve their inputs, parameterizations, and physical processes at regional and local scales [37].
BC is a refractory and water-insoluble material that is rapidly removed from the atmosphere by deposition; its short-life favors that its atmospheric abundance responds to the emissions. Reducing BC emissions represents a potential mitigation strategy that could reduce global climate change from anthropogenic activities in the near term, so it might be more economically feasible to control BC particles than CO2 [3,40]. In recent years, research on BC has increased in cities of South American countries, such as Brazil [41,42], Colombia [43], and Chile [44,45]; however, studies of BC observations and their comparison with global models in Peruvian cities have yet to be reported. In this context, we began to measure BC in Tacna, Peru, from November 2019, a few months before the start of the lockdown due to the COVID-19 pandemic, to September 2021, which allowed us to compare the concentration of BC under normal mobility conditions and periods of restricted mobility.
In this study, we analyze the temporal variation in BC and the location of its sources in a city in the Atacama Desert (Tacna, Peru) from November 2019 to September 2021 through measurements of BC with a photoacoustic extinctiometer (PAX) and BC data obtained from NASA reanalysis (MERRA-2). Given the low confidence in quantifying the current atmospheric distribution of the individual components of carbonaceous aerosols due to the lack of observations at the global level and the great dispersion in their global charge balance with the simulations [1]. The present investigation contributes to long-term observations of BC concentrations (the most important component of carbonaceous aerosols) in a part of the earth where studies of the BC temporal variations (annual, seasonal, and monthly) are limited. In this paper, we compare the BC ground-based measurements and MERRA-2 reanalysis data. We also analyze the probable causes of the similarities and/or differences between these two techniques to obtain the BC concentration. The objectives of the work were as follows: (1) identify and compare BC patterns due to in situ measurements and MERRA-2 reanalysis; (2) validate the applicability and accuracy of the MERRA-2 BC with BC observations. The results of this research can serve as a reference for the global MERRA-2 model to improve its inputs, parameterizations, and physical processes for this part of the world. In addition, it serves as a reference for the effective control of air pollutant emissions in Tacna, Peru, and thus improves the quality of its urban air.

2. Materials and Methods

2.1. Measurement Site

The Tacna region is located in the extreme south of the Republic of Peru, bordered by Chile to the south and Bolivia to the northeast. This region has four provinces (Tacna, Jorge Basadre, Candarave, and Tarata). The city of Tacna is located in the coastal strip between the coast and 2500 m above sea level (m.a.s.l), where an arid (with little humidity throughout the year) and temperate climate predominates. According to the Thornthwaite methodology, officially used in Peru, this type of climate is called E(d) B’ [46]. In addition, it is the most arid area on the Peruvian coast and corresponds to the head of the Atacama Desert, which is characterized by the scarcity of water resources [47].
The city of Tacna is the capital of the region and province of Tacna. It has a population of 346,192 inhabitants as of June 2020 [48]. Tacna is located ∼55 km north of the port of Arica, Chile and ∼120 km southeast of the port of Ilo, one of the most significant point sources of sulfur dioxide in the world due to the large copper smelter located in this port [49]. The Pucamarca (gold) and Toquepala (copper) mines are located ∼51 km northeast and ∼95 km northwest of Tacna, respectively (see Figure 1).
The area of Tacna, Arica, Ilo and the surrounding Atacama Desert is one of the driest on Earth, with extremely low annual rainfall, on average less than 2 mm year−1. The climate of the Atacama Desert is controlled by the Hadley circulation, which significantly reduces convection (and precipitation); and the Peruvian Cold Current (Humboldt Current), which inhibits the moisture capacity of onshore winds by creating a persistent inversion that traps any moisture from the Pacific below 1000 m.a.s.l [50]. The hyper-arid core of the desert receives less than 2 mm year−1 of precipitation. In contrast, most of the Peruvian coast and the central coasts of northern Chile are adjacent to one of the world’s largest and seasonally persistent stratocumulus cloud fields [51,52].
The measurement site was located at the Laboratorio de Fisica de la Atmosfera y Calidad del Aire–LAFACA (Laboratory of Physics of the Atmosphere and Air Quality), which operates on the top floor of the Faculty of Sciences building, located inside the campus of the Jorge Basadre Grohmann National University (UNJBG), in Tacna, Peru, at 530 m.a.s.l., latitude 18.02°S and longitude 70.25°W (Figure 1). The campus is located within a residential area without industrial activity, with bordering avenues to the south, west, and north, with a small street to the east, so there is a constant flow of buses and private cars. Two gas stations are nearby, one ∼250 m to the south and the other ∼300 m to the southwest.

2.2. Measuring Instruments

2.2.1. The Photoacoustic Extinctiometer (PAX)

BC surface observations were obtained with a photoacoustic extinctiometer (PAX). The PAX (Droplet Measurement Technologies, Boulder, CO, USA) works with a laser diode with a wavelength of 870 nm and is modulated at 1500 Hz. It extracts ambient air at a flow rate of 1 L min−1 employing an internal vacuum pump controlled by two critical ports. PAX uses the photoacoustic technique to directly measure the aerosol absorption coefficient (Babs). A detailed discussion of the photoacoustic extinctiometer and photoacoustic technique can be found in Retama et al. (2015) [53], Paredes-Miranda et al. (2009) [54], and Arnott et al. (1999) [55]. Ground-based BC mass concentration (PAX BC) is obtained by dividing the Babs measurements by the specific mass absorption cross section (MAC). In the present study, we consider the standard MAC value of 4.74 m2 g−1, obtained from the MAC value of 7.75 m2 g−1 at 532 nm, and using the inverse relationship of the wavelength to the MAC, recommended by Bond and Bergstrom (2006) [56]. The 870 nm wavelength version of PAX is specific for BC particles, since the absorption of gases and other non-BC aerosol species is relatively low at this wavelength.
PAX BC surface concentrations were collected at the measurement site LAFACA inside the campus of the UNJBG, from November 2019 to September 2021, with a time resolution of one minute. The inlet was located at a height of approximately 14 m above ground level (m.a.g.l).

2.2.2. The MERRA-2 BC Reanalysis

The Modern-Era Retrospective Analysis for Research and Applications, version 2 (MERRA-2), is the new atmospheric reanalysis produced by NASA’s Global Modeling and Assimilation Office (GMAO) for the satellite era (1980 onward) [30,57,58]. MERRA-2 using the GEOS-5 (Goddard Earth Observing System, version 5) atmospheric model, Earth system model and Data Assimilation System version 5.12.4, and the three-dimensional variational data analysis (3DVAR) grid-point statistical interpolation (GSI) analysis system [57,58]. Aerosols in MERRA-2 are simulated with a radiatively coupled version of the GEO-5 model to the Goddard Chemistry Aerosol Radiation and Transport (GOCART) aerosol module [57,58]. The GOCART includes the sources, sinks, and chemistry of the following five types of aerosols: dust, sea salt, BC, organic carbon (OC), and sulfate (SO4). An overview of the MERRA-2 modeling system with more aerosol-specific details can be found in Gelaro et al. (2017) [30], Randles et al. (2017) [57], and Buchard et al. (2017) [58].
The resolution of the GEOS-5 model is approximately 50 km with 72 hybrid layers, from the surface to 0.01 hPa (80 km). At the same time, most products are stored on a standard grid 0.5° × 0.625° latitude by longitude [57]. In our study, MERRA-2 grid represented an area of ~50 × ~50 km and is delimited by coordinates 18.0–18.5°S and 70.000–70.625°W. To obtain an idea of the magnitude of this measurement, the area of the entire city of Tacna is much smaller than the grid area. Therefore, the MERRA-2 data should be carefully chosen when used as a proxy for ground-based measurements, when these are not available. In addition, the 1-hourly, 3-hourly, and monthly MERRA-2 products can be accessed through the NASA website (https://gmao.gsfc.nasa.gov/reanalysis/MERRA-2/data_access/, accessed on 31 October 2022). For this study, BC values from the MERRA-2 reanalysis (MERRA-2 BC) were obtained with a temporal resolution of one hour and at single-level.

2.2.3. Meteorological Variables

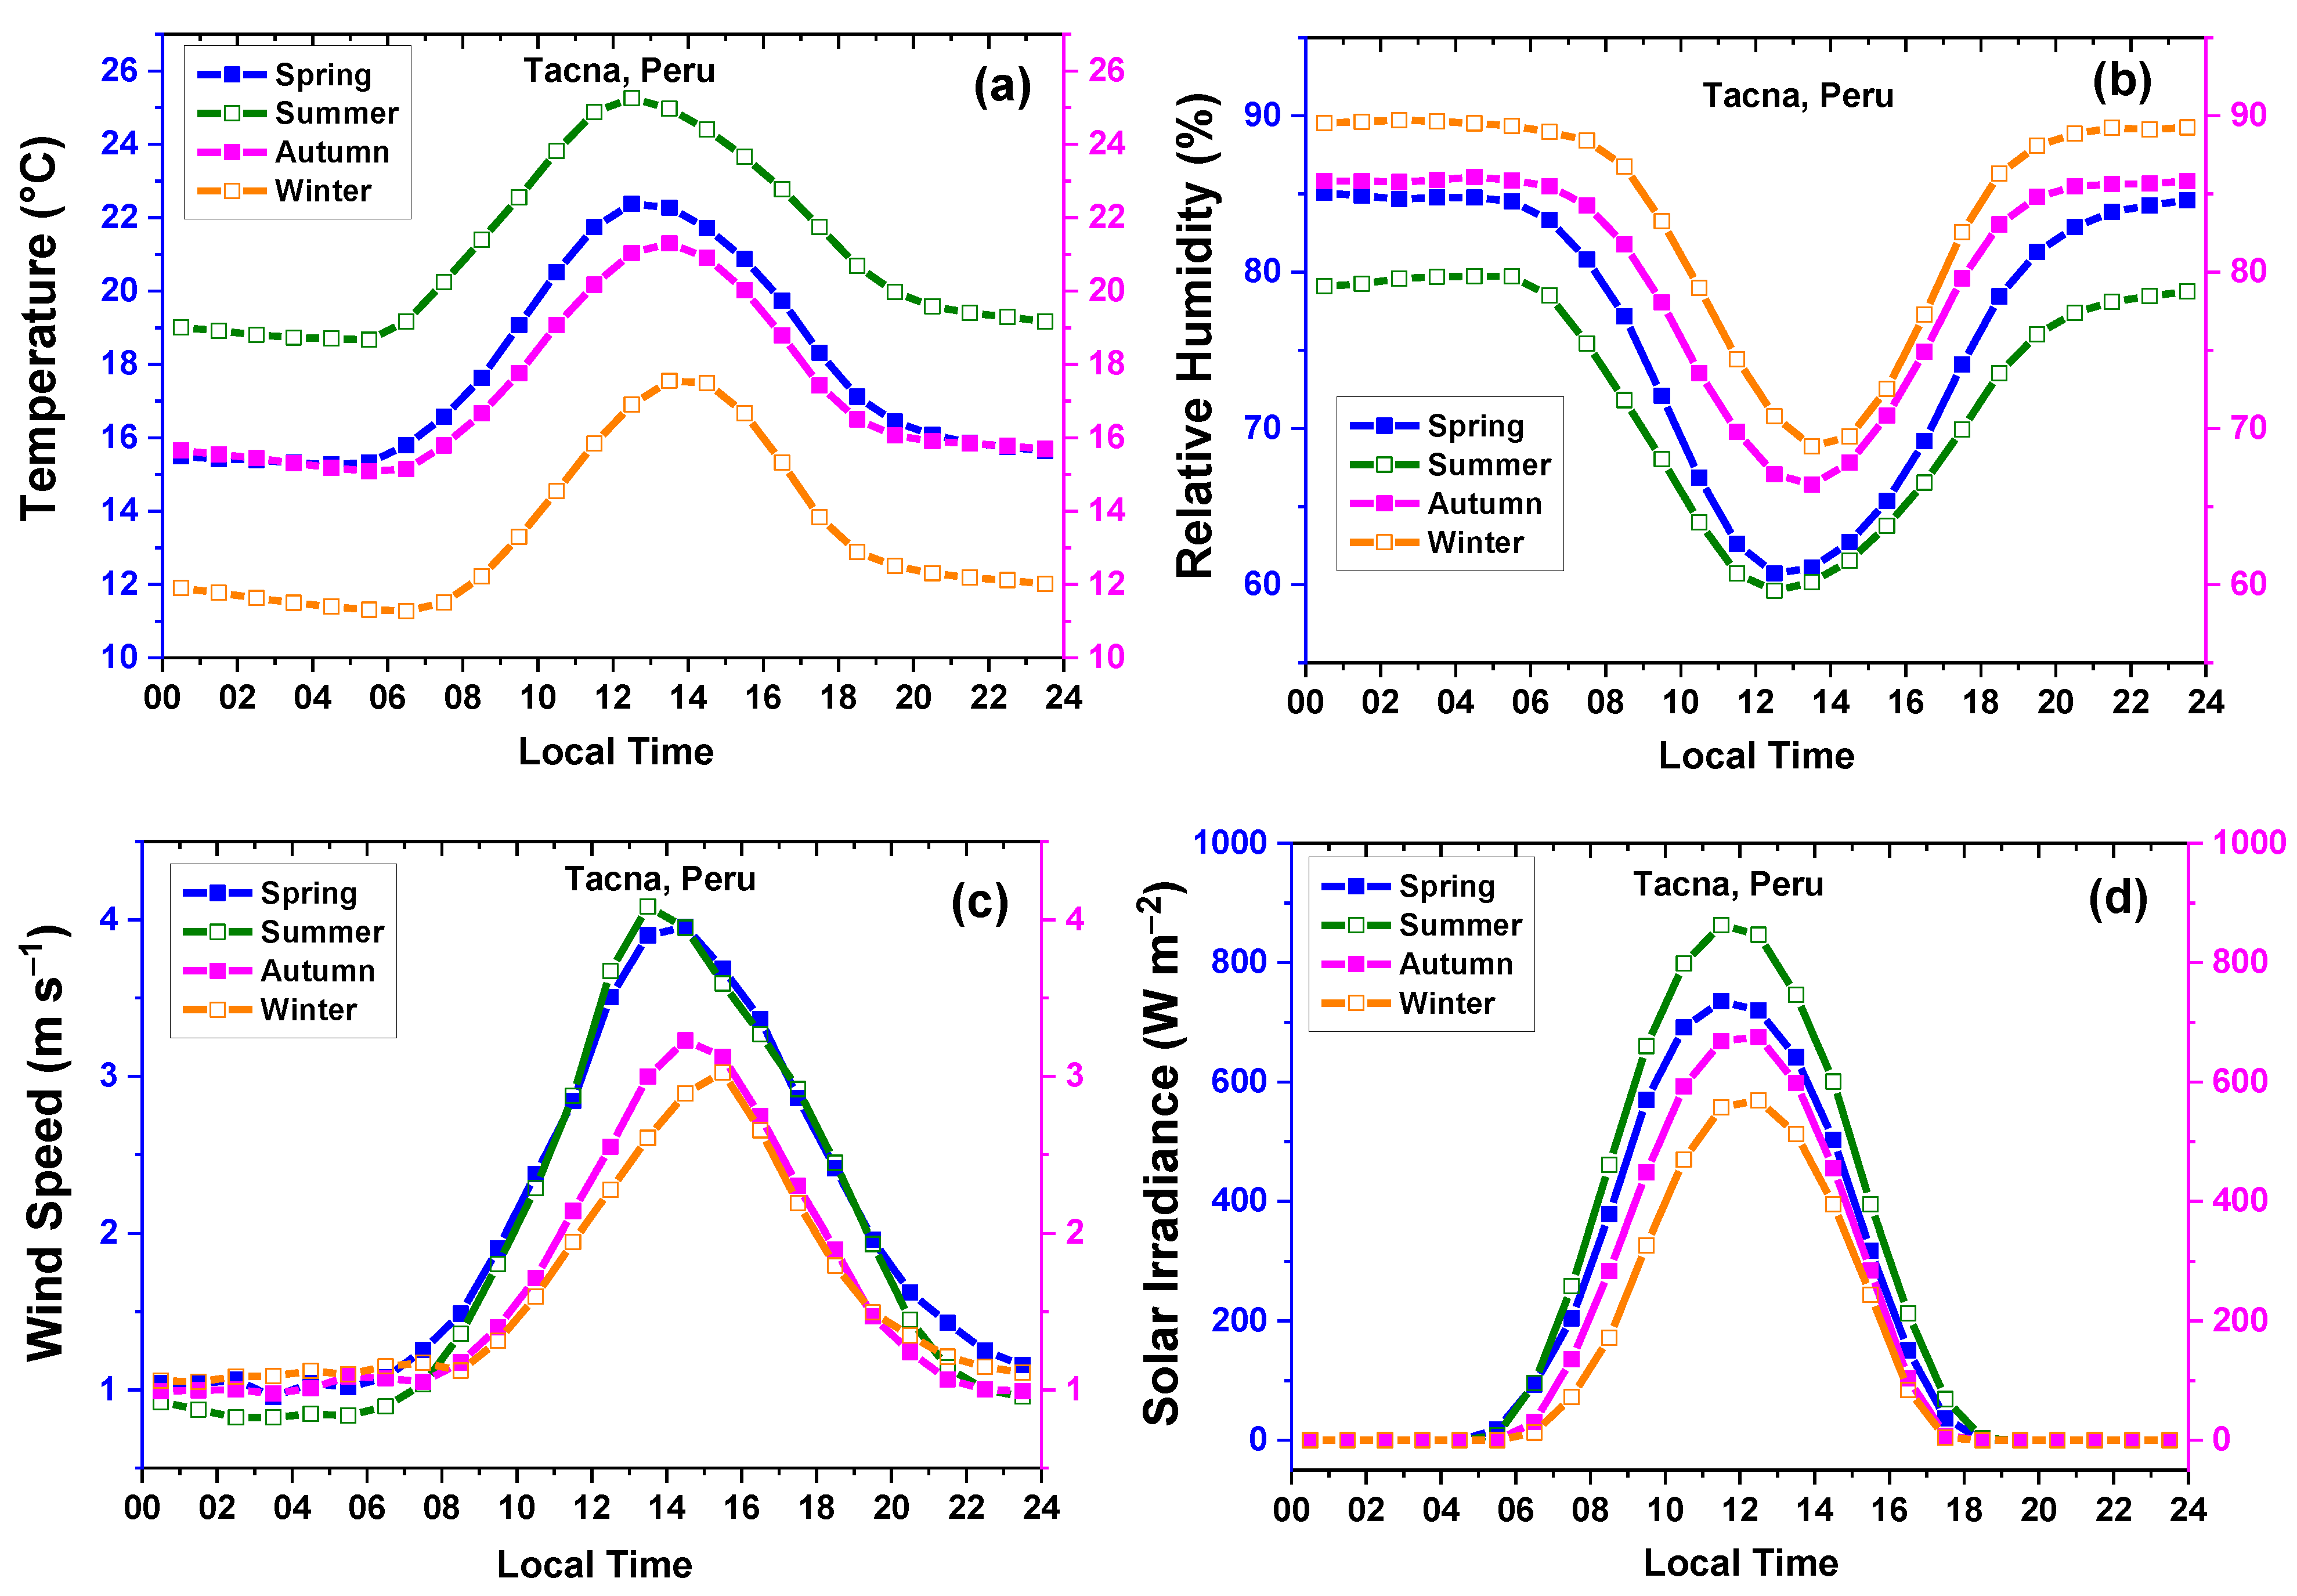
The meteorological variables (temperature, relative humidity, wind speed, solar radiation, and precipitation) were obtained from a Davis Meteorological Station that works at the LAFACA measurement site, from November 2019 to September 2021, with a temporal resolution of one minute. The sensors for these meteorological variables were located on the roof of the measurement site, approximately at 15 m.a.g.l. The values of the meteorological variables were recorded with a temporal resolution of one minute. These data are shown in Figure 2 and Figure 3, and Table 1.

2.2.4. HYSPLIT Model

The Hybrid Single-Particle Lagrangian Integrated Trajectory (HYSPLIT) model developed by the National Oceanic and Atmospheric Administration (NOAA), is one of the most widely used for atmospheric trajectory and dispersion calculations. Although the HYSPLIT calculates the backward air mass trajectories ending at the measuring site, it is designed to support a wide range of simulations. The meteorological dataset used for modeling is generated from the Global Data Assimilation System (GDAS) archive maintained by the Air Resources Laboratory (ARL), by running four times per day and has a 1° × 1° spatial resolution [59,60,61]. In addition, HYSPLIT model estimates the top of the boundary layer by the height at which the potential temperature first exceeds the ground temperature by 2 Kelvin (K) [62].
In order to identify the origin of the BC source regions and possible subsidence, the air masses arriving in Tacna at 10:00 UTC (Local Time: UTC–5:00) and the path followed by the HYSPLIT backward trajectories were analyzed, 24 h before reaching our site measurement. The arrival heights established for this evaluation were as follows: 100, 1000, and 2000 m above ground level.
We used hourly averages of PAX BC, MERRA-2 BC, HYSPLIT back-trajectories, and meteorological variables for statistical analysis and graphics. Data were grouped into the following four climatic seasons: spring (September–December); summer (December–March); autumn (March–June); and winter (June–September).

3. Results and Discussion

In order to provide a concise and precise description of the experimental results and their interpretation, we have divided this section into the following subheadings:

3.1. Meteorological Measurements

3.1.1. Time Series of Precipitation

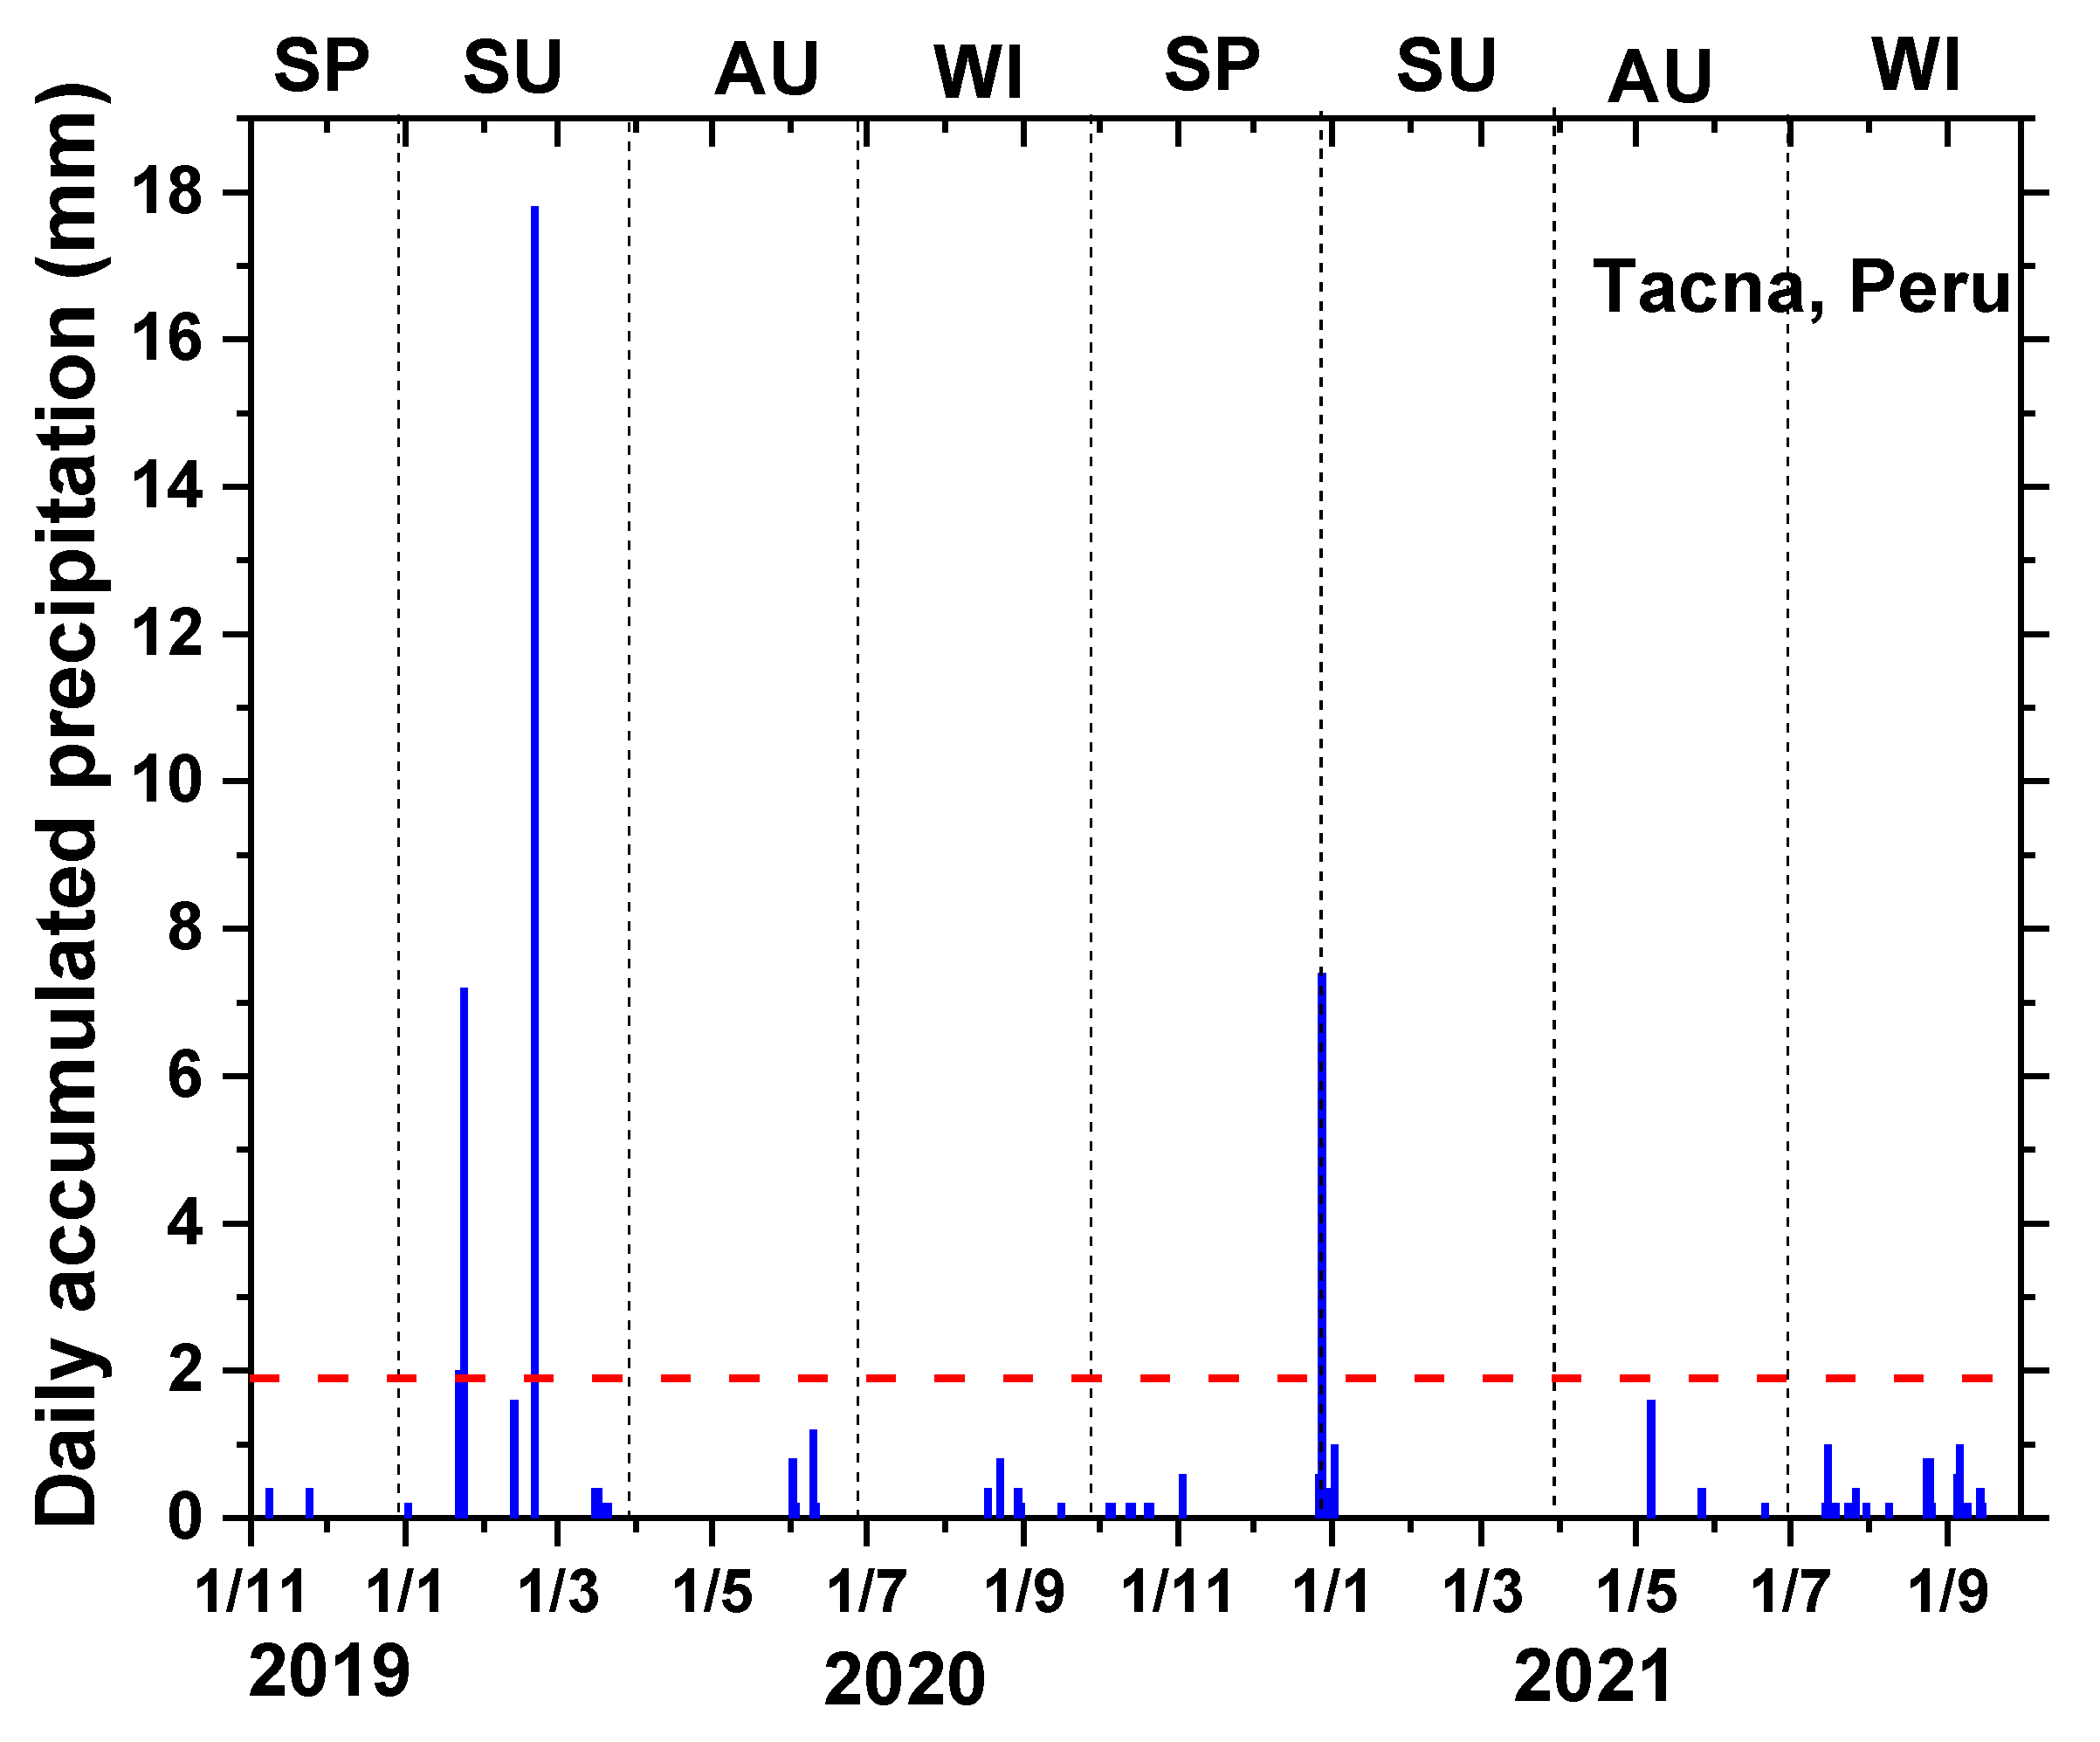
Figure 2 shows the time series of the accumulated daily precipitation during the entire period in the city of Tacna. It can be clearly distinguished that the accumulated daily precipitation does not exceed 2 mm of water during the entire study period, except for three days during 2020. In this year, there were cumulative daily precipitation events of up to 18 mm (21 February 2020). These rain events are atypical in Tacna, Peru. The precipitation event on 21 February activated a huaico (Quechua word that means landslide of masses of mud that devastate everything in its path), which even reached the urban area of the city of Tacna, causing the death of three people. This event was repeated after 93 years, another similar fact occurred on 27 February 1927 [63].

3.1.2. Seasonal and Diurnal Variation in Meteorological Variables

Table 1 shows the average values and standard deviations of temperature, relative humidity, wind speed, and solar irradiance in the city of Tacna, Peru, for the four seasons throughout our study period. The highest temperature was observed in the summer and the lowest in the winter; the temperatures during the spring and autumn were very similar, higher than those in the winter and lower than in the summer. In the spring 2019, a temperature of 19.04 °C was observed, approximately 3 °C higher than the temperature of the same season during 2020, this could be because this study covered only the last four weeks of spring 2019. In contrast, a higher relative humidity was observed in the winter and a lower one in the summer. The wind speed was higher during the spring and lower in the winter (its seasonal effects on BC concentration are analyzed in Section 3.5). Solar irradiance was higher in the summer and lower in the winter.
Figure 3 shows the daily patterns of temperature, relative humidity, wind speed, and solar irradiance in the city of Tacna, Perú, for the four seasons of the entire study period. In all seasons, the diurnal variations of temperature (Figure 3a) were similar. They present a maximum between 12:00–13:00 LT (spring and summer) and 13:00–14:00 LT (autumn and winter). The daily cycles of relative humidity (Figure 3b) presented a notable minimum between 12:00–13:00 LT (spring and summer) and 13:00–14:00 LT (autumn and winter), which was consistent with the inverse correlation between temperature and relative humidity. The diurnal wind speed cycles (Figure 3c), in all seasons, exhibit a peak between 13:00 and 16:00 LT. During the night, the wind speed values are around 1 m s−1, and in peak hours it reaches values of approximately 4 m s−1 in the spring and summer seasons, while in the autumn and winter, they were around 3 m s−1. The daily cycles of solar irradiance (Figure 3d) in the four seasons were similar with values of 0 W m−2 during the hours without sunlight and with a peak around noon. The highest peak is reached in the summer with a value close to 900 W m−2, while the lowest was in the winter with an approximate value of 600 W m−2.

3.2. Temporal Variations of BC

3.2.1. BC Time Series

The statistics of the mass concentration of BC on the surface (PAX BC), together with that obtained by the MERRA-2 reanalysis (MERRA-2 BC), are shown in Table 2. Figure 4 shows the time series of the daily averages of PAX BC (Figure 4a) and MERRA-2 BC (Figure 4b) in Tacna during the entire period of study (26 November 2019, to 12 September 2021). Figure 4a highlights the following two highest average values of PAX BC: 2.84 and 2.27 μg m−3 for 30 June 2021, and 1 January 2020, respectively. Similarly, Figure 4b highlights the following two days with the highest average value of MERRA-2 BC: 1.05 and 0.38 μg m−3 for 7 November and 15 September 2020, respectively. Figure 4 also shows that July (2020 and 2021) presented the highest PAX BC values, while the highest MERRA-2 BC values occurred between August (winter) and November (spring).
The daily PAX BC mean concentrations were an order of magnitude higher than the daily mean MERRA-2 BC values; even the PAX BC background values were higher than the BC MERRA-2 daily averages in Tacna, Peru. To explain this discrepancy between BC PAX and BC MERRA-2 concentrations throughout the study period, it is necessary to consider that the model results highly depend on the input data [58]. Ansari and Ramachandran [37] found that to reduce the differences between models and observations, the treatment (inventory of emissions, atmospheric transport, and removal mechanisms) of absorbing carbonaceous aerosols in MERRA-2 is crucial. Reanalysis data have the advantage of providing global coverage and long-term aerosol observations. However, they also have problems such as overestimating or underestimating their results due to cloud contamination, aerosol recovery uncertainties, and sensor-specific data gaps [27,58,64]. Specifically, this large discrepancy could be because of the fact that the MERRA-2 reanalysis uses observations from suburban and rural sites as input data since aerosol concentrations (PM2.5) in urban areas generally tend to be higher and less uniform than in suburban and rural areas, making urban observations unrepresentative of the mean grid values used by MERRA-2 in Tacna city [58,64,65]. When comparing in the western United States the observations of the EPA-AQS (Environmental Protection Agency-Air Quality System) and IMPROVE (Interagency Monitoring of Protected Visual Environment) networks with the MERRAero reanalysis (pre-MERRA-2 version), Buchard et al. (2016) [64] found that surface PM2.5 best-matched measurements from the IMPROVE network, which is essentially composed of rural stations. The emissions inventories used in these models are based on country emissions reports and satellite observations, and the uncertainties in the estimated emissions could be substantial, especially in countries experiencing rapid economic change [66].
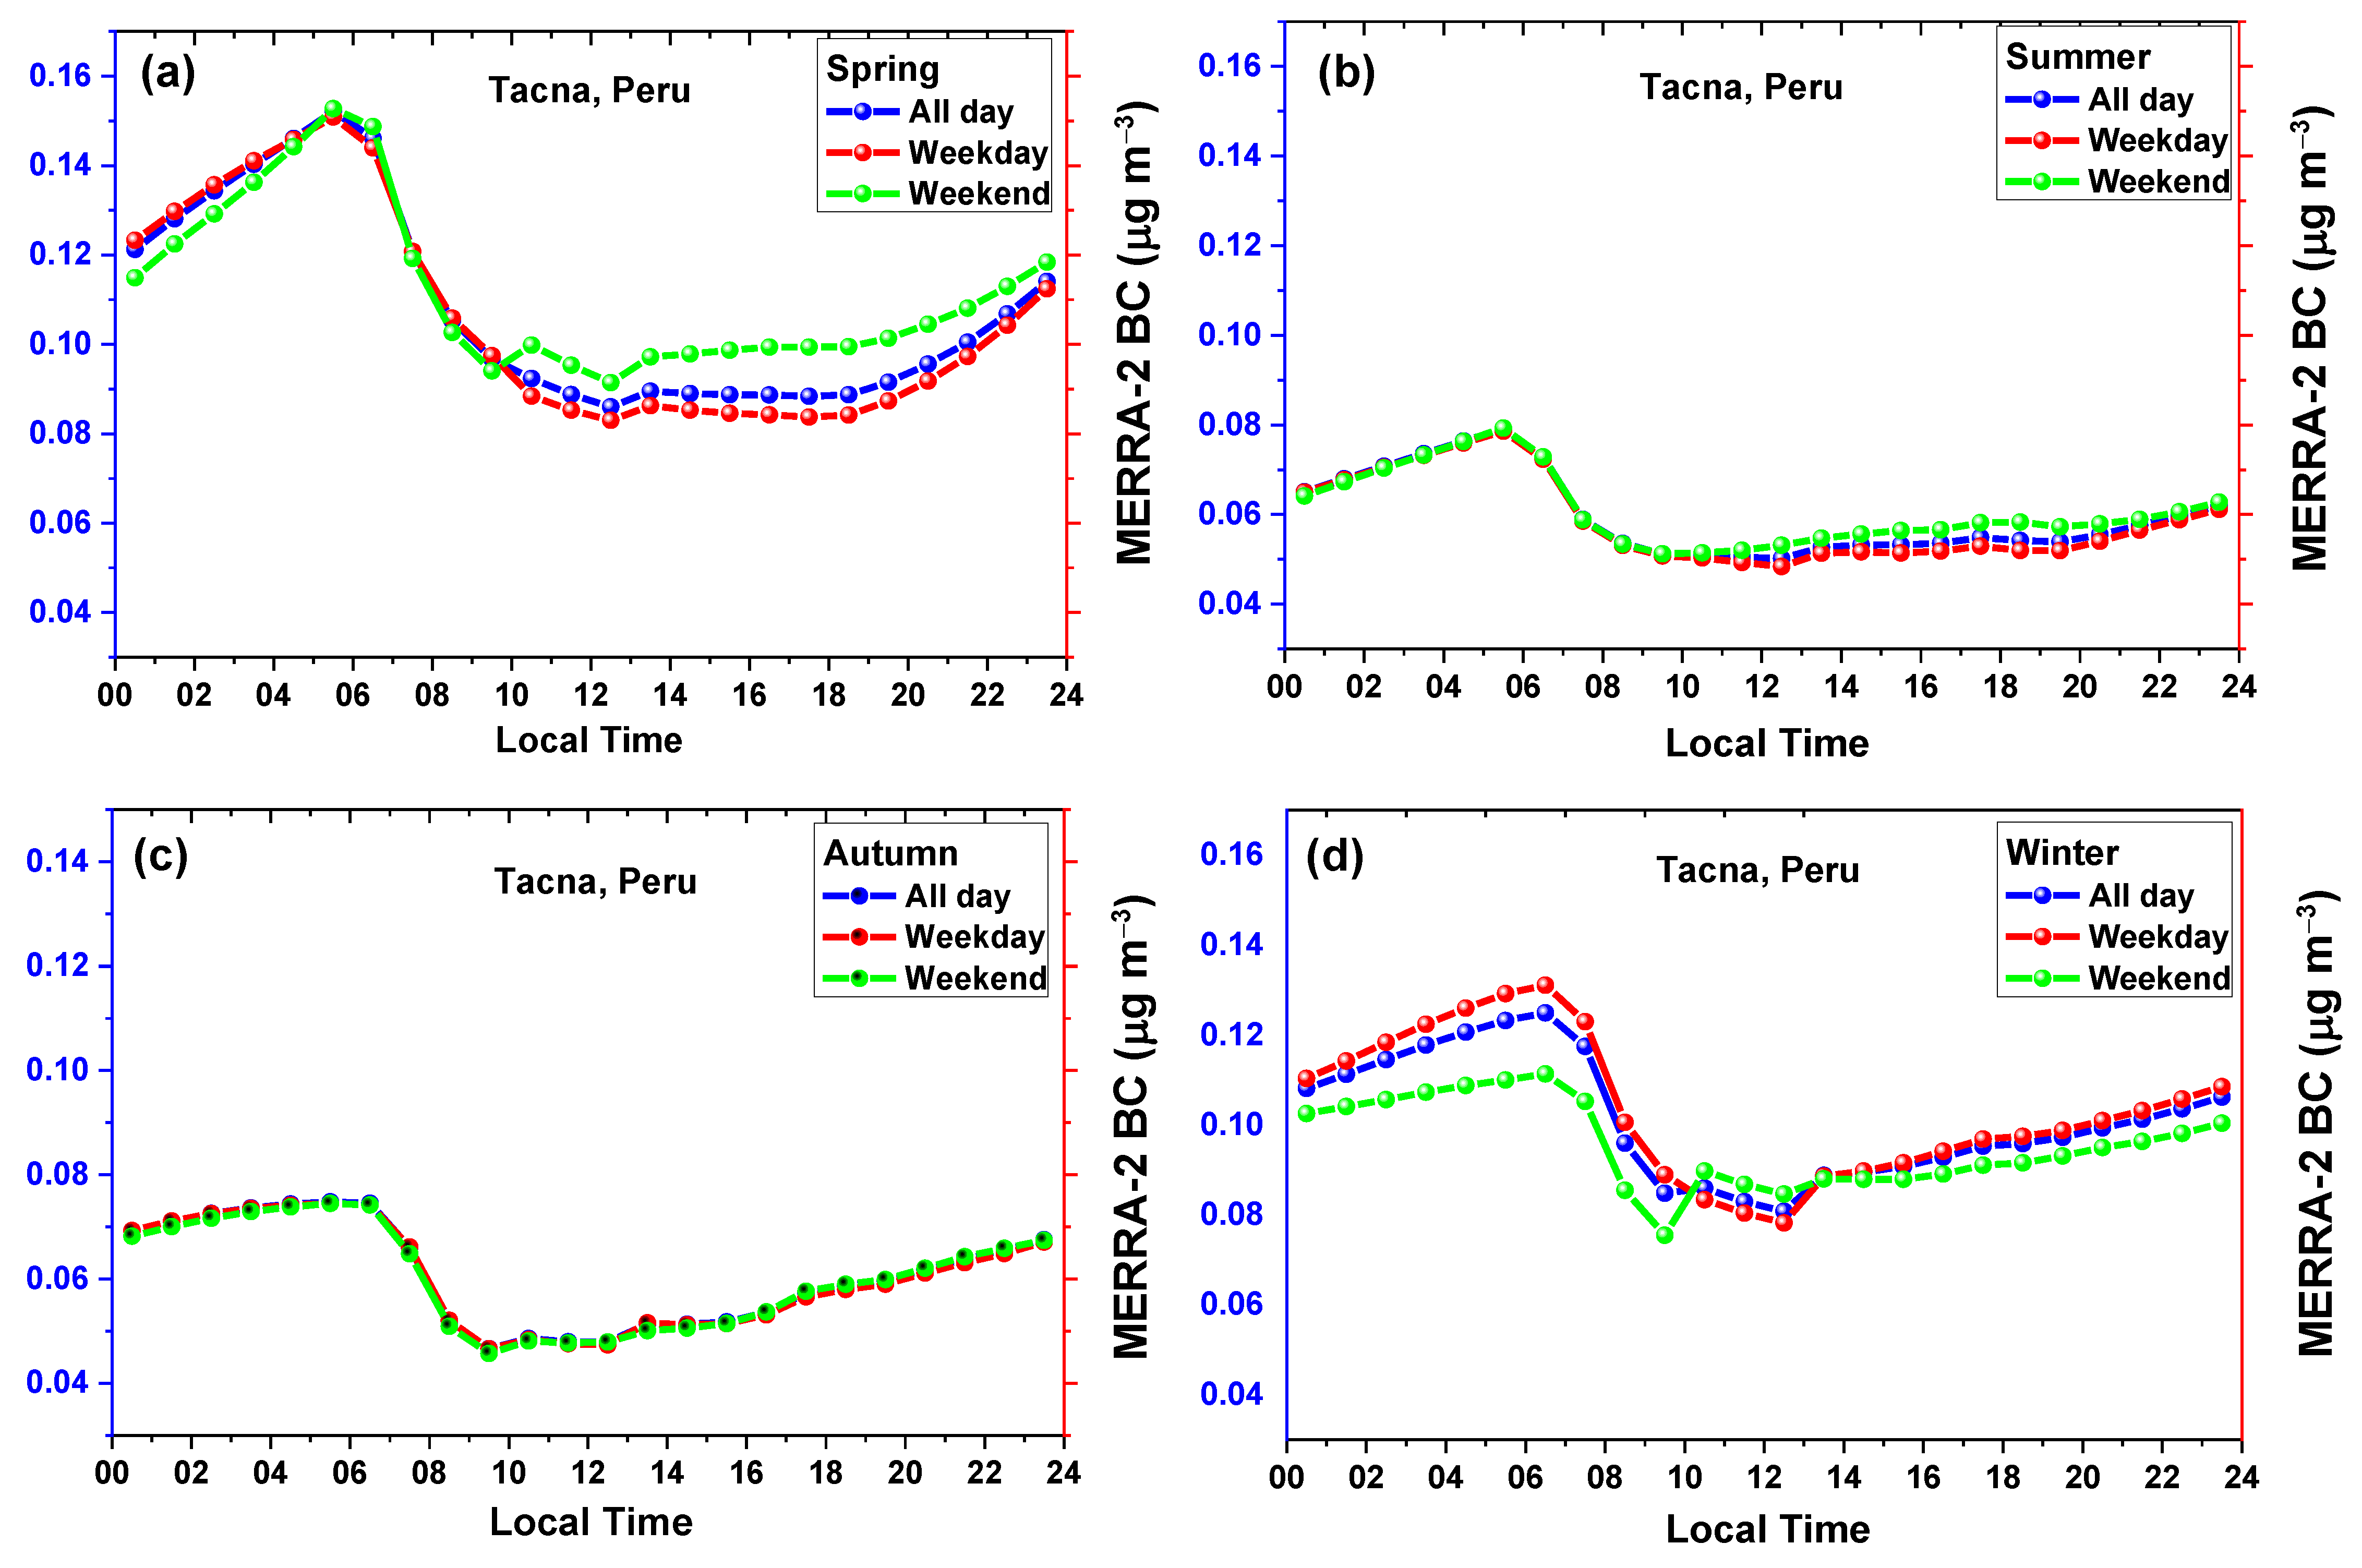
Another notable aspect of the time series shown in Figure 4 is the lack of agreement between the PAX BC and MERRA-2 BC values of 1 January 2020 (a day of high pollution due to the New Year’s celebration) and 30 June 2021 (a day of winter with a low height of the boundary layer). The two highest concentrations of PAX BC throughout the study period were observed on these two days; however, MERRA-2 did not to capture these “plumes”. Similarly, MERRA-2 BC did not show the weekend effect (Figure A2 and Table A1). These results suggest that MERRA-2 underestimates urban emissions likely because MERRA-2 uses the local displacement ensemble (LDE) method, which attempts to correct for misplaced aerosol “plumes” by considering the aerosol properties (speciation, vertical distribution) in neighboring grid boxes to try to minimize the difference between the model forecast and the assimilated observations [58,64,65]. Regarding the two days with the highest MERRA-BC values, we found that on these days the concentration of the BC measured at the surface with the PAX were relatively low (Figure 4). In many cases, if the aerosol mass at a given level is too high (low) relative to the observations, the application of the AOD increment may exacerbate (reduce) this bias [58,64,65].

3.2.2. Seasonal Variation in BC

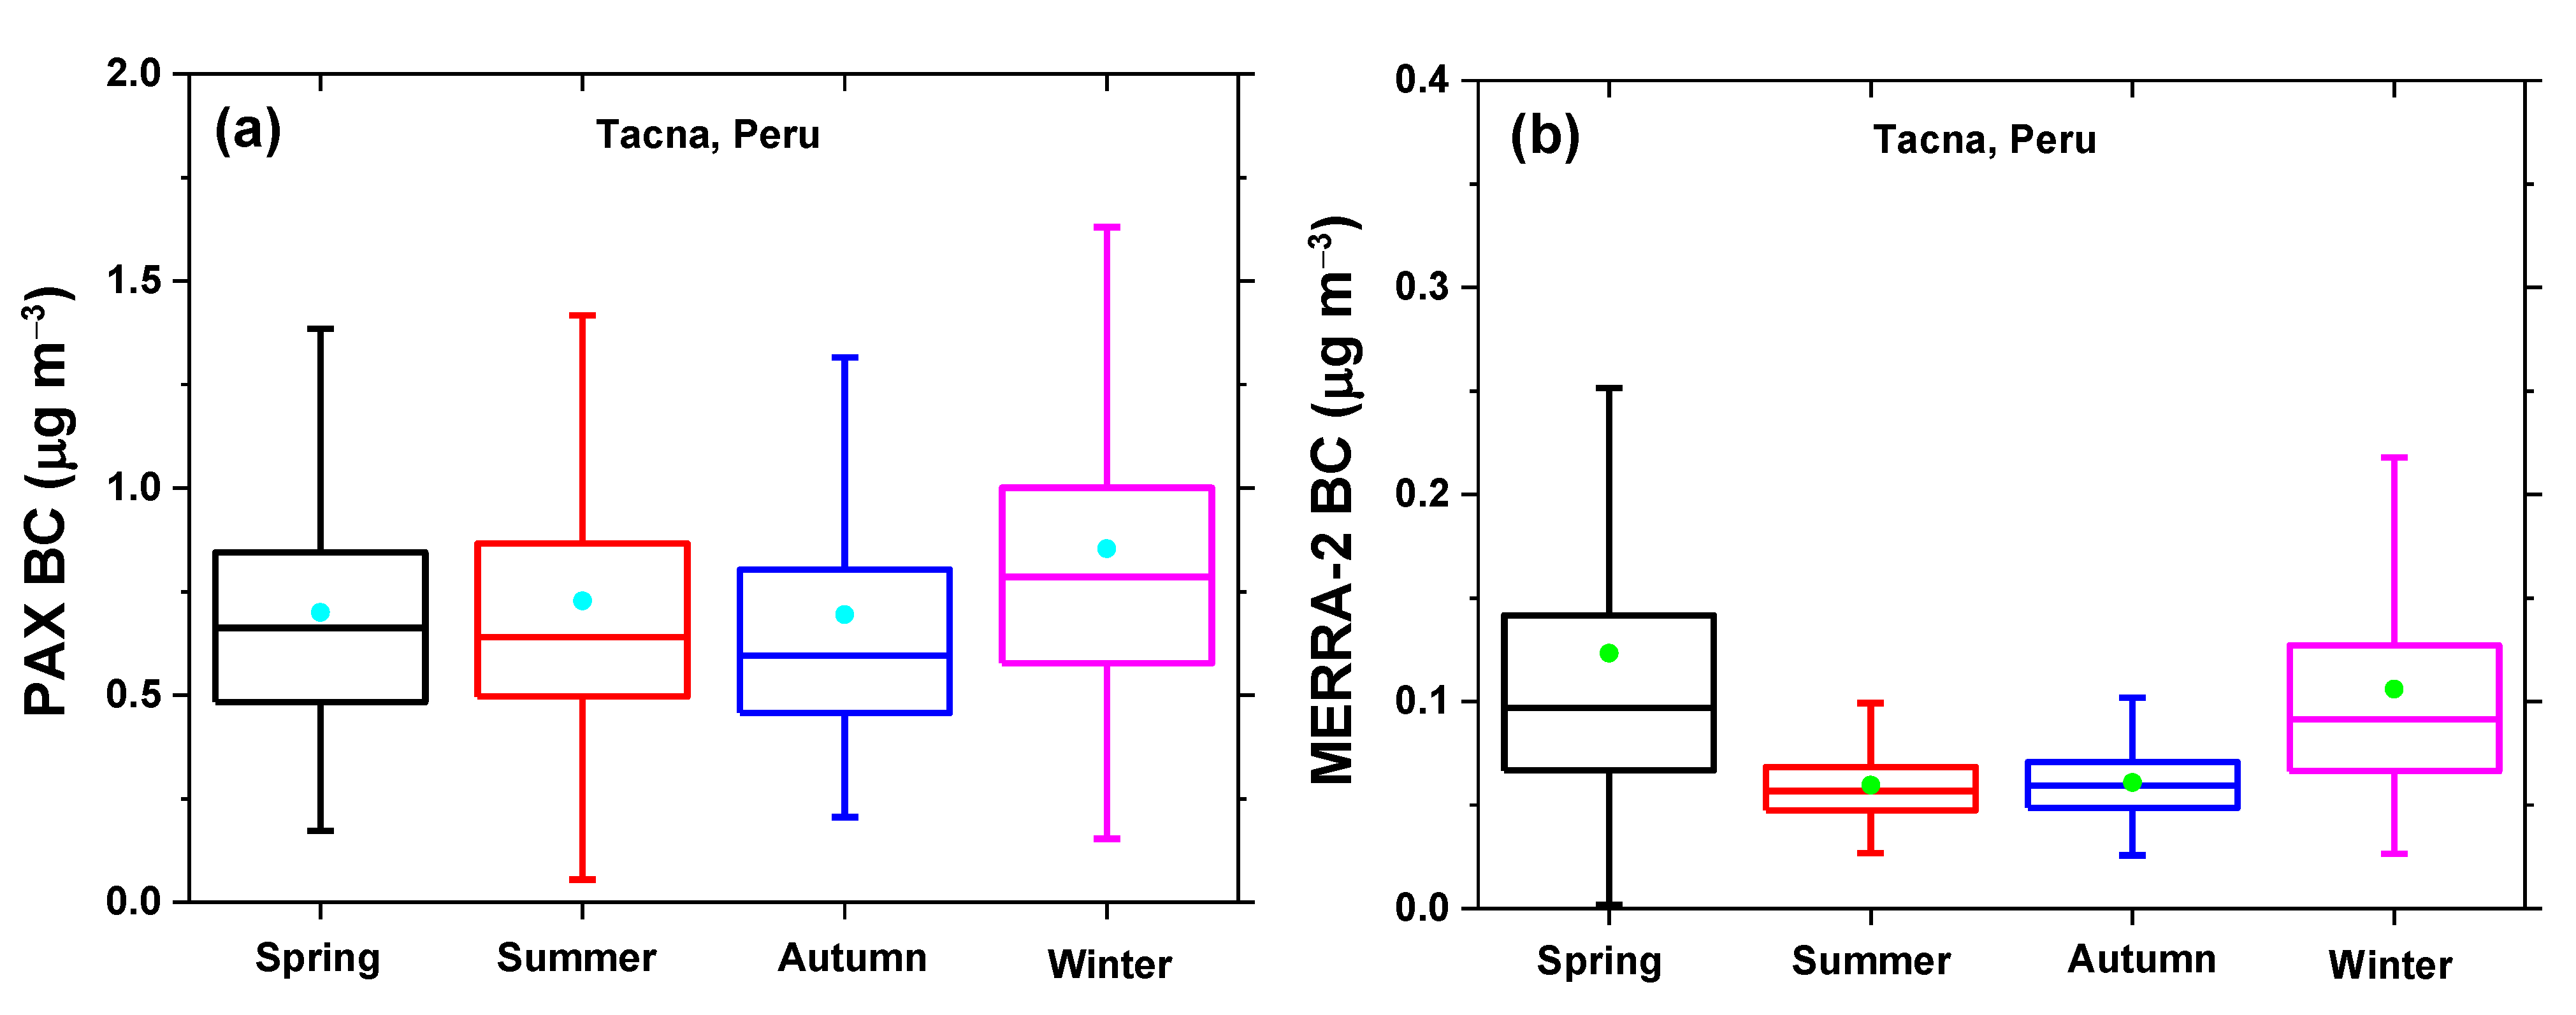
The box-and-whisker plots in Figure 5 show the concentration of black carbon for each season in Tacna, Peru. The season with the highest seasonal average of PAX BC was winter, with a value of 0.85 ± 0.46 μg m−3 (Figure 5a). The mean values of the PAX BC concentration, for the other seasons, were 0.70 ± 0.35 μg m−3, 0.73 ± 0.46 μg m−3, and 0.70 ± 0.39 μg m−3, for spring, summer, and autumn, respectively (see Table 2). Figure 5b and Table 2 show that the spring and winter seasons presented the highest seasonal average of MERRA-2 BC, with 0.12 ± 0.11 μg m−3 and 0.11 ± 0.06 μg m−3, respectively. While the summer and autumn seasons obtained the same seasonal average (0.06 ± 0.02 μg m−3) of MERRA-2 BC concentration. The results are consistent with the values for the monthly variation in PAX BC and MERRA-2 BC (Figure A1). The seasonal averages of ground-based black carbon (PAX BC) and the obtained using the MERRA-2 reanalysis (MERRA-2 BC) showed a considerable discrepancy (Table 2 and Figure 5). During the autumn and summer seasons, ground-based PAX BC measurements were an order of magnitude higher than the values obtained by the MERRA-2 reanalysis. However, the BC concentrations during spring and winter obtained by these two methods were of the same order of magnitude, although the difference was still significant (Figure 4 and Figure 5). In addition to the likely reasons for this large gap (or discrepancy) between the MERRA-2 BC and PAX BC measurements discussed in Section 3.2.1; another critical reason that explains the difference was probably due to spatial coverage MERRA-2 grid, which represented a spatiotemporal average of the atmospheric column over a specific area of the Earth’s surface [61].
It is important to note that the MERRA-2 reanalysis simulates the surface concentration of black carbon and other aerosols. Aerosols in MERRA-2 are simulated with the GOCART model to determine the distribution, mass, speciation, size, and vertical location of aerosols. The AOD can be estimated from the aerosol mass combined with the assumptions of species-specific optical properties and its hygroscopic growth [57,58]. The AOD is the total extinction in the column due to all aerosol species, indicating of the particulate load in the atmosphere [58,67]. Aerosol diagnoses depend on (a) the quality of the observed AOD; (b) the quality of the background forecast (i.e., aerosol speciation, size, and vertical structure); (c) assumed optical properties that are used to convert aerosol mass to AOD; (d) the parameterization of the error covariances in the aerosol data assimilation algorithm [58]. AOD is a column-integrated observation and PM2.5 concentration is a surface measurement; therefore, using AOD as the only predictor of PM2.5 can have considerable uncertainties. For this reason, it is crucial to consider the influence of other variables, such as relative humidity, the vertical location of aerosols, and the optical properties of aerosols [58,64,65,68,69]; nevertheless, MERRA-2 generally improves simulations of PM2.5 surfaces. In particular, the improvement is most noticeable during the spring and summer seasons, except in the western part of the US, where a lack of nitrate emissions in MERRA-2 and an underestimation of carbon emissions explain much of the reanalysis bias during the winter [64].
Another reason that would explain the discrepancy between the PAX BC and MERRA-2 BC could be due to the fact that the MERRA-2 model does not capture the updated aerosol composition patterns well. If this happens in first world countries, where they have the resources to perform aerosol chemical speciation studies, in the southern hemisphere (where the Atacama Desert is located) where these studies are scarce, the uncertainty is likely to be higher; consequently, the climatic feedback due to the changing pattern of aerosols would be endowed with uncertainty [70].

3.3. Daily Variation in BC

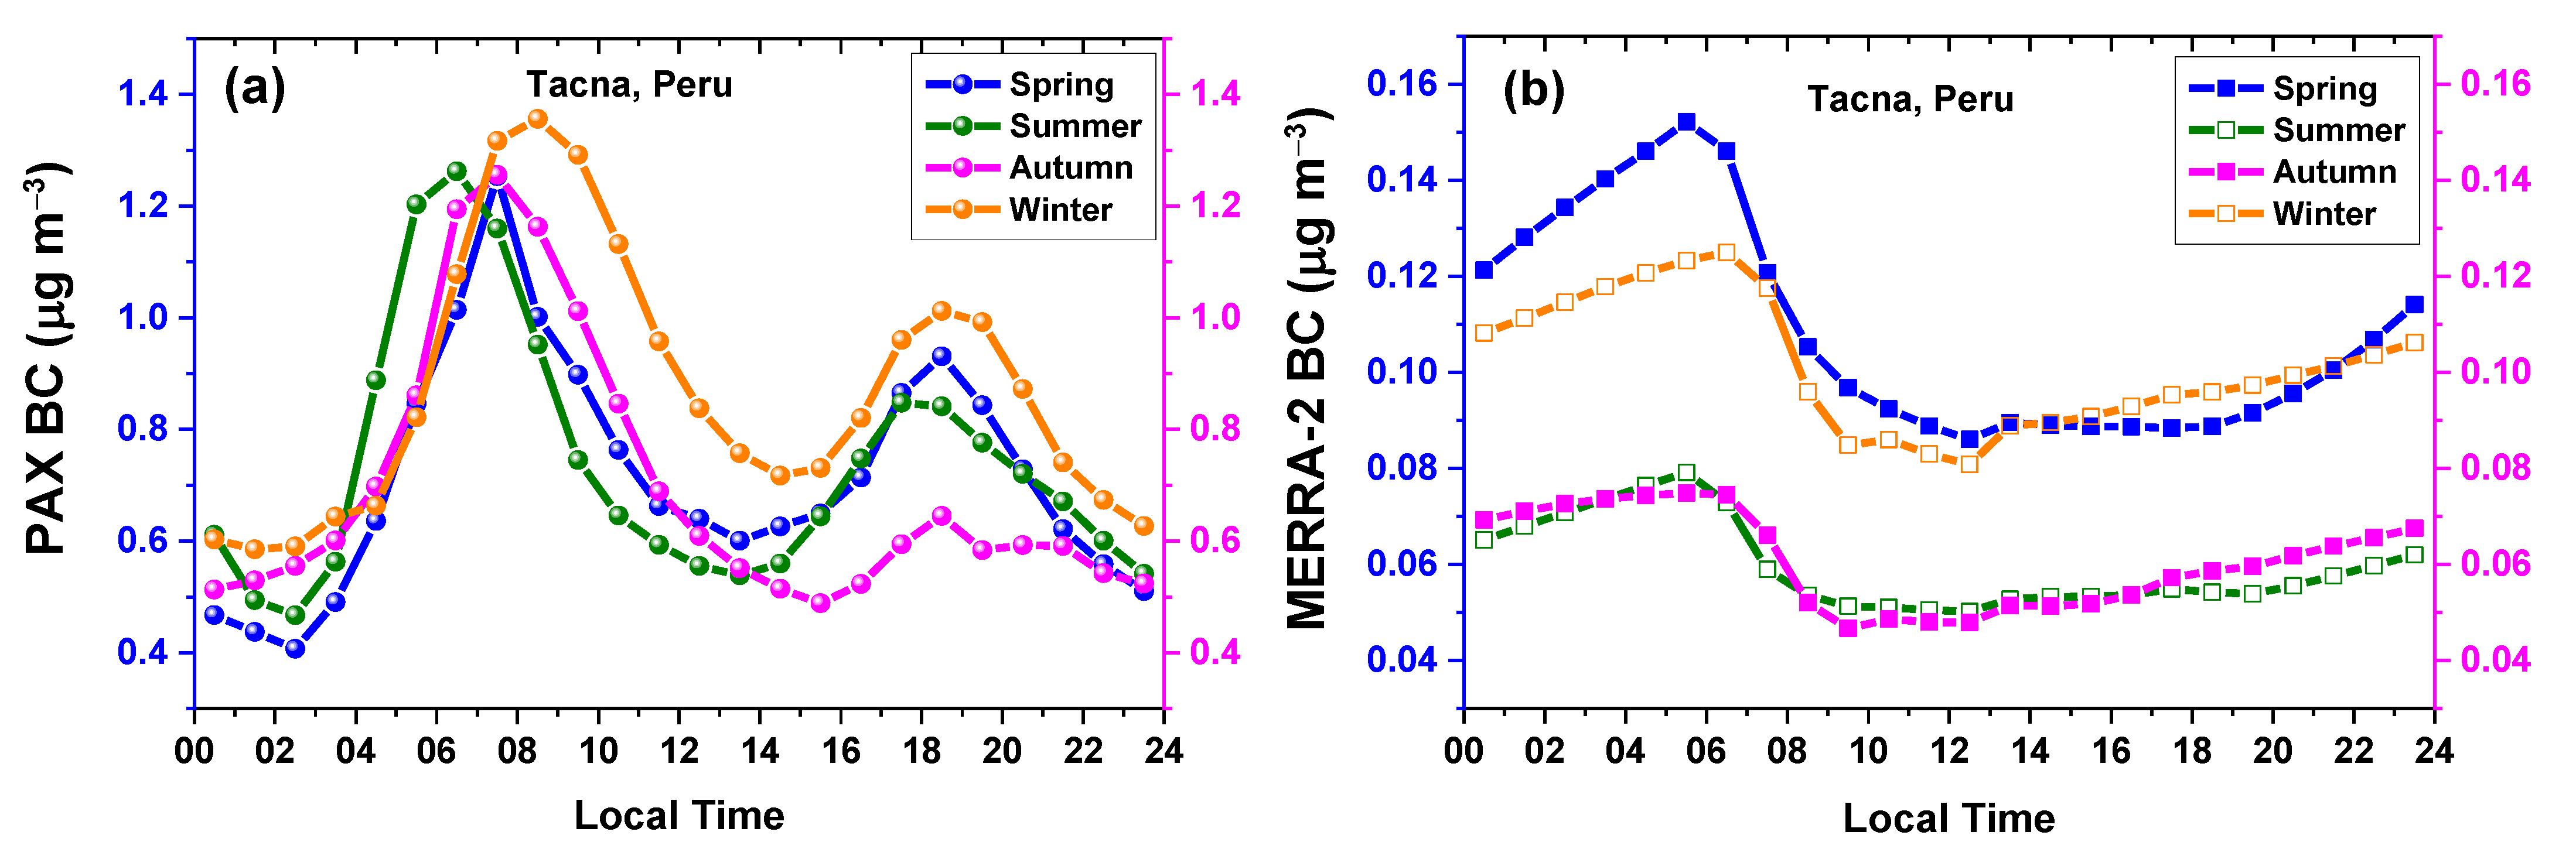
The influence of local anthropogenic activities on the concentration of black carbon is reflected in its daily cycle [71,72,73]. Figure 6 shows the daily patterns of PAX BC mass concentration (Figure 6a) and the MERRA-2 BC values obtained through the MERRA 2 reanalysis (Figure 6b) in Tacna, Peru, during the four seasons. The diurnal variation in the PAX BC observations for the four seasons was similar. They presented two maxima and two minima, a typical daily trend of BC concentration in urban areas. The PAX BC concentration began to increase rapidly from its first minimum, approximately at 02:00–03:00 LT, until it reached its maxima values of 1.25 μg m−3, 1.26 μg m−3, 1.26 μg m−3, and 1.36 μg m−3, for the spring (07:00–08:00 LT), summer (06:00–07:00 LT), autumn (07:00–08:00 LT), and winter (08:00–09:00 LT), respectively. Subsequently, the PAX BC concentration decreased until a second minimum in the afternoon, around 13:00–15:00 LT, depending on the season. This decrease coincided with a significant increase in the height of the mid-boundary layer estimated for Tacna using HYSPLIT. The second maximum of the BC appeared at the end of the afternoon, between 18:00 and 19:00 LT for all seasons. This peak coincided with the end of the decrease in the height of the mid-boundary layer. This daily cycle of the PAX BC concentration was expected.
In an urban area, the daily cycle of BC concentration is influenced by the following two factors: emissions and meteorological conditions [71,73]. The beginning of the increase in PAX BC concentration, from the early morning (02:00–03:00 LT) until sunrise, would be due to the start of anthropogenic activities in the city under the following relatively stable meteorological conditions: temperature, relative humidity, wind speed, and solar radiation, are all almost constant (see Figure 3); moreover, all of them are conditions that favor a boundary layer low height. With sunrise, these meteorological variables changed, which contributes to a development of the atmospheric boundary layer; however, the concentration of PAX BC continued to increase to its maxima values (06:00–08:00 LT) because the rate of increase in anthropogenic activities, especially vehicular traffic, exceeds the rate of change in the atmospheric boundary layer. The decrease in the PAX BC concentration to its second minimum coincides with the maximum height of the mixed layer while the traffic density decreases. The second peak of the PAX BC concentration (18:00–19:00 LT) occurs one hour after sunset, when the height of the boundary layer is at its minimum value.
Figure 6b shows the diurnal patterns of the MERRA-2 BC values for the four seasons in Tacna, Peru. The daily cycles of the MERRA-2 BC were similar to each other. They presented a maximum very early in the morning and a minimum of around noon. These features differed from those shown for the PAX BC concentrations. This daily cycle is typical of suburban areas [74], a result which is consistent with the fact that the MERRA-2 reanalysis was designed with input data from observations in suburban and rural sites [58,64,65].
In the spring and summer, MERRA-2 BC reached its maximum between 05:00 and 06:00 LT, while in the autumn and winter, it reached it an hour later at 06:00–07:00 LT. Then it decreased until reaching its only minimum around noon, maintaining low values throughout the afternoon. At night, it begins a smooth increase towards its maximum the next day. The spring presented the largest daily cycle of MERRA-2 BC, exceeding the daily cycle during the winter. The daily cycles of MERRA-2 BC in the autumn and summer did not differ; they had the same seasonal average value (0.06 μg m−3) half the seasonal average of MERRA-2 BC in spring (see Table 2). In various studies that compare ground-based measurements with values obtained through the MERRA-2 reanalysis, they find an underestimation of part of the MERRA-2 reanalysis [32,37,38,39,58,70,75]. Ansari and Ramachandran [37] suggest that improvements in seasonal-scale emission inventories are essential to improve processes and model aerosol parameterizations.

3.4. Days of High Concentration of PAX BC and MERRA-2 BC

Figure 7 shows the daily cycles of PAX BC and MERRA-2 BC for four specific days in Tacna, Peru. These days were chosen as a case study because they correspond to the two days with the highest concentration of PAX BC (1 January 2020 and 30 June 2021) and the two days with the highest values of MERRA-2 BC (15 September and 7 November 2020). The daily cycles of PAX BC and MERRA-2 BC from 1 January 2020 and 30 June 2021 are shown in Figure 7a. Figure 7b shows the daily cycles for 15 September and 7 November 2020.
In Figure 7a, it can be clearly seen that the daily cycle of 1 January (blue) presents the highest hourly concentration of PAX BC (~23 µg m−3) during the first hour. This notable concentration is related to the burning of different “old” objects, traditional in the country. In the following hours the concentration decreases, but still remains high, stabilizing around 08:00–09:00 LT. As can be seen in the same figure, the daily cycle of MERRA-2 BC (magenta) was not disturbed by this large contamination of carbonaceous aerosols in the city, maintaining its values and behavior similar to the summer seasonal daily cycle (see Figure 6b). The atmospheric boundary layer for the first hours of this day was relatively high, decreasing until 04:00–05:00 LT. When we analyzed the backward trajectories of the air masses that arrived in Tacna using the HYSPLIT model, it could be observed that they originated (24 h before) in the Pacific Ocean to the southwest but entered Tacna from the southeast direction. This result suggests that MERRA-2 BC does not capture “plumes” of urban aerosols. The same Figure 7a shows the daily cycle of 30 June (olive) that presents high values (~11 µg m−3) between 03:00 and 08:00 LT. This “plume” of carbonaceous aerosols was not captured by the daily cycle of MERRA-2 BC (orange), which maintains its constant values during these hours, values that were even lower than the values of the winter seasonal daily cycle (Figure 6b); however, the atmospheric boundary layer during the early morning hours was very low. The analysis using the HYSPLIT model indicated that the air masses that arrived in Tacna (for all predetermined heights) came from the northwest, where the country’s main copper mines are located. In addition, they indicated a subsidence of air masses of approximately 1.5 km during the 24 h prior to their arrival in Tacna.
Figure 7b shows that the first nine hours of the daily cycle of the MERRA-2 BC on 7 November (orange) presented relatively very high values, even higher than those of the PAX BC (olive). The atmospheric boundary layer during the first hours of this day was relatively low. The MERRA-2 BC daily cycle for 15 September (magenta) presented a typical behavior, with hourly values lower than the winter seasonal average (Figure 6b) and lower than those of the PAX BC daily cycle (blue). The boundary layer was relatively high. The backward trajectories indicated the arrival of the air masses to the city of Tacna from different directions. These air masses came from a height of approximately 3500 m.

3.5. Daily Cycle of Mid-Boundary Layer Height

The mid-boundary layer height in Tacna, Peru, was estimated using the HYSPLIT model. To evaluate its dynamics during the daily cycle, the HYSPLIT model was run 24 times, once for each hour of the day. Two days with the highest concentration of PAX BC (1 January 2020, and 30 June 2021) and two days with the highest concentration of MERRA-2 BC (7 November and 15 September 2020) were chosen. Figure 8 shows the mid-boundary layer height daily cycles in Tacna for the four days chosen. In general, relatively low heights (~100 m) are observed at night and a development with the appearance of sunlight until reaching maximum values (~800 m) around noon, depending on the year’s season.

3.6. Influence of Wind Speed on BC Concentration

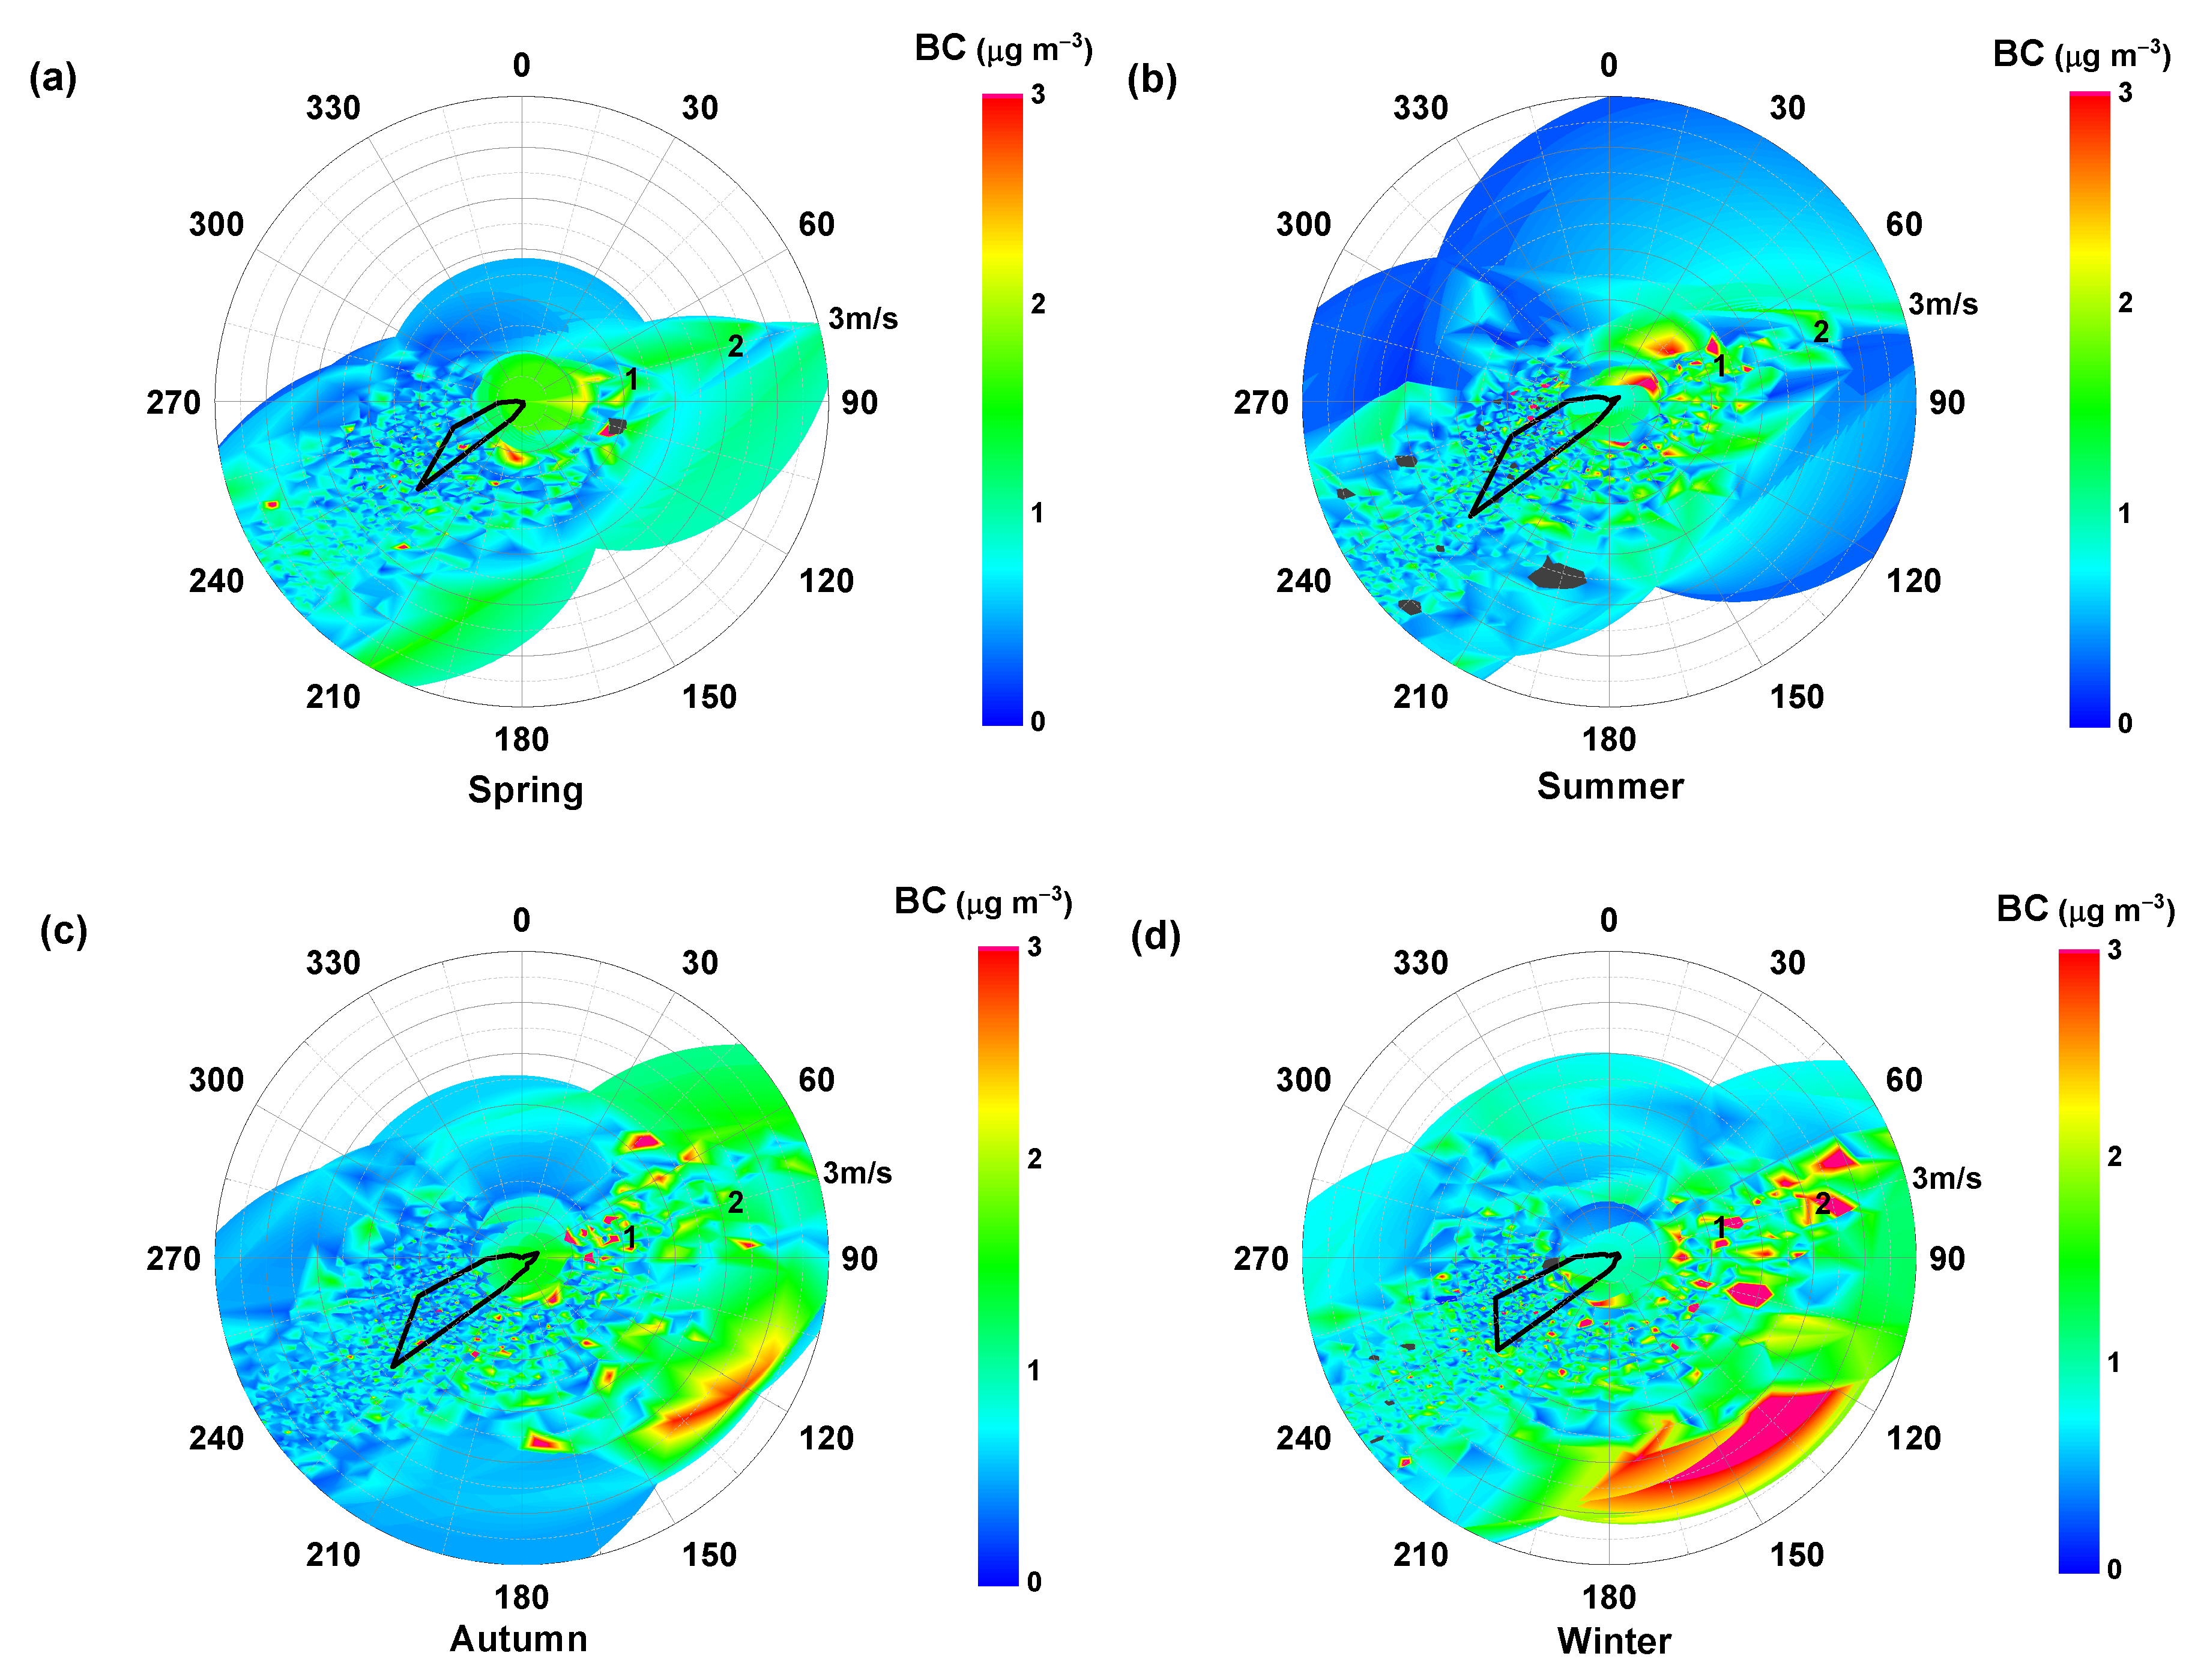
We used polar contour plots to analyze the influence of wind speed on the concentration of BC and determine the location of its most important sources. These are two-dimensional graphs of the form r(x), θ(y), which are associated with a third variable, z (BC concentration), whose values are represented by an arbitrary color scale. The radial variable r(x) represents wind speed, and the angular variable, θ(y), the wind direction. The colors in the graph represent the magnitude of the PAX BC concentration according to the predefined scale. We consider a “low speed” at wind speeds between 0 and 2 m s−1, and a “high speed” when it is greater than 4 m s−1. An “intermediate speed” will be between 2 and 4 m s−1. The thick closed black line around the center represents the frequency of the wind direction [74,76].
Figure 9 shows the dependence of the PAX BC concentration on the wind speed for all seasons in Tacna. The most frequent wind directions were between the south (S) and west (W) of the measurement site, with approximately 81% of the total frequency of wind directions during the entire study period. Specifically, the area between SW (225°) and WSW (247.5°) contributes more than 50% of the total frequency. We defined a scale of PAX BC concentration values using the average value and the standard deviation of the PAX BC concentration as a reference during the entire study period (0.75 ± 0.55 μg m−3). If the PAX BC concentration was greater than 2.3 μg m−3, it was considered “very high BC”; a value between 1.3 and 2.3 μg m−3 was “high BC”; a concentration from 0.3 to 1.3 μg m−3 was considered as “intermediate BC”; and a value less than 0.3 μg m−3 was “low BC”. During spring (Figure 9a), when the wind was weak and came from any direction, the intermediate values of BC predominated; however, when the wind came from the direction sector between 60° and 240°, high and very high BC values appeared. In the summer (Figure 9b), when the wind speed was less than 2 ms−1 and came from the 30–270° sector, high and very high BC values predominated. During the autumn (Figure 9c), high and very high BC values appeared when the wind was weak and came from the 30–240° sector. In the winter (Figure 9d), high and very high BC values predominated when the wind speed was low and came from the 45–270° sector. The BC concentrations were low and intermediate when the weak winds came from the 270–30° sector. For intermediate winds (2–4 m s−1) coming from the region between 45° and 255°, very high and high BC concentrations predominated, especially in the winter and autumn.
In general, the concentration of BC showed a strong dependence on the wind. When the wind was weak, high concentrations of BC came from sources between the southeast and northeast of our measurement site. High wind speeds (regional transport) were not important in Tacna. These results suggest that Tacna is mainly influenced by local emission sources located northeast and southeast of our measurement site.

3.7. Air Mass Analysis with HYSPLIT Backward Trajectories

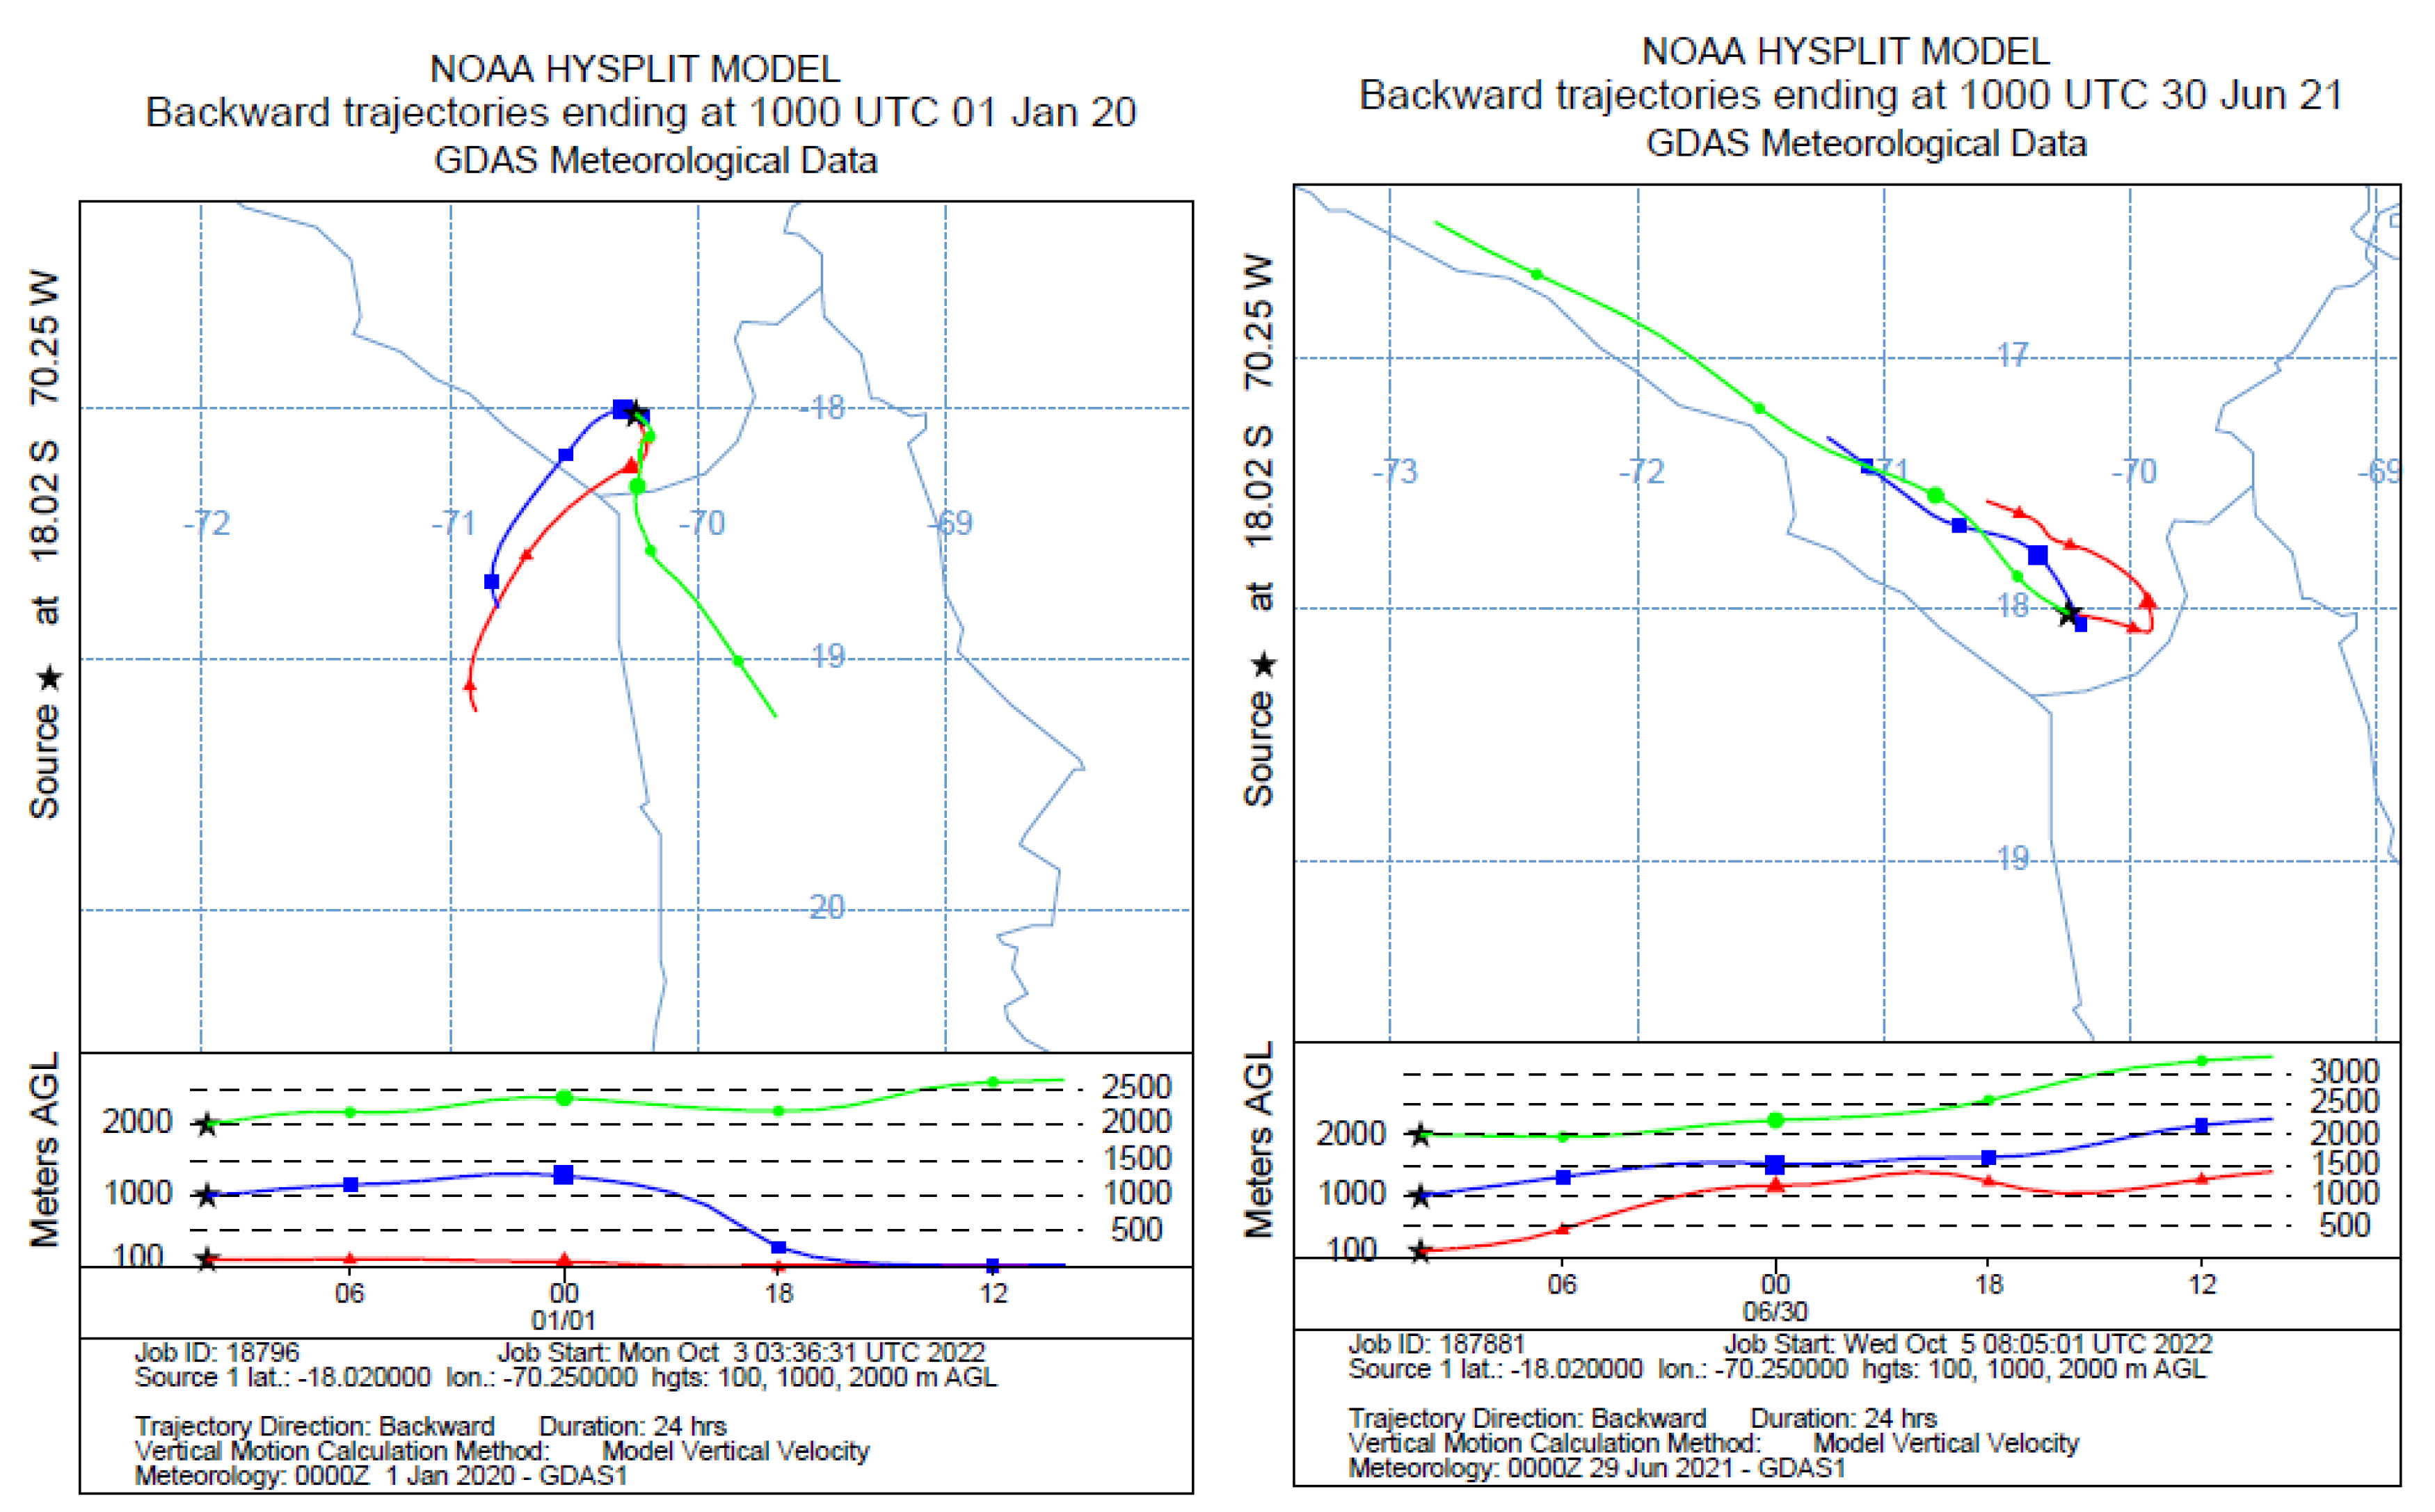
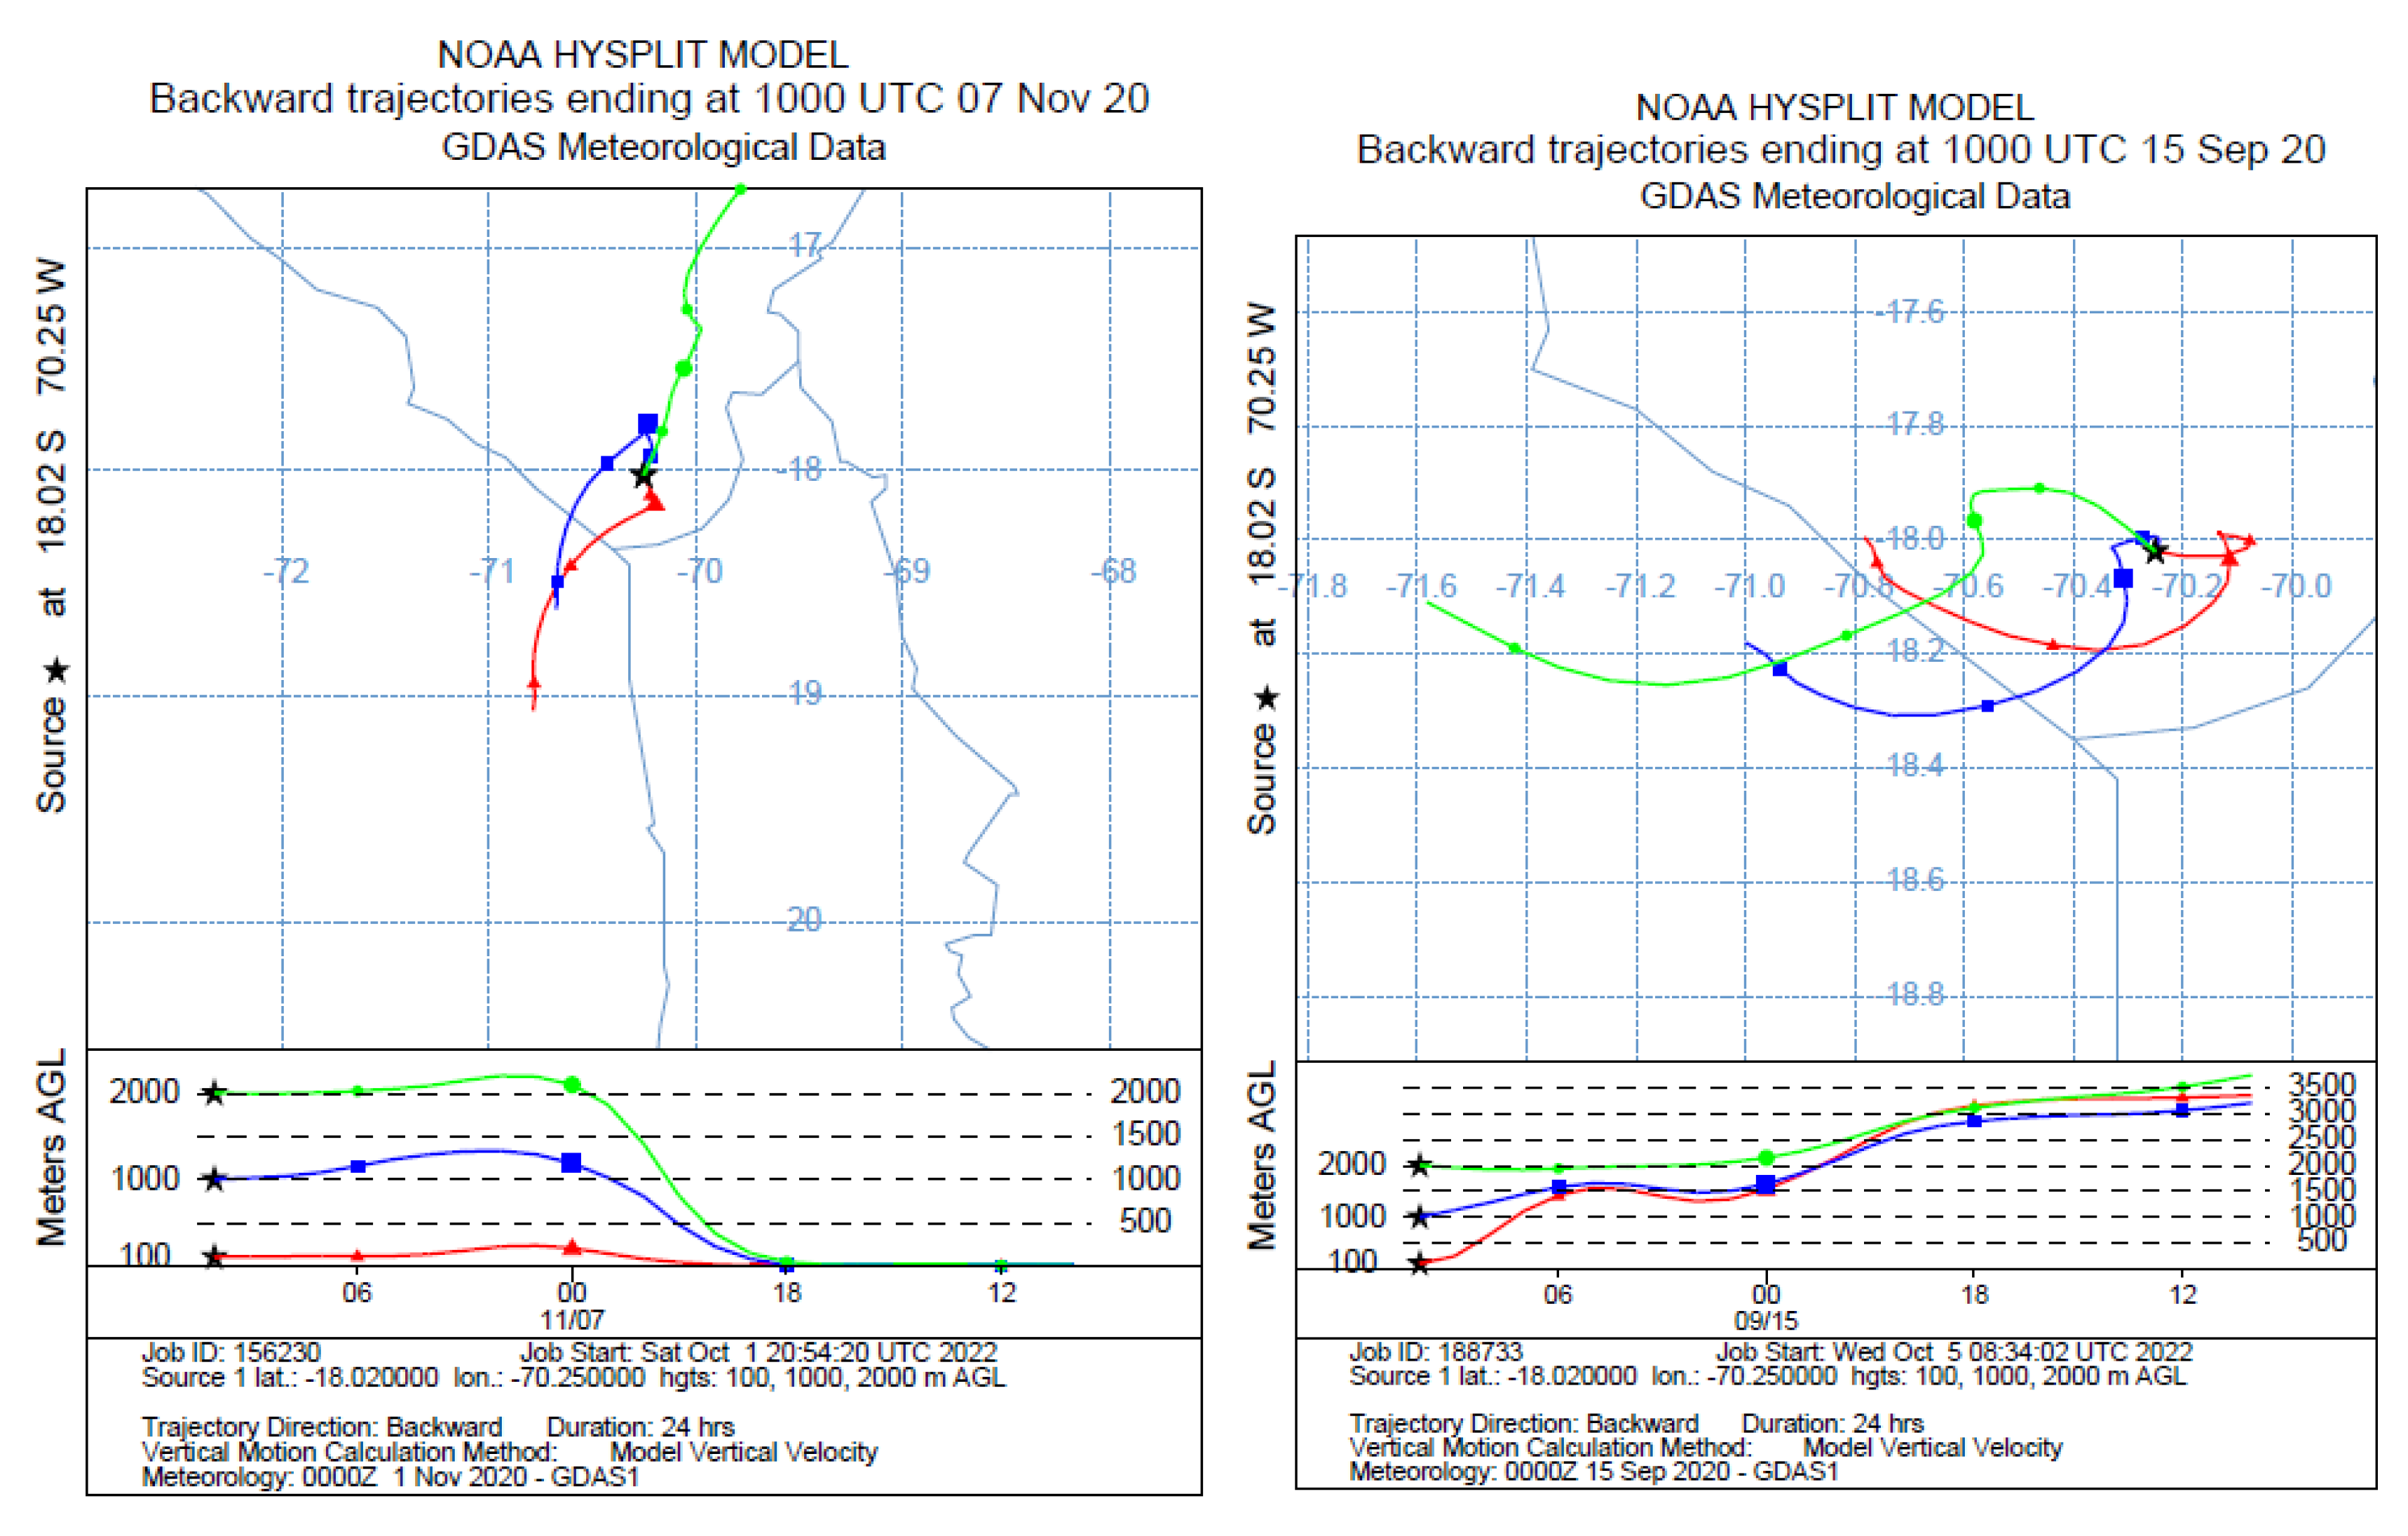
In order to identify the origin of the source regions and the path followed 24 h before reaching the sampling site, Figure 10 shows the HYSPLIT backward trajectories arriving at 10:00 UTC (Local Time is 5:00 A.M (UTC–5:00)) on the following four days with the highest BC concentrations mentioned in Section 3.2, Section 3.4, and Section 3.5: 1 January 2020 (Figure 9a), 30 June 2021 (Figure 9b), 7 November 2020 (Figure 9c), and 15 September 2020 (Figure 9d). The first two days corresponded to those with the highest PAX BC concentration, and the other two had the highest values of BC in the atmospheric column (MERRA-2 BC).
Figure 10a shows the HYSPLIT backward trajectories of 1 January 2020, a day that presents the highest concentrations of PAX BC of the entire year during its first hours, a consequence of the massive emissions (burning of everything old) due to the celebration of the new year. At the height of 100 and 1000 m, the air masses that arrive in Tacna originated in the Pacific Ocean, and reached the site from the southeast and west, respectively. At a boundary layer height of 2000 m, air masses arrived at the site from the southeast. Figure 10b shows the HYSPLIT backward trajectories of 30 June 2021, the second day with the highest concentration of PAX BC of our entire study period. On this day, the air masses that arrived at Tacna were in the northwest of Tacna at an approximate height of 1500 m above each of these three levels 24 h before. Our results suggest a subsidence of air masses during this day.
Figure 10c shows the HYSPLIT backward trajectories of 7 November 2020, the day with the highest value of MERRA-2 BC in our entire study period. The air masses that arrive at Tacna at 100 and 1000 m of height originated in the Pacific Ocean, and arrived through the southeast and northwest, respectively. At the height of 2000 m, the air masses arrived in Tacna from the northeast, where the Pucamarca Gold Mine is located, and came from the surface. PAX did not detect this high contamination event; however, it was detected by MERRA-2 reanalysis, probably because the reanalysis model encompasses a higher spatial resolution and measures an atmospheric column. This result suggests that the air masses located above the atmospheric boundary layer were highly polluted. Figure 10d shows the HYSPLIT backward trajectories of 15 September 2020, the second day with the highest value of MERRA-2 BC in our entire study period. The air masses that arrived at Tacna in the three levels were in the Pacific Ocean between 3000 and 3500 m high 24 h before. Significant subsidence was observed, especially from the air mass that reached Tacna at the level of 100 m (approximately 3400 m of height difference). This could be the reason why the MERRA-2 reanalysis recorded such a high BC, on this day.

3.8. Influence of the COVID-19 Lockdown on BC Concentration

In Peru, between March 2020 and September 2021, two “waves” of pandemic indicators (number of daily cases and number of daily deaths) developed (Figure A3). Having a very fragile health system, this abrupt growth in indicators devastated the vulnerable population. This tragedy placed Peru as the country with the highest number of deaths from COVID-19 by number of inhabitants. Despite the fact that Peru was one of the first countries to decree a lockdown when the indicators of the pandemic were very low as of Sunday, 15 March 2020. Taking this lockdown start day as a reference, we performed the Mann–Kendall test for the trends and estimated the variation in the BC concentration between the two (one) weeks before and the two (one) weeks after for PAX-BC and MERRA-2 BC.
The Mann–Kendall test is applicable when the values xi of a time series can be assumed to obey the following: xi = f (ti) + εi, where f (ti) is a continuous monotonic increasing or decreasing function and εi are the residuals. The Mann–Kendall non-parametric test for trends consists of testing the null hypothesis, H0, of no trend, against the alternative hypothesis, HA, of an increasing or decreasing trend. For this, we must find both the so-called Mann–Kendall S-statistics and the normal approximation (Z-statistics). The S-statistic is used when the time series has less than 10 data, and for time series with 10 or more data, the Z statistic is used. If the number of data (n) is 9 or less, H0 is rejected in favor of HA in an upward trend if S is positive and its corresponding probability value is less than a priori specified α significance level of the test [77]. Similarly, for a downward trend, reject H0 and accept HA if S is negative and if the probability value corresponding to the absolute value of S is less than the α significance level. If n is at least 10, the normal approximation test is used. The presence of a statistically significant trend is evaluated using the Z-statistic. A positive (negative) value of Z indicates an upward (downward) trend. H0 is rejected if the absolute value of Z is greater than Z1−α (Z1−α/2), where α is the significance level [77,78,79].
The results obtained from the application of the Mann–Kendall test for the trends of the time series of daily BC concentrations two (one) weeks before and after the start of the lockdown are shown in Table 3. The average PAX BC concentration two weeks after the start of the COVID-19 lockdown decreased by 30% compared to the previous two weeks. For the same period, the average value of MERRA-2 BC decreased by 21%. Additionally, between the week before and after the start of the lockdown, a greater decrease in the mean concentration of black carbon was estimated as follows: 37% for PAX-BC and 38% for MERRA-2 BC. Various studies around the world have confirmed that as a consequence of the COVID-19 lockdown, a decrease in the concentration of aerosols has been observed [70].
On the other hand, when evaluating the time series of PAX BC from two weeks before and two weeks after to the beginning of the lockdown (15 March 2020), using the Mann–Kendall test resulted in a α significance level of 0.05. The 0.05 significance level means that there is a 5% probability that we make a mistake when considering that the series presented a trend or when we reject H0 (of no trend). We calculate a Z = +2.299 (from S = +43) for the first series and Z = −2.299 (from S = −13) for the second. When comparing the absolute value of Z with Z1−α and Z1−α/2 (Z is greater than Z1−α and Z1−α/2), the first series presented an increasing trend and the second a decreasing trend. By applying the Mann–Kendall test for the MERRA-2 BC time series, for the same periods and the same significance level, a series with an increasing trend was obtained with Z = +2.299 (from S = +43), while the second series with Z = +1.3138 (from S = +25) did not present a trend, as Z was less than Z1−α/2.
In the Mann–Kendall test for the time series of the daily BC concentration one week before and after the start of the lockdown due to COVID-19, the number of data was 7, so the comparison between the corresponding probability value to S obtained with the a priori specified α significance level was direct. For the PAX BC, during the first week an S = −7 was found, whose absolute value corresponds to a probability value of 0.191 [77], a value that was higher than the significance level (α = 0.05); consequently, this series did not present a trend. In the second series, S = −17 and a probability value equal to 0.0054 [77] were obtained, a value less than the significance level. This result means that the series presented a downward trend. For MERRA-2 BC, S = −7 was obtained in the first series, so this series did not present trend. During the week after the start of the lockdown, the S obtained was −5, corresponding to a probability value of 0.281 [77], a value greater than α; therefore, the series did not present a trend. These summarized results are presented in Table 3.
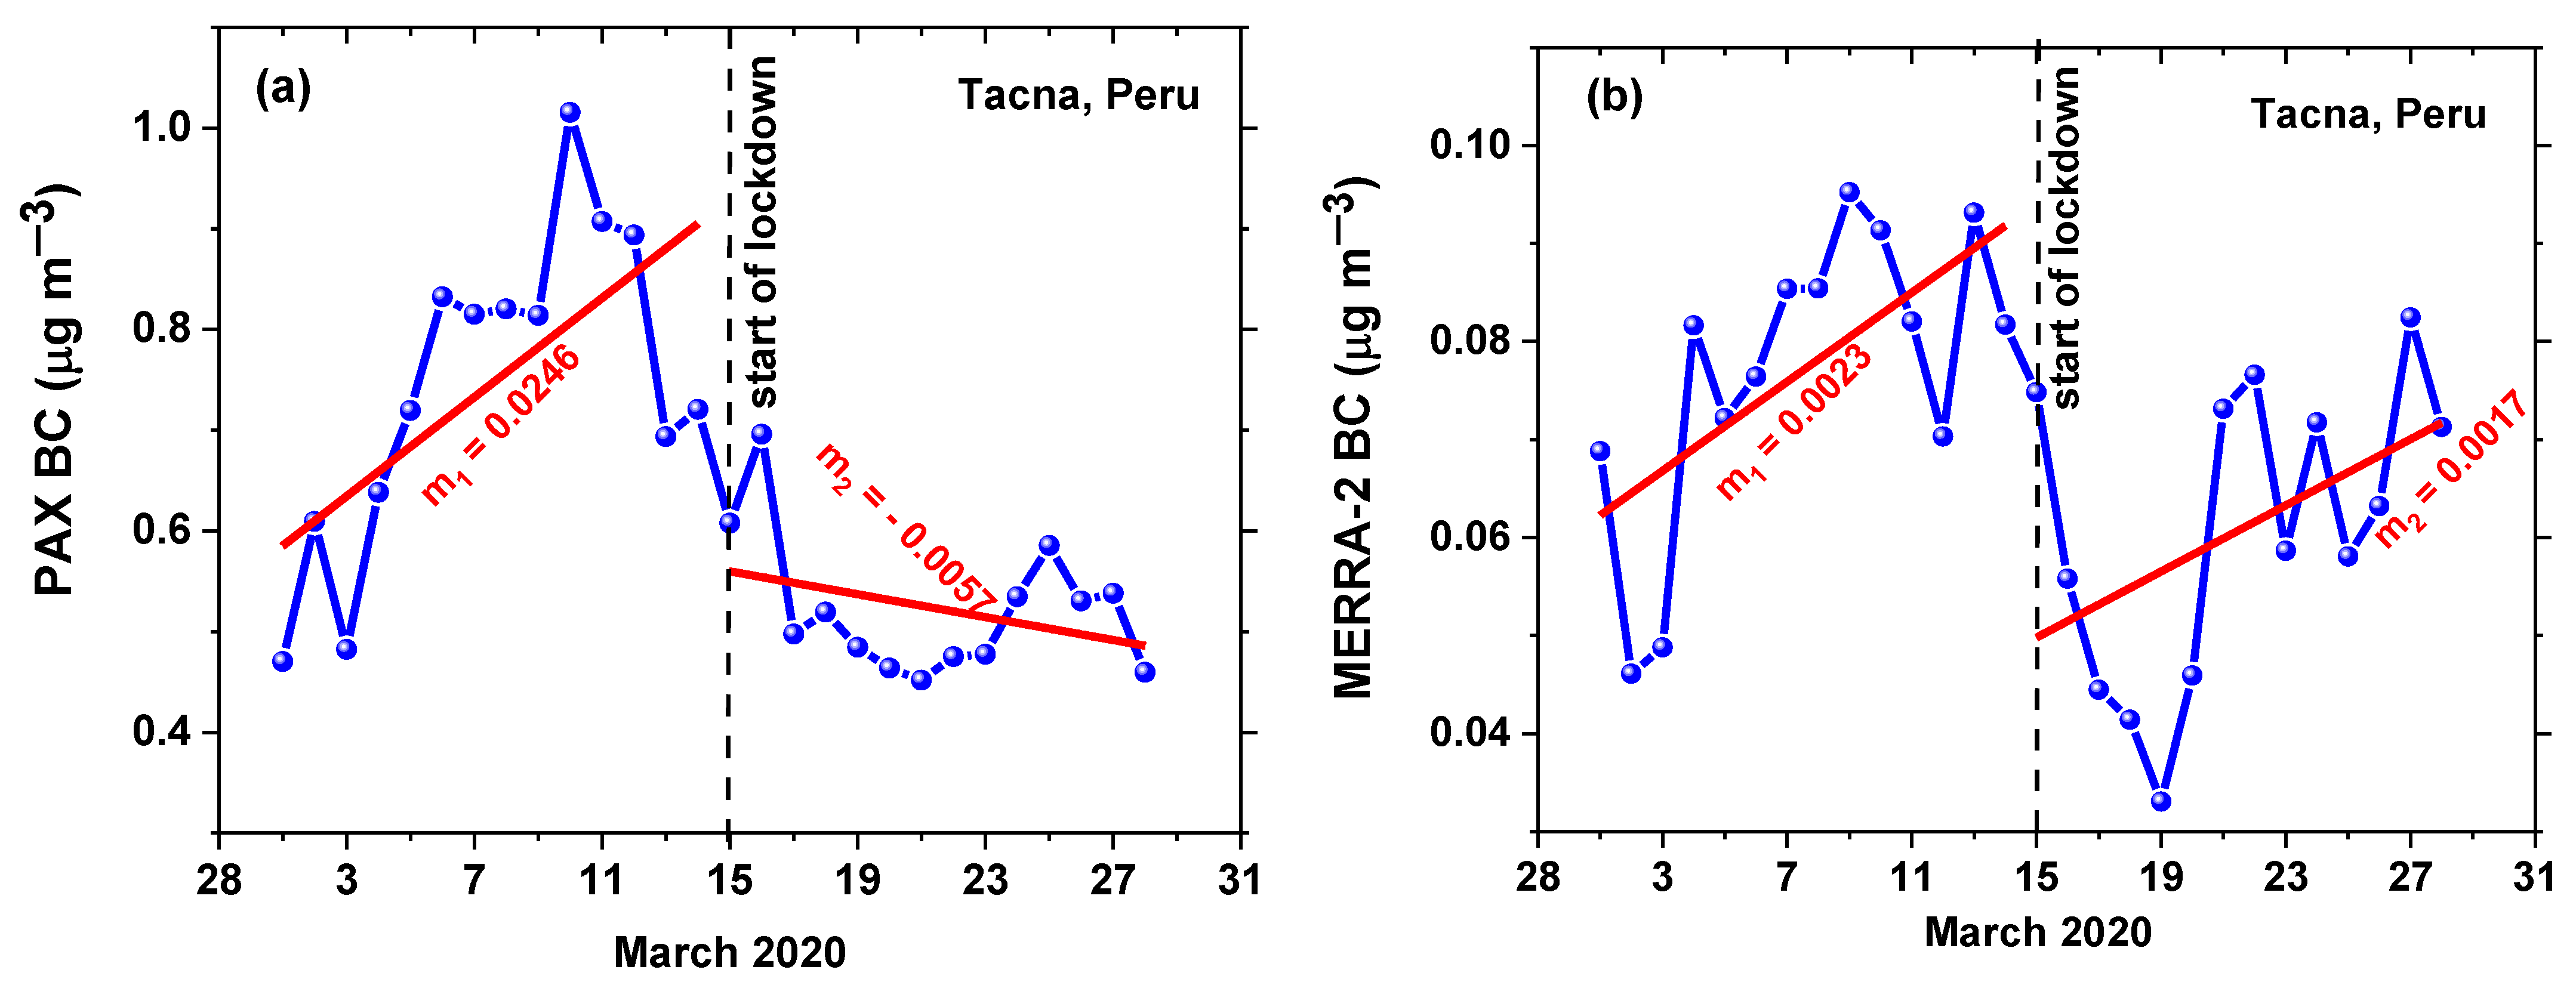
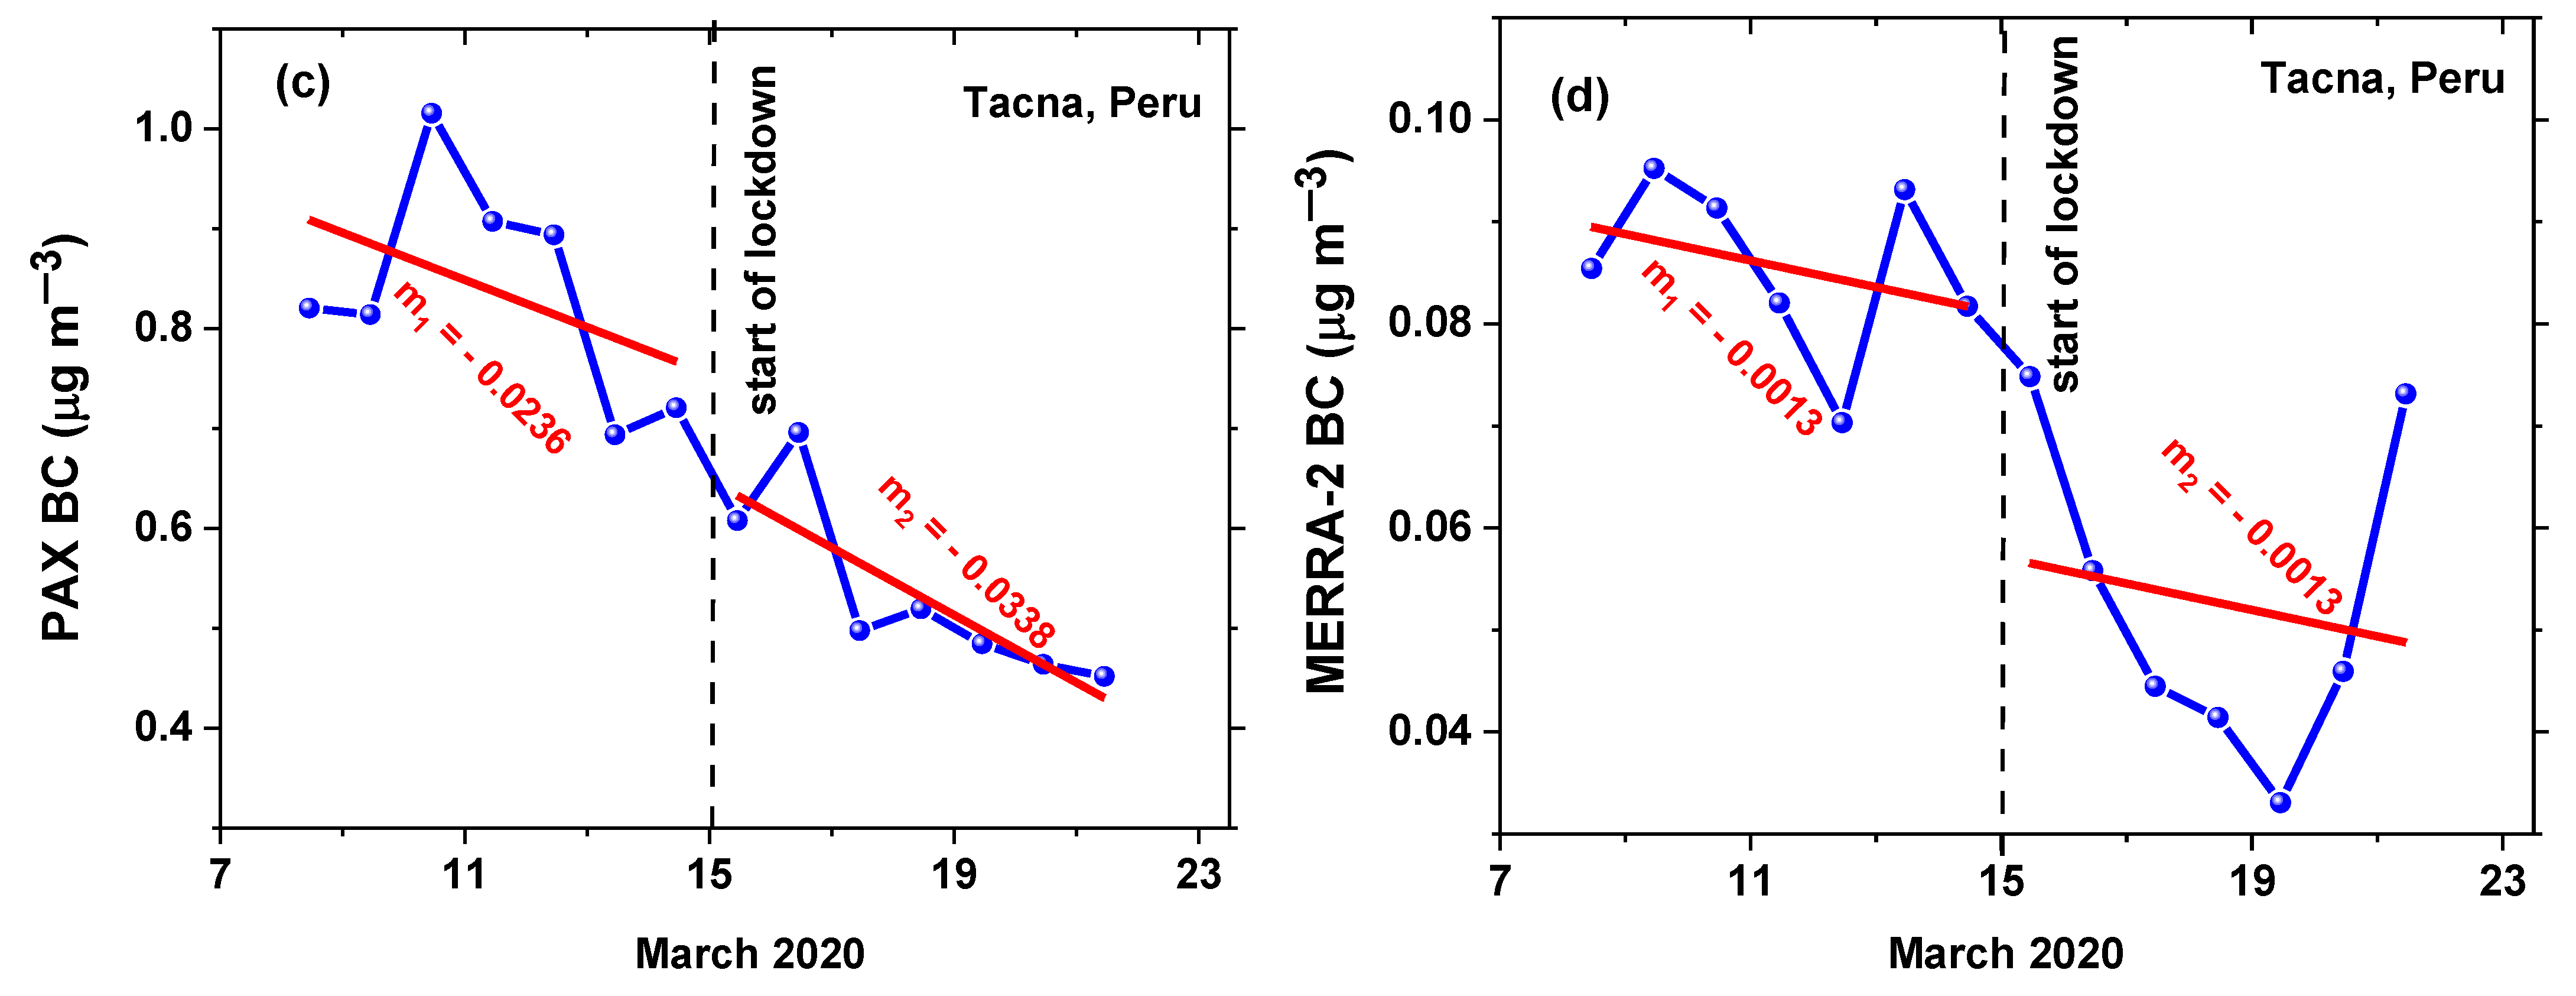
Figure 11 shows the time series of the daily concentrations of PAX BC and MERRA-2 BC two weeks before and after the start of the lockdown due to COVID-19 (15 March 2020), together with their respective lines of trend (red), in Tacna, Peru. Figure 11a shows the PAX BC time series with a dotted vertical line that separates it into two other series (the first from 01 to 14 and the second from 15 to 28). The trend line in the first series presented a positive slope (m1 = 0.0246), which is consistent with the result obtained by the Mann–Kendall test of the increasing trend series. The slope of the trend line of the second series was negative (m2 = −0.0057), a decreasing trend of this series that was confirmed with the Mann–Kendall test (Table 3). Consequently, the decrease in the BC concentration (measured with PAX) was statistically confirmed in the two weeks after the start of the lockdown, compared to the previous two weeks. Figure 11b shows the time series of the daily MERRA-2 BC values. This series was separated into two parts for the trend test, as was performed previously for the PAX BC. The series presented the positive slopes m1 = 0.0023 and m2 = 0.0017, for the first and second series, respectively. The Mann–Kendall test confirmed the first as a series with an increasing trend; however, it determined that in the second there was no trend (Table 3).
The time series of daily PAX BC concentrations one week before and after the start of the lockdown due to COVID-19 are shown in Figure 11c. Both series presented trend lines with negative slopes (m1 = −0.0236 and m2 = −0.0338); however, the Mann–Kendall test applied to these series found no trend in the first and confirmed the downward trend in the second series. Figure 11d shows the time series of the daily MERRA-2 BC values one week before and after 15 March. The trend lines of the two series presented the same negative slope (m1 = m2 = −0.0013); however, the Mann–Kendall test determined that these series did not exhibit a trend (Table 3).

4. Summary and Conclusions

In this study, we evaluated the temporal behavior of the PAX BC and MERRA-2 BC in the city of Tacna from November 2019 to September 2021. The season with the highest seasonal average of PAX BC was winter. The highest seasonal average of MERRA-2 BC occurred during the spring and winter seasons. In contrast, they showed the same seasonal average of MERRA-2 BC in the summer and autumn seasons. PAX BC measurements were an order of magnitude higher than the values obtained by MERRA-2, except during the spring and summer seasons. The results generally suggest a large discrepancy between the PAX BC and the MERRA-2 BC. This difference arises naturally due to the characteristics of these two techniques to obtain BC concentrations.
The diurnal variation in PAX BC for the four seasons was similar. The daily cycles of the MERRA-2 BC were similar to each other. This daily cycle is typical of suburban areas.
The most frequent wind directions were between the south (S) and west (W) of the measurement site, with approximately 81% of the total frequency of wind directions during the entire study period. Specifically, the area between SW (225°) and WSW (247.5°) contributed more than 50% of the total frequency. In general, the concentration of BC showed dependence on the wind. When the wind was weak, high concentrations of BC came from sources between the southeast and northeast of our measurement site. High speeds (regional transport) were not important in Tacna. These results suggest that Tacna is mainly influenced by local emission sources located northeast and southeast of the measurement site.
The following four days were chosen as a case study: two days with the highest concentration of PAX BC (1 January 2020 and 30 June 2021) and two days with the highest values of MERRA-2 BC (15 September and 7 November 2020). During the first hour of 1 January, the highest hourly concentration of PAX BC (~23 µ m−3) was recorded, maintaining high concentrations until 08:00–09:00 LT. These BC plumes were not captured by MERRA-2. Using the HYSPLIT model, it was seen that the air masses from the Pacific Ocean entered the city from the southeast. On 30 June, high concentrations of PAX BC (up to ~11 µ m−3) were recorded between 03:00 and 08:00 LT. This “plume” of carbonaceous aerosols was also not captured by MERRA-2. These results suggest that the MERRA-2 model underestimates urban plumes.
The 7 November presented relatively very high values of MERRA-2 BC, even higher than those of PAX BC. The atmospheric boundary layer during the first hours of this day was relatively low, and the backward trajectories of the air masses reached Tacna from the southeast (100 m), northwest (1000 m), and northeast (2000 m). The second highest value of MERRA-2 BC (15 September) occurs with a relatively high atmospheric boundary layer, and the HYSPLIT backward trajectories indicate subsidence of air masses that came from heights of 3500 m. This result would suggest that the high values of MERRA-2 BC were recorded when the subsidence of air masses occurred.
The Mann–Kendall tests applied to the BC concentration time series (measured with PAX), the trend lines and the mean concentrations statistically confirmed that the lockdown influenced the decrease in the BC surface concentration; however, this test found no trend in the time series of BC values obtained using the MERRA-2 reanalysis. During the first and second weeks after the start of the COVID-19 lockdown, the average concentration of PAX BC decreased by 37% and 30%, respectively.

Author Contributions

Conceptualization, R.N.L.-A., O.R.-P., D.S., G.C., G.P.-M. and W.P.A.; methodology, R.N.L.-A., D.S., W.P.A., G.C., G.P.-M. and D.S.; software, R.N.L.-A. and O.R.-P.; validation, W.P.A., G.C., G.P.-M. and D.S.; formal analysis, R.N.L.-A., W.P.A., G.C., O.R.-P. and D.S.; investigation, R.N.L.-A. and O.R.-P.; data curation, O.R.-P., R.M.L.-A. and H.T.-M.; writing—original draft preparation, R.N.L.-A., H.T.-M. and R.M.L.-A.; writing—review and editing, R.N.L.-A., H.T.-M. and R.M.L.-A.; project administration, R.N.L.-A.; funding acquisition, R.N.L.-A. All authors have read and agreed to the published version of the manuscript.

Funding

This research was funded by the Jorge Basadre Grohmann National University (Rectoral Resolution No. 4516-2018-UNJBG).

Data Availability Statement

Data for meteorological variables and black carbon are not yet publicly available but may be shared for scientific purposes. The MERRA-2 reanalysis data can be obtained from the NASA website (https://gmao.gsfc.nasa.gov/reanalysis/MERRA-2/data_access/, accessed on 31 October 2022).

Acknowledgments

The authors express their gratitude to NASA MERRA-2 website for using the MERRA-2 black carbon reanalysis data in this work, NOAA Air Resources Laboratory (ARL) for providing the HYSPLIT transport and dispersion model and/or the READY website (https://www.ready.noaa.gov, accessed on 7 January 2023) used in this publication; and Jorge Basadre Grohmann National University for funding this research.

Conflicts of Interest

The authors declare no conflict of interest. The funders had no role in the design of the study; in the collection, analyses, or interpretation of data; in the writing of the manuscript; or in the decision to publish the results.

Appendix A

Table A1. Mean values seasonal of PAX BC and MERRA-2 BC for weekends and weekdays in Tacna, Peru.
PeriodBlack CarbonStatisticsSeasons
SpringSummerAutumnWinter
PAX BC
(µg m−3)
MERRA-2 BC
(µg m−3)
20200.720.710.700.85
20210.720.810.760.96
Weekdays2020–20210.720.760.730.91
20200.080.070.060.12
20210.140.050.060.09
2020–20210.110.060.060.10
PAX BC20200.760.690.580.76
(µg m−3)20210.670.680.660.81
Weekends 2020–20210.710.680.620.79
MERRA-2 BC20200.090.070.070.10
(µg m−3)20210.140.050.060.10
2020–20210.110.060.060.10
Figure A1. Monthly black carbon concentrations obtained: (a) with a photoacoustic extinctiometer (PAX BC), and (b) through the NASA MERRA-2 reanalysis (MERRA-2 BC) from November 2019 to September 2021, in Tacna, Peru. Box-and-whisker plots represent the 5th (bottom whisker), 25th (bottom of box), 50th (median), 75th (top of box), and 95th (top whisker) percentiles. The colored circles represent the mean values.
Remotesensing 15 04702 g0a1
Figure A2. Diurnal variations of the BC concentrations by MERRA-2 reanalysis (MERRA-2 BC) of weekdays and weekends for (a) spring, (b) summer, (c) autumn, and (d) winter in Tacna, Peru. For comparison, we also show MERRA-2 BC observations for all days.
Remotesensing 15 04702 g0a2
Figure A3. Daily evolution of the COVID-19 indicators (number of daily cases and number of daily deaths) between March 2020 and September 2021, in Peru. Two large waves occurred in this period.
Remotesensing 15 04702 g0a3

References

  1. Intergovernmental Panel on Climate Change (IPCC). Short-lived climate forcers. In Climate Change 2021: The Physical Science Basis; Contribution of Working Group I to the Sixth Assessment Report of the Intergovernmental Panel on Climate Change; Panel on Climate Change; Cambridge University Press: Cambridge, UK; New York, NY, USA, 2021; pp. 817–922. Available online: https://www.ipcc.ch/report/ar6/wg1/chapter/chapter-6/ (accessed on 10 November 2022).
  2. Cao, S.; Zhang, S.; Gao, C.; Yan, Y.; Bao, J.; Su, L.; Liu, M.; Peng, N.; Liu, M. A long-term analysis of atmospheric black carbon MERRA-2 concentration over China during 1980–2019. Atm. Environ. 2021, 264, 118662. [Google Scholar] [CrossRef]
  3. Bond, T.C.; Doherty, S.J.; Fahey, D.W.; Forster, P.M.; Berntsen, T.; DeAngelo, B.J.; Flanner, M.G.; Ghan, S.; Kärcher, B.; Koch, D.; et al. Bounding the role of black carbon in the climate system: A scientific assessment. J. Geophys. Res. Atmos. 2013, 118, 5380–5552. [Google Scholar] [CrossRef]
  4. Moosmüller, H.; Chakrabarty, R.K.; Arnott, W.P. Aerosol light absorption and its measurement: A review. J. Quant. Spectrosc. Radiat. Transf. 2009, 110, 844–878. [Google Scholar] [CrossRef]
  5. Hansen, J.; Lacis, A.; Ruedy, R.; Sato, M.; Wilson, H. How sensitive is the world’s climate? Natl. Geog. Res. Explor. 1993, 29, 142–158. [Google Scholar]
  6. Yang, F.; Tan, J.; Zhao, Q.; Du, Z.; He, K.; Ma, Y.; Duan, F.; Chen, G.; Zhao, Q. Characteristics of PM 2.5 speciation in representative megacities and across China. Atmos. Chem. Phys. 2011, 11, 5207–5219. [Google Scholar] [CrossRef]
  7. Aiken, A.C.; Salcedo, D.; Cubison, M.J.; Huffman, J.A.; DeCarlo, P.F.; Ulbrich, I.M.; Docherty, K.S.; Sueper, D.; Kimmel, J.R.; Worsnop, D.R.; et al. Mexico City aerosol analysis during MILAGRO using high resolution aerosol mass spectrometry at the urban supersite (T0)–Part 1: Fine particle composition and organic source apportionment. Atmos. Chem. Phys. 2009, 9, 6633–6653. [Google Scholar] [CrossRef]
  8. Jimenez, J.L.; Canagaratna, M.R.; Donahue, N.M.; Prévôt, A.S.H.; Zhang, Q.; Kroll, J.H.; DeCarlo, P.F.; Allan, J.D.; Coe, H.; Ng, N.L.; et al. Evolution of organic aerosols in the atmosphere. Science 2009, 326, 1525–1529. [Google Scholar] [CrossRef] [PubMed]
  9. Salcedo, D.; Onasch, T.B.; Dzepina, K.; Canagaratna, M.R.; Zhang, Q.; Huffman, J.A.; DeCarlo, P.F.; Jayne, J.T.; Mor-timer, P.; Worsnop, D.R.; et al. Characterization of ambient aerosols in Mexico City during the MCMA-2003 campaign with Aerosol Mass Spectrometry: Results from the CENICA Super-site. Atmos. Chem. Phys. 2006, 6, 925–946. [Google Scholar] [CrossRef]
  10. Cao, J.J.; Zhu, C.S.; Chow, J.C.; Watson, J.G.; Han, Y.-M.; Wang, G.-H.; Shen, Z.X.; An, Z.S. Black carbon relationships with emissions and meteorology in Xi’an, China. Atmos. Res. 2009, 94, 194–202. [Google Scholar] [CrossRef]
  11. Han, S.; Kondo, Y.; Oshima, N.; Takegawa, N.; Miyazaki, Y.; Hu, M.; Lin, P.; Deng, Z.; Zhao, Y.; Sugimoto, N.; et al. Temporal variations of elemental carbon in Beijing. J. Geophys. Res. 2009, 114, D23202. [Google Scholar] [CrossRef]
  12. Kondo, Y.; Komazaki, Y.; Miyazaki, Y.; Moteki, N.; Takegawa, N.; Kodama, D.; Deguchi, S.; Nogami, M.; Fukuda, M.; Miyakawa, T.; et al. Temporal variations of elemental carbon in Tokyo. J. Geophys. Res. 2006, 111, D12205. [Google Scholar] [CrossRef]
  13. Ramachandran, S.; Rupakheti, M. Trends in physical, optical, and chemical columnar aerosol characteristics and radiative effects over South and East Asia: Satellite and ground-based observations. Gondwana Res. 2022, 105, 366–387. [Google Scholar] [CrossRef]
  14. Ramanathan, V.; Carmichael, G. Global and regional changes climate due to black carbon. Nat. Geosci. 2008, 1, 221–227. [Google Scholar] [CrossRef]
  15. Baumgartner, J.; Zhang, Y.X.; Schauer, J.J.; Huang, W.; Wang, Y.Q.; Ezzati, M. Highway proximity and black carbon from cookstoves as a risk factor for higher blood pressure in rural China. Proc. Natl. Acad. Sci. USA 2014, 111, 13229–13234. [Google Scholar] [CrossRef]
  16. Intergovernmental Panel on Climate Change (IPCC). Short-lived climate forcers. In Climate Change 2013: The Physical Science Basis; Contribution of Working Group I to the Fifth Assessment Report of the Intergovernmental Panel on Climate Change; Panel on Climate Change; Cambridge University Press: Cambridge, UK; New York, NY, USA, 2013; pp. 571–658. Available online: https://www.ipcc.ch/site/assets/uploads/2018/02/WG1AR5_Chapter07_FINAL-1.pdf (accessed on 15 November 2022).
  17. Melzi, G.; Nozza, E.; Frezzini, M.A.; Canepari, S.; Vecchi, R.; Cremonesi, L.L.; Potenza, M.; Marinovich, M.; Corsini, E. Toxicological Profile of PM from Different Sources in the Bronchial Epithelial Cell Line BEAS-2B. Toxics 2023, 11, 413. [Google Scholar] [CrossRef]
  18. Steiner, S.; Mueller, L.; Popovicheva, O.B.; Raemy, D.O.; Czerwinski, J.; Comte, P.; Mayer, A.; Gehr, P.; Rothen-Rutishauser, B.; Clift, M.J.D. Cerium dioxide nanoparticles can interfere with the associated cellular mechanistic response to diesel exhaust exposure. Toxicol. Lett. 2012, 214, 218–225. [Google Scholar] [CrossRef]
  19. Jung, K.H.; Patel, M.M.; Moors, K.; Kinney, P.L.; Chillrud, S.N.; Whyatt, R.; Hoepner, L.; Garfinkel, R.; Yan, B.; Ross, J.; et al. Effects of Heating Season on Residential Indoor and Outdoor Polycyclic Aromatic Hydrocarbons, Black Carbon, and Particulate Matter in an Urban Birth Cohort. Atmos. Environ. 2010, 44, 4545–4552. [Google Scholar] [CrossRef]
  20. Valavanidis, A.; Fiotakis, K.; Vlachogianni, T. Airborne particulate matter and human health: Toxicological assessment and importance of size and composition of particles for oxidative damage and carcinogenic mechanisms. J. Environ. Sci. Health Parth C Environ. Carcinog. Ecotoxicol. Rev. 2008, 26, 339–362. [Google Scholar] [CrossRef]
  21. Pope III, C.A.; Dockery, D.W. Health Effects of Fine Particulate Air Pollution: Lines that connect. J. Air Waste Manag. Assoc. 2006, 56, 709–742. [Google Scholar] [CrossRef]
  22. Dockery, D.W.; Pope, C.A. Epidemiology of acute health effects: Summary of time-series. In Particles in Our Air: Concentration and Health Effects; Harvard University Press: Cambridge, MA, USA, 1993; pp. 123–147. [Google Scholar]
  23. McConnell, R.; Islam, T.; Shankardass, K.; Jerrett, M.; Lurmann, F.; Gilliland, F.; Gauderman, J.; Avol, E.; Künzli, N.; Yao, L.; et al. Childhood incident asthma and traffic-related air pollution at home and school. Environ. Health Perspect. 2010, 118, 1021–1026. [Google Scholar] [CrossRef]
  24. Steiner, S.; Bisig, C.; Petri-Fink, A.; Rothen-Rutishauser, B. Diesel exhaust: Current knowledge of adverse effects and underlying cellular mechanisms. Arch. Toxicol. 2016, 90, 1541–1553. [Google Scholar] [CrossRef] [PubMed]
  25. Rosa, M.J.; Yan, B.; Chillrud, S.N.; Acosta, L.M.; Divjan, A.; Jacobson, J.S.; Miller, R.L.; Goldstein, I.F.; Perzanowski, M.S. Domestic airborne black carbon levels and 8-isoprostane in exhaled breath condensate among children in New York City. Environ. Res. 2014, 135, 105–110. [Google Scholar] [CrossRef] [PubMed]
  26. Cornell, A.G.; Chillrud, S.N.; Mellins, R.B.; Acosta, L.M.; Miller, R.L.; Quinn, J.W.; Yan, B.; Divjan, A.; Olmedo, O.E.; Lopez-Pintado, S.; et al. Domestic airborne black carbon and exhaled nitric oxide in children in NYC. J. Expos. Sci. Environ. Epidem. 2012, 22, 258–266. [Google Scholar] [CrossRef]
  27. Xu, X.; Yang, X.; Zhu, B.; Tang, Z.; Wu, H.; Xie, L. Characteristics of MERRA-2 black carbon variation in east China during 2000–2016. Atmos. Environ. 2019, 222, 117140. [Google Scholar] [CrossRef]
  28. Manoharan, V.; Kotamarthi, V.; Liao, K. Data Assimilation of CO, and Primary Aerosols (BC) Using the GEOS-Chem Model Based on EaKF Technique. In Proceedings of the American Geophysical Union Fall Meeting 2011, San Francisco, CA, USA, 9 December 2011. [Google Scholar]
  29. Schuster, G.L.; Dubovik, O.; Holben, B.N.; Clothiaux, E.E. Inferring black carbon content and specific absorption from Aerosol Robotic Network (AERONET) aerosol retrievals. J. Geophys. Res. 2005, 110, D10S17. [Google Scholar] [CrossRef]
  30. Gelaro, R.; McCarty, W.; Suárez, M.J.; Todling, R.; Molod, A.; Takacs, L.; Randles, C.A.; Darmenov, A.; Bosilovich, M.G.; Reichle, R.; et al. The Modern-Era Retrospective Analysis for Research and Applications, Version 2 (MERRA-2). J. Clim. 2017, 30, 5419–5454. [Google Scholar] [CrossRef]
  31. Ou, Y.; Li, Z.; Chen, C.; Zhang, Y.; Li, K.; Shi, Z.; Dong, J.; Xu, H.; Peng, Z.; Xie, Y.; et al. Evaluation of MERRA-2 Aerosol Optical and Component Properties over China Using SONET and PARASOL/ GRASP Data. Remote Sens. 2022, 14, 821. [Google Scholar] [CrossRef]
  32. Qin, W.; Zhang, Y.; Chen, J.; Yu, Q.; Cheng, S.; Li, W.; Liu, X.; Tian, H. Variation, sources, and historical trend of black carbon in Beijing, China based on ground observation and MERRA-2 reanalysis data. Environ. Pollut. 2018, 245, 853–863. [Google Scholar] [CrossRef]
  33. Ramachandran, S.; Rupakheti, M.; Lawrence, M. Black carbon dominates the aerosol absorption over the Indo-Gangetic Plains and the Himalayan foothills. Environ. Int. 2020, 142, 105814. [Google Scholar] [CrossRef]
  34. Zhuravleva, T.B.; Artyushina, A.V.; Vinogradova, A.A.; Voronina, Y.V. Black carbon in the surface air far from the emission sources: Comparison of measurement results and MERRA-2 reanalysis. Opt. Atmos. Okeana 2020, 33, 250–260. [Google Scholar] [CrossRef]
  35. Vinogradova, A.A.; Kopeikin, V.M.; Vasileva, A.V.; Smirnov, N.S.; Ivanova, Y.A. Concentration of Black Carbon in the Near-Surface Atmosphere in the Pechora-Ilych Natural Reserve: Measurements and Merra-2 Reanalysis. Izv. Atmos. Ocean. Phys. 2020, 56, 1191–1201. [Google Scholar] [CrossRef]
  36. Sitnov, S.A.; Mokhov, I.I.; Likhosherstova, A.A. Exploring large-scale black-carbon air pollution over Northern Eurasia in summer 2016 using MERRA-2 reanalysis data. Atmos. Res. 2020, 235, 104763. [Google Scholar] [CrossRef]
  37. Ansari, K.; Ramachandran, S. Aerosol characteristics over Indo-Gangetic Plain from ground-based AERONET and MERRA-2/CAMS model simulations. Atmos. Environ. 2023, 293, 119434. [Google Scholar] [CrossRef]
  38. Sun, E.; Xu, X.; Che, H.; Tang, Z.; Gui, K.; An, L.; Lu, C.; Shi, G. Variation in MERRA-2 aerosol optical depth and absorption aerosol optical depth over China from 1980 to 2017. J. Atmos. Solar-Terrest. Phys 2019, 186, 8–19. [Google Scholar] [CrossRef]
  39. Song, Z.; Fu, D.; Zhang, X.; Wu, Y.; Xia, X.; He, J.; Han, X.; Zhang, R.; Che, H. Diurnal, and seasonal variability of PM2.5 and AOD in North China plain: Comparison of MERRA-2 products and ground measurements. Atmos. Environ 2018, 191, 70–78. [Google Scholar] [CrossRef]
  40. Hansen, J.; Sato, M.; Ruedy, R.; Lacis, A.; Oinas, V. Global warming in the twenty-first century: An alternative scenario. Proc. Natl. Acad. Sci. USA 2000, 97, 9875–9880. [Google Scholar] [CrossRef]
  41. Targino, A.C.; Krecl, P.; Oukawa, G.Y.; Mollinedo, E.M. A short climatology of black and brown carbon and their sources at a suburban site impacted by smoke in Brazil. J. Environ. Sci. 2023, 136, 498–511. [Google Scholar] [CrossRef]
  42. Krecl, P.; Oukawa, G.Y.; Charres, I.; Targino, A.C.; Grauer, A.F.; Cavalcanti e Silva, D. Compilation of a city-scale black carbon emission inventory: Challenges in developing countries based on a case study in Brazil. Sci. Total Environ. 2022, 839, 156332. [Google Scholar] [CrossRef]
  43. Blanco-Donado, E.P.; Schneider, I.L.; Artaxo, P.; Lozano-Osorio, J.; Portz, L.; Oliveira, M.L.S. Source identification and global implications of black carbon. Geosci. Front. 2022, 13, 101149. [Google Scholar] [CrossRef]
  44. Reyes, F.; Ahumada, S.; Rojas, F.; Oyola, P.; Vásquez, Y.; Aguilera, C.; Henriquez, A.; Gramsch, E.; Kang, C.M.; Saarikoski, S.; et al. Impact of Biomass Burning on Air Quality in Temuco City, Chile. Aerosol Air Qual. Res. 2021, 21, 210110. [Google Scholar] [CrossRef]
  45. Gramsch, E.; Muñoz, A.; Langner, J.; Morales, L.; Soto, C.; Pérez, P.; Rubio, M.A. Black carbon transport between Santiago de Chile and glaciers in the Andes Mountains. Atmos. Environ. 2020, 232, 117546. [Google Scholar] [CrossRef]
  46. Servicio Nacional de Meteorología e Hidrología del Peru (SENAMHI). Climas del Peru: Mapa de Clasificación Climática Nacional, 2021, 1era. Ed. August 2021. Available online: www.gob.pe/senamhi (accessed on 15 December 2022).
  47. Narvaez-Montoya, C.; Torres-Martínez, J.A.; Pino-Vargas, E.; Cabrera-Olivera, F.; Loge, F.J.; Mahlknecht, J. Predicting adverse scenarios for a transboundary coastal aquifer system in the Atacama Desert (Peru/Chile). Sci. Total Environ. 2022, 806, 150386. [Google Scholar] [CrossRef]
  48. Instituto Nacional de Estadística e Informática (INEI). Peru: Estimaciones y Proyecciones de Población por Departamento. Provincia y Distrito, 2018–2020. 2020, Boletín Especial N° 26, January 2020. Available online: https://www.inei.gob.pe/media/MenuRecursivo/publicaciones_digitales/Est/Lib1715/ (accessed on 15 December 2022).
  49. Carn, S.A.; Krueger, A.J.; Krotkov, N.A.; Yang, K.; Levelt, P.F. Sulfur dioxide emissions from Peruvian copper smelters detected by the Ozone Monitoring Instrument. Geophys. Res. Lett. 2007, 34, L09801. [Google Scholar] [CrossRef]
  50. Houston, J. Variability of precipitation in the Atacama Desert: Its causes and Hidrological impact. Int. J. Climatol. 2006, 26, 2181–2198. [Google Scholar] [CrossRef]
  51. Bretherton, C.S.; Peters, M.E.; Back, L.E. Relationships between Water Vapor Path and precipitation over the Tropical Oceans. J. Am. Meteorol. Soc. 2004, 17, 1517–1528. [Google Scholar] [CrossRef]
  52. Klein, S.A.; Hartmann, D.L. The seasonal Cycle of Low Stratiform Clouds. J. Am. Meteorol. Soc. 1993, 6, 1578–1606. [Google Scholar] [CrossRef]
  53. Retama, A.; Baumgardner, D.; Raga, G.B.; McMeeking, G.R.; Walker, J.W. Seasonal and diurnal trends in Black Carbon properties and co-Pollutants in Mexico City. J. Atmos. Chem. Phys. 2015, 15, 9693–9709. [Google Scholar] [CrossRef]
  54. Paredes-Miranda, G.; Arnott, W.P.; Jimenez, J.L.; Aiken, A.C.; Gaffney, J.S.; Marley, N.A. Primary and secondary contributions to aerosol light scattering and absorption in Mexico City during the MILAGRO 2006 campaign. Atmos. Chem. Phys. 2009, 9, 3721–3730. [Google Scholar] [CrossRef]
  55. Arnott, W.P.; Moosmüller, H.; Rogers, C.F.; Jin, T.; Bruch, R. Photoacoustic spectrometer for measuring light absorption by aerosols: Instrument description. Atmos. Environ. 1999, 33, 2845–2852. [Google Scholar] [CrossRef]
  56. Bond, T.C.; Bergstrom, R.W. Light Absorption by carbonaceous Particles: An Investigative Review. Aerosol Sci. Technol. 2006, 40, 27–67. [Google Scholar] [CrossRef]
  57. Randles, C.A.; da Silva, A.M.; Buchard, V.; Colarco, P.R.; Darmenov, A.; Govindaraju, R.; Smirnov, A.; Holben, B.; Ferrare, R.; Hair, J.; et al. The MERRA-2 Aerosol Reanalysis, 1980 onward. Part I: System Description and Data Assimilation Evaluations. J. Clim. 2017, 30, 6823–6850. [Google Scholar] [CrossRef] [PubMed]
  58. Buchard, V.; Randles, C.A.; da Silva, A.M.; Darmenov, A.; Colarco, P.R.; Govindaraju, R.; Ferrare, R.; Hair, J.; Beyersdorf, A.J.; Ziemba, L.D.; et al. The MERRA-2 Aerosol Reanalysis, 1980 onward. Part II: Evaluation and Case Studies. J. Clim. 2017, 30, 6851–6872. [Google Scholar] [CrossRef] [PubMed]
  59. Rolph, G.; Stein, A.; Stunder, B. Real-time Environmental Applications and Display System: READY. Environ. Model. Softw. 2017, 95, 210–228. [Google Scholar] [CrossRef]
  60. Stein, A.F.; Draxler, R.R.; Rolph, G.D.; Stunder, B.; Cohen, M.D.; Ngan, F. NOAA’s HYSPLIT atmospheric transport and dispersion modeling system. Bull. Amer. Meteor. Soc. 2015, 96, 2059–2077. [Google Scholar] [CrossRef]
  61. Wang, L.; Zhang, X.; Ming, J. Aerosol Optical Properties Measurement Using a PAX in Central Asia from 2016 to 2019 and the Climatic and Environment Outlooks. ACS Earth Space Chem. 2021, 5, 95–105. [Google Scholar] [CrossRef]
  62. Gebhart, K.A.; Schichtel, B.A.; Malm Barna, M.G.; Rodriguez, M.A.; Collett, J.L. Back-trajectory-based source apportionment of airborne sulfur and nitrogen concentrations at Rocky Mountain National Park, Colorado, USA. Atmos. Environ. 2011, 45, 621–633. [Google Scholar] [CrossRef]
  63. Zora Carbajal, F. Tacna Historia y Folklore, 2nd ed.; Editorial Santa Mara: Tacna, Peru, 1969. [Google Scholar]
  64. Buchard, V.; da Silva, A.M.; Randles, C.A.; Colarco, P.R.; Ferrare, R.; Hair, J.; Hostetler, C.; Tackett, J.; Winker, D. Evaluation of the surface PM 2.5 in version 1 of the NASA MERRA Aerosol Reanalysis over the United States. Atmos. Environ. 2016, 125, 100–111. [Google Scholar] [CrossRef]
  65. Buchard, V.; da Silva, A.M.; Colarco, P.R.; Darmenov, A.; Randles, C.A.; Govindaraju, R.; Torres, O.; Campbell, J.; and Spurr, R. Using the OMI aerosol index and absorption aerosol optical depth to evaluate the NASA MERRA Aerosol Reanalysis. Atmos. Chem. Phys. 2015, 15, 5743–5760. [Google Scholar] [CrossRef]
  66. Li, C.; McLinden, C.; Fioletov, V.; Krotkov, N.; Carn, S.; Joiner, J.; Streets, D.; He, H.; Ren, X.; Li, Z.; et al. India Is Overtaking China as the world’s Larger Emitter of Anthropogenic Sulfur Dioxide. Sci. Rep. 2017, 7, 14304. [Google Scholar] [CrossRef]
  67. Pan, L.; Che, H.; Geng, F.; Xia, X.; Wang, Y.; Zhu, C.; Chen, M.; Gao, W.; Guo, J. Aerosol optical properties based on ground measurements over the Chinese Yangtze delta Region. Atmos. Environ. 2010, 44, 2587–2596. [Google Scholar] [CrossRef]
  68. Van Donkelaar, A.; Martin, R.V.; Brauer, M.; Boys, B.L. Use of satellite observations for long term exposure assessment of global concentrations of fine particulate matter. Environ. Health Perspect. 2015, 123, 135–143. [Google Scholar] [CrossRef] [PubMed]
  69. Van Donkelaar, A.; Martin, R.V.; Brauer, M.; Kahn, R.; Levy, R.; Verduzco, C.; Villeneuve, P.J. Global Estimates of Ambient Fine Particulate Matter Concentrations from Satellite-Based Aerosol Optical Depth: Development and Application. Environ. Health Perspect. 2010, 118, 847–855. [Google Scholar] [CrossRef] [PubMed]
  70. Ramachandran, S.; Rupakheti, M.; Cherian, R. Insights into recent aerosol trends over Asia: From observations and CMIP6 simulations. Sci. Total Environ. 2022, 807, 150756. [Google Scholar] [CrossRef] [PubMed]
  71. Liñán-Abanto, R.N.; Salcedo, D.; Arnott, P.; Paredes-Miranda, L.; Grutter, M.; Peralta, O.; Carabali, G.; Serrano-Silva, N.; Ruiz-Suárez, L.G.; Castro, T. Temporal variations of black carbon, carbon monoxide, and carbon dioxide in Mexico City: Mutual Correlations and evaluation of emissions inventories. Urban Clim. 2021, 37, 100855. [Google Scholar] [CrossRef]
  72. Zhang, X.; Rao, R.; Huang, Y.; Mao, M.; Berg, M.J.; Sun, W. Black carbon aerosols in urban central China. J. Quant. Spectrosc. Radiat. Transfer. 2015, 150, 3–11. [Google Scholar] [CrossRef]
  73. Zhuang, B.L.; Wang, T.J.; Liu, J.; Li, S.; Xie, M.; Yang, X.Q.; Fu, C.B.; Sun, J.N.; Yin, C.Q.; Liao, J.B.; et al. Continuous measurement of black carbon aerosol in urban Nanjing of Yangtze River Delta, China. Atmos. Environ. 2014, 89, 415–424. [Google Scholar] [CrossRef]
  74. Liñán-Abanto, R.N.; Peralta, O.; Salcedo, D.; Ruiz-Suárez, L.G.; Arnott, P.; Paredes-Miranda, L.; Alvarez-Ospina, H.; Castro, T. Optical properties of atmospheric particles over an urban site Mexico City and a peri-urban site in Queretaro. J. Atmos. Chem. 2019, 76, 201–228. [Google Scholar] [CrossRef]
  75. Qin, Y.; Xie, S. Spatial and temporal variation of anthropogenic black carbon emissions in China for the period 1980–2009. Atmos. Chem. Phys. 2012, 12, 4825–4841. [Google Scholar] [CrossRef]
  76. He, X.; Li, C.C.; Lau, A.K.H.; Deng, Z.Z.; Mao, J.T.; Wang, M.H.; Liu, X.Y. An intensive study of aerosol optical properties in Beijing urban area. Atmos. Chem. Phys. 2009, 9, 8903–8915. [Google Scholar] [CrossRef]
  77. Gilbert, R.O. Statistical Methods for Environmental Pollution Monitoring; John Wiley & Sons: New York, NY, USA, 1987. [Google Scholar]
  78. Hollander, M.; Wolfe, D.A. Nonparametric Statistical Methods; John Wiley & Sons: New York, NY, USA, 1973. [Google Scholar]
  79. Salmi, T.; Maata, A.; Antilla, P.; Ruoho-Airola, T.; Amnell, T. Detecting Trends of Annual Values of Atmospheric Pollutants by the Mann-Kendall Test and Sen’s Slope Estimates-The Excel Template Application MAKENSENS; FIN-00101; Finnish Meteorological Institute, Publications on Air Quality: Helsinki, Finland, 2002; p. 31. [Google Scholar]
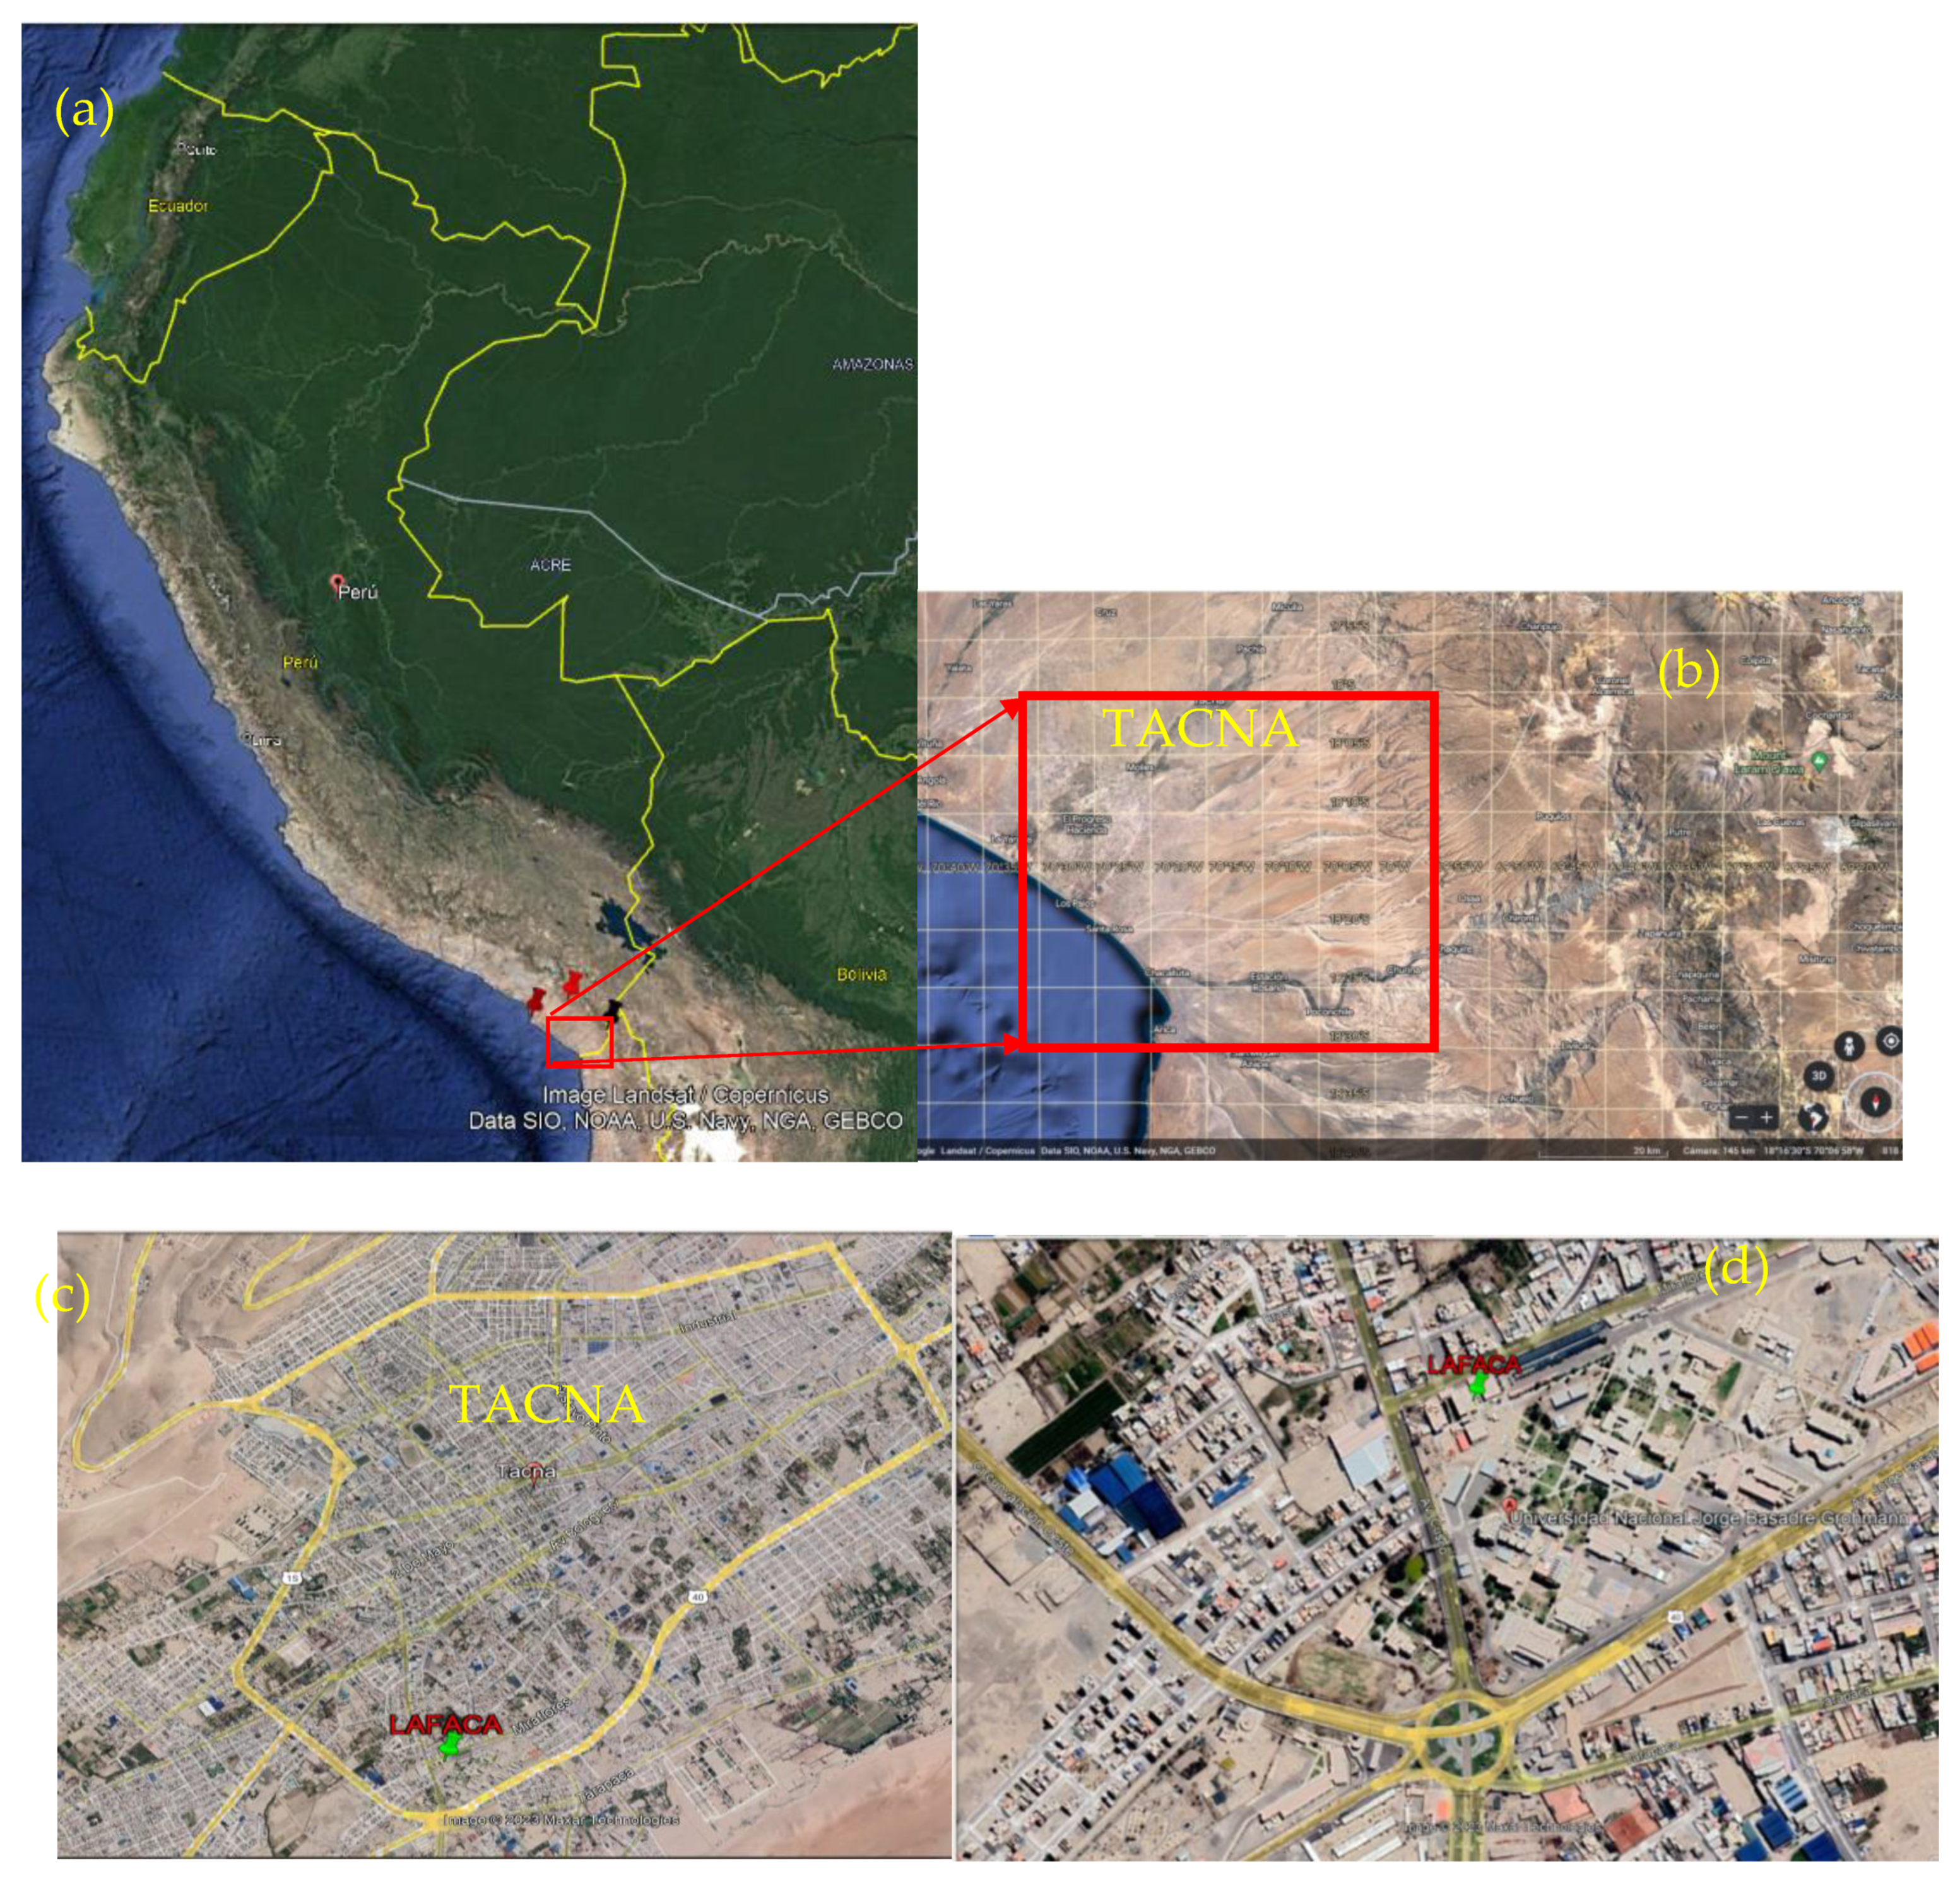
Figure 1. (a) Map of Peru and its surroundings, where the red box represents the grid cell where the city of Tacna is located. The red, black, and wine icons represent the locations of the Toquepala mine, the Pucamarca mine, and the copper smelter, respectively. (b) Plot of the grid cell domain 18.0–18.5°S and 70.000–70.625°W with the city of Tacna on the map. (c) The metropolitan area of the city of Tacna. (d) The location of the measurement site: Laboratory of Physics of the Atmosphere and Air Quality (LAFACA) of the Jorge Basadre Grohmann National University (UNBG).
Remotesensing 15 04702 g001
Figure 2. Time series of daily accumulated precipitation during the entire study period in Tacna, Peru. The dotted vertical lines divide the entire measurement period into seasons: spring (SP), summer (SU), autumn (AU), and winter (WI).
Remotesensing 15 04702 g002
Figure 3. Seasonal daily patterns of: (a) temperature; (b) relative humidity; (c) wind speed; and (d) solar irradiance in Tacna, Peru.
Remotesensing 15 04702 g003
Figure 4. Time series during the entire measurement period in Tacna, Peru, of: (a) PAX BC, black carbon obtained by the photoacoustic extinctiometer (PAX), and (b) MERRA-2 BC, black carbon data from the MERRA -2 reanalysis. The dotted vertical lines divide the entire period into seasons: spring (SP), summer (SU), autumn (AU), and winter (WI). The two days of highest PAX BC (1 January 2020 and 30 June 2021) and the two highest MERRA-2 BC values (15 September and 7 November 2020) are highlighted.
Remotesensing 15 04702 g004
Figure 5. Seasonal concentrations of black carbon obtained by: (a) PAX (PAX BC), and (b) MERRA-2 reanalysis (MERRA-2 BC).
Remotesensing 15 04702 g005
Figure 6. Seasonal diurnal variations of: (a) PAX BC, and (b) MERRA-2 BC), in Tacna, Peru.
Remotesensing 15 04702 g006
Figure 7. Daily cycles of PAX BC and MERRA-2 BC for (a) the two days with the highest PAX BC (1 January 2020 and 30 June 2021); (b) Highest MERRA-2 BC values (15 September and 7 November 2020).
Remotesensing 15 04702 g007
Figure 8. Evolution of the mid-boundary layer height for the four (04) days with the highest values of black carbon concentration in Tacna, Peru. Two days measured with the PAX (1 January 2020, and 30 June 2021), and two days measured by the MERRA-2 reanalysis (7 November 2020, and 15 September 2020).
Remotesensing 15 04702 g008
Figure 9. Wind dependence of black carbon obtained PAX (PAX BC) in Tacna, Peru, for: (a) spring; (b) summer; (c) autumn; and (d) winter.
Remotesensing 15 04702 g009
Figure 10. HYSPLIT trajectories backwards for four (04) days when the highest values of black carbon concentration occurred in Tacna, Peru. Two days (1 January 2020, and 30 June 2021) measured with the PAX (top), and two days (7 November 2020, and 15 September 2020) obtained by the MERRA-2 reanalysis (bottom). The red, blue, and green trajectories backward representative of 24 h, ending at 10:00 UTC (05:00 local time), were executed at 100 m, 1000 m, and 2000 m above ground level, respectively.
Remotesensing 15 04702 g010aRemotesensing 15 04702 g010b
Figure 11. Shows the time series of the daily concentrations of PAX BC and MERRA-2 BC in Tacna, Peru, during March 2020 (15 March start of lockdown). (a) PAX BC time series two weeks before and after of start of the 15 March; (b) MERRA-2 BC time series two weeks before and after of start of the lockdown; (c) PAX BC time series one week before and after of start of the lockdown; and (d) MERRA-2 BC time series one week before and after of 15 March. The trend lines are shown with their respective slopes (m).
Remotesensing 15 04702 g011aRemotesensing 15 04702 g011b
Table 1. Mean values seasonal of meteorological variables in Tacna, Peru.
Meteorological VariablesPeriodSpringSummerAutumnWinter
Temperature (°C)202019.0421.5217.5713.58
202116.4020.6216.7613.07
2020–202116.9221.0617.1213.24
202074.6573.7180.6081.94
Relative humidity (%)202178.8371.2679.8685.66
2020–202177.4472.4680.0382.94
20202.041.891.601.63
Wind speed (m s−1)20211.961.921.661.57
2020–20211.971.911.631.60
2020214.03233.56187.45159.22
Solar irradiance (W m−2)2021203.96267.72169.01124.27
2020–2021207.24250.99175.90142.45
Table 2. Seasonal statistics of PAX BC and MERRA-2 BC in Tacna, Peru.
Black CarbonStatisticsSeasons
SpringSummerAutumnWinter
BC-PAX
(µg m−3)
Minimum0.170.060.210.15
Mean0.700.730.700.85
Median0.660.640.600.79
Stand. Dev.0.350.460.390.46
Maximum5.9411.005.136.14
BC-MERRA2
(µg m−3)
Minimum0.000.030.030.03
Mean0.120.060.060.11
Median0.090.060.060.09
Stand. Dev.0.110.020.020.06
Maximum1.350.130.120.46
Table 3. Statistics of the Mann–Kendall non-parametric test for trends applied to the time series of the daily concentrations of PAX BC and MERRA-2 BC two and one week before and after the start of the lockdown due to COVID-19, in Tacna, Peru.
Period
(Week)
Statistics of
Mann–Kendall Test
PAX BC (µg m−3)MERRA-2 BC (µg m−3)
Pre-Start LockdownPost-Start LockdownDecreased (%)Pre-Start LockdownPost-Start Lockdown Decreased (%)
Mean0.7450.523300.0770.060821
Slope (m)0.0246−0.0057 0.00230.0017
TwoA0.050.05 0.050.05
S43−13 4325
Z2.299−2.299 2.2991.3138
ZP1.6451.96 1.6451.96
TrendUpwardDownward UpwardNo
Mean0.8380.531370.08560.052738
Slope (m)−0.0236−0.0338 −0.0013−0.0013
OneA0.050.05 0.050.05
S−7−17 −7−5
P.V.0.1910.0054 0.1910.281
TrendNoDownward NoNo
α: Significance level; S: statistics of Mann–Kendall; Z: statistics of normal approximation; ZP: Z-score; P.V.: probability value of S; No: there was no trend.
Disclaimer/Publisher’s Note: The statements, opinions and data contained in all publications are solely those of the individual author(s) and contributor(s) and not of MDPI and/or the editor(s). MDPI and/or the editor(s) disclaim responsibility for any injury to people or property resulting from any ideas, methods, instructions or products referred to in the content.