Article

Vegetation Dynamics and Its Trends Associated with Extreme Climate Events in the Yellow River Basin, China

1
College of Geography and Environmental Science, Henan University, Kaifeng 475004, China
2
Key Laboratory of Geospatial Technology for the Middle and Lower Yellow River Region, Ministry of Education, Henan University, Kaifeng 475004, China
3
School of Earth and Environmental Sciences, University of Queensland, Brisbane, QLD 4072, Australia
4
Beijing Totop Technology Co., Ltd., Beijing 100043, China
*
Author to whom correspondence should be addressed.
Remote Sens. 2023, 15(19), 4683; https://doi.org/10.3390/rs15194683
Submission received: 31 July 2023 / Revised: 8 September 2023 / Accepted: 22 September 2023 / Published: 25 September 2023
(This article belongs to the Special Issue Monitoring Ecohydrology with Remote Sensing)

Abstract

:
As a vital ecological barrier in China, Yellow River Basin (YRB) is strategically significant for China’s national development and modernization. However, YRB has fragile ecosystems, and is sensitive to climatic change. Extreme climate events (e.g., heavy precipitation, heatwaves, and extreme hot and cold) occur frequently in this basin, but the implications (positive and negative effects) of these events on vegetation dynamics remains insufficiently understood. Combing with net primary productivity (NPP), the normalized difference vegetation index (NDVI) and extreme climate indexes, we explored the spatio–temporal characteristics of plants’ growth and extreme climate, together with the reaction of plants’ growth to extreme climate in the Yellow River Basin. This study demonstrated that annual NPP and NDVI of cropland, forest, and grassland in the study region all revealed a climbing tendency. The multi-year monthly averaged NPP and NDVI were characterized by a typical unimodal distribution, with the maximum values of NPP (66.18 gC·m−2) and NDVI (0.54) occurring in July and August, respectively. Spatially, multi–year averaged of vegetation indicators decreased from southeast to northwest. During the study period, carbon flux (NPP) and vegetation index (NDVI) both exhibited improvement in most of the YRB. The extreme precipitation indexes and extreme high temperature indexes indicated an increasing tendency; however, the extreme low temperature indexes reduced over time. NPP and NDVI were negatively associated with extreme low temperature indexes and positively correlated with extreme high temperature indexes, and extreme precipitation indicators other than consecutive dry days. Time lag cross–correlation analysis displayed that the influences of extreme temperature indexes on vegetation indexes (NPP and NDVI) were delayed by approximately six months, while the effects of extreme precipitation indexes were immediate. The study outcomes contribute to our comprehension of plants’ growth, and also their reaction to extreme climates, and offer essential support for evidence–based ecological management practices in the Yellow River Basin.

Graphical Abstract

1. Introduction

Vegetation, as many studies have shown, performs an essential role in the transaction of materials and energy [1] between atmosphere and land [2], acting as a link between the soil, water, and atmosphere [3,4]. By doing so, it is able to maintain the stability of the terrestrial ecosystems. However, these ecosystems are undergoing significant changes due to global climatic change, which can potentially intensify the frequency and geographic scope of extreme events, making it a major concern for vegetation. As such, identifying trends in vegetation growth and evaluating the influence of extreme climate on ecosystem are of great theoretical materiality in assessing the ecological environment.
The temperature of terrestrial surface increased by approximately 1.09 °C in the period from 2011 to 2020 compared to the industrial revolution [5]. Under global warming, extreme high temperature episodes have increased significantly in over 70% of the world, whilst extreme low temperature episodes have reduced noticeably in the past 50 years [6]. Meanwhile, extreme precipitation displayed an increase, although which areas might be affected was highly uncertain [7]. For instance, in Northwest China, the high temperature days increased, but the low temperature days and diurnal temperature range diminished, along with a decline in the extreme precipitation [8]. The extreme temperature indexes and extreme cold indexes have diminished in the Yangtze River basin, while the warm indexes have increased [9]; also the intenseness and frequency of extreme precipitation have increased [10]. Compared to average climatic conditions, extreme climate events are more destructive and catastrophic [11], and ecosystems are much more vulnerable to extreme climate change [12,13]. Therefore, it is urgent to explore changes in vegetation ecosystems due to extreme climates. Previous studies found that extreme climates can affect food production [14] and plant communities [15]. Extreme precipitation may lead to an increase in anaerobic respiration in plant roots, which is not conducive to vegetation growth [16]. Additionally, extreme climate events can affect the growth period of vegetation. For instance, a 1 °C increase in the highest temperature from 1982 to 2011 increased the leaf spreading period in Europe by 4.7 days and in the United States by 4.3 days [17]. Therefore, investigating the connection between extreme climate episodes and vegetation is pivotal for a better awareness and prediction of the influence of extreme climate episodes on ecosystems.
Satellite remote sensing is perfectly adapted for vegetation dynamics [18], land surface temperature monitoring [19], and modelling trends from earth observation data [20], and it supplies multi–decadal observations in a range of spatio–temporal scales. Remote sensing has the capacity to enhance knowledge and administration of earth’s environmental variables. Many studies focused on the impacts of the extreme climate on terrestrial ecosystems utilizing multi–source remote sensing data and diverse extreme climate indexes. Studies on extreme climate events on vegetation growth in different regions are summarized in Table 1. Similar studies were conducted in diverse regions based on various datasets and methods, which displayed different founds. Normalized difference vegetation index (NDVI) was broadly used on remote sensing dataset to describe plants’ growth. Net primary production (NPP) depicts the amount of atmospheric C fixed by plants and accumulated as biomass, thus mirroring the plant growth condition and ecosystem health. Therefore, the ecological significance of the NPP and NDVI are distinct. We selected NPP and NDVI as the two vegetation indicators in this manuscript. Correlation analysis was universally utilized to discuss the relation between vegetation dynamics and extreme climate indexes.
Yellow River Basin, which plays a crucial part in China’s ecological security as an important ecological barrier, is extremely susceptible to climate change and its ecological environment is fragile. Numerous studies have showed that global changes have led to a growth in temperature and strong spatial heterogeneity of precipitation in the Yellow River Basin [26]. Vegetation in the Yellow River Basin is also highly susceptible to climate change [27]. Previous studies have demonstrated an increase in extreme temperature indexes [28] and vegetation coverage [29,30] in most parts of the Yellow River Basin over the past few decades. The asymmetric warming in temperature during the day and night in the Yellow River Basin has accelerated the growing season and delayed the ending period [31]. Despite previous research on dynamics in vegetation coverage and climate in the Yellow River Basin, the vegetation dynamics and extreme climate for a long time series, as well as the influence assessments of climate extremes on terrestrial surface plants remains poorly understood, especially in zones with strong anthropogenic activities and climate variability.
In lieu of concentrating solely on either vegetation dynamics or climate change, this study analyzed plants’ growth utilizing multi–type remote sensing indicators, investigated the extreme climate trend based on multiple types of indicators, and explored the nexus between climate extremes and plants’ growth. By integrating cross–sensor satellite observations of the normalized difference vegetation index (NDVI) and net primary production (NPP) datasets, together with 27 extreme climate indexes, the overarching objectives of this study were (1) to map spatio–temporal changes in vegetation dynamics utilizing multi–type remote sensing data; (2) to assess the spatial and temporal changes in extreme climate indexes; and (3) to explore the spatial heterogeneity of the correlation between extreme climate and plant change. Our findings are remarkable for improving sustainable development of the social economy and ecological environment in the Yellow River Basin.

2. Materials and Methods
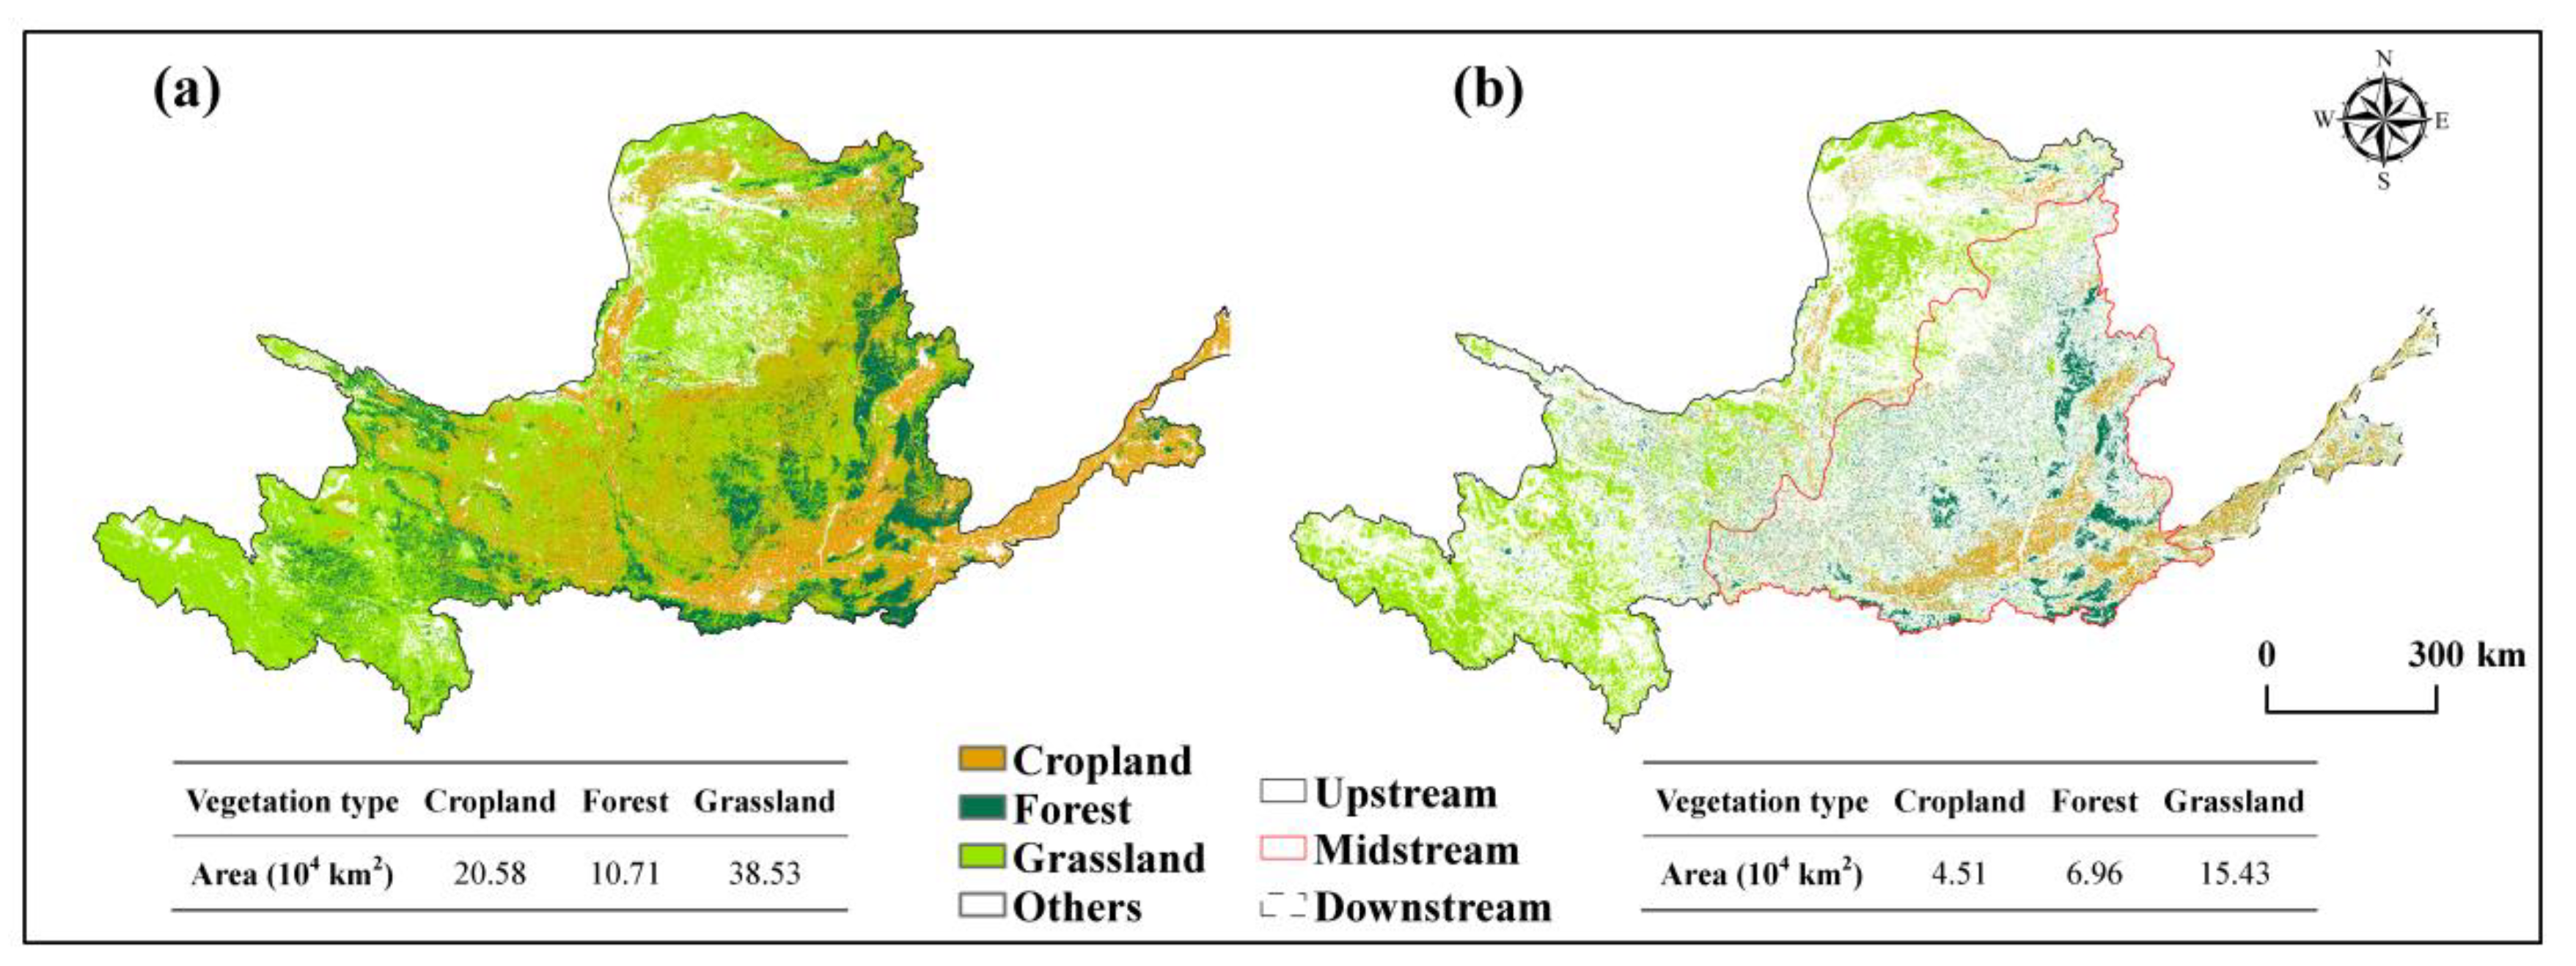
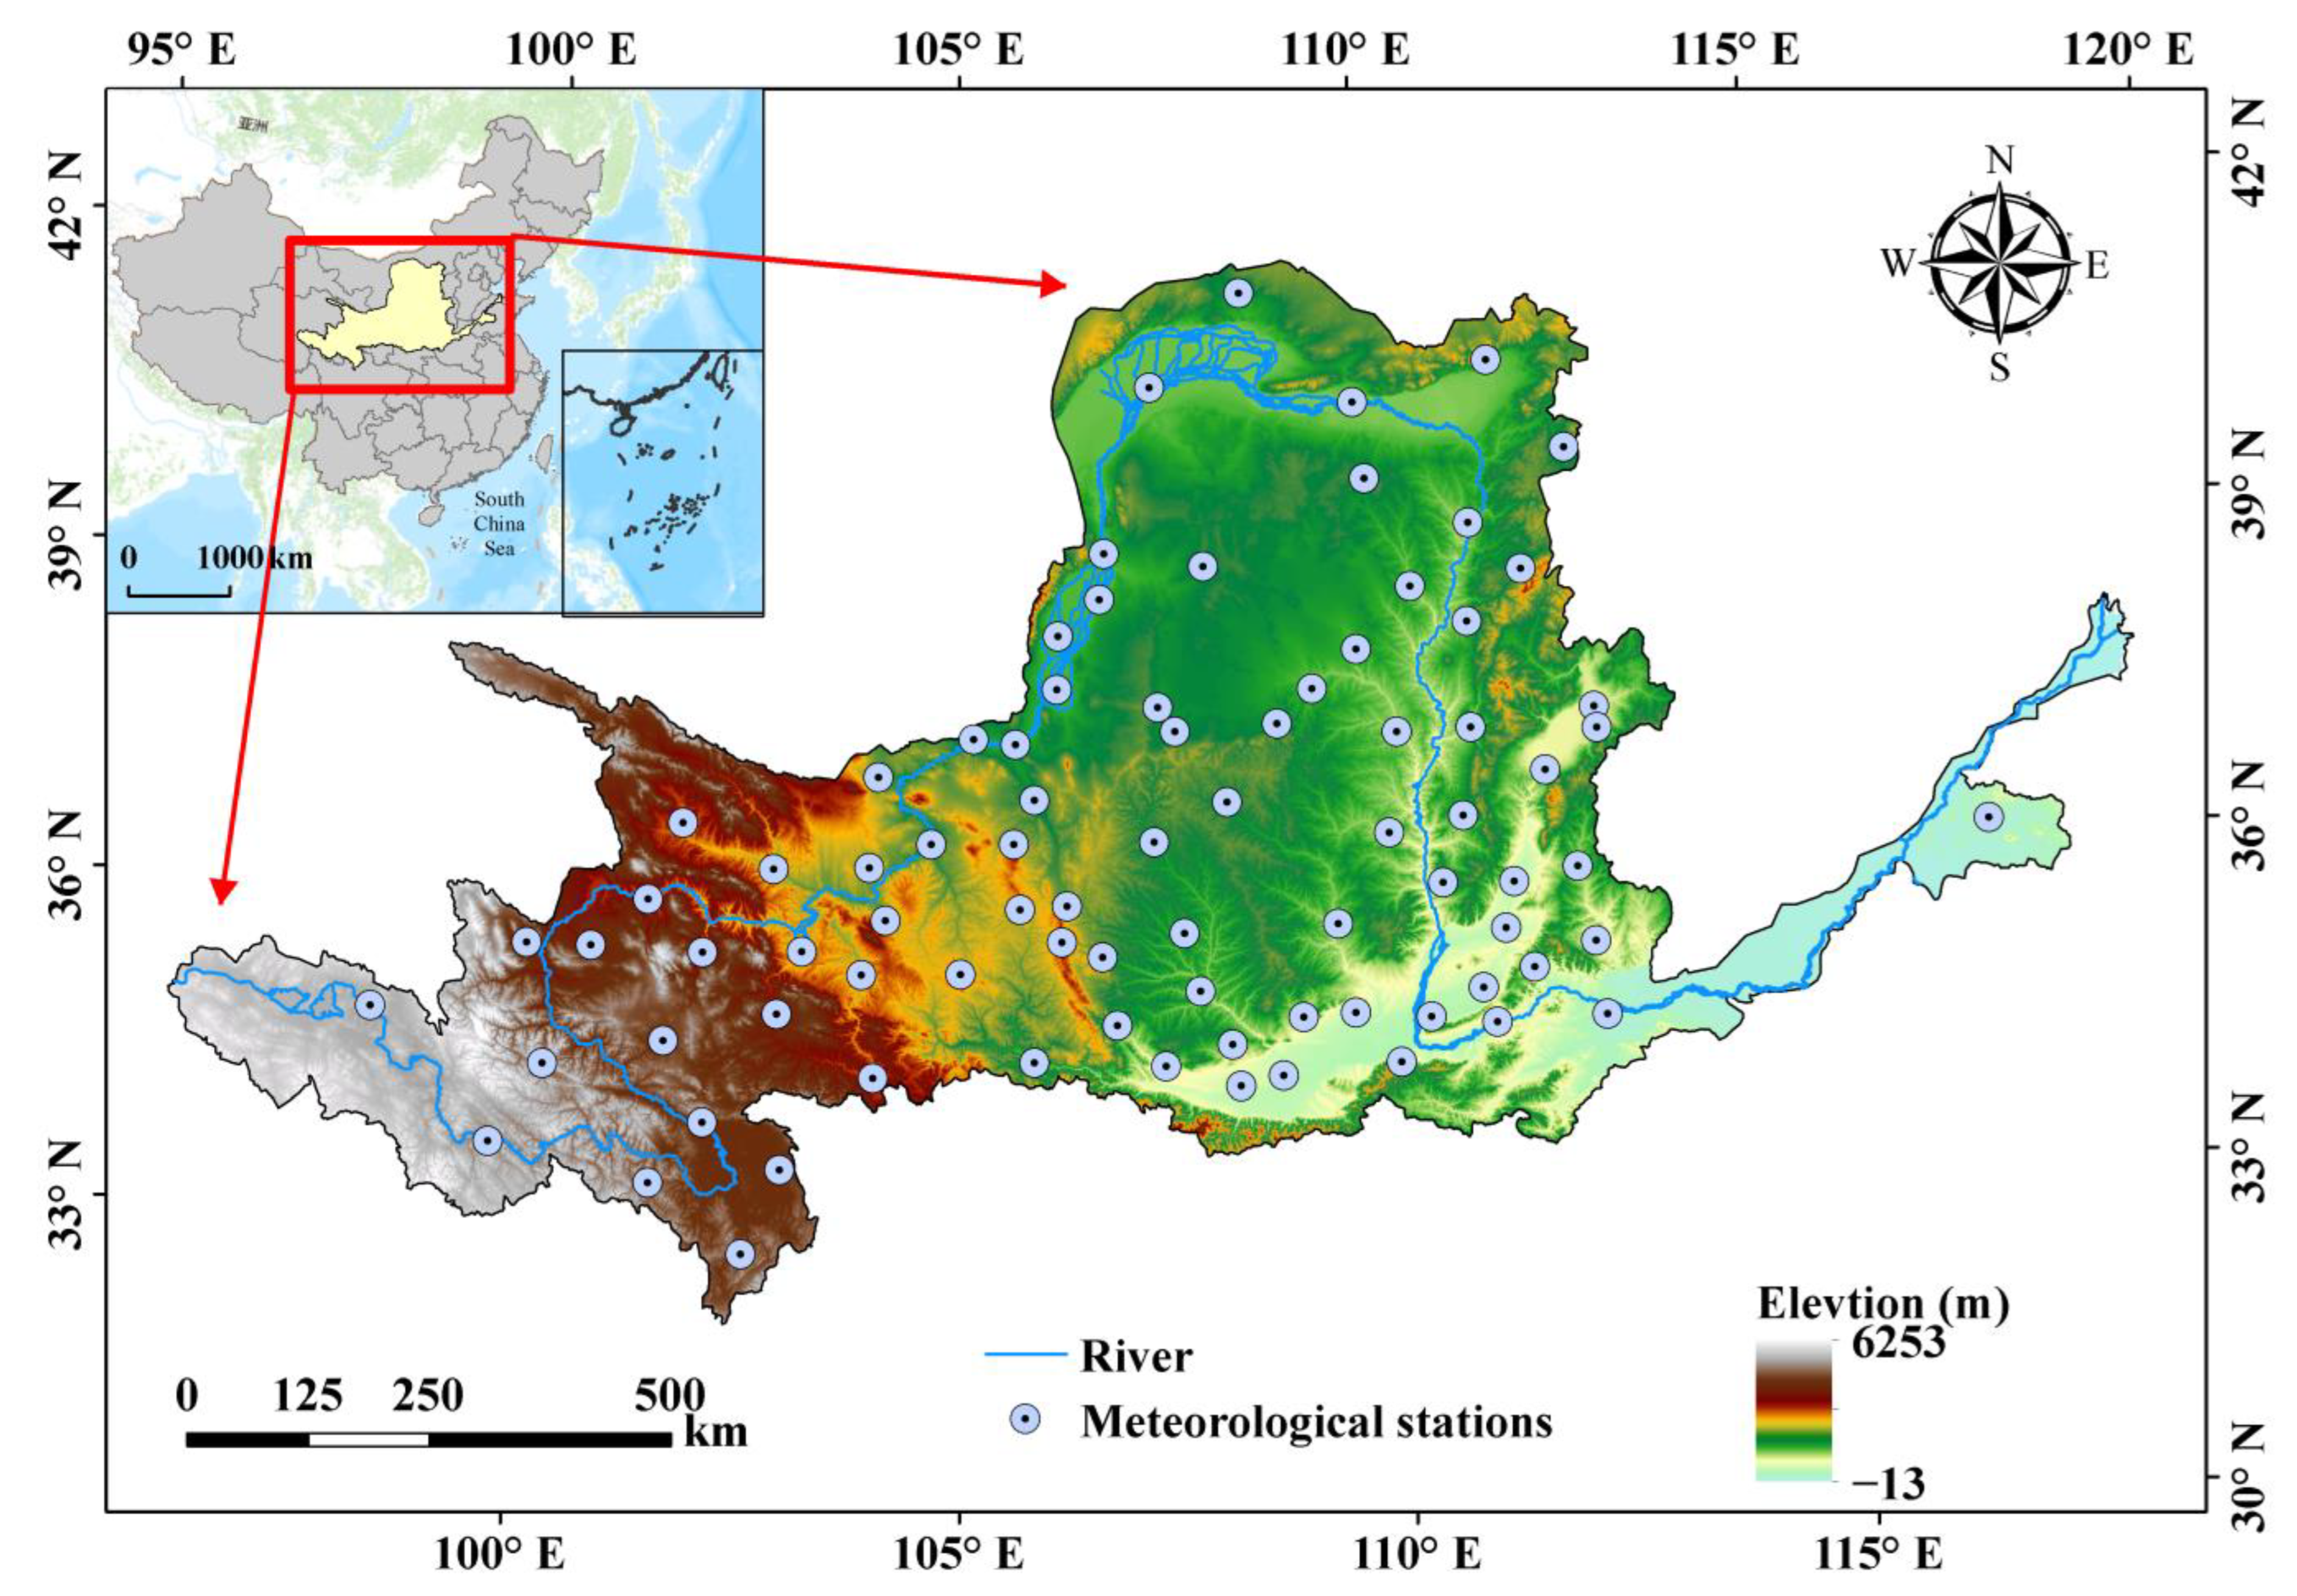
2.1. Study Area

Yellow River Basin (hereinafter abbreviated as YRB) located in Central Northern China, covers a significant geographical area spanning latitudinal range of 32–42°N and longitudinal range of 96–119°E, at elevations between −13 and 6253 m (Figure 1). Yellow River starts from the Bayankala Mountain foothills of Tibetan Plateau, and flows for 5464 km, before eventually discharging into the Bohai Sea, passing through nine provinces. YRB experiences a continental climate with arid, semi-arid, and semi–humid climatic changes. The temperature fluctuation throughout the year is significant, and the multi–year average precipitation stands at approximately 451.7 mm [32]. Grassland area covers the largest portion of the YRB, mainly found in the north of the middle streams, and the upper streams of the YRB. Forests and cultivated land are the second largest land cover classes, primarily distributed in the southeast of the mid–streams and down–streams [33].

2.2. Materials

2.2.1. Carbon Flux Data

Net primary productivity (NPP), as a critical metric of ecosystem functioning, is central to the storage and accumulation of carbon in ecosystems, as well as the yield of usable products [34,35]. It is defined as the quantity of organic matter that greeneries accumulate on Earth’s surface. The satellite remote sensing NPP data (1986–2018) utilized in this study were obtained from an 8–day/0.05° raster dataset supplied by the National Earth System Science Data Center (http://www.geodata.cn, accessed on 1 July 2022). The dataset was estimated by utilizing the multisource dataset synergized quantitative-net primary productivity improved vegetation productivity estimation model. The NPP products were generated basing on fraction of photosynthetically active radiation (FPAR) products, global land surface satellite (GLASS) leaf area index product, and ERA Interior meteorological data, all of which have high quality [36,37,38]. Previous studies found this dataset is highly applicable and reliable [37]. This dataset performed well when compared with FLUXNET data (with R2 = 0.56 and RMSE = 2.78 gC/m2d) [38]. The monthly and annual NPP dataset with 5 km spatial resolution were calculated from the 8-day dataset utilizing ArcMap and python platform.

2.2.2. Vegetation Indicator Dataset

Normalized difference vegetation index (NDVI) represents vegetation coverage, and can accurately mirror the distribution and changes in vegetation [3,39]. We utilized the GIMMS–NDVI dataset (1986–2018) obtained from the National Tibetan Plateau Data Center (https://data.tpdc.ac.cn/, accessed on 18 June 2022), and MODIS–NDVI (2001–2021) data obtained from the MODIS vegetation index product of the Earth Information Center at NASA Headquarters (https://earthdata.nasa.gov/, accessed on 10 August 2022). The GIMMS–NDVI dataset has grids at a spatial resolution of 1/12° × 1/12° and a 8-day timescale. The MODIS NDVI, with a spatial resolution of 0.05° and a temporal resolution of 16-day, was processed based on the quality assessment data, removing the values with low pixel reliability. And gaps in the MODIS NDVI because of removal of values were filled utilizing linear interpolation. To ensure consistency in the spatial resolution of the two datasets, the nearest neighbor resampling approach was applied to resample the MODIS–NDVI dataset to 1/12° spatial resolution. Then, a grid-level linear regression model was established for the GIMMS–NDVI and MODIS–NDVI annual datasets during the same time period (2001–2015). Finally, the MODIS–NDVI data and the linear regression model were utilized to calculate the value of GIMMS–NDVI from 2016 to 2021 [40] based on matlab codes. Furthermore, monthly and annual NDVI with 1/12° spatial resolution were calculated based on ArcMap 10.2 and python 3.11.1 software.

2.2.3. Land Use and Land Cover (LULC) Data

LULC and its change influences the global energy balance and biogeochemical cycle [41]. The LULC dataset for the years 1980, 1990, 1995, 2000, 2005, 2010, 2015, and 2020 was supplied by the Resource and Environment Science and Data Center (https://www.resdc.cn/, accessed on 1 May 2022). The LULC dataset comprises 1 km raster data that mainly includes six first–level classifications, namely, grassland, forest, cropland, built–up land, water, and bare land, and has 25 secondary classifications. To avoid interference with the annual changes in land use, only areas with no change in vegetation types were analyzed. Specifically, the analysis only focused on whether there were any changes in land use at the pixel level for the eight images, and if there was a change, it did not include the annual evolution of vegetation coverage for cropland, forest, and grassland. Among these, cropland, forest, and grassland are the primary vegetation cover. Therefore, this study mainly analyzed the changes in these three vegetation ecosystems.

2.2.4. Meteorological Observation Data

There are 83 meteorological observation sites in the YRB (as shown in Figure 1) spanning from 1986 to 2020, which were supplied by the China Meteorological Data Service Center, National Meteorological Information Center (http://data.cma.cn/, accessed on 10 July 2021). The daily precipitation and daily temperature (including of mean temperature, minimum temperature, and maximum temperature) datasets were utilized in this paper to calculate the climate extreme indexes. We selected 27 extreme climate indexes, consisting 11 extreme precipitation indexes and 16 extreme temperature indexes [42]. The specific meaning of each extreme climate index can be found in Table 2.

2.3. Methodology

2.3.1. Tendency Analysis

The combined application of Theil–Sen median slope (Sen’ slope) and Mann–Kendall test (MK) methods were widely exploited to discuss the spatio–temporal change trend of NPP or NDVI [40,43,44].
Sen’ slope is an approach for steady and nonparametric statistical trend computation. This method can avoid the effect of outlier value or measurement errors, and is not easily disturbed by outliers [45]. Nevertheless, we removed outliers before trend analysis and interpolated gaps using linear regression. The equation for Sen’ slope is defined as follows:
β = Median x j x k j k   ( k = 1 , , N ; and   1 j < k n )
where k, j represent the variable’s time; xk and xj are the analyzed variable value (NPP or NDVI) at the time k and j, respectively. If β > 0, it denotes an ascending tendency in NPP and NDVI; and if β < 0, it means a descending tendency.
Mann–Kendall (MK) trend test is supplemented with Sen’ slope in this paper to assess the significant change trends of a series of a variable. The MK trend test is extensively utilized in hydro–meteorological studies [10]. The sample data of the MK test method do not work well with unspecified distribution, and outliers can be eliminated [46]. The calculation formula for MK is as follows:
S = k = 1 n 1 j = k + 1 n s i g n x j x k
s i g n x j x k = 1   ( x j x k > 0 )   0   x j x k = 0   1   ( x j x k < 0 )  
Z = S 1 v a r S   ( S > 0 )   0   S = 0 S + 1 v a r S   ( S < 0 )
Z is the changing trend test statistics. xj and xk are the variables values of the time j and k. When n > 8, S is approximately normal distributed. The mean and variance values of S are defined as follows:
E ( S ) = 0
Var ( S ) = n n 1 2 n 5 18
We used |Z| ≥ 1.96, which passes the 95% significance test.
Furthermore, the uncertainty in the Sen’ slope used to describe the NPP and NDVI trends over the period of the dataset is calculated using bootstrap methods, which is an empirical approach for estimating uncertainty, and the sampling process is simulated many times. These uncertainties are designed to indicate the weight of observations in the analysis convolved with the background error variance estimate.
The univariate linear regression approach was utilized herein to calculate the temporal trends of meteorological variables. The linear regression method is a form of mathematical regression analysis. The slope calculated from the univariate linear regression showed the change rate of the extreme climate indexes. Slope > 0 depicted a lifting trend, and slope < 0 described a dropping trend.

2.3.2. Association Analysis Method

The association between vegetation indexes (NPP and NDVI) and the extreme climate indexes were calculated using Spearman’s rank correlation coefficient method.
ρ = k = 1 m x k x ¯ y k y ¯ k = 1 m x k x ¯ 2 k = 1 m y k y ¯ 2
where x k and y k depict the ranks of the positions occupied by the variable in their respective ordered samples. x ¯ and y ¯ describe the average value of the time series x k and y k , respectively.
To further exploit the association between plants’ growth and climate extreme event, a time–lag cross–correlation investigation approach was employed. Following the principle of this method, the cross–correlation coefficient of extreme climate indexes and vegetation index at each station under each time delay was calculated. Subsequently, the maximum cross-correlation coefficient of extreme climate indexes and vegetation indexes at each station in the YRB and their corresponding lag time were obtained. The calculation formula for this method is given below:
r = k = 1 n M k M ¯ N k L N ¯ k = 1 n M k M ¯ 2 k = 1 n N k L N ¯ 2
where M(k) denotes the NPP and NDVI value of the k month. N(k–L) is the extreme climate indexes value corresponding to kL. k denotes the time. L represents the lag time. M ¯ and N ¯ are the average values of corresponding indexes, respectively.

3. Results

3.1. Vegetation Growth Status

3.1.1. Land Use and Land Cover Change

The LULC map of 2020 (Figure 2a) revealed that grassland covered the most extensive area, ensued by cropland and forest. The combined area of the these three vegetation cover in 2020 was 38.53 × 10⁴ km2, 20.58 × 10⁴ km2, and 10.71 × 10⁴ km2, respectively. Other LULC, such as built–up land, bare land, and water, had smaller areas. By comparing the LULC maps of 1985 and 2020, we identified the unchanged zones of cropland, forest, and grassland in the YRB (Figure 2b), with an area of 4.51 × 10⁴ km2, 6.96 × 10⁴ km2, and 15.43 × 10⁴ km2, respectively. Spatially, grassland was primarily distributed in the upper streams of the YRB, whereas forest was concentrated in the midstream portion of the basin. Cropland was primarily observed in the southeast of the midstream and in the downstream zone of the YRB. It was worth noting that the grassland, forest, and cropland displayed in Figure 2b were the specific zones analyzed in this study.

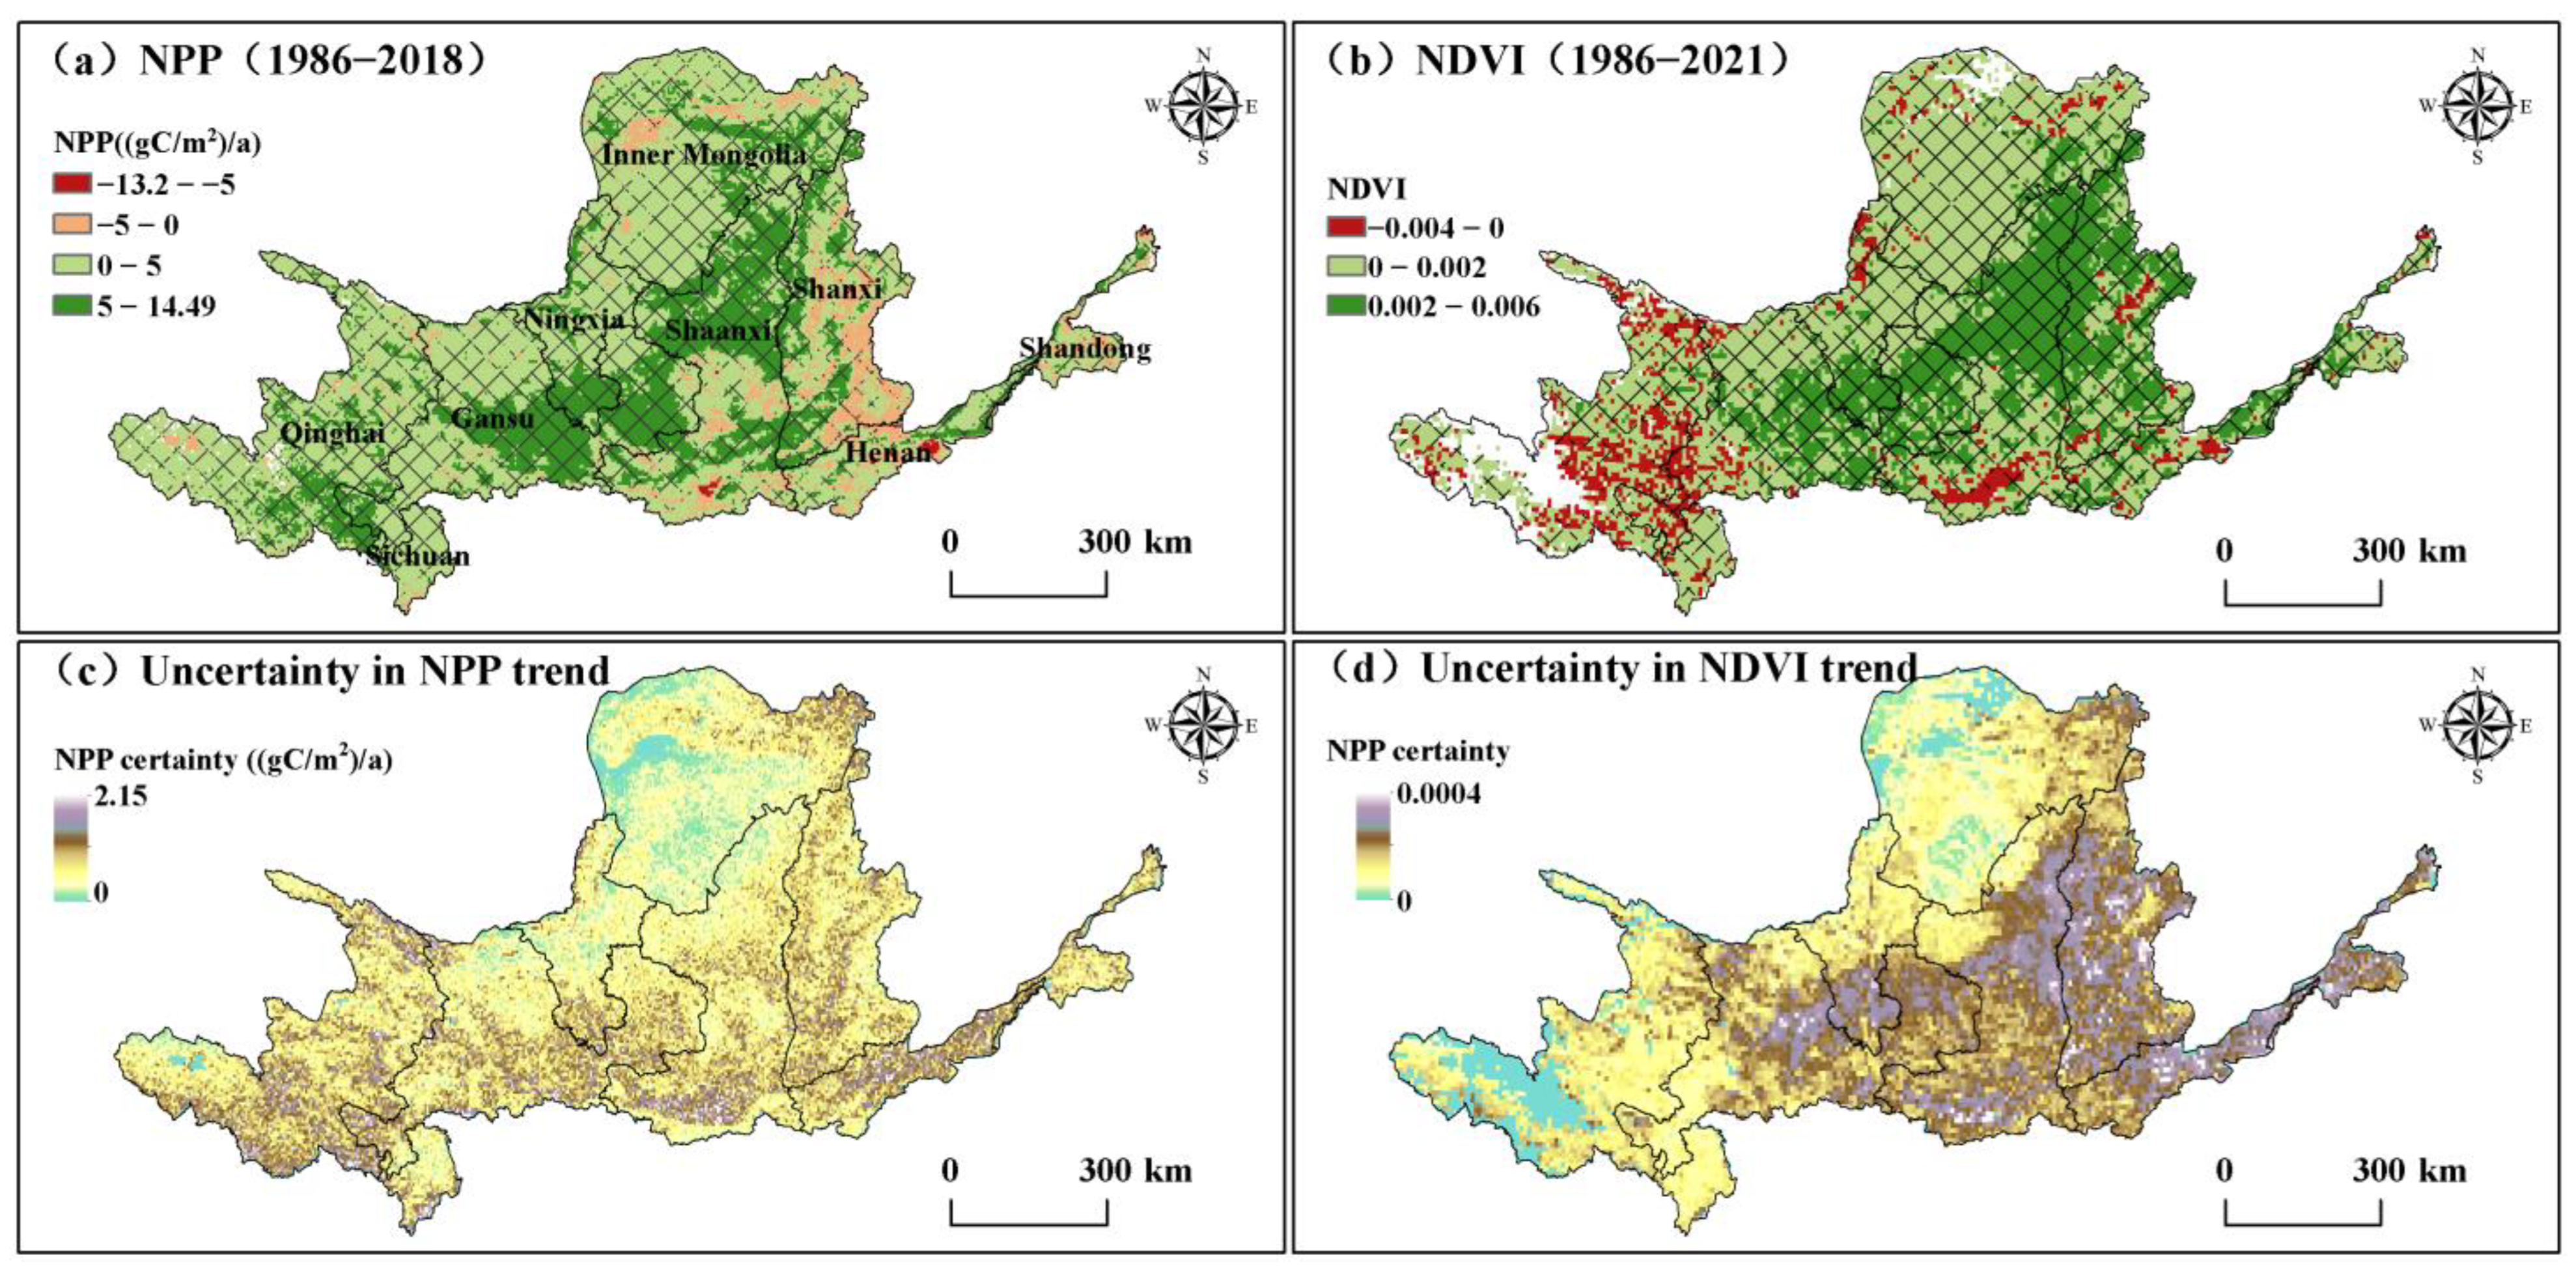
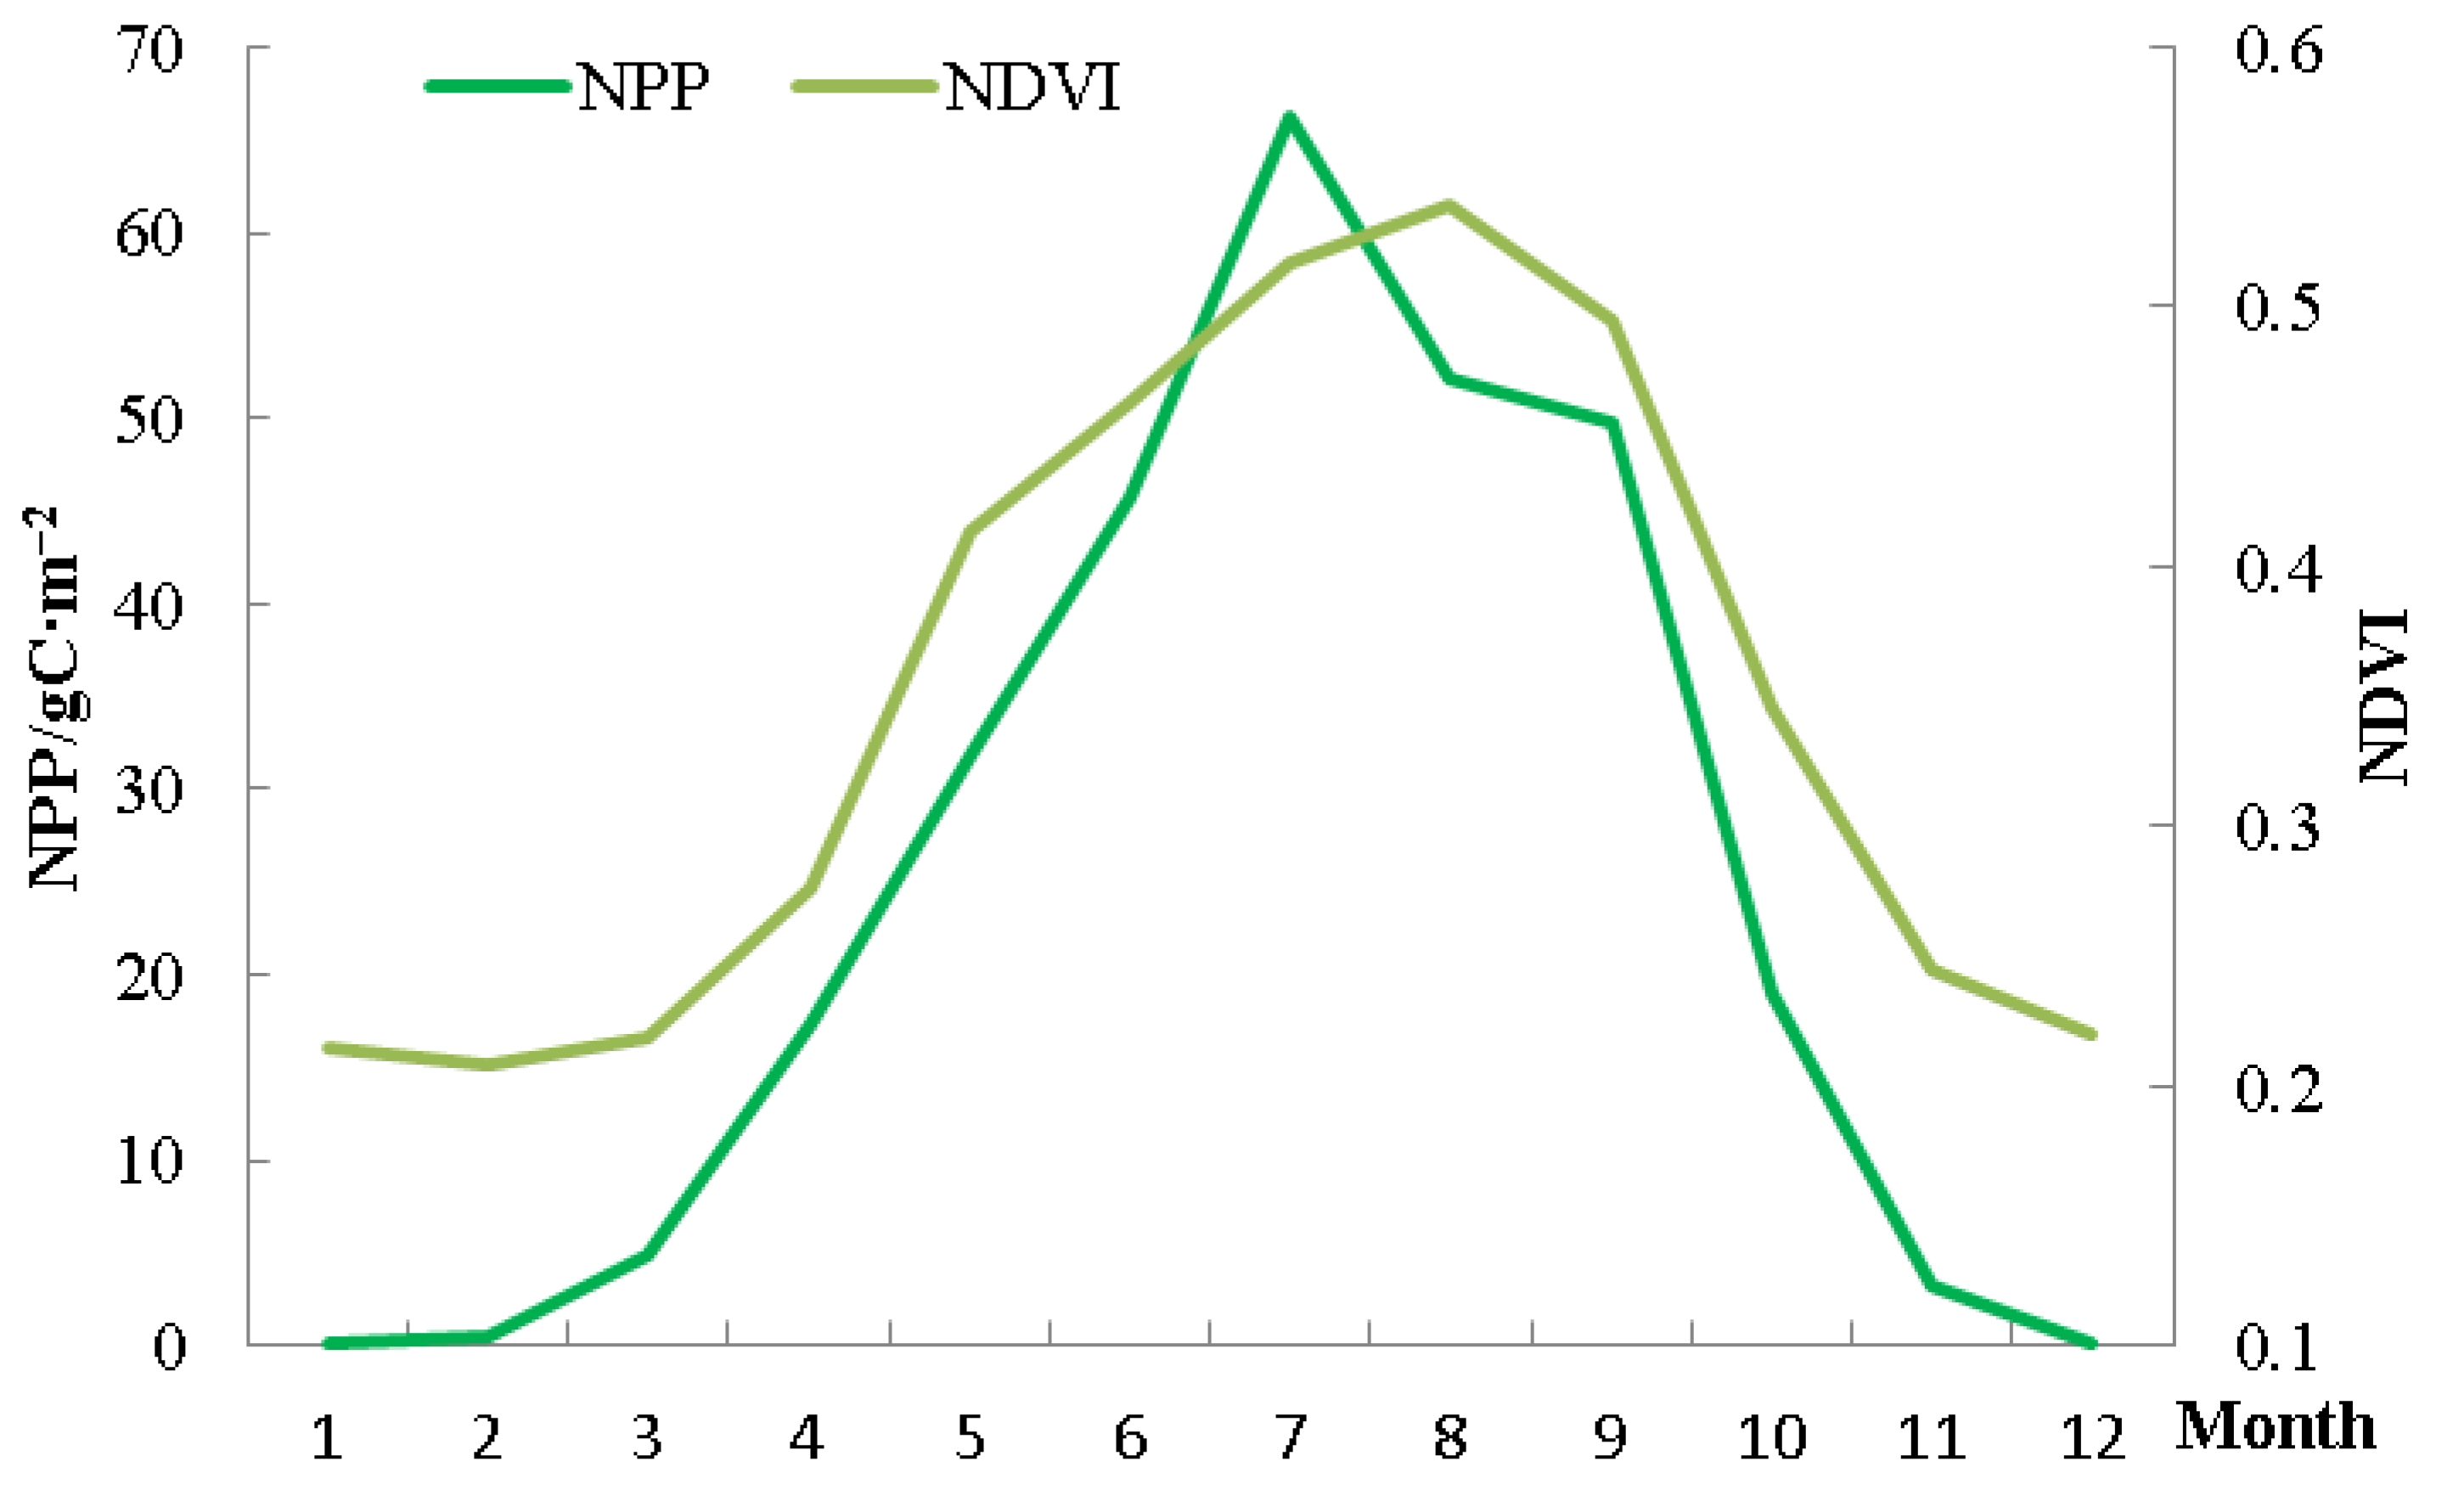
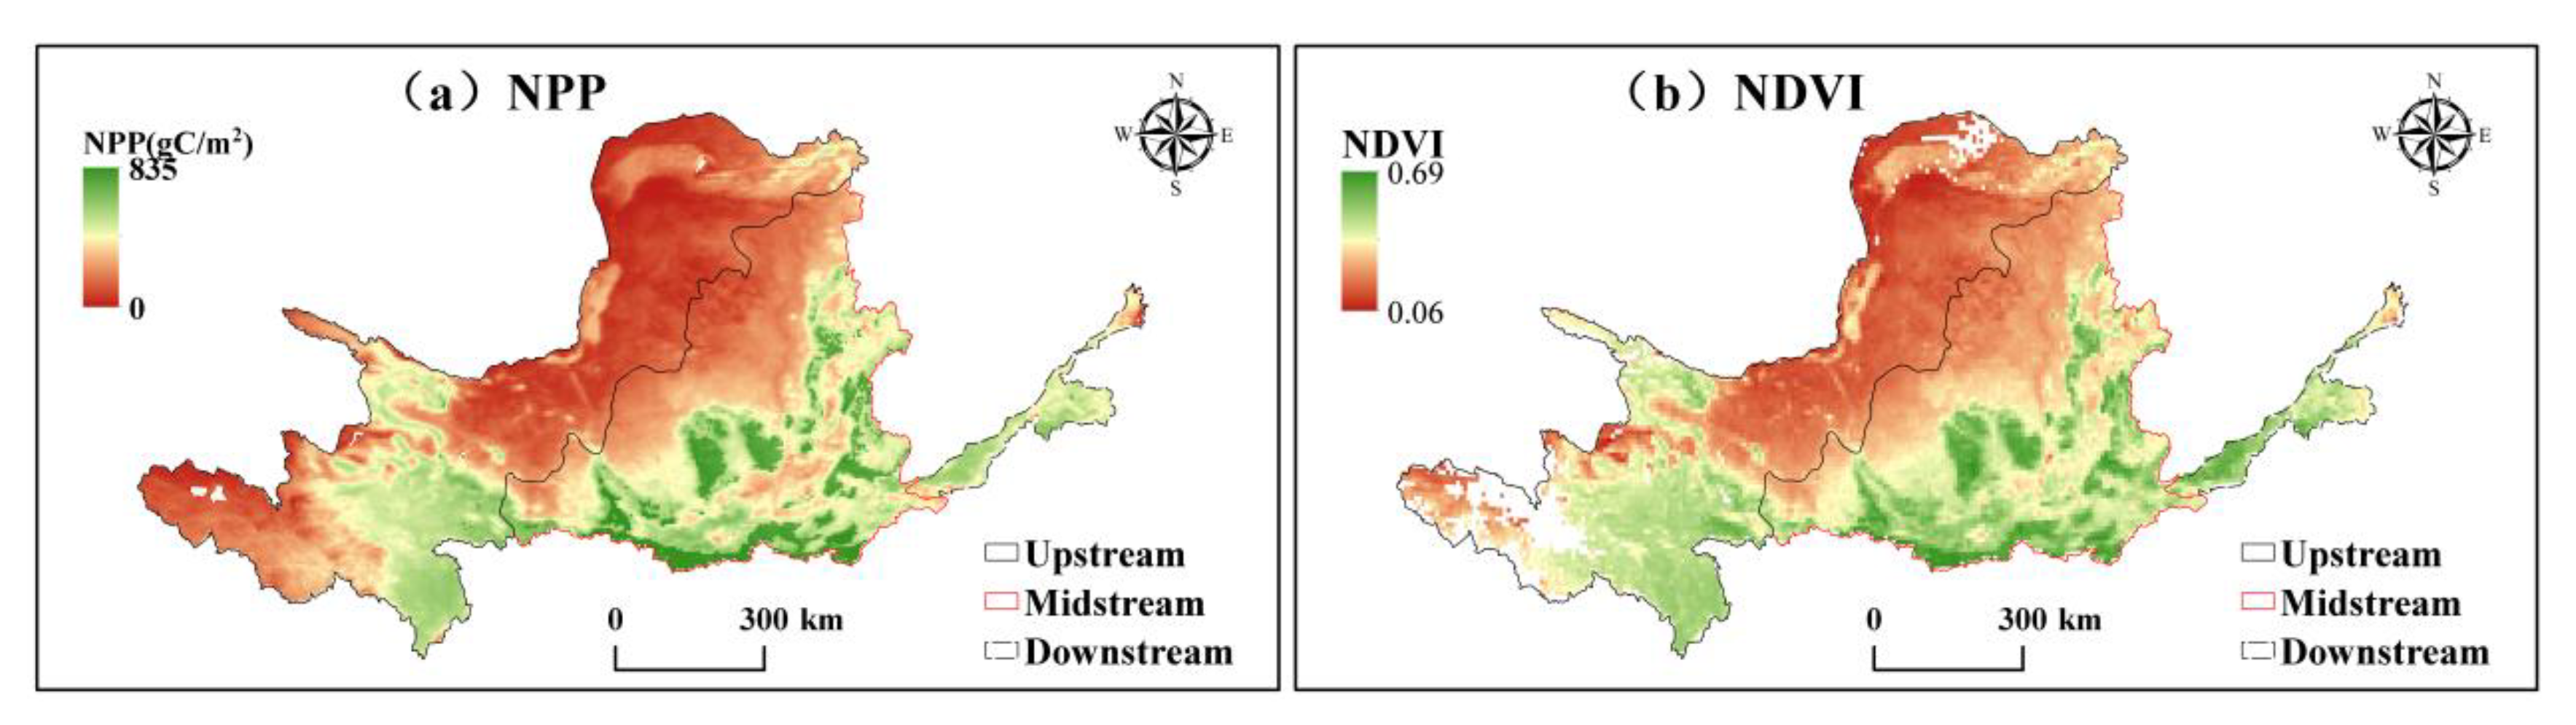
3.1.2. Spatio–Temporal Patterns of NPP and NDVI

The multi–year monthly averaged of NPP (1986–2018) and NDVI (1986–2021) across the YRB exhibited a “single peak” pattern, as illustrated in Figure 3. Specifically, both indexes increased from January, peaked around July and August, and then gradually decreased. The highest values were 66.18 gC·m−2 and 0.54 for NPP and NDVI, respectively. The changes in multi-year monthly averages of NPP and NDVI were largely similar, reflecting the seasonal variations in vegetation growth across the YRB, characterized by germination in spring, flourishing in summer, and defoliation in autumn. NPP had a high and obvious connection with NDVI (R2 = 0.96, p < 0.001), which indicated two vegetation indexes that can capture the seasonal variations of vegetation growth.
For the YRB, NPP and NDVI values varied for forest, grassland, and cropland. Overall, forest had the largest NPP and NDVI values, and grassland the smallest (Figure 4). During the study period, cropland, forest, and grassland all showed increasing trends of vegetation cover across the YRB, as depicted in Figure 4. The annual NPP and NDVI of these three vegetation types displayed similar features and all exhibited significant upward trend. Moreover, the annual NPP and NDVI values of forest, cropland, and grassland displayed a markedly gradient distribution. Of note, the cropland demonstrated the fastest increase rate of NPP, with the value of 4.13 gC/m2/a, while forest had the slowest rate at 3.09 gC/m2/a. It was different with the forest exhibiting the fastest growth rate of NDVI at 0.0018/a, where the slowest growth rate for grassland occurred at 0.0009/a. The comparative analysis found that different vegetation types and vegetation indexes presented distinct change characteristics. Although the overall distribution of NPP and NDVI was similar, the differences indicated that carbon flux data and vegetation cover index for divergent vegetation type had different characteristics.
To further investigate the vegetation growth, we explore the spatial distribution of carbon flux data and vegetation cover index in Yellow River Basin. The spatial pattern of the multi–year averaged NPP value (1986–2018) in YRB ranged between 0 and 835 gC·m−2 (Figure 5a). Specifically, cropland, forest, and grassland exhibited NPP values ranging from 27 to 759 gC/m2, 41 to 829 gC/m2, and 9 to 813 gC/m2, respectively. Comparing with NPP, we found the multi-year averaged NDVI values ranged from 0.06 to 0.69 (Figure 5b), with cropland, forest, and grassland displaying respective NDVI values from 0.11 to 0.60, 0.09 to 0.68, and 0.06 to 0.66. The spatial allocation of both NPP and NDVI values decreased from southeast to northwest and exhibited distinct differences between the north and south areas. Notably, the low value regions of NPP and NDVI were mostly scattered in the western and northern zones of YRB, while the high–value zones were predominantly assigned across the eastern and southern zones. Furthermore, high–value NPP and NDVI largely overlapped across different land types. For example, the high–value zone of cropland was situated in the south of midstream and downstream areas of YRB, while the high–value area of forest occurred in the eastern and central southern parts of midstream. Finally, the high–value zone of grassland was discovered in the southeast of the upstream region.
The annual change rate of NPP in YRB ranged from −13.20 to 14.60 gC·m−2·a−1 during the past thirty years (Figure 6a). Grids with an increasing trend accounted for a vast majority of the total area, specifically 90.15%. Moreover, the significance of the increasing zone was highest in the southeastern part of Qinghai, the southern part of Ningxia and Gansu, and the northern part of Shaanxi, encompassing 74.90% of the total area. Notably, the upward rate of NPP in some areas of Shaanxi–Gansu–Ningxia was the biggest, surpassing 5 gC/m2/a. On the other hand, a decline trend was found in 7.54% of the whole study region, scattered primarily in the northern part of Inner Mongolia, Shanxi, and Henan. Specifically, NPP of cropland in some parts of Henan declined, while NPP upward trends in the Southern Shaanxi region were significantly higher than 5 gC/m2/a. Furthermore, forest NPP was observed to be declining in certain areas of Shanxi and Henan, while forest NPP of the south of Ningxia and Gansu, as well as the northern part of Shaanxi, exhibited an increase that exceeded 5 gC/m2/a. In terms of grassland NPP, a decline was documented in the Northern Inner Mongolia region, while a noticeable rise was observed in the southeast of Qinghai.
The annual change rate of NDVI in YRB during the study period ranged between −0.37% and 0.65% (Figure 6b). Approximately 89.74% of the area exhibited an upward trend, mostly distributed in provinces other than Qinghai. Significantly changing areas accounted for 77.77% of the YRB, wherein the northern zone of Shaanxi and Shanxi and the southern zone of Gansu displayed the highest rise trend (>0.002). In contrast, approximately 10.26% of the region showed a decline, mostly distributed in Qinghai and the southern zone of Shaanxi. Specifically, NDVI of cropland in the eastern part of Henan was rapidly increasing (>0.002), whereas the rise in forest NDVI in the northern part of Shanxi and Shaanxi exceeded 0.002. With regard to grassland NDVI, most regions in Qinghai displayed a declining trend. However, the grassland NDVI in Inner Mongolia and the central part of Gansu displayed a slightly increasing trend (<0.002).
Figure 6c,d showed the uncertainty in the fitting of the annual NPP and NDVI change trend. The whole area average uncertainty in the change trend fitting of NPP and NDVI were 0.41 gC/m2/a and 0.0001, respectively. The largest fitting uncertainties occurred across the NPP in the southern and eastern part of YRB. Here, we observed the fitting uncertainties of NDVI were similarly distributed to those of the NPP fitting, and both had the smallest uncertainties in the northern part of YRB.

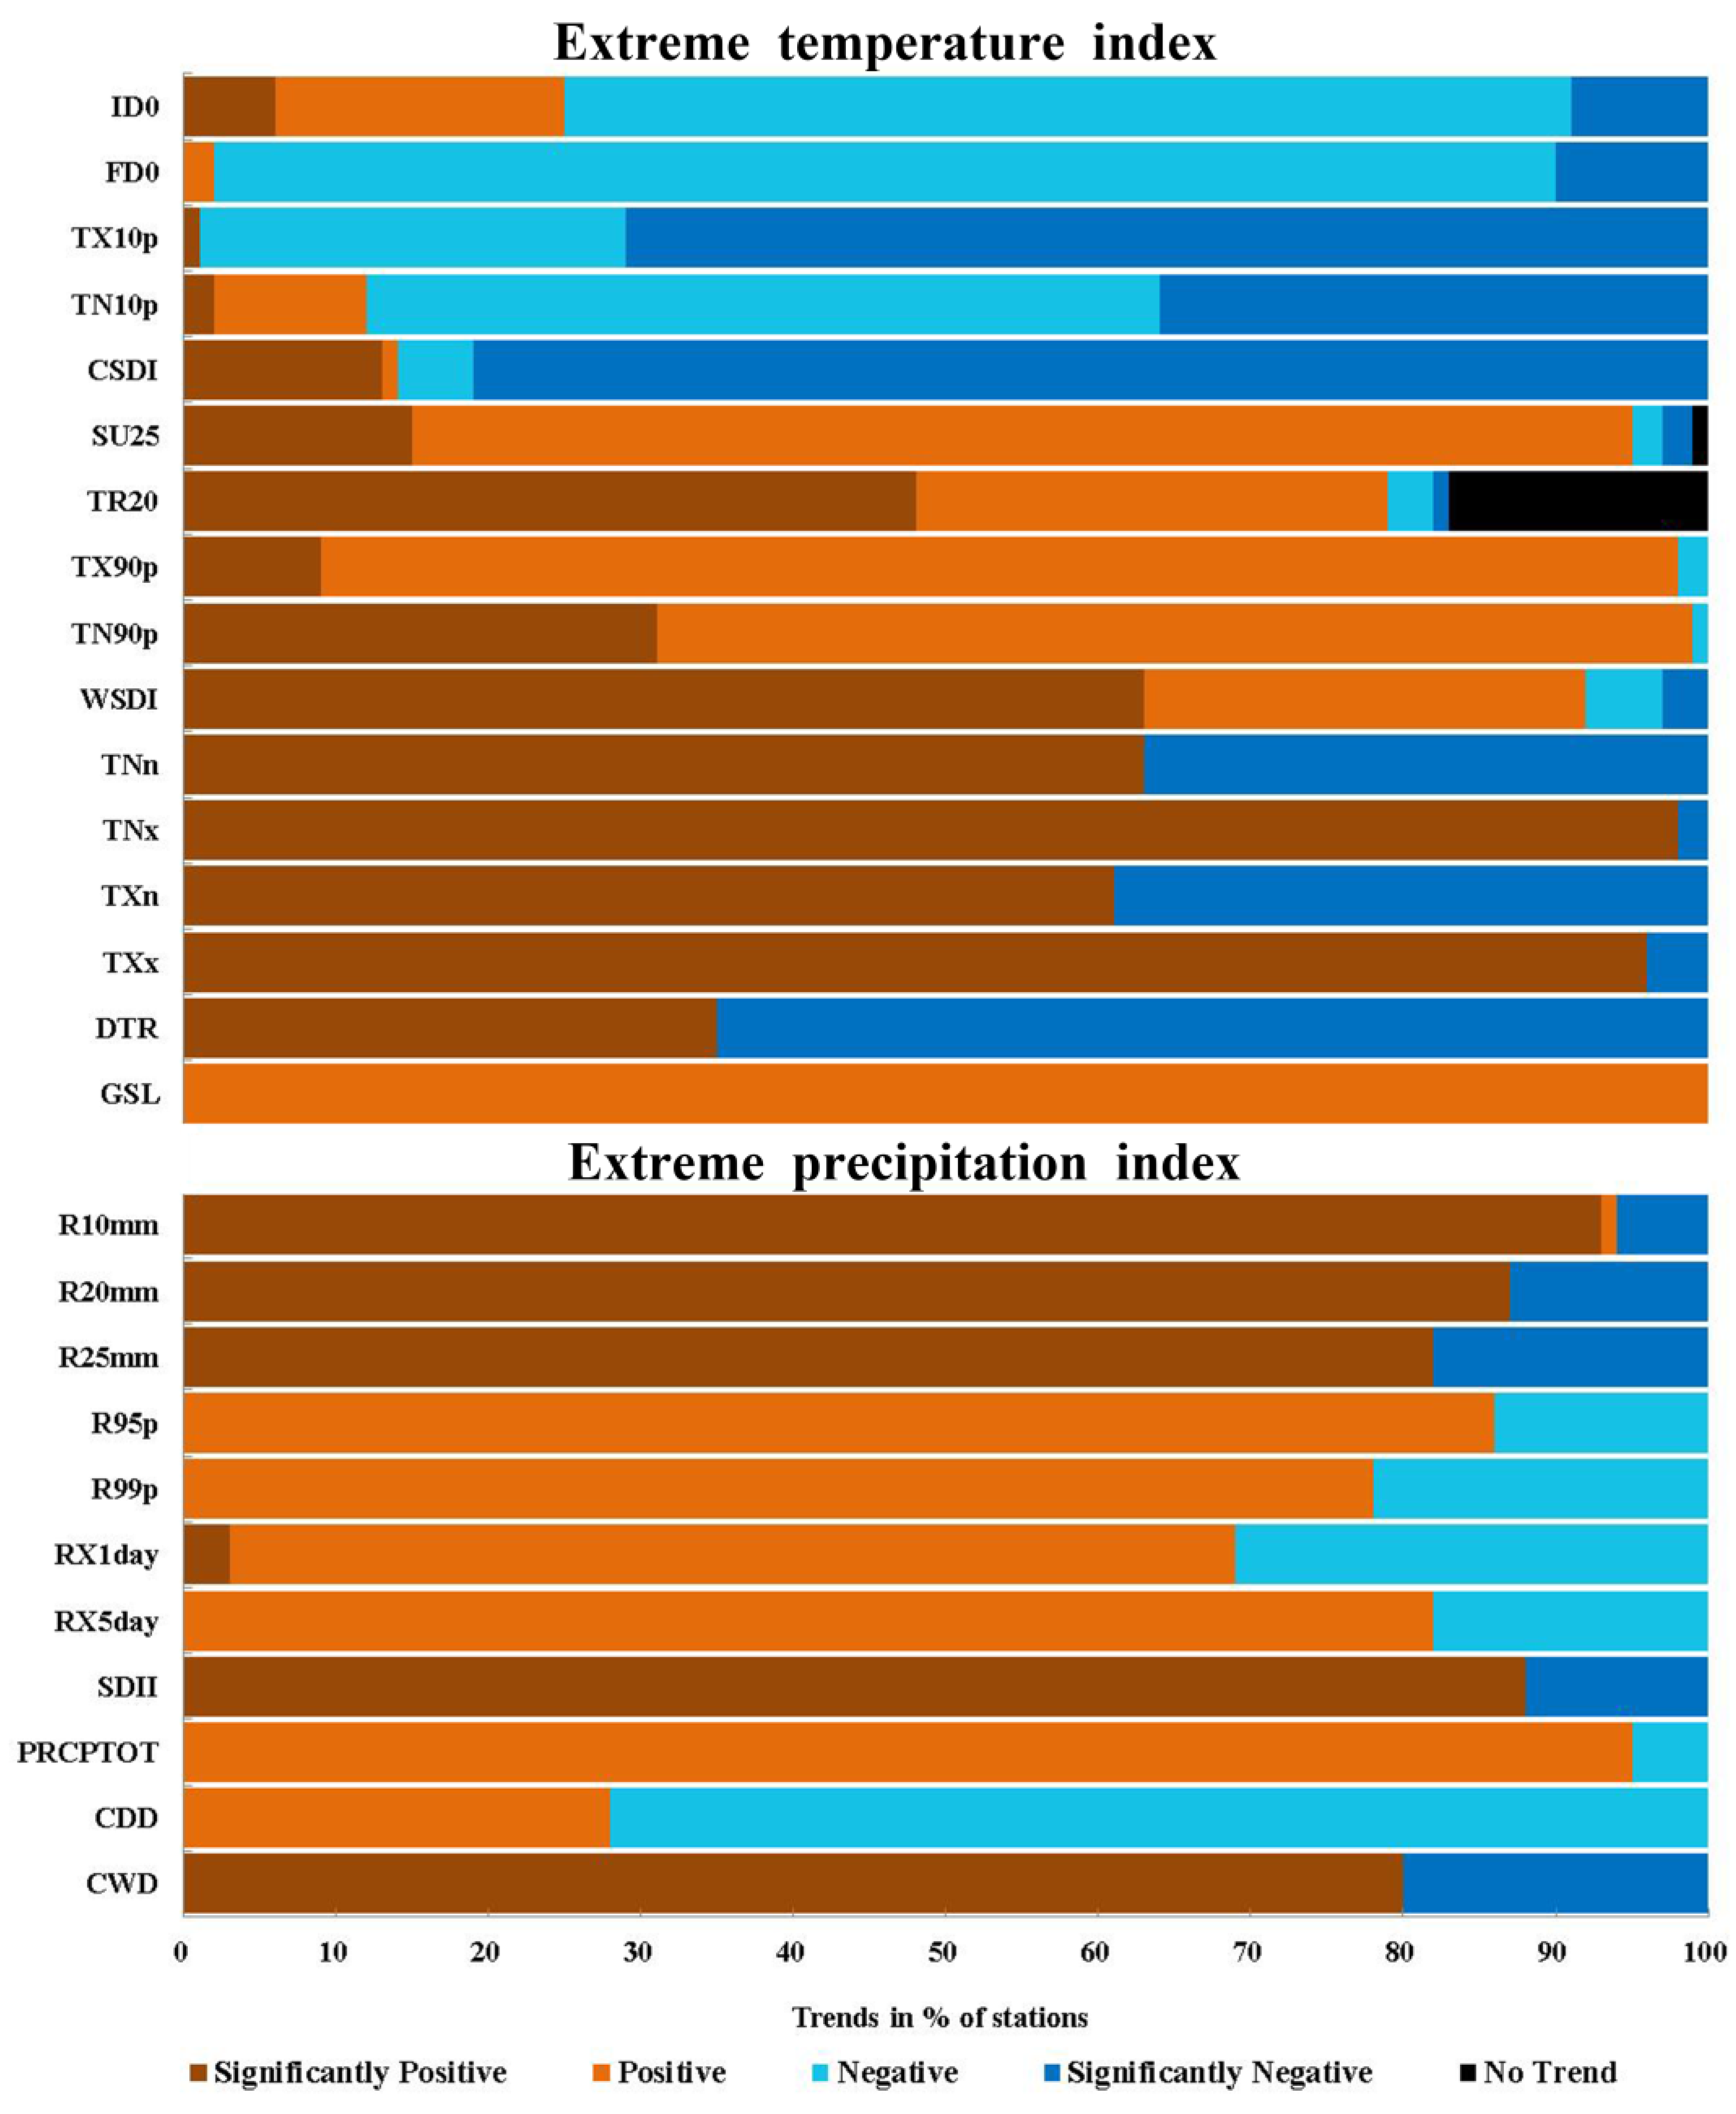
3.2. Spatio–Temporal Patterns of Climate Extremes Indexes

As depicted in Table 3, extreme high temperature indexes, including GSL, TN90P, TX90P, SU25, and TR20, all exhibited a significant ascending trend in the YRB. Conversely, extreme low temperature indexes, e.g., FD0, TN10P, and TX10P, all displayed a significant decline trend. Moreover, the increase rate of extreme high temperature indexes was higher than that of decrease in extreme low temperature indexes. Numerous extreme precipitation indexes in the Yellow River Basin also revealed a significant rising trend. Specifically, PRCPTOT and R95p increased remarkably with slope value of 2.63 and 1.33, respectively.
As depicted in Figure 7, over 75% of the extreme low temperature indexes, including ID0, FD0, TN10P, TX10P, and CSDI, demonstrated a declining trend across the meteorological sites. Conversely, most of the extreme high temperature indexes, e.g., SU25, TR20, TN90P, TX90P, and WSDI, exhibited an upward trend, with TN90P rising as much as 99%. Additionally, 98% of the meteorological sites showed an increase in TNx values. Furthermore, the GSL value demonstrated a rising trend across all the meteorological sites. With respect to extreme precipitation indexes, more than 69% of the meteorological sites indicated an upward trend, except for CDD.

3.3. Relationship between NPP, NDVI, and Climate Extreme Indexes

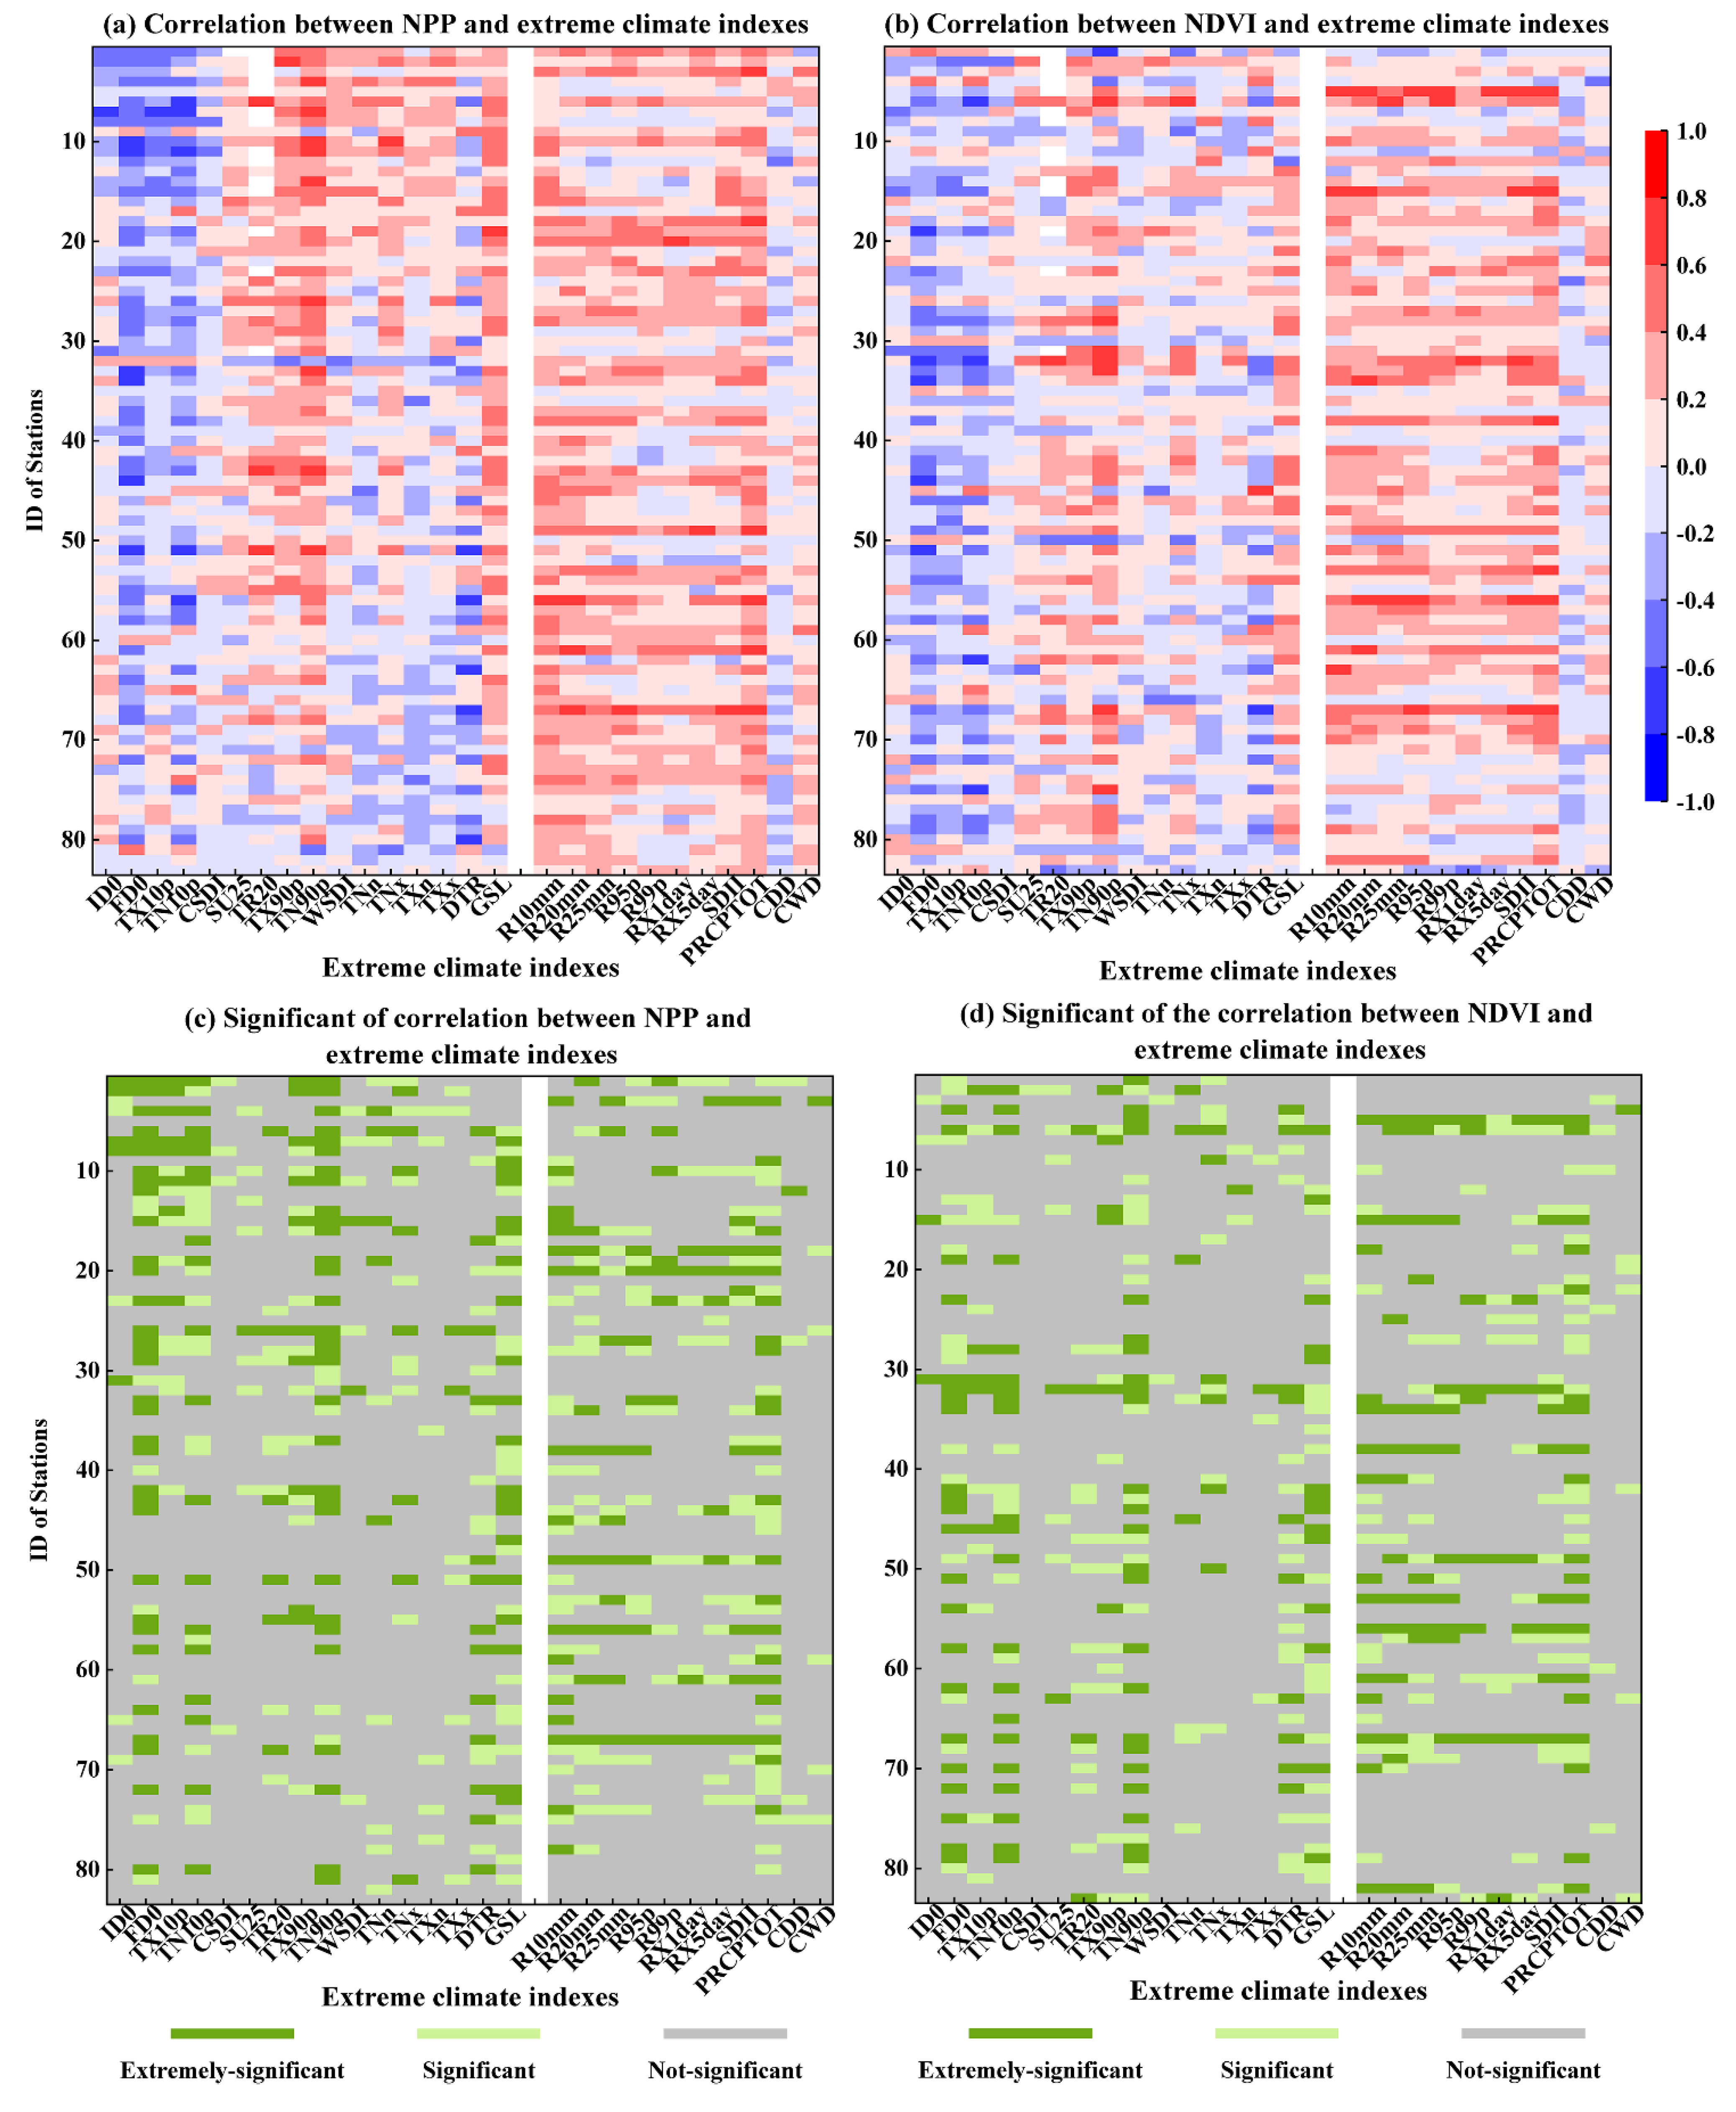
3.3.1. Relationship between NPP, NDVI, and Climate Extreme Indexes in the Yellow River Basin

Generally, the results denoted a negative relationship between carbon flux (NPP) and several extreme climate indexes, including ID0, FD0, TX10p, TN10p, TNn, TXn, DTR, CSDI, and CDD of the YRB (as highlighted in Table 4). Specifically, the correlation between NPP and FD0 was the largest, reaching −0.74. On the other hand, other extreme climate indexes showed positive correlations with NPP, with TN90p and GSL having the highest correlation coefficients of over 0.75. Overall, the nexus between NDVI and climate extreme indexes in YRB seemed to be similar to the association observed between NPP and climate extreme indexes, but the overall strength of the correlation was weaker for NPP, with correlation coefficients such as FD0 (−0.64), TN90p (0.65), and GSL (0.63) being less pronounced than those observed for NPP.
On the whole, extreme temperature indexes at approximately 53.46% of meteorological sites were positively correlated with their corresponding NPP. Conversely, FD0, TX10p, TN10p, TNn, TXn, DTR, and CSDI exhibited a negative correlation with NPP in more than 55% of the stations, while SU25, TR20, TX90p, TN90p, TNx, TXx, GSL, and WSDI were positively correlated with NPP at more than 55% of stations. In Figure 8, the stations were arranged along the ordinate from north to south and west to east, according to their geographic location within the YRB. NPP and extreme temperature indexes demonstrated a more positive correlation in the western region, whereas the eastern region showed a more negative correlation. Except for CDD, all other extreme precipitation indexes exhibited a favorable correlation with NPP, with R10mm, R20mm, R25mm, R95p, and PRCPTOT showing a correlation above 0.5. Roughly 78.53% of the stations exhibited a positive relationship between carbon flux (NPP) and extreme precipitation indexes, while 21.47% showed a negative correlation. NPP was positively correlated with R10mm, R20mm, R25mm, R95p, SDII, PRCPTOT, and CWD at more than 80% of stations. However, the correlation in the east was weaker compared to that in the west. Most of the stations with an absolute correlation value greater than 0.4 passed the 95% significance test.
NDVI of each station within the YRB displayed a positive correlation with extreme temperature indexes at around 50.38% of the stations, while 48.49% showed a negative correlation. Regarding extreme precipitation indexes, NDVI exhibited a positive correlation at approximately 72.18% of the stations, and a negative correlation at 27.82% of the stations. It is worth noting that most of the stations with absolute correlation values higher than 0.4 were obvious at the 95% level, showcasing the robustness of these correlations.
The maximum cross–correlation between NPP and extreme climate indexes within the YRB was highly consistent with the relationship between NDVI and climate extreme indexes (Figure 9). Weak negative correlations were observed between NPP and NDVI and TX10p and TN10p in more than 65% of stations, while weak positive correlations were detected with TX90p and TN90p in over 63% of stations. NDVI was negatively correlated with TNx. Around 70% of meteorological stations exhibited a positive relationship between NPP and NDVI and TNn, TXn, DTR, RX1day, and RX5day. Figure 9b,d displayed that NPP and NDVI within the YRB mainly coincided with the extreme climate indexes or lagged behind them by 6 to 7 months. About 26% of meteorological stations revealed NPP or NDVI within the same period as extreme temperature indexes, mostly displaying a positive correlation. Approximately 14% of sites showed an NPP or NDVI lag of 6 to 7 months compared to extreme temperature indexes, with most revealing a negative correlation. Extreme precipitation indexes, NPP, and NDVI within the YRB shared a similar period with around 66% of stations.

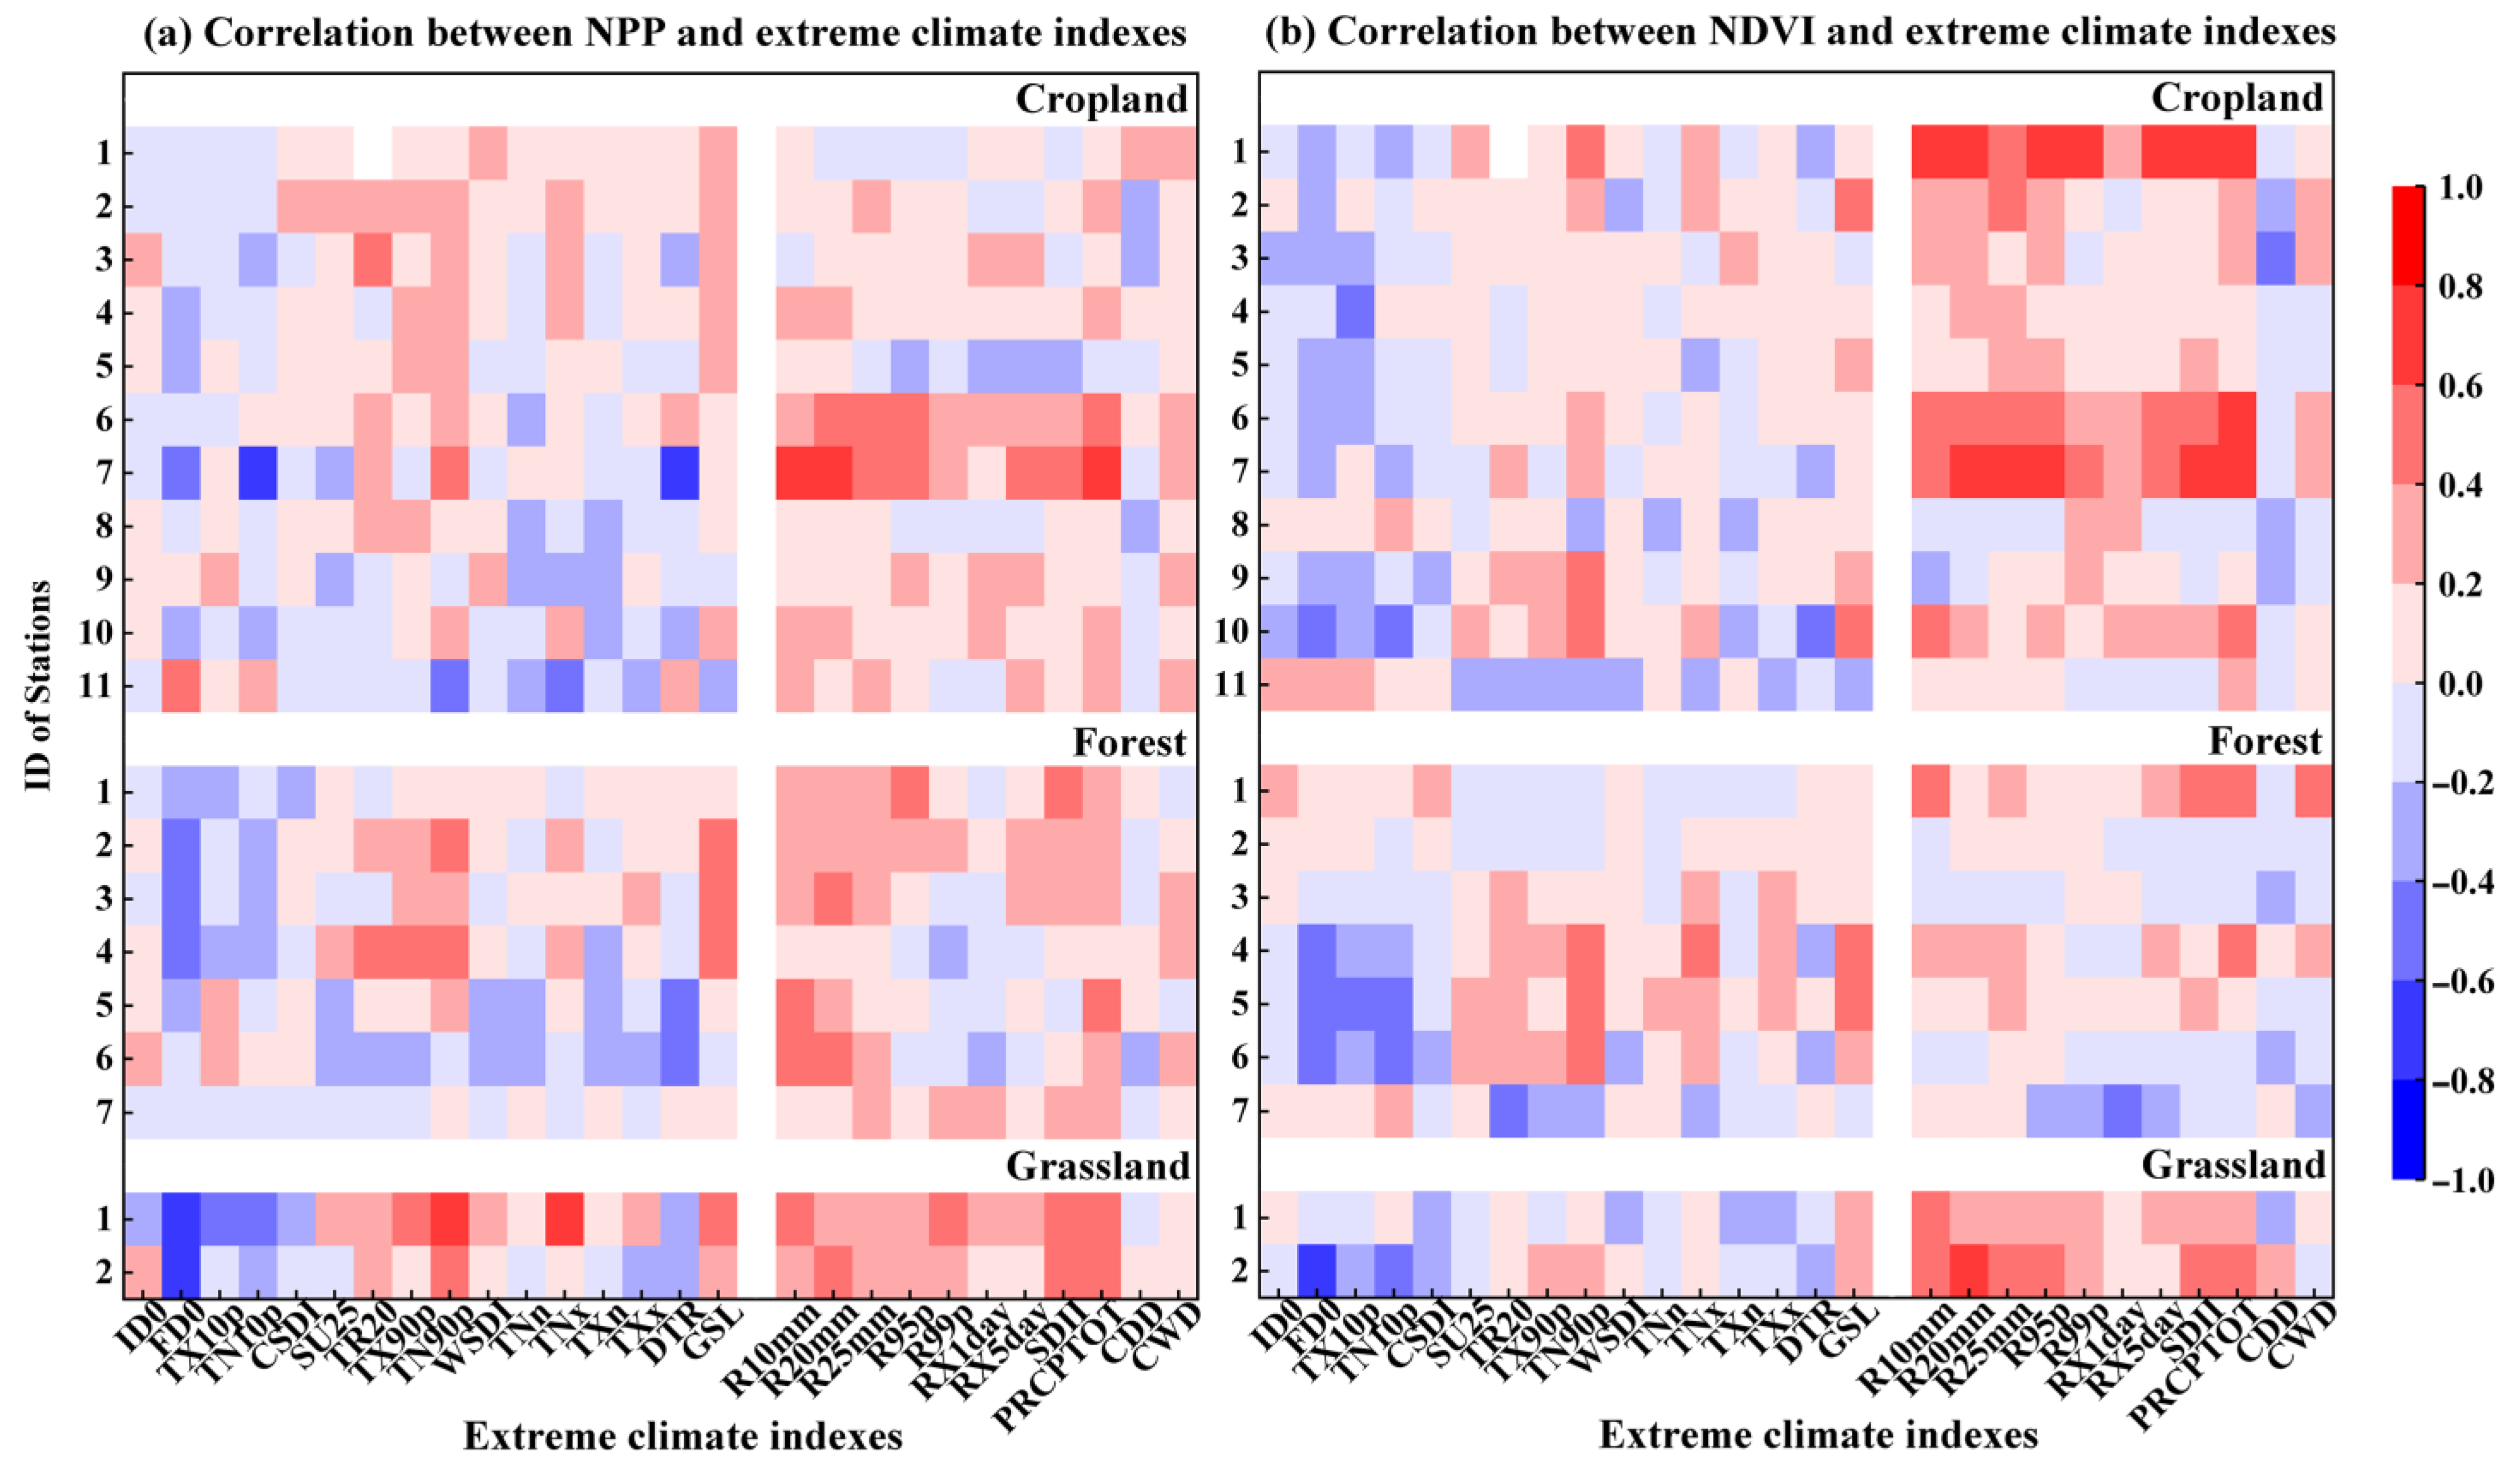
3.3.2. Relationship between NPP, NDVI, and Climate Extreme Indexes in Vegetation Ecosystem

There are mainly three vegetation types (cropland, forest, and grassland) in the whole YRB. We further investigated the nexus between extreme climate indexes and vegetation indicators (NPP and NDVI) for diverse vegetation ecosystem (cropland, forest, and grassland) utilizing Spearman correlation coefficients, and the results are displayed in Figure 10. The extreme precipitation indexes generally displayed positive relationship with NPP and NDVI, having proven influence on plants’ growth in cropland, forest, and grassland ecosystems. NPP and NDVI in the grassland were generally negatively correlated with FD0, TX10P, TX10P, CSDI, and DTR, indicating these indexes disturb vegetation growth. Others extreme temperature indexes, e.g., TR20, TX90p, TX90p, WSDI, and TNx, displayed a positive association with NPP and NDVI in the grassland ecosystem, indicating these indexes favor grass growth. For the cropland and forest ecosystems, the relationship between NPP/NDVI of different meteorological sites and their 16 extreme temperature indexes varied among meteorological sites. There were positive and negative relationships between NPP/NDVI of forest and cropland with the 16 extreme temperature indexes. The results suggested that nexus between the vegetation growth and extreme temperature in the cropland and forest was complex.

4. Discussion

4.1. Vegetation Growth

Anthropogenic activities, for example, afforestation, grain–for–green project, and implementation of watershed ecology and environmental protection policies, can contribute to the restoration of vegetation cover [47]. Conversely, overgrazing, deforestation, cropland loss, and urban expansion could lead to the destruction of vegetation [48]. In this study, we focused on zones within the YRB that had not undergone changes in vegetation cover types in past years in order to explore the vegetation growth. The predominant goal of this operation was to exclude the influence of land use changes and human activities on vegetation growth, and only consider the impact of climatic change on plants’ growth. Carbon flux data (NPP) can assess plants’ biomass, and NDVI mirrors greenness change in vegetation canopy. NPP and NDVI, as the proxies of plant vegetation herein, can describe the plants’ growth through diverse biomes. Our analysis revealed that remote sensing indexes (NPP and NDVI) of cropland, forest, and grassland were increasing, coherent with previous findings [49]. Vegetation greening indicated that climate change in the YRB were favorable for plants’ growth (Figure 4). Furthermore, YRB has the largest grassland area, and the cropland is second to grassland. However, remote sensing indexes (NPP and NDVI) of cropland were larger than grassland, which was due to the arid and semi-arid climate in the Yellow River Basin. Grassland areas are mostly rain-fed. Agricultural areas (wheat, maize, etc.) are affected by human activities, such as irrigation, in addition to precipitation. Spatially, the NPP and NDVI in the YRB tended to increase from northwest to southeast (Figure 5) due to the relatively low vegetation indexes in mountainous and desert areas in the northwest (mainly grassland), while better water and heat conditions in the southeast (primarily forest and cropland) led to a relatively high vegetation index [50]. Carbon flux (NPP) and vegetation index (NDVI) of the YRB and its divergent vegetation types (crop, forest, and grass) had shown a raised trend over the past decades due to climate change. Previous research had also indicated that the primary driving factor behind vegetation change in the YRB was climatic factors [51]. Precipitation contributes less (<26%) to NDVI in drylands globally [52], and average temperature also dominated part of the NDVI change [23]. From a regional perspective, the Shaanxi–Gansu–Ningxia region of the YRB displayed a clear upward trend in carbon flux (NPP) and vegetation index (NDVI) (Figure 6), indicating improvement in the ecological environment. However, NPP and NDVI in the upper and downstream regions of the YRB underwent remarkable declines because of climate change, pointing to ecological environment degradation in those regions. The decreasing trend of NDVI in this work was in agreement with previous studies [49]. Our findings revealed that most part of crop, forest, and grass in the Yellow River Basin displayed an increasing tendency, and parts of grids demonstrated a downward trend in the context of climate change.

4.2. Extreme Temperature and Precipitation

Numerous studies have revealed that extreme climate displayed diverse change characteristics that varied based on various regions [28,53]. In Southwest China, extreme warm indexes were significantly increased, and extreme cold indexes were obviously reduced, while extreme precipitation indexes were markedly raised [54]. Significant gain in extreme rainfall was found in Sarawak tropical peatland, and change in minimum temperature was higher than that of maximum temperature [55]. We found extreme high temperature indexes in the YRB displayed an increase trend, while extreme low temperature indexes exhibited a corresponding decrease trend (as shown in Table 3). Previous findings had indicated that both night and day temperatures had increased due to global warming [31]. Our analysis revealed that the decline rate of extreme low temperature indexes was larger than the extreme high temperature indexes’ rise rate, suggesting that night warming was significantly higher than day temperature. Additionally, we observed a decreasing diurnal temperature range, indicating that the daily difference between high and low temperatures became smaller. The observed increase in growing season length indicated that global warming extended the time period suitable for vegetation growth. While extreme precipitation indexes showed an overall increase, and the trend of change was not significant. Extreme climate events changes were attributed to both anthropogenic forcing and natural climate change, affecting their frequency, intensity, and duration [56,57,58]. Overall, our results displayed that the extreme climate change in the historical period of the YRB was large and obvious, and the change pattern of climate extreme would be a potential threat to its plants’ growth.

4.3. Vegetation Growth Responses to Extreme Climate

We depicted the sensitiveness of vegetation dynamics to extreme climate through correlations between vegetation indexes (NPP and NDVI) and extreme climate indexes in this paper. It is essential to estimate the sensitiveness of vegetation dynamics to extreme climate as soon as possible and to decipher their nexus.
As a typical arid and semi-arid zone, Yellow River Basin’s vegetation status is deeply affected by climate and environmental changes. Sufficient heat and moisture facilitates the growth of vegetation, while temperature and precipitation can directly impact the water balance of soil, thereby affecting plants’ growth [59]. Negative correlations between vegetation indexes (NPP and NDVI) and extreme low temperature indexes in the YRB revealed that such weather conditions can impede the growth of vegetation. This could be owing to the insufficient accumulation of temperature required for plants’ growth, which can limit plant development [60] and in severe cases cause a range of low temperature disasters. Conversely, positive correlations were observed between NPP and NDVI with extreme high temperature indexes, which can encourage the growth of vegetation up to a certain level. High temperatures can increase evaporation, leading to accelerated plants’ growth and improved water use efficiency, ultimately promoting photosynthesis. However, beyond a certain threshold, extreme high temperatures can be detrimental to vegetation [13]. Our analysis also revealed negative correlation between NPP and DNVI with the diurnal temperature range and positive correlations with growing season length, indicating that the latter had a positive influence on vegetation growth, while the former restricted it. NPP and NDVI were found to be positively correlated with extreme precipitation, which stimulated vegetation growth by increasing soil moisture in the arid zones, thereby improving carbonic accumulation and ecosystem productiveness. We also found the extreme precipitation indexes exhibited positive correlation with NPP and NDVI for cropland, forest, and grassland ecosystem (Figure 10), having favorable impact on vegetation (grass, crop, and forest) growth. Numerous studies also demonstrated that climate change’s apparent fingerprint on the earth’s ecosystems activities [61,62]. Extreme temperature showed marked influences on the grassland NDVI changes than extreme precipitation. Comparatively, shrubland NDVI changes were mainly governed by extreme precipitation [23].

4.4. Limitations and Prospects

We probed the spatial and temporal features of vegetation indexes (NPP and NDVI) and extreme climate, and delved deeper into their nexus. Although critical results have been obtained, this study had a few limitations. Firstly, the nexus between vegetation indexes and extreme climate was discussed by with the Spearman’s rank correlation analysis and cross-correlation analysis method. The nonlinear relationship between them was not considered. Then, we only analyzed the nexus of plants’ growth and extreme climate at the point scale, and did not quantitatively discuss the reaction of grid-scale vegetation to climate extreme. Thus, further research is required for the quantifiable estimation of extreme climate effects on vegetation growth at the regional scale using multi-source regional scale datasets.

5. Conclusions

The study intends to evaluate the spatio–temporal patterns of vegetation indicators and climate extreme indexes in the Yellow River Basin (YRB), and enhance our comprehension of the correlation between terrestrial ecosystems and climate extremes in the arid and semiarid regions. Our important conclusions are as follows.
NPP and NDVI exhibited an upward trend for cropland, forest, and grassland in the YRB. The fastest increasing trend of NPP for cropland was 4.13 gC/m2/a, and the largest rising tendency of NDVI for forest was 0.0018. Spatially, the multi-year average of NPP and NDVI both increased from northwest to southeast, with over 89% of YRB experiencing an increase in NPP and NDVI. Notably, significant increases in NPP and NDVI were mainly evident in Qinghai and Shaanxi.
Extreme low temperature indexes exhibited a downward tendency, while extreme high temperature and precipitation indexes displayed an upward trend. Over 75% of the extreme low temperature indexes at each station displayed a declining tendency, whilst over 79% of extreme high temperature indexes exhibited an ascending trend. Apart from the cooling degree days, more than 69% of extreme precipitation indexes demonstrated an upward trend.
We found a negative relationship between NPP, NDVI, and extreme low temperature indexes, and a positive nexus with extreme high temperature and precipitation indicators (excluding CDD). Moreover, NPP and NDVI in the YRB showed a prompt response to the beneficial impact of extreme temperature, while the negative impact was evident after around six months. Finally, NPP and NDVI were mostly concurrent with extreme precipitation indexes.
In summary, our study provides extensive insights into the spatial and temporal distribution patterns, and the nexus between climate extremes change and vegetation indicators in the YRB, which could benefit related ecological research in the region.

Author Contributions

Conceptualization, Z.X.; methodology, Y.C.; software, X.H.; validation, X.H., M.C. and Q.L.; formal analysis, Y.C.; investigation, X.H.; resources, W.W. and Q.L.; data curation, X.H. and M.C.; writing—original draft preparation, Y.C. and Z.X.; writing—review and editing, Y.C.; visualization, M.C.; supervision, Z.X.; project administration, Z.X.; funding acquisition, Y.C. All authors have read and agreed to the published version of the manuscript.

Funding

This research was funded by the National Natural Science Foundation of China, grant numbers: U21A2014, 41701503, and 42101324, and the Natural Science Foundation of Henan Province, grant number: 232300420160.

Data Availability Statement

This study was performed based on public-access data. The data that support the findings of this study are available from the corresponding author upon reasonable request.

Conflicts of Interest

The authors declare no conflict of interest.

References

  1. Zhao, L.; Dai, A.; Dong, B. Changes in global vegetation activity and its driving factors during 1982–2013. Agric. For. Meteorol. 2018, 249, 198–209. [Google Scholar] [CrossRef]
  2. Zhang, Z.; Xin, Q.; Li, W. Machine Learning-Based Modeling of Vegetation Leaf Area Index and Gross Primary Productivity across North America and Comparison with a Process-Based Model. J. Adv. Model. Earth Syst. 2021, 13, e2021MS002802. [Google Scholar] [CrossRef]
  3. Jiang, W.; Yuan, L.; Wang, W.; Cao, R.; Zhang, Y.; Shen, W. Spatio-temporal analysis of vegetation variation in the Yellow River Basin. Ecol. Indic. 2015, 51, 117–126. [Google Scholar] [CrossRef]
  4. Yao, R.; Cao, J.; Wang, L.; Zhang, W.; Wu, X. Urbanization effects on vegetation cover in major African cities during 2001–2017. Int. J. Appl. Earth Obs. Geoinf. 2019, 75, 44–53. [Google Scholar] [CrossRef]
  5. IPCC. Climate Change 2021: The Physical Science Basis. Contribution of Working Group I to the Sixth Assessment Report of the Intergovernmental Panel on Climate Change; Cambridge University Press: Cambridge, UK, 2021. [Google Scholar]
  6. Alexander, L.V.; Zhang, X.; Peterson, T.C.; Caesar, J.; Gleason, B.; Klein Tank, A.M.G.; Haylock, M.; Collins, D.; Trewin, B.; Rahimzadeh, F.; et al. Global observed changes in daily climate extremes of temperature and precipitation. J. Geophys. Res. Atmos. 2006, 111, D05109. [Google Scholar] [CrossRef]
  7. Li, J.; Su, Z.; Jiang, J.; Chen, W.; Yu, N.; Li, X.; Xie, J.; Wei, J. Spatial-Temporal Change in Vegetation Cover and Climate Factor Drivers of Variation in the Haihe River Basin 2003-2016. IOP Conf. Ser. Earth Environ. Sci. 2021, 697, 012005. [Google Scholar] [CrossRef]
  8. Li, C.; Wang, R. Recent changes of precipitation in Gansu, Northwest China: An index-based analysis. Theor. Appl. Climatol. 2017, 129, 397–412. [Google Scholar] [CrossRef]
  9. Shi, G.; Ye, P. Assessment on Temporal and Spatial Variation Analysis of Extreme Temperature Indices: A Case Study of the Yangtze River Basin. Int. J. Environ. Res. Public Health 2021, 18, 10936. [Google Scholar] [CrossRef]
  10. Li, X.; Zhang, K.; Gu, P.; Feng, H.; Yin, Y.; Chen, W.; Cheng, B. Changes in precipitation extremes in the Yangtze River Basin during 1960–2019 and the association with global warming, ENSO, and local effects. Sci. Total Environ. 2021, 760, 144244. [Google Scholar] [CrossRef]
  11. Cui, L.; Wang, L.; Qu, S.; Singh, R.P.; Lai, Z.; Yao, R. Spatiotemporal extremes of temperature and precipitation during 1960–2015 in the Yangtze River Basin (China) and impacts on vegetation dynamics. Theor. Appl. Climatol. 2019, 136, 675–692. [Google Scholar] [CrossRef]
  12. Saleem, A.; Awange, J.L.; Kuhn, M.; John, B.; Hu, K. Impacts of extreme climate on Australia’s green cover (2003–2018): A MODIS and mascon probe. Sci. Total Environ. 2021, 766, 142567. [Google Scholar] [CrossRef] [PubMed]
  13. Xu, X.; Jiang, H.; Guan, M.; Wang, L.; Huang, Y.; Jiang, Y.; Wang, A. Vegetation responses to extreme climatic indices in coastal China from 1986 to 2015. Sci. Total Environ. 2020, 744, 140784. [Google Scholar] [CrossRef] [PubMed]
  14. Vogel, E.; Donat, M.G.; Alexander, L.V.; Meinshausen, M.; Ray, D.K.; Karoly, D.; Meinshausen, N.; Frieler, K. The effects of climate extremes on global agricultural yields. Environ. Res. Lett. 2019, 14, 054010. [Google Scholar] [CrossRef]
  15. Deng, H.; Yin, Y.; Han, X. Vulnerability of vegetation activities to drought in Central Asia. Environ. Res. Lett. 2020, 15, 084005. [Google Scholar] [CrossRef]
  16. Liu, G.; Liu, H.; Yin, Y. Global patterns of NDVI-indicated vegetation extremes and their sensitivity to climate extremes. Environ. Res. Lett. 2013, 8, 025009. [Google Scholar] [CrossRef]
  17. Piao, S.; Tan, J.; Chen, A.; Fu, Y.H.; Ciais, P.; Liu, Q.; Janssens, I.A.; Vicca, S.; Zeng, Z.; Jeong, S.-J.; et al. Leaf onset in the northern hemisphere triggered by daytime temperature. Nat. Commun. 2015, 6, 6911. [Google Scholar] [CrossRef] [PubMed]
  18. Zhang, Z.; Lu, L.; Zhao, Y.; Wang, Y.; Wei, D.; Wu, X.; Ma, X. Recent advances in using Chinese Earth observation satellites for remote sensing of vegetation. ISPRS J. Photogramm. Remote Sens. 2023, 195, 393–407. [Google Scholar] [CrossRef]
  19. Orusa, T.; Viani, A.; Moyo, B.; Cammareri, D.; Borgogno-Mondino, E. Risk Assessment of Rising Temperatures Using Landsat 4-9 LST Time Series and Meta® Population Dataset: An Application in Aosta Valley, NW Italy. Remote Sens. 2023, 15, 2348. [Google Scholar] [CrossRef]
  20. Seto, K.C.; Shepherd, J.M. Global urban land-use trends and climate impacts. Curr. Opin. Environ. Sustain. 2009, 1, 89–95. [Google Scholar] [CrossRef]
  21. Zhang, Y.; Hong, S.; Liu, D.; Piao, S. Susceptibility of vegetation low-growth to climate extremes on Tibetan Plateau. Agric. For. Meteorol. 2023, 331, 109323. [Google Scholar] [CrossRef]
  22. Mo, Y.; Zhang, X.; Liu, Z.; Zhang, J.; Hao, F.; Fu, Y. Effects of Climate Extremes on Spring Phenology of Temperate Vegetation in China. Remote Sens. 2023, 15, 686. [Google Scholar] [CrossRef]
  23. He, L.; Guo, J.; Yang, W.; Jiang, Q.; Chen, L.; Tang, K. Multifaceted responses of vegetation to average and extreme climate change over global drylands. Sci. Total Environ. 2023, 858, 159942. [Google Scholar] [CrossRef]
  24. Wei, Y.; Yu, M.; Wei, J.; Zhou, B. Impacts of Extreme Climates on Vegetation at Middle-to-High Latitudes in Asia. Remote Sens. 2023, 15, 1251. [Google Scholar] [CrossRef]
  25. Yan, W.; He, Y.; Cai, Y.; Qu, X.; Cui, X. Relationship between extreme climate indices and spatiotemporal changes of vegetation on Yunnan Plateau from 1982 to 2019. Glob. Ecol. Conserv. 2021, 31, e01813. [Google Scholar] [CrossRef]
  26. Niu, C.; Qi, Y.; Guo, A.; Chang, J. Grain yield and food security evaluation in the yellow river basin under climate change and water resources constraints. Front. Water 2022, 4, 908945. [Google Scholar] [CrossRef]
  27. Zhan, C.; Liang, C.; Zhao, L.; Jiang, S.; Niu, K.; Zhang, Y. Drought-related cumulative and time-lag effects on vegetation dynamics across the Yellow River Basin, China. Ecol. Indic. 2022, 143, 109409. [Google Scholar] [CrossRef]
  28. Zhu, X.; Lee, S.-Y.; Wen, X.; Ji, Z.; Lin, L.; Wei, Z.; Zheng, Z.; Xu, D.; Dong, W. Extreme climate changes over three major river basins in China as seen in CMIP5 and CMIP6. Clim. Dyn. 2021, 57, 1187–1205. [Google Scholar] [CrossRef]
  29. Liu, C.; Zhang, X.; Wang, T.; Chen, G.; Zhu, K.; Wang, Q.; Wang, J. Detection of vegetation coverage changes in the Yellow River Basin from 2003 to 2020. Ecol. Indic. 2022, 138, 108818. [Google Scholar] [CrossRef]
  30. Cao, Y.; Xie, Z.; Woodgate, W.; Ma, X.; Cleverly, J.; Pang, Y.; Qin, F.; Huete, A. Ecohydrological decoupling of water storage and vegetation attributed to China’s large-scale ecological restoration programs. J. Hydrol. 2022, 615, 128651. [Google Scholar] [CrossRef]
  31. Wang, Y.; Luo, Y.; Shafeeque, M. Interpretation of vegetation phenology changes using daytime and night-time temperatures across the Yellow River Basin, China. Sci. Total Environ. 2019, 693, 133553. [Google Scholar] [CrossRef]
  32. Liang, K.; Liu, S.; Bai, P.; Nie, R. The Yellow River basin becomes wetter or drier? The case as indicated by mean precipitation and extremes during 1961–2012. Theor. Appl. Climatol. 2015, 119, 701–722. [Google Scholar] [CrossRef]
  33. Li, Q.; Cao, Y.; Miao, S.; Huang, X. Spatiotemporal Characteristics of Drought and Wet Events and Their Impacts on Agriculture in the Yellow River Basin. Land 2022, 11, 556. [Google Scholar] [CrossRef]
  34. Rong, T.; Long, L.H. Quantitative Assessment of NPP Changes in the Yellow River Source Area from 2001 to 2017. IOP Conf. Ser. Environ. Earth Sci. 2021, 687, 012002. [Google Scholar] [CrossRef]
  35. Peng, D.; Wu, C.; Zhang, B.; Huete, A.; Zhang, X.; Sun, R.; Lei, L.; Huang, W.; Liu, L.; Liu, X.; et al. The Influences of Drought and Land-Cover Conversion on Inter-Annual Variation of NPP in the Three-North Shelterbelt Program Zone of China Based on MODIS Data. PLoS ONE 2016, 11, e0158173. [Google Scholar] [CrossRef] [PubMed]
  36. Cui, T.; Wang, Y.; Sun, R.; Qiao, C.; Fan, W.; Jiang, G.; Hao, L.; Zhang, L. Estimating vegetation primary production in the Heihe River Basin of China with multi-source and multi-scale data. PLoS ONE 2016, 11, e0153971. [Google Scholar] [CrossRef] [PubMed]
  37. Yu, T.; Sun, R.; Xiao, Z.; Zhang, Q.; Liu, G.; Cui, T.; Wang, J. Estimation of global vegetation productivity from global land surface satellite data. Remote Sens. 2018, 10, 327. [Google Scholar] [CrossRef]
  38. Wang, M.; Sun, R.; Zhu, A.; Xiao, Z. Evaluation and comparison of light use efficiency and gross primary productivity using three different approaches. Remote Sens. 2020, 12, 1003. [Google Scholar] [CrossRef]
  39. Luo, M.; Sa, C.; Meng, F.; Duan, Y.; Liu, T.; Bao, Y. Assessing extreme climatic changes on a monthly scale and their implications for vegetation in Central Asia. J. Clean. Prod. 2020, 271, 122396. [Google Scholar] [CrossRef]
  40. Wu, D.; Wu, H.; Zhao, X.; Zhou, T.; Tang, B.; Zhao, W.; Jia, K. Evaluation of Spatiotemporal Variations of Global Fractional Vegetation Cover Based on GIMMS NDVI Data from 1982 to 2011. Remote Sens. 2014, 6, 4217–4239. [Google Scholar] [CrossRef]
  41. Liu, H.; Gong, P.; Wang, J.; Clinton, N.; Bai, Y.; Liang, S. Annual dynamics of global land cover and its long-term changes from 1982 to 2015. Earth Syst. Sci. Data 2020, 12, 1217–1243. [Google Scholar] [CrossRef]
  42. Ren, Y.; Zhang, F.; Zhao, C.; Wang, D.; Li, J.; Zhang, J.; Cheng, Z. Spatiotemporal changes of extreme climate indices and their influence and response factors in a typical cold river basin in Northeast China. Theor. Appl. Climatol. 2023, 152, 1285–1309. [Google Scholar] [CrossRef]
  43. Yang, Y.; Wang, S.; Bai, X.; Tan, Q.; Li, Q.; Wu, L.; Tian, S.; Hu, Z.; Li, C.; Deng, Y. Factors Affecting Long-Term Trends in Global NDVI. Forests 2019, 10, 372. [Google Scholar] [CrossRef]
  44. Zhang, F.; Zhang, Z.; Kong, R.; Chang, J.; Tian, J.; Zhu, B.; Jiang, S.; Chen, X.; Xu, C.-Y. Changes in Forest Net Primary Productivity in the Yangtze River Basin and Its Relationship with Climate Change and Human Activities. Remote Sens. 2019, 11, 1451. [Google Scholar] [CrossRef]
  45. Liu, Z.; Wang, H.; Li, N.; Zhu, J.; Pan, Z.; Qin, F. Spatial and Temporal Characteristics and Driving Forces of Vegetation Changes in the Huaihe River Basin from 2003 to 2018. Sustainability 2020, 12, 2198. [Google Scholar] [CrossRef]
  46. Ndlovu, M.; Clulow, A.D.; Savage, M.J.; Nhamo, L.; Magidi, J.; Mabhaudhi, T. An Assessment of the Impacts of Climate Variability and Change in KwaZulu-Natal Province, South Africa. Atmosphere 2021, 12, 427. [Google Scholar] [CrossRef]
  47. Sun, X.; Li, G.; Wang, J.; Wang, M. Quantifying the Land Use and Land Cover Changes in the Yellow River Basin while Accounting for Data Errors Based on GlobeLand30 Maps. Land 2021, 10, 31. [Google Scholar] [CrossRef]
  48. Ji, Q.; Liang, W.; Fu, B.; Zhang, W.; Yan, J.; Lü, Y.; Yue, C.; Jin, Z.; Lan, Z.; Li, S.; et al. Mapping Land Use/Cover Dynamics of the Yellow River Basin from 1986 to 2018 Supported by Google Earth Engine. Remote Sens. 2021, 13, 1299. [Google Scholar] [CrossRef]
  49. Wang, L.; Zhu, Q.; Zhang, J.; Liu, J.; Zhu, C.; Qu, L. Vegetation dynamics alter the hydrological interconnections between upper and mid-lower reaches of the Yellow River Basin, China. Ecol. Indic. 2023, 148, 110083. [Google Scholar] [CrossRef]
  50. Zhan, C.; Liang, C.; Zhao, L.; Jiang, S.; Niu, K.; Zhang, Y.; Cheng, L. Vegetation Dynamics and its Response to Climate Change in the Yellow River Basin, China. Front. Environ. Sci. 2022, 10, 892747. [Google Scholar] [CrossRef]
  51. Lamchin, M.; Wang, S.W.; Lim, C.-H.; Ochir, A.; Pavel, U.; Gebru, B.M.; Choi, Y.; Jeon, S.W.; Lee, W.-K. Understanding global spatio-temporal trends and the relationship between vegetation greenness and climate factors by land cover during 1982–2014. Glob. Ecol. Conserv. 2020, 24, e01299. [Google Scholar] [CrossRef]
  52. Ukkola, A.M.; De Kauwe, M.G.; Roderick, M.L.; Burrell, A.; Lehmann, P.; Pitman, A.J. Annual precipitation explains variability in dryland vegetation greenness globally but not locally. Glob. Change Biol. 2021, 27, 4367–4380. [Google Scholar] [CrossRef]
  53. Guo, E.; Zhang, J.; Wang, Y.; Quan, L.; Zhang, R.; Zhang, F.; Zhou, M. Spatiotemporal variations of extreme climate events in Northeast China during 1960–2014. Ecol. Indic. 2019, 96, 669–683. [Google Scholar] [CrossRef]
  54. Wang, P.; Cheng, Q.; Jin, H. Divergent vegetation variation and the response to extreme climate events in the National Nature Reserves in Southwest China, 1961–2019. Ecol. Indic. 2023, 150, 110247. [Google Scholar] [CrossRef]
  55. Sa’adi, Z.; Yaseen, Z.M.; Farooque, A.A.; Mohamad, N.A.; Muhammad, M.K.I.; Iqbal, Z. Long-term trend analysis of extreme climate in Sarawak tropical peatland under the influence of climate change. Weather Clim. Extrem. 2023, 40, 100554. [Google Scholar] [CrossRef]
  56. Madakumbura, G.D.; Thackeray, C.W.; Norris, J.; Goldenson, N.; Hall, A. Anthropogenic influence on extreme precipitation over global land areas seen in multiple observational datasets. Nat. Commun. 2021, 12, 3944. [Google Scholar] [CrossRef]
  57. Duan, W.; Zou, S.; Christidis, N.; Schaller, N.; Chen, Y.; Sahu, N.; Li, Z.; Fang, G.; Zhou, B. Changes in temporal inequality of precipitation extremes over China due to anthropogenic forcings. npj Clim. Atmos. Sci. 2022, 5, 33. [Google Scholar] [CrossRef]
  58. Hu, T.; Sun, Y. Anthropogenic influence on extreme temperatures in China based on CMIP6 models. Int. J. Climatol. 2022, 42, 2981–2995. [Google Scholar] [CrossRef]
  59. Wang, J.; Rich, P.M.; Price, K.P. Temporal responses of NDVI to precipitation and temperature in the central Great Plains, USA. Int. J. Remote Sens. 2003, 24, 2345–2364. [Google Scholar] [CrossRef]
  60. Zhao, F.; Ma, S.; Wu, Y.; Qiu, L.; Wang, W.; Lian, Y.; Chen, J.; Sivakumar, B. The role of climate change and vegetation greening on evapotranspiration variation in the Yellow River Basin, China. Agric. For. Meteorol. 2022, 316, 108842. [Google Scholar] [CrossRef]
  61. Higgins, S.I.; Conradi, T.; Muhoko, E. Shifts in vegetation activity of terrestrial ecosystems attributable to climate trends. Nat. Geosci. 2023, 16, 147–153. [Google Scholar] [CrossRef]
  62. Leake, I. Climate extremes drive negative vegetation growth. Nat. Rev. Earth Environ. 2023, 4, 68. [Google Scholar] [CrossRef]
Figure 1. Geographic location and DEM of the study region, and the distributions of meteorology sites (the datum and the EPSG of the map–WGS_1984, EPSG:4326).
Remotesensing 15 04683 g001
Figure 2. Spatial pattern of LULC types of the study region. (a) Land cover types in 2020. (b) No change zone of LULC across YRB from 1985 to 2020 (the datum and the EPSG of the map–WGS_1984, EPSG:4326).
Remotesensing 15 04683 g002
Figure 3. Multi–year monthly averaged values of NPP and NDVI over the YRB.
Remotesensing 15 04683 g003
Figure 4. Annual (a) NPP and (b) NDVI of cropland, forest, and grassland over the Yellow River Basin.
Remotesensing 15 04683 g004
Figure 5. Spatial distributions of multi–year averaged value of (a) NPP and (b) NDVI in YRB (the datum and the EPSG of the map–WGS_1984, EPSG:4326).
Remotesensing 15 04683 g005
Figure 6. Annual change trend of NPP (a) and NDVI (b) in YRB during the study period, and the uncertainty in the Theil–Sen slope fit of the NPP (c) and NDVI (d) trends (significant change in pixels at the 95% level were hinted by grids, the datum, and the EPSG of the map–WGS_1984, EPSG:4326).
Remotesensing 15 04683 g006
Figure 7. Percentage of meteorological sites with both noticeably negative and noticeably positive tendency of extreme climate indexes in the YRB. A significance level (α = 0.05) was chosen to judge the presence of a tendency.
Remotesensing 15 04683 g007
Figure 8. Relationship between NPP, NDVI, and climate extreme indexes at meteorological sites in YRB.
Remotesensing 15 04683 g008
Figure 9. Time–lag cross–correlation of between NPP, NDVI, and extreme climate indexes at meteorological stations in the Yellow River Basin.
Remotesensing 15 04683 g009
Figure 10. Relationship between NPP, NDVI, and climate extreme indexes at meteorological sites in the ecosystems of cropland, forest, and grassland, respectively.
Remotesensing 15 04683 g010
Table 1. Summary of related studies about the extreme climate on vegetation growth.
StudyVegetation Data SourcesExtreme ClimateStudy PeriodLocationMethods
Zhang et al. [21]NDVI and solar-induced chlorophyll fluorescence (SIF)Drought, extreme wet, extreme hot and cold2001–2018Tibetan PlateauEvent coincidence analysis and significant test
Mo et al. [22]NDVI15 extreme temperature indexes and 10 extreme precipitation indexes1982–2015ChinaPartial correlation analysis
He et al. [23]NDVIAverage precipitation, temperature and potential evapotranspiration; five extreme precipitation and temperature change1982–2015Global drylandsLinear regression method; partial correlation analysis; Pearson correlation analysis; geographical detector model
Wei et al. [24]Leaf area index (LAI)extreme hot and wet; extreme hot and dry; extreme cold and wet; extreme cold and
dry climates
1982–2016Middle–to–high latitudes in AsiaStandardized anomalies
Yan et al. [25]NPP11 extreme temperature indexes and 4 extreme precipitation indexes1982–2019Yunnan plateauGeographic detector
Table 2. Descriptions of the utilized extreme climate indexes.
IndexDescriptive NameDefinitionUnits
Extreme temperature indexesID0Icing daysAnnual count where daily maximum temperature < 0 °Cdays
FD0Frost daysAnnual count where daily minimum temperature < 0 °Cdays
TX10pCold daysPercentage of days when daily maximum temperature < 10th percentiledays
TN10pCold nightsPercentage of days when daily minimum temperature < 10th percentiledays
CSDICold spell duration indexAnnual count of days with at least 6 consecutive days when TN < 10th percentiledays
SU25Summer daysAnnual count where daily maximum temperature > 25 °Cdays
TR20Tropical nightsAnnual count where daily minimum temperature > 20 °Cdays
TX90pWarm daysPercentage of days when daily maximum temperature > 90th percentiledays
TN90pWarm nightsPercentage of days when daily minimum temperature > 90th percentiledays
WSDIWarm spell duration indexAnnual count of days with at least 6 consecutive days
when daily maximum temperature > 90th percentile
days
TNnMinimum TNMonthly minimum value of daily minimum temperature°C
TNxMaximum TNMonthly maximum value of daily minimum temperature°C
TXnMinimum TXMonthly minimum value of daily maximum temperature°C
TXxMaximum TXMonthly maximum value of daily maximum temperature°C
DTRDiurnal temperature rangeAnnual mean difference between daily maximum temperature and daily minimum temperature°C
GSLGrowing season lengthAnnual count between first span of at least 6 days with daily mean temperature >5 °C and first span after July 1 of 6 days with daily mean temperature <5 °Cdays
Extreme precipitation indexesR10mmNumber of heavy precipitation daysAnnual count of days when daily precipitation > 10 mmdays
R20mmNumber of heavy precipitation daysAnnual count of days when daily precipitation > 20 mmdays
R25mmNumber of heavy precipitation days Annual count of days when daily precipitation > 25 mmdays
R95pVery wet daysNumber of days with daily precipitation > 95th percentilemm
R99pExtremely wet daysNumber of days with daily precipitation > 99th percentilemm
RX1dayMax 1 day precipitation amountMonthly maximum 1–day precipitationmm
RX5dayMax 5 day precipitation amountMonthly maximum consecutive 5–day precipitationmm
SDIISimple daily intensity indexAnnual total ≥ 1mm precipitation divided by the number of wet daysmm/d
PRCPTOTAnnual total wet day precipitationAnnual total precipitation in wet daysmm
CDDConsecutive dry daysMaximum number of consecutive days with daily precipitation < 1 mmdays
CWDConsecutive wet daysMaximum number of consecutive days with daily precipitation ≥ 1 mmdays
Table 3. Inter–annual trends of extreme climate episodes in the YRB between 1986 and 2020.
Extreme Climate IndexesIndexChange SlopeIndexChange Slope
Extreme temperature indexesID0−0.12SU250.32 *
FD0−0.59 *TR200.25 *
TX10p−0.25 *TX90p0.38 *
TN10p−0.35*TN90p0.63 *
CSDI−0.06WSDI0.10
TNn0.03TNx0.05 *
TXn−0.01TXx0.04 *
DTR−0.01GSL0.67 *
Extreme precipitation indexesR10mm0.09 *RX1day0.16 *
R20mm0.05 *RX5day0.45 *
R25mm0.04 *SDII0.03 *
R95p1.33 *PRCPTOT2.63 *
R99p0.60 *CDD−0.20
CWD0.02
Note: * represents passing the significance test of 0.05.
Table 4. Correlation coefficient between NPP, NDVI, and extreme climate indexes in the YRB.
NPPNDVI NPPNDVI
Extreme temperature indexesID0−0.11−0.17TNn−0.060.05
FD0−0.74 **−0.64 **TNx0.52 **0.41 *
SU250.46 **0.43 *TXn−0.20−0.10
TR200.58 **0.55 **TXx0.220.19
TX10p−0.38 *−0.45 **DTR−0.27−0.13
TN10p−0.61 **−0.50 **CSDI−0.18−0.20
TX90p0.48 **0.45 **GSL0.75 **0.63 **
TN90p0.76 **0.65 **WSDI0.180.25
Extreme precipitation indexesR10mm0.58 **0.48 **RX1day0.36 *0.34
R20mm0.61 **0.53 **RX5day0.49 **0.42 *
R25mm0.57 **0.49 **SDII0.45 **0.46 **
R95p0.58 **0.50 **PRCPTOT0.59 **0.48 **
R99p0.46 **0.36 *CDD−0.12−0.18
CWD0.290.22
Note: * represents passing the significance test of 0.05; ** represents passing the significance test of 0.01.
Disclaimer/Publisher’s Note: The statements, opinions and data contained in all publications are solely those of the individual author(s) and contributor(s) and not of MDPI and/or the editor(s). MDPI and/or the editor(s) disclaim responsibility for any injury to people or property resulting from any ideas, methods, instructions or products referred to in the content.

