Article

Environmental Characteristics of High Ice-Content Permafrost on the Qinghai–Tibetan Plateau

1
State Key Laboratory of Frozen Soil Engineering, Northwest Institute of Eco-Environment and Resources, Chinese Academy of Sciences, Lanzhou 730000, China
2
University of Chinese Academy of Sciences, Beijing 100049, China
3
Xining Integrated Natural Resources Survey Centre, China Geological Survey (CGS), Xining 810099, China
*
Author to whom correspondence should be addressed.
Remote Sens. 2023, 15(18), 4496; https://doi.org/10.3390/rs15184496
Submission received: 3 August 2023 / Revised: 6 September 2023 / Accepted: 8 September 2023 / Published: 13 September 2023

Abstract

:
Permafrost areas are sensitive to climate change and have a significant impact on energy and water cycles. Ground ice is a crucial component on the Qinghai–Tibetan Plateau (QTP). Understanding the environmental characteristics of ground ice is vital for accurately modeling its distribution and evolution. In this study, we analyzed 15 environmental characteristics of high ice-content permafrost sites. These attributes were extracted from 400 high ice-content permafrost datasets including 300 drilling boreholes and 100 thaw slumps collected throughout the entire plateau using large-scale remote sensing data and their products. The results are as follows: The mean annual air temperature in areas where high ice-content permafrost exists ranges from −5 to −3.5 °C, with an average warming rate of 0.08 °C/a. Additionally, there was an average increase in precipitation of about 25 mm/10a and an increase in soil moisture of about 4%/10a. Geomorphology strongly influences the occurrence of high ice content permafrost, with 85% of high ice-content permafrost development at altitudes between 4400 and 5100 m. Approximately 86% of high ice-content permafrost were developed in lowland or relatively flat areas, preferably in gently sloping and shady slope regions. Soils exhibit less variability in clay particles and more variability in silt and sand. Key indicators in the high ice content permafrost region include warming rate, active layer thickness, elevation, bulk density, soil thickness, clay content, precipitation, soil moisture, and NDVI. High ice-content permafrost is the result of a combination of environmental factors and is expected to undergo significant changes in the future. This study provides a foundation for comprehending the environmental changes in the high ice-content permafrost areas and modeling the distribution of ground ice. It underscores the urgent need to address the significant environmental changes faced by high ice-content permafrost regions.

1. Introduction

Permafrost is predominantly found at high latitudes and altitudes and covers about 16% of the global land area and 24% of the land area in the northern hemisphere [1,2]. The permafrost carbon pool, which accounts for over half of the global soil carbon pool, is about 1290 Pg and plays a crucial role in the Earth system. Due to global warming, the permafrost region experiences a warming rate of approximately 0.6 °C/10a, which is twice the global warming rate [3,4]. Consequently, this situation poses significant challenges and crises for the permafrost regions.
The Qinghai–Tibetan Plateau (QTP) is recognized as the largest expanse of high-altitude permafrost worldwide. Consequently, it has become a focal point for studying climate change, carbon and nitrogen cycles, hydrological and water resource effects, and ecological and environmental evolution, both in Asia and globally [5,6]. The permafrost in this region is characterized by high mean annual ground temperature, substantial ground ice content, elevated soil carbon content, and notable climate sensitivity [7]. Infrastructure development is profoundly impacted by freezing–thawing cycles resulting from ground ice formation and melting [8,9]. Current research on permafrost on the QTP primarily focuses on permafrost changes within the context of climate change, hydrology and ecology under the influence of permafrost changes, the construction and maintenance of permafrost zone engineering, and the feedback of greenhouse gases emitted due to permafrost thaw with the global warming [10,11,12,13]. These studies were concentrated on analyzing changes in permafrost temperatures and the subsequent effects on hydrology, ecology, and roadbed stability, while paying less attention to a crucial component of permafrost: ground ice.
Permafrost containing a substantial amount of ice commonly forms in moisture-rich locations, including lakeshores [14], wetland environments [15], and drained lake basins [16]. O’Neill [17] conducted a study in North America, sampling near-surface permafrost from 26 sites in the Illisarvik Drainage Lake Basin, 3 sites on the Lake Basin Terrace, and 9 sites in the tundra around Richards Island, NWT. The study determined that the accumulation of excess ice varied significantly, with a strong positive correlation to soil moisture status in the active layer and a secondary correlation to soil texture. The tundra exhibits significantly higher near-surface ground ice content compared to the basin, with ice enrichment occurring at greater depths [17]. Kokelj and Burn [18] conducted measurements of near-surface ground ice content at over 70 sites in the Mackenzie Delta area. The study revealed that well-drained silt with warm near surfaces had low ice content, while wetter spruce and alder communities located above flood level had high near-surface ground ice content. Morse et al. [15] examined 71 instances of near-surface ground ice content variation on Kendall Island in the Mackenzie Delta area. The results indicated that upland permafrost had a lower mean excess ice content (24%) compared to alluvial wetlands (34%), and the distribution of ground ice displayed greater variability in upland terrain than in lowland areas.
The high-altitude permafrost on the QTP displays clear large-scale three-way zonation [19]. While the local distribution of ground ice is primarily influenced by lithology, moisture, and geothermal temperature, there are also regional and zonal patterns present [20]. Ground ice stable isotope values (δ2H and δ18O) on the QTP are higher compared to those in the Arctic tundra ecosystem and the Eastern Siberian tundra. The spatial distribution of ground ice isotopes is primarily influenced by altitude and soil depth [21]. Yang et al. [22,23,24], using isotopic methods, conducted a study in the Beiluhe Basin and concluded that ground ice primarily derives its water from precipitation and active layer moisture, with some areas also being recharged by river water. Lin et al. [25] examined variations in near-surface ground ice content within the upper 2–3 m of the permafrost table. Mass water contents generally ranged from 8% to 500%, with approximately 76% of the samples classified as ice rich (≥20% mass water content). Average sedimentation rates ranged from 0.05 to 0.44. Fan et al. [26] utilized CT scanning to examine ground ice samples from the Beiluhe Basin, enabling the determination of volumetric ice content and cryostructure. However, despite these valuable contributions, the specific areas on the QTP characterized by high ice-content permafrost distribution have not been identified. Consequently, more research is needed to address this knowledge gap and to further our understanding of ground ice distribution on a large scale.
High ice-content permafrost is of great significance in terms of engineering and the environment [27,28,29,30]. However, the spatial distribution of ground ice is influenced by various factors, as well as the complexity involved in its formation on the QTP [31]. Many studies still rely on physical exploration, drilling, and other techniques to meet the geological requirements of specific engineering areas. This study utilizes an extensive dataset comprising 400 data sites of high ice-content permafrost over multiple years. The study employs remote sensing data to gain insight into environmental factors that affect the high ice-content permafrost.

2. Materials and Methods

2.1. Classification System for Ground Ice

Murton [32] classified ground ice into five categories based on volumetric ice content, where each class represents a 25% increase. These categories are ice-poor permafrost, ice-rich permafrost, sediment-rich permafrost, sediment-poor permafrost, and pure ice (Figure 1 and Table 1). Chinese permafrost scientists have also classified ground ice into five grades based on an engineering perspective [33,34].
Transporting permafrost samples from the field to the laboratory over long distances for volumetric ice content measurements is not a viable option. Instead, mass water content measurements are predominantly conducted at the sampling sites. These measurements, along with qualitative observations depicted in Figure 1, provide the basis for determining the ground ice content.
In this study, the term “high ice-content permafrost” encompasses sediment-rich permafrost, sediment-poor permafrost, and pure ice permafrost. Therefore, the high ice-content permafrost in the study was characterized by a mass water content exceeding 25%. During field work, permafrost samples that exhibit visible characteristics as shown in Figure 1d–f were classified as high ice-content permafrost.

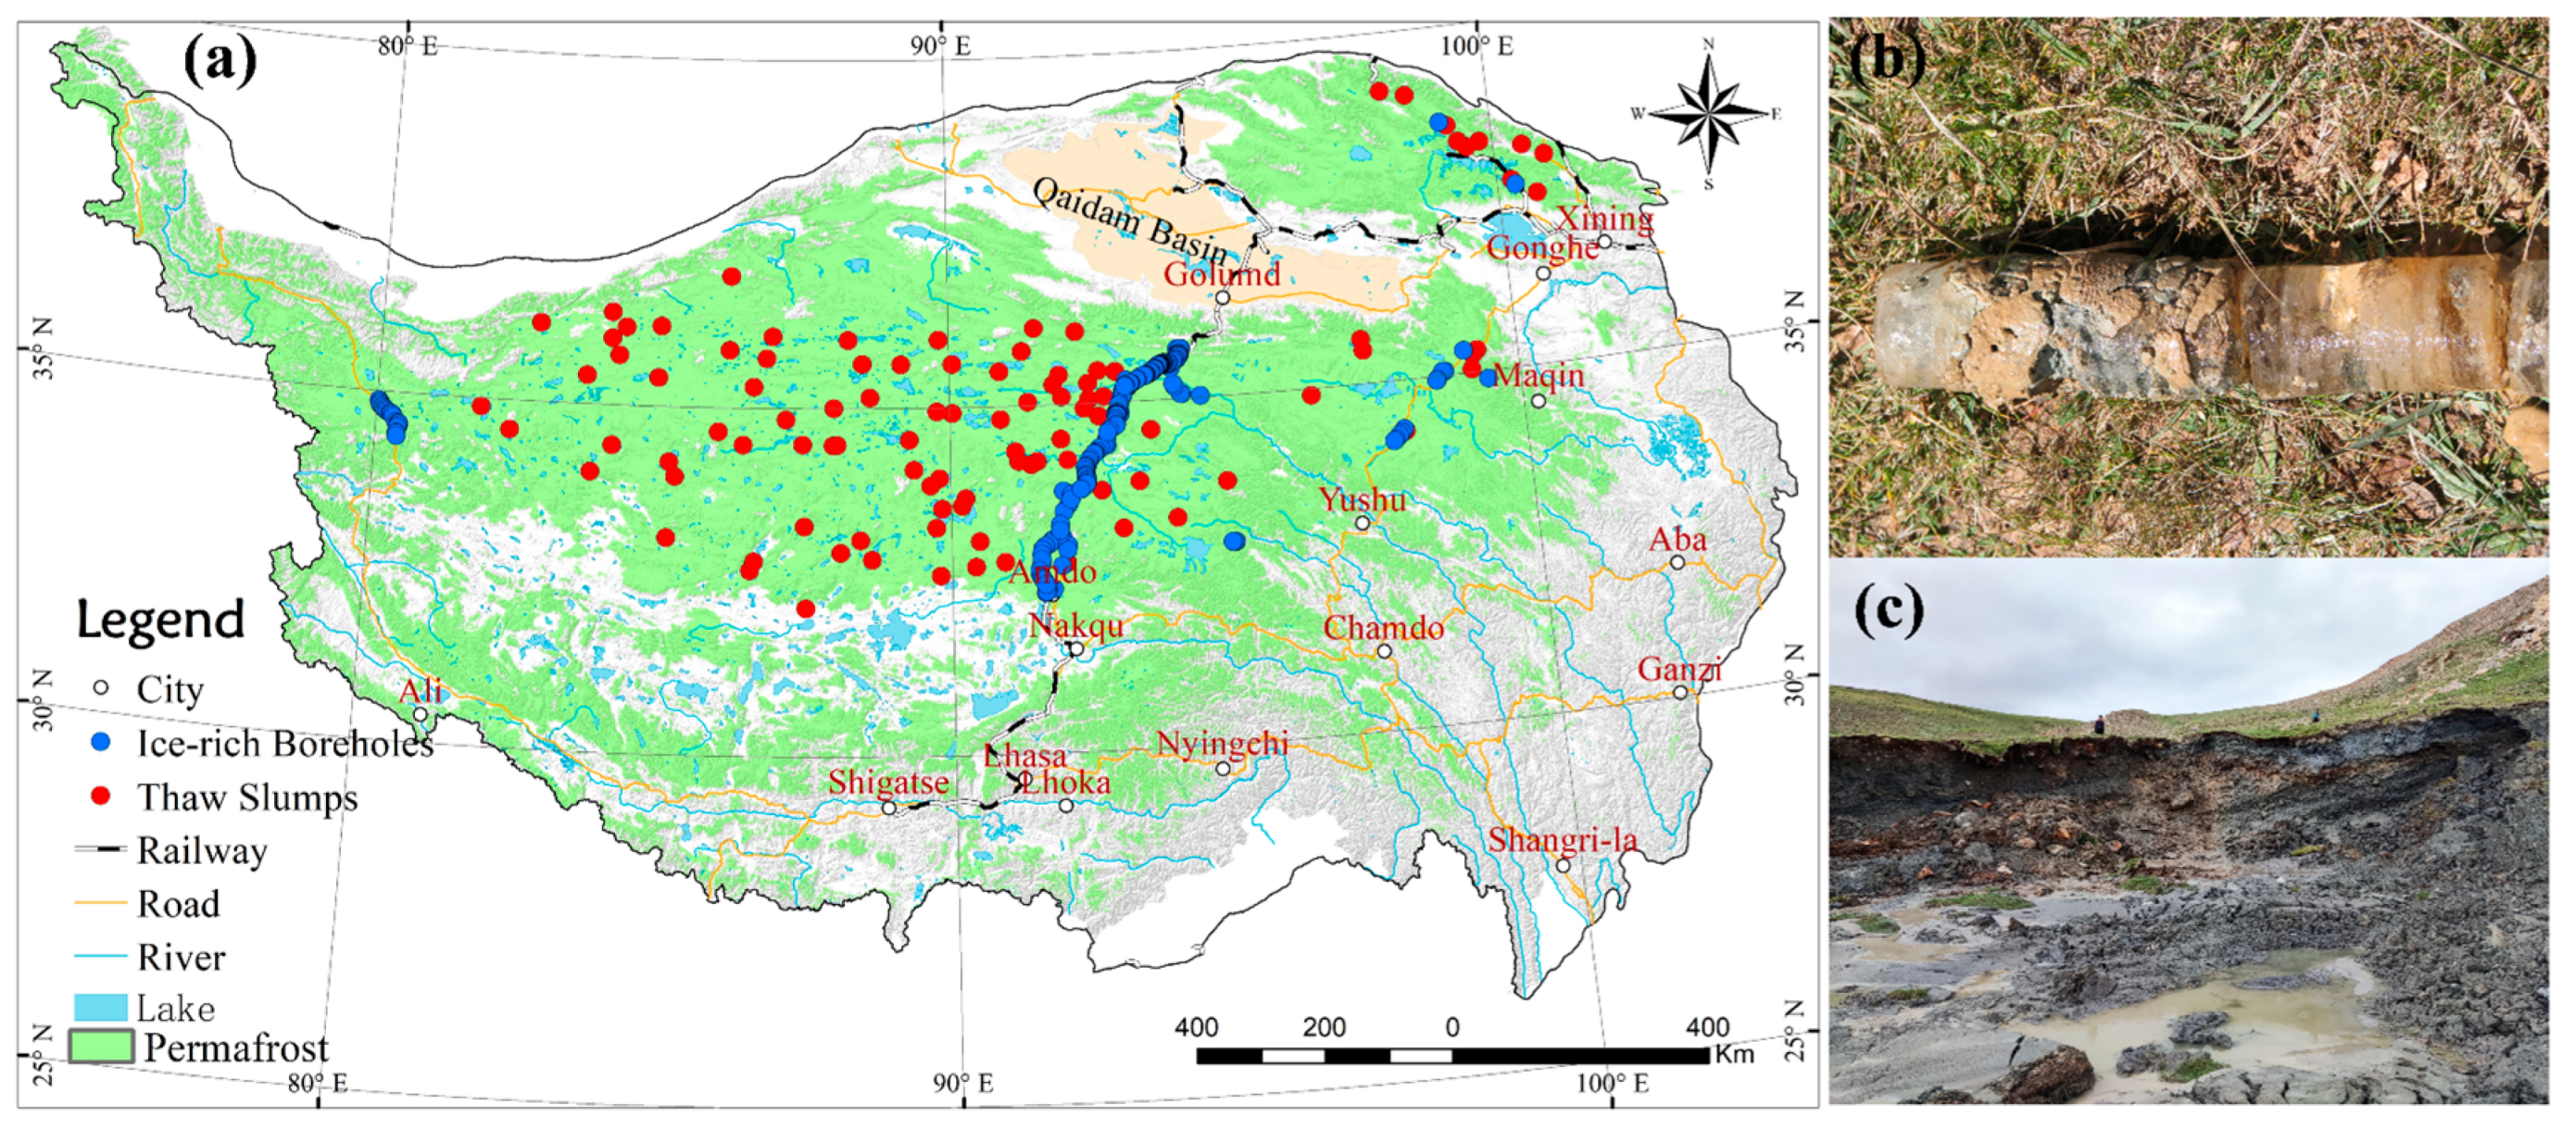
2.2. Source of High Ice-Content Permafrost Data

Ground ice is located underground, and drilling is commonly employed to measure the content of ground ice. The borehole data in this study comprise three components. The first component includes the extensive fieldwork conducted over a span of almost 20 years on the QTP. This fieldwork involved drilling multiple boreholes, subsequent data analysis, and collecting over 100 boreholes with high ice-content permafrost. The second component comprises data collected from approximately 150 boreholes drilled during the construction and reconstruction of various transportation routes within the permafrost region, such as the Qinghai–Tibet Railway/Highway, the Xinjiang–Tibet Highway, and the Gongyu Highway. To ensure the reliability of the data in this section, comparative analyses with neighboring areas were performed to validate the accuracy of the data obtained from boreholes with a notable ice content. The third component draws upon literature sources, which provide both qualitative and quantitative information on ground ice content, as well as regional data, such as permafrost temperature and geological features. This section includes approximately 50 data (Figure 2).
Thaw slumps form in sediment-poor permafrost or pure ice permafrost areas [33,34], hence making these areas classified as high ice-content permafrost areas. High-quality remote sensing images allow for a comprehensive interpretation of thaw slumps. In the study area, thaw slumps typically exhibit elongated, branched, and tongued shapes, with distinct boundaries resulting from active layer collapse and slumping within the thaw slump zones [34]. Moreover, the displacement and deformation of the thaw slump bodies lead to the alteration of their geomorphological integrity. The exposure of soil and ground ice beneath the active layer, along with variations in soil moisture content and surface cover, differentiate the landslide areas from the surrounding regions. Consequently, noticeable discrepancies can be observed between the thaw slump areas and the neighboring areas on remotely sensed images. Therefore, it is possible to identify the distribution of thaw slumps on the plateau (see Figure 2). In this study, we visually interpreted thaw slumps on QTP by using Gaofen 2019. One hundred thaw slumps were then selected to replace the high ice-content data on the no-borehole areas.

2.3. Remote Sensing Data Products

The permafrost characterization data include information on permafrost ground temperature, active layer thickness (ALT), and the geological soil environment. Permafrost ground temperature data obtained through monitoring consist of long series of temperature data. The ALT was calculated based on these temperature data. The geological soil data were compiled during the drilling process. Design and construction data were collected through geological surveys performed during the design and construction phases. Permafrost ground temperatures were derived from short time series of boreholes, while ALT were measured using boreholes drilled during the summer months. Geological soils were catalogued based on geological assessments conducted during the drilling process. In cases where ground temperature, ALT, and geological soil information are absent, calculations were performed using remote sensing data. These additional data were sourced from the National Tibetan Plateau Data Center (https://doi.org/10.17632/hbptbpyw75.1, accessed on 24 October 2022).
The air temperature data used in this study were obtained from the China 1 km resolution monthly mean air temperature dataset for the period 1996–2020, available at https://doi.org/10.11888/Meteoro.tpdc.270961, accessed on 31 May 2023. Similarly, the precipitation data were sourced from the China 1 km resolution monthly precipitation dataset covering the same time frame, which can be accessed at https://doi.org/10.5281/zenodo.3185722, accessed on 31 May 2023. Both datasets were acquired from the National Tibetan Plateau Data Center, and they exhibit a month-by-month temporal resolution and a spatial resolution of 1 km.
The elevation data used in this study were derived from the “SRTMDEM 90M resolution raw elevation data”, which were sourced from Geospatial Data Cloud (http://www.gscloud.cn/, accessed on 18 November 2021). The elevation data have a spatial resolution of 90 m. The slope aspect data were generated using the ArcGIS platform. Preceding analysis, the data underwent preprocessing steps, including mosaicing, cropping, and re-sampling to derive the elevation, slope, and slope aspect data at a spatial resolution of 1 km for the study area.
The soil moisture data utilized a 0.25° × 0.25° surface soil moisture product generated by the SMAP time dilation method on the QTP. The SMAP L3-level surface soil moisture product was processed with time dilation using the random forest method with passive microwave bright temperature data and related ancillary data. Among these, the years 1980, 1985, 1990, 1995, and 2000 were month-by-month products that utilized bright temperature data from three channels: SMMR, SSM/I, and SSMIS at 19 GHz V/H and 37 GHz V. The period from 20 June 2002 to 30 December 2018, constituted a day-by-day product that employed AMSR-E and AMSR2 at 6.925 GHz V/H, 10.65 GHz V/H, and 36.5 GHz V bright temperature data from five channels (https://doi.org/10.11888/Soil.tpdc.270948, accessed on 24 September 2021).
The soil data were derived from soil survey profiles obtained from the “Second Tibet Plateau Scientific Expedition and Research (STEP) program” and the “Land System Survey and Compilation of China’s Soil System Record Project”. The product adopted a predictive digital soil mapping paradigm and conducted soil formation analysis and spatial analysis using geographic information and remote sensing technologies. An adaptive depth function fitting method was developed, and an advanced ensemble machine learning method was integrated to generate a series of three-dimensional raster distribution maps for soil attributes including sand, silt, clay, soil texture, bulk density, and thickness of the soil body on the QTP (https://doi.org/10.11888/Terre.tpdc.272482, accessed on 6 June 2021) [35,36].
The vegetation dataset comprises a growing season Normalized Difference Vegetation Index (NDVI) and vegetation phenology dataset on the QTP spanning the last 20 years (2001–2020). It was obtained from the MODIS (MOD13A2) product at a spatial resolution of 1 km. The dataset provides the average NDVI for each year during the growing season (May–September) from 2001 to 2020, with a spatial resolution of 1 km and a temporal resolution of 1 year (https://doi.org/10.11888/Terre.tpdc.272838, accessed on 10 October 2022).

2.4. Methodology for Indicators

The Topographic Position Index (TPI), first proposed by Andrew Weiss at the ESRI International Users’ Workshop in 2001, is defined as follows [37]:
T P I = e i = 1 8 e i / 8
The TPI value of a point on the ground is calculated as the difference between the elevation value of that point and the average elevation of its surrounding points. TPI indicates the relative positioning of the point in relation to its neighboring points within the terrain.
The Topographic Wetness Index (TWI) serves as a physical indicator that reflects the influence of regional topography on runoff flow direction and accumulation [38,39]:
T W I = l n [ S C A   /   T a n ( s l o p e ) ]
In this equation, SCA represents the sink flow per unit area, and slope refers to the slope.
The Normalized Difference Vegetation Index (NDVI) quantifies vegetation by comparing the difference between near-infrared light (strongly reflected by vegetation) and red light (absorbed by vegetation). The formula is
N D V I = ( N I R R E D ) / ( N I R + R E D )
NIR stands for near-infrared light, while RED represents red light. A negative NDVI value suggests the presence of water, while a value close to +1 signifies the presence of dense green foliage. If the NDVI value is close to zero, it implies the absence of green leaves, likely indicating a desert environment.

2.5. Systematic Cluster Analyses

Systematic cluster analysis was used to characterize the commonalities in the high ice-content permafrost areas. Through this analysis, shared characteristics among high ice-content permafrost areas were identified. Cluster analysis, also referred to as point cluster analysis, is an unsupervised learning technique used for dividing a dataset into subsets, or clusters. In this process, objects within a cluster exhibit similarity to one another, while being dissimilar to objects in other clusters. The resulting set of clusters is collectively known as a clustering.
In this study, we analyzed a dataset that consisted of 400 high ice-content permafrost sites. These sites were evaluated based on 15 attribute variables, including temperature (such as air temperature, warming rate, ground temperature, and active layer thickness (ALT)), moisture (precipitation and soil moisture), geomorphology (elevation, slope aspect, slope, TPI, and TWI), soil (soil particle content, bulk density, and soil thickness), and vegetation (NDVI values).
There are two main measures of similarity: distance and similarity coefficient. Distance is commonly utilized to assess similarity between samples, while the similarity coefficient serves as a measurement for similarity between variables. To characterize the similarity of environmental features in high ice-content permafrost areas, the similarity coefficient was employed to classify the system. Cosine similarity was used to evaluate the similarity of two vectors by calculating the cosine of their angle [40]. It is calculated as:
c o s θ = k = 1 n x 1 k x 2 k k = 1 n x 1 k 2 k = 1 n x 2 k 2
The  c o s θ  ranges from −1 to 1. A higher cosine value indicates a smaller angle between the vectors, signifying greater similarity. Conversely, a lower cosine value suggests a larger angle and a lesser degree of similarity. The objective behind correcting cosine similarity is to surpass the limitation of considering only the similarity in the direction of vector dimensions, without accounting for differences in dimension measurements. To tackle this issue, we subtract the mean value of each dimension during the calculation of similarity.

3. Results

3.1. Temperature Characteristics

Permafrost formation due to the cold climate in geological history and demonstrates a strong correlation with air temperature. Therefore, our initial analysis focused on the connection between air temperature and the extent of the high ice-content permafrost area. Despite the strong spatial heterogeneity of air temperatures on the QTP, in terms of their average values, the mean annual air temperatures on the QTP where high ice-content permafrost exists range from −5 to −3.5 °C, with fluctuations of ±2 to 5 °C (Figure 3a). Due to continuous global warming on the QTP, air temperatures in regions with high ice-content permafrost have been steadily increasing. The air temperature distribution in the high ice-content permafrost regions across the QTP are undergoing changes. The difference in air temperature before and after 2000 and 2015 is substantial, reaching ±5 °C. In contrast, for periods such as 1995 to 2020, the temperature difference is only ±1 °C. This indicates that the warming trend of air temperature on high ice-content permafrost regions is heterogeneous and non-uniform. The calculated warming rates for high ice-content permafrost regions exceeded 0 °C/a, with some areas reaching as high as 0.3 °C/a. In contrast, the average warming rate for the entire QTP was 0.08 °C per year (Figure 3b).
Temperature fluctuations typically have a direct impact on permafrost ground temperatures and the active layer. Consequently, we utilized model-derived mean annual ground temperatures (MAGT) for permafrost during the period of 2005–2015 to investigate the correlation between ground temperatures and the active layer thickness (ALT) on the high ice-content permafrost areas. In total, 51% of MAGT in the high ice-content permafrost sites were below −1 °C, while 49% of these regions had MAGT ranging from −1 to 0 °C. Among the boreholes studied, 75% of the boreholes were located on either side of the road, and among this subset, only 45% had MAGT below −1 °C due to the impact of engineering structures. Consequently, the MAGT of permafrost with high ice-content in this study may be relatively higher (Figure 3c). Regarding the ALT, 90% of permafrost areas with high ice-content exhibit ALT below 3.5 m, while 74% of these areas have ALT ranging from 2 m to 3.5 m (Figure 3d). The ALT in permafrost regions with high ice-content were generally limited, as none of the available data indicated an active layer thickness exceeding 5 m.

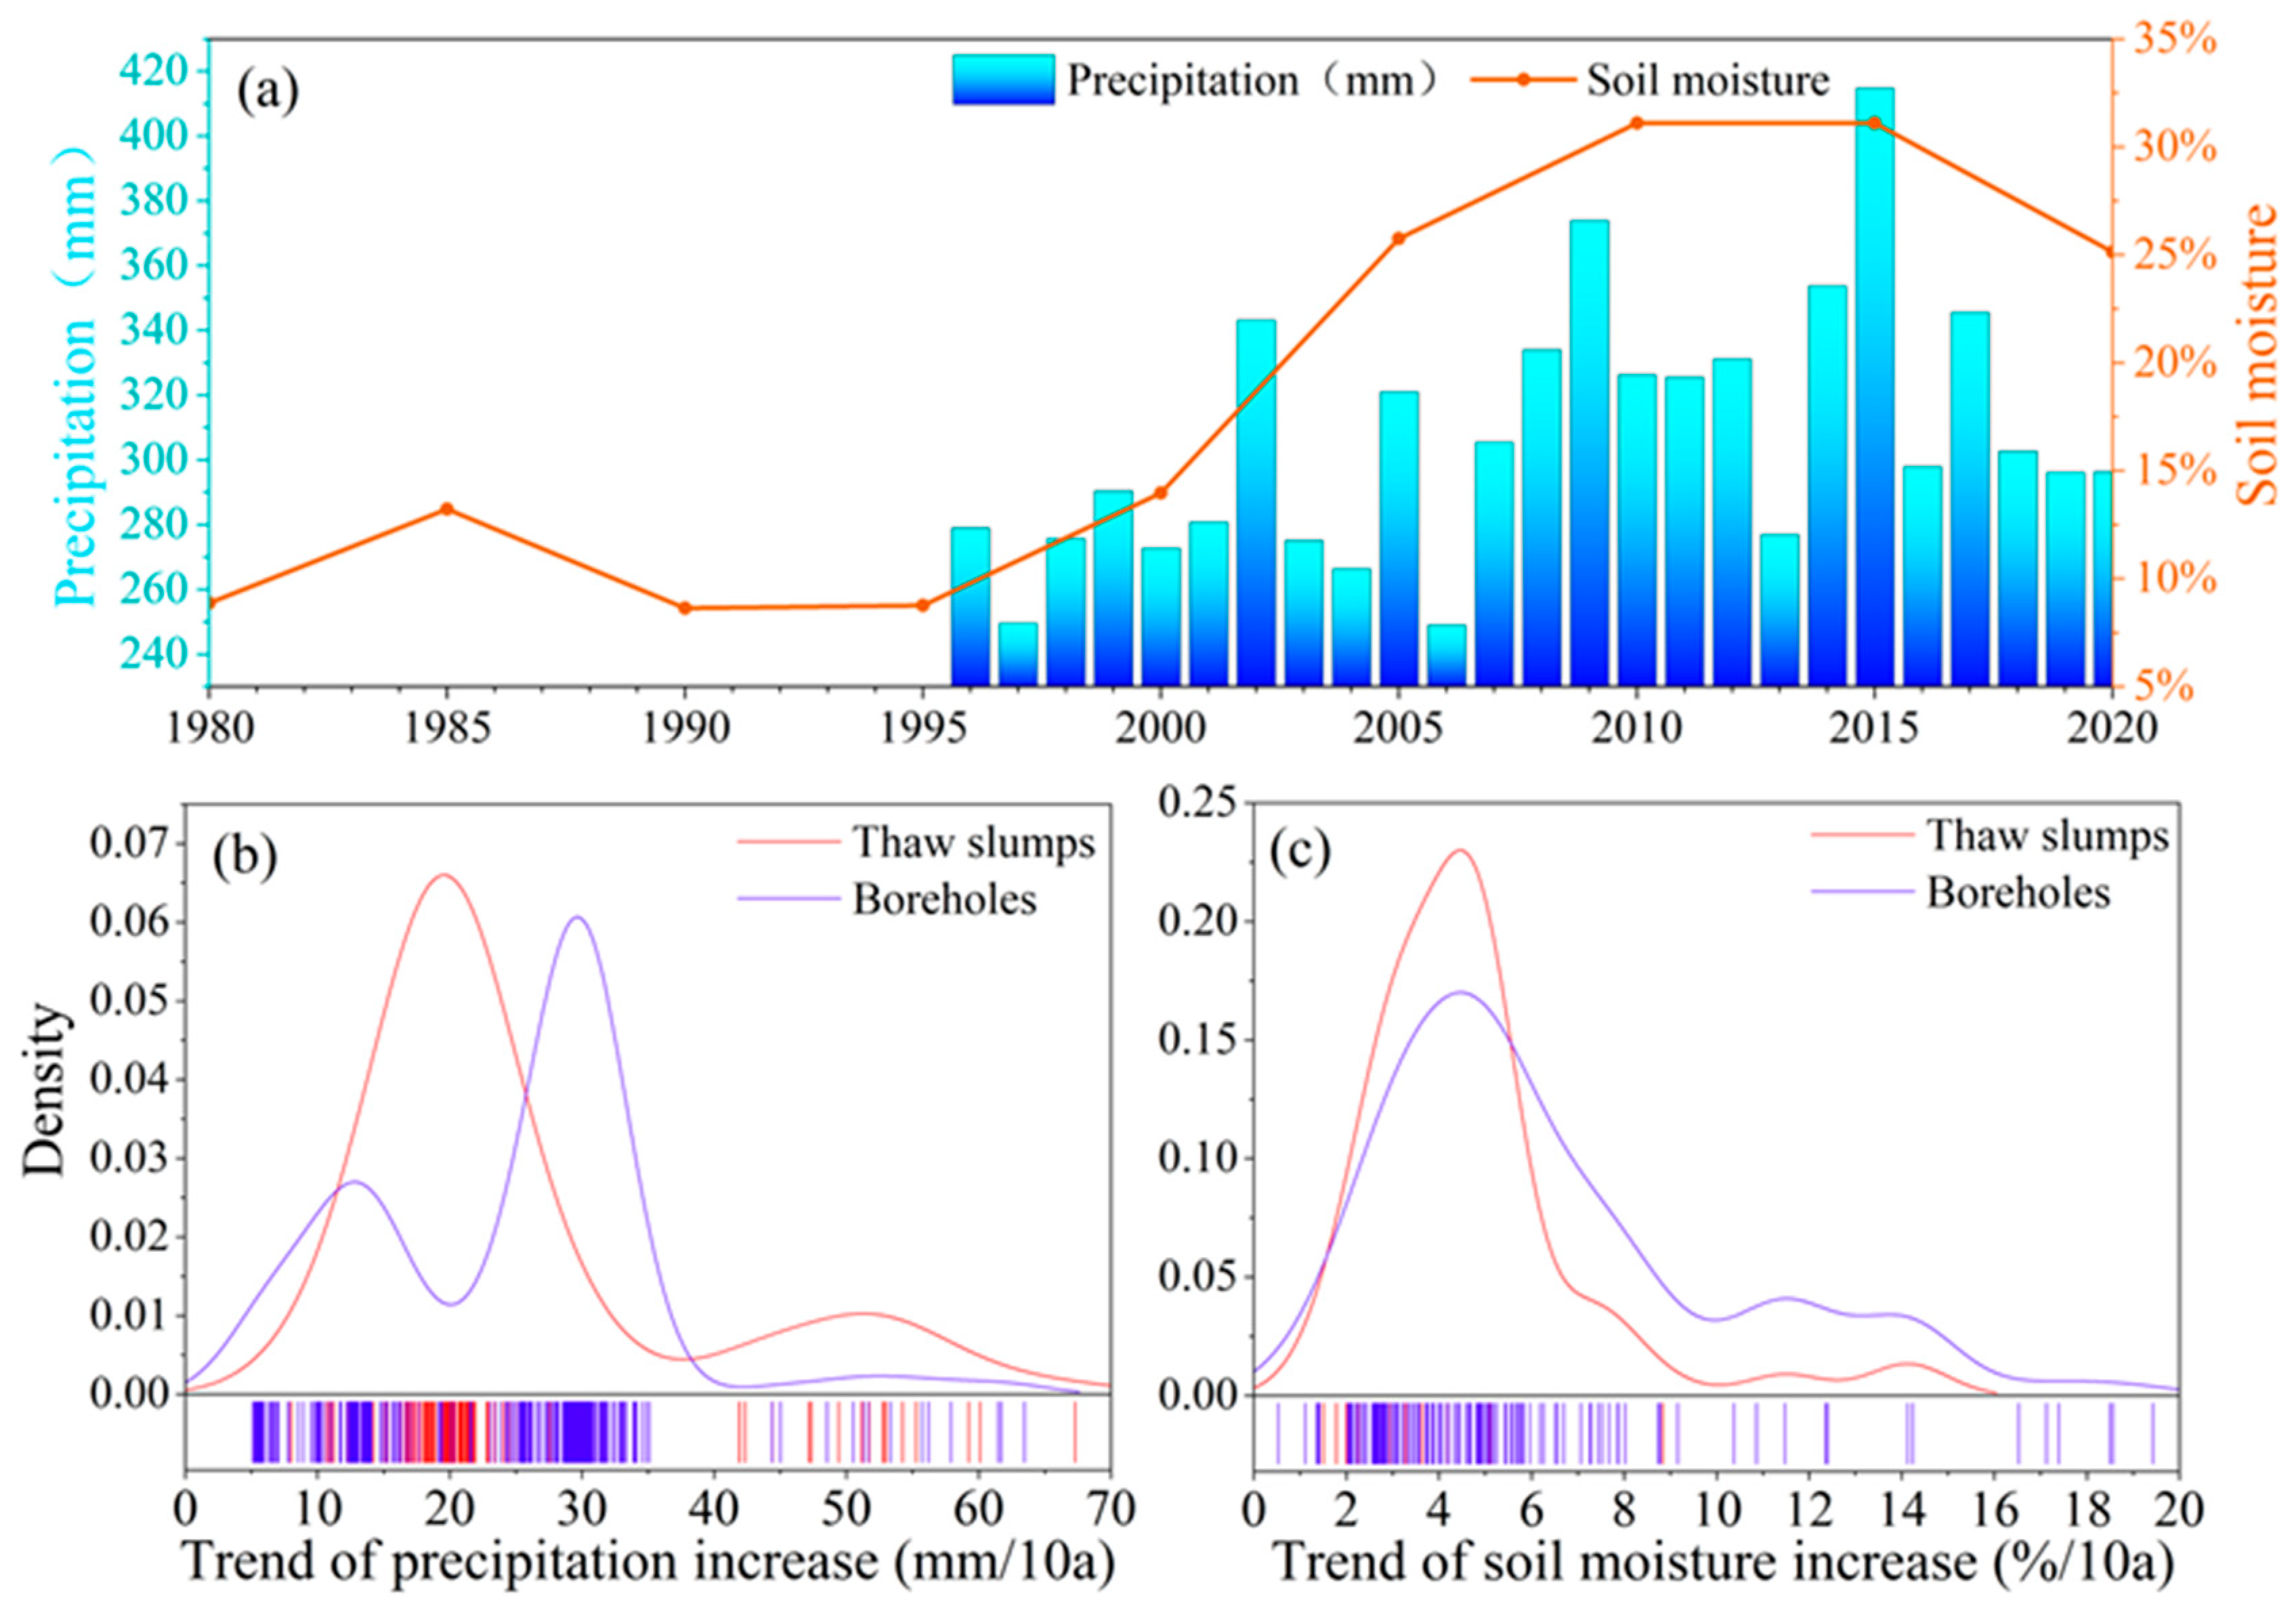
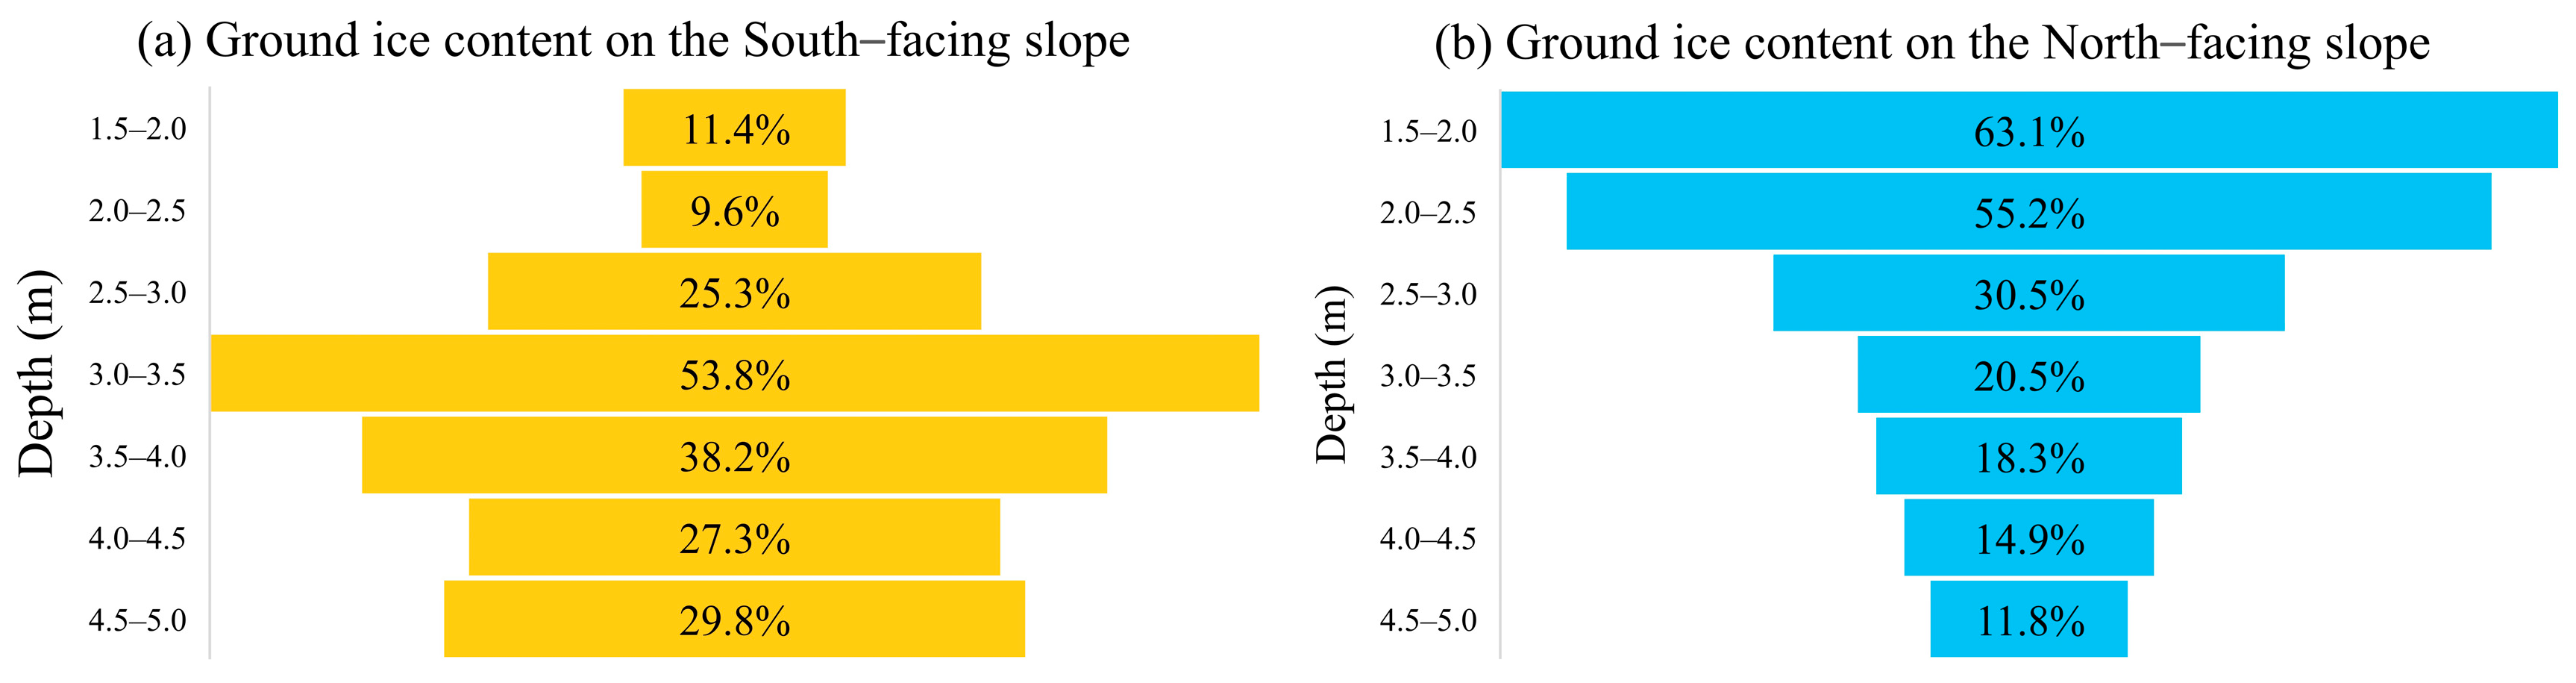
3.2. Moisture Characteristics

Moisture plays a crucial role in the formation of ground ice, with precipitation contributing to its melting and subsequent impact on soil moisture levels. Consequently, we quantified the variations in precipitation and soil moisture for the permafrost region characterized by high ice content. Precipitation in the high ice-content region exhibited fluctuations and experienced an overall increase from 1995 to 2020, with an average magnitude of approximately 25 mm/10a. Notably, the highest average precipitation of around 400 mm occurred in 2015. Concurrently, soil moisture levels also rose, with the average soil moisture in the high ice-content permafrost region peaking at 30% between 2010 and 2015 before declining to 25% by 2020 (Figure 4a). The moisture data suggest an increasing trend in wetness within the high ice-content permafrost region.
As precipitation significantly contributes to the occurrence of thaw slumps, we examined the characteristics of the high ice-content permafrost region using both boreholes and thaw slumps to understand the diverse wetting rates within this region. The thaw slumps region experienced a substantial peak in the rate of precipitation increase, amounting to approximately 25 mm/10a. In contrast, the borehole region displayed two peaks at 12 mm/decade and 30 mm/decade, respectively, highlighting the heterogeneous spatial distribution of precipitation (Figure 4b). Additionally, a smaller peak in the precipitation increase rate, measuring 50 mm/10a, was observed in select thaw slump areas, suggesting that heavy precipitation events contributed to the formation of these specific thaw slumps (Figure 4b). Regarding the increase in soil moisture, no notable disparity in the rate of increase was observed between the thaw slump areas and the borehole areas. Both regions exhibited rates of approximately 4% per decade, with similar contributions from the melting of ground ice (Figure 4c).

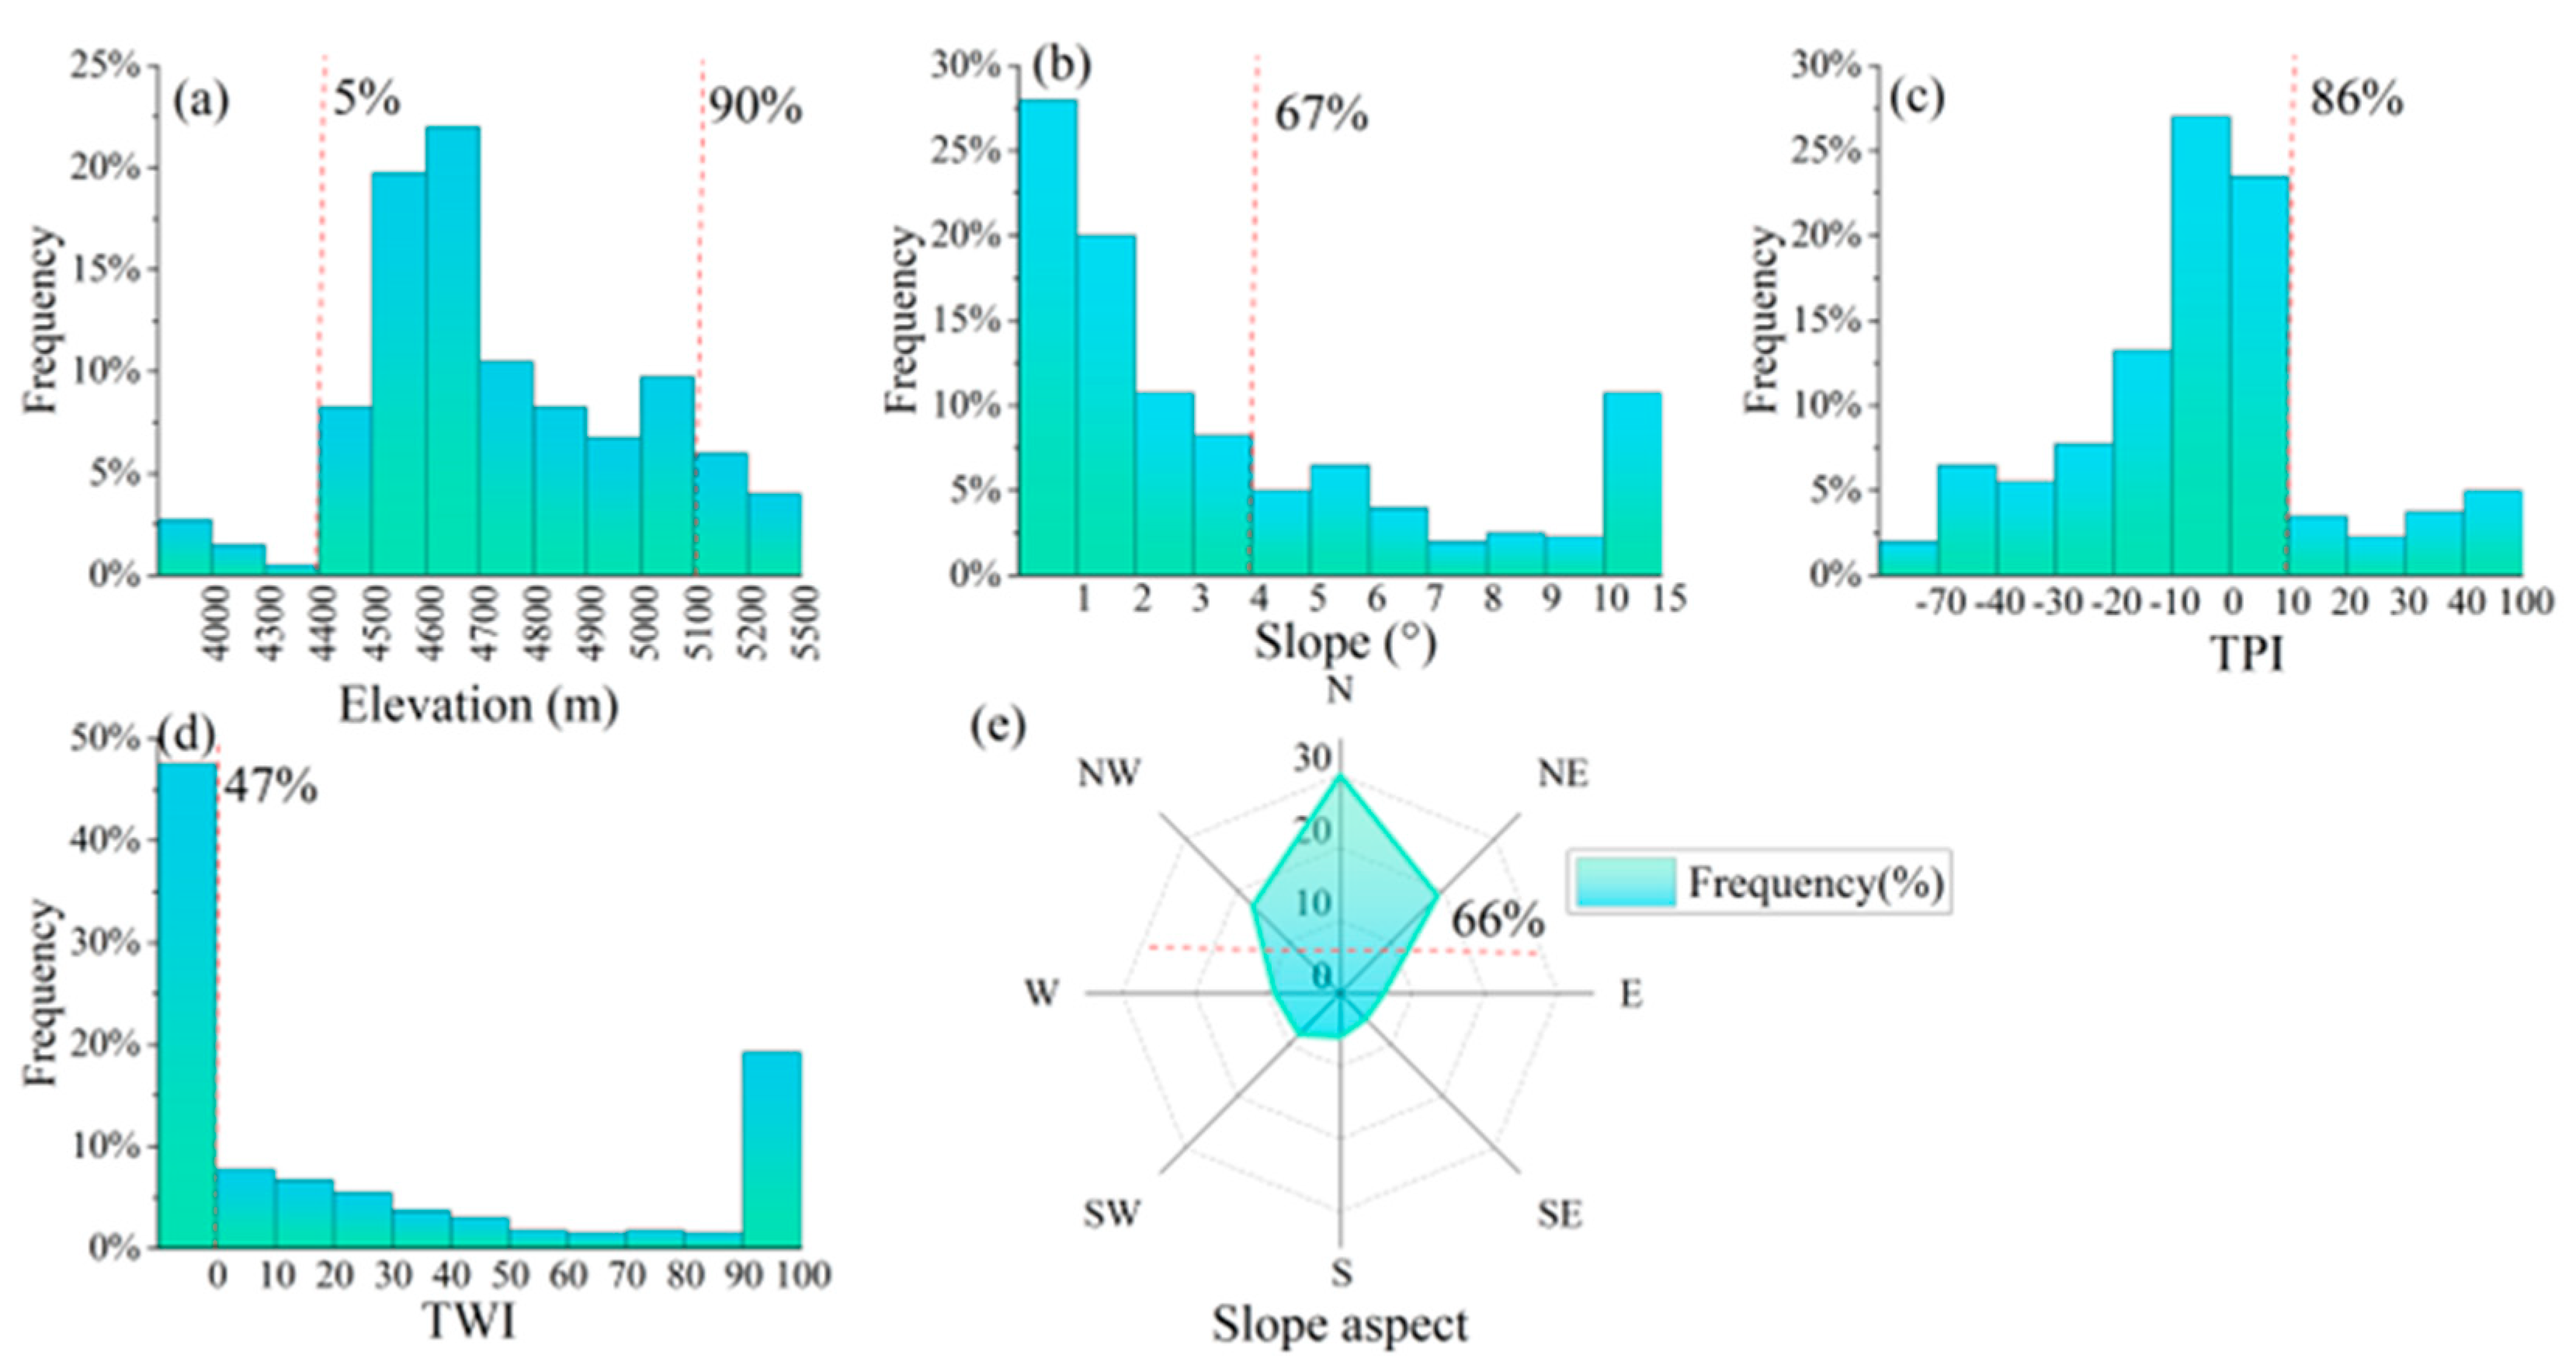
3.3. Geomorphological Feature

Geomorphological variations are initially manifested in terms of altitude, wherein temperatures and vegetation density gradually decline with increasing elevation. Consequently, permafrost forms as temperature decreases with altitude. The Qilian area exhibits the lowest altitude for the occurrence of high ice-content permafrost, approximately 3800 m, while the highest altitude of around 5400 m is found in the West Kunlun and Tanggula areas. Within the QTP, approximately 85% of the high ice-content permafrost is concentrated at altitudes ranging from 4400 to 5100 m (Figure 5a).
The QTP comprises a complex network of mountain systems, featuring mountain ranges, gorges, and valleys as fundamental geomorphological components. Slopes play a crucial role in facilitating gravitational erosion and sediment transport. However, excessively steep slopes impede water convergence and the formation of extensive ground ice layers. The QTP encompasses vast mountainous regions characterized by diverse terrain slopes, including extremely steep slopes exceeding 80° in certain high mountain areas. Detailed calculations reveal that 67% of the high ice-content permafrost forms on slopes shallower than 4°, while 90% is developed on slopes less than 10° (Figure 5b).
The Topographic Position Index (TPI) provides insights into the correlation between the study site and its adjacent landscape. To account for the resolution limitations, TPI values ranging from 0 to 10 were also designated as relatively flat lowland or plain regions. Approximately 86% of the high ice-content permafrost developed in low-lying or relatively flat regions (Figure 5c).
Lowland areas typically serve as water catchment zones, with the majority of high ice-content permafrost regions exhibiting water flow accumulation patterns reaching up to 100. Moreover, 53% of the areas with high ice-content permafrost exhibit positive values for the Topographic Wetness Index (TWI), indicating favorable wetness conditions. Additionally, the regions characterized by substantial high ice-content development demonstrate high TWI values, implying that increased moisture fosters optimal conditions for ground ice formation (Figure 5d).
Within permafrost regions, where mountain ranges predominantly extend in an east-west direction, variations in slope aspect significantly influence the solar radiation, subsequently impacting surface temperatures, water evapotranspiration, and the depth of ground ice. Our study involved calculations to determine the distribution of high ice-content permafrost on slopes, thereby elucidating the spatial patterns of ground ice occurrence within permafrost areas. The slope aspects were categorized into eight 45° sectors, commencing from 0° in the northern direction and progressing clockwise to 360° in geographical terms. For instance, the north slope direction spanned 0–22.5° and 337.5−360°, while the northeast slope aspect encompassed 22.5−67.5°, and so forth. Among the surveyed sites with high ice-content permafrost, approximately 66% of the high ice content is concentrated in shady slope areas characterized by northeastern, northern, and northwestern orientations (Figure 5e).

3.4. Soil Characteristics

Soil plays a crucial role in determining thermal conductivity, which in turn influences the formation of ground ice. This subsection examines the impact of the topsoil, including the calculation of the proportion of clay, silt, and sand particles, the soil layer thickness, and the average bulk density in the high ice-content permafrost top soil layer. The clay content in areas of high ice-content permafrost consistently remains below 25%, reaching a minimum of 2%. Silt content displays significant variability, ranging from 12% to 60%, with a mean value of 32% (Figure 6a). It is evident that the soil texture exhibits considerable variation, with a predominant proportion of sand particles exceeding 60%. Clay particles show less variation among soil layers, whereas silt and sand particles display greater variability.
The thickness of the topsoil layer ranged from a minimum of 40 cm to a maximum of 100 cm. The majority of soil layers fall within the 80–90 cm range, indicating the typically thin nature of topsoil in regions with high ice-content permafrost. Soil bulk density in high ice-content permafrost regions typically ranges from 1300 to 1450 kg/m3, with an average value of 1365 kg/m3. By integrating the derived thermograms of soil bulk density and soil layer thickness, it was determined that high ice-content permafrost is characterized by a soil bulk density of 1400 ± 50 kg/m3 and a soil layer thickness of 85 ± 5 cm (Figure 6b). Soil bulk density and thickness exhibit a central distribution pattern.

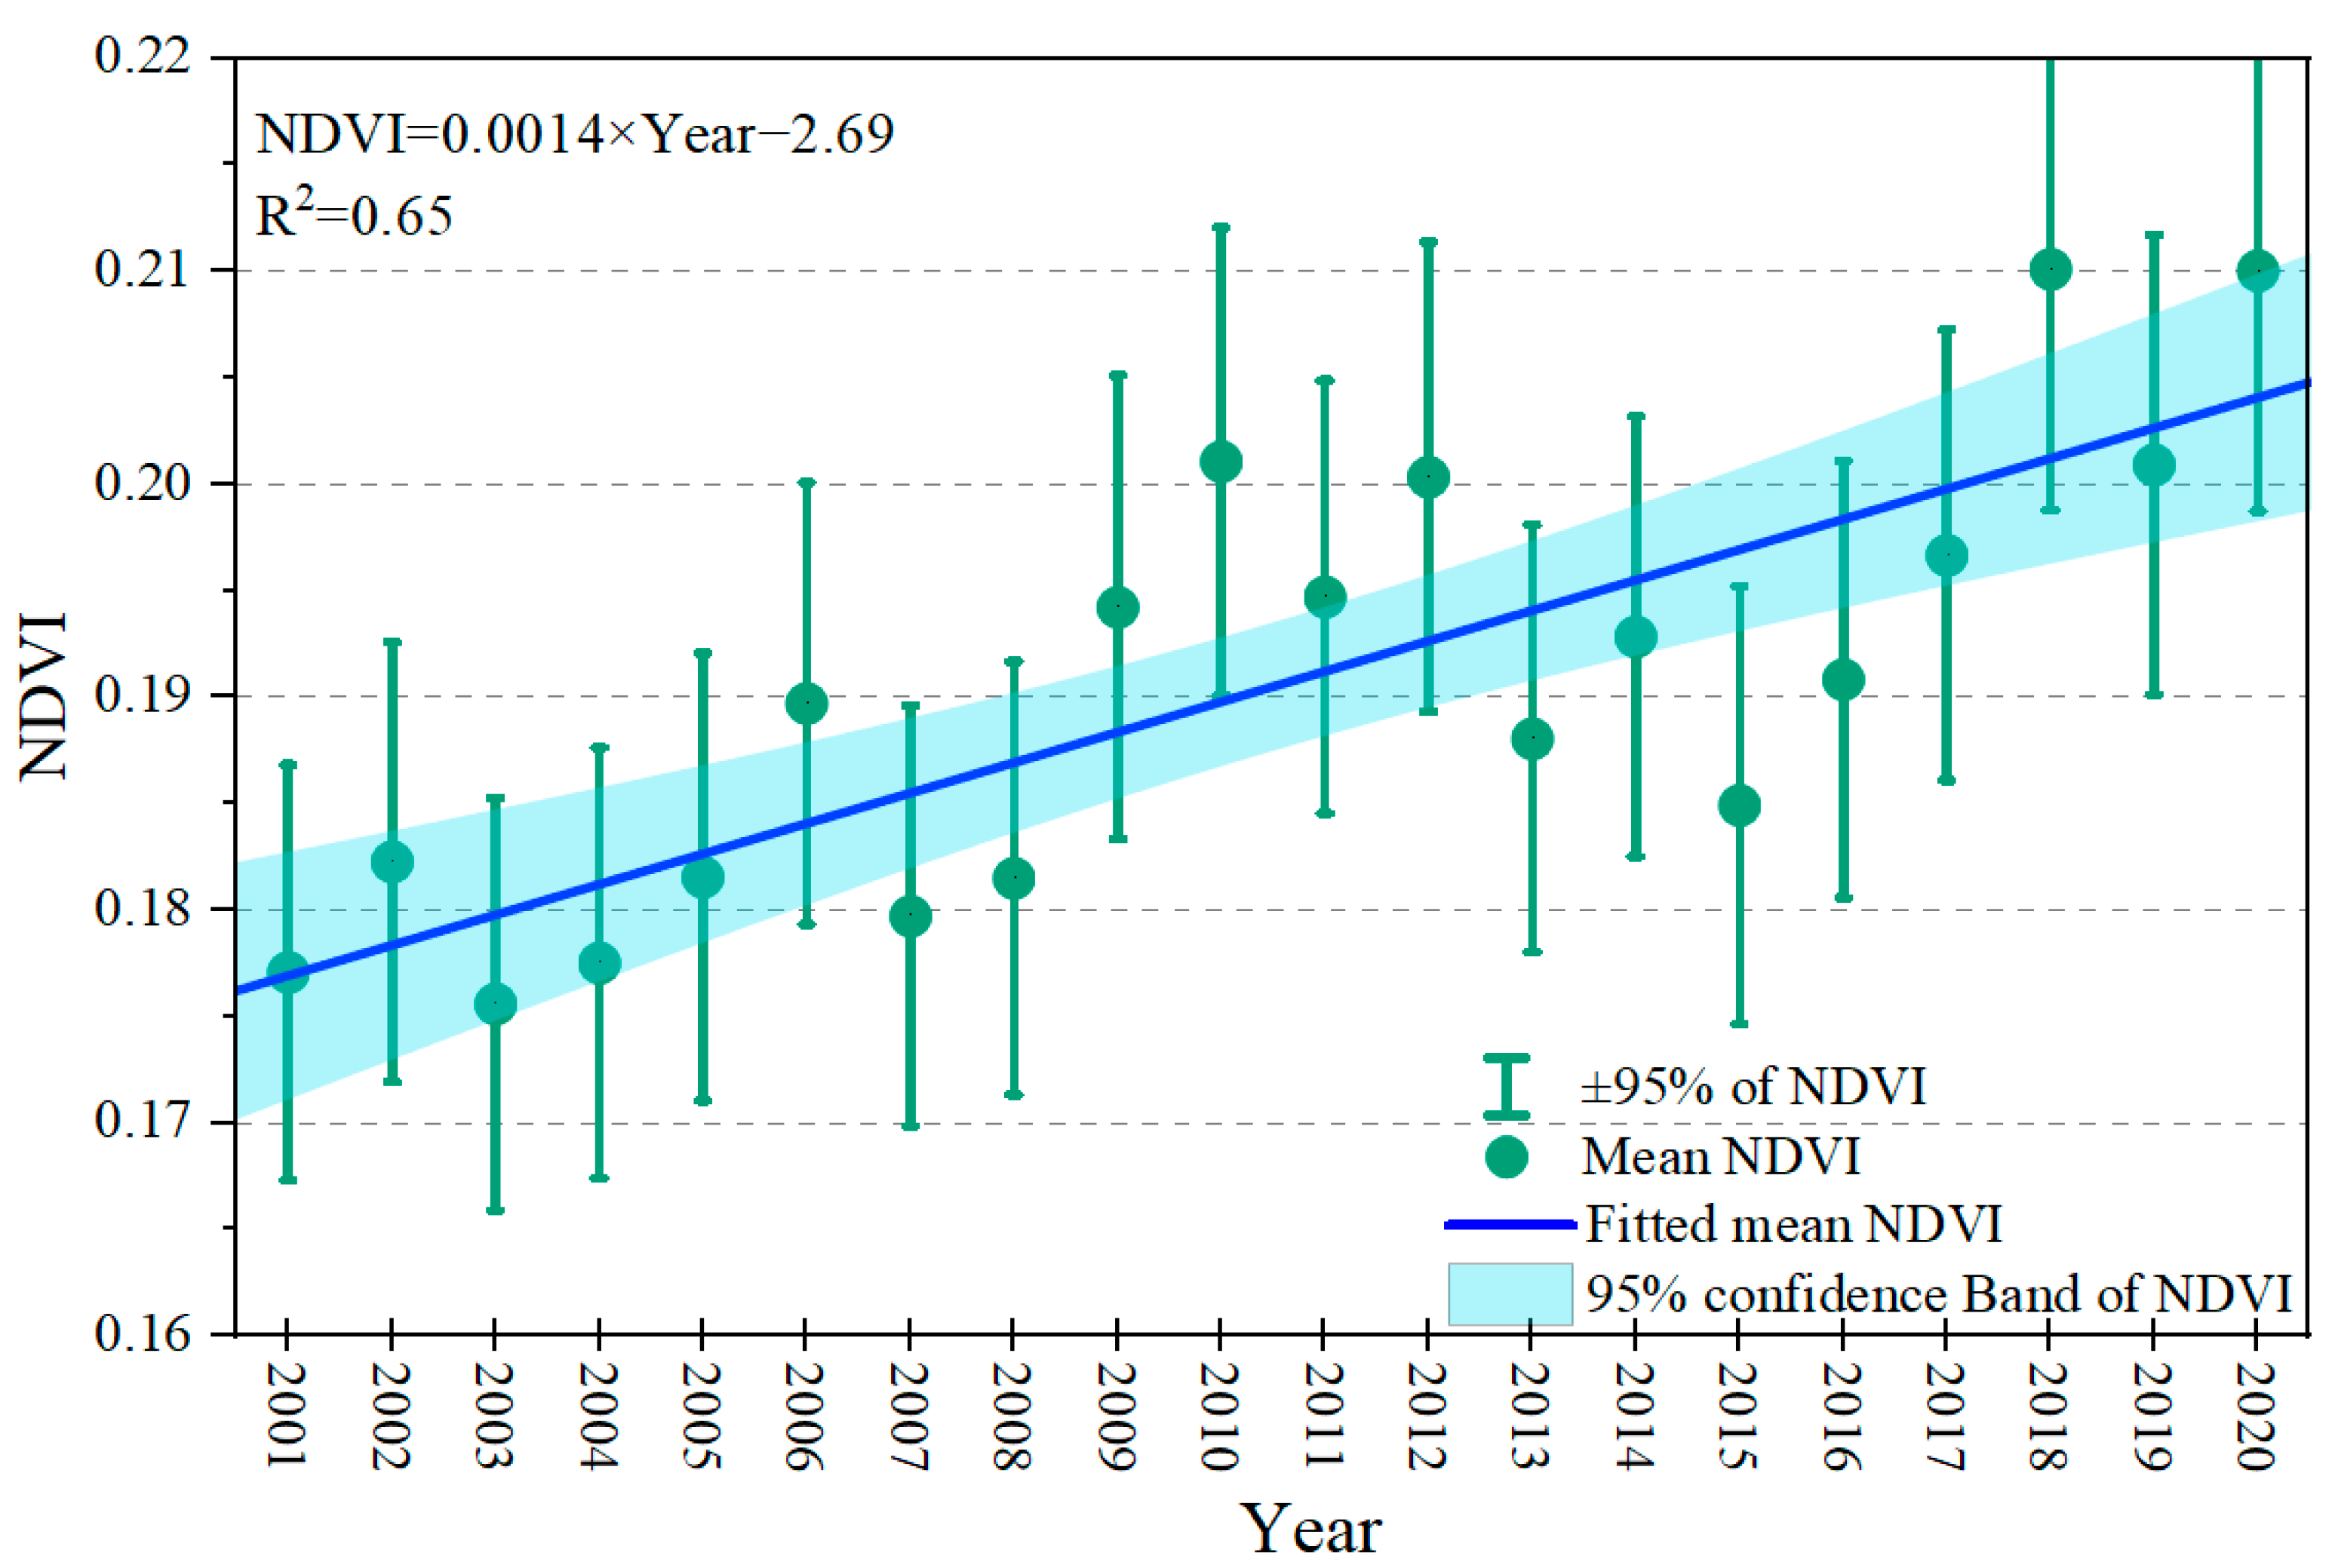
3.5. Regional Vegetation Changes

In permafrost regions, the growing of vegetation primarily occurs during the warm season. The average NDVI (Normalized Difference Vegetation Index) values for the growing season (May–September) on the QTP over the past two decades (2001–2020) were used to investigate the relationship between vegetation growth and high ice-content permafrost. In high ice-content permafrost area, the average NDVI was 0.175 in 2000 and 0.21 in 2020. The highest recorded NDVI value was 0.60 (observed in the east-central part of the QTP in 2018), indicating the presence of lush meadow vegetation. With warmer and wetter conditions on the QTP, the NDVI exhibits continuous fluctuations with an annual growth rate of 0.0014 per year (Figure 7). In general, vegetation within high ice-content regions showed growth and expansion. Furthermore, the entire plateau experienced an increasing trend in NDVI within the high ice-content regions due to climate change. The precise contribution of melted high-content ground ice to vegetation growth remains uncertain.

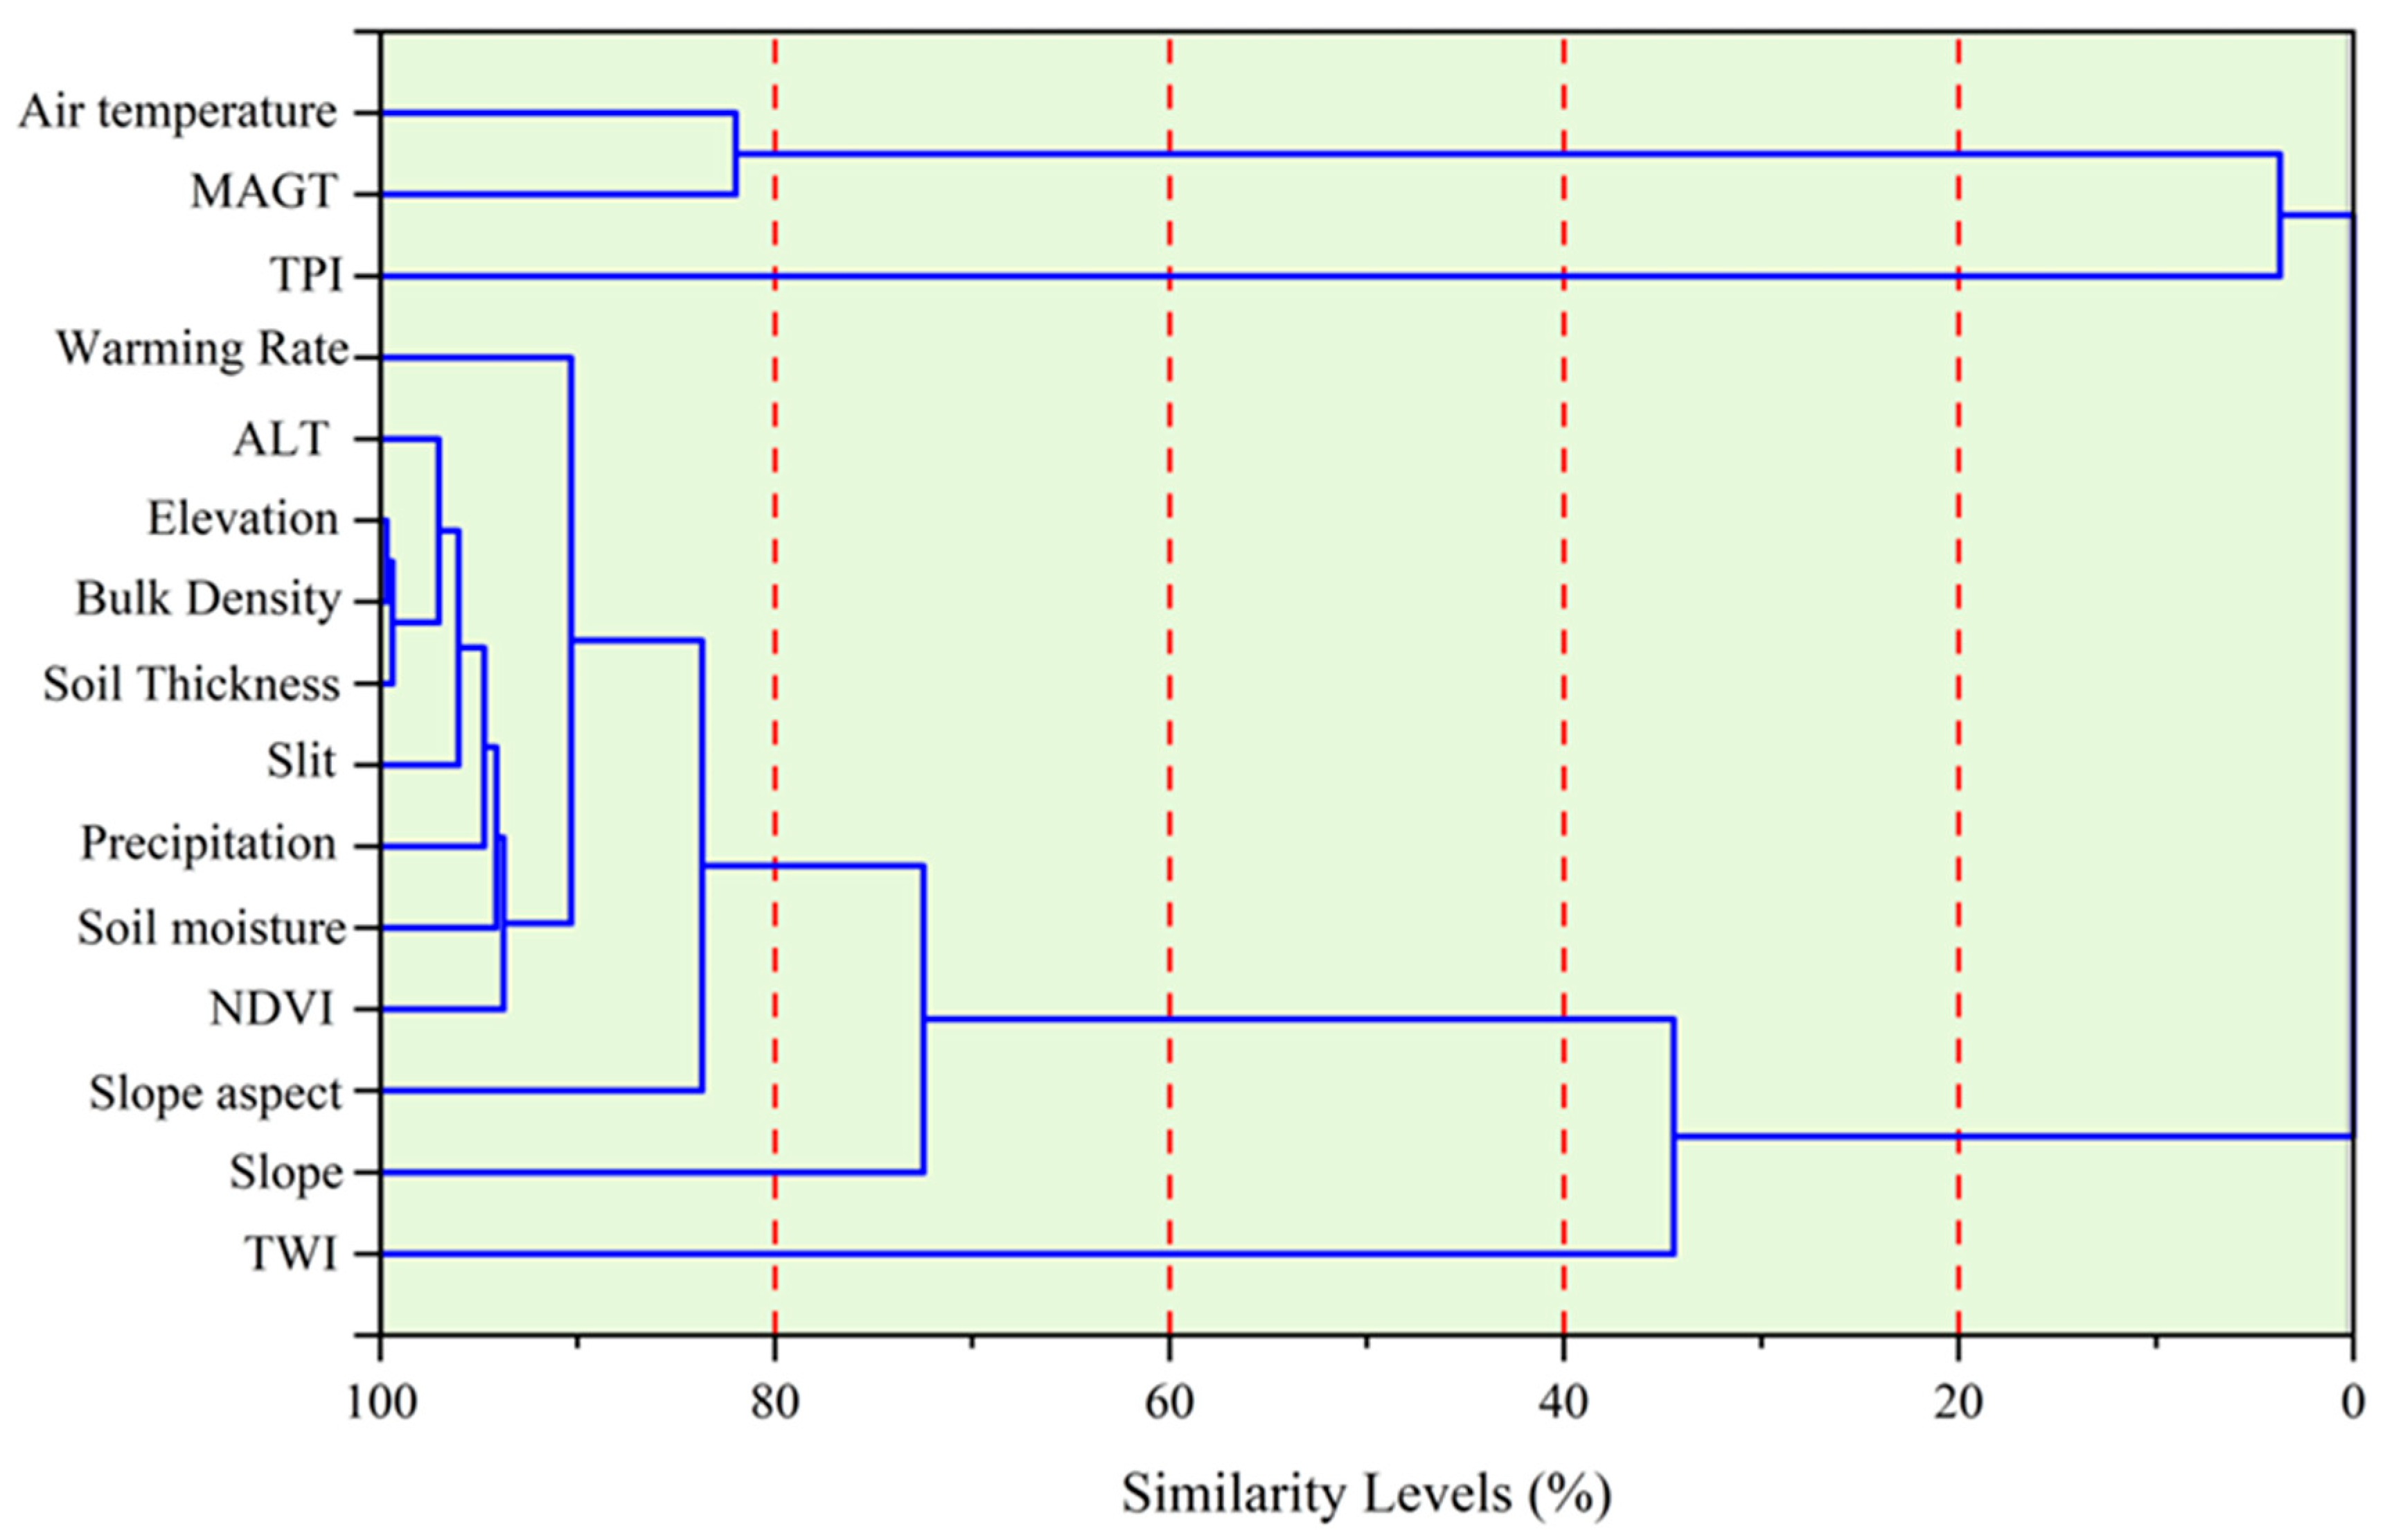
3.6. Environmental Commonalities

Previous analyses indicated significant environmental variations in high ice-content permafrost regions. Therefore, it is important to identify common environmental characteristics of high ice-content permafrost distribution that can serve as a foundation for future ground ice modeling. In this section, cluster analysis was utilized to evaluate 15 attributes of 400 high ice-content permafrost sites across the plateau, aiming to explore their interrelationships. The results revealed that elevation, bulk density, and soil thickness exhibited the highest similarity among the 400 high ice-content permafrost sites, whereas active layer thickness, soil properties, precipitation, and soil moisture displayed relatively lower similarities. Notably, the environmental attributes that exhibited similarity levels exceeding 90% included warming rate, active layer thickness, elevation, bulk density, soil thickness, soil content, precipitation, soil moisture, and NDVI (Figure 8). On the other hand, indicators such as air temperature, MAGT, and slope aspect demonstrated similarities ranging from less than 90% to more than 80%, while slope (76%), TWI (37%), and TPI (2%) exhibited substantial environmental disparities, reflecting significant environmental variability. The relatively low similarity between TWI and TPI can be attributed to variations in geomorphological settings, where there was a scarcity of data for topographic lows and catchments.

4. Discussion

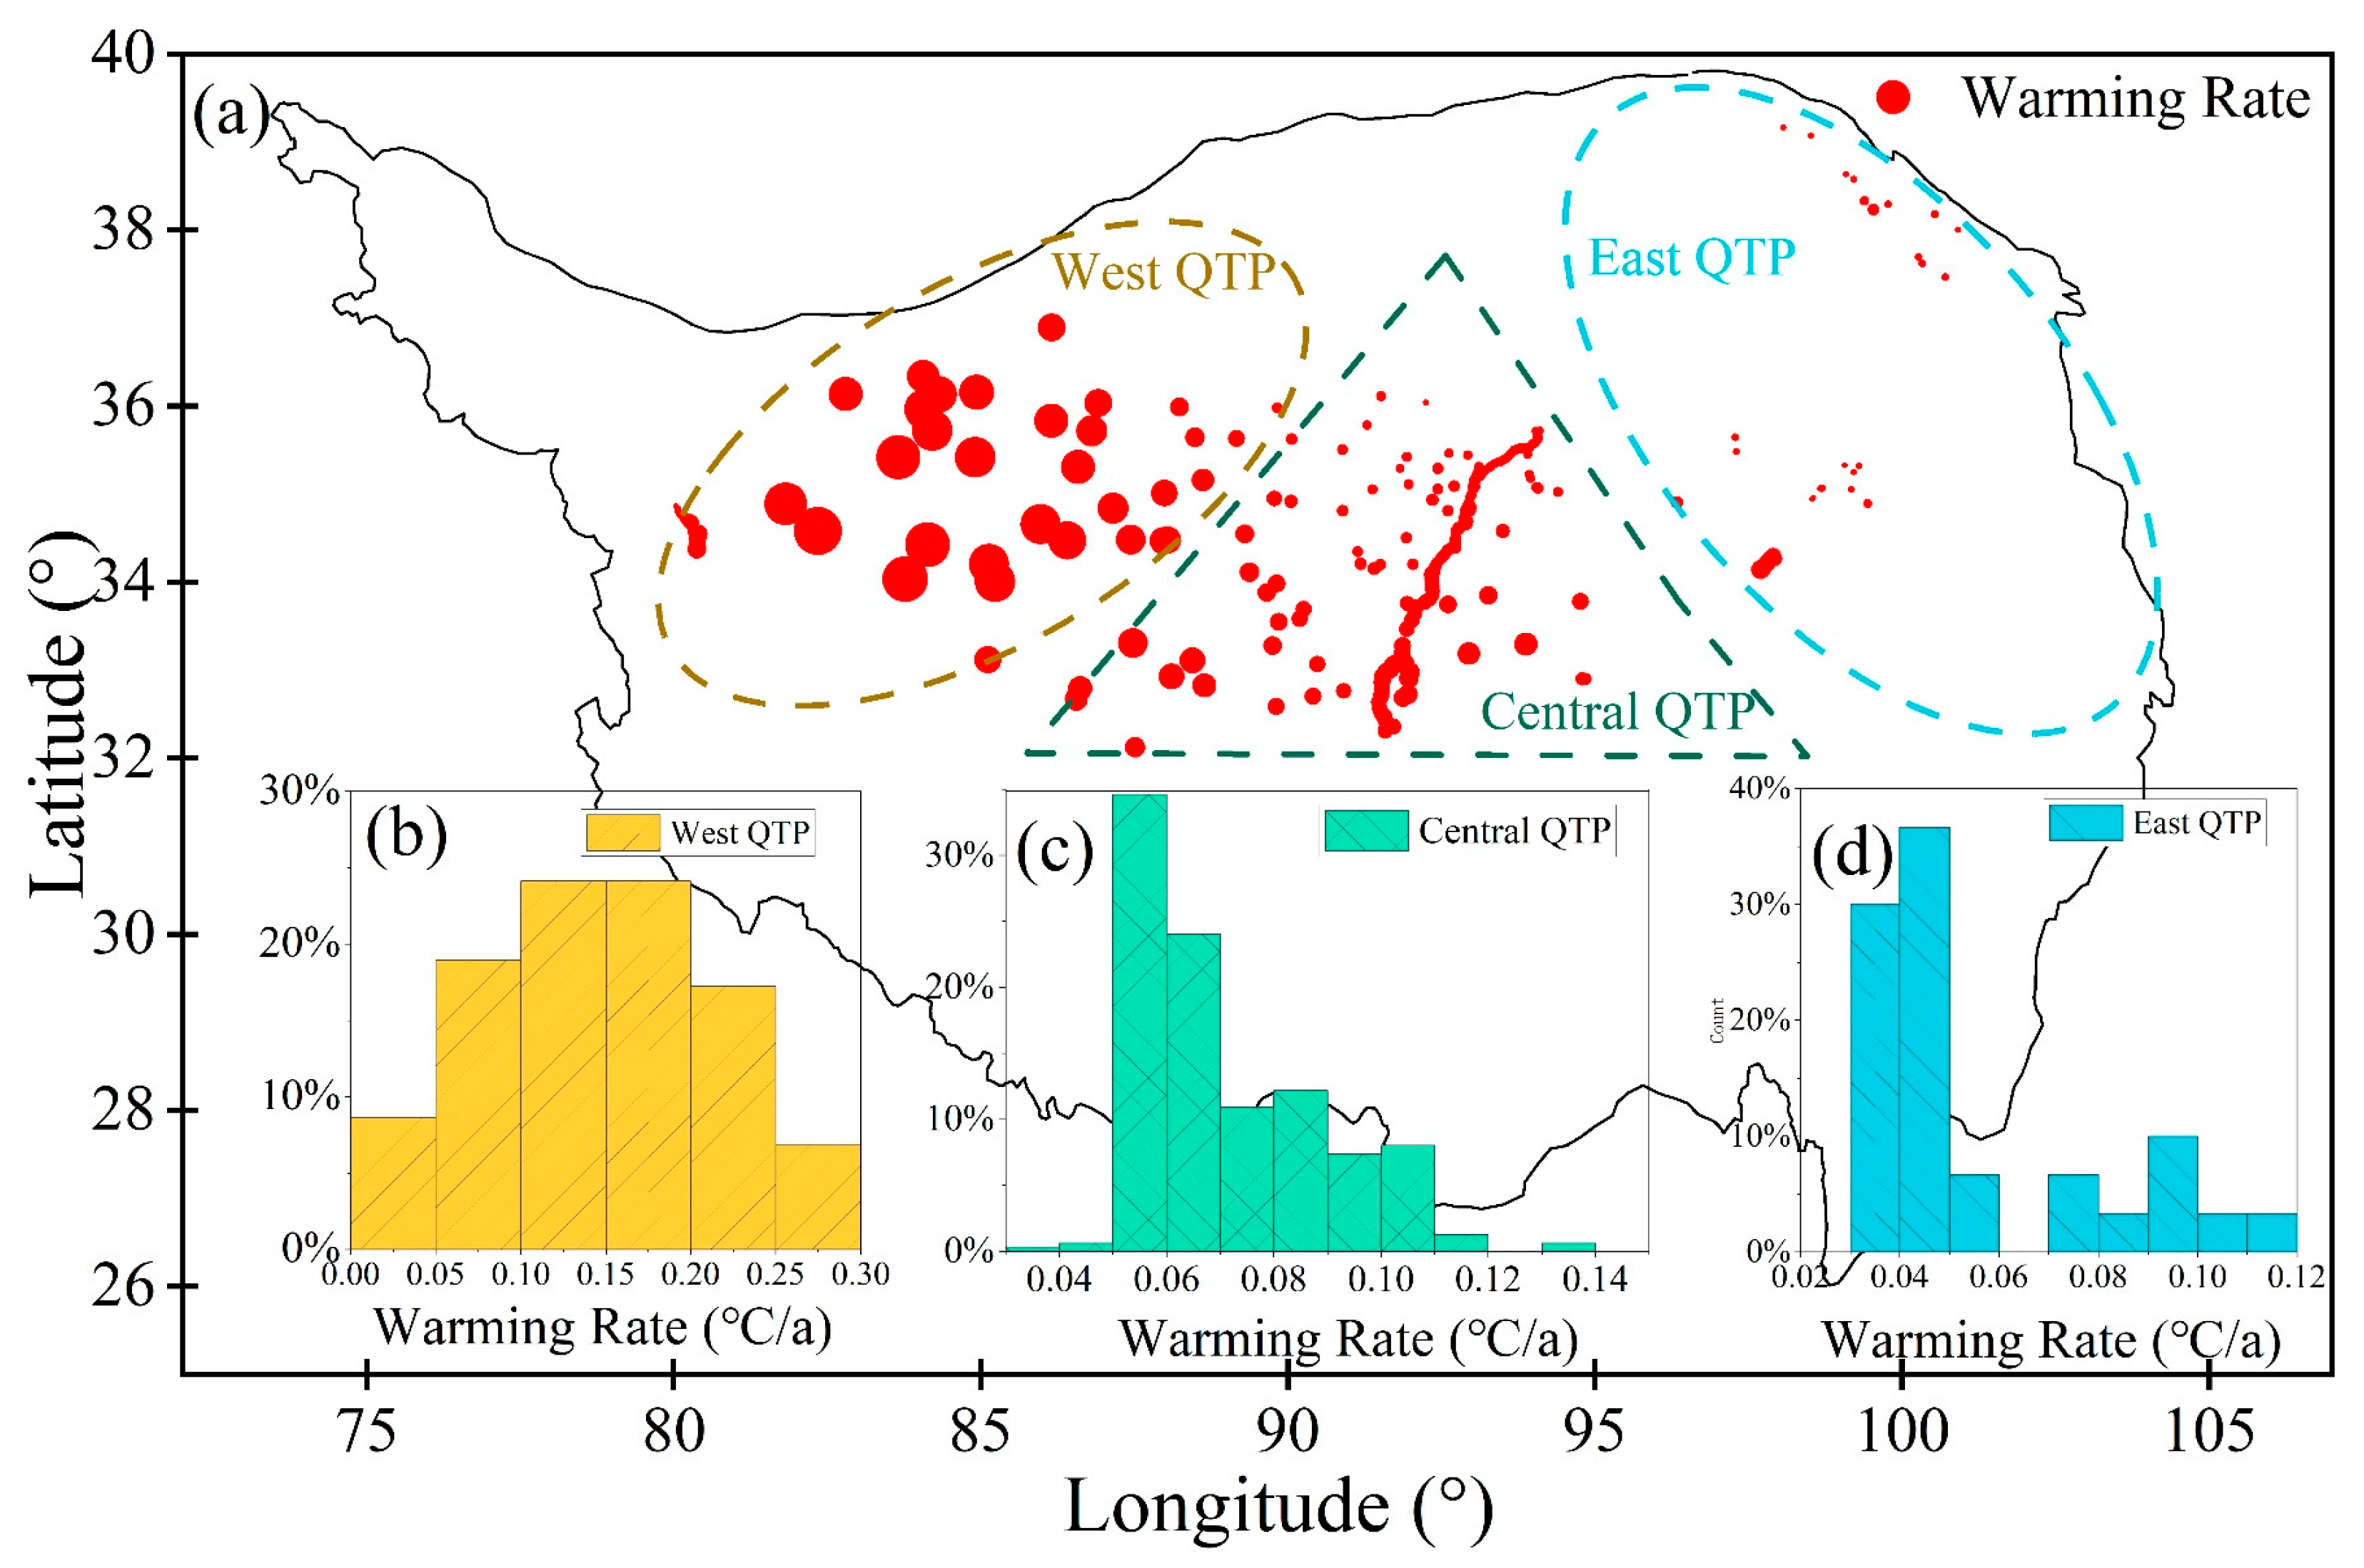
4.1. Higher Warming and Wetting Trends in High Ice-Content Permafrost Regions

The IPCC’s Sixth Assessment Report showed that by the end of this century, the global average surface temperature is expected to rise by 0.3 °C to 4.8 °C compared to the average temperature of 1986–2005 [41,42]. If greenhouse gas emissions remain high, the warming is expected to be even greater. Despite the alternation between warm and cold periods, when using the global average surface temperature at the beginning of the Industrial Revolution as a reference, the current global annual average temperature is approximately 0.8 °C higher (up to 1.3 °C) [43]. Over the past 50 years, the overall temperature on the QTP has shown a significant warming trend, with an average increase of 0.36 °C/10a, much higher than the average warming rate in China (0.28 °C/10a) and globally (0.12 °C/10a). Certain high-altitude on the QTP and Arctic regions have experienced a warming rate that is more than twice the global average [44,45]. The QTP has undergone a period of warming and humidification, particularly evident in permafrost areas with high ice content. From 1996 to 2020, the average air temperature has increased by approximately 1.5 °C, with an annual increase trend of 0.80 °C/10a, indicating a significant temperature rise. Additionally, there is an increasing trend of approximately 15 mm/10a in precipitation and a 4%/10a change in soil moisture, which will have a significant impact on the permafrost environment.
The QTP is known as the “Asian Water Tower” and the “Third Pole,” with the largest high-altitude permafrost area [46]. Due to its unique topography and strong non-adiabatic heating characteristics, the QTP acts as a “trigger” and “amplifier” of global climate change [45,47,48]. Under the amplification effect of plateau warming, combined with altitude-dependent warming [49,50], the QTP experienced a warming trend of 0.21 °C/10a during the period from 1980 to 1997, and the warming trend has accelerated since then (0.25 °C/10a) [51]. The western part of the high ice-content permafrost regions on the QTP exhibits a more pronounced warming trend, where 90% of the warming rate is greater than 0.25 °C/10a (Figure 9b), indicating a higher risk of thermal thawing in this area. The warming also exhibits a high degree of spatial heterogeneity. In the central part, 65% of the study sites have a warming rate higher than the plateau’s average warming rate (Figure 9c). In the eastern part of the plateau, 35% of the high ice-content permafrost area has a warming rate higher than the plateau’s average warming rate (0.25 °C/10a). It is also important to note that 49% of the high ice-content permafrost area has MAGT between −1 °C and 0 °C, indicating unstable permafrost. If the temperature continues to warm, extensive melting of the ground ice will occur, which will have further significant impacts on the permafrost environment.

4.2. The Combined Effects of Environmental Factors Affecting High Ice-Content Permafrost

The primary influencing factor of permafrost distribution is climate, while local variations in permafrost conditions are determined by various other factors, such as ecology (vegetation), water bodies, drainage (hydrology), and soil properties [52,53]. The presence of permafrost depends on the thermal balance of the soil [54], and therefore, the MAGT of high ice-content permafrost is below 0 °C (Figure 3c). In the continuous permafrost zone on the QTP, the lower boundary of high ice-content permafrost increases in elevation from north (at an altitude of 4267 m) to south (at an altitude of 4901 m). Generally, the lower boundary of permafrost on the plateau is about 800–1100 m below the snow line, with mean annual air temperature ranging from −2.5 °C to 3.6 °C [7,55]. The mean annual air temperature of high ice-content permafrost was −2.33 °C at its northern limit and −1.04 °C at its southern limit.
Regional topographic effects can also influence permafrost characteristics, and permafrost conditions may vary with changes in elevation, slope, and aspect [56]. Microtopography can also affect local variations in permafrost distribution and related terrain attributes [57,58]. According to Ishikawa’s observations in Mongolia, permafrost develops more often on northern slopes, while southern slopes and flat grasslands have rare permafrost development [59]. As for high ice-content permafrost, it is mostly found on the shady slopes (northeast, north, and northwest) of the mountainous terrain, accounting for 66% of the total distribution (Figure 5e). In Gushan, the Beiluhe Basin on the central QTP, ground ice at the top of the permafrost layer has degraded on the sunny slope but continues to accumulate on the shady slope [60]. Additionally, near the upper limit of permafrost, the ground ice content is much lower on the sunny slope compared to the shady slope, which reflects the influence of the slope aspect on solar radiation and reflection intensity, resulting in differences in the near-surface ice distribution (Figure 10).
Vegetation is also an important influencing factor. The transition from dense to sparse vegetation can lead to rapid increases in surface temperature and permafrost degradation [25], thereby affecting the development of high ice-content permafrost. Soil texture also has some influence on the formation of ground ice, especially the proportion of silt and clay particles, which regulate the soil’s sensitivity to freezing and thawing [60].
In summary, the development of high ice-content permafrost is the result of multiple interacting factors and exhibits strong local coupling.

4.3. Indicators of High Ice-Content Permafrost Distribution

Based on the clustering results (Figure 8), it is evident that air temperature and mean annual ground temperature (MAGT) belong to one cluster, while variables such as elevation, bulk density, and soil layer thickness belong to another cluster. Air temperature and MAGT determine the existence of permafrost, and the clustering results indicate that there is no significant similarity between air temperature and ground temperature across all QTP study sites, suggesting that their influence on the development of high ice-content permafrost may be limited. Topography, including slope and elevation, affects the climate environment and provides favorable conditions for the occurrence of abundant ground ice. Variables such as bulk density, soil layer thickness, and soil moisture show higher similarity in areas with high ice content, indicating their association with the presence of high ice-content permafrost (Figure 11). Vegetation tends to develop well in areas with sufficient soil moisture and higher percentages of fine particles (silt and clay); it can serve as an indicator of significant permafrost presence under similar low-temperature conditions.
In the Arctic region, researchers believe that the ground ice content is positively correlated to the silt content [14,15,16] because silt has the highest hydraulic conductivity below 0 °C [61], making it more sensitive to freeze–thaw cycles than clay or sandy soil. The results of this study show that there is little variation in the clay content in the soil layers, while the silt and sand contents vary significantly. Therefore, the clay content may serve as an important indicator of the presence of ground ice. Field investigations have shown that most of the thaw slumping surface soils are dominated by sand and silt particles, but near the ground ice, clay dominates (Figure 12a). Drilling investigations conducted in the swam meadow (SM) (Figure 12b) and alpine meadow (AM) (Figure 12c) in the central QTP, along with the analysis of the correlation between the clay content and the ground ice content (volumetric ice content), also indicate a strong correlation between the clay content and the ground ice content (with SM R2 = 0.64; AM R2 = 0.53) (Figure 12d). Therefore, the clay content can indicate the distribution of high-altitude permafrost with a high ice content, which may differ from that of permafrost in high-latitude regions.

4.4. High Ice-Content Areas Will Experience Significant Environmental Changes

Continued warming has led to an increase in the ground temperature of permafrost. By 2100, the average temperature of permafrost on the QTP will increase by 0.8 °C (SSP2-4.5), 2.0 °C (SSP3-7.0), and 2.6 °C (SSP5-8.5) [62,63]. Continued warming will also cause a significant reduction in the area of permafrost [64,65]. Lu et al. [66] predicted that by 2100, the depth of permafrost in the shallow layer on the QTP will decrease by 22–64% (under RCP2.6 and RCP8.5 scenarios), while Zhang et al. [63] predicted a decrease in the area of shallow-layer permafrost by 44% (under SSP2-4.5 scenario), 59% (under SSP3-7.0 scenario), and 71% (under SSP5-8.5 scenario). The warming climate will trigger thermokarst processes, resulting in significant impacts on infrastructure [67,68], food security [69,70], and public health [71,72,73] in permafrost regions. In this study, the high ice-content permafrost areas experienced higher rates of warming, which will further accelerate the melting of ground ice, leading to environmental changes in the high ice-content areas.
Continued warming will lead to significant melting of ground ice in high ice-content permafrost regions. Thus, in turn, it will give rise to a series of thermokarst phenomena such as thermokarst lakes (Figure 13a), thaw slumping (Figure 13b,c), thermokarst channels (Figure 13d), and thermokarst caves (Figure 13e). As the high ice-content permafrost beneath roadbeds melts, it will cause the formation of large cracks, resulting in road damage (Figure 13f). Ran et al. [2] simulated the losses caused by permafrost changes on the QTP and estimated that, under the SSP2-4.5 scenario, by 2050, approximately 38% of roads, 39% of railways, 39% of power lines, and 21% of buildings would be situated in high-risk areas. This would lead to significant financial losses amounting to approximately 6.31 billion dollars.

5. Conclusions

This study collected data from 300 boreholes with high ice-content permafrost and 100 thaw slumps across the entire QTP to examine the factors influencing the distribution of high ice-content permafrost. Large-scale remote sensing data and products were utilized, and 15 environmental characteristic attributes of 400 high ice-content permafrost sites were extracted. Analyzing the dominant attributes of high ice-content permafrost led to the following conclusions: The analysis reveals that regions with high ice-content permafrost experience mean annual air temperatures ranging from −5 to −3.5 °C, with a warming rate of 0.08 °C/a. The warming trend in the high ice-content permafrost shows heterogeneity and non-uniformity. In total, 51% of high ice-content permafrost sites have MAGT below −1 °C, and 49% have MAGT ranging from −1 to 0 °C. And, 75% of high ice-content permafrost areas having ALT below 3.5 m. From 1995 to 2020, precipitation in high ice-content permafrost areas increased by approximately 25 mm/10a, peaking at 400 mm in 2015, while soil moisture increased by approximately 4%/10a peaked at 30% between 2010 and 2015. About 85% of high ice-content permafrost develops at altitudes ranging from 4400 to 5100 m, and approximately 86% of high ice-content permafrost is found in lower or relatively flat areas, with a preference for shady and gentle slopes. Clay content in the top soil of high ice-content permafrost is consistently below 25%, while the silt content ranges from 12% to 60%. The topsoil of high ice-content permafrost is characterized by a soil bulk density of 1400 ± 50 kg/m³ and a soil layer thickness of 85 ± 5 cm. Vegetation within high ice content regions with the average NDVI increased from 0.175 in 2000 to 0.21 in 2020, with an increase in NDVI of 0.0014 per year. The main indicators that show high similarity in high ice-content permafrost areas include warming rate, active layer thickness, altitude, bulk density, soil layer thickness, silt content, precipitation, soil moisture, and NDVI. The presence of high ice-content permafrost is attributed to the combined effects of multiple factors, and these areas will experience significant environmental changes in the future. This study provides a basis for understanding the environmental changes in high ice-content permafrost regions and for simulating the distribution of ground ice. It also highlights the urgent need for more attention on high ice-content permafrost regions.

Author Contributions

Conceptualization, X.F.; Data curation, Y.W., X.W., Z.D. and W.P.; Funding acquisition, Z.L.; Investigation, X.F., W.L. and X.W.; Methodology, X.F., W.L. and Z.D.; Project administration, F.N. and Z.L.; Supervision, F.N.; Writing—original draft, X.F.; Writing—review and editing, Y.W. and Z.L. All authors have read and agreed to the published version of the manuscript.

Funding

This research was funded by the Gansu Province Science and Technology Major Special Projects (Grant No. 22ZD6FA004), the Second Tibet Plateau Scientific Expedition and Research (STEP) program (Grant No. 2019QZKK0905).

Data Availability Statement

The data presented in this study are available on reasonable request from the corresponding author. The data are not publicly available due to the further research of ground ice modeling, and the entire data will be made public upon completion of the research.

Acknowledgments

Air temperature: Peng, S. (2019). 1 km monthly mean temperature dataset for china (1901–2022). National Tibetan Plateau Data Center. https://doi.org/10.11888/Meteoro.tpdc.270961, accessed on 31 May 2023. Precipitation: Peng, S. (2020). 1-km monthly precipitation dataset for China (1901–2022). A Big Earth Data Platform for Three Poles. https://doi.org/10.5281/zenodo.3185722, accessed on 31 May 2023. Permafrost: Ni, J., Wu, T. (2021). Simulation data of active layer thickness and ground temperature of permafrost in Qinghai Tibet Plateau (2000–2015, 2061–2080). A Big Earth Data Platform for Three Poles. https://doi.org/10.17632/hbptbpyw75.1, accessed on 24 October 2022. Soil Moisture: Chai, L., Zhu, Z., Liu, S. (2020). Land Surface Soil Moisture Dataset of SMAP Time-Expanded Daily 0.25° × 0.25° over Qinghai-Tibet Plateau Area (SMsmapTE, V1). National Tibetan Plateau Data Center. https://doi.org/10.11888/Soil.tpdc.270948, accessed on 24 September 2021. NDVI: Wang, T., Yang, D. (2022). Dataset for vegetation greenness and phenology during 2001–2020 in the Tibetan Plateau. National Tibetan Plateau Data Center. https://doi.org/10.11888/Terre.tpdc.272838 accessed on 10 October 2022. https://cstr.cn, accessed on 10 October 2022. DEM: National Geospatial Data Cloud (NGDC), http://www.gscloud.cn/, accessed on 18 November 2021. Soil: Liu, F., Zhang, G. (2022). Dataset of digital soil mapping products for the Qinghai-Tibet Plateau (2015–2024). National Tibetan Plateau Data Center. https://doi.org/10.11888/Terre.tpdc.272482, accessed on 6 June 2021. The authors are appreciative of all the above sources for providing valuable datasets. We also would like to thank the editor, the anonymous reviewers who provided insightful suggestions.

Conflicts of Interest

The authors declare no conflict of interest.

References

  1. Zhang, T.; Barry, R.; Knowles, K.; Ling, F.; Armstrong, R. Statistics and characteristics of permafrost and ground-ice distribution in the northern hemisphere. Polar Geogr. 2008, 31, 47–68. [Google Scholar] [CrossRef]
  2. Ran, Y.; Cheng, G.; Dong, Y.; Jin, H.; Yang, J. Permafrost degradation increases risk and large future costs of infrastructure on the Third Pole. Nat. Commun. Earth Environ. 2022, 3, 238. [Google Scholar] [CrossRef]
  3. Qiu, J. China: The third pole. Nature 2008, 454, 393–396. [Google Scholar] [CrossRef] [PubMed]
  4. Yao, T.; Bolch, T.; Chen, D.; Duan, K.; Fang, X.; Su, F.; Thompson, L.; Wada, Y.; Wang, L.; Wang, T.; et al. The imbalance of the Asian Water Tower. Nat. Rev. Earth Environ. 2022, 3, 289–304. [Google Scholar] [CrossRef]
  5. Wang, T.; Yang, D.; Yang, Y.; Piao, S.; Li, X.; Cheng, G.; Fu, B. Permafrost thawing puts the frozen carbon at risk over the Tibetan Plateau. Sci. Adv. 2020, 6, eaaz3513. [Google Scholar] [CrossRef]
  6. Chen, L.; Liang, J.; Qin, S.; Yu, W.; Wei, X.; Wang, G. Determinants of carbon release from the active layer and permafrost deposits on the Tibetan Plateau. Nat. Commun. 2016, 7, 13046. [Google Scholar] [CrossRef]
  7. Cheng, G.; Zhao, L.; Li, R.; Wu, T. Characteristics, changes and impacts of permafrost on the Qinghai-Tibet Plateau. Chin. Sci. Bull. 2019, 64, 2783–2795. [Google Scholar]
  8. Ma, W.; Niu, F.; Mu, Y. Fundamental researches for major permafrost engineering on Qinghai-Tibet Plateau. Adv. Earth Sci. 2012, 27, 1185–1191. [Google Scholar]
  9. Chen, L.; Yu, W.B.; Han, F.L.; Lu, Y.; Zhang, T.Q. Effects of desertification on permafrost environment in Qinghai-Tibetan Plateau. J. Environ. Manag. 2020, 262, 110302. [Google Scholar] [CrossRef] [PubMed]
  10. Grosse, G.; Goetz, S.; McGuire, A.D.; Romanovsky, V.E.; Schuur, E.A.G. Changing permafrost in a warming world and feedbacks to the Earth system. Environ. Res. Lett. 2016, 11, 040201. [Google Scholar] [CrossRef]
  11. Immerzeel, W.W.; Lutz, A.F.; Andrade, M.; Bahl, A.; Biemans, H.; Bolch, T.; Hyde, S.; Brumby, S.; Davies, B.J.; Elmore, A.C.; et al. Importance and vulnerability of the world’s water towers. Nature 2020, 577, 364–369. [Google Scholar] [CrossRef]
  12. Schuur, E.A.G.; McGuire, A.D.; Schädel, C.; Grosse, G.; Harden, J.W.; Hayes, D.J.; Hugelius, G.; Koven, C.D.; Kuhry, P.; Lawrence, D.M.; et al. Climate change and the permafrost carbon feedback. Nature 2015, 520, 171–179. [Google Scholar] [CrossRef] [PubMed]
  13. Wang, T.; Wang, X.; Liu, D.; Lv, G.; Ren, S.; Ding, J.; Chen, B.; Qu, J.; Wang, Y.; Piao, S.; et al. The current and future of terrestrial carbon balance over the Tibetan Plateau. Sci. China Earth Sci. 2023, 66, 595–608. [Google Scholar] [CrossRef]
  14. Kokelj, S.V.; Burn, C.R. Near-surface ground ice in sediments of the Mackenzie Delta, Northwest Territories, Canada. Permafr. Periglac. Process. 2005, 16, 291–303. [Google Scholar] [CrossRef]
  15. Morse, P.D.; Burn, C.R.; Kokelj, S.V. Near-surface ground-ice distribution, Kendall Island Bird Sanctuary, western Arctic coast, Canada. Permafr. Periglac. Process. 2009, 20, 155–171. [Google Scholar] [CrossRef]
  16. Mackay, J.R.; Burn, C.R. The first 20 years (1978–1979 to 1998–1999) of active-layer development, Illisarvik experimental drained lake site, western Arctic coast, Canada. Can. J. Earth Sci. 2002, 39, 1657–1674. [Google Scholar] [CrossRef]
  17. O’Neill, B. The Development of Near-Surface Ground Ice at Illisarvik, Richards Island, Northwest Territories. Ph.D. Thesis, Carleton University, Ottawa, ON, Canada, 2011. [Google Scholar]
  18. Burn, C.R.; Kokelj, S.V. The environment and permafrost of the Mackenzie Delta area. Permafr. Periglac. Process. 2010, 20, 83–105. [Google Scholar] [CrossRef]
  19. Cheng, G.; Zhao, L. The influence of local factors on the distribution of permafrost and its implications for the design of the Qinghai-Tibet Railway. Sci. China Ser. D-Earth Sci. 2003, 33, 602–607. (In Chinese) [Google Scholar]
  20. Zhao, L.; Ding, Y.; Liu, G.; Wei, L.; Guo, T.; Wang, Z. Estimation and assessment of underground ice reserves in the permafrost of the Qinghai-Tibet Plateau. J. Glaciol. Geocryol. 2010, 32, 1–9. (In Chinese) [Google Scholar]
  21. Wang, W.; Wu, T.; Chen, Y.; Li, R.; Xie, C.; Qiao, Y.; Zhu, X.; Hao, J.; Ni, J. Spatial variations and controlling factors of ground ice isotopes in permafrost areas of the central Qinghai-Tibet Plateau. Sci. Total Environ. 2019, 688, 542–554. [Google Scholar] [CrossRef]
  22. Yang, Y.; Wu, Q.; Hou, Y.; Zhang, Z.; Zhan, J.; Gao, S.; Jin, H. Unraveling of permafrost hydrological variabilities on Central Qinghai-Tibet Plateau using stable isotopic technique. Sci. Total Environ. 2017, 605–606, 199–210. [Google Scholar] [CrossRef] [PubMed]
  23. Yang, Y.; Wu, Q.; Jiang, G.; Zhang, P. Stable Isotopic Stratification and Growth Patterns of Ground Ice in Permafrost on the Qinghai-Tibet Plateau, China. Permafr. Periglac. Process. 2017, 28, 119–129. [Google Scholar]
  24. Yang, Y.; Wu, Q.; Yun, H. Stable isotope variations in the ground ice of Beiluhe Basin on the Qinghai-Tibet Plateau. Quat. Int. 2013, 313–314, 85–91. [Google Scholar]
  25. Lin, Z.; Gao, Z.; Fan, X.; Niu, F.; Luo, J.; Yin, G.; Liu, M. Factors controlling near surface ground-ice characteristics in a region of warm permafrost, Beiluhe Basin, Qinghai-Tibet Plateau. Geoderma 2020, 376, 114540. [Google Scholar] [CrossRef]
  26. Fan, X.; Lin, Z.; Gao, Z.; Meng, X.; Niu, F.; Luo, J.; Yin, G.; Zhou, F.; Lan, A. Investigation into cryostructures and ground ice content in ice-rich permafrost area of the Qinghai-Tibet Plateau with CT scanning. J. Mountain Sci. 2021, 18, 1028–1221. [Google Scholar] [CrossRef]
  27. Li, X.; Jin, X.; Wang, X.; Jin, H.; Zhang, S. Investigation of permafrost engineering geological environment with electrical resistivity tomography: A case study along the china-russia crude oil pipelines. Eng. Geol. 2021, 291, 106237. [Google Scholar] [CrossRef]
  28. Nelson, F.E.; Anisimov, O.A.; Shiklomanov, N.I. Climate change and hazard zonation in the circum-arctic permafrost regions. Nat. Hazards 2002, 26, 203–225. [Google Scholar] [CrossRef]
  29. Chadburn, S.E.; Burke, E.J.; Cox, P.M.; Friedlingstein, P.; Hugelius, G.; Westermann, S. An observation-based constraint on permafrost loss as a function of global warming. Nat. Clim. Chang. 2017, 7, 340–344. [Google Scholar] [CrossRef]
  30. Trochim, E.D.; Schnabel, W.E.; Kanevskiy, M.; Munk, J.; Shur, Y. Geophysical and cryostratigraphic investigations for road design in northern Alaska. Cold Reg. Sci. Technol. 2016, 131, 24–38. [Google Scholar] [CrossRef]
  31. Lacelle, D.; Fisher, D.A.; Verret, M.; Pollard, W. Improved prediction of the vertical distribution of ground ice in Arctic-Antarctic permafrost sediments. Commun. Earth Environ. 2022, 3, 31. [Google Scholar] [CrossRef]
  32. Murton, J.B. Ground ice and cryostratigraphy. In Treatise on Geomorphology; Shroder, J., Giardino, R., Harbor, J., Eds.; Academic Press: San Diego, CA, USA, 2013; Volume 8, pp. 173–201. [Google Scholar]
  33. Kokelj, S.V.; Lantz, T.C.; Tunnicliffe, J.; Segal, R.; Lacelle, D. Climate-driven thaw of permafrost preserved glacial landscapes, northwestern Canada. Geology 2017, 45, 371–374. [Google Scholar] [CrossRef]
  34. Luo, J.; Niu, F.; Lin, Z.; Liu, M.; Yin, G. Recent acceleration of thaw slumping in permafrost terrain of Qinghai-Tibet Plateau: An example from the Beiluhe Region. Geomorphology 2019, 341, 79–85. [Google Scholar] [CrossRef]
  35. Liu, F.; Wu, H.; Zhao, Y.; Li, D.; Yang, J.-L.; Song, X.; Shi, Z.; Zhu, A.-X.; Zhang, G.-L. Mapping high resolution National Soil Information Grids of China. Sci. Bull. 2022, 67, 328–340. [Google Scholar] [CrossRef] [PubMed]
  36. Liu, F.; Zhang, G.L.; Song, X.D.; Li, D.C.; Zhao, Y.G.; Yang, J.L.; Wu, H.Y.; Yang, F. High-resolution and three-dimensional mapping of soil texture of China. Geoderma 2020, 361, 114061. [Google Scholar] [CrossRef]
  37. Weiss, A. Topographic position and Landforms Analysis. Poster presentation. In Proceedings of the ESRI User Conference, San Diego, CA, USA, 9–13 July 2001. [Google Scholar]
  38. Schillaci, C.; Braun, A.; Kropácek, J. Terrain analysis and landform recognition. In Geomorphological Techniques (Online Edition); Clarke, N.E., Nield, J.M., Eds.; British Society for Geomorphology: London, UK, 2015. [Google Scholar]
  39. Beven, K.; Kirkby, M.J. A Physically based, variable contributing area model of basin hydrology. Hydrol. Sci. Bull. 1979, 24, 43–69. [Google Scholar]
  40. Jongman, R.H.G.; Ter Braak, C.J.F.; Van Tongeren, O.F.R. Data analysis in community and landscape ecology: Cluster analysis. Biometrics 1995, 46, 91–173. [Google Scholar]
  41. IPCC. Climate Change 2022: Mitigation of Climate Change (Summary for Policymakers) [M/OL]. 2022. Available online: https://www.ipcc.ch/report/ar6/wg3/#FullReport (accessed on 4 April 2022).
  42. Wang, Z.; Yuan, J.; Pang, B.; Huang, L. The interpretation and highlights on mitigation of climate change in IPCC AR6 WGIII report. Adv. Clim. Chang. Res. 2022, 18, 531–537. Available online: http://www.climatechange.cn/CN/Y2022/V18/I5/531 (accessed on 3 August 2023). [CrossRef]
  43. Burke, K.D.; Williams, J.W.; Chandler, M.A.; Haywood, A.M.; Lunt, D.J.; Otto-Bliesner, B.L. Pliocene and Eocene provide best analogs for near-future climates. Proc. Natl. Acad. Sci. USA 2018, 115, 13288–13293. [Google Scholar] [CrossRef]
  44. Thoman, R.L.; Richter-Menge, J.; Druckmiller, M.L. Arctic Report Card 2020. Available online: https://arctic.noaa.gov/Report-Card/Report-Card-2020 (accessed on 3 August 2023).
  45. Yao, T.; Xue, Y.; Chen, D.; Chen, F.; Thompson, L.; Cui, P.; Koike, T.; Lau, W.K.-M.; Lettenmaier, D.; Mosbrugger, V.; et al. Recent third pole’s rapid warming accompanies cryospheric melt and water cycle intensification and interactions between monsoon and environment: Multidisciplinary approach with observations, modeling, and analysis. Bull. Am. Meteorol. Soc. 2019, 100, 423–444. [Google Scholar] [CrossRef]
  46. Yao, T.; Chen, F.; Cui, P.; Ma, Y.; Xu, B.; Zhu, L.; Zhang, F.; Wang, W.; Ai, L.; Yang, X. From the Tibetan Plateau to the Third Pole and Pan-Third Pole. Bull. Chin. Acad. Sci. 2017, 32, 924–931. [Google Scholar]
  47. Feng, S.; Tang, M.; Wang, D. New evidence that the Tibetan Plateau is the starting point of climate change in China. Chinese Sci. Bull. 1998, 43, 633–636. [Google Scholar]
  48. Pan, B.; Li, J. The Tibetan Plateau: A driving force and amplifier of global climate change—Part III: The impact of uplift of the Qinghai-Tibetan Plateau on climate change. J. Lanzhou Univ. 1996, 32, 108–115. [Google Scholar]
  49. Pepin, N.; Bradley, R.S.; Diaz, H.F.; Baraer, M.; Caceres, E.B.; Forsythe, N.; Fowler, H.; Greenwood, G.; Hashmi, M.Z.; Liu, X.D.; et al. Elevation-dependent warming in mountain regions of the world. Nat. Clim. Chang. 2015, 5, 424–430. [Google Scholar]
  50. Liu, X.; Chen, B. Climatic warming in the Tibetan Plateau during recent decades. Int. J. Climatol. 2000, 20, 1729–1742. [Google Scholar] [CrossRef]
  51. Duan, A.; Xiao, Z. Does the climate warming hiatus exist over the Tibetan Plateau? Sci. Rep. 2015, 5, 13711. [Google Scholar] [CrossRef]
  52. French, H.M. The Periglacial Environment; Wiley: Hoboken, NJ, USA, 2018. [Google Scholar]
  53. Harris, S.A.; Brouchkov, A.; Cheng, G. Geocryology; Taylor and Francis Group: London, UK, 2017. [Google Scholar]
  54. Williams, P.J.; Smith, M.W. The Frozen Earth. Fundamentals of Geocryology; Cambridge University Press: Cambridge, UK, 1991. [Google Scholar]
  55. Wang, J.; Wang, S.; Qiu, G. The permafrost along the Qinghai-Tibet Highway. Acta Geogr. Sin. 1979, 14, 18–32. [Google Scholar]
  56. Peddle, D.R.; Franklin, S.E. Classification of permafrost active layer depth from remotely sensed and topographic evidence. Remote Sens. Environ. 1993, 44, 67–80. [Google Scholar] [CrossRef]
  57. Lara, M.J.; McGuire, A.D.; Euskirchen, E.S.; Tweedie, C.E.; Hinkel, K.M.; Skurikhin, A.N.; Romanovsky, V.E.; Grosse, G.; Bolton, W.R.; Genet, H. Polygonal tundra geomorphological change in response to warming alters future CO2 and CH4 flux on the Barrow Peninsula. Global Chang. Biol. 2015, 21, 1634–1651. [Google Scholar] [CrossRef]
  58. Wainwright, H.M.; Dafflon, B.; Smith, L.J.; Hahn, M.S.; Curtis, J.B.; Wu, Y.; Ulrich, C.; Peterson, J.E.; Torn, M.S.; Hubbard, S.S. Identifying multiscale zonation and assessing the relative importance of polygon geomorphology on carbon fluxes in an Arctic tundra ecosystem. J. Geophys. Res. Biogeosci. 2015, 120, 788–808. [Google Scholar] [CrossRef]
  59. Ishikawa, M.; Sharkhuu, N.; Zhang, Y.; Kadota, T.; Ohata, T. Ground thermal and moisture conditions at the southern boundary of discontinuous permafrost, Mongolia. Permafrost Periglac. Process. 2010, 16, 209–216. [Google Scholar] [CrossRef]
  60. Gilbert, G.; Kanevskiy, M.; Murton, J.B. Recent advances (2008–2015) in the study of ground ice and cryostratigraphy. Permafrost Periglac. Process. 2016, 27, 377–389. [Google Scholar] [CrossRef]
  61. Burt, T.P.; Williams, P.J. Hydraulic conductivity in frozen soils. Earth Surf. Process. 1976, 1, 349–360. [Google Scholar] [CrossRef]
  62. Ni, J.; Wu, T.; Zhu, X.; Li, S.; Zhang, M.; Miao, Y. Simulation of the present and future projection of permafrost on the Qinghai-Tibet Plateau with statistical and machine learning models. J. Geophys. Res. Atmos. 2021, 126, e2020JD033402. [Google Scholar] [CrossRef]
  63. Zhang, G.; Nan, Z.; Hu, N.; Li, X.; Wang, W.; Yu, Q. Qinghai-Tibet Plateau permafrost at risk in the late 21st century. Earth’s Future 2022, 10, e2022EF002652. [Google Scholar] [CrossRef]
  64. Slater, A.G.; Lawrence, D.M. Diagnosing present and future permafrost from climate models. J. Clim. 2013, 26, 5608–5623. [Google Scholar] [CrossRef]
  65. Koven, C.D.; Riley, W.J.; Stern, A. Analysis of permafrost thermal dynamics and response to climate change in the CMIP5 Earth System Models. J. Clim. 2013, 26, 1877–1900. [Google Scholar] [CrossRef]
  66. Lu, Q.; Zhao, D.; Wu, S. Simulated responses of permafrost distribution to climate change on the Qinghai-Tibet Plateau. Sci. Rep. 2017, 7, 3845. [Google Scholar] [CrossRef]
  67. Romanovsky, V.; Smith, S.L.; Isaksen, K.; Streletskiy, D. Terrestrial permafrost. Bull. Am. Meteorol. Soc. 2018, 99, S161–S165. [Google Scholar]
  68. Streletskiy, D.A.; Clemens, S.; Lanckman, J.P.; Shiklomanov, N.I.; Nyland, K.E. The costs of Arctic infrastructure damages due to permafrost degradation. Environ. Res. Lett. 2023, 18, 015006. [Google Scholar] [CrossRef]
  69. Maslakov, A.A.; Nyland, K.E.; Komova, N.N.; Shiklomanov, N.I.; Pochatuk, A.V.; Streletskiy, D.A. Community ice cellars in eastern Chukotka: Climatic and anthropogenic influences on structural stability. Geogr. Environ. Sustain. 2020, 13, 49–56. [Google Scholar] [CrossRef]
  70. Nyland, K.E.; Klene, A.E.; Brown, J.; Streletskiy, D.A.; Romanovsky, V.E.; Shiklomanov, N.I. Traditional Inupiat ice cellars (SIĠḷUAQ) in Barrow, Alaska: Characteristics, temperature monitoring, and distribution. Geogr. Rev. 2017, 107, 143–158. [Google Scholar] [CrossRef]
  71. Puchkov, A.V.; Yakovlev, E.Y.; Hasson, N.; Shiklomanov, N.I.; Streletskiy, D.A. Radonhazard in permafrost conditions: Current state of research. Geogr. Environ. Sustain. 2021, 4, 93–104. [Google Scholar] [CrossRef]
  72. Revich, B.A.; Eliseev, D.O.; Shaposhnikov, D.A. Risks for public health and social infrastructure in Russian Arctic under climate change and permafrost degradation. Atmosphere 2022, 13, 532. [Google Scholar] [CrossRef]
  73. Schaefer, K.; Elshorbany, Y.; Jafarov, E.; Chen, G.; Gusmeroli, A.; Murray, A.; Zhong, L.; McCalley, C.K.; Vogel, J.G.; Monaghan, A.J.; et al. Potential impacts of mercury released from thawing permafrost. Nat. Commun. 2020, 11, 4650. [Google Scholar] [CrossRef]
Figure 1. Six permafrost samples with different ice contents. (a) Ice-poor, with almost invisible ice crystals; (b) Icy permafrost, micro ice lenses or small ice particles can be seen (c) ice-rich, some ice crystals visible to the naked eye; (d) sediment-rich, uneven ice layers; (e) sediment poor, a mixture of ice and soil, with soil containing ice layer, and a lot of ice is visible; (f) pure ice.
Remotesensing 15 04496 g001
Figure 2. The distribution of high ice-content permafrost sites on the Qinghai–Tibet Plateau. (a) High ice-content permafrost boreholes (iv > 25%) sites and parts of the thaw slumps areas exists. (b) High ice-content permafrost found in boreholes. (c) Thaw slump with high ice content.
Remotesensing 15 04496 g002
Figure 3. Statistical figures of different temperatures and active layer thickness (ALT) of high ice-content permafrost. (a) Mean annual air temperature change with an average warming rate of 0.08 °C/a; (b) histogram of warming rates from 1996 to 2020; (c) histogram of mean annual ground temperature (MAGT); (d) histogram of active layer thickness (ALT).
Remotesensing 15 04496 g003
Figure 4. Variation in precipitation and soil moisture in regions with high ice-content permafrost. (a) Variation of soil moisture and precipitation over time in the high ice-content region. (b) Density plots of the increase rate of precipitation in both borehole and thaw slumps; (c) density plots of the increase rate of soil moisture.
Remotesensing 15 04496 g004
Figure 5. Geomorphological features of the distribution of high ice-content permafrost. (a) elevation; (b) slope; (c) topographic position index (TPI); (d) topographic wetness index (TWI); (e) slope aspect.
Remotesensing 15 04496 g005
Figure 6. Soil properties of high ice-content permafrost. (a) Soil clay, silt, and sand content; (b) heatmap of soil layer thickness and soil bulk density.
Remotesensing 15 04496 g006
Figure 7. Variation of NDVI (May–September) over time in the high ice-content permafrost regions. The NDVI values in the figure are the mean annual NDVI.
Remotesensing 15 04496 g007
Figure 8. Cluster analysis of 15 indicators from 400 high ice-content permafrost sites.
Remotesensing 15 04496 g008
Figure 9. Distribution of warming rates of high ice-content permafrost regions on the QTP. (a) Whole QTP, with larger circle diameters denoting higher warming rates; (b) western QTP; (c) central QTP; and (d) eastern QTP.
Remotesensing 15 04496 g009
Figure 10. Variation in gravimetric ice content of permafrost on the sunny (south) and shady (north) slopes of the Gu Mountain in the Beiluhe Basin.
Remotesensing 15 04496 g010
Figure 11. Assessment of the reliability of high ice-content permafrost, with a higher number of “+” signs signifying greater reliability. AT: air temperature; ST: soil thickness; BD: bulk density; SM: soil moisture.
Remotesensing 15 04496 g011
Figure 12. Map of viscous clay content in regions with high ice-content permafrost. (a) Material distribution profile of a typical thaw slump located in the Hol Xil Mountains; (b) Swamp meadow investigated using boreholes in the Beiluhe Basin; (c) Alpine meadow investigated using boreholes in the Beiluhe Basin; and (d) the relationship between clay content and ground ice content (volumetric ice content) in the two vegetation types of swamp meadow and the alpine meadow.
Remotesensing 15 04496 g012
Figure 13. The thawing of permafrost containing a significant amount of ice leads to the emergence of various thermokarst phenomena. (a) thermokarst lakes; (b) thaw-exposed ground ice; (c) large-scale thaw slump; (d) thermokarst gullies; (e) thermokarst caves; and (f) ground ice thaw that creates large cracks in the roadbed.
Remotesensing 15 04496 g013
Table 1. Basic characteristics of permafrost ice content and corresponding structures [32,33,34].
Classificationiv, % 1Visual CharacterizationIce Characteristics
Ice-poor permafrostiv ≤ 12%Ice layer is not visible to the naked eyePoor cohesion, is fragile, and lacks excess ice, thus not melting and sinking
Icy permafrost12% < iv ≤ 18%Occasionally, micro ice lenses or small ice particles can be seenIce film around the particles, indicating weak melting and sinking
Ice-rich permafrost18% < iv ≤ 25%Unevenly distributed ice lenses and thin ice layersIrregularly oriented ice bands indicate melting and sinking
Sediment-rich permafrost25% < iv ≤ 44%Ice and soil are generally distributed separatelyClearly oriented ice bands indicate strong melting and sinking
Sediment-poor permafrost or pure iceiv > 44%A large amount of visible iceIce-rich layers or pure ice layers, resulting in melting and subsidence.
1 Mass water content.
Disclaimer/Publisher’s Note: The statements, opinions and data contained in all publications are solely those of the individual author(s) and contributor(s) and not of MDPI and/or the editor(s). MDPI and/or the editor(s) disclaim responsibility for any injury to people or property resulting from any ideas, methods, instructions or products referred to in the content.

