1. Introduction
Synthetic aperture radar has been widely applied in various fields such as ocean observation, cartography, and civilian remote sensing due to its imaging characteristics and all-day, all-weather, and high azimuth resolutions [
1,
2]. Compared to microwave SAR, THz SAR offers a shorter wavelength, wider bandwidth, and distinct Doppler characteristics resulting from platform or target motion. This enables THz SAR to achieve a higher imaging resolution [
3] and real-time detection capabilities at video frame rates [
4], thus presenting broader application prospects.
The integrated navigation system based on the Global Navigation Satellite System (GNSS) and Inertial Navigation System (INS) allows for real-time acquisition of the position and attitude information of radar platforms, finding effective application in synthetic aperture radar systems [
5]. For vehicle-borne or airborne SAR systems, although an integrated navigation system can periodically record the position information of the radar, the non-uniform sampling characteristics in azimuth are inevitable due to the difficulty in maintaining an ideal constant linear motion during radar movement [
6], which leads to a degradation in the imaging quality of the radar. Compared to microwave SAR, THz SAR requires a higher sampling rate in azimuth, resulting in more severe non-uniform sampling issues that significantly impact the image reconstruction.
Traditional methods for addressing non-uniform sampling in the azimuth of microwave SAR primarily focus on hardware considerations. By utilizing an integrated navigation system to measure the real-time motion velocity of the radar platform, the PRF can be adjusted to achieve a more uniform azimuth sampling position [
7]. However, for THz SAR systems with denser sampling points in azimuth, this hardware-based method of adjusting the PRF has certain limitations. The azimuth sampling positions still remain somewhat non-uniform to some extent, making it difficult to achieve the desired imaging results. In addition, a higher azimuth sampling rate also increases the hardware design requirements and incurs additional hardware costs.
The issue of non-uniform sampling in the azimuth of SAR can also be addressed from a software perspective. The flight path error of the SAR platform can be divided into along-track motion errors and cross-track motion errors [
8]. The along-track motion error is the azimuth non-uniform sampling problem studied in this paper. On the other hand, the cross-track motion error, caused by the deviation of the radar platform from the ideal motion trajectory, is typically compensated for after compensating for the along-track motion error. Based on the importance of the impact on imaging quality, there is a considerable amount of literature that has studied the problem of cross-track motion error compensation [
5,
6,
7,
8,
9,
10,
11,
12,
13,
14,
15], while research on the problem of along-track motion error compensation is relatively limited, even though its impact on imaging quality should not be overlooked [
16]. Currently, the predominant approach for addressing the issue is azimuth resampling [
10], which involves interpolating the non-uniformly sampled data to obtain uniformly sampled echo data for processing. This method is straightforward in principle; however, when the influence of spectral aliasing cannot be neglected, it results in a degradation of the image focusing effect [
17]. The BPA, being a time-domain imaging technique, is applicable to any imaging geometry and can also be used for imaging non-uniformly sampled echo data [
8]. This method offers high imaging accuracy but requires significant computational resources. A phase compensation-based method was employed in [
17] to compensate for along-track motion errors, which offers high computational efficiency. However, this method relies on certain approximations and lacks general applicability, particularly for imaging scenarios involving close-range distances. Due to the distance having no influence on the spectral range of azimuth signals, the spectral reconstruction method can effectively handle imaging issues in close-range scenarios. The problem of spectral reconstruction for azimuth non-uniformly sampled signals can be formulated as an inverse problem in mathematics, and the solution to this problem may be ill-posed. Therefore, we employ the Tikhonov regularization method for solving the problem of spectral reconstruction. The Tikhonov regularization method is an approach that, overall, minimizes the norm of the solution and residual norm based on the selected regularization parameter [
18]. It has been widely applied in solving ill-posed problems [
19,
20].
To tackle the problem of non-uniform sampling in the azimuth of THz SAR, a regularization-based algorithm in this paper is proposed for reconstructing the spectrum of non-uniformly sampled signals. It transforms the spectrum reconstruction problem into a linear equation system and solves it using Tikhonov regularization. The proposed algorithm achieves a fast transformation of SAR non-uniformly sampled signals from the spatial domain to wavenumber domain in azimuth, thereby establishing an efficient image reconstruction algorithm suitable for non-uniformly sampled SAR. Considering the characteristics of SAR echo signals as two-dimensional matrices and unknown noise, a regularization parameter selection method based on L-curve criterion is established. Moreover, we utilize a Fourier series to analyze the error in spectrum reconstruction, demonstrating that the accuracy of estimating the signal spectrum for finite-length approximate band-limited signals depends on the high-frequency components beyond the signal bandwidth and the signal noise. The simulation and experimental results validate that the proposed algorithm achieves a more accurate reconstruction of the non-uniformly sampled signals compared to the azimuth resampling algorithms, resulting in improved imaging quality. Additionally, it offers higher computational efficiency compared to BPA, making it more suitable for compensating the significant azimuth motion errors in THz SAR applications.
This article is organized as follows. In
Section 2, a spectral reconstruction model for non-uniformly sampled signals is established. In
Section 3, the Tikhonov regularization method is used to solve the model and the regularization parameter is determined using the L-curve criterion. In
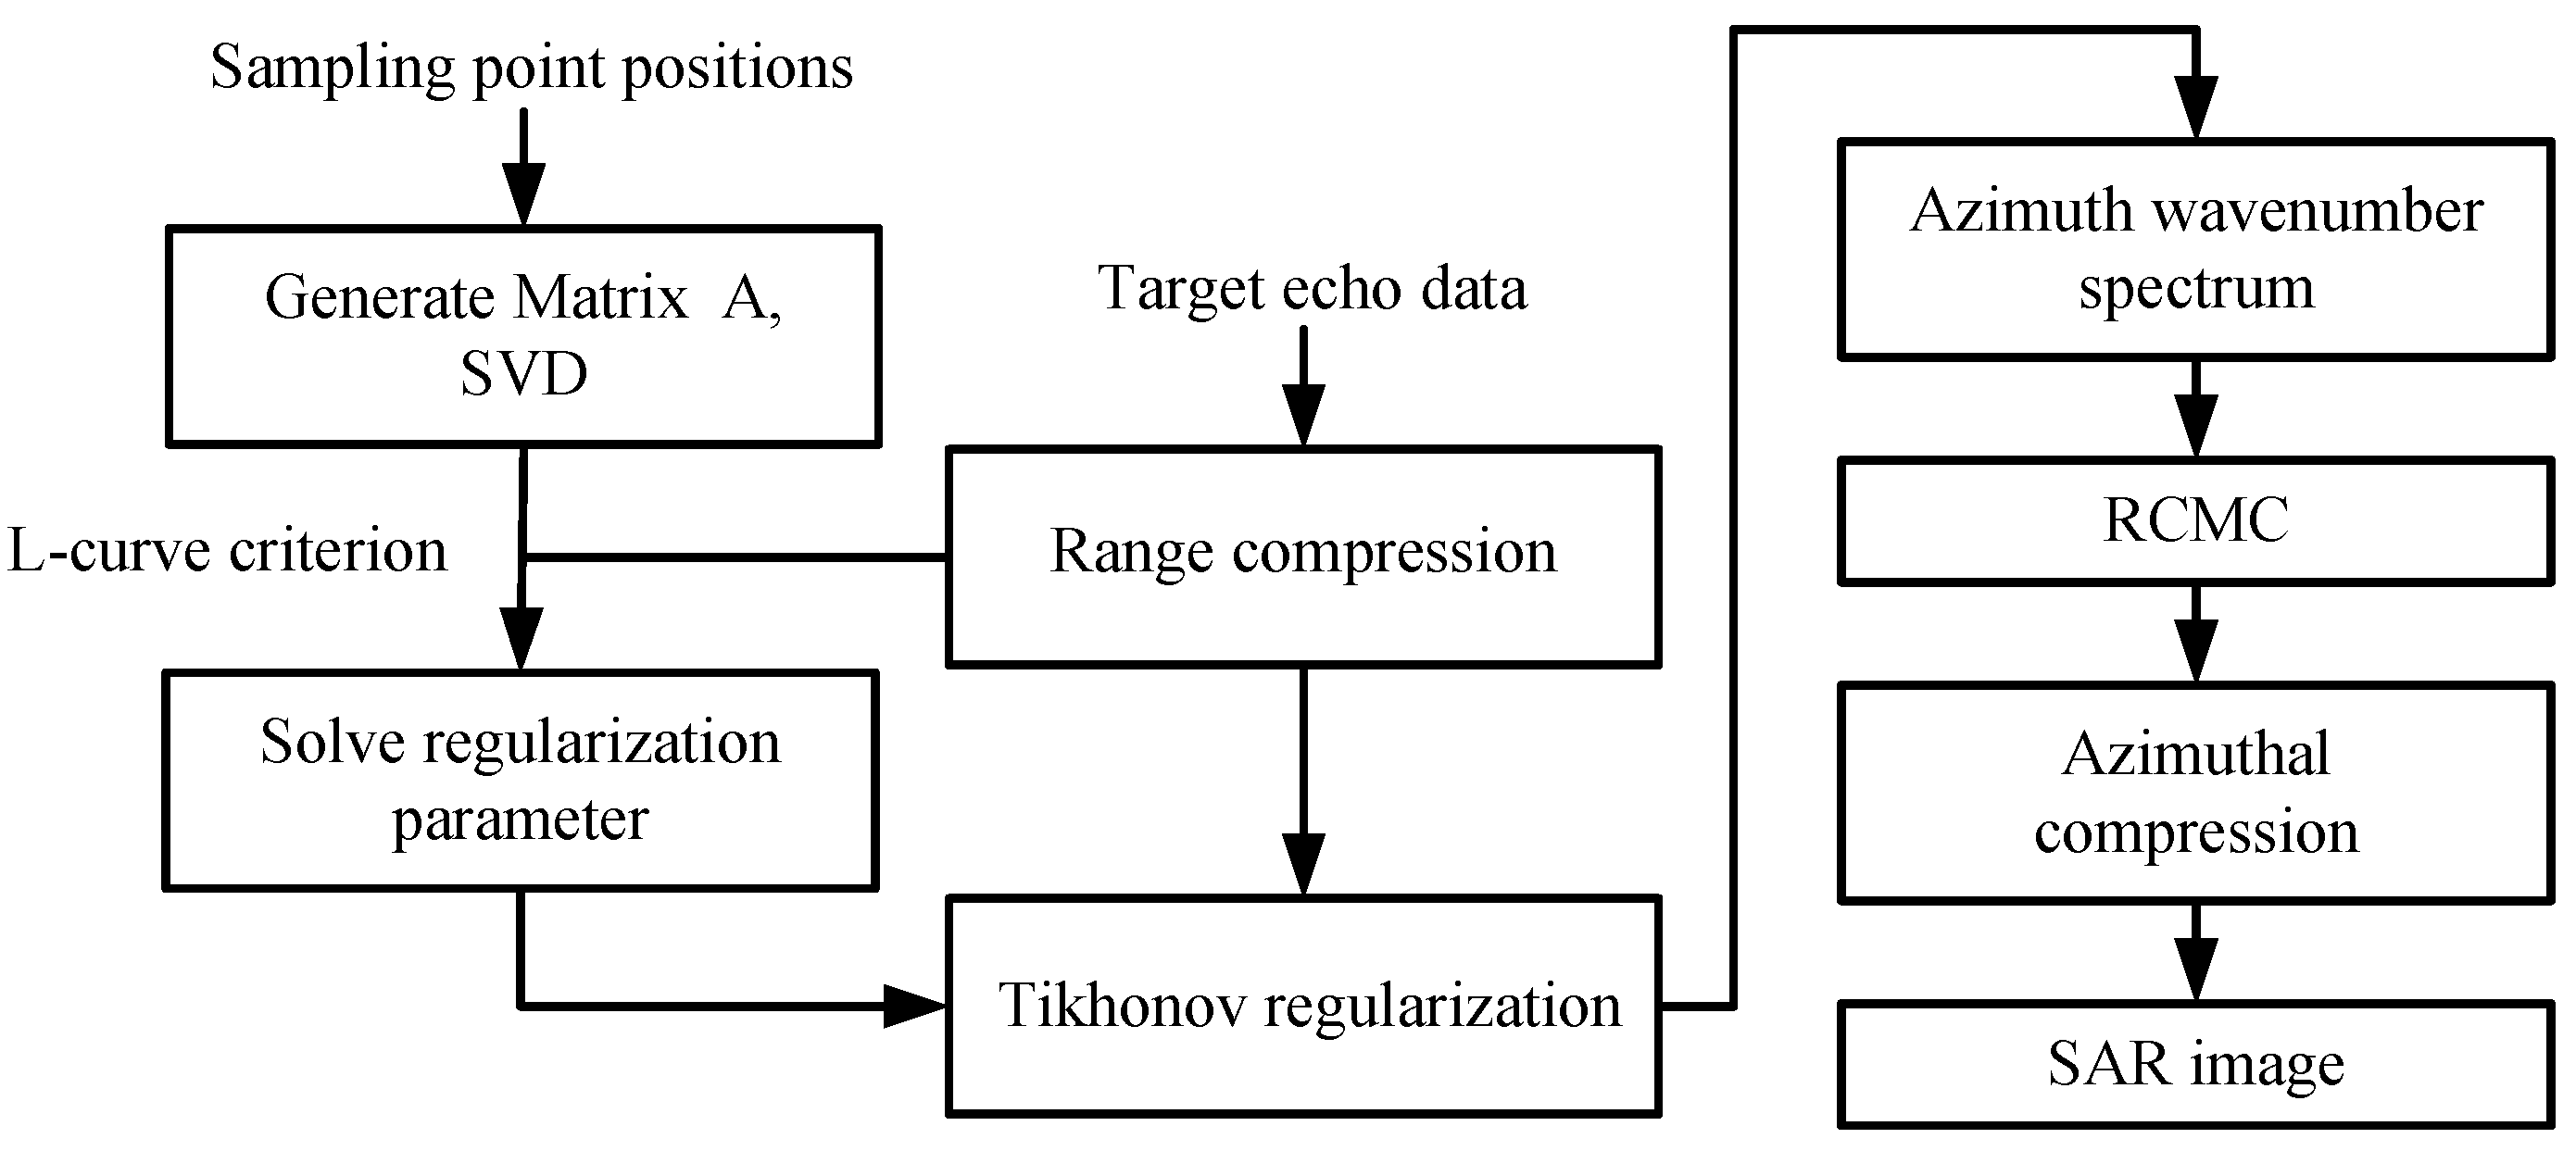
Section 4, the proposed method is applied to the problem of THz SAR with non-uniform sampling, and a corresponding algorithm flowchart is provided. In
Section 5, simulations and experiments are conducted using a 0.3 THz stepped-frequency radar system. Finally, a conclusion is drawn in
Section 6.
2. Spectrum Reconstruction Model for Non-Uniform Sampling Signals
For a finite-length continuous signal , where , let , assuming it satisfies the Dirichlet condition and its spectrum is primarily concentrated within the frequency range of ; with high-frequency components being negligible, we define a signal meeting these conditions as an approximate band-limited signal, which is commonly observed in most real-world sampled analog signals.
Let
be the Fourier transform of
. Given
N non-uniform sampling positions with known sampling values
, where
, and
s is an
N-dimensional vector, the frequency spectrum of
to be reconstructed is denoted as a (
)-dimensional vector
S, with the condition that
Define
A as a linear operator, represented by an
-dimensional matrix, satisfying the condition
where
is the error term caused by
not being a true band-limited signal.
Equation (
2) represents the spectrum reconstruction model for non-uniformly sampled signals, which allows us to estimate the discrete signal spectrum
S given the known vector
s and matrix
A. Next, we will derive the expressions for
A and
, and analyze the magnitude of
through simulations.
2.1. Principle of Spectrum Reconstruction
For an infinite-length periodic signal
with a frequency band of
and a signal period of
, the value of any point
t in
can be accurately expressed using the following discrete inverse Fourier transform formula [
21]:
where
is the Fourier coefficient of
at frequency
.
However, for finite-length signals typically encountered in the real-world, they do not satisfy (
3). Nevertheless, it is worth noting that (
3) approximately holds for an approximate band-limited signal, with the error value depending on the spectral components outside the signal’s bandwidth.
Let
be the periodic extension of
, satisfying
, where
, and
n is an integer. Then,
can be expanded using the Fourier series [
22], given by
where
is the Fourier coefficient of
, and the expression is
This indicates that
is equal to the value of
at
multiplied by a constant term. When
, it holds that
Let
then (
6) can be rewritten as
As the spectrum of
is primarily concentrated within the range
, it suggests that when
, the magnitude of
is close to zero. Therefore,
is significantly smaller compared to the first term on the right side of (
8). For
N non-uniform sampling positions
, let vector
, then, the norm of
is much smaller than the norm of
s, i.e.,
. We define
as the higher-order error term of the non-uniform sampling signal. From a time-domain perspective,
can be expressed as the error generated by approximating a finite-length signal using a certain order of trigonometric polynomials. As the order increases, the approximation error decreases.
Based on (
2), (
5), and (
8), the error term can be obtained as
, and the expression for
A is
2.2. Simulation Analysis of High-Order Error Term
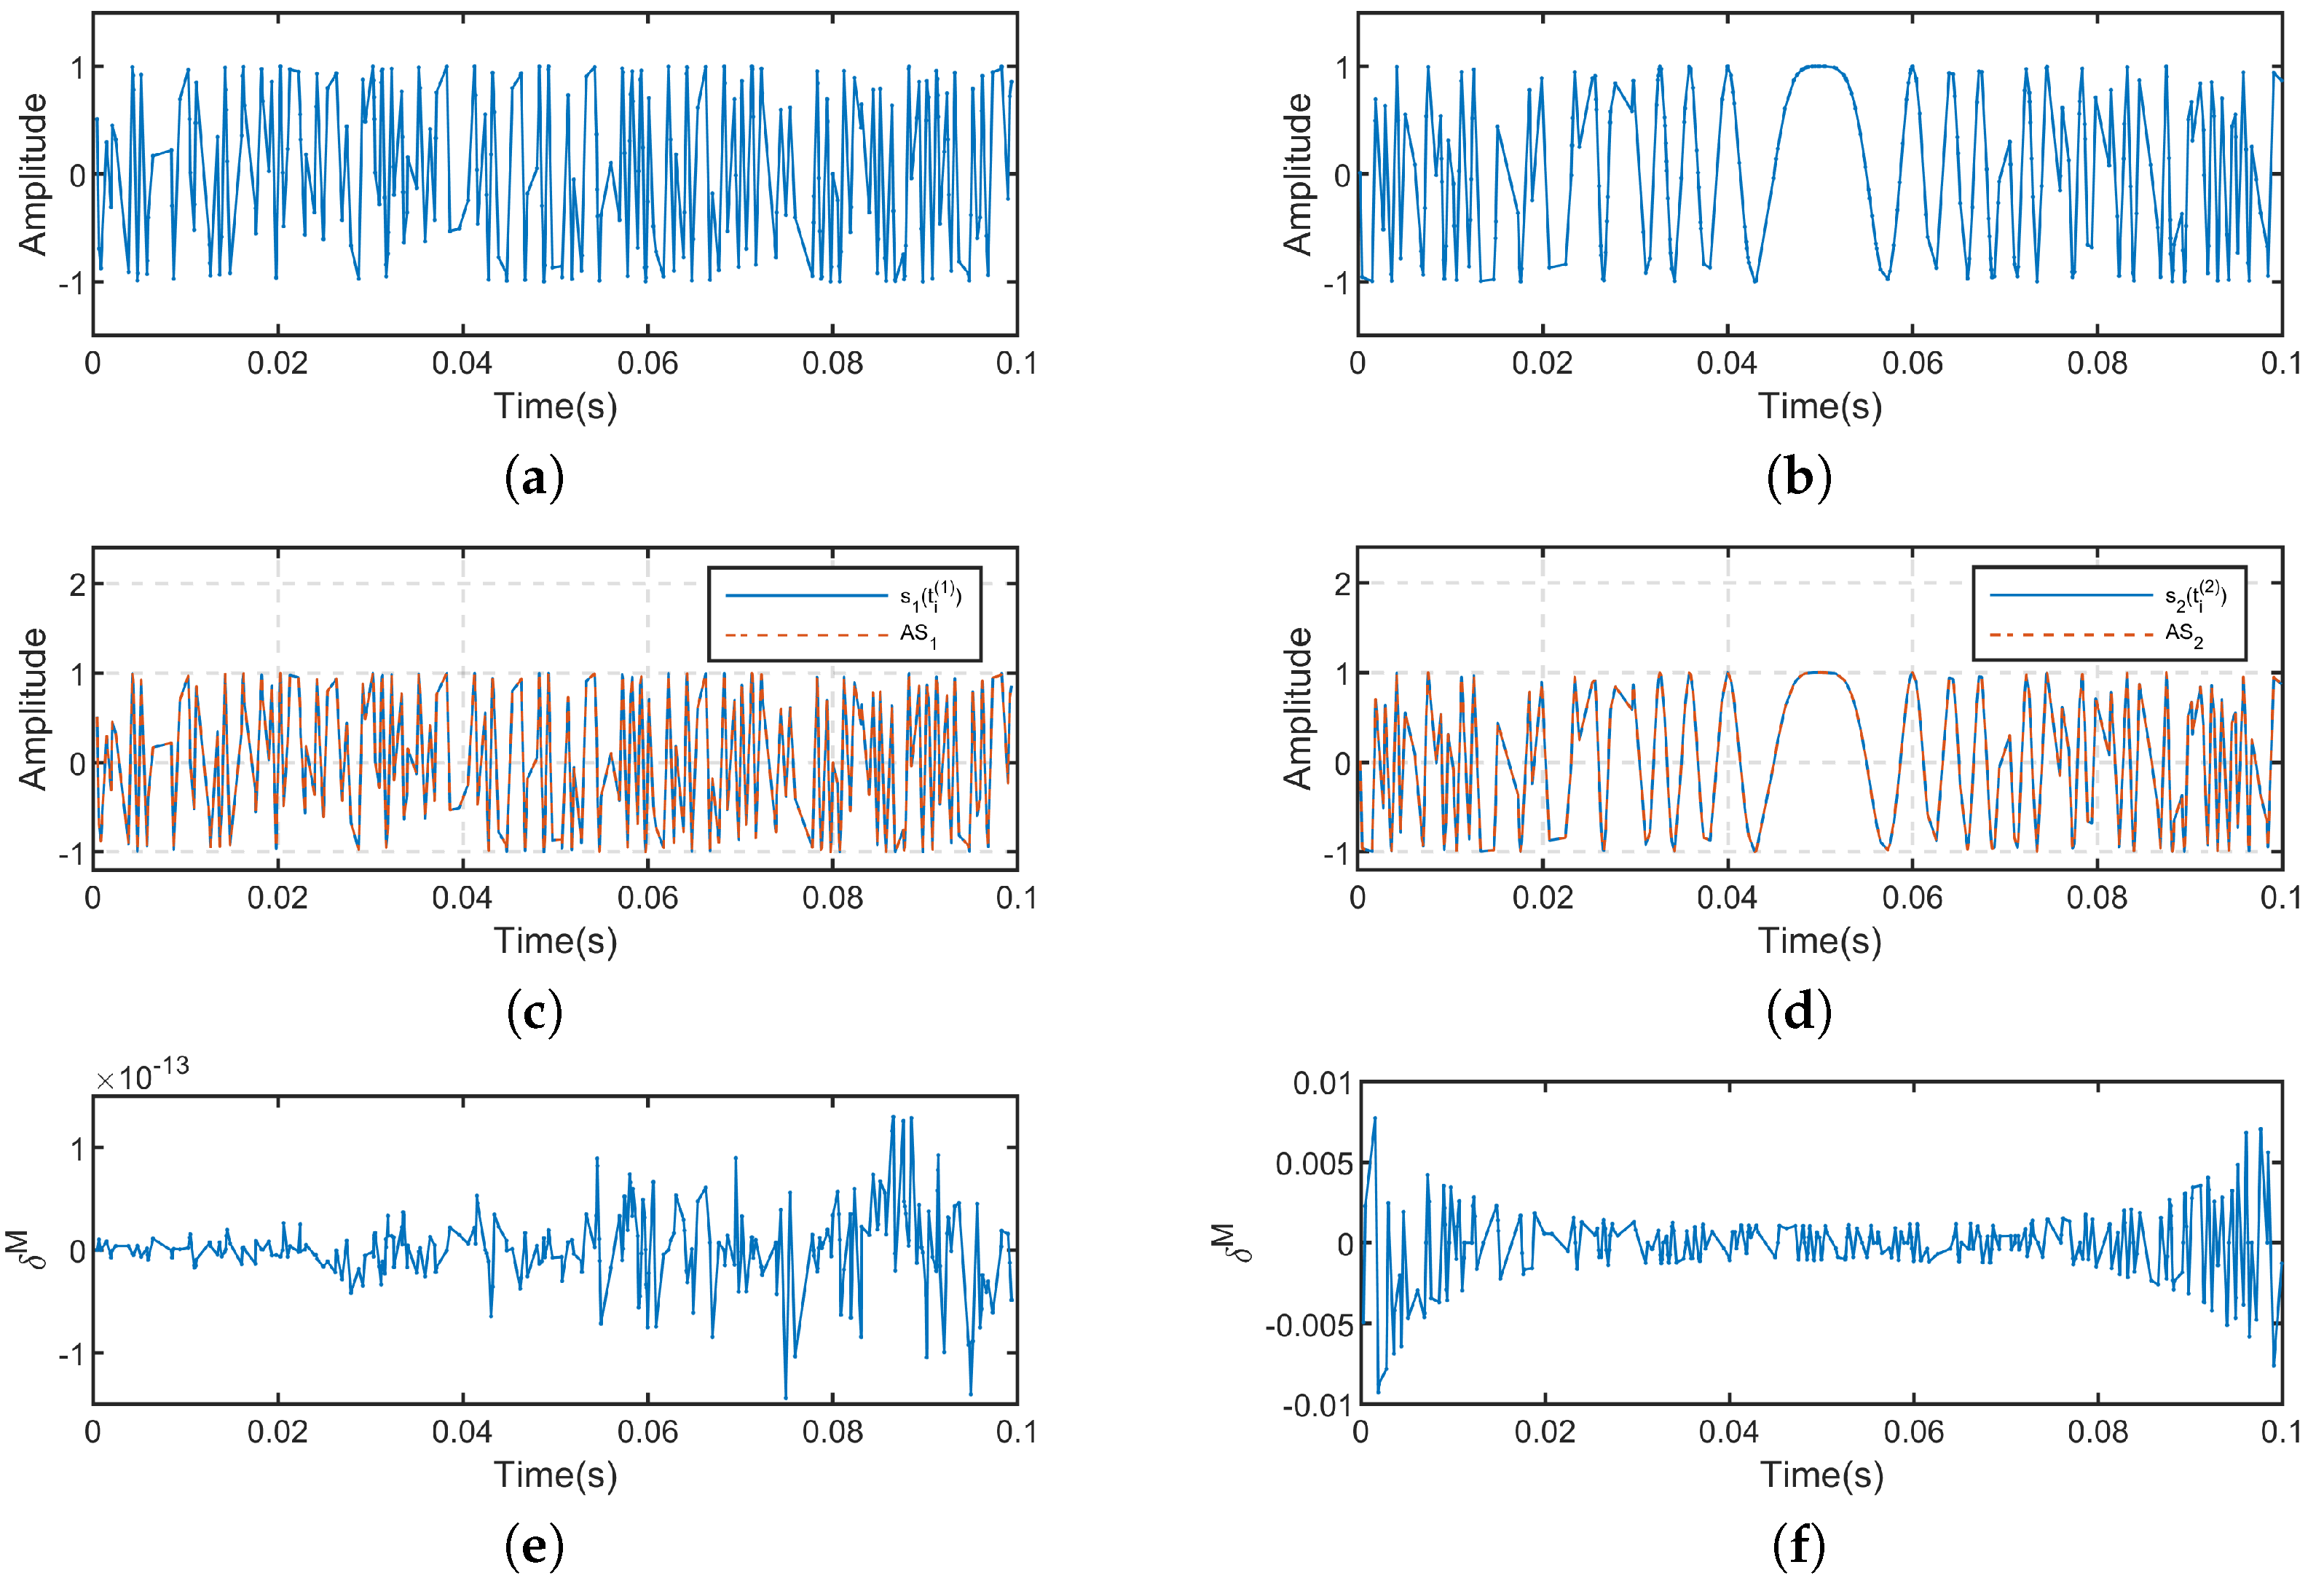
The selected simulation signals are
for the sine wave signal and
for the linear frequency modulation (LFM) signal. The time-domain waveform plots of the non-uniformly sampled signals
and
, represented as
and
, respectively, are shown in
Figure 1a,b, where
. The non-uniform sampling points
and
are randomly obtained within the range of
. The frequency spectra of
and
are primarily centered at the interval of
. To improve the accuracy of the computations, the actual spectral bandwidth used for the calculations should be slightly wider than the theoretical spectral bandwidth of the signal [
23]. We set the oversampling factor
, which means that the actual computational spectral range of both signals is set to
. Consequently, we have
, and choose the number of non-uniform sampling points for the two signals as
.
Since
, we can solve it using (
2). Let
and
be the discrete frequency spectrum vectors of
and
, and they have the same meaning as the variable
S in Equation (
2). The values of
and
are obtained by performing the fast Fourier transform (FFT) operation on the uniformly sampled signals of
and
, which are sampled at a rate ten times higher than the Nyquist sampling rate [
24]. The
A is generated based on the positions of the non-uniform sampling points. The waveform comparison between the non-uniformly sampled signals and obtained by multiplying
A with the discrete frequency spectrum vectors are shown in
Figure 1c,d. By subtracting the amplitudes of the two waveforms being compared, we can obtain
of the two non-uniformly sampled signals, which are shown in
Figure 1e,f, respectively. The simulation results indicate that compared to
and
,
is significantly smaller. The ratio of
in
and
is found to be
and
, respectively, satisfying the condition of
. This also demonstrates that estimating the discrete frequency spectrum of non-uniformly sampled signals using (
2) is feasible, as
is significantly smaller compared to
s.
3. Model Solution
The sampled signals are inevitably contaminated with noise. Assume the actual non-uniformly sampled signal is represented by the vector
, where
,
indicating the noise error term. In this case, the error term
should also include the effects caused by the noise, let
. Therefore, according to (
2), we can get
Equation (
10) represents the signal model that needs to be solved under the presence of noise. By setting
and
as the approximate solution of
S, Equation (
10) can be equivalently expressed as
In this article, we only consider the case when
, indicating that the signal’s sampling rate is not less than the Nyquist sampling rate, and Equation (
11) has a unique least squares solution.
3.1. Tikhonov Regularization and Solution Error Analysis
The singular value decomposition (SVD) of
A is
where
V is an orthogonal matrix composed of the corresponding eigenvectors
of
with eigenvalues
, and all eigenvalues of
are positive real numbers.
is the singular value matrix, satisfying
, where
is the singular values of
A.
U is an orthogonal matrix of dimension
, and its columns are formed by the vectors
.
Suppose
is the least squares solution of (
2). Based on Picard’s theorem [
25], it can be expressed as
When there are certain singular values
of
A that are very small or close to zero, the solution for Equation (
11) becomes ill-posed. In this case,
has a significant impact on the solution. To solve such problems, a Tikhonov regularization operator
is constructed [
26], such that
where
is the regularized solution of Equation (
13) under the regularization parameter
, and
is the filtering factor [
27]. For small singular values
,
can attenuate the amplification effect of
on the error, thereby obtaining a stable solution for Equation (
13). The expression for the filtering factor is
Let
utilizing the Tikhonov regularization method to quantify the solution error of Equation (
10) as
The specific formula derivation can be found in
Appendix A. The result of Equation (
17) indicates that, when a non-uniform sampling problem is determined, the solving error is only dependent on
, as the magnitude of
and
z can be considered as unknown constants. The solving error caused by
decreases as
increases. When
, this term tends to zero. The second term on the right-hand side of Equation (
17) represents the regularization error caused by filter factor and increases with the increase of
.
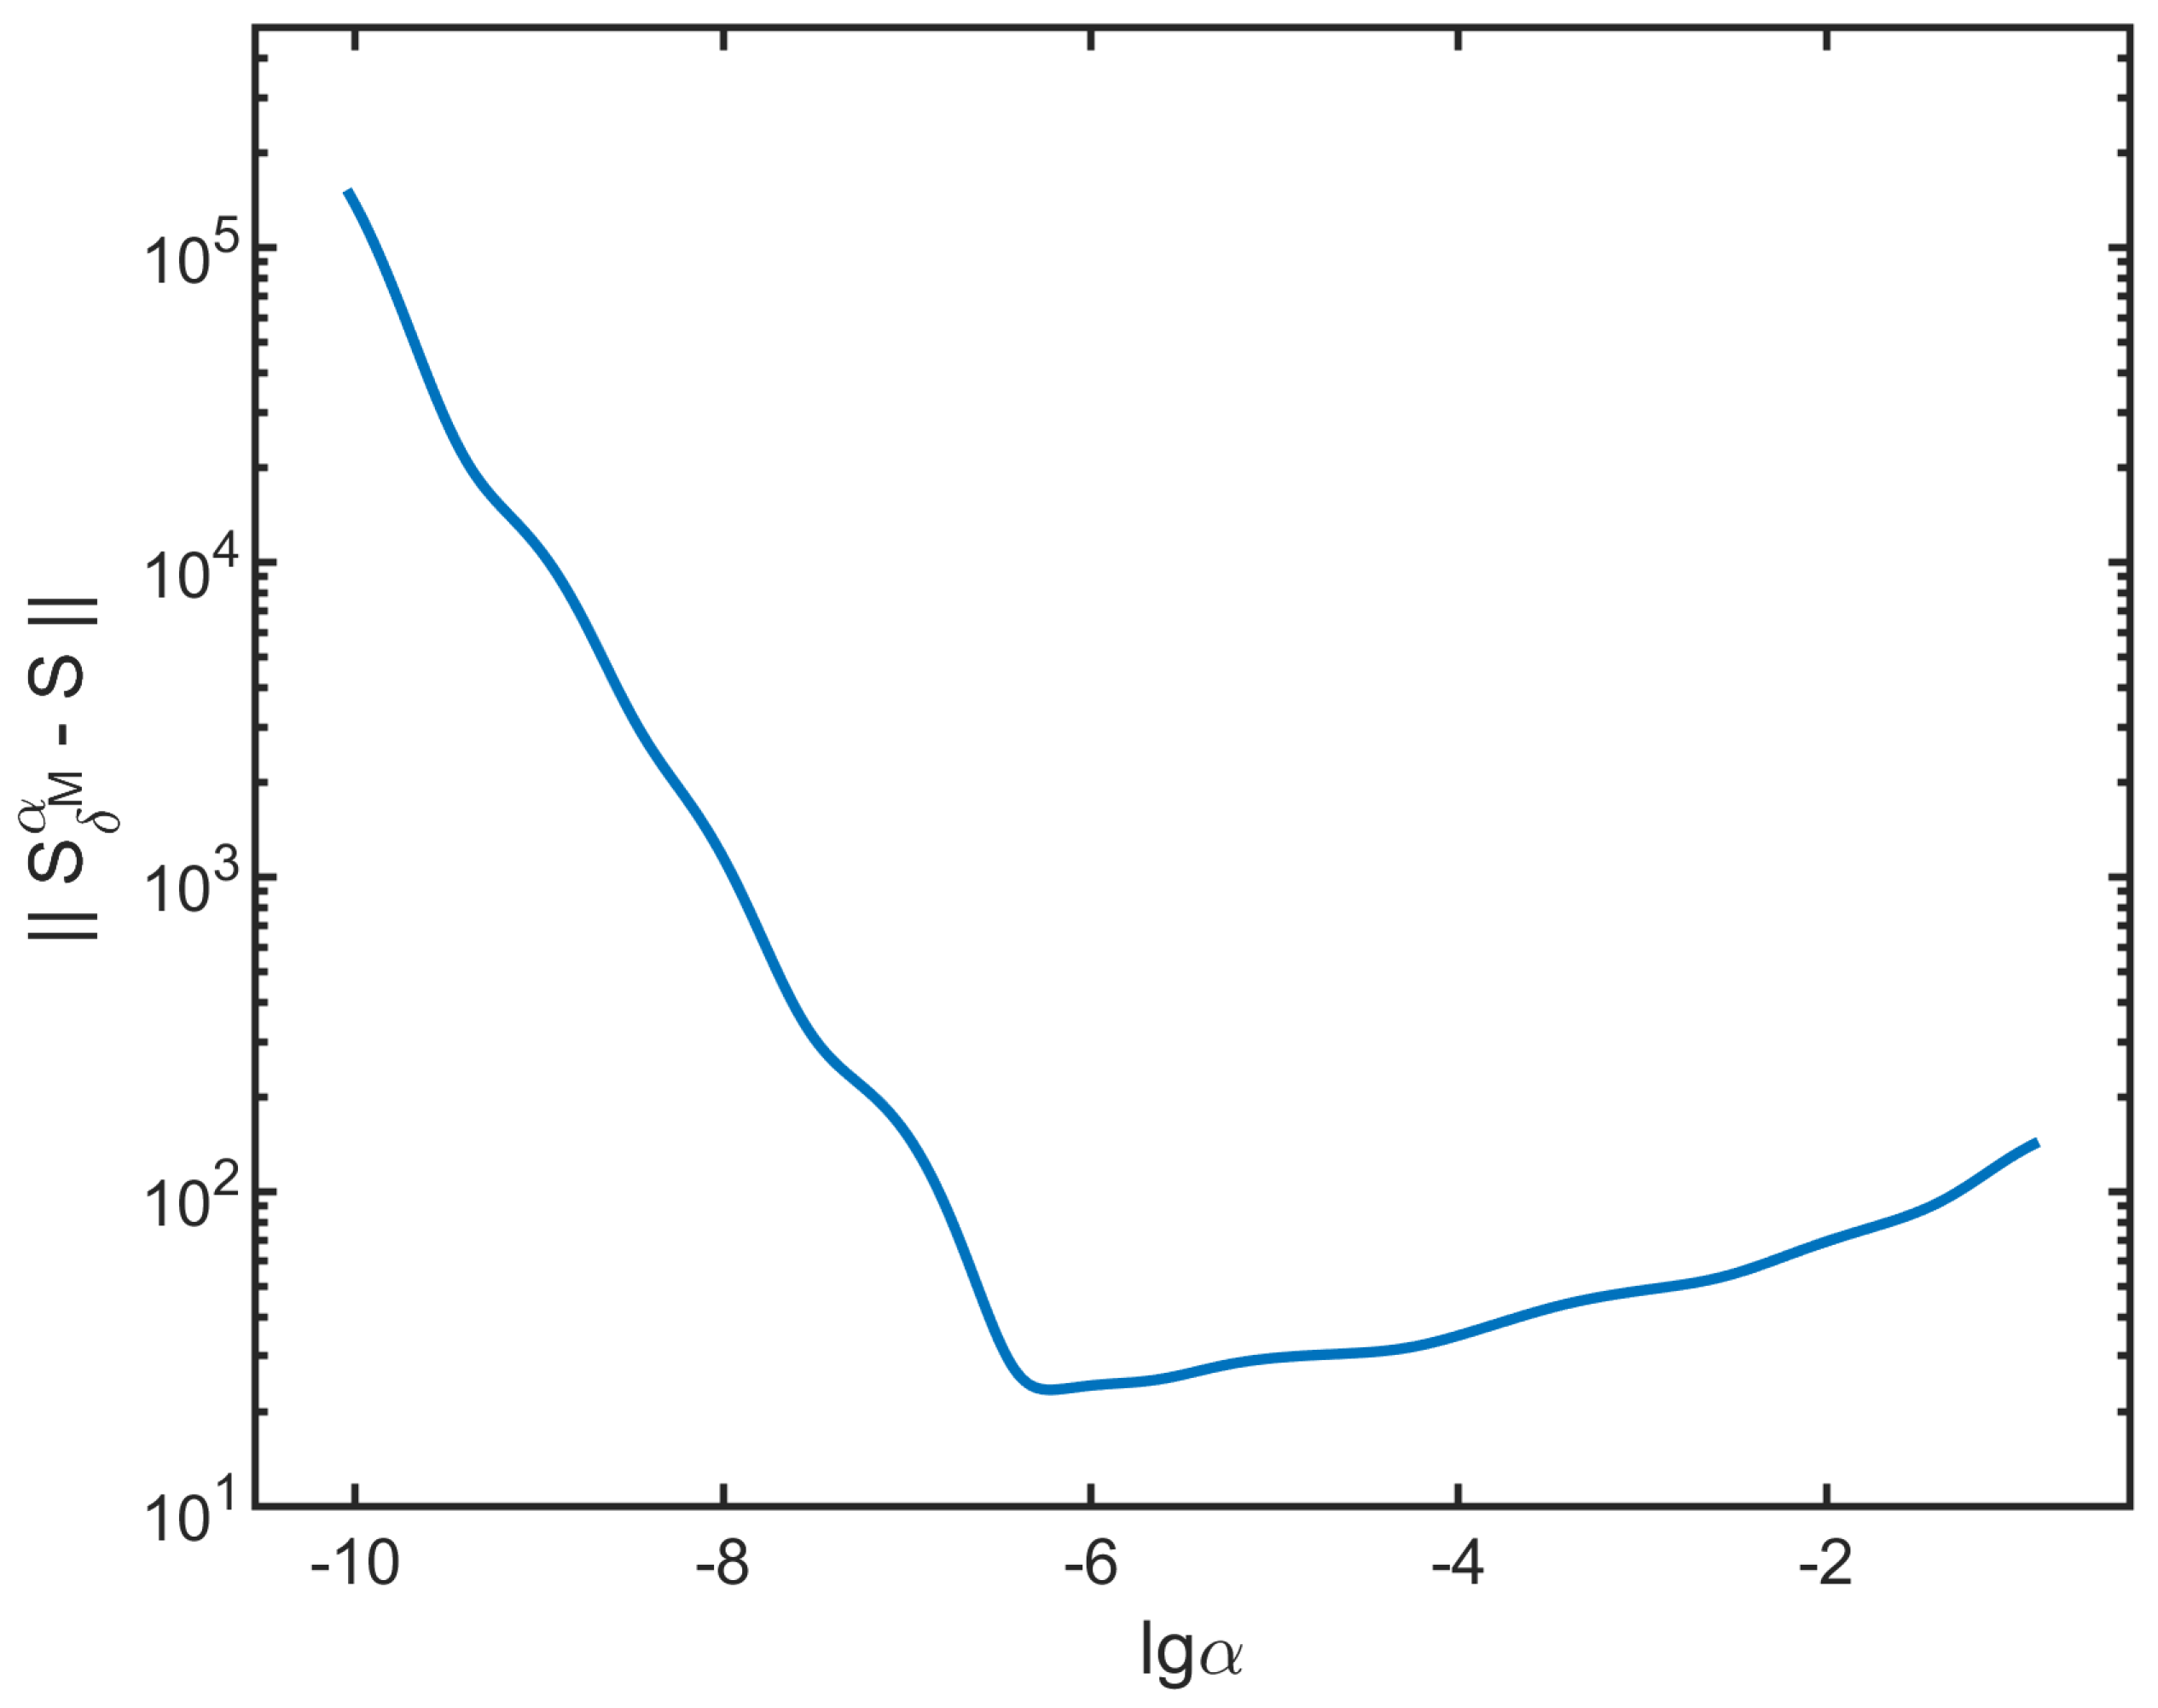
The magnitude of solving error for
under different
is shown in
Figure 2. The 500 selected regularization parameters are evenly distributed on a logarithmic scale axis
with the range of
. When
is small, the solving error primarily caused by
reaches the order of
, indicating that
has a significant impact on the solution results for
. As
increases, the solving error gradually decreases, reaching its minimum value when
. However, as
further increases, the regularization error begins to dominate. Therefore, the role of
is to balance the two types of errors in Equation (
17). In practical solutions to non-uniform sampling problems, it is important to select an appropriate
in order to minimize the overall solving error as much as possible.
3.2. Selection of Regularization Parameters and Simulation
Considering that it is difficult to obtain prior knowledge about
in practical non-uniform sampling problems, we adopt the L-curve criterion to select
. The L-curve is used to describe the relationship between the residual term
and the regularized solution
under different
. it can effectively utilize the information of
and
, seeking a balance that ensures both values are relatively small [
28]. In order to avoid an excessively large regularized solution, we impose a constraint on the norm of
within a certain range. In this case, we select the corner point of the L-curve, which corresponds to the regularization parameter value that maximizes the curvature of the L-curve on a log–log scale. Let
and
, then the chosen
is determined to maximize the following curvature function
within a specified range [
29].
where
represents the derivative with respect to
. Given the known singular value decomposition of
A, it is straightforward to numerically solve for the regularization parameter that maximizes the curvature function
.
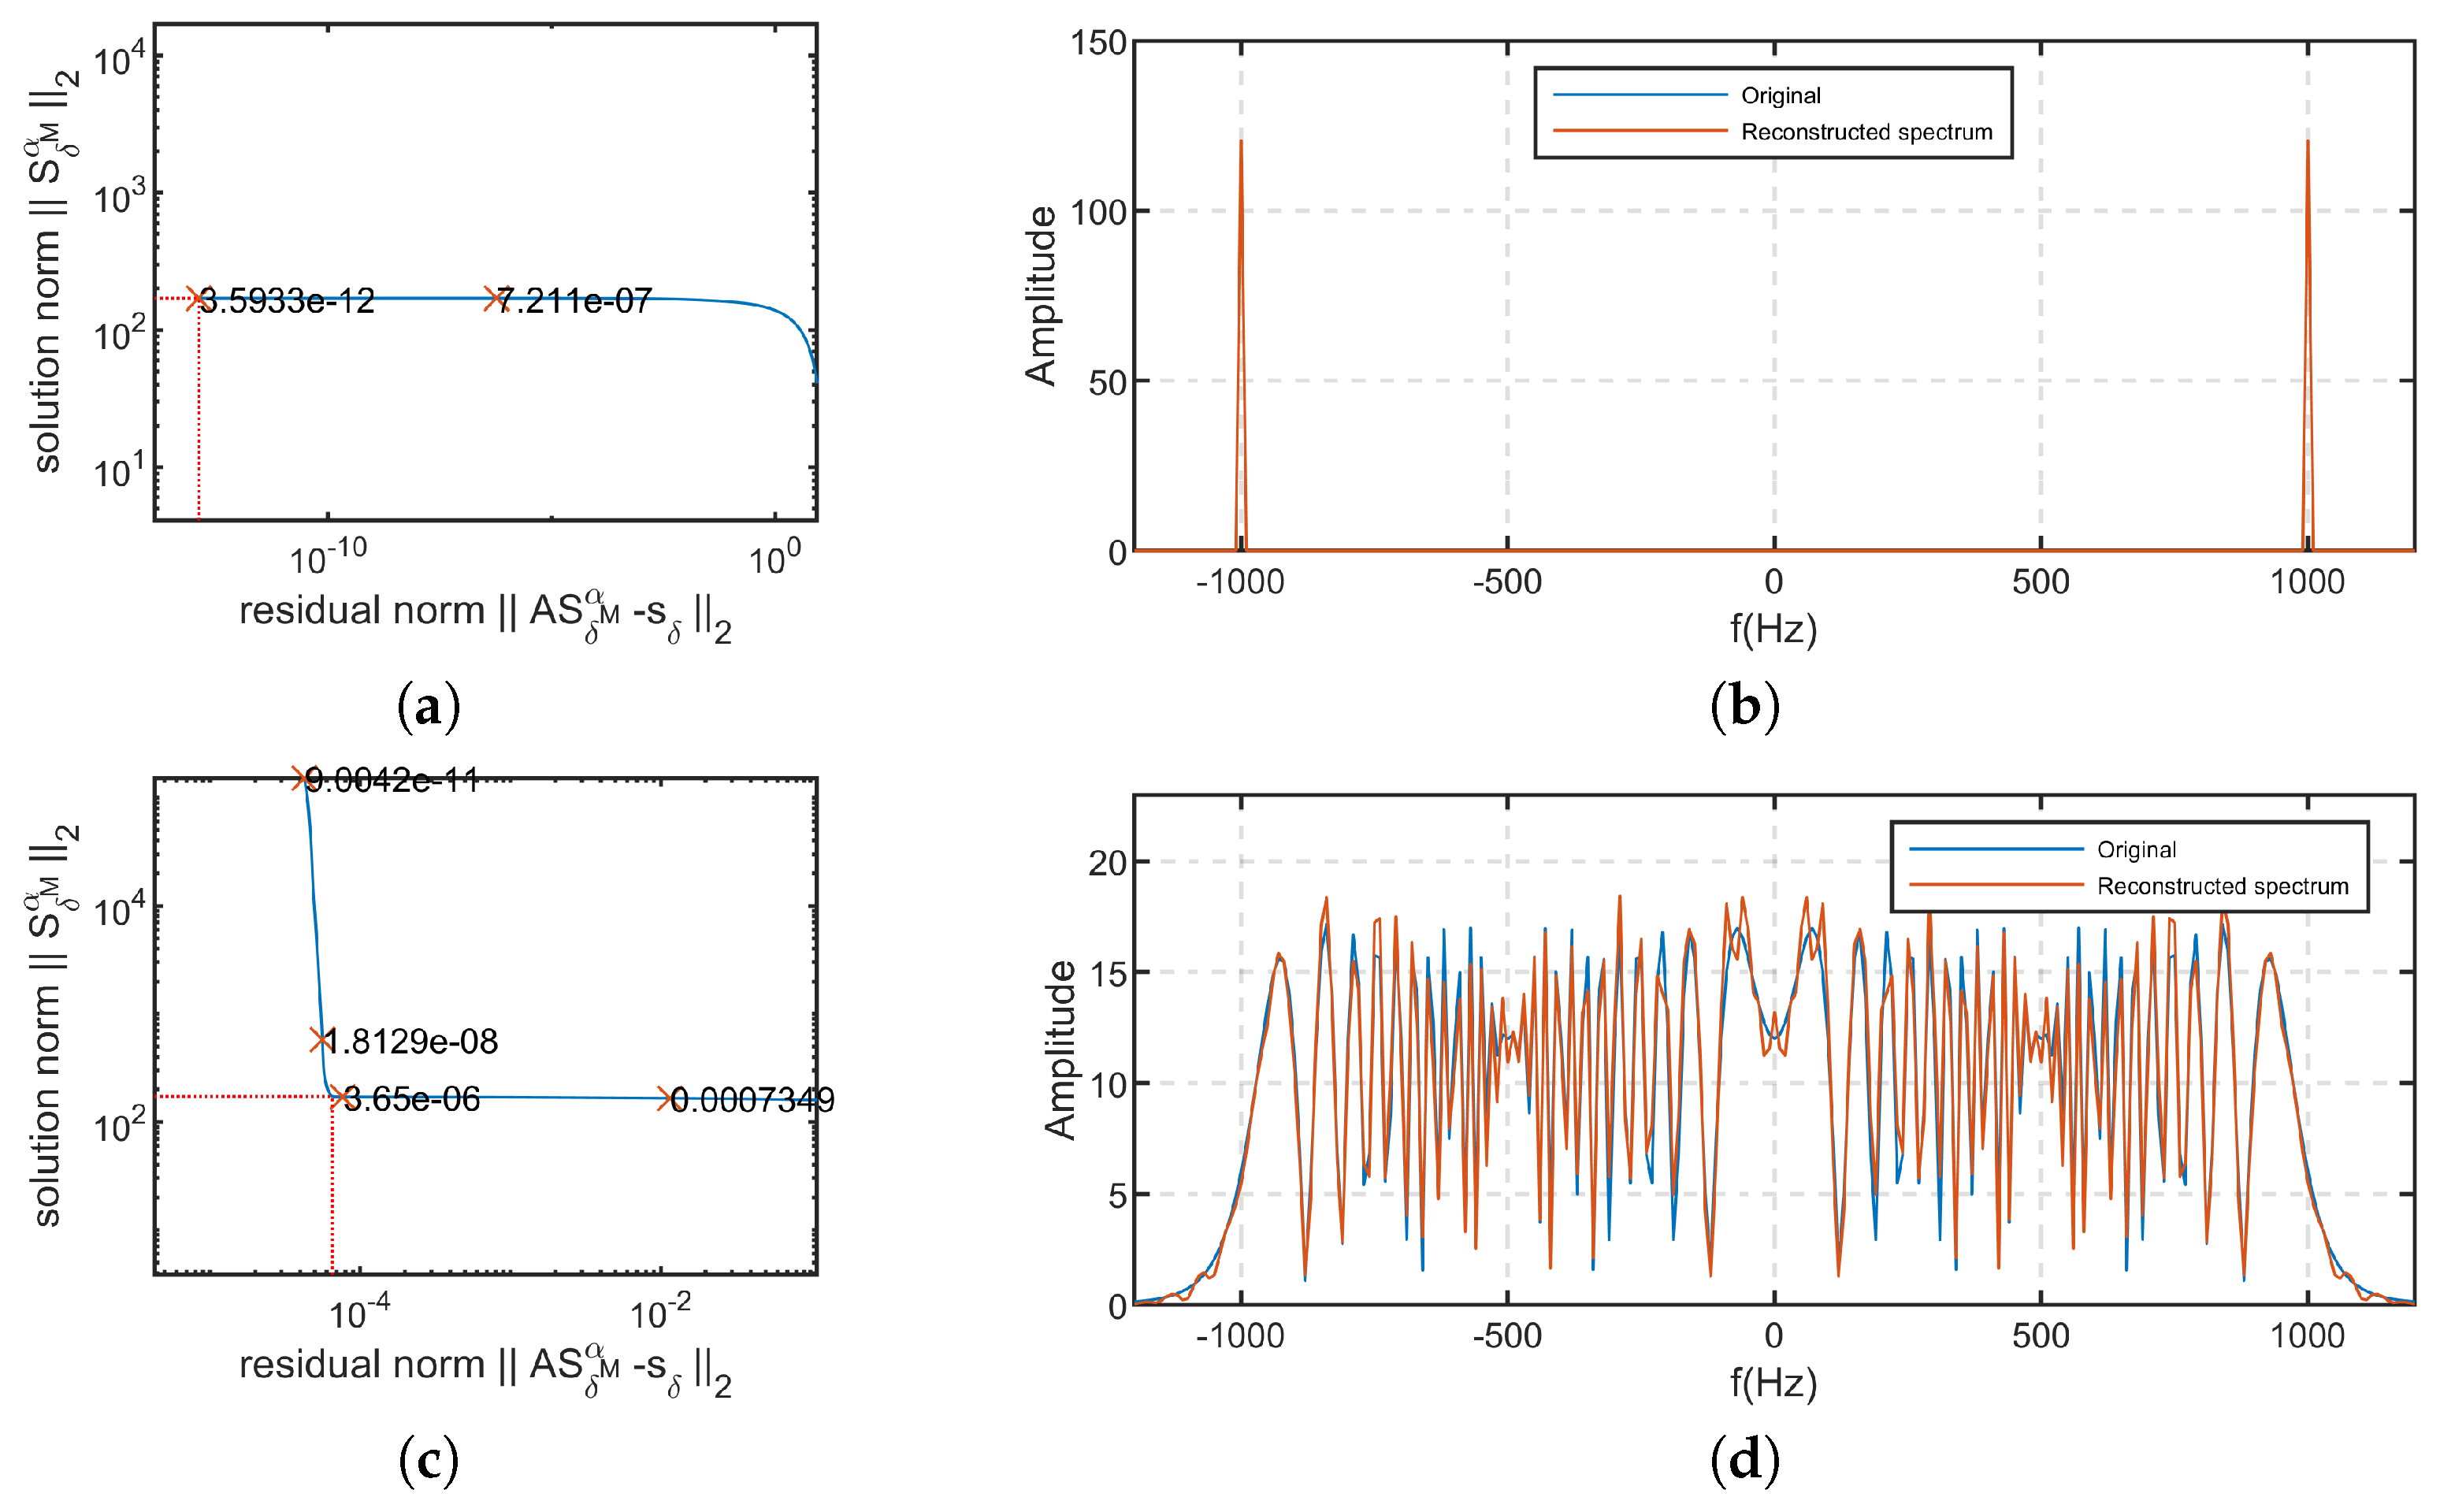
The solving results of
and
using the Tikhonov regularization method based on L-curve criterion are shown in
Figure 3. In
Figure 3a,c, the numbers marked with ‘x’ represent the values of regularization parameter at those points. The positions marked by the red dashed lines on L-curve indicate the points with maximum curvature. The selected regularization parameters are
for
and
for
. It can be observed from
Section 3.1 that the regularization parameter selected for
based on L-curve criterion is in the same order of magnitude as the one which minimizes the difference from true solution, and there is a very small error present. Compared to
,
is more affected by errors. Therefore, the L-curve exhibits a noticeable corner in
Figure 3c and the spectrum of
can be perfectly reconstructed in
Figure 3b. Moreover, by comparing the results in
Figure 3d, we can find that even under conditions where the influence of errors is significant, the proposed algorithm is still able to achieve satisfactory spectral reconstruction results.
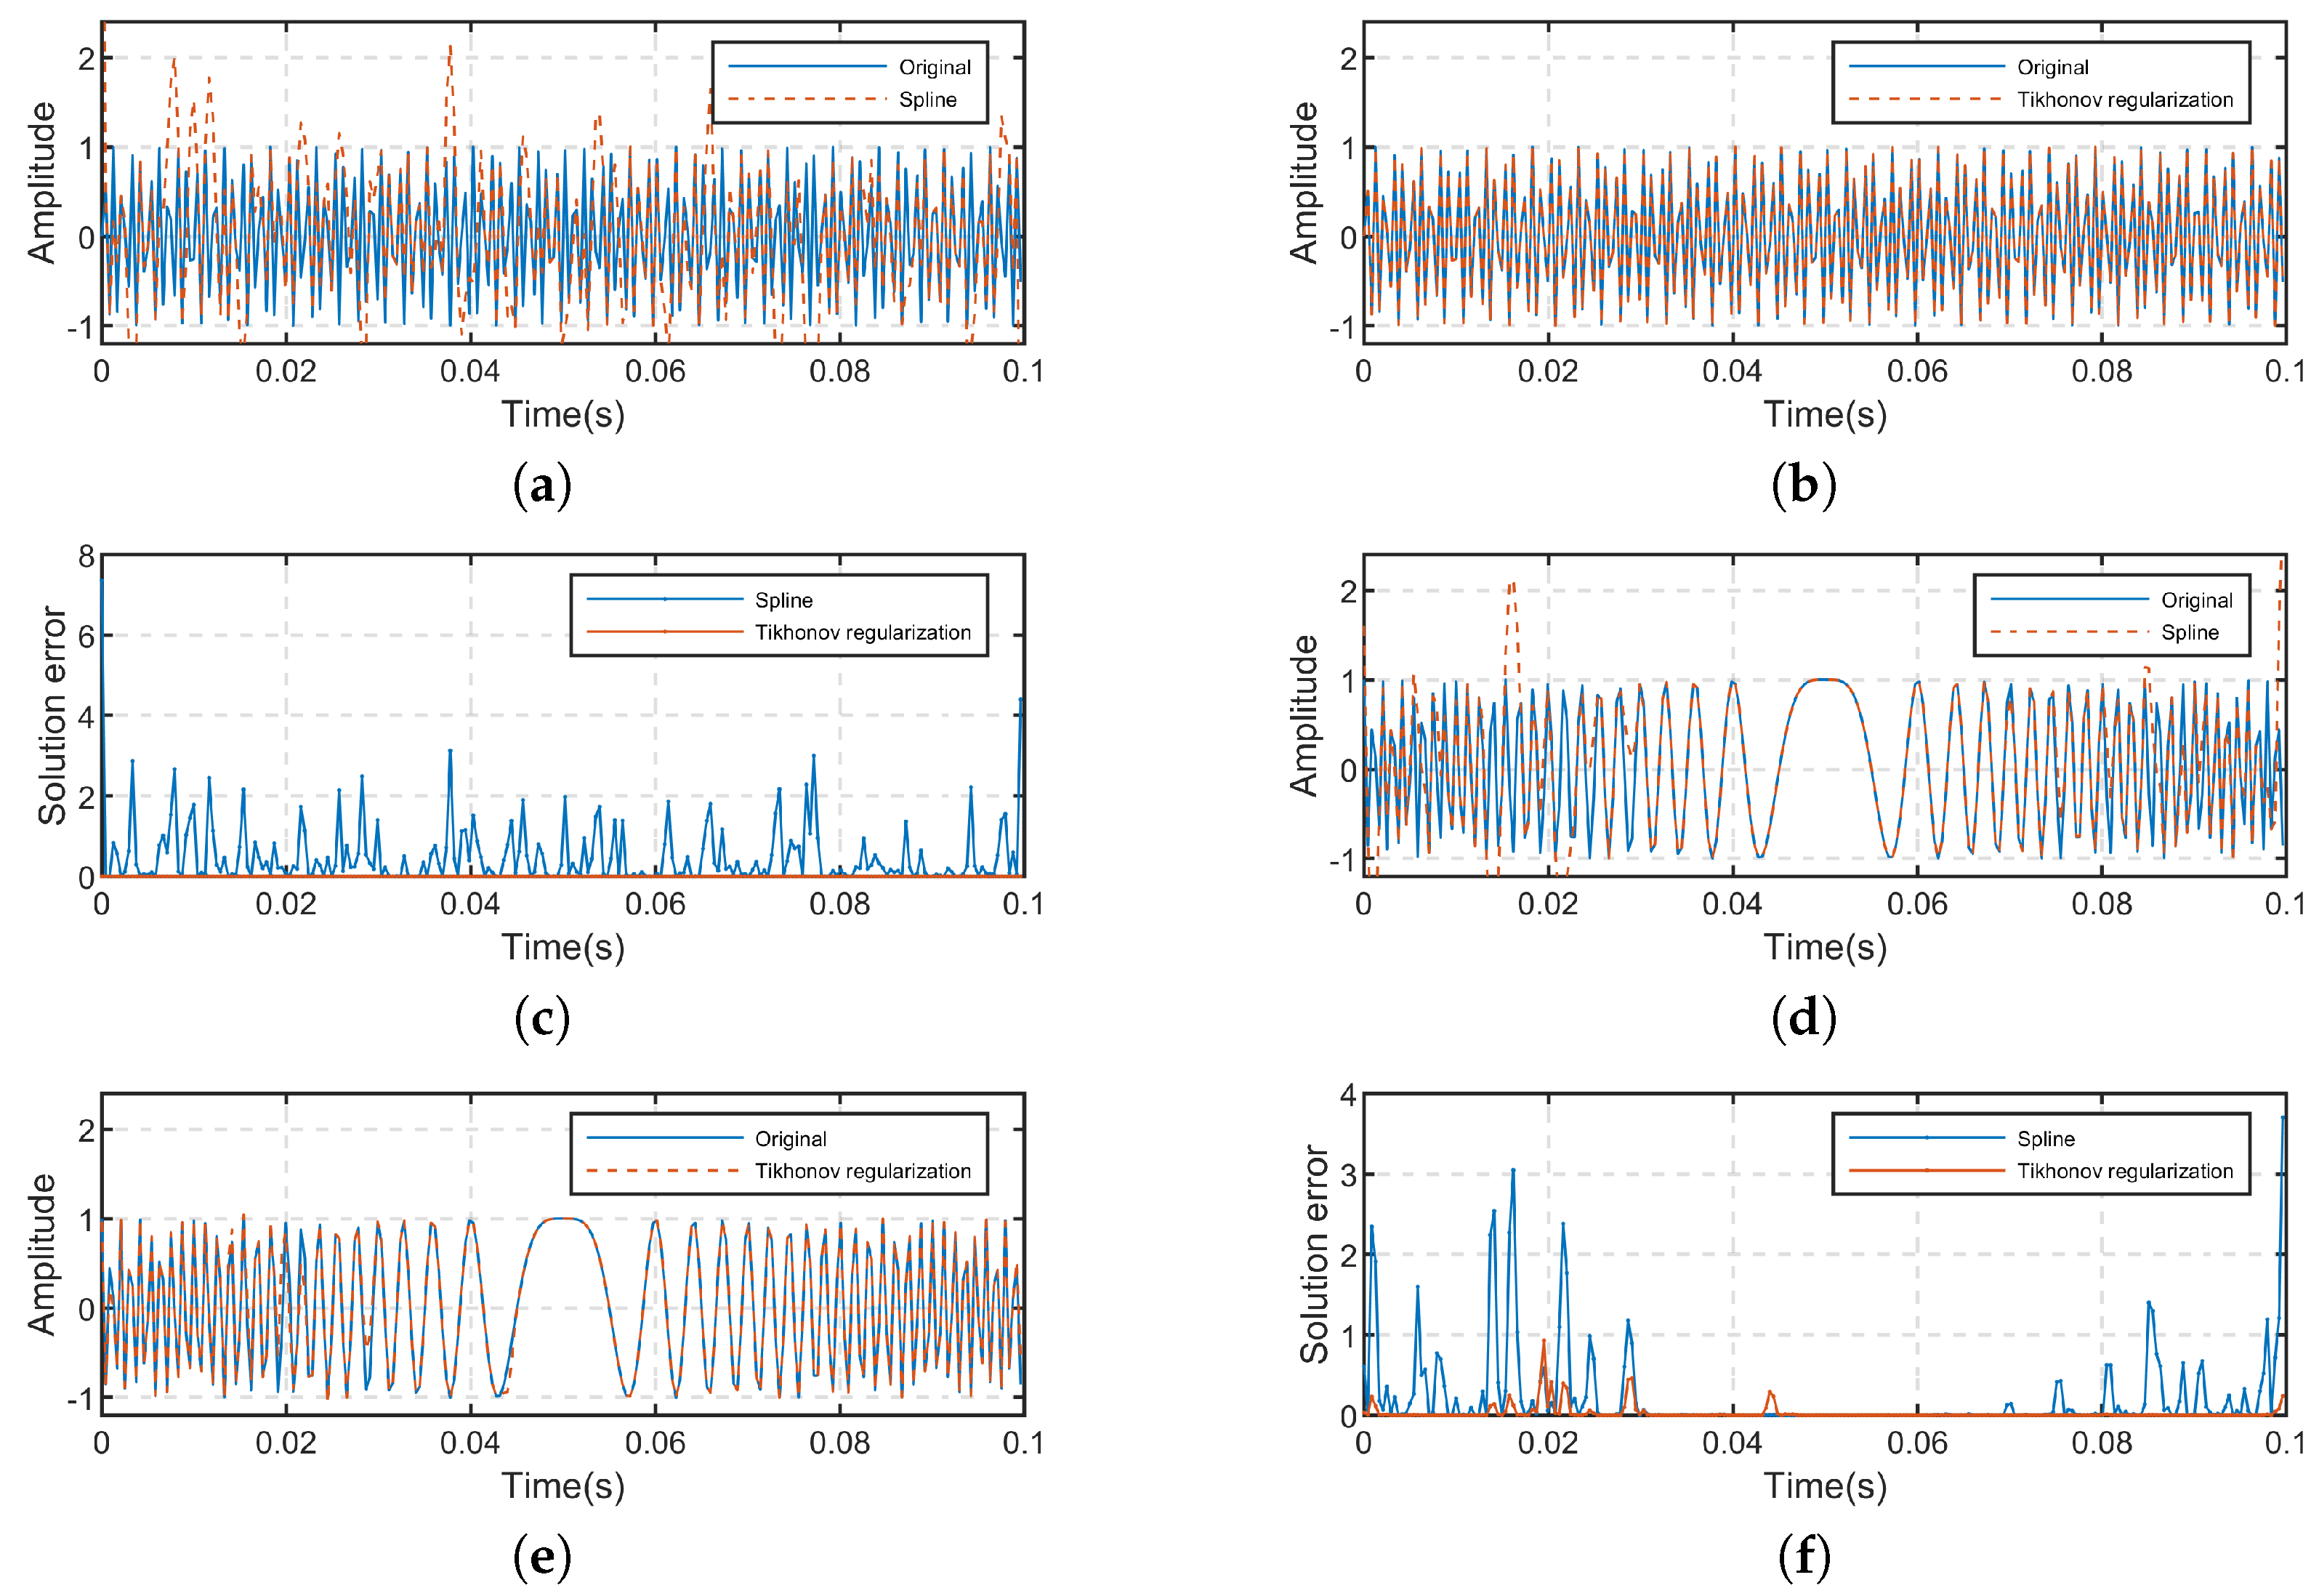
To further verify the effectiveness of the proposed algorithm, we transform the reconstructed signal’s spectrum to the time domain using discrete inverse Fourier transform and compare it with the results obtained through cubic spline interpolation. The cubic spline interpolation method is commonly used due to its simplicity and excellent stability, and it is also frequently employed in addressing the azimuth non-uniform sampling problem in SAR. Therefore, we compare the proposed method with the cubic spline interpolation.
Figure 4a–d shows the results of reconstructing
and
using both methods and comparing them with the original uniformly sampled signals.
Figure 4e,f illustrates the comparison results of solving errors between the two methods. This indicate that the proposed method significantly outperforms cubic spline interpolation in terms of reconstructing signals
and
. Particularly for
, the reconstruction result obtained through cubic spline interpolation is very poor due to spectral aliasing effect, while the proposed method can get accurately reconstruction results, with solution errors in the order of
.
In SAR signal processing, the azimuth echoes located in the same range direction can be approximated as LFM signals under certain conditions. Similar to the processing of SAR azimuth echoes, we multiply the reconstructed results of
obtained using the two methods by a phase function
in the frequency domain and perform the IFFT operation, where
K is the chirp rate of
.
Figure 5 shows the corresponding results and compares them with the pulse compression results of the original uniformly sampled signals. The results indicate that both cubic spline interpolation and the Tikhonov regularization method can correctly focus at
s after pulse compression. However, the result obtained using cubic spline interpolation exhibits higher sidelobes, while the Tikhonov regularization method is closer to the pulse compression result of original uniformly sampled signal. This also demonstrates the potential application of the proposed method in THz SAR azimuth non-uniform sampling problems. Further detailed discussions on this issue will be conducted in
Section 4.
6. Conclusions
For the problem of THz SAR with azimuth non-uniform sampling, this paper proposes a wavenumber spectrum reconstruction algorithm based on Tikhonov regularization. The proposed algorithm can be combined with conventional frequency domain imaging algorithms such as RDA, CSA, and RMA, and is applicable to different imaging distances, including vehicle-mounted and airborne scenarios. In this paper, the spectral reconstruction model for non-uniformly sampled signals is established. The principle of spectral reconstruction is derived using a Fourier series, demonstrating that the estimation accuracy of the spectrum depends on the high-frequency components beyond signal bandwidth and noise for finite-length approximately band-limited signals. The azimuth echo data are processed in the wavenumber domain without considering the complex factors of platform motion speed. Simulation and experimental results demonstrate the effectiveness of the proposed algorithm. Compared to azimuthal resampling algorithms, the proposed algorithm reduces the impact of spectral aliasing and achieves better imaging results. Compared to the BPA, it also has higher computational efficiency, making it more suitable for compensating the large azimuth motion errors in THz SAR. Additionally, the simulation analysis results not only demonstrate the good signal reconstruction performance of the proposed algorithm in THz SAR imaging but also indicate its wide application prospects in the field of signal recovery.
