Abstract
The GaoFen-14 satellite is primarily utilized for global high-precision positioning and generating 1:10,000 scale geographic information products, making it one of the most accurate stereo mapping satellites in China. With a long-stitched CCD (charge couple device) consisting of nine chips for the forward view camera and six chips for the backward view camera, it is crucial to validate the satellite’s geometric performance and achieve high uncontrolled global positioning precision. In this study, two calibration models were proposed for the on-orbit calibration of the GaoFen-14 satellite: one accounting for the inter-chip geometry constraint and another without the constraint. Correspondingly, five calibration schemes (A, B, C, D, and E) were designed, with varying settings of the external calibration parameters, interior parameters, and utilization of the optical axis measurement data. Schemes A and B utilized the same set of alignment angles for the forward and backward images and differed in the set of interior calibration parameters. Scheme A took a single set of interior calibration parameters for all chips within the same view, while Scheme B set independent interior calibration parameters for each chip in both the forward and backward views considering the inter-chip geometry constraint. Schemes C, D, and E set two groups of alignment angles for the forward and backward views, respectively. In addition, Schemes C, D, and E utilized GaoFen-14′s specific real-time recording data of the optical axis, incorporating a slight revision of the alignment angle calibration value using dichotomous search. The interior models of Schemes A and C were identical, and those of Schemes B and D were the same. In comparison with scheme D, scheme E only lacks the inter-chip geometry constraint. These five schemes were taken to validate the most suitable exterior model and interior model for the GaoFen-14 satellite. Calibration experiments were conducted using original multichip images and the stitched images from the Zhongwei, Ningxia, and Songshan (Henan) test fields. Additionally, four sets of data from around the world are used to verify the calibration effect. The results demonstrated significant improvements in uncontrolled positioning accuracy for all five calibration schemes, transitioning from the 100 m level to the meter or even the submeter level. However, Schemes A and B exhibited unstable controlled positioning accuracy, with fluctuations ranging from 1 m to 5 m. In contrast, Schemes C, D, and E achieved substantial enhancements in uncontrolled positioning accuracy, maintaining stability with variations ranging from 0.94 to 1.14 m in the X direction, 0.41 to 0.48 m in the Y direction, and 0.77 to 0.81 m in the Z direction. The positions of the CCD probes obtained from Schemes C and D demonstrated consistency, with over 80% of the probes falling within 0.1 pixels, and all of the sampled probes within 0.3 pixels. However, Scheme D behaves better in describing the geometric deformation of each CCD chip and keeping the integrity of the long-stitched CCD simultaneously. These experimental results validate the GaoFen-14 satellite’s ability to achieve stable uncontrolled positioning accuracy worldwide and a stable geometric structure between multichips. For the GaoFen-14 satellite, it is more appropriate to adopt two sets of alignment angles for the forward and backward views, respectively. As the satellite’s on-orbit operation time increases, it is recommended to employ Scheme D for monitoring inconsistent local geometric deformation in future calibration work.
1. Introduction
Optical satellites are an important means for global and regional remote sensing. On-orbit geometric calibration of a satellite is essential for achieving high precision of geometric positioning and ensuring long-term stability. While all optical satellite parameters undergo rigorous geometric calibration in the laboratory prior to launch, the rigid structure between payloads and the geometric parameters of the imaging sensor may experience changes due to the impact of satellite launch and long-time on-orbit operation factors. These changes can significantly affect the accuracy of satellite positioning. Therefore, conducting on-orbit calibration after the launch becomes crucial for maintaining optimal performance and ensuring the reliability of the satellite’s geometric positioning capabilities over time.
The French Space Agency performed static and dynamic parameter geometric calibration on the SPOT-5 satellite camera, achieving high positioning precision using worldwide distributed field calibration sites [1,2,3]. The German MOMS-2 satellite optimized and refined its geometric calibration parameters through the self-calibration block adjustment technique [4,5]. For the Japanese ALOS/PRISM camera, satisfactory geometric position accuracy was achieved by on-orbit geometric calibration with multiple field calibration sites [6,7,8]. Numerous on-orbit geometric calibration investigations were performed for the Indian IRS satellite [9,10] and Cartosat-1 satellite [11,12]. The United States IKONOS satellite achieved a 12 m planar positioning accuracy and 10 m vertical positioning accuracy by refining the camera’s geometric parameters [13,14]. Detailed studies were also conducted on the geometric calibration of the OrbView satellite [15] and the GeoEye satellite [16,17]. China’s SDGSAT-1 satellite [18], Mapping Satellite (TH) series [19,20], and Resource (ZY) satellite series [21,22] have all carried out extensive on-orbit calibration processing research, resulting in significant achievements.
Most mainstream optical mapping satellites, including IKONOS, QuickBird, WorldView-2, SPOT6/7, Pleiades 1A/1B, LandSat-8, GaoFen-7 [23,24], and GaoFen-14 satellite [25,26], currently utilize stitching techniques to achieve larger swath widths and shorter satellite revisit cycles. For the on-orbit calibration processing of stitched optical cameras, the traditional approach involves stitching multichip images together as a whole for the study of on-orbit calibration processing.
However, it has been observed that, when there are different geometric deformations between multichip images, processing the stitched panoramic image as a whole can result in a degradation in positioning accuracy. Therefore, it is necessary to study the distortions of each multichip independently during on-orbit calibration. Weser found relative displacements between different CCD chips of ALOS/PRISM cameras, and the lack of calibration for the relative placement parameters led to significant systematic residuals in the positioning results [27]. The finding highlights the need to utilize an extended model to account for the relative displacements of each CCD in subsequent work [28]. Zhang L. conducted DSM (digital surface model) generation experiments using three sets of IKONOS satellite images [29,30]. The first set consisted of stitched images that were not effectively aligned, while the remaining two sets corrected the relative displacements between multichip images. The test results demonstrated that achieving subpixel-level stitching of the multichip images was crucial for ensuring the accuracy of DSM production.
In the case of ZY-3 satellite images, Zhang Yongjun proposed a calibration method that accounted for the misalignment angle and displacements of multiple chips [31]. Wang Mi self-conducted self-calibration for the primary single TDI (time delayed and integration) CCD chip using a small range of absolute GCPs (ground control points), and then performed calibration for the secondary chips based on the connection points between coupled images and adjacent single TDI-CCD images [32]. Wang Tao proposed a geometric calibration method for spliced satellite optical cameras based on geometry constraints between chips. The experimental results on optical butting satellite ZY-3 and mechanical interleaving satellite TH-1 demonstrated that the proposed method yielded reliable calibration values for the alignment angle and interior parameters, resulting in high-precision seamless mosaic images with mosaic errors within one pixel [33,34].
Moreover, systematic investigations on the geometric calibration of satellites have revealed the presence of systematic time-varying errors in alignment angles, degrading geometric processing accuracy. Over the 10-year on-orbit operations of the ZY3-01 satellite, a comprehensive geometric calibration study was conducted on ten simultaneous NAD (Nadir)-forward (FWD)-backward (BWD) imagery acquired from 2012 to 2020. The results found that the boresight alignment angle of the China ZY3-01 satellite’s TLC (three-line camera) exhibited dynamic changes during long-periodic flights, with misalignments within 7 arc seconds for both FWD and BWD sensors [35]. Long-term observations have identified these long-periodic changes in the alignment angle, although previous satellites lacked efficient measurement equipment to track such changes. However, the GaoFen-14 satellite addresses this limitation by incorporating an innovative optical axis position measurement device. This device allows for the measurement of angle changes in the forward and backward cameras, as well as the star camera, relative to the reference component. It also measures the focal length changes of three cameras, enabling real-time monitoring of the angles and focal length changes during photography. Effectively utilizing the optical axis measurement data poses a challenging task.
Considering the stitching characteristics of the GaoFen-14 dual-line-array camera and its unique optical axis position measurement device, specific calibration methods are proposed for the on-orbit calibration of the GaoFen-14 satellite. The GaoFen-14 satellite utilizes optical butting imaging CCDs, with a long-stitched CCD consisting of nine chips for the forward view and a long-stitched CCD with nine chips for the backward view. However, local deformations between adjacent chips can significantly degrade the geoposition accuracy. To address this, we propose a calibration model that does not consider the internal errors of each CCD chip, as well as an integral geometric calibration model that incorporates inter-chip constraints. Five different calibration schemes are designed accordingly. Additionally, the optical axis measurement data are adopted in two calibration schemes to facilitate the on-orbit calibration process. Finally, several sets of GaoFen-14 satellite data from the Ningxia and Songshan (Henan) test fields and four other regions around the world were used for on-orbit geometric calibration and verification.
The contributions of this paper are as follows:
- (1)
- We developed a calibration model that accounts for the specific characteristics of the GaoFen-14 satellite, i.e., the integral geometric calibration model with inter-chip constraints.
- (2)
- Based on the characteristics of the long-stitched CCDs of the GaoFen-14 satellite and the specific real-time recording data of the optical axis, five calibration schemes are designed for its on-orbit geometric calibration.
- (3)
- Innovatively, GaoFen-14 specific real-time recording data of the optical axis are adopted in the orbit-calibration schemes C, D, and E, which apply slight revisions to the alignment angle calibration values using the dichotomous search approach.
2. GaoFen-14 Satellite Payload
The GaoFen-14 satellite is equipped with advanced multi-payload integrated Earth observation technology, including dual-line-array cameras, a hyperspectral camera, and a ranging laser. The dual-line-array cameras are specifically designed for stereo mapping tasks, featuring an intersection angle of 31°. The forward-view camera has a +26° incidence angle and utilizes a long-stitched CCD with nine chips, while the backward-view camera has a −5° incidence angle and uses a long-stitched CCD with six chips. Additionally, the backward-view camera can capture multispectral images. The panchromatic images obtained by the GaoFen-14 satellite have a ground resolution of 0.6 m, while the multispectral images have a ground resolution of 2.4 m. Both types of images cover a swath width of 40 km.
The hyperspectral camera is capable of capturing images across 100 electromagnetic wave bands, which include a 5 m resolution visible near-infrared band and a 10 m resolution short-wave infrared band. The swath width covered by the hyperspectral camera is 9.9 km. In terms of its imaging method, the GaoFen-14 camera employs optical stitching. The multichip CCDs are arranged as an equivalent long-line array through the use of an optical prism. Ideally, there should be zero misalignments of the CCD chips along the track direction, allowing for the formation of a continuous straight line in the focal plane. This design feature significantly reduces the challenges associated with geometric stitching and other subsequent image-processing tasks.
The satellite is also equipped with a three-beam laser ranging system arranged in a triangle pattern. This system is used to measure the slant distance at the moment of photography and record the unfiltered echo waveform. The laser ranging system also captures images of the laser ground footprint area, which can be utilized to determine the precise location of the laser point on the ground by comparing it with the dual-line array images. Moreover, the satellite platform incorporates two high-precision star cameras, capable of achieving a measurement accuracy of 1 arc second.
Additionally, a set of optical axis position measurement devices are installed, enabling the monitoring of angle change in the forward and backward cameras as well as the star camera relative to the reference component. This device acquires the relative attitude angles of the forward camera and the backward camera with respect to the reference component during on-orbit photography. The acquisition angle data describe the attitude changes of the imaging cameras. This device also facilitates the detection of focal length changes in the three cameras, enabling real-time monitoring of angle and focal length variations during photography.
3. Material and Methods
3.1. On-Orbit Calibration Model without Considering the Internal Error of the CCD Chips
For satellite-borne optical images, the rigorous imaging model can be established between the image point p and its corresponding ground point P:
where P(X, Y, Z) represents the coordinates of ground point P in the CGCS2000 coordinate system; represents the misalignment matrix; indicates the installation matrix from the camera system to the satellite body system, predetermined in the laboratory; is the rotation matrix from the satellite body system to space conventional inertial system (J2000) calculated using satellite attitude data; indicates the rotation matrix from the J2000 system to the CGCS2000 coordinate system; is the scaling coefficient; (XS, YS, ZS) are the GPS antenna phase center coordinates obtained from the satellite position measurement data; and are the coordinates of image point p, represented by the probe pointing angles . The initial value is calculated from the preliminary installation angle of each imaging view and the CCD detector unit size. The misalignment matrix absorbs systematic errors in the satellite orbit measurement data and attitude measurement data, as well as the camera mounting angle and GPS eccentricity constants. It is represented by the camera alignment angle , such that is the pitch angle, is the roll angle, and is the yaw angle. Figure 1 displays the geometric relationship of probe-pointing angles in the image space coordinate system.
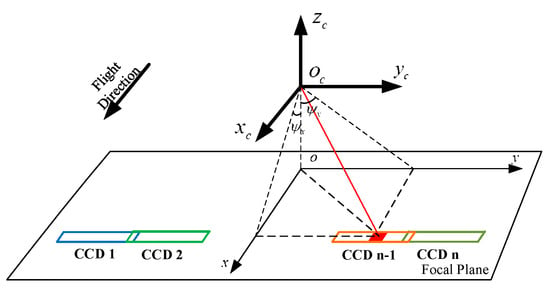
Figure 1.
Optical butting diagram of the Gaofen-14 dual-line-array camera.
The on-orbit geometric calibration of the satellite-borne optical cameras can be divided into two components: external calibration and internal calibration. External calibration focuses on determining the external error, i.e., the alignment angle . For multi-line array stereo observation cameras, such as TH-1 and ZY-3 optical cameras, is used to indicate the external error of the forward, nadir, and backward views. In practical scenarios, multiple views can either share a common set of or have different sets of . If multiple views share a set of , they are marked as the external calibration scheme W1. In contrast, if different sets of are utilized to indicate the external error in each view, they are marked as the external calibration scheme W2.
The internal geometric calibration focuses on calibrating the probe pointing angle of each detector unit in the camera system. There are two types of internal geometric calibration models: the physical model and the general model. In the calibration of airborne and satellite-borne line array cameras, the general model is more widely used. Wang Tao analyzed the differences and connections between the physical model and the general model and established the conversion relationship between them (Wang et al., 2020). For high-resolution optical cameras onboard satellites, it is recommended to use a general model with an order less than or equal to the three because of their small field view. In this paper, we adopt the third-order general model of the probe element number S, i.e.,
where c0, c1, c2, and c3 are the interior calibration parameters for each CCD in the direction and r0, r1, r2, and r3 are the interior calibration parameters for each CCD in the direction. Equations (1) and (2) can be expanded using a Taylor series approximation in the first order, which establishes the calibration model for the on-orbit calibration of the GaoFen-14 satellite.
3.2. Integral On-Orbit Calibration Model Taking into Account the Inter-Chip Geometry Constraints
The GaoFen-14 dual-line-array stereo mapping camera utilizes stitched CCD technology, which involves combining sub-strip images from each chip CCD to create a panoramic image. During the calibration process, if the CCD chip structure remains stable and the geometric deformation is consistent, the stitched panoramic image can be processed as an integral body. This means that the forward and backward views each adopt one group of internal calibration parameters, referred to as the internal calibration scheme N1. However, if the internal distortion of each CCD chip is different and changeable, an independent set of internal calibration parameters would be used for each chip. In this case, the forward view takes nine sets of internal calibration parameters, while the backward view takes six sets. This approach is referred to as the internal calibration scheme N2.
For the internal calibration, this paper proposes an integral geometric calibration method that incorporates inter-chip geometry constraints. In a spliced satellite optical camera, the overlapped area between adjacent chips represents the same ground coverage. This means that a single ground point corresponds to two image points in the adjacent overlapped chip area. Suppose that the ground point P(X, Y, Z) forms the image point p1(x1, y1) on the left chip and the corresponding image point p2(x2,y2) on the right chip. For image points p1 and p2, rigorous geometric imaging models are generated using Equations (3) and (4), where the multiple rotation matrices in Equation (1) can then be combined into Equation (5). For the image points p1(x1,y1) and p2(x2,y2), the scaling coefficient is considered to be the same.
where (XS1, YS1, ZS1) and (XS2, YS2, ZS2) are the GPS antenna centers corresponding to the left and right chips, respectively. R1 is the R rotation matrix for the image point p1(x1,y1) on the left chip and R2 is that of the image point p2(x2,y2).
Combining Equations (3) and (4), the geometry constraint model between adjacent chips can be constructed, as presented in Equation (6).
The inter-chip geometry constraint model captures the geometric relationship between corresponding points in the overlapping chip area. Theoretically, the corresponding image points on the left and right chips coincide on the same ground point. However, various factors including external and internal errors of different chips can undermine the geometry constraints (Equation (6)). Therefore, an integral geometric calibration model must be established that accounts for both external and internal errors based on Equation (6). After linearization and expanding the formula using a first-order Taylor series, the integral geometric calibration model based on inter-chip geometry constraints can be derived.
Equation (7) presents the integral geometric calibration model for spliced satellite optical cameras based on inter-chip geometry constraints and can be named as condition C. Based on this, the external calibration model (8) and the internal geometric model (9) based on inter-chip geometry constraints are developed:
The external calibration determines the alignment angle , while the internal calibration determines the interior calibration parameters c0, c1, c2, c3, r0, r1, r2, and r3. Models (1), (7), (8), and (9) are expanded according to the Taylor series to obtain the linearized equations for the alignment angle and the interior calibration parameters; therefore, the integral on-orbit calibration model taking into account the inter-chip geometry constraints can be established.
3.3. Correction of Alignment Angle Based on Optical Axis Position Measurement Data
Remote sensing satellites experience varying solar irradiation conditions as they orbit around Earth, resulting in alternating hot and cold thermal environments. Studies have shown that these changing conditions can introduce periodic errors in star sensors known as star sensor low-frequency errors. Additionally, the periodic changes in the solar irradiation angle cause uneven heating of the satellite’s overall structure. The relative installation parameters between the payloads also undergo periodic changes. These factors contribute to time-varying systematic errors in the alignment angle. These errors are crucial as they can impact the accuracy of geometric processing for optical satellite remote-sensing images.
Currently, this issue has attracted significant research interest. One proposed approach is based on ground-based detection, which involves the inversion and projection of the errors using a large amount of ground-based observation data. Wang [32] analyzed and detected time-varying systematic errors based on star-sensitive observation data from multiple orbits during satellite operation. Zhu [35] conducted a study on ZY3-01 TLC images from 2012 to 2020, revealing that the boresight alignment angles are dynamic during long-periodic flights, with variations in both FWD and BWD within 7 arc seconds. However, this approach requires a substantial amount of global data for continuous analysis, and the underlying patterns are difficult to uncover. Another approach is based on onboard satellite detection, where special payloads are added to measure and record attitude change data for regular analysis and error correction. The GaoFen-14 satellite is designed based on this idea and is equipped with an optical axis position measurement device. This device enables the acquisition of relative attitude changes of the forward camera, backward camera, and star camera with respect to the reference component during the on-orbit photography, providing a basis for alignment angle correction.
Figure 2 illustrates the principle of alignment angle correction based on optical axis position measurement data. Suppose that A, B, and C are three imaging moments during the on-orbit photography. A and B are imaging moments corresponding to the test fields A and B, and C is the imaging moment corresponding to the uncontrolled area. The angles of the forward or backward camera relative to the reference component are , provided by the optical axis position measurement device, and change periodically with the orbit cycle. The calibrated alignment angles of A and B are and , respectively, which are acquired from the geometric calibration of test fields. The angles provided by the optical axis position measurement device are and . The angles provided by the optical axis position measurement device for the C site are , and what is required is a reliable corrected alignment angle .
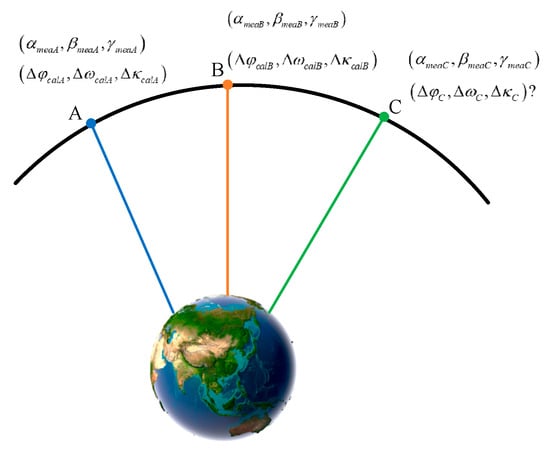
Figure 2.
Alignment angle correction principle based on optical axis position measurement data.
The reliable corrected alignment angle can be calculated as
Although the specific real-time recording data of the optical axis on the GaoFen-14 satellite reflect the periodic changes in the alignment angle, there is no direct functional correlation between the recorded values and the actual alignment angle. However, this relationship can be established by calculating the weights, denoted as , which are obtained through Equation (11), by taking the ratio between the alignment angle calibration values based on test fields and the observation data provided by the optical axis position measurement device.
are the minor adjusting values for . Because also exhibit periodic changes, it is important to consider the variations between the observation period and the calibration period. refer to the periodic change of the optical axis measurement data by Equation (12).
indicates the difference between imaging moments A and C in the current observation period; refers to the difference between imaging moments A and C in the previous calibration period; and the minor adjusting value is determined from the region by the dichotomous search, and the same for and .
4. On-Orbit Geometric Calibration Process and Schemes
The on-orbit geometric calibration process for the GaoFen-14 dual-line-array stereo mapping satellite is designed to incorporate two steps: the external calibration process and the internal calibration process. The two steps are independent and iterative to resolve the strong correlation between the exterior parameter and the interior parameters. The workflow diagram illustrating the steps of this calibration process is presented in Figure 3.
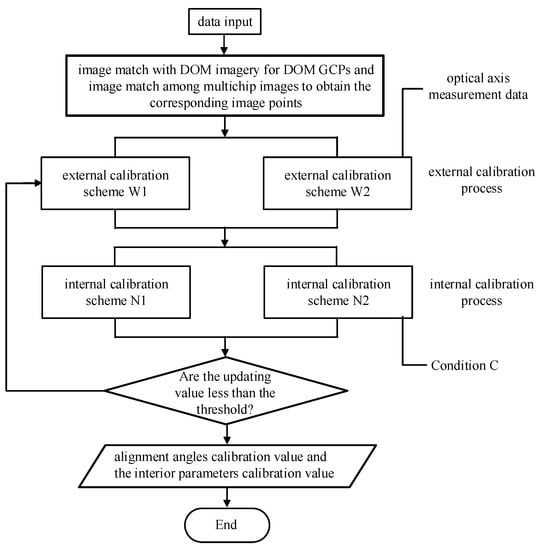
Figure 3.
On-orbit geometric calibration flow for the GaoFen-14 satellite.
The on-orbit geometric calibration process for the GaoFen-14 dual-line-array stereo mapping satellite includes the following steps:
- (1)
- Image matching is implemented on all chip images and the high-resolution digital orthophoto map (DOM) to automatically obtain the DOM ground control points (GCPs). The height value of GCPs can be interpolated from corresponding DEM (digital elevation model) data. Additionally, image matching is performed on the multichip images to obtain the corresponding image points in the overlap areas of adjacent chips.
- (2)
- External calibration is conducted using two external calibration schemes, W1 and W2. Scheme W1 calibrates the same set of alignment angles for both the forward and backward views. Scheme W2 calibrates two different sets of alignment angles separately for the forward view and the backward view. Furthermore, two sets of calibrated alignment angles through W2 are corrected using the optical axis position measurement data.
- (3)
- Internal calibration is carried out using two internal calibration schemes, N1 and N2, and condition C can be taken into account. With N1, the same set of interior calibration parameters, c0, c1, c2, c3, r0, r1, r2, and r3, is calibrated for multi-chip images of the forward and backward views, resulting in the determination of two sets of interior calibration parameters. With N2, an independent set of interior calibration parameters is calibrated for each chip, leading to the calculation of nine sets of interior calibration parameters for the forward view and six sets for the backward view.
- (4)
- The external calibration and internal calibration are performed iteratively, and the iteration cycle continues until the updated values of the alignment angle and interior calibration parameters are below the threshold values. Finally, the alignment angles and the interior calibration parameters are output as the calibration results. The interior calibration parameters are then used to generate the probe pointing angle of each CCD unit on the forward and backward views.
Accordingly, five different on-orbit calibration schemes are formulated and used in the experiment.
- On-orbit geometric calibration scheme AThe external calibration uses scheme W1, utilizing the same set of alignment angles for the forward and backward images. The internal calibration uses scheme N1, employing a single set of interior calibration parameters for all chips within the same view.
- On-orbit geometric calibration scheme BThe external calibration is performed using scheme W1, which utilizes the same set of alignment angles for the forward and backward images. The internal calibration uses scheme N2 and condition C is taken into account, where independent interior calibration parameters are determined for each chip in both the forward and backward views.
- On-orbit geometric calibration scheme CThe external calibration uses scheme W2, which involves two sets of alignment angles for the forward and backward views. The internal calibration follows scheme N1, utilizing a single set of interior calibration parameters for all chips within the same view. Moreover, the two sets of calibrated alignment angles are further refined by incorporating the optical axis position measurement data.
- On-orbit geometric calibration scheme DThe external calibration adopts scheme W2, with two sets of alignment angles for the forward and backward views, respectively, and the internal calibration adopts scheme N2 and condition C, with independent inner calibration parameters for each chip in the forward/backward view image. Moreover, two sets of calibrated alignment angles are corrected using the optical axis position measurement data.
- On-orbit geometric calibration scheme EAll of the internal and external calibration settings of scheme E are identical to those of scheme D, except that scheme E does not consider condition C.
These five schemes are designed to validate the following goals:
- Whether it is more appropriate for the forward and backward images share the same set of alignment angles or to involve two independent sets of alignment angles for the GaoFen-14 satellite calibration, with the support of the optical axis position measurement data.
- Whether there is independent and inconsistent geometric distortion among different CCD chips.
5. Results and Discussion
5.1. Experiment Data
The calibration test fields located in Zhongwei, Ningxia, and Songshan (Henan), China, were selected for the on-orbit calibration experiments on the GaoFen-14 dual-line-array stereo mapping satellite. The resulting on-orbit geometric calibration results were validated using four sets of images from various locations worldwide.
The Ningxia calibration test field’s primary dataset consists of an aerial remote sensing image captured in 2020, with a resolution of 20 cm and covering an area of about 100 km × 340 km. These images were processed to generate high-precision DOM and DEM data, meeting the accuracy requirements of the 1:2000 scale topographic map. To establish the initial positions of control points, GaoFen-14 satellite images were matched with the DOM data. The positions of image points were then further refined through manual editing. For the calibration experiments, the GaoFen-14 satellite captured three tracks of strip images of the Ningxia calibration field on 27 December 2020, 31 December 2020, and 4 January 2021, respectively. From each track, four consecutive scenes of images were intercepted for calibration purposes, shown in yellow, white and blue color boxes. The image coverage of the Ningxia calibration site is shown in a 5 cm resolution orthoimage in CGCS2000 (China Coordinate System 2000) (Figure 4).
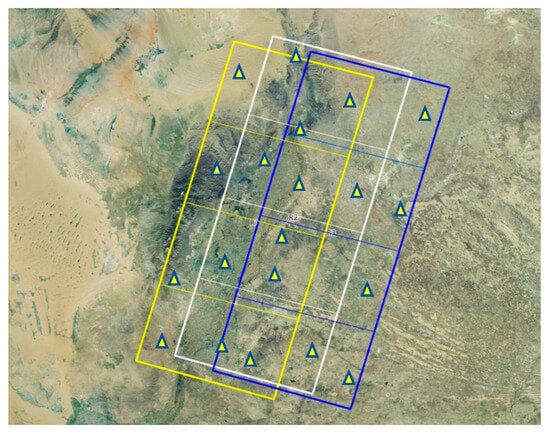
Figure 4.
Distribution of GaoFen-14 Satellite images over the NingXia calibration test field.
The Songshan calibration test field is situated in Dengfeng, Henan Province, China, covering an area of approximately 8000 square kilometers [36]. On site, a large number of high-precision control points were established, marked by natural and artificial characteristics. Aerial remote sensing images with resolutions ranging from 10 cm to 40 cm were acquired and used in the production of the DOM, DEM, and DSM datasets. The GaoFen-14 satellite acquired three tracks of strip images of the Songshan calibration test field on 3 March, 22 March, and 26 March 2021. In addition, four consecutive scenes of images were selected from each track for the calibration experiments, shown in green, white and yellow color boxes. The image coverage of the Songshan calibration site is shown in a 5 cm resolution orthoimage in CGCS2000 (China Coordinate System 2000) (Figure 5).
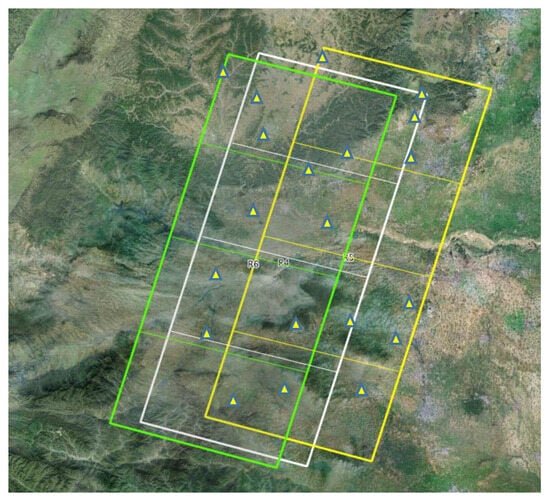
Figure 5.
Distribution of GaoFen-14 satellite images over Henan Songshan calibration test field.
In addition to the two calibration test fields, four sets of data from different regions around the world were used to evaluate the accuracy and stability of the on-orbit calibration of GaoFen-14. The validation data consisted of regions, in Guangzhou, Tibet, Hetian Xinjiang province, and South Africa. There were nine ground control points (GCPs) in the validation data (1) from the Guangzhou area, and their distribution is shown in Figure 6. Four CGPs were in Tibet, and their distribution is shown in Figure 7. Eleven GCPs were used in the validation data (3) of Hetian Xinjiang province, while three GCPs were employed in the validation data (4) of South Africa. The validation images encompassed diverse topographic features including high mountains, hills, plains, and cities, providing a robust assessment of the accuracy and stability of the on-orbit calibration.
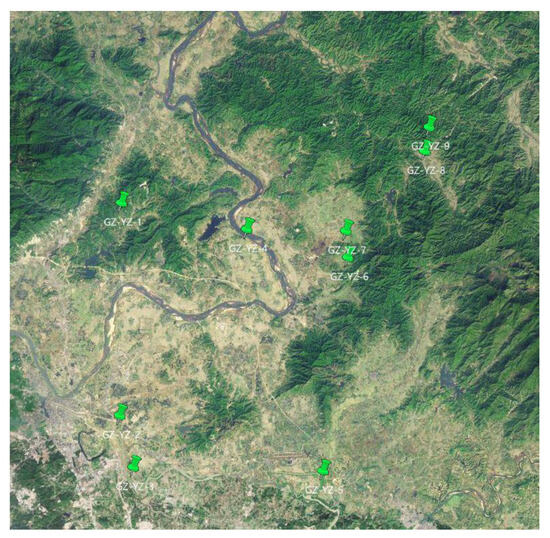
Figure 6.
Distribution of GCPs over the Guangzhou area.
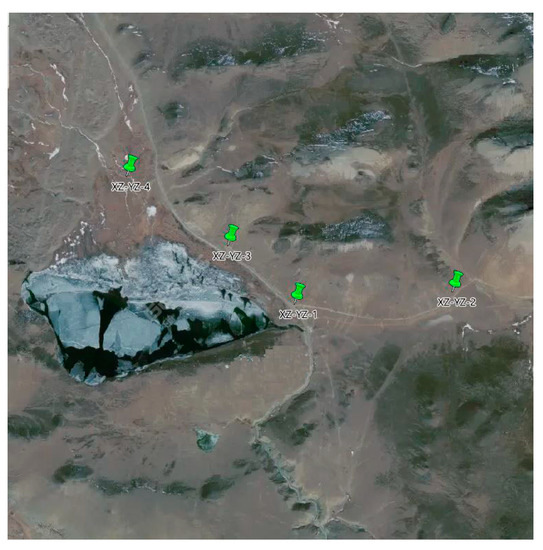
Figure 7.
Distribution of GCPs over the Tibet area.
5.2. Experimental Results and Analysis
(1) On-orbit geometric calibration experiment based on the calibration test field
Five schemes (A, B, C, D, and E) were implemented for the calibration experiments using the Ningxia and Songshan calibration test fields. The scheme design involved using the stitched panoramic image for calibration in schemes A and C, while schemes B, D, and E use the unstitched multichip images. The stitched panoramic image is generated from a direct mosaic of multichip images without any geometric transform. Only the left overlapping area is reserved and the right adjacent area is cropped out. For the Ningxia calibration test field, a significant number of GCPs were obtained by image matching using our self-developed software. Out of these GCPs, 20 control points were selected as independent checkpoints to evaluate the accuracy of the on-orbit calibration. The distribution of the 20 control points is shown in Figure 4, and the 20 control points should be in an even and wide distribution pattern.
For the Songshan calibration field, in addition to GCPs obtained through field measurements with RTK (real-time kinematic) equipment, a considerable number of GCPs were also acquired through image matching. Twenty GCPs obtained through field measurements were retained as checkpoints for accuracy evaluation, and the distribution of twenty GCPs is shown in Figure 5.
Using the rigorous imaging model (1), the initial geoposition accuracy and the calibrated geoposition accuracy of the GaoFen-14 dual-line-array camera were calculated using the forward space intersection approach. The pre-calibration geoposition accuracy was determined based on the original satellite ephemeris data and laboratory camera parameters, whereas the post-calibration geoposition accuracy was computed using the alignment angles and the interior parameters’ calibration values. The root mean square errors between the calculated values and the measured GCP values were used as the accuracy evaluation index, and the geometric accuracy statistics are presented in Table 1. Figure 8 plots out the direct positioning residuals of 20 check GCPs of 22 March 2021 Songshan data before calibration. Figure 8a plots out the planar positioning residuals and Figure 8b plots out the height positioning residuals. Figure 9 plots out the positioning residuals of 20 check GCPs of 22 March 2021 Songshan data after calibration with scheme D. Figure 9a plots out the planar positioning residuals and Figure 9b plots out the height positioning residuals. Figure 8 is displayed in 1:25,000 scale and Figure 9 is displayed in 1:300 scale.

Table 1.
Statistics of the on-orbit calibration results based on two calibration test fields (unit: m).
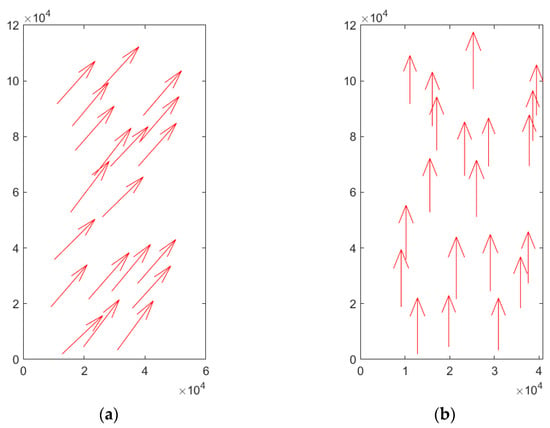
Figure 8.
Direct positioning residuals of 22 March 2021 Songshan data pre-calibration (unit: m). (a) Planar and (b) height direction.
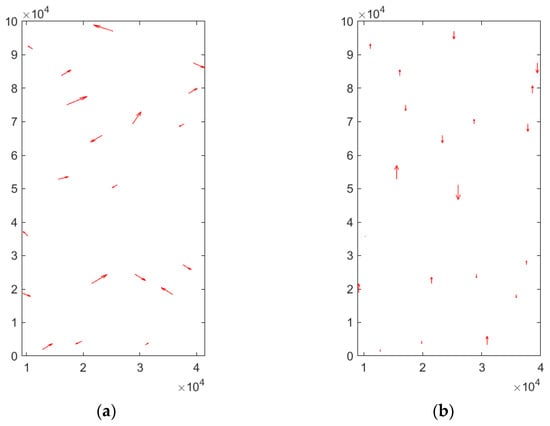
Figure 9.
Positioning residuals of 22 March 2021 Songshan data after calibration with scheme D (unit: m). (a) Planar and (b) height direction.
As shown in Table 1 and Figure 8 and Figure 9, the initial positioning accuracy of each group was consistently poor prior to calibration. The X-direction plane error ranged from 154 m to 168 m, the Y-direction plane error ranged from 207 m to 232 m, and the Z-direction elevation error ranged from 172 m to 186 m. Following the on-orbit geometric calibration, a significant improvement in image positioning accuracy was observed for all four schemes. The calibration accuracy of the four calibration schemes achieved values below 0.4 m and within 1 pixel in the X, Y, and Z directions, indicating effective compensation for systematic errors. The calibration values for the alignment angle and the interior parameters obtained from the Ningxia image on 4 January 2020, are presented in Table 2 and Table 3.

Table 2.
Alignment angle on-orbit calibration values (unit: radians).

Table 3.
Interior parameters’ calibration values of the forward camera.
To compare schemes A, B, C, D, and E in depth, we plot out the pointing probe curves for the forward camera in Figure 10 and Figure 11. Figure 10 plots out the pointing probe curve in the x direction (the obit flight direction); Figure 10a shows the overall curve and Figure 10b displays the local details to provide a more vivid description. Figure 11 plots out the pointing probe curve in the y direction (vertical to the obit flight direction); Figure 11a shows the overall curve and Figure 11b displays the local details.
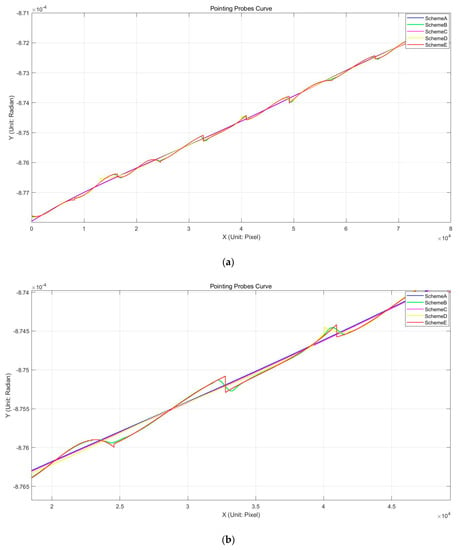
Figure 10.
The pointing probe curve of the forward camera in the orbit flight direction. (a) The overall pointing probe curve of the forward camera. (b) The local details of the pointing probe curve.
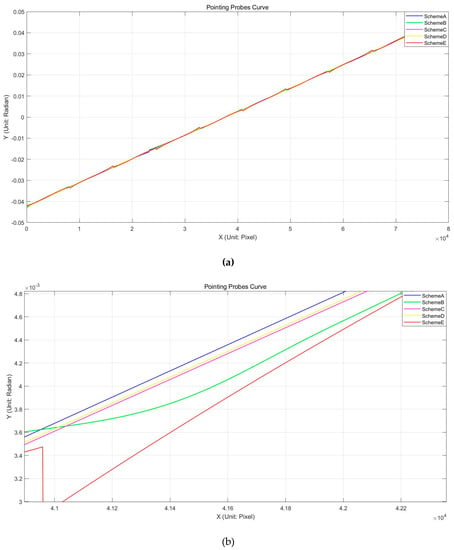
Figure 11.
The pointing probe curve of the forward camera across the orbit flight direction. (a) The overall pointing probe curve of the forward camera. (b) The local details of the pointing probe curve.
From Table 3 and Figure 10 and Figure 11, we can see obvious multi CCD overlay structures. For scheme A and scheme C, only the general shape of the long-stitched CCD is reflected and the details are lost. For schemes B, D, and E, the deformation of each CCD is described in detail and the independent deformation variation is displayed. For scheme E, there exists significant displacement among CCD chips due to the lack of inter-chip geometry constraint. Schemes B and D well illustrate the deformation of each CCD and maintain the consistency between adjacent CCD chips.
(2) On-orbit geometric calibration validation experiment
To ensure the reliability and applicability of the alignment angle and interior parameters obtained from the on-orbit calibration, it is necessary to evaluate the calibration parameters using additional data outside of the calibration field. The calibration values obtained from the Ningxia test field and the Songshan test field are denoted as CANning and CANsong, respectively. Four sets of verification data were used to conduct uncontrolled positioning experiments, wherein the GCPs in each verification area were employed to assess the effectiveness and applicability of the calibration parameters by comparing the uncontrolled positioning accuracy before and after calibration. The results of these experiments are shown in Table 4.

Table 4.
Statistics of uncontrolled positioning accuracy based on CANning and CANsong (unit: m).
From Table 4, it is evident that the use of CANning and CANsong calibration values has resulted in a significant improvement in the uncontrolled positioning accuracy of all four sets of image data. The accuracy transitioned from the 100 m level to the meter level or even the submeter level, indicating the applicability and effectiveness of the calibration values. However, there is noticeable instability in the uncontrolled positioning accuracy for schemes A and B, with large fluctuations ranging from over 1 m to nearly 5 m. On the other hand, the calibration values of schemes C, D, and E significantly improved the uncontrolled positioning accuracy, exhibiting remarkable stability across the four sets of validation data. The accuracy in the X direction ranges from 0.94 m to 1.14 m, in the Y direction from 0.41 m to 0.48 m, and in the Z direction from 0.77 m to 0.81 m. These findings suggest that schemes A and B lack the adoption of optical axis real-time measurement data for correcting the alignment angle calibration value, resulting in affected and unstable uncontrolled positioning accuracy for different latitude regions. In contrast, schemes C, D, and E achieve stable and consistent uncontrolled positioning accuracy for the GaoFen-14 dual-line-array satellite.
Through comprehensive observation of the optical axis position measurement data, it was found that the maximum difference among measurements is two seconds. From Table 4, it can be observed that the variations in schemes A and B range from 1.93 m to 4.89 m in the X direction, 1.02 m to 3.32 m in the Y direction, and 1.25 m to 3.45 m in the Z direction. From the designed orbit height of 500 km, the maximum estimated uncontrolled positioning accuracy variation is 4.8 m. The latitude differences of the four sets of validation data to the two test fields do not exceed 180 degrees, indicating that the uncontrolled positioning variation for schemes A and B aligns with the changes in the optical axis position measurement data.
When comparing Schemes C and D, the main difference between them lies in the approach to interior calibration parameters for multi-chip images. Scheme C uses a single set of interior calibration parameters for both forward and backward images, while scheme D employs independent interior calibration parameters for each chip. In the presence of local distortion and displacement between multi-chips, these variations can lead to significant differences in the pointing angles obtained by the two schemes. For further comparison and analysis, the interior parameter calibration values of schemes C and D were used to calculate the positions of CCD probes in the forward and backward images. A sampling approach was applied, selecting every 50th probe as a sample, and the differences between the two schemes were recorded. The statistical values are shown in Table 5 and Figure 12.

Table 5.
Evaluation of the calibration values of the interior parameters between schemes C and D.
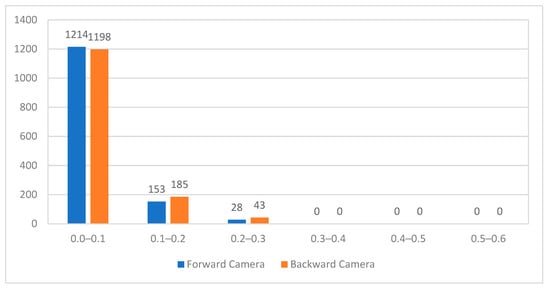
Figure 12.
Probe differences between schemes C and D.
The results presented in Table 5 and Figure 12 indicate a high level of consistency in the positions of the CCD probes obtained through the two internal calibration methods. More than 80% of the probes exhibited differences of less than 0.1 pixels, while all of the sampled probes differed by no more than 0.3 pixels. These findings confirm the stable geometric relationship between the multi-chip CCDs of the GaoFen-14 dual-line-array satellite, with no evidence of local internal geometric deformation. Currently, both schemes C and D can be employed for the on-orbit calibration of the satellite. However, as the satellite’s operational time increases, inconsistent local geometric deformation can occur among the multi-chip CCDs of the dual-line-array camera. In such cases, scheme D, which incorporates inter-chip constraints, can prove more effective. Therefore, using both schemes C and D for comparison and change monitoring in the later calibration work is a reasonable and effective choice.
For a more comprehensive analysis of the uncontrolled positioning accuracy, the uncontrolled positioning results of the Guangzhou area and the validation data (3) were selected. Figure 13 displays the positioning residuals in X, Y, and Z directions for all GCPs in the Guangzhou data, as obtained using scheme C from Table 4. Similarly, Figure 14 plots the positioning residuals for the validation data (3) from Table 4.
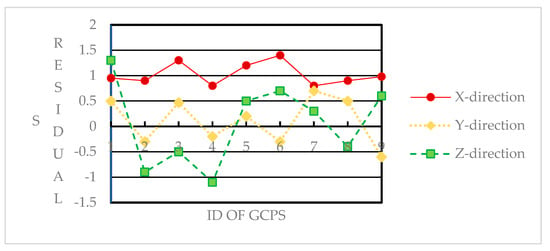
Figure 13.
Statistics of uncontrolled positioning accuracy of the Guangzhou area.
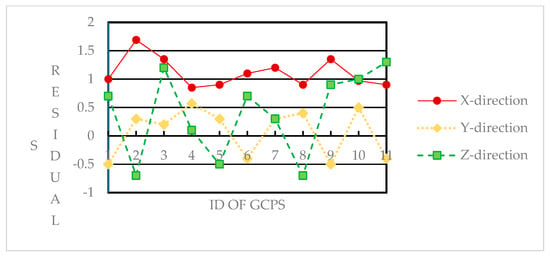
Figure 14.
Statistics of uncontrolled positioning accuracy of the Hetian area.
From the analyses of Figure 13 and Figure 14, it can be seen that the residuals in the Y and Z directions for both validation datasets exhibited oscillations around zero, with the mean value closely approaching zero. This suggests that the calibrated alignment angle and interior parameters effectively compensate for systematic errors in these directions. However, the overall residual curve in the X direction showed oscillations around the 1 m line, indicating the presence of residual systematic errors in this direction. These errors can be mitigated through subsequent block adjustments using a few GCPs. The experimental results highlight the effectiveness of the optical axis position measurement device in correcting alignment angles and achieving consistent uncontrolled positioning accuracy across the Earth. As the GaoFen-14 satellite continues to orbit, prolonged observations of the optical axis position measurement data will further enhance its utility in uncontrolled geopositioning.
6. Conclusions
The primary objective of the GaoFen-14 satellite is to acquire continuous and high-quality stereo images globally, enabling the production of accurate uncontrolled mapping products. To ensure precise global positioning, the satellite incorporates an optical axis position measurement device, which plays a crucial role in the on-orbit geometric calibration of GaoFen-14.
In this paper, we presented two calibration models for the on-orbit calibration of the GaoFen-14 satellite. The first model treats all of the CCD chips in the same view as a whole and considers just one set of interior parameters for each camera, while the second model treats each CCD chip separately and incorporates geometry constraints between the chips. We designed five calibration schemes and outlined the specific calibration processes. Moreover, we introduced the use of optical axis position measurement data to correct the calibrated alignment angle. The on-orbit geometric calibration of the GaoFen-14 satellite was evaluated based on the Ningxia and Songshan calibration test fields. To validate the effectiveness of the calibration, we utilized four sets of data from different locations worldwide. The experimental results demonstrate that, even without the technical support of worldwide calibration test fields, the uncontrolled positioning accuracy of the GaoFen-14 satellite can achieve an RMS within 1.14 m in the X direction, 0.48 m in the Y direction, and 0.81 m in the Z direction, meeting the original design objectives.
However, there remains a residual systematic error of approximately 1 m in the X direction, which requires further investigation and analysis. In the future, we will continue to exploit the properties of the optical axis position measurement data and hope to advance the uncontrolled geopositioning accuracy to a higher level.
Author Contributions
Conceptualization, T.Z. and Y.Z. (Yan Zhang); methodology, T.W., Y.Z. (Yan Zhang), and Y.Z. (Yongsheng Zhang); software, T.W. and Y.Z. (Yan Zhang); validation, Y.Y. and T.Z.; formal analysis, T.Z.; writing—original draft preparation, T.W. and Y.Z. (Yan Zhang); writing—review and editing, L.L. (Lei Li) and L.L. (Li Li); visualization, L.L. (Lei Li). All authors have read and agreed to the published version of the manuscript.
Funding
This research received no external funding.
Data Availability Statement
The study did not report any data.
Conflicts of Interest
The authors declare no conflict of interest. The funders had no role in the design of the study; in the collection, analyses, or interpretation of data; in the writing of the manuscript; or in the decision to publish the results.
References
- Grün, A. Potential and limitations of highresolution satellite imagery. In Proceedings of the 21st Asian Conference on Remote Sensing, Taipei, Taiwan, 4–8 December 2000; Swiss Federal Institute of Technology, Institute of Geodesy and Photogrammetry: Zurich, Switzerland, 2000. [Google Scholar]
- Bouillon, A.; Breton, E.; Lussy, F.D.; Gachet, R. SPOT5 geometric image quality. In Proceedings of the IEEE International Geoscience & Remote Sensing Symposium, Toulouse, France, 21–25 July 2003; pp. 303–305. [Google Scholar]
- Valorge, C.; Meygret, A.; Lebègue, L.; Henry, P.; Bouillon, A.; Gachet, R.; Breton, E.; Léger, D.; Viallefont, F. Forty years of experience with SPOT in-flight calibration. In Proceedings of the International Workshop on Radiometric and Geometric Calibration, Gulfport, MS, USA, 2–5 December 2003; pp. 119–133. [Google Scholar]
- Ebner, H.; Kornus, W.; Ohlhof, T.; Putz, E. Orientation of MOMS-02/D2 and MOMS-2P/PRIRODA imagery. ISPRS J. Photogramm. Remote Sens. 1999, 54, 332–341. [Google Scholar] [CrossRef]
- Kornus, W.; Lehner, M.; Schroeder, M. Geometric in-flight calibration of the stereoscopic line-CCD scanner MOMS-2P. ISPRS J. Photogramm. Remote Sens. 2000, 55, 59–71. [Google Scholar] [CrossRef]
- Kocaman, S.; Gruen, A. Orientation and self-calibration of ALOS PRISM imagery. Photogramm. Rec. 2008, 23, 323–340. [Google Scholar] [CrossRef]
- Tadono, T.; Shimada, M.; Hashimoto, T.; Takaku, J.; Mukaida, A.; Kawamoto, S. Results of calibration and validation of ALOS optical sensors, and their accuracy assesments. In Proceedings of the 2007 IEEE International Geoscience and Remote Sensing Symposium, Barcelona, Spain, 23–28 July 2007; pp. 3602–3605. [Google Scholar]
- Gruen, A.; Kocaman, S.; Wolff, K. Calibration and validation of early alos/prism images. J. Jpn. Soc. Photogramm. Remote Sens. 2007, 46, 24–38. [Google Scholar]
- Jacobsen, K. Issues and methods for in-flight and on-orbit calibration. In Proceedings of the International Workshop on Radiometric and Geometric Calibration, Gulfport, MS, USA, 2–5 December 2003; Volume 2, pp. 83–92. [Google Scholar]
- Radhadevi, P.V.; Solanki, S.S.; Ramchandran, R.; Krishnan, R. Pre-processing considerations of IRS-P6 LISS-4 imagery. Int. J. Appl. Earth Obs. Geoinf. 2008, 10, 133–139. [Google Scholar] [CrossRef]
- Kocaman, S.; Wolff, K.; Gruen, A.; Baltsavias, E. Geometric validation of Cartosat-1 imagery. Int. Arch. Photogramm. Remote Sens. Spat. Inf. Sci. 2008, 37, 1363–1368. [Google Scholar]
- Baltsavias, E.; Kocaman, S.; Akca, D.; Wolff, K. Geometric and radiometric investigations of Cartosat-1 data. In Proceedings of the ISPRS Hannover Workshop 2007, “High Resolution Earth Imaging for Geospatial Information”, Hannover, Germany, 29 May–1 June 2007; Volume 12, pp. 224–234. [Google Scholar]
- Grodecki, J.; Dial, G. Ikonos geometric accuracy. In Proceedings of the Joint Workshop of ISPRS Working Groups I/2, I/5 and IV/7 on High Resolution Mapping from Space 2001, Hanover, Germany, 19–21 September 2001. [Google Scholar]
- Grodecki, J.; Lutes, J. IKONOS geometric calibrations. In Proceedings of the ASPRS 2005 Annual Conference, Baltimore, MD, USA, 7–11 March 2005. [Google Scholar]
- Mulawa, D. On-orbit Geometric Calibration of the Orbview-3 high Resolution Imaging Satellite. Int. Arch. Photogramm. Remote Sens. Spat. Inf. Sci. 2004, 35, 1–6. [Google Scholar]
- Aguilar, M.A.; Aguilar, F.J.; Mar Saldaña, M.D.; Fernández, I. Geopositioning Accuracy Assessment of GeoEye-1 Panchromatic and Multispectral Imagery. Photogramm. Eng. Remote Sens. 2012, 78, 247–257. [Google Scholar] [CrossRef]
- Crespi, M.; Colosimo, G.; De Vendictis, L.; Fratarcangeli, F.; Pieralice, F. GeoEye-1: Analysis of Radiometric and Geometric Capability. In Personal Satellite Services, Proceedings of the Second International ICST Conference, PSATS 2010, Rome, Italy, 4–5 February 2010; Springer: Berlin/Heidelberg, Germany, 2010; pp. 354–369. [Google Scholar]
- Li, X.; Li, L.; Zhao, L.; Jiao, J.; Jiang, L.; Yang, L.; Chen, F.; Sun, S. In-Orbit Geometric Calibration for Long-Linear-Array and Wide-Swath Whisk-Broom TIS of SDGSAT-1. IEEE Trans. Geosci. Remote Sens. 2023, 61, 1–14. [Google Scholar] [CrossRef]
- Wang, J.; Wang, R.; Hu, X.; Su, Z. The on-orbit calibration of geometric parameters of the Tian-Hui 1 (TH-1) satellite. ISPRS J. Photogramm. Remote Sens. 2017, 124, 144–151. [Google Scholar] [CrossRef]
- Zhang, Y.; Wang, T.; Feng, W.; Yuan, Z.; Wang, S. Self-calibration Block Adjustment for Mapping Satellite-1 Three Linear CCD Images. J. Remote Sens. 2015, 19, 219–227. [Google Scholar]
- Jiang, Y.; Zhang, G.; Wang, T.; Li, D.; Zhao, Y. In-Orbit Geometric Calibration without Accurate Ground Control Data. Photogramm. Eng. Remote Sens. 2018, 84, 485–493. [Google Scholar] [CrossRef]
- Yang, B.; Pi, Y.; Li, X.; Yang, Y. Integrated geometric self-calibration of stereo cameras onboard the ZiYuan-3 satellite. ISPRS J. Photogramm. Remote Sens. 2020, 162, 173–183. [Google Scholar] [CrossRef]
- Cao, H.; Dai, J.; Zhang, X.; Zhao, C.; Liu, F.; Guo, A.; Xu, C. Study on the Development Approach of GF-7 High Precision Optical Stereo Mapping Satellite. Spacecr. Recovery Remote Sens. 2020, 41, 17–28. [Google Scholar]
- Tang, X.; Liu, C.; Zhang, H.; Wang, X.; Li, G.; Mo, F.; Li, F. GF-7 Satellite Stereo Images Block Adjustment Assisted with Laser Altimetry Data. Geomat. Inf. Sci. Wuhan Univ. 2021, 46, 1423–1430. [Google Scholar]
- Wang, J.; Yang, Y.; Hu, Y.; Lü, Y.; Yang, X.; Lu, X.; Cao, B. Preliminary Location Accuracy Assessments of GF-14 Stereo Mapping Satellite Without Ground Control Points. Acta Geod. Cartogr. Sin. 2023, 52, 8. [Google Scholar]
- Lu, X.; Wang, J.; Yang, X.; Lv, Y.; Hu, Y.; Wei, Y.; Cao, B. High-precision On-orbit Geometric Calibration of the GF-14 Satellite Dual-line-array Cameras. Acta Geod. Cartogr. Sin. 2023, 52, 15. [Google Scholar]
- Weser, T.; Rottensteiner, F.; Willneff, J.; Fraser, C. A generic pushbroom sensor model for high-resolution satellite imagery applied to SPOT 5, QuickBird and ALOS data sets. Int. Arch. Photogramm. Remote Sens. Spat. Inf. Sci. 2007, 36, 6. [Google Scholar]
- Weser, T.; Rottensteiner, F.; Willneff, J.; Poon, J.; Fraser, C.S. Development and testing of a generic sensor model for pushbroom satellite imagery. Photogramm. Rec. 2008, 23, 255–274. [Google Scholar] [CrossRef]
- Zhang, L.; Gruen, A. Automatic DSM generation from linear array imagery data. Int. Arch. Photogramm. Remote Sens. Spat. Inf. Sci. 2004, 35, 128–133. [Google Scholar]
- Zhang, L.; Gruen, A. Multi-image matching for DSM generation from IKONOS imagery. ISPRS J. Photogramm. Remote Sens. 2006, 60, 195–211. [Google Scholar] [CrossRef]
- Zhang, Y.; Zheng, M.; Xiong, J.; Lu, Y.; Xiong, X. On-Orbit Geometric Calibration of ZY-3 Three-Line Array Imagery with Multistrip Data Sets. IEEE Trans. Geosci. Remote Sens. 2014, 52, 224–234. [Google Scholar] [CrossRef]
- Wang, M.; Cheng, Y.; Tian, Y.; He, L.; Wang, Y. A New On-Orbit Geometric Self-Calibration Approach for the High-Resolution Geostationary Optical Satellite GaoFen4. IEEE J. Sel. Top. Appl. Earth Obs. Remote Sens. 2018, 11, 1670–1683. [Google Scholar] [CrossRef]
- Wang, T.; Zhang, Y.; Zhang, Y.; Zhang, Z.; Xiao, X.; Yu, Y.; Wang, L. A Spliced Satellite Optical Camera Geometric Calibration Method Based on Inter-Chip Geometry Constraints. Remote Sens. 2021, 13, 2832. [Google Scholar] [CrossRef]
- Wang, T.; Meng, W.; Zhang, Y. Linear Sensors Geometric Calibration and Positioning Technology and Application; Science Press: Beijing, China, 2020; ISBN 978-7-03-064508-1. [Google Scholar]
- Zhu, X.; Tang, X.; Zhang, G.; Liu, B.; Hu, W.; Pan, H. Long-Periodic Analysis of Boresight Misalignment of Ziyuan3-01 Three-Line Camera. Remote Sens. 2022, 14, 1157. [Google Scholar] [CrossRef]
- Wang, T.; Zhang, Y.; Zhang, Y.; Jiang, G.; Zhang, Z.; Yu, Y.; Dou, L. Geometric Calibration for the Aerial Line Scanning Camera GFXJ. Photogramm. Eng. Remote Sens. 2019, 85, 643–658. [Google Scholar] [CrossRef]
Disclaimer/Publisher’s Note: The statements, opinions and data contained in all publications are solely those of the individual author(s) and contributor(s) and not of MDPI and/or the editor(s). MDPI and/or the editor(s) disclaim responsibility for any injury to people or property resulting from any ideas, methods, instructions or products referred to in the content. |
© 2023 by the authors. Licensee MDPI, Basel, Switzerland. This article is an open access article distributed under the terms and conditions of the Creative Commons Attribution (CC BY) license (https://creativecommons.org/licenses/by/4.0/).