Abstract
Earth observation (EO) techniques have significantly evolved over time, covering a wide range of applications in different domains. The scope of this study is to review the research conducted on EO in the Eastern Mediterranean, Middle East, and North Africa (EMMENA) region and to identify the main knowledge gaps. We searched through the Web of Science database for papers published between 2018 and 2022 for EO studies in the EMMENA. We categorized the papers in the following thematic areas: atmosphere, water, agriculture, land, disaster risk reduction (DRR), cultural heritage, energy, marine safety and security (MSS), and big Earth data (BED); 6647 papers were found with the highest number of publications in the thematic areas of BED (27%) and land (22%). Most of the EMMENA countries are surrounded by sea, yet there was a very small number of studies on MSS (0.9% of total number of papers). This study detected a gap in fundamental research in the BED thematic area. Other future needs identified by this study are the limited availability of very high-resolution and near-real-time remote sensing data, the lack of harmonized methodologies and the need for further development of models, algorithms, early warning systems, and services.
1. Introduction
Earth observation (EO) via remote sensing technologies provides information about our planet’s physical, chemical, and biological systems [1]. This type of information is crucial in regions which are exposed in various risks (e.g., climate change, droughts, floods, earthquakes, and landslides) and where ground data are scarce [2,3,4,5], such as the Eastern Mediterranean, Middle East, and North Africa (EMMENA) region [6].
We define EMMENA as the geographical region which includes the following countries: Algeria, Bahrain, Cyprus, Egypt, Iran, Iraq, Israel, Jordan, Kuwait, Lebanon, Libya, Malta, Morocco, Oman, Palestine, Qatar, Saudi Arabia, Syria, Tunisia, Turkey, United Arab Emirates, and Yemen (Figure 1). The EMMENA region hosts approximately 558 million people, covers an area of 12,046,012 km2, and is one of the most diverse regions in the world in economic terms, with per capita annual gross domestic products (GDP) ranging from USD 533 in Yemen to USD 66838 in Qatar [7].

Figure 1.
Countries of the EMMENA region.
The region has a rich history and cultural heritage but has also been exposed to various risks over the decades [8]. The EMMENA region has been suffering from geopolitical tensions, political instability, and conflicts [8]. Furthermore, population growth and expanding urbanization in the EMMENA region have increased the pressure on ecosystems and on available resources [9,10,11,12]. In addition, this region has been characterized as a climate change hot spot, leading to increasing temperatures, extended droughts, and a decline in rainfall [13,14]. The agricultural sector, of which 70 percent is rainfed, is highly exposed to changing climatic conditions [14]. This is of critical importance as the agriculture sector contributes significantly to the national economies of many EMMENA countries. Additionally, climate change will have negative impacts on many other aspects including air quality, human health, land ecosystems, marine ecosystems, freshwater resources, and energy demand [15,16]. Finally, many countries of the EMMENA region are situated on complex topography and on tectonically active areas, thus are prone to hazards related to landslides and earthquakes [17].
EO plays a crucial role in understanding processes on our planet, enabling us to advance our monitoring capabilities over various domains of interest [18]. The information generated from EO enables researchers and decisionmakers to formulate and apply effective policies for environmental protection and sustainable management of natural resources. The amount of freely accessible EO data has been increasing over the years, mainly due to technological advancements and the implementation of open data policies. For example, the yearly volume of open and freely available satellite data increased from 0.25 PB in 2013 (MODIS and Landsat missions) to 4.25 PB in 2019 (MODIS, Landsat, and Sentinel missions) [19]. These data provide the opportunity to expand our knowledge in many thematic areas including atmosphere, water, agriculture, land, disaster risk (reduction), cultural heritage, energy, and marine safety and security. However, due to the expanding amount of data, there is a need for novel solutions to properly store, process, disseminate, and analyze these big Earth data sets [18].
The ongoing development of big Earth data techniques and the increasing availability of satellite EO data provide opportunities to better monitor the aforementioned thematic areas [20,21]. As the EMMENA region is a fairly new segment for EO activities, there are many opportunities to expand in EO research [6]. However, it is crucial to document first the current EO applications per thematic area and to identify the existing knowledge gaps. Currently, review papers on EO are focusing on specific thematic areas [22,23,24,25,26,27,28,29]. To the best of our knowledge, there are no review papers available on the full range of EO applications. Furthermore, review studies on EO in the EMMENA region are limited. The aim of this scoping review is to fill this gap by focusing on the wide range of EO applications in the EMMENA region. The specific objectives of this study are to (1) provide an overview of EO studies in the EMMENA region per thematic area and per country; and (2) identify the EO applications and explore the existing limitations and knowledge gaps of the research with the highest impact per thematic area.
2. Materials and Methods
Similar to Imane et al. [30], the search strategy consisted of three steps (Figure 2):
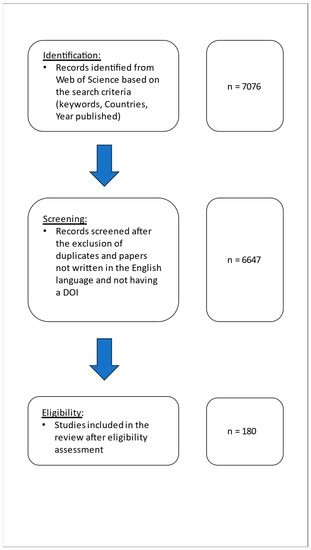
Figure 2.
Flow diagram of the scoping review methodology.
Identification: The key word searches were conducted in the Web of Science™ database to find articles about EO in the EMMENA region for the past five years. As search terms, we selected the “Topic” option which searched journals’ title, abstract, and keywords for the following keywords: “Remote sensing OR Satellite OR Earth observations OR GIS OR geographical information systems”. With the ‘’AND Topic” option, we constrained the research to the EMMENA region by inserting the following keywords: “Algeria OR Bahrain OR Cyprus OR Egypt OR Iran OR Iraq OR Israel OR Jordan OR Kuwait OR Lebanon OR Libya OR Malta OR Morocco OR Oman OR Palestine OR Qatar OR Saudi Arabia OR Syria OR Tunisia OR Turkey OR United Arab Emirates OR Yemen”. Additionally, with the “AND Year published” option we further constrained the search to the past five years by inserting the following: “2018–2022”.
Screening: Duplicates and articles not written in the English language and not having a digital object identifier (DOI) were excluded from the analysis. The relevance of the papers was further examined by consulting the keywords, titles, and abstracts. Furthermore, in case of uncertainty the full texts were evaluated. Articles of which their study area covered more than one country were named as “regional”. Author names and affiliations, the journal title, keywords, and abstracts, the number of citations, and the DOI were exported and analyzed in Excel® (Microsoft, Redmond, Washington, DC, USA) and in ArcGIS Pro (ESRI, Redlands, CA, USA).
Eligibility: The papers were categorized into the following thematic areas based on the relevant EO applications (Table 1): Atmosphere (ATM), water (WAT), agriculture (AGR), land (LAN), disaster risk reduction (DRR), cultural heritage (CH), energy (EN), marine safety and security (MSS), and big Earth data (BED). The latter thematic area, which includes data mining and information extraction, machine learning and artificial intelligence, visual exploration and semantic enrichment, and geoinformation, can also be considered as a horizontal thematic area as its applications are often supplementary to the rest of the thematic areas. Articles which were not classified into any of the above thematic areas were named as “other” and articles which were classified into more than one thematic area were named as “interdisciplinary”. Thus, some articles were categorized into more than one thematic area. Assuming that citations are a relevant measure of the impact of an article, the top 20 highly cited articles (up to 13 March 2023) from each thematic area were included in the review. The categorization was carried out by two people, the person responsible for the overall review and an independent reviewer for each country.

Table 1.
Indicative EO Applications per thematic area.
The analysis included the citation topics at the micro level, which were downloaded from Web of Science™. The citation topics at the micro level included 2437 topics which were algorithmically derived with the use of an algorithm developed by CWTS, Leiden [31]. Also, the analysis included the top 10 affiliations and the top 25 authors with the highest number of publications and their affiliations. Finally, data for the population, area, and gross domestic product (GDP) of each country within the EMMENA region were taken from the World Bank [7] and the International Monetary Fund [32] (Table 2).
Table 2.
Population (Po), area (A), per capita gross domestic product (GDP.P.C), and number of author and co-author affiliations (A.A) per country, as percentage of the total number of affiliations and author affiliations per capita (A.A.P.C) for EMMENA countries (measured in ppm). Data were taken from the World Bank [7] and the International Monetary Fund [32].
3. Results
3.1. Overview of EO Studies in the EMMENA Region
The total number of publications on EO applications in the EMMENA region from 2018 to 2022 was 7076. Following the exclusion of articles not written in the English language and not having a digital object identifier (DOI), the total number of publications dropped to 6647 (Figure 3); 1291 of these studies had a regional geographic focus, extending beyond country borders. The geographic focus of most publications was on Iran (1883 publications), while EO studies in Bahrain were the least common (10 publications). Similarly, for the author affiliation country (Table 2), Iran has the highest (2186) and Bahrain has the lowest (14) number of affiliations. However, 44.8% of the authors’ affiliations are not within the EMMENA region. Considering the population of each country, Cyprus has the highest author affiliation number per capita (770 per 1 million people). Countries that are suffering from political and military conflicts, such as Libya and Yemen, have the lowest author affiliation number per capita (7 and 13, respectively). This is also mirrored in the low per capita GDP of these countries (Table 2).
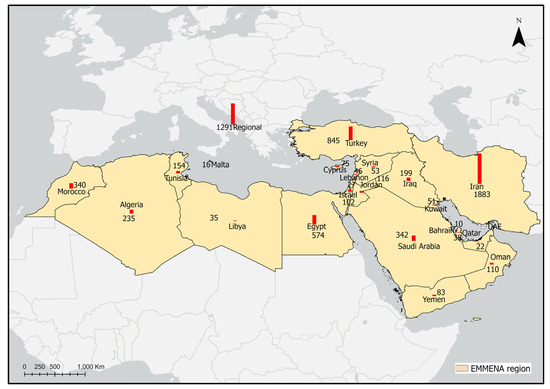
Figure 3.
Number of publications on EO per country (red column) in the EMMENA region for the period between 2018 and 2022.
The list with the 6647 publications including author name, article title, author keywords and addresses, citations, and DOI is presented in the Supplementary Materials (Table S1).
The 10 institutions with the highest number of affiliations (authors and co-authors) as identified in the EO publications in the EMMENA region are the following: University of Tehran (416 records), Islamic Azad University (346 records), Tarbiat Modares University (196 records), National Authority for Remote Sensing Sciences—NARSS (173 records), Shiraz University (167 records), Centre National de la Recherche Scientifique—CNRS (166 records), University of Tabriz (157 records), King Abdulaziz University (149 records), Istanbul Technical University (137 records), and Khajeh Nasir Toosi University of Technology (122 records). Six out of ten of these institutions are in Iran.
The 25 authors with the highest number of publications focusing in the EMMENA region are shown in Figure 4. Twelve of these authors have affiliation in countries not included in the EMMENA region (Australia, Austria, Canada, Finland, Germany, Malaysia, Norway, South Korea, Spain, Sweden, Taiwan, and the USA). Ten authors have affiliations in Iran (Shiraz University, University of Kurdistan, Tarbiat Modares University, Agricultural Research, Education and Extension Organization, University of Tabriz, Isfahan University of Technology, and Shahid Rajaee Teacher Training University). The remaining three authors are affiliated with Morocco (Mohammed VI Polytechnic University), Cyprus (Cyprus University of Technology), and Saudi Arabia (King Abdul Aziz University).
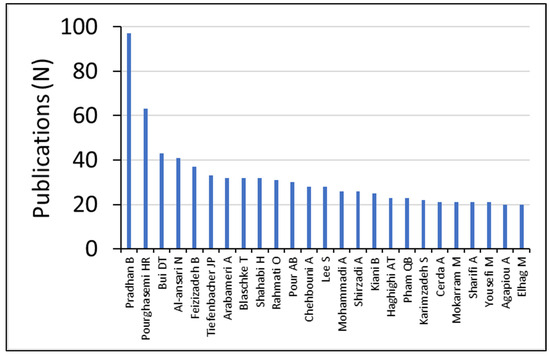
Figure 4.
Top 25 authors with highest number of publications for papers on EO in the EMMENA region.
The funding agency with the highest number of funded articles (145) is the Scientific and Technological Research Institution of Turkey (Figure 5), followed by the National Natural Science Foundation of China (108 articles) and the European Commission (104 articles). The list with the top ten funding agencies contains five more organizations which are outside the EMMENA region, namely the German Research Foundation (Germany), UK Research and Innovation (UK), the National Science Foundation (USA), National Aeronautics and Space Administration (USA), and the Natural Environment Research Council (UK).
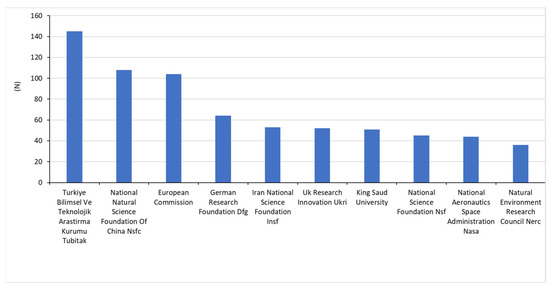
Figure 5.
Top 10 funding agencies based on the number of publications for papers on EO in the EMMENA region.
Big Earth data is the thematic area with the highest contribution (27.1%) of EO research carried out in the EMMENA region, followed by land (21.6%), disaster risk reduction (15.5%), water (15.1%), atmosphere (8.6%), agriculture (5.8%), and energy (4.1%) (Figure 6). Surprisingly, while most of the EMMENA region countries are surrounded by sea, marine safety and security has the lowest contribution of EO research carried out in the EMMENA region (0.9%). Also, the EMMENA region is characterized by a long history and cultural richness [8], but EO applications on cultural heritage have a low contribution to the total number of studies (1.4%).
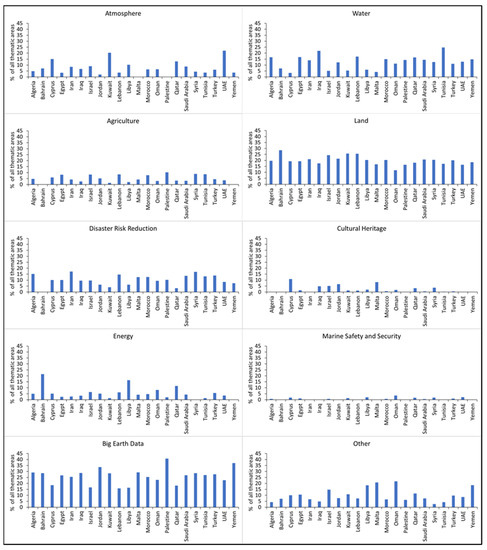
Figure 6.
EO applications per country and per thematic area (% of all clusters).
A total of 495 citation topics were identified in Web of Science, of which the first 10 account for 46% of the total number of publications. These topics include the normalized difference vegetation index (NDVI) (9%), groundwater (6%), evapotranspiration (6%), landslides (6%), fuzzy sets (4%), ecosystem services (4%), aerosols (3%), geostatistics (3%), soil erosion (3%), and tectonics (2%).
Most publications on EO applications in the EMMENA region used Landsat and Sentinel data, as identified by the keyword search on the publications’ title, keywords, and abstract (Table 3). Sentinel-2 data (60.8%) and Sentinel-1 data (35.4%) are the most widely used among the Sentinel missions. Similarly, Landsat 8 (83.2%) and Landsat 7 (10.0%) are the most widely used data sources among the Landsat missions.
Table 3.
Percentages of satellite missions per appearance in the title, keywords, and abstract of EMMENA publications.
The detailed analysis of the EO research according to the top 20 highly cited articles per thematic area will be described in the following subsection.
3.2. Main Outcomes of the Top 20 Highly Cited Articles from Each Thematic Area
3.2.1. Atmosphere
The focus of the 20 most highly cited articles in the thematic area of atmosphere are on precipitation estimates (4 articles), on dust storms (6 articles), and on the impact of coronavirus on air quality through EO (4 articles).
Spatiotemporal precipitation estimates of high accuracy are essential in climate studies and in water resource planning and management, especially in regions where in situ precipitation data are not available [33,34]. Amjad et al. [35] evaluated the performance of satellite-based (Tropical Rainfall Measuring Mission (TRMM) Multi-satellite Precipitation Analysis (TMPA), the Integrated Multi-satellitE Retrievals for Global Precipitation Measurement (IMERG)) and model-based (European Centre for Medium-Range Weather Forecasts (ECMWF-ERA interim, ERA5)) precipitation products over varying climate and complex topography. For their evaluation, they used 256 ground-based gauge stations between 2014 and 2018 over Turkey. They reported that satellite-based products consistently performed better than model-based products in detecting and estimating daily precipitation intensities. Mahmoud et al. [36] assessed the accuracy of the IMERG products by using ground-based rain gauge observations throughout Saudi Arabia for the period from October 2015 to April 2016, based on six statistical indices. The authors highlighted the potential of IMERG products in complementing ground precipitation measurements. However, the accuracy of this product is limited in regions with high heterogeneity in the rainfall distribution and with high variability in the terrestrial topography. Similarly, Hosseini-Moghari and Tang [33] found poor accuracy of IMERG products in regions with higher precipitation in Iran. The systematic error varied from less than 12% in dry regions to more than 60% in wet regions. In their study on the assessment of satellite-based precipitation measurement products over Egypt, Nashwan et al. [37] evaluated the performance of three satellite-based high-resolution gridded rainfall datasets, namely the gauge-corrected Global Satellite Mapping of Precipitation (GSMaP), IMERG, and the Climate Hazards Group InfraRed Precipitation with Stations (CHIRPS), in the hot desert climate of Egypt with different statistical indices. Overall, CHIRPS was more accurate than the other products in estimating rainfall amounts but IMERG was better at detecting the occurrence of rainfall than CHIRPS. In order to overcome the contradictory results obtained using different statistical metrics, Salman et al. [34] proposed the use of compromise programming for the selection of the appropriate gridded precipitation datasets.
Dust storms are considered a common environmental phenomenon in the EMMENA region with significant impact on human health, the environment, and many associated socioeconomic factors [38,39,40,41]. The study of Namdari et al. [42] examined the impacts of climate fluctuations on dust storm activity over the Middle East. They used aerosol optical depth, temperature, and precipitation data between 2000 and 2015, obtained from MODIS Collection, Tropical Rainfall Measuring Mission (TRMM), Global Historical Climate Network (GHCN) of the NCDC/NOAA, ECMWF, and from the Iran Meteorological Organization (IMO). Their results indicate that long-term reduction in rainfall has promoted lower soil moisture and vegetative cover, leading to more intense dust emissions. Furthermore, short-term variations in temperature in hot periods exacerbate the influence on the dust storm genesis. Yassin et al. [38] used a backward trajectory method on the HYSPLIT model to study the sources of dust storms over Kuwait during a 12-year period (2000–2012). The authors compared MODIS satellite observations at various latitudes (1000, 3000, 5000 m) with the HYSPLIT model and reported similar results. The sources of dust storms were identified from both the Sahara Desert and the Arabian Desert. Similarly, Beegum et al. [39] investigated dust storms over the Arabian Peninsula using the regionally adapted chemistry transport model CHIMERE coupled with the Weather Research and Forecast (WRF) model. They found good agreement (R ~0.73 and RMSE ~0.1) in the spatiotemporal pattern between simulations and observations (MSG/SEVRI RGB dust, MODIS Deep Blue Aerosol Optical Depth: DB-AOD, Ozone Monitoring Instrument Observed UV Aerosol Absorption Index: OMI-AI and AERONET AOD). Boroughani et al. [40] used three statistical-based machine learning algorithms (weights of evidence, frequency ratio, and random forest) to produce a dust source susceptibility map (DSSM) in Khorasan Razavi Province (Iran). Land use, lithology, slope, soil, geomorphology, normalized difference vegetation index (NDVI), and distance from river data were included in the models. The random forest model with an area under the curve (AUC) value equal to 88% showed higher performance than frequency ratio (80%) and weights of evidence (81%) when validated with MODIS data (23 images during the 2005–2016 period). Similarly, Gholami et al. [41] applied eight algorithms including random forest (RF), support vector machine (SVM), Bayesian additive regression trees (BART), radial basis function (RBF), extreme gradient boosting (XGBoost), regression tree analysis (RTA), Cubist model and boosted regression trees (BRTs), and an ensemble modeling (EM) approach for generating spatial dust distribution maps in Khuzestan Province (Iran) and Iraq. The EM approach showed the highest performance (AUC = 99.8%) for generating the dust storm provenance map.
Spaceborne NO2 column observations from two high-resolution instruments, Tropospheric Monitoring Instrument (TROPOMI, Sentinel-5 Precursor) and Ozone Monitoring Instrument (OMI), were used to assess the impact of the COVID-19 outbreak on NO2 pollution in five different regions (China, South Korea, western Europe, the USA, and Iran) [43]. The results showed a 20–40% decrease in NO2 columns over China, Europe, South Korea, and the United States between January and April 2020, due to the lockdown measures implemented by the governments. A likely explanation for the absence of a decrease in NO2 in Iran is that complete lockdowns were not enforced in Iran. The authors emphasized that further studies are needed to evaluate the effects of the temporary lockdowns on global air quality and climate and the gradual return the values of to prelockdown periods. On the contrary, the study of Broomandi et al. [44] showed that the COVID-19 lockdown positively affected Iran’s air quality, as evident by the reduction in the levels of CO, NO2, SO2, and PM10. Similar trends of NO2 reduction during the lockdown were observed for other EMMENA countries, such as Egypt and Iraq [45,46].
The remaining studies in the atmosphere thematic area focus on the improvement of CO2 anthropogenic emission measurements [47], climate change [48,49], aerosol pollution [50], drought estimation [51], and preseismic ionospheric anomalies [52].
Reuter et al. [47] developed a co-location method with the simultaneous use of CO2 (OCO-2) and NO2 (Sentinel-5) data for the identification and quantification of anthropogenic emission plume signals. The authors highlighted that existing satellites present high flux uncertainties which are expected to be reduced by the planned European Copernicus anthropogenic CO2 monitoring mission (CO2M), due to higher spatial resolution and better imaging capabilities.
Long-term trends between vegetation and climate showed apparent climate change effects in Iran [48]. Using 33-year records of NDVI (calculated with data from the Advanced Very High Resolution Radiometer (AVHRR) satellite) and climate variables, Lamchin et al. [48] found that the vegetation greenness trend consistently decreased (range = −0.47 to −0.08) in eastern Iran. Similarly, projected land use changes for Saudi Arabia between 2014 and 2100 showed reductions in vegetation due to climate change and anthropogenic activities [49].
Hossein Mardi et al. [50] examined the long-term temporal and spatial characteristics associated with aerosol pollution in Lake Urmia by using daily aerosol optical depth (AOD) data from MODIS satellites, between 2001 and 2015. They found that aerosols in the area are emitted more effectively from bordering lands (desiccated areas, dried watercourses, and river deltas), rather than the Lake Urmia salt crust.
The study of Alizadeh and Nikoo [51] evaluated the performance of three advanced fusion-based methodologies including the ordered weighted averaged (OWA) approach based on the ORNESS weighting method (ORNESS-OWA) and ORLIKE weighting method (ORLIKE-OWA) for drought estimation with the use of different remotely sensed precipitation data products (CHOMPS, GPCP, CMAP, PERSIANN-CDR, TRMM, GLDAS-2, and MERRA-2). Their results showed that the ORNESS-OWA method had the highest performance (MARE = 2.51% and R2 = 95%) in comparison with all other fusion-based models, demonstrating an effective proficiency in drought estimation.
Tariq et al. [52] showed the feasibility of detecting earthquake (EQ)-related anomalies in the ionosphere with the use of the Temporal Electron Content (TEC) from Global Ionospheric Map TEC (GIMTEC) and ground-based dual-frequency GPS receivers. They used data for three major (M > 7.0) earthquakes in Nepal and the Iran–Iraq border from 2015–2017. Their statistical procedures showed positive ionospheric anomalies within 10 days before all the major earthquakes.
3.2.2. Water
The main focus of the 20 most highly cited articles in the thematic area of water (Table 4) is on groundwater potential mapping (10 articles) and on groundwater quality (7 articles Most of the EMMENA countries suffer from water scarcity because of the semi-arid and arid climate which, combined with the population growth and the growing demand for water, creates an urgent need to further explore the potential groundwater resources as an alternative [53,54,55,56,57,58,59,60,61,62]. Existing groundwater resources in EMMENA countries (e.g., Iran, Egypt) have significantly declined, both in terms of quality and quantity [60,63,64,65,66,67,68]. Due to anthropogenic activities and mismanagement, groundwater bodies in the EMMENA region face many threats such as brackish water [63,64,65], poor water quality index [66], fluoride and nitrate contamination [67,68], and high levels of total dissolved solids (TDS) [60]. According to Arabameri et al. [54], due to the constant technical advancements in the field of groundwater potential mapping, there is no current agreement or reference on which approach is more suitable to predict high groundwater potential. However, all studies have in common the use of GIS and geostatistical methods, including different models and algorithms. The studies used various sources of data (e.g., ALOS PALSAR, ASTER, Landsat, ground-based) related to water quantity, land use/land cover, soil and geology, digital elevation, and morphological (e.g., slope, aspect) and hydrological data (e.g., river network). The choice of the input data depends on the site-specific characteristics of each region. All these studies highlighted that the results will be useful for better water and land management practices and policies.
The remaining studies in the water thematic area focus on dam site selection [69], quantification of irrigation water [70], and on evapotranspiration estimates [71].
Jozaghi et al. [69] conducted a comparative analysis of the analytic hierarchy process (AHP) and the technique for order of preference by similarity to ideal solution (TOPSIS) for the optimum dam site selection in Sistan and Baluchestan Province (Iran), with the use of GIS. Their comparison was made based on geographic (geology, land use, sediment, erosion, slope, groundwater, and discharge) and water quality (soluble sodium percentage, total dissolved solids, potential of hydrogen, and electrical conductivity) criteria. The authors reported that the TOPSIS method is better suited to the problem of dam site selection for this study area.
Jalilvand et al. [70] used the SM2RAIN algorithm for the estimation of irrigation water use at the southern Urmia Lake catchment (Iran) based on satellite soil moisture observations obtained from Advanced Microwave Scanning Radiometer 2 (AMSR2). They found that the simulated quantities of the irrigation water were consistent with the observed data with an average R = 0.86 and RMSE = 12.89 mm/month. Zamani Losgedaragh and Rahimzadegan [71] applied three different models (Surface Energy Balance Algorithm for Land (SEBAL), Mapping Evapotranspiration with Internalized Calibration (METRIC), Surface Energy Balance System (SEBS)) to estimate the amount of evapotranspiration over the region of the Amirkabir dam reservoir (Iran). Sixteen Landsat 5 and Landsat 8 satellite images from 2011 to 2017 were used in these models to compute evapotranspiration and the results were validated with ground truth pan evaporation data. The authors found good performance of the SEBS (R2: 0.62, RMSE: 0.93) and METRIC (R2: 0.57, RMSE: 2.02 mm) models. On the contrary, the SEBAL model showed poor performance (R2: 0.36, RMSE: 5.1 mm).
Table 4.
Research focus (GP: groundwater potential mapping, GQ: groundwater quality, QIW: quantification of irrigation water, ET: evapotranspiration estimates, DP: dam site selection) of the 20 most-cited papers in the water thematic area, the geographical focus (country), the methods used (AHP: analytical hierarchical process, Fuzzy-AHP: fuzzy analytical hierarchical process, ML: machine learning, AI: artificial intelligence), and the satellite data used.
| N | Ref. | Focus | Country | Methods | Satellites |
|---|---|---|---|---|---|
| 1 | [53] | GP | S. Arabia | Fuzzy-AHP | Landsat 8, ALOS PALSAR |
| 2 | [61] | GP | Morocco | AHP | Landsat 8 |
| 3 | [59] | GP | Iran | ML | ASTER GDEM |
| 4 | [62] | GP | Iran | ML | Landsat ETM+ |
| 5 | [58] | GP | Iran | ML | Landsat 8 |
| 6 | [55] | GP | Iran | ML | Landsat ETM+ |
| 7 | [56] | GP | Iran | AI | Landsat 7, ASTER |
| 8 | [57] | GP | Iran | ML | Landsat 8 |
| 9 | [54] | GP | Iran | ML | Landsat ETM+, Sentinel-2, ASTER, ALOS |
| 10 | [72] | GP | Iran | AI/ML | Landsat |
| 11 | [66] | GQ | Egypt | N/A | |
| 12 | [63] | GQ | Iran | N/A | |
| 13 | [64] | GQ | Iran | N/A | |
| 14 | [67] | GQ | Iran | N/A | |
| 15 | [68] | GQ | Iran | ML | N/A |
| 16 | [65] | GQ | Iran | N/A | |
| 17 | [60] | GQ | Iran | N/A | |
| 18 | [70] | QIW | Iran | ASCAT, SMOS, AMSR2 JAXA | |
| 19 | [71] | ET | Iran | Landsat 5/8 | |
| 20 | [69] | DP | Iran | AHP | N/A |
3.2.3. Agriculture
The EO applications in the thematic area of agriculture cover a wide range of topics such as evapotranspiration (ET) estimation [73,74,75,76], land suitability for agriculture [77,78,79,80,81,82,83], irrigation mapping [84], agricultural land loss [85], crop monitoring [86,87], crop production and yield prediction [88,89], crop mapping [90], stem water potential monitoring [91], and crop water footprint estimation [92].
Accurate assessment of water use in agriculture is of critical importance due to the changing climate and increasing water scarcity. Thus, modeling crop water use is a powerful decision tool for agricultural policy decisionmakers to improve water use efficiency [92]. In their study on crop water footprint estimation, Elbeltagi et al. [92] modeled the green and blue water footprints of maize by using an artificial neural network (ANN) in major maize-producing sites in Egypt, between 2006 and 2016. Meteorological data were collected from the Climatic Research Unit Time Series and the Japanese 55-year Reanalysis (JRA-55) in NetCDF formats. Their model achieved high accuracy with deviations between the actual and predicted water footprints ranging from −2.6 to 6.6% and from −2.4 to 3.2% for the blue and green water footprints, respectively.
Representative and accurate evapotranspiration maps are needed to achieve the planning and management of sustainable water use in water-scarce regions, such as the EMMENA region [76]. Jamshidi et al. [74] compared four different evapotranspiration methods, including ET estimates from reanalysis data (NCEP, ERA-Interim, ERA5), MODIS ET datasets, Landsat-based ET models (METRIC, SEBS), and in situ measurements, from 2009 to 2014, in southern Iran. The authors reported 4.6% overestimation and 11.4% underestimation of ET with the METRIC and SEBS models, respectively. Huang et al. [73] reported that actual evapotranspiration in daily time steps predicted based on the SEBAL method is underestimated for barley, cucumber, chickpea, and alfalfa and overestimated for wheat, potato, onion, lentil, bean, and maize and is close to the calculated values of SWB for tomato, colza, and sugar beet. Furthermore, Rahimzadegana and Janani [75] showed good efficiency of the SEBAL model for estimating the actual ET of pistachio. Mahmoud and Gan [76] computed the actual evapotranspiration (AET) over the central region of Saudi Arabia from 1950–2013, based on meteorological data and on crop coefficients (Kc) which were modeled as a function of a 16-day time-series MODIS normalized difference vegetation index (NDVI). They reported that annual AET estimated by the soil water balance model was between 9 and 11% higher than the modeled AET. The studies emphasized the need for high-quality in situ data in future studies to improve the model’s performance.
Land suitability studies were conducted both with GIS and multi-criteria decision-making analysis for wheat (Turkey), Citrus (Turkey, Morocco), legumes (Morocco), maize (Iran), soybean (Iran), rapeseed (Iran), barley (Iran), olives (Morocco), and jojoba (UAE) crops. The studies reported that their findings can help in improving the management of crop production and that future studies should expand on different crops and soil types.
In their study on soil moisture and irrigation mapping in Tunisia, Bousbih et al. [84] presented a new technique based on the synergistic interpretation of multi-temporal optical and Synthetic Aperture Radar (SAR) data (Sentinel-2 and Sentinel-1). Their approach is based on the inversion of the water cloud model, using radar data and NDVI data derived from optical images. Their results showed an RMSE of 4.3% and a bias of 1.9% between the satellite and observed data.
Crop production and yield prediction using remotely sensed data are generally scarce in the EMMENA region due to the inter-annual variation in meteorological factors combined with anthropogenic factors (such as war conflicts) [88]. In the study on barley yield prediction in Iran, Sharifi [89] combined vegetation indices (NDVI and EVI) derived from Sentinel-2 data, barley yield data, and four algorithms, including a backpropagation neural network, decision tree, K-nearest neighbor, and Gaussian process regression. The latter algorithm had the highest performance (r2 = 0.84) and estimated yield with a root mean square error of 737 kg ha−1 and mean absolute error of 650 kg ha−1. Qader et al. [88] developed an empirical regression-based model to forecast winter wheat and barley production in Iraq, based on MODIS satellite data and in situ crop data. They found that the highest accuracy (R2 = 0.70) is achieved when the vegetation index (VI) is at the maximum. Crop growth dynamic observations from satellites are often limited by the coarse spatial and temporal resolutions. To address this issue, Nguyen et al. [87] proposed the use of data from different ongoing satellite missions of Sentinel-2 (ESA) and Landsat 7/8 (NASA) through harmonization techniques. They found that improved topographic correction models are needed to achieve higher performance of the harmonized products in mountainous areas. Sadeh et al. [86] developed a new method to fuse a time series of images sourced from two different satellite constellations (Sentinel-2, Planetscope) which combines the advantages of each satellite (high temporal, spatial, and spectral resolution). This new technique was applied to create spectrally consistent daily images of wheat LAI at a 3 m resolution which were then compared with in situ wheat LAI measurements from Australia and Israel. Their approach successfully estimated LAI (R2 = 0.94) throughout the growing season for LAI < 3.
Ashourloo et al. [90] examined the potential of automatic mapping of canola (Brassica napus L.) using time series of Sentinel-2 images. They found that multiplication of the near-infrared (NIR) band by the sum of red and green bands is an efficient index to identify canola during the flowering stage. The kappa and overall accuracy (OA) were more than 0.75 and 88%, respectively. Furthermore, Helman et al. [91] examined the relationship between stem water potential and four vegetation indices (GNDVI, NDVI, EVI, and SAVI) in Mediterranean vineyards (Israel) through the use of high spatial resolution Planetscope images. The authors highlighted that SAVI displayed a slightly better correlation with stem water potential than the other three indices, likely due to its capacity for reducing soil effects.
Urban expansion has critical consequences for agricultural production in the EMMENA region. Radwan et al. [85] analyzed 24 LULC maps from the European Space Agency Climate Change Initiative (ESA-CCI) land cover viewer (http://maps.elie.ucl.ac.be/CCI/viewer/, accessed on 13 March 2023) and found that 74,600 hectares of fertile agricultural land in the Nile Delta (Old Lands) was lost due to urban expansion from 1992 to 2015 at an average rate of 3108 ha year−1. Also, 206,100 hectares of bare land was converted to agricultural land at an average rate of 8588 ha year−1. According to the authors, more sustainable land use strategies are needed to minimize the threats to agricultural sustainability and food security.
3.2.4. Land
Land degradation due to soil erosion is one of the major problems which the EMMENA region is facing as highlighted by most of the studies in the land thematic area [93,94,95,96,97,98,99]. Jazouli et al. [99] integrated the revised universal soil loss equation (RUSLE) in a GIS environment to quantify soil loss and to map erosion risk of the Oum Er Rbia River basin, located in the Middle Atlas (Morocco), for 2013, 2013, and 2017. For their analysis, they used satellite images of Sentinel-2A, Landsat Oli-8, and ETM and applied cellular automata Markov to forecast the land use/land cover map and to detect the associated changes. Their results showed an estimated annual soil loss of 58 t ha−1 yr−1 in 2003, while the predicted annual soil loss for 2030 increased to 142 t ha−1 yr−1. Different techniques can be found in the literature for creation of soil erosion susceptibility maps. Ameri et al. [98] used four different multi-criteria decision-making models (SAW, VIKOR, TOPSIS, and CF) and concluded that the VIKOR method has higher predictive accuracy than TOPSIS, SAW, and CF models for the Ghaemshahr Basin in Iran. They used the Advanced Space Thermal Emission Radiometer (ASTER) digital elevation model (DEM) with spatial resolution of 30 m for the extraction and analysis of 23 morphometric parameters. Arabameri et al. [94] evaluated the performance of three data-driven models (frequency ratio, weights of evidence, index of entropy) and the AHP knowledge-based technique for gully erosion susceptibility mapping in the Toroud watershed (Iran). Morphological and land use parameters were derived from ALOS PALSAR and Landsat 8 satellite images. All four models showed excellent accuracy in prediction of areas prone to gully erosion. Zabihi et al. [97] tested the same models in the Valasht watershed (Iran) and found that the frequency ratio model had better performance (80.4%) than the weight of evidence (79.5%) and index of entropy (79%) for erosion mapping. In another study, Arabameri et al. [95] studied the performance of three algorithms (random forest, boosted regression tree, and multi-variate adaptive regression spline) for gully erosion susceptibility mapping in the Shahroud watershed, Iran. Landsat 8 and ASTER GDEM data were used in their analysis. According to the authors, the random forest model had the highest prediction accuracy. Similar high performance for the random forest algorithm was reported by Garosi et al. [96]. Finally, Arabameri et al. [93] proposed a new model which combines the geographically weighted regression technique with the certainty factor and random forest models to produce gully erosion zonation mapping. The proper selection of the data in these studies depends on their availability and site-specific characteristics.
Information about the location, extent, and type of land use/land cover (LULC) is essential for improving land management practices [100]. Mansour et al. [101] applied advanced GIS techniques, spatial modeling, and utilization of satellite images (Landsat 5/8) to simulate LULC changes and to predict the urban expansion in the mountainous cities of Oman, for the years 2028 and 2038. Their predictions showed a 50% increase in the built-up area in 2038; on the contrary, vegetation will decrease by 36.5%. Ghorbanian et al. [100] developed an object-based land cover classification methodology using the Google Earth Engine in order to improve the land cover map of Iran. They used Sentinel-1 and Sentinel-2 imagery data for the fusion of SAR and multi-spectral data to increase the land cover classification accuracy. The land cover map for Iran (2017) had an overall accuracy of 95.6%. Mohajane et al. [102] studied the vegetation change in Azrou Forest (Morocco) between 1987 and 2017. They combined Landsat images (MSS, ETM+, TM, OLI) and used the NDVI and ground-based survey to improve the discrimination between LULC categories. Land cover maps for each year were produced with the maximum likelihood (ML) classification method. The authors reported high classification accuracies and showed that the total forest cover over the 30-year period remained stable. Rasul et al. [103] developed the dry built-up index (DBI) and dry bare-soil index (DBSI) to map built-up and bare areas in dry climates with the use of Landsat 8 images. The results from the city of Erbil (Iraq) showed an overall classification accuracy of 93% (κ = 0.86) and 92% (κ = 0.84) for DBI and DBSI, respectively.
Rapid and extensive urbanization over the past few decades has led to changes in the microclimate of urban environments [104]. Urban regions experience warmer temperatures by absorbing a greater amount of solar radiation than their natural rural surroundings, a phenomenon well known as urban heat island (UHI). Shirani et al. [104] used satellite images of Landsat 7 ETM+ (1999 and 2006) and Landsat 8 (2013 and 2016) to retrieve the Earth surface temperature of Isfahan (Iran). Their results showed an increase in the minimum temperature of 2016 compared to 1999 and that the heat island ratio followed a rising trend, moving from 0.16 (1999) to 0.3 (2016). Similarly, the study of Weng et al. [105] showed that surface urban heat island intensity in the city of Babol (Iran) increased significantly (24%) during the period from 1985 to 2017. Cetin et al. [106] found a temperature difference between urban high building density areas and other terrestrial areas, ranging from 0.4 to 2.5 °C.
Knowledge about the distribution of soil properties over the landscape is required for a variety of land management applications and resources, modeling, and monitoring practices [107,108]. Amazirh et al. [109] developed a method for retrieving surface soil moisture at a high spatiotemporal resolution, by combining Sentinel-1 (S1) microwave and Landsat 7/8 thermal data. The authors reported a root mean square difference between satellite and in situ soil moisture of 0.03 m3m−3. Zeraatpisheh et al. [107] used the normalized difference vegetation index (NDVI), ratio vegetation index (RVI), perpendicular vegetation index (PVI), clay index (CI), Landsat image band 4 (B4), and soil adjusted vegetation index (SAVI), derived from the Landsat enhanced thematic mapper, in order to predict and compare the spatial distribution of soil organic carbon (SOC), calcium carbonate equivalent (CCE), and clay content by using different machine learning techniques (Cubist, random forest, regression tree, and a multiple linear regression) in Iran. Their results showed that the highest and the lowest prediction accuracies were obtained for clay and SOC using random forest and random tree models, respectively. Fathololoumi et al. [110] showed that the use of dynamic (multi-temporal) satellite data fusion, rather than static, can greatly improve soil modeling and mapping.
Accurate measurements of aboveground forest biomass are crucial for estimating forest carbon stocks and for regional, sustainable land use planning. Vafaei et al. [111] applied machine learning techniques in order to improve the forest aboveground biomass estimation. They generated three datasets including the Sentinel-2A dataset, the ALOS-2 PALSAR-2 dataset, and the combination of the Sentinel-2A dataset and the ALOS-2 PALSAR-2 dataset (Sentinel-ALOS). They found that aboveground biomass models derived from the combination of the Sentinel-2A and the ALOS-2 PALSAR-2 data had the highest accuracy, followed by models using the Sentinel-2A dataset and the ALOS-2 PALSAR-2 dataset.
3.2.5. Disaster Risk Reduction
Disaster risk reduction is the thematic area with the highest average number of citations per thematic area for the top 20 cited papers (Figure 7). The focus of these papers is on landslides [112,113,114,115,116,117,118,119,120,121,122] and on floods [118,123,124,125].
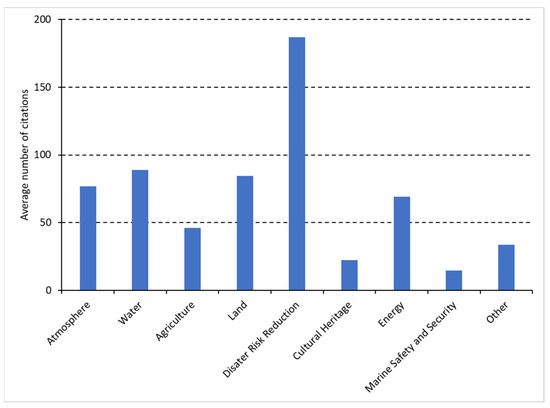
Figure 7.
Average number of citations per thematic area (top 20 highly cited papers).
Landslides are often catastrophic natural hazards leading to loss of life, damage to properties, and economic disruption [113]. All the studies on landslides have in common the coupling of machine learning (or artificial neural network) algorithms with spatial data types. The data used in these studies can be categorized into five main categories: topographical (e.g., aspect, slope, elevation), hydrological (e.g., rainfall, river density), lithological (e.g., lithology, faults), land cover (e.g., NDVI), and anthropogenic (e.g., road density). Topographical and land cover data are often derived from satellite images. However, the source of these data was not provided in most studies. According to Merghadi et al. [113], tree-based ensemble algorithms achieve excellent results compared to other machine learning algorithms for landslide susceptibility mapping. Specifically, the random forest algorithm offers robust performance for accurate landslide susceptibility mapping with only a small number of adjustments required before training the model. The studies of Pourghasemi and Rahmadi [117], Youssef and Pourghasemi [122], Arabameri et al. [121], and Achour and Pourghasemi [119] reported similar robust performance for the random forest algorithm for landslide susceptibility assessment. Tien Bui et al. [126] applied the metaheuristic algorithm Harris hawks optimization (HHO) in order to improve the performance of the artificial neural network (ANN) for landslide susceptibility assessment in western Iran. The authors found that the HHO algorithm improved the performance of the ANN in both recognizing and predicting the landslide patterns. Shirzadi et al. [127] showed that the use of a hybrid approach of alternative tree decision and ensemble algorithms (rotation forest and multi-boost) will improve the predictions of landslide susceptibility due to decreasing noise and over-fitting problems. According to Reichenbach et al. [112], for the preparation of landslide susceptibility assessment there are nine steps that need to be considered, which include obtaining relevant landslide and thematic information, selecting the appropriate mapping unit and model, evaluating model fitting and predictive performance, estimating model uncertainty, ranking model quality, and designing the landslide protocol. Future studies should consider these steps and focus on the development of landslide early warning systems at different geographical scales.
Floods are considered as a major natural disaster because of their devastating effects that lead to human casualties and socioeconomic losses [128]. Khosravi et al. [125] tested four decision tree-based machine learning models (logistic model trees (LMTs), reduced error pruning trees (REPTs), naïve Bayes trees (NBTs), and alternating decision trees (ADTs)) for flash flood susceptibility mapping at the Haraz watershed in the northern part of Iran. The physical factors needed for the models, such as ground slope, altitude, and curvature, were derived from the Aster digital elevation model (DEM) of 30m resolution and the land use and NDVI maps were extracted from Landsat 8 Operational Land Image (OLI). Their results showed that all models have good performances in flood susceptibility assessment, with the ADT model having the highest predictive capability. Tien Bui et al. [126] combined the adaptive neuro-fuzzy inference system (ANFIS) with two GIS-based ensemble artificial intelligence approaches, the imperialistic competitive algorithm (ICA) and the firefly algorithm (FA), for flood spatial modeling and mapping applications in the Haraz watershed (Iran). The ten factors included in their analysis were slope angle, elevation, stream power index (SPI), curvature, topographic wetness index (TWI), lithology, rainfall, land use, stream density, and the distance to river. The results showed high prediction accuracy of the two ensemble models with values of MSE and RMSE for ANFIS-ICA and ANFIS-FA equal to 0.41 and 0.35 and 0.169 and 0.129, respectively. According to Ahmadlou et al. [123], flood occurrence is mainly affected by plan curvature, followed by altitude, geology, distance to river, slope, soil, land use, rainfall, and aspect. A range of models and machine learning techniques have been applied in order to improve the flood susceptibility mapping [118,125,126,128,129,130,131]. However, future studies should focus on the development of flood forecasting and warning systems which is essential in order to minimize the flood hazards [124].
3.2.6. Cultural Heritage
EO within the culture heritage thematic area includes detection, monitoring, mapping, and management of archaeological sites [132,133,134,135,136,137,138,139,140], looting detection [141,142], and other threats to cultural heritage sites [143,144,145,146,147,148,149].
The studies on detection, monitoring, and management employed various satellite data (Corona, Landsat, Spot, Quickbird, Sentinel-2A, COSMO-SkyMed) and reported that there is a need for further development of machine and deep learning techniques in order to automate feature extraction and pattern detection in very high-resolution (VHR) images [132,134]. Soroush et al. [134] tested the application of deep convolutional neural networks (CNNs) for automated remote sensing detection of qanat systems in the Erbil Plain (Iraq), with the use of Corona imagery. They demonstrated that even with small datasets, deep learning can be successfully applied to automate the detection of qanat shafts. According to Bachagha et al. [137], the combined use of LiDAR, aerial photographs, historical records, and satellite images will further enhance the investigation of ancient sites. By screening long Sentinel-2 time series for Aleppo and Apamea, Tapete and Cigna [132] showed that changes in textural properties and surface reflectance can be associated with events relevant for conservation. Tapete and Cigna [133] also suggested the use of COSMO-SkyMed data for condition assessment of archaeological heritage and landscape disturbance due to their capabilities for very high spatial resolution images and for site revisit of up to one day. Stott et al. [139] applied airborne laser scanning (ALS) remote sensing and photogrammetric techniques, including enhancing local topographic contrast for archaeological interpretation, residual relief modeling, sky view factor, and local dominance, and they were able to accurately map known archaeological features and to detect a wide variety of previously unrecorded potential features. A major issue for the preservation of archaeological areas appears to be urban and agriculture sprawling [132,135,139,143,144,145]. With the use of multi-temporal and multi-sensor satellite data (Corona, Landsat, Spot, Quickbird, and Sentinel-2A), Elfadaly et al. [135] showed that urban fabric continuously expanded from 1984 to 2017, posing a severe threat at the Theban temples at west Luxor (Egypt).
Lasaponara and Masini [142] introduced an automatic method for an archaeological looting feature extraction approach (ALFEA) which is based on looting enhancement using spatial autocorrelation, unsupervised classification, and segmentation. For their analysis, they used images available from Google Earth. Their results from the evaluation procedure showed satisfactory performance from two analyzed test cases with a rate of success higher than 90%. According to the review study by Tapete and Cigna [141], a variety of satellite data were used for the detection of archaeological looting, such as HR multi-spectral imagery from Sentinel-2, VHR X-band SAR data from COSMO-SkyMed, VHR panchromatic and multi-spectral WorldView-2 imagery, and VHR optical data from GeoEye-1, IKONOS-2, QuickBird-2, and WorldView-3; 89% of the studies on looting detection exploited optical images and the majority of these studies used VHR images (less than 1 m resolution). According to the authors, the use of open high-resolution (HR) data (e.g., Sentinel-2 and Landsat) is still at the early stage. Currently, there is lack of common practices in the domain of looting detection from space, thus there is a need to move toward sharing and harmonization of methodologies.
Apart from looting and urbanization described above, remote sensing techniques have also been applied in other domains which may threaten cultural heritage sites such as erosion [146,148], earthquakes [149], flooding [147], and salt weathering [144].
3.2.7. Energy
The majority of the top 20 highly cited articles in the energy thematic area focus on the spatial assessment of the energy potential and on the location selection for energy plants [150,151,152,153,154,155,156,157,158,159,160,161,162,163,164,165,166]. Thirteen of these studies focus on solar energy (photovoltaics, concentrating solar power), two studies focus on wind energy, and two studies focus on bioethanol/biogas. The three remaining studies focus on techno-economical assessment of energy resources [167,168] and on the design optimization of off-grid hybrid renewable energy systems [169]. The geographical focus of the studies was on Iran (nine studies), Morocco (four studies), Egypt (two studies), Turkey (two studies), Algeria (one study), and Saudi Arabia (one study).
In their study on the spatial assessment of solar energy potential at a global scale, Pravalie et al. [157] analyzed the solar radiation distribution and intensity based on global horizontal irradiation (GHI) and direct normal irradiation (DNI) data. They found that most of the countries located in the EMMENA region (Saharan countries and countries located in the Arabian Peninsula) present superb (maximum) solar potential, thus there are opportunities for developing solar energy at a national or international (regional) level. However, there are additional factors that can affect solar power generation in this region, such as dust particles and dust storms, high air temperatures, insufficient financial resources, and political instability or war conflicts.
Eleven studies in the spatial assessment of the energy potential and on the location selection for energy plants combined GIS and multi-criteria decision models (Table 5). The assessment of the energy potential and the location of energy plants includes a range of criteria such as climatic (e.g., solar radiation, sunshine, land surface temperature), morphological (e.g., slope and aspect), locational (e.g., distance from cities, roads, and electricity grid), land cover, and hydrological (e.g., distance from dams and groundwater) criteria [150,151,152,153,158,159]. The criteria for the assessment of the offshore wind energy potential include, among others, wind characteristics, water depth, soil substrate, and distance from the shoreline, military areas, parks, submerged cables, shipping routes, and fishing areas [155,156]. Finally, the criteria for bioethanol facility location selection include social (e.g., policies, work force, societal impact, quality of life), environmental (e.g., ecologically sensitive areas), and economic (e.g., investment, maintenance, and operation costs) criteria [154].
Table 5.
Energy resource and research focus (OL: Optimized Location/Site, P: Energy potential, TE: Techno-Economical, OD: Optimal Design) of the top 20 highly cited papers in the Energy thematic area (Ref.), the geographical focus (Country), the methods used (MCDM: Multi-Criteria Decision Model, BF: Boolean-Fuzzy Logic, SO: Swarm Optimization, HE: Heuristic, MC: Monte Carlo), and the satellite data used.
3.2.8. Marine Safety and Security
Marine safety and security is the thematic area with the lowest average number of citations per thematic area for the top 20 highly cited papers (Figure 7). Studies include oil spill detection and assessment [170,171,172,173,174,175,176,177], marine habitat mapping [178], toxicity assessment of heavy metals [179], environmental pollution of coastal zones [180], detection of floating plastic litter [181,182,183], marine mucilage monitoring [184], ecology of sea turtles [185,186,187], habitat suitability model for Posidonia oceanica [188], characterization of natural hydrocarbon seepage [189], and relative sea-level rise and potential submersion risk [190].
Oil pollution is among the major maritime environmental disasters and has become a worldwide concern due to the increasing rate of offshore oil production and transport [177]. Abou Samra et al. mapped and examined the oceanographic parameters that may affect oil pollution dispersion along the offshore zone of the Nile Delta with the use of GIS techniques. They analyzed data of wave patterns, bathymetry, sea surface temperature (SST), chlorophyll content, phytoplankton concentration, and organic carbon concentration. They found that oil spills along the offshore region are primarily influenced by bathymetry and SST. Chaturverdi et al. [173] and El-Magd et al. [175] used SAR data from Sentinel-1 satellites to detect and map oil spills in the Al Khafji area (Saudi Arabia) and in the coastal waters of Egypt. Their results demonstrated the capability of utilizing Sentinel-1 for oil spill detection and mapping. Arslan [172] analyzed Sentinel-1 data to detect an oil spill caused by a ship on 18 December 2016 off the coast of Ildır Bay (Izmir, Turkey). Furthermore, Landsat 8 data were used for validation purposes by estimating brightness temperatures to observe oil spill changes in temperature on the sea surface. Park et al. [171] combined very high-resolution satellite images (Planetscope) with an artificial neural network technique to detect an oil spill accident that occurred on 10 August 2017 near the Ras Al Zour area (Kuwait). The accuracy and kappa coefficient of the oil classification map obtained from the optical image were 82.01% and 72.42%, respectively. Future studies should focus on satellite data of higher temporal resolution to verify the results with in situ or satellite SAR data and to develop better algorithms for rejecting low-probability pixels and dust. Finally, there is a need to develop a near-real-time warning and alarm system for oil spill cases as a service, which can help to identify the ship or platform that is liable for the pollution [175].
Mateos-Molina et al. [178] analyzed a variety of different data sources, including Sentinel-2 and DubaiSat-2 imagery, and mapped the spatial distribution of coastal marine habitats in the north-western United Arab Emirates (UAE). Their multiple data analysis approach overcame the limitation of turbid waters and habitat seasonality with an overall accuracy of 77%.
Ivanov et al. [189] studied the hydrocarbon seep characteristics and their relation to the local hydrocarbon field or potential hydrocarbon reservoirs in the South Caspian sea (Iran). They analyzed SAR images (Sentinel-1) together with bathymetry and geological and geophysical data with GIS. Their results showed that the oil slicks have a natural origin, related to the bottom seepage phenomenon and associated with an existing hydrocarbon system.
Fatehian et al. [180] designed and implemented an integrated volunteered geographic information (VGI)-based system based on coastal pollution management concepts and public participation in order to monitor coastal pollution in the port city of Nowshahr (Mazandaran Province, Iran). Tourists, residents, and other present individuals were asked to report observable pollutants at their location; 86% of the reports referred to the accumulation of garbage, while 10% and 4% of the remaining reports were related to wastewater pollution and oil contaminants, respectively. According to the authors, future work should focus on the integration of spatial decision support systems (SDSSs) in the existing tool to improve coastal pollution management.
El-Alfy et al. [179] used Landsat OLI images, synchronized with the sampling time of water and sediment samples, to assess the toxicity of heavy metals and organochlorine pesticides in freshwater and marine environments in the Rosetta area (Egypt). They found that drainage canals, cultivations, and urbanized zones were the major sources of contamination in the studied area. They recommended biological treatment processes such as using naturally grown plants like Phragmites australis in the contaminated sites.
The increasing level of marine plastic pollution poses severe threats to marine ecosystems, thus cost-effective solutions for identifying plastic litter are essential. Themistocleous et al. [181] examined the potential of detection of floating plastic litter by introducing the plastic index (PI) and reversed normalized difference vegetation index (RNDVI), based on the Sentinel-2 B08 (842 nm) and B04 (665 nm) bands. They found that Sentinel-2 satellite images were effective in identifying plastic clusters in the sea, through the high reflectance of solar radiation at NIR wavelengths. They highlighted that future research should focus on the use of Sentinel-1 SAR images for the identification of plastic litter in the sea. Sannigrahi et al. [182] combined Sentinel-2 imagery with machine learning algorithms (support vector machine and random forest) for the development of an automated marine floating plastic detection system. The authors found that the random forest algorithm performed better than the support vector machine, as it detected floating plastic from real-world data collected from Calabria and Beirut with 91% accuracy. Zhou et al. [183] combined WorldView-3 satellite data with a knowledge-based classifier and concluded that this approach is efficient and reliable for monitoring and identifying plastic materials. Global warming and human activities have caused abrupt changes in marine ecosystems. Yagci et al. [184] investigated the potential of using the coarse spatial resolution MODIS products for mucilage detection and monitoring in the Sea of Marmara (Turkey). The validation carried out with the reference mucilage datasets derived from Sentinel-2A imagery and with in situ spectroradiometer measurements showed that the produced MODIS-based maps accurately depicted the mucilage-covered areas. Bakirman and Gumusay [188] combined GIS, MCDM, and remote sensing techniques (SPOT 7 optical imagery) for the identification of suitable habitats for Posidonia oceanica in Gulluk Bay, Turkey. The authors used the following criteria: depth, sheltered area, slope, sediment yield, and topographic position index. Their model identified suitable habitats for seagrass with an overall accuracy of 76%. Human activities have resulted in negative effects on sea turtle populations in the Mediterranean, thus sufficient conservation and monitoring efforts are essential [187]. Towards this direction, satellite telemetry and conventional GPS data loggers have been proven to be valuable tools for mapping the spatial ecology of sea turtles [185,186]. Antonioli et al. [190] studied the relative sea-level rise and potential submersion risk for 2100 on 16 coastal plains of the Mediterranean Sea (France, Spain, Tunisia, Cyprus) by analyzing LiDAR data and different climate projection scenarios. They estimated a potential loss of land for the above areas between about 148 km2 for the IPCC-RCP8.5 scenario and 192 km2 for the Rahmstorf scenario, impacting a coastline length of about 400 km. However, the low resolution (25 m × 25 m) of the digital terrain model map of Cyprus prevented any further detailed coastal hazard assessment.
3.2.9. Big Earth Data
The big Earth data thematic area includes technologies and development of methods and algorithms which are applied in the other thematic areas (Table 6). Thus, it is considered as a horizontal thematic area. Thirteen out of the twenty most highly cited articles which include big Earth data applications were categorized into the disaster risk reduction thematic area (Section 3.2.5), and the remaining seven are in water (three articles, Section 3.2.2) land (three articles, Section 3.2.4), and energy (one article, Section 3.2.7) thematic areas. The geographical focus of these articles is on Iran (14 articles), Algeria (2 articles), regional (2 articles), Morocco (1 article), and Oman (1 article). The average number of citations (up to 13 March 2023) of the top 20 articles containing big Earth data was 197. As shown in the previous subsections, the majority of the research carried out on big Earth data in the EMMENA region is applied.
Table 6.
Reference (Ref.), number of citations up to 13 March 2023 (Citations), geographical focus (Country), thematic area and research focus (LS: Landslides, FL: Floods, GQ: Groundwater Quality, SP: Soil Properties, FB: Forest Biomass, OL: Optimized Location/Site for Energy Plant, LU/LC: Land Use/Land Cover) of the top 20 highly cited papers which include big Earth data methods and techniques.
3.2.10. Other
This study also identified EO studies in the EMMENA region which are not included in any of the above thematic areas. These studies include animal species detection, identification and monitoring [191,192,193,194], mineralogy–petrology [195,196,197], sociodemographic characteristics [198,199,200,201], spatial analysis of cancer [202,203], healthcare [204,205], location selection of shopping malls [206], optimal siting of electric vehicle charging stations [207], evaluation of bike-share stations [208], paleoecology [209], and examining the walking accessibility, willingness, and travel conditions of residents [210].
4. Discussion
4.1. EO Studies in the EMMENA Region
Over the past years, there has been an increasing trend in EO research in the EMMENA region (Figure 8). However, the number of EO studies in the EMMENA region represents only 3% of the EO studies carried out worldwide. Also, as we have shown in Table 2, the amount of EO research is highly uneven between countries within the EMMENA region. Iran is the most active EMMENA country in terms of EO publications, as shown both from the number of publications and the author affiliations. However, from our analysis we found that almost half of the studies were conducted by researchers not affiliated with the EMMENA region. We assume that, to some extent, the barrier for the expansion of EO research can be attributed to the lack of collaborations and knowledge transfer within EMMENA countries. Towards this direction, the recent establishment of a Centre of Excellence acting as a digital innovation hub for EO in the EMMENA region is a significant advancement in expanding EO research and in seeking future collaborations and knowledge transfer schemes among the EMMENA countries [211].
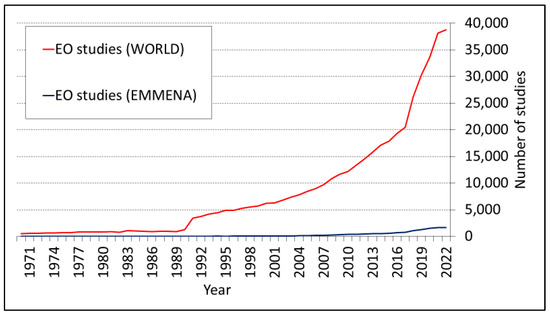
Figure 8.
Number of EO publications per year for the EMMENA region (blue line) and the world (red line).
The plethora of satellite data currently available are usually scattered among different platforms (Table 3), resulting in more time and work needed for data collection and preprocessing [18]. The development of a user-friendly central data hub (or data cubes) can resolve this issue. An example of such a central data hub is the GEO-CRADLE EU project which facilitates access to and sharing of geospatial data and information collected from satellites and ground-based networks in the North Africa, Middle East, and Balkans (NAMEBA) region.
4.2. EO Studies per Thematic Area: Limitations, Research Gaps, and Future Directions
A general limitation on EO research which was identified in all thematic areas is the lack of in situ (ground truth) data. This issue has many implications such as on the validation of the EO outputs and on the further development of algorithms and models. The increasing number of countries and organizations adopting open data policies will partially resolve this issue, but inevitably there is a need for research infrastructure investments, especially in data-scarce regions.
Our review revealed a wide range of EO applications in the thematic area of atmosphere. Similar to the findings of Imane et al. [30], we found that many studies in the EMMENA focused on dust (PM10/PM2.5), as this is a common problem among these countries. Also, most of the EMMENA countries are situated in water-scarce semi-arid and arid climate zones. Thus, as expected, EO research on precipitation estimates has a high research impact. In addition to this, the rise and peak of the coronavirus pandemic occurred within the period selected for this review, thus many studies related to the virus outbreak received high research interest. Future studies on the thematic area of atmosphere should focus on the development of EO methods for improved monitoring of air quality [30].
Most studies in the water thematic area focus on groundwater research, as shown both by the article review and the results of the citation topics. However, there is a range of topics where EO applications can contribute such as monitoring the water level of lakes, dams, and rivers with satellite radar altimeters and identifying the presence of different substances in water based on their unique spectral signatures, which can be measured by satellites with thermal and optical sensors and provide further information on water quality parameters (e.g., chlorophyll-a, total suspended sediments, colored dissolved organic matter) [212]. In addition to this, the management of transboundary rivers at a watershed level will be an emerging issue as water resources continue to diminish in the EMMENA region. Thus, EO applications may become a necessity in the emerging topic of hydrodiplomacy.
EO research in the agriculture thematic area covered a wide range of applications. According to the World Bank, due to population growth agricultural production will need to expand by approximately 70% by 2050 to cover the food need. Thus, it is important to develop sustainable farming practices, such as precision (smart) irrigation through EO. Such studies are having a great impact on agriculture, especially in water-scarce regions such as EMMENA. However, our review did not reveal high-impact studies on this topic. Also, there were no studies on the emerging subject of the photosynthetic activity of plants based on solar-induced fluorescence (SIF) which can be obtained by the Sentinel-5 satellite mission [213]. Furthermore, research on pest and disease detection, especially in the early stages, was limited. There is a great potential to advance EO research in this direction.
The thematic area of disaster risk reduction can be considered the most impactful in terms of research interest, as it has on average a higher number of citations than the other thematic areas. This was expected, as this thematic area deals with human casualties and economic losses. However, our review identified research carried out only on landslides and floods. Unexpectedly, forest fires were not included among the top 20 articles. The choice of the proper parameters needed and the variety of algorithms available (machine learning, artificial intelligence, hybrid) along with the rapid development in the field of big Earth data have created confusion on which approach is more suitable for landslide and flood mapping. Future studies should focus on the development of protocols which will guide researchers and stakeholders towards the selection of the most suitable algorithm or method based on the specific characteristics of their research. Services related to early warning and decision support systems will upgrade EO applications, especially in thematic areas dealing with hazards and human health [113,117,180]. The improvement of existing services or the continuous development of new systems will help stakeholders and the relevant authorities to take the appropriate actions aiming at reducing the number of human casualties and severe economic losses. Similar systems will be extremely useful in the thematic areas of atmosphere and agriculture, with applications regarding extreme weather warnings and irrigation support.
Research in specific thematic areas is surprisingly limited. The Mediterranean Sea is one of the busiest seas in the world, accounting for 20% of seaborne trade and over 200 million passengers [214]. Studies on ship detection and more particularly of those related to illegal activities were absent. In addition to this, the Mediterranean Sea is exposed to many risks such as rising CO2 emissions, pollution, marine litter, and collisions. However, this is not reflected by the number of studies carried out in the marine safety and security thematic area. We speculate that the reason for the low number of studies in this thematic area may be twofold: restrictions on data sharing which are often applied in the sea region due to security reasons and the insufficient resolution and revisiting time of existing non-commercial satellites which limit their ability to detect objects and the movement of these objects in time. Similarly, EO applications in the cultural heritage thematic area are very rare (1.4% of all EO applications) with the insufficient resolution of existing non-commercial satellites being identified as the main limitation. Finally, we expect that the EO research in the energy thematic area will attract more attention in the following years due to the gradual transition from fossil fuel to renewable energy.
5. Conclusions
The EMMENA region is facing many challenges related to climate change, environmental degradation, energy, water scarcity, and hazards. The ongoing development of EO parallel with advancement in the domain of big Earth data has provided the opportunity to better assess and address the various challenges. This work provides an overview of the existing EO applications in the EMMENA region, where 6647 articles were efficiently categorized into the following thematic areas: Atmosphere, water, agriculture, land, disaster risk reduction, cultural heritage, energy, marine safety and security, and other. The big Earth data thematic area was identified as horizontal. A total of 180 articles were further reviewed from the selection of the top 20 highly cited articles per thematic area.
The results from the top 20 articles revealed a high research interest in the thematic area of disaster risk reduction with almost two times higher number of citations than the second thematic area (water). The focus of these articles is limited to floods and landslides. The main knowledge gap was the lack of protocols and the development of early warning systems based on EO. The results also revealed limited research in specific EO applications for the water thematic area, which include water body monitoring through radar altimeters and water quality parameter estimation through thermal and optical satellite data. Also, EO research related to cultural heritage (1.4% of the total number of studies) and marine safety and security (0.9% of the total number of studies) was surprisingly rare. The main research interest in the thematic area of atmosphere was related to precipitation estimates, dust, and the impact of coronavirus on air quality. The thematic area of agriculture covered a wide range of EO applications (evapotranspiration estimation, land suitability for agriculture, irrigation mapping, agricultural land loss, crop monitoring, crop production, yield prediction, crop mapping, stem water potential monitoring, and crop water footprint estimation).
The study has also identified the top authors, research organizations, and funding agencies for the EMMENA region. Sentinel-2 data (60.8%) and Sentinel-1 data (35.4%) are the most widely used among the Sentinel missions. Similarly, Landsat 8 (83.2%) and Landsat 7 (10.0%) are the most widely used data sources among the Landsat missions. The ongoing development of big Earth data techniques and the increasing availability of satellite EO data will enhance the research capabilities in the aforementioned thematic areas.
Supplementary Materials
The following supporting information can be downloaded at: https://www.mdpi.com/article/10.3390/rs15174202/s1, Table S1: List of publications including author name, article title, author keywords and affiliations, times cited, and DOI.
Author Contributions
Conceptualization, methodology, validation, formal analysis: M.E., S.M., K.T. and K.N.; investigation, software, resources, data curation: M.E., E.E., K.F. (Kyriaki Fotiou), K.F. (Konstantinos Fragkos), G.L., C.T., C.F.P., C.P., M.M. and S.N.; writing—original draft preparation, M.E.; writing—review and editing, A.A., G.K., G.S., C.K. and D.H.; visualization, M.E. and S.M.; supervision, D.H.; project administration, D.H.; funding acquisition, D.H. All authors have read and agreed to the published version of the manuscript.
Funding
This research was funded by ‘EXCELSIOR’ project (European Union’s Horizon 2020 research and innovation programme), grant number “857510”.
Data Availability Statement
The data are contained within the article and were extracted from the Web of Science™ database (https://www.webofscience.com/wos/woscc/basic-search, accessed on 13 March 2023).
Acknowledgments
The authors acknowledge the “EXCELSIOR”: ERATOSTHENES: Eχcellence Research Centre for Earth Surveillance and Space-Based Monitoring of the Environment H2020 Widespread Teaming project (www.excelsior2020.eu, accessed on 13 March 2023). The “EXCELSIOR” project has received funding from the European Union’s Horizon 2020 Research and Innovation Programme under Grant Agreement No 857510, from the Government of the Republic of Cyprus through the Directorate General for the European Programmes, Coordination and Development and the Cyprus University of Technology.
Conflicts of Interest
The authors declare no conflict of interest.
References
- Kansakar, P.; Hossain, F. A Review of Applications of Satellite Earth Observation Data for Global Societal Benefit and Stewardship of Planet Earth. Space Policy 2016, 36, 46–54. [Google Scholar] [CrossRef]
- Morsy, M.; Dietrich, P.; Scholten, T.; Michaelides, S.; Borg, E.; Sherief, Y. Chapter 7—The Potential of Using Satellite-Related Precipitation Data Sources in Arid Regions. In Precipitation Science; Michaelides, S., Ed.; Elsevier: Amsterdam, The Netherlands, 2022; pp. 201–237. ISBN 978-0-12-822973-6. [Google Scholar]
- Morsy, M.; Michaelides, S.; Scholten, T.; Dietrich, P. Monitoring and Integrating the Changes in Vegetated Areas with the Rate of Groundwater Use in Arid Regions. Remote Sens. 2022, 14, 5767. [Google Scholar] [CrossRef]
- Al Sayah, M.J.; Abdallah, C.; Khouri, M.; Nedjai, R.; Darwich, T. A Framework for Climate Change Assessment in Mediterranean Data-Sparse Watersheds Using Remote Sensing and ARIMA Modeling. Theor. Appl. Clim. 2021, 143, 639–658. [Google Scholar] [CrossRef]
- Milewski, A.; Elkadiri, R.; Durham, M. Assessment and Comparison of TMPA Satellite Precipitation Products in Varying Climatic and Topographic Regimes in Morocco. Remote Sens. 2015, 7, 5697–5717. [Google Scholar] [CrossRef]
- Themistocleous, K.; Hadjimitsis, D.G.; Michaelides, S.; Neocleous, K.; Schreier, G.; Ansmann, A.; Kontoes, H.; Komodromos, G. Excelsior: Earth Observation Opportunities for Excellence in the Emmena Region. In Proceedings of the Eighth International Conference on Remote Sensing and Geoinformation of the Environment (RSCy2020), Paphos, Cyprus, 26 August 2020; SPIE: Bellingham, WA, USA, 2020; Volume 11524, pp. 209–215. [Google Scholar]
- World Bank Open Data. Available online: https://data.worldbank.org (accessed on 16 May 2023).
- Seyfi, S.; Hallz, C.M. Cultural Heritage Tourism in the MENA: Introduction and Background. In Cultural and Heritage Tourism in the Middle East and North Africa; Routledge: Milton, UK, 2020; ISBN 978-0-429-27906-5. [Google Scholar]
- Kassouri, Y.; Altıntaş, H. Human Well-Being versus Ecological Footprint in MENA Countries: A Trade-Off? J. Environ. Manag. 2020, 263, 110405. [Google Scholar] [CrossRef] [PubMed]
- Nathaniel, S.P.; Adeleye, N.; Adedoyin, F.F. Natural Resource Abundance, Renewable Energy, and Ecological Footprint Linkage in MENA Countries. Stud. Appl. Econ. 2021, 39, 27168–27179. [Google Scholar] [CrossRef]
- Usman, O.; Rafindadi, A.A.; Sarkodie, S.A. Conflicts and Ecological Footprint in MENA Countries: Implications for Sustainable Terrestrial Ecosystem. Environ. Sci. Pollut. Res. 2021, 28, 59988–59999. [Google Scholar] [CrossRef]
- Zdruli, P. Land Resources of the Mediterranean: Status, Pressures, Trends and Impacts on Future Regional Development. Land Degrad. Dev. 2014, 25, 373–384. [Google Scholar] [CrossRef]
- Lelieveld, J.; Proestos, Y.; Hadjinicolaou, P.; Tanarhte, M.; Tyrlis, E.; Zittis, G. Strongly Increasing Heat Extremes in the Middle East and North Africa (MENA) in the 21st Century. Clim. Chang. 2016, 137, 245–260. [Google Scholar] [CrossRef]
- Waha, K.; Krummenauer, L.; Adams, S.; Aich, V.; Baarsch, F.; Coumou, D.; Fader, M.; Hoff, H.; Jobbins, G.; Marcus, R.; et al. Climate Change Impacts in the Middle East and Northern Africa (MENA) Region and Their Implications for Vulnerable Population Groups. Reg. Environ. Chang. 2017, 17, 1623–1638. [Google Scholar] [CrossRef]
- Lelieveld, J.; Hadjinicolaou, P.; Kostopoulou, E.; Chenoweth, J.; El Maayar, M.; Giannakopoulos, C.; Hannides, C.; Lange, M.A.; Tanarhte, M.; Tyrlis, E.; et al. Climate Change and Impacts in the Eastern Mediterranean and the Middle East. Clim. Chang. 2012, 114, 667–687. [Google Scholar] [CrossRef]
- Neira, M.; Erguler, K.; Ahmady-Birgani, H.; AL-Hmoud, N.D.; Fears, R.; Gogos, C.; Hobbhahn, N.; Koliou, M.; Kostrikis, L.G.; Lelieveld, J.; et al. Climate Change and Human Health in the Eastern Mediterranean and Middle East: Literature Review, Research Priorities and Policy Suggestions. Environ. Res. 2023, 216, 114537. [Google Scholar] [CrossRef]
- Dabbeek, J.; Silva, V.; Galasso, C.; Smith, A. Probabilistic Earthquake and Flood Loss Assessment in the Middle East. Int. J. Disaster Risk Reduct. 2020, 49, 101662. [Google Scholar] [CrossRef]
- Gomes, V.C.F.; Queiroz, G.R.; Ferreira, K.R. An Overview of Platforms for Big Earth Observation Data Management and Analysis. Remote Sens. 2020, 12, 1253. [Google Scholar] [CrossRef]
- Soille, P.; Burger, A.; De Marchi, D.; Kempeneers, P.; Rodriguez, D.; Syrris, V.; Vasilev, V. A Versatile Data-Intensive Computing Platform for Information Retrieval from Big Geospatial Data. Future Gener. Comput. Syst. 2018, 81, 30–40. [Google Scholar] [CrossRef]
- Guo, H. Big Earth Data: A New Frontier in Earth and Information Sciences. Big Earth Data 2017, 1, 4–20. [Google Scholar] [CrossRef]
- Guo, H.; Liu, Z.; Jiang, H.; Wang, C.; Liu, J.; Liang, D. Big Earth Data: A New Challenge and Opportunity for Digital Earth’s Development. Int. J. Digit. Earth 2017, 10, 1–12. [Google Scholar] [CrossRef]
- Fingas, M.; Brown, C.E. A Review of Oil Spill Remote Sensing. Sensors 2018, 18, 91. [Google Scholar] [CrossRef]
- Kuenzer, C.; Bluemel, A.; Gebhardt, S.; Quoc, T.V.; Dech, S. Remote Sensing of Mangrove Ecosystems: A Review. Remote Sens. 2011, 3, 878–928. [Google Scholar] [CrossRef]
- Maxwell, A.E.; Warner, T.A.; Fang, F. Implementation of Machine-Learning Classification in Remote Sensing: An Applied Review. Int. J. Remote Sens. 2018, 39, 2784–2817. [Google Scholar] [CrossRef]
- Mulder, V.L.; de Bruin, S.; Schaepman, M.E.; Mayr, T.R. The Use of Remote Sensing in Soil and Terrain Mapping—A Review. Geoderma 2011, 162, 1–19. [Google Scholar] [CrossRef]
- White, J.C.; Coops, N.C.; Wulder, M.A.; Vastaranta, M.; Hilker, T.; Tompalski, P. Remote Sensing Technologies for Enhancing Forest Inventories: A Review. Can. J. Remote Sens. 2016, 42, 619–641. [Google Scholar] [CrossRef]
- Kattenborn, T.; Leitloff, J.; Schiefer, F.; Hinz, S. Review on Convolutional Neural Networks (CNN) in Vegetation Remote Sensing. ISPRS J. Photogramm. Remote Sens. 2021, 173, 24–49. [Google Scholar] [CrossRef]
- Weiss, M.; Jacob, F.; Duveiller, G. Remote Sensing for Agricultural Applications: A Meta-Review. Remote Sens. Environ. 2020, 236, 111402. [Google Scholar] [CrossRef]
- Talukdar, S.; Singha, P.; Mahato, S.; Shahfahad; Pal, S.; Liou, Y.-A.; Rahman, A. Land-Use Land-Cover Classification by Machine Learning Classifiers for Satellite Observations—A Review. Remote Sens. 2020, 12, 1135. [Google Scholar] [CrossRef]
- Imane, S.; Oumaima, B.; Kenza, K.; Laila, I.; Youssef, E.M.; Zineb, S.; Mohamed, E. jarmouni A Review on Climate, Air Pollution, and Health in North Africa. Curr. Environ. Health Rep. 2022, 9, 276–298. [Google Scholar] [CrossRef]
- Traag, V.A.; Waltman, L.; van Eck, N.J. From Louvain to Leiden: Guaranteeing Well-Connected Communities. Sci. Rep. 2019, 9, 5233. [Google Scholar] [CrossRef]
- IMF Country Information. Available online: https://www.imf.org/en/Countries (accessed on 16 May 2023).
- Hosseini-Moghari, S.-M.; Tang, Q. Validation of GPM IMERG V05 and V06 Precipitation Products over Iran. J. Hydrometeorol. 2020, 21, 1011–1037. [Google Scholar] [CrossRef]
- Salman, S.A.; Shahid, S.; Ismail, T.; Al-Abadi, A.M.; Wang, X.; Chung, E.-S. Selection of Gridded Precipitation Data for Iraq Using Compromise Programming. Measurement 2019, 132, 87–98. [Google Scholar] [CrossRef]
- Amjad, M.; Yilmaz, M.T.; Yucel, I.; Yilmaz, K.K. Performance Evaluation of Satellite- and Model-Based Precipitation Products over Varying Climate and Complex Topography. J. Hydrol. 2020, 584, 124707. [Google Scholar] [CrossRef]
- Mahmoud, M.T.; Al-Zahrani, M.A.; Sharif, H.O. Assessment of Global Precipitation Measurement Satellite Products over Saudi Arabia. J. Hydrol. 2018, 559, 1–12. [Google Scholar] [CrossRef]
- Nashwan, M.S.; Shahid, S.; Wang, X. Assessment of Satellite-Based Precipitation Measurement Products over the Hot Desert Climate of Egypt. Remote Sens. 2019, 11, 555. [Google Scholar] [CrossRef]
- Yassin, M.F.; Almutairi, S.K.; Al-Hemoud, A. Dust Storms Backward Trajectories’ and Source Identification over Kuwait. Atmos. Res. 2018, 212, 158–171. [Google Scholar] [CrossRef]
- Beegum, S.N.; Gherboudj, I.; Chaouch, N.; Temimi, M.; Ghedira, H. Simulation and Analysis of Synoptic Scale Dust Storms over the Arabian Peninsula. Atmos. Res. 2018, 199, 62–81. [Google Scholar] [CrossRef]
- Boroughani, M.; Pourhashemi, S.; Hashemi, H.; Salehi, M.; Amirahmadi, A.; Asadi, M.A.Z.; Berndtsson, R. Application of Remote Sensing Techniques and Machine Learning Algorithms in Dust Source Detection and Dust Source Susceptibility Mapping. Ecol. Inform. 2020, 56, 101059. [Google Scholar] [CrossRef]
- Gholami, H.; Mohamadifar, A.; Collins, A.L. Spatial Mapping of the Provenance of Storm Dust: Application of Data Mining and Ensemble Modelling. Atmos. Res. 2020, 233, 104716. [Google Scholar] [CrossRef]
- Namdari, S.; Karimi, N.; Sorooshian, A.; Mohammadi, G.; Sehatkashani, S. Impacts of Climate and Synoptic Fluctuations on Dust Storm Activity over the Middle East. Atmos. Environ. 2018, 173, 265–276. [Google Scholar] [CrossRef] [PubMed]
- Bauwens, M.; Compernolle, S.; Stavrakou, T.; Müller, J.-F.; van Gent, J.; Eskes, H.; Levelt, P.F.; van der A, R.; Veefkind, J.P.; Vlietinck, J.; et al. Impact of Coronavirus Outbreak on NO2 Pollution Assessed Using TROPOMI and OMI Observations. Geophys. Res. Lett. 2020, 47, e2020GL087978. [Google Scholar] [CrossRef]
- Broomandi, P.; Karaca, F.; Nikfal, A.; Jahanbakhshi, A.; Tamjidi, M.; Kim, J.R. Impact of COVID-19 Event on the Air Quality in Iran. Aerosol Air Qual. Res. 2020, 20, 1793–1804. [Google Scholar] [CrossRef]
- Hashim, B.M.; Al-Naseri, S.K.; Al-Maliki, A.; Al-Ansari, N. Impact of COVID-19 Lockdown on NO2, O3, PM2.5 and PM10 Concentrations and Assessing Air Quality Changes in Baghdad, Iraq. Sci. Total Environ. 2021, 754, 141978. [Google Scholar] [CrossRef]
- Mostafa, M.K.; Gamal, G.; Wafiq, A. The Impact of COVID 19 on Air Pollution Levels and Other Environmental Indicators—A Case Study of Egypt. J. Environ. Manag. 2021, 277, 111496. [Google Scholar] [CrossRef] [PubMed]
- Reuter, M.; Buchwitz, M.; Schneising, O.; Krautwurst, S.; O’Dell, C.W.; Richter, A.; Bovensmann, H.; Burrows, J.P. Towards Monitoring Localized CO2 Emissions from Space: Co-Located Regional CO2 and NO2 Enhancements Observed by the OCO-2 and S5P Satellites. Atmos. Chem. Phys. 2019, 19, 9371–9383. [Google Scholar] [CrossRef]
- Lamchin, M.; Lee, W.-K.; Jeon, S.W.; Wang, S.W.; Lim, C.H.; Song, C.; Sung, M. Long-Term Trend and Correlation between Vegetation Greenness and Climate Variables in Asia Based on Satellite Data. Sci. Total Environ. 2018, 618, 1089–1095. [Google Scholar] [CrossRef] [PubMed]
- Mahmoud, S.H.; Gan, T.Y. Impact of Anthropogenic Climate Change and Human Activities on Environment and Ecosystem Services in Arid Regions. Sci. Total Environ. 2018, 633, 1329–1344. [Google Scholar] [CrossRef]
- Hossein Mardi, A.; Khaghani, A.; MacDonald, A.B.; Nguyen, P.; Karimi, N.; Heidary, P.; Karimi, N.; Saemian, P.; Sehatkashani, S.; Tajrishy, M.; et al. The Lake Urmia Environmental Disaster in Iran: A Look at Aerosol Pollution. Sci. Total Environ. 2018, 633, 42–49. [Google Scholar] [CrossRef]
- Alizadeh, M.R.; Nikoo, M.R. A Fusion-Based Methodology for Meteorological Drought Estimation Using Remote Sensing Data. Remote Sens. Environ. 2018, 211, 229–247. [Google Scholar] [CrossRef]
- Tariq, M.A.; Shah, M.; Hernández-Pajares, M.; Iqbal, T. Pre-Earthquake Ionospheric Anomalies before Three Major Earthquakes by GPS-TEC and GIM-TEC Data during 2015–2017. Adv. Space Res. 2019, 63, 2088–2099. [Google Scholar] [CrossRef]
- Mallick, J.; Khan, R.A.; Ahmed, M.; Alqadhi, S.D.; Alsubih, M.; Falqi, I.; Hasan, M.A. Modeling Groundwater Potential Zone in a Semi-Arid Region of Aseer Using Fuzzy-AHP and Geoinformation Techniques. Water 2019, 11, 2656. [Google Scholar] [CrossRef]
- Arabameri, A.; Rezaei, K.; Cerda, A.; Lombardo, L.; Rodrigo-Comino, J. GIS-Based Groundwater Potential Mapping in Shahroud Plain, Iran. A Comparison among Statistical (Bivariate and Multivariate), Data Mining and MCDM Approaches. Sci. Total Environ. 2019, 658, 160–177. [Google Scholar] [CrossRef] [PubMed]
- Golkarian, A.; Naghibi, S.A.; Kalantar, B.; Pradhan, B. Groundwater Potential Mapping Using C5.0, Random Forest, and Multivariate Adaptive Regression Spline Models in GIS. Environ. Monit Assess 2018, 190, 149. [Google Scholar] [CrossRef]
- Khosravi, K.; Panahi, M.; Tien Bui, D. Spatial Prediction of Groundwater Spring Potential Mapping Based on an Adaptive Neuro-Fuzzy Inference System and Metaheuristic Optimization. Hydrol. Earth Syst. Sci. 2018, 22, 4771–4792. [Google Scholar] [CrossRef]
- Kordestani, M.D.; Naghibi, S.A.; Hashemi, H.; Ahmadi, K.; Kalantar, B.; Pradhan, B. Groundwater Potential Mapping Using a Novel Data-Mining Ensemble Model. Hydrogeol. J. 2019, 27, 211–224. [Google Scholar] [CrossRef]
- Miraki, S.; Zanganeh, S.H.; Chapi, K.; Singh, V.P.; Shirzadi, A.; Shahabi, H.; Pham, B.T. Mapping Groundwater Potential Using a Novel Hybrid Intelligence Approach. Water Resour. Manag. 2019, 33, 281–302. [Google Scholar] [CrossRef]
- Naghibi, S.A.; Pourghasemi, H.R.; Abbaspour, K. A Comparison between Ten Advanced and Soft Computing Models for Groundwater Qanat Potential Assessment in Iran Using R and GIS. Theor. Appl. Clim. 2018, 131, 967–984. [Google Scholar] [CrossRef]
- Ostad-Ali-Askari, K.; Shayannejad, M. Quantity and Quality Modelling of Groundwater to Manage Water Resources in Isfahan-Borkhar Aquifer. Environ. Dev. Sustain. 2021, 23, 15943–15959. [Google Scholar] [CrossRef]
- Benjmel, K.; Amraoui, F.; Boutaleb, S.; Ouchchen, M.; Tahiri, A.; Touab, A. Mapping of Groundwater Potential Zones in Crystalline Terrain Using Remote Sensing, GIS Techniques, and Multicriteria Data Analysis (Case of the Ighrem Region, Western Anti-Atlas, Morocco). Water 2020, 12, 471. [Google Scholar] [CrossRef]
- Tien Bui, D.; Shirzadi, A.; Chapi, K.; Shahabi, H.; Pradhan, B.; Pham, B.T.; Singh, V.P.; Chen, W.; Khosravi, K.; Bin Ahmad, B.; et al. A Hybrid Computational Intelligence Approach to Groundwater Spring Potential Mapping. Water 2019, 11, 2013. [Google Scholar] [CrossRef]
- Abbasnia, A.; Alimohammadi, M.; Mahvi, A.H.; Nabizadeh, R.; Yousefi, M.; Mohammadi, A.A.; Pasalari, H.; Mirzabeigi, M. Assessment of Groundwater Quality and Evaluation of Scaling and Corrosiveness Potential of Drinking Water Samples in Villages of Chabahr City, Sistan and Baluchistan Province in Iran. Data Brief 2018, 16, 182–192. [Google Scholar] [CrossRef] [PubMed]
- Abbasnia, A.; Radfard, M.; Mahvi, A.H.; Nabizadeh, R.; Yousefi, M.; Soleimani, H.; Alimohammadi, M. Groundwater Quality Assessment for Irrigation Purposes Based on Irrigation Water Quality Index and Its Zoning with GIS in the Villages of Chabahar, Sistan and Baluchistan, Iran. Data Brief 2018, 19, 623–631. [Google Scholar] [CrossRef] [PubMed]
- Abbasnia, A.; Yousefi, N.; Mahvi, A.H.; Nabizadeh, R.; Radfard, M.; Yousefi, M.; Alimohammadi, M. Evaluation of Groundwater Quality Using Water Quality Index and Its Suitability for Assessing Water for Drinking and Irrigation Purposes: Case Study of Sistan and Baluchistan Province (Iran). Hum. Ecol. Risk Assess. Int. J. 2019, 25, 988–1005. [Google Scholar] [CrossRef]
- Rabeiy, R.E. Assessment and Modeling of Groundwater Quality Using WQI and GIS in Upper Egypt Area. Environ. Sci. Pollut. Res. 2018, 25, 30808–30817. [Google Scholar] [CrossRef]
- Yousefi, M.; Ghalehaskar, S.; Asghari, F.B.; Ghaderpoury, A.; Dehghani, M.H.; Ghaderpoori, M.; Mohammadi, A.A. Distribution of Fluoride Contamination in Drinking Water Resources and Health Risk Assessment Using Geographic Information System, Northwest Iran. Regul. Toxicol. Pharmacol. 2019, 107, 104408. [Google Scholar] [CrossRef]
- Sajedi-Hosseini, F.; Malekian, A.; Choubin, B.; Rahmati, O.; Cipullo, S.; Coulon, F.; Pradhan, B. A Novel Machine Learning-Based Approach for the Risk Assessment of Nitrate Groundwater Contamination. Sci. Total Environ. 2018, 644, 954–962. [Google Scholar] [CrossRef] [PubMed]
- Jozaghi, A.; Alizadeh, B.; Hatami, M.; Flood, I.; Khorrami, M.; Khodaei, N.; Ghasemi Tousi, E. A Comparative Study of the AHP and TOPSIS Techniques for Dam Site Selection Using GIS: A Case Study of Sistan and Baluchestan Province, Iran. Geosciences 2018, 8, 494. [Google Scholar] [CrossRef]
- Jalilvand, E.; Tajrishy, M.; Ghazi Zadeh Hashemi, S.A.; Brocca, L. Quantification of Irrigation Water Using Remote Sensing of Soil Moisture in a Semi-Arid Region. Remote Sens. Environ. 2019, 231, 111226. [Google Scholar] [CrossRef]
- Zamani Losgedaragh, S.; Rahimzadegan, M. Evaluation of SEBS, SEBAL, and METRIC Models in Estimation of the Evaporation from the Freshwater Lakes (Case Study: Amirkabir Dam, Iran). J. Hydrol. 2018, 561, 523–531. [Google Scholar] [CrossRef]
- Naghibi, S.A.; Hashemi, H.; Berndtsson, R.; Lee, S. Application of Extreme Gradient Boosting and Parallel Random Forest Algorithms for Assessing Groundwater Spring Potential Using DEM-Derived Factors. J. Hydrol. 2020, 589, 125197. [Google Scholar] [CrossRef]
- Huang, D.; Wang, J.; Khayatnezhad, M. Estimation of Actual Evapotranspiration Using Soil Moisture Balance and Remote Sensing. Iran J. Sci. Technol. Trans. Civ. Eng. 2021, 45, 2779–2786. [Google Scholar] [CrossRef]
- Jamshidi, S.; Zand-parsa, S.; Pakparvar, M.; Niyogi, D. Evaluation of Evapotranspiration over a Semiarid Region Using Multiresolution Data Sources. J. Hydrometeorol. 2019, 20, 947–964. [Google Scholar] [CrossRef]
- Rahimzadegan, M.; Janani, A. Estimating Evapotranspiration of Pistachio Crop Based on SEBAL Algorithm Using Landsat 8 Satellite Imagery. Agric. Water Manag. 2019, 217, 383–390. [Google Scholar] [CrossRef]
- Mahmoud, S.H.; Gan, T.Y. Irrigation Water Management in Arid Regions of Middle East: Assessing Spatio-Temporal Variation of Actual Evapotranspiration through Remote Sensing Techniques and Meteorological Data. Agric. Water Manag. 2019, 212, 35–47. [Google Scholar] [CrossRef]
- Seyedmohammadi, J.; Sarmadian, F.; Jafarzadeh, A.A.; McDowell, R.W. Development of a Model Using Matter Element, AHP and GIS Techniques to Assess the Suitability of Land for Agriculture. Geoderma 2019, 352, 80–95. [Google Scholar] [CrossRef]
- Ostovari, Y.; Honarbakhsh, A.; Sangoony, H.; Zolfaghari, F.; Maleki, K.; Ingram, B. GIS and Multi-Criteria Decision-Making Analysis Assessment of Land Suitability for Rapeseed Farming in Calcareous Soils of Semi-Arid Regions. Ecol. Indic. 2019, 103, 479–487. [Google Scholar] [CrossRef]
- Aldababseh, A.; Temimi, M.; Maghelal, P.; Branch, O.; Wulfmeyer, V. Multi-Criteria Evaluation of Irrigated Agriculture Suitability to Achieve Food Security in an Arid Environment. Sustainability 2018, 10, 803. [Google Scholar] [CrossRef]
- Seyedmohammadi, J.; Sarmadian, F.; Jafarzadeh, A.A.; Ghorbani, M.A.; Shahbazi, F. Application of SAW, TOPSIS and Fuzzy TOPSIS Models in Cultivation Priority Planning for Maize, Rapeseed and Soybean Crops. Geoderma 2018, 310, 178–190. [Google Scholar] [CrossRef]
- Ennaji, W.; Barakat, A.; El Baghdadi, M.; Oumenskou, H.; Aadraoui, M.; Karroum, L.A.; Hilali, A. GIS-Based Multi-Criteria Land Suitability Analysis for Sustainable Agriculture in the Northeast Area of Tadla Plain (Morocco). J. Earth Syst. Sci. 2018, 127, 79. [Google Scholar] [CrossRef]
- Dedeoğlu, M.; Dengiz, O. Generating of Land Suitability Index for Wheat with Hybrid System Aproach Using AHP and GIS. Comput. Electron. Agric. 2019, 167, 105062. [Google Scholar] [CrossRef]
- Tercan, E.; Dereli, M.A. Development of a Land Suitability Model for Citrus Cultivation Using GIS and Multi-Criteria Assessment Techniques in Antalya Province of Turkey. Ecol. Indic. 2020, 117, 106549. [Google Scholar] [CrossRef]
- Bousbih, S.; Zribi, M.; El Hajj, M.; Baghdadi, N.; Lili-Chabaane, Z.; Gao, Q.; Fanise, P. Soil Moisture and Irrigation Mapping in A Semi-Arid Region, Based on the Synergetic Use of Sentinel-1 and Sentinel-2 Data. Remote Sens. 2018, 10, 1953. [Google Scholar] [CrossRef]
- Radwan, T.M.; Blackburn, G.A.; Whyatt, J.D.; Atkinson, P.M. Dramatic Loss of Agricultural Land Due to Urban Expansion Threatens Food Security in the Nile Delta, Egypt. Remote Sens. 2019, 11, 332. [Google Scholar] [CrossRef]
- Sadeh, Y.; Zhu, X.; Dunkerley, D.; Walker, J.P.; Zhang, Y.; Rozenstein, O.; Manivasagam, V.S.; Chenu, K. Fusion of Sentinel-2 and PlanetScope Time-Series Data into Daily 3 m Surface Reflectance and Wheat LAI Monitoring. Int. J. Appl. Earth Obs. Geoinf. 2021, 96, 102260. [Google Scholar] [CrossRef]
- Nguyen, M.D.; Baez-Villanueva, O.M.; Bui, D.D.; Nguyen, P.T.; Ribbe, L. Harmonization of Landsat and Sentinel 2 for Crop Monitoring in Drought Prone Areas: Case Studies of Ninh Thuan (Vietnam) and Bekaa (Lebanon). Remote Sens. 2020, 12, 281. [Google Scholar] [CrossRef]
- Qader, S.H.; Dash, J.; Atkinson, P.M. Forecasting Wheat and Barley Crop Production in Arid and Semi-Arid Regions Using Remotely Sensed Primary Productivity and Crop Phenology: A Case Study in Iraq. Sci. Total Environ. 2018, 613–614, 250–262. [Google Scholar] [CrossRef]
- Sharifi, A. Yield Prediction with Machine Learning Algorithms and Satellite Images. J. Sci. Food Agric. 2021, 101, 891–896. [Google Scholar] [CrossRef] [PubMed]
- Ashourloo, D.; Shahrabi, H.S.; Azadbakht, M.; Aghighi, H.; Nematollahi, H.; Alimohammadi, A.; Matkan, A.A. Automatic Canola Mapping Using Time Series of Sentinel 2 Images. ISPRS J. Photogramm. Remote Sens. 2019, 156, 63–76. [Google Scholar] [CrossRef]
- Helman, D.; Bahat, I.; Netzer, Y.; Ben-Gal, A.; Alchanatis, V.; Peeters, A.; Cohen, Y. Using Time Series of High-Resolution Planet Satellite Images to Monitor Grapevine Stem Water Potential in Commercial Vineyards. Remote Sens. 2018, 10, 1615. [Google Scholar] [CrossRef]
- Elbeltagi, A.; Deng, J.; Wang, K.; Hong, Y. Crop Water Footprint Estimation and Modeling Using an Artificial Neural Network Approach in the Nile Delta, Egypt. Agric. Water Manag. 2020, 235, 106080. [Google Scholar] [CrossRef]
- Arabameri, A.; Pradhan, B.; Rezaei, K. Gully Erosion Zonation Mapping Using Integrated Geographically Weighted Regression with Certainty Factor and Random Forest Models in GIS. J. Environ. Manag. 2019, 232, 928–942. [Google Scholar] [CrossRef]
- Arabameri, A.; Rezaei, K.; Pourghasemi, H.R.; Lee, S.; Yamani, M. GIS-Based Gully Erosion Susceptibility Mapping: A Comparison among Three Data-Driven Models and AHP Knowledge-Based Technique. Environ. Earth Sci 2018, 77, 628. [Google Scholar] [CrossRef]
- Arabameri, A.; Pradhan, B.; Pourghasemi, H.R.; Rezaei, K.; Kerle, N. Spatial Modelling of Gully Erosion Using GIS and R Programing: A Comparison among Three Data Mining Algorithms. Appl. Sci. 2018, 8, 1369. [Google Scholar] [CrossRef]
- Garosi, Y.; Sheklabadi, M.; Conoscenti, C.; Pourghasemi, H.R.; Van Oost, K. Assessing the Performance of GIS- Based Machine Learning Models with Different Accuracy Measures for Determining Susceptibility to Gully Erosion. Sci. Total Environ. 2019, 664, 1117–1132. [Google Scholar] [CrossRef]
- Zabihi, M.; Mirchooli, F.; Motevalli, A.; Khaledi Darvishan, A.; Pourghasemi, H.R.; Zakeri, M.A.; Sadighi, F. Spatial Modelling of Gully Erosion in Mazandaran Province, Northern Iran. CATENA 2018, 161, 1–13. [Google Scholar] [CrossRef]
- Ameri, A.A.; Pourghasemi, H.R.; Cerda, A. Erodibility Prioritization of Sub-Watersheds Using Morphometric Parameters Analysis and Its Mapping: A Comparison among TOPSIS, VIKOR, SAW, and CF Multi-Criteria Decision Making Models. Sci. Total Environ. 2018, 613–614, 1385–1400. [Google Scholar] [CrossRef]
- Jazouli, A.E.; Barakat, A.; Khellouk, R.; Rais, J.; Baghdadi, M.E. Remote Sensing and GIS Techniques for Prediction of Land Use Land Cover Change Effects on Soil Erosion in the High Basin of the Oum Er Rbia River (Morocco). Remote Sens. Appl. Soc. Environ. 2019, 13, 361–374. [Google Scholar] [CrossRef]
- Ghorbanian, A.; Kakooei, M.; Amani, M.; Mahdavi, S.; Mohammadzadeh, A.; Hasanlou, M. Improved Land Cover Map of Iran Using Sentinel Imagery within Google Earth Engine and a Novel Automatic Workflow for Land Cover Classification Using Migrated Training Samples. ISPRS J. Photogramm. Remote Sens. 2020, 167, 276–288. [Google Scholar] [CrossRef]
- Mansour, S.; Al-Belushi, M.; Al-Awadhi, T. Monitoring Land Use and Land Cover Changes in the Mountainous Cities of Oman Using GIS and CA-Markov Modelling Techniques. Land Use Policy 2020, 91, 104414. [Google Scholar] [CrossRef]
- Mohajane, M.; Essahlaoui, A.; Oudija, F.; Hafyani, M.E.; Hmaidi, A.E.; Ouali, A.E.; Randazzo, G.; Teodoro, A.C. Land Use/Land Cover (LULC) Using Landsat Data Series (MSS, TM, ETM+ and OLI) in Azrou Forest, in the Central Middle Atlas of Morocco. Environments 2018, 5, 131. [Google Scholar] [CrossRef]
- Rasul, A.; Balzter, H.; Ibrahim, G.R.F.; Hameed, H.M.; Wheeler, J.; Adamu, B.; Ibrahim, S.; Najmaddin, P.M. Applying Built-Up and Bare-Soil Indices from Landsat 8 to Cities in Dry Climates. Land 2018, 7, 81. [Google Scholar] [CrossRef]
- Shirani-bidabadi, N.; Nasrabadi, T.; Faryadi, S.; Larijani, A.; Shadman Roodposhti, M. Evaluating the Spatial Distribution and the Intensity of Urban Heat Island Using Remote Sensing, Case Study of Isfahan City in Iran. Sustain. Cities Soc. 2019, 45, 686–692. [Google Scholar] [CrossRef]
- Weng, Q.; Firozjaei, M.K.; Sedighi, A.; Kiavarz, M.; Alavipanah, S.K. Statistical Analysis of Surface Urban Heat Island Intensity Variations: A Case Study of Babol City, Iran. GISci. Remote Sens. 2019, 56, 576–604. [Google Scholar] [CrossRef]
- Cetin, M.; Adiguzel, F.; Gungor, S.; Kaya, E.; Sancar, M.C. Evaluation of Thermal Climatic Region Areas in Terms of Building Density in Urban Management and Planning for Burdur, Turkey. Air Qual. Atmos. Health 2019, 12, 1103–1112. [Google Scholar] [CrossRef]
- Zeraatpisheh, M.; Ayoubi, S.; Jafari, A.; Tajik, S.; Finke, P. Digital Mapping of Soil Properties Using Multiple Machine Learning in a Semi-Arid Region, Central Iran. Geoderma 2019, 338, 445–452. [Google Scholar] [CrossRef]
- Zeraatpisheh, M.; Jafari, A.; Bagheri Bodaghabadi, M.; Ayoubi, S.; Taghizadeh-Mehrjardi, R.; Toomanian, N.; Kerry, R.; Xu, M. Conventional and Digital Soil Mapping in Iran: Past, Present, and Future. CATENA 2020, 188, 104424. [Google Scholar] [CrossRef]
- Amazirh, A.; Merlin, O.; Er-Raki, S.; Gao, Q.; Rivalland, V.; Malbeteau, Y.; Khabba, S.; Escorihuela, M.J. Retrieving Surface Soil Moisture at High Spatio-Temporal Resolution from a Synergy between Sentinel-1 Radar and Landsat Thermal Data: A Study Case over Bare Soil. Remote Sens. Environ. 2018, 211, 321–337. [Google Scholar] [CrossRef]
- Fathololoumi, S.; Vaezi, A.R.; Alavipanah, S.K.; Ghorbani, A.; Saurette, D.; Biswas, A. Improved Digital Soil Mapping with Multitemporal Remotely Sensed Satellite Data Fusion: A Case Study in Iran. Sci. Total Environ. 2020, 721, 137703. [Google Scholar] [CrossRef] [PubMed]
- Vafaei, S.; Soosani, J.; Adeli, K.; Fadaei, H.; Naghavi, H.; Pham, T.D.; Tien Bui, D. Improving Accuracy Estimation of Forest Aboveground Biomass Based on Incorporation of ALOS-2 PALSAR-2 and Sentinel-2A Imagery and Machine Learning: A Case Study of the Hyrcanian Forest Area (Iran). Remote Sens. 2018, 10, 172. [Google Scholar] [CrossRef]
- Reichenbach, P.; Rossi, M.; Malamud, B.D.; Mihir, M.; Guzzetti, F. A Review of Statistically-Based Landslide Susceptibility Models. Earth-Sci. Rev. 2018, 180, 60–91. [Google Scholar] [CrossRef]
- Merghadi, A.; Yunus, A.P.; Dou, J.; Whiteley, J.; ThaiPham, B.; Bui, D.T.; Avtar, R.; Abderrahmane, B. Machine Learning Methods for Landslide Susceptibility Studies: A Comparative Overview of Algorithm Performance. Earth-Sci. Rev. 2020, 207, 103225. [Google Scholar] [CrossRef]
- Aditian, A.; Kubota, T.; Shinohara, Y. Comparison of GIS-Based Landslide Susceptibility Models Using Frequency Ratio, Logistic Regression, and Artificial Neural Network in a Tertiary Region of Ambon, Indonesia. Geomorphology 2018, 318, 101–111. [Google Scholar] [CrossRef]
- Kalantar, B.; Pradhan, B.; Naghibi, S.A.; Motevalli, A.; Mansor, S. Assessment of the Effects of Training Data Selection on the Landslide Susceptibility Mapping: A Comparison between Support Vector Machine (SVM), Logistic Regression (LR) and Artificial Neural Networks (ANN). Geomat. Nat. Hazards Risk 2018, 9, 49–69. [Google Scholar] [CrossRef]
- Moayedi, H.; Mehrabi, M.; Mosallanezhad, M.; Rashid, A.S.A.; Pradhan, B. Modification of Landslide Susceptibility Mapping Using Optimized PSO-ANN Technique. Eng. Comput. 2019, 35, 967–984. [Google Scholar] [CrossRef]
- Pourghasemi, H.R.; Rahmati, O. Prediction of the Landslide Susceptibility: Which Algorithm, Which Precision? CATENA 2018, 162, 177–192. [Google Scholar] [CrossRef]
- Shafizadeh-Moghadam, H.; Valavi, R.; Shahabi, H.; Chapi, K.; Shirzadi, A. Novel Forecasting Approaches Using Combination of Machine Learning and Statistical Models for Flood Susceptibility Mapping. J. Environ. Manag. 2018, 217, 1–11. [Google Scholar] [CrossRef] [PubMed]
- Achour, Y.; Pourghasemi, H.R. How Do Machine Learning Techniques Help in Increasing Accuracy of Landslide Susceptibility Maps? Geosci. Front. 2020, 11, 871–883. [Google Scholar] [CrossRef]
- Bui, D.T.; Moayedi, H.; Kalantar, B.; Osouli, A.; Pradhan, B.; Nguyen, H.; Rashid, A.S.A. A Novel Swarm Intelligence—Harris Hawks Optimization for Spatial Assessment of Landslide Susceptibility. Sensors 2019, 19, 3590. [Google Scholar] [CrossRef]
- Arabameri, A.; Saha, S.; Roy, J.; Chen, W.; Blaschke, T.; Tien Bui, D. Landslide Susceptibility Evaluation and Management Using Different Machine Learning Methods in The Gallicash River Watershed, Iran. Remote Sens. 2020, 12, 475. [Google Scholar] [CrossRef]
- Youssef, A.M.; Pourghasemi, H.R. Landslide Susceptibility Mapping Using Machine Learning Algorithms and Comparison of Their Performance at Abha Basin, Asir Region, Saudi Arabia. Geosci. Front. 2021, 12, 639–655. [Google Scholar] [CrossRef]
- Ahmadlou, M.; Karimi, M.; Alizadeh, S.; Shirzadi, A.; Parvinnejhad, D.; Shahabi, H.; Panahi, M. Flood Susceptibility Assessment Using Integration of Adaptive Network-Based Fuzzy Inference System (ANFIS) and Biogeography-Based Optimization (BBO) and BAT Algorithms (BA). Geocarto Int. 2019, 34, 1252–1272. [Google Scholar] [CrossRef]
- Darabi, H.; Choubin, B.; Rahmati, O.; Torabi Haghighi, A.; Pradhan, B.; Kløve, B. Urban Flood Risk Mapping Using the GARP and QUEST Models: A Comparative Study of Machine Learning Techniques. J. Hydrol. 2019, 569, 142–154. [Google Scholar] [CrossRef]
- Khosravi, K.; Pham, B.T.; Chapi, K.; Shirzadi, A.; Shahabi, H.; Revhaug, I.; Prakash, I.; Tien Bui, D. A Comparative Assessment of Decision Trees Algorithms for Flash Flood Susceptibility Modeling at Haraz Watershed, Northern Iran. Sci. Total Environ. 2018, 627, 744–755. [Google Scholar] [CrossRef]
- Bui, D.T.; Panahi, M.; Shahabi, H.; Singh, V.P.; Shirzadi, A.; Chapi, K.; Khosravi, K.; Chen, W.; Panahi, S.; Li, S.; et al. Novel Hybrid Evolutionary Algorithms for Spatial Prediction of Floods. Sci. Rep. 2018, 8, 15364. [Google Scholar] [CrossRef]
- Shirzadi, A.; Soliamani, K.; Habibnejhad, M.; Kavian, A.; Chapi, K.; Shahabi, H.; Chen, W.; Khosravi, K.; Thai Pham, B.; Pradhan, B.; et al. Novel GIS Based Machine Learning Algorithms for Shallow Landslide Susceptibility Mapping. Sensors 2018, 18, 3777. [Google Scholar] [CrossRef]
- Souissi, D.; Zouhri, L.; Hammami, S.; Msaddek, M.H.; Zghibi, A.; Dlala, M. GIS-Based MCDM—AHP Modeling for Flood Susceptibility Mapping of Arid Areas, Southeastern Tunisia. Geocarto Int. 2020, 35, 991–1017. [Google Scholar] [CrossRef]
- Janizadeh, S.; Avand, M.; Jaafari, A.; Phong, T.V.; Bayat, M.; Ahmadisharaf, E.; Prakash, I.; Pham, B.T.; Lee, S. Prediction Success of Machine Learning Methods for Flash Flood Susceptibility Mapping in the Tafresh Watershed, Iran. Sustainability 2019, 11, 5426. [Google Scholar] [CrossRef]
- Shahabi, H.; Shirzadi, A.; Ghaderi, K.; Omidvar, E.; Al-Ansari, N.; Clague, J.J.; Geertsema, M.; Khosravi, K.; Amini, A.; Bahrami, S.; et al. Flood Detection and Susceptibility Mapping Using Sentinel-1 Remote Sensing Data and a Machine Learning Approach: Hybrid Intelligence of Bagging Ensemble Based on K-Nearest Neighbor Classifier. Remote Sens. 2020, 12, 266. [Google Scholar] [CrossRef]
- Siahkamari, S.; Haghizadeh, A.; Zeinivand, H.; Tahmasebipour, N.; Rahmati, O. Spatial Prediction of Flood-Susceptible Areas Using Frequency Ratio and Maximum Entropy Models. Geocarto Int. 2018, 33, 927–941. [Google Scholar] [CrossRef]
- Tapete, D.; Cigna, F. Appraisal of Opportunities and Perspectives for the Systematic Condition Assessment of Heritage Sites with Copernicus Sentinel-2 High-Resolution Multispectral Imagery. Remote Sens. 2018, 10, 561. [Google Scholar] [CrossRef]
- Tapete, D.; Cigna, F. COSMO-SkyMed SAR for Detection and Monitoring of Archaeological and Cultural Heritage Sites. Remote Sens. 2019, 11, 1326. [Google Scholar] [CrossRef]
- Soroush, M.; Mehrtash, A.; Khazraee, E.; Ur, J.A. Deep Learning in Archaeological Remote Sensing: Automated Qanat Detection in the Kurdistan Region of Iraq. Remote Sens. 2020, 12, 500. [Google Scholar] [CrossRef]
- Elfadaly, A.; Attia, W.; Qelichi, M.M.; Murgante, B.; Lasaponara, R. Management of Cultural Heritage Sites Using Remote Sensing Indices and Spatial Analysis Techniques. Surv. Geophys. 2018, 39, 1347–1377. [Google Scholar] [CrossRef]
- Elfadaly, A.; Shams Eldein, A.; Lasaponara, R. Cultural Heritage Management Using Remote Sensing Data and GIS Techniques around the Archaeological Area of Ancient Jeddah in Jeddah City, Saudi Arabia. Sustainability 2020, 12, 240. [Google Scholar] [CrossRef]
- Bachagha, N.; Wang, X.; Luo, L.; Li, L.; Khatteli, H.; Lasaponara, R. Remote Sensing and GIS Techniques for Reconstructing the Military Fort System on the Roman Boundary (Tunisian Section) and Identifying Archaeological Sites. Remote Sens. Environ. 2020, 236, 111418. [Google Scholar] [CrossRef]
- Hammer, E.; Ur, J. Near Eastern Landscapes and Declassified U2 Aerial Imagery. Adv. Archaeol. Pract. 2019, 7, 107–126. [Google Scholar] [CrossRef]
- Stott, D.; Kristiansen, S.M.; Lichtenberger, A.; Raja, R. Mapping an Ancient City with a Century of Remotely Sensed Data. Proc. Natl. Acad. Sci. USA 2018, 115, E5450–E5458. [Google Scholar] [CrossRef]
- Nsanziyera, A.F.; Rhinane, H.; Oujaa, A.; Mubea, K. GIS and Remote-Sensing Application in Archaeological Site Mapping in the Awsard Area (Morocco). Geosciences 2018, 8, 207. [Google Scholar] [CrossRef]
- Tapete, D.; Cigna, F. Detection of Archaeological Looting from Space: Methods, Achievements and Challenges. Remote Sens. 2019, 11, 2389. [Google Scholar] [CrossRef]
- Lasaponara, R.; Masini, N. Space-Based Identification of Archaeological Illegal Excavations and a New Automatic Method for Looting Feature Extraction in Desert Areas. Surv. Geophys. 2018, 39, 1323–1346. [Google Scholar] [CrossRef]
- Elfadaly, A.; Lasaponara, R. On the Use of Satellite Imagery and GIS Tools to Detect and Characterize the Urbanization around Heritage Sites: The Case Studies of the Catacombs of Mustafa Kamel in Alexandria, Egypt and the Aragonese Castle in Baia, Italy. Sustainability 2019, 11, 2110. [Google Scholar] [CrossRef]
- Elfadaly, A.; Attia, W.; Lasaponara, R. Monitoring the Environmental Risks Around Medinet Habu and Ramesseum Temple at West Luxor, Egypt, Using Remote Sensing and GIS Techniques. J. Archaeol. Method Theory 2018, 25, 587–610. [Google Scholar] [CrossRef]
- Zaina, F. A Risk Assessment for Cultural Heritage in Southern Iraq: Framing Drivers, Threats and Actions Affecting Archaeological Sites. Conserv. Manag. Archaeol. Sites 2019, 21, 184–206. [Google Scholar] [CrossRef]
- Howland, M.D.; Jones, I.W.N.; Najjar, M.; Levy, T.E. Quantifying the Effects of Erosion on Archaeological Sites with Low-Altitude Aerial Photography, Structure from Motion, and GIS: A Case Study from Southern Jordan. J. Archaeol. Sci. 2018, 90, 62–70. [Google Scholar] [CrossRef]
- Marchetti, N.; Curci, A.; Gatto, M.C.; Nicolini, S.; Mühl, S.; Zaina, F. A Multi-Scalar Approach for Assessing the Impact of Dams on the Cultural Heritage in the Middle East and North Africa. J. Cult. Herit. 2019, 37, 17–28. [Google Scholar] [CrossRef]
- Pourkerman, M.; Marriner, N.; Morhange, C.; Djamali, M.; Amjadi, S.; Lahijani, H.; Beni, A.N.; Vacchi, M.; Tofighian, H.; Shah-Hoesseini, M. Tracking Shoreline Erosion of “at Risk” Coastal Archaeology: The Example of Ancient Siraf (Iran, Persian Gulf). Appl. Geogr. 2018, 101, 45–55. [Google Scholar] [CrossRef]
- Tzouvaras, M.; Kouhartsiouk, D.; Agapiou, A.; Danezis, C.; Hadjimitsis, D.G. The Use of Sentinel-1 Synthetic Aperture Radar (SAR) Images and Open-Source Software for Cultural Heritage: An Example from Paphos Area in Cyprus for Mapping Landscape Changes after a 5.6 Magnitude Earthquake. Remote Sens. 2019, 11, 1766. [Google Scholar] [CrossRef]
- Colak, H.E.; Memisoglu, T.; Gercek, Y. Optimal Site Selection for Solar Photovoltaic (PV) Power Plants Using GIS and AHP: A Case Study of Malatya Province, Turkey. Renew. Energy 2020, 149, 565–576. [Google Scholar] [CrossRef]
- Alami Merrouni, A.; Elwali Elalaoui, F.; Mezrhab, A.; Mezrhab, A.; Ghennioui, A. Large Scale PV Sites Selection by Combining GIS and Analytical Hierarchy Process. Case Study: Eastern Morocco. Renew. Energy 2018, 119, 863–873. [Google Scholar] [CrossRef]
- Ozdemir, S.; Sahin, G. Multi-Criteria Decision-Making in the Location Selection for a Solar PV Power Plant Using AHP. Measurement 2018, 129, 218–226. [Google Scholar] [CrossRef]
- Shorabeh, S.N.; Firozjaei, M.K.; Nematollahi, O.; Firozjaei, H.K.; Jelokhani-Niaraki, M. A Risk-Based Multi-Criteria Spatial Decision Analysis for Solar Power Plant Site Selection in Different Climates: A Case Study in Iran. Renew. Energy 2019, 143, 958–973. [Google Scholar] [CrossRef]
- Kheybari, S.; Kazemi, M.; Rezaei, J. Bioethanol Facility Location Selection Using Best-Worst Method. Appl. Energy 2019, 242, 612–623. [Google Scholar] [CrossRef]
- Mahdy, M.; Bahaj, A.S. Multi Criteria Decision Analysis for Offshore Wind Energy Potential in Egypt. Renew. Energy 2018, 118, 278–289. [Google Scholar] [CrossRef]
- Abdel-Basset, M.; Gamal, A.; Chakrabortty, R.K.; Ryan, M. A New Hybrid Multi-Criteria Decision-Making Approach for Location Selection of Sustainable Offshore Wind Energy Stations: A Case Study. J. Clean. Prod. 2021, 280, 124462. [Google Scholar] [CrossRef]
- Prăvălie, R.; Patriche, C.; Bandoc, G. Spatial Assessment of Solar Energy Potential at Global Scale. A Geographical Approach. J. Clean. Prod. 2019, 209, 692–721. [Google Scholar] [CrossRef]
- Alami Merrouni, A.; Elwali Elalaoui, F.; Ghennioui, A.; Mezrhab, A.; Mezrhab, A. A GIS-AHP Combination for the Sites Assessment of Large-Scale CSP Plants with Dry and Wet Cooling Systems. Case Study: Eastern Morocco. Sol. Energy 2018, 166, 2–12. [Google Scholar] [CrossRef]
- Firozjaei, M.K.; Nematollahi, O.; Mijani, N.; Shorabeh, S.N.; Firozjaei, H.K.; Toomanian, A. An Integrated GIS-Based Ordered Weighted Averaging Analysis for Solar Energy Evaluation in Iran: Current Conditions and Future Planning. Renew. Energy 2019, 136, 1130–1146. [Google Scholar] [CrossRef]
- Dehwah, A.H.A.; Asif, M.; Rahman, M.T. Prospects of PV Application in Unregulated Building Rooftops in Developing Countries: A Perspective from Saudi Arabia. Energy Build. 2018, 171, 76–87. [Google Scholar] [CrossRef]
- Ghasemi, G.; Noorollahi, Y.; Alavi, H.; Marzband, M.; Shahbazi, M. Theoretical and Technical Potential Evaluation of Solar Power Generation in Iran. Renew. Energy 2019, 138, 1250–1261. [Google Scholar] [CrossRef]
- Kannan, D.; Moazzeni, S.; Darmian, S.M.; Afrasiabi, A. A Hybrid Approach Based on MCDM Methods and Monte Carlo Simulation for Sustainable Evaluation of Potential Solar Sites in East of Iran. J. Clean. Prod. 2021, 279, 122368. [Google Scholar] [CrossRef]
- Mensour, O.N.; El Ghazzani, B.; Hlimi, B.; Ihlal, A. A Geographical Information System-Based Multi-Criteria Method for the Evaluation of Solar Farms Locations: A Case Study in Souss-Massa Area, Southern Morocco. Energy 2019, 182, 900–919. [Google Scholar] [CrossRef]
- Yousefi, H.; Hafeznia, H.; Yousefi-Sahzabi, A. Spatial Site Selection for Solar Power Plants Using a GIS-Based Boolean-Fuzzy Logic Model: A Case Study of Markazi Province, Iran. Energies 2018, 11, 1648. [Google Scholar] [CrossRef]
- Zareei, S. Evaluation of Biogas Potential from Livestock Manures and Rural Wastes Using GIS in Iran. Renew. Energy 2018, 118, 351–356. [Google Scholar] [CrossRef]
- Zhang, G.; Shi, Y.; Maleki, A.; Rosen, M.A. Optimal Location and Size of a Grid-Independent Solar/Hydrogen System for Rural Areas Using an Efficient Heuristic Approach. Renew. Energy 2020, 156, 1203–1214. [Google Scholar] [CrossRef]
- Nematollahi, O.; Alamdari, P.; Jahangiri, M.; Sedaghat, A.; Alemrajabi, A.A. A Techno-Economical Assessment of Solar/Wind Resources and Hydrogen Production: A Case Study with GIS Maps. Energy 2019, 175, 914–930. [Google Scholar] [CrossRef]
- Touili, S.; Alami Merrouni, A.; Azouzoute, A.; El Hassouani, Y.; Amrani, A. A Technical and Economical Assessment of Hydrogen Production Potential from Solar Energy in Morocco. Int. J. Hydrogen Energy 2018, 43, 22777–22796. [Google Scholar] [CrossRef]
- Mokhtara, C.; Negrou, B.; Settou, N.; Settou, B.; Samy, M.M. Design Optimization of Off-Grid Hybrid Renewable Energy Systems Considering the Effects of Building Energy Performance and Climate Change: Case Study of Algeria. Energy 2021, 219, 119605. [Google Scholar] [CrossRef]
- Khanna, S.; Santos, M.J.; Ustin, S.L.; Shapiro, K.; Haverkamp, P.J.; Lay, M. Comparing the Potential of Multispectral and Hyperspectral Data for Monitoring Oil Spill Impact. Sensors 2018, 18, 558. [Google Scholar] [CrossRef] [PubMed]
- Park, S.-H.; Jung, H.-S.; Lee, M.-J.; Lee, W.-J.; Choi, M.-J. Oil Spill Detection from PlanetScope Satellite Image: Application to Oil Spill Accident near Ras Al Zour Area, Kuwait in August 2017. J. Coast. Res. 2019, 90, 251–260. [Google Scholar] [CrossRef]
- Arslan, N. Assessment of Oil Spills Using Sentinel 1 C-Band SAR and Landsat 8 Multispectral Sensors. Environ. Monit. Assess. 2018, 190, 637. [Google Scholar] [CrossRef]
- Chaturvedi, S.K.; Banerjee, S.; Lele, S. An Assessment of Oil Spill Detection Using Sentinel 1 SAR-C Images. J. Ocean Eng. Sci. 2020, 5, 116–135. [Google Scholar] [CrossRef]
- Sardi, S.S.; Qurban, M.A.; Li, W.; Kadinjappalli, K.P.; Manikandan, P.K.; Hariri, M.M.; Tawabini, B.S.; Khalil, A.B.; El-Askary, H. Assessment of Areas Environmentally Sensitive to Oil Spills in the Western Arabian Gulf, Saudi Arabia, for Planning and Undertaking an Effective Response. Mar. Pollut. Bull. 2020, 150, 110588. [Google Scholar] [CrossRef]
- El-Magd, I.A.; Zakzouk, M.; Ali, E.M.; Abdulaziz, A.M. An Open Source Approach for Near-Real Time Mapping of Oil Spills along the Mediterranean Coast of Egypt. Remote Sens. 2021, 13, 2733. [Google Scholar] [CrossRef]
- Abou Samra, R.M.; Eissa, R.; El-Gammal, M. Applying the Environmental Sensitivity Index for the Assessment of the Prospective Oil Spills along the Nile Delta Coast, Egypt. Geocarto Int. 2020, 35, 589–601. [Google Scholar] [CrossRef]
- Abou Samra, R.M.; El-Gammal, M.; Eissa, R. Oceanographic Factors of Oil Pollution Dispersion Offshore the Nile Delta (Egypt) Using GIS. Environ. Sci. Pollut. Res. 2021, 28, 25830–25843. [Google Scholar] [CrossRef]
- Mateos-Molina, D.; Antonopoulou, M.; Baldwin, R.; Bejarano, I.; Burt, J.A.; García-Charton, J.A.; Al-Ghais, S.M.; Walgamage, J.; Taylor, O.J.S. Applying an Integrated Approach to Coastal Marine Habitat Mapping in the North-Western United Arab Emirates. Mar. Environ. Res. 2020, 161, 105095. [Google Scholar] [CrossRef]
- El-Alfy, M.A.; Hasballah, A.F.; Abd El-Hamid, H.T.; El-Zeiny, A.M. Toxicity Assessment of Heavy Metals and Organochlorine Pesticides in Freshwater and Marine Environments, Rosetta Area, Egypt Using Multiple Approaches. Sustain. Environ. Res. 2019, 29, 19. [Google Scholar] [CrossRef]
- Fatehian, S.; Jelokhani-Niaraki, M.; Kakroodi, A.A.; Dero, Q.Y.; Samany, N.N. A Volunteered Geographic Information System for Managing Environmental Pollution of Coastal Zones: A Case Study in Nowshahr, Iran. Ocean Coast. Manag. 2018, 163, 54–65. [Google Scholar] [CrossRef]
- Themistocleous, K.; Papoutsa, C.; Michaelides, S.; Hadjimitsis, D. Investigating Detection of Floating Plastic Litter from Space Using Sentinel-2 Imagery. Remote Sens. 2020, 12, 2648. [Google Scholar] [CrossRef]
- Sannigrahi, S.; Basu, B.; Basu, A.S.; Pilla, F. Development of Automated Marine Floating Plastic Detection System Using Sentinel-2 Imagery and Machine Learning Models. Mar. Pollut. Bull. 2022, 178, 113527. [Google Scholar] [CrossRef]
- Zhou, S.; Kuester, T.; Bochow, M.; Bohn, N.; Brell, M.; Kaufmann, H. A Knowledge-Based, Validated Classifier for the Identification of Aliphatic and Aromatic Plastics by WorldView-3 Satellite Data. Remote Sens. Environ. 2021, 264, 112598. [Google Scholar] [CrossRef]
- Yagci, A.L.; Colkesen, I.; Kavzoglu, T.; Sefercik, U.G. Daily Monitoring of Marine Mucilage Using the MODIS Products: A Case Study of 2021 Mucilage Bloom in the Sea of Marmara, Turkey. Environ. Monit Assess 2022, 194, 170. [Google Scholar] [CrossRef] [PubMed]
- Snape, R.T.E.; Bradshaw, P.J.; Broderick, A.C.; Fuller, W.J.; Stokes, K.L.; Godley, B.J. Off-the-Shelf GPS Technology to Inform Marine Protected Areas for Marine Turtles. Biol. Conserv. 2018, 227, 301–309. [Google Scholar] [CrossRef]
- Haywood, J.C.; Fuller, W.J.; Godley, B.J.; Margaritoulis, D.; Shutler, J.D.; Snape, R.T.; Widdicombe, S.; Zbinden, J.A.; Broderick, A.C. Spatial Ecology of Loggerhead Turtles: Insights from Stable Isotope Markers and Satellite Telemetry. Divers. Distrib. 2020, 26, 368–381. [Google Scholar] [CrossRef]
- Başkale, E.; Sözbilen, D.; Katılmış, Y.; Azmaz, M.; Kaska, Y. An Evaluation of Sea Turtle Strandings in the Fethiye-Göcek Specially Protected Area: An Important Foraging Ground with an Increasing Mortality Rate. Ocean Coast. Manag. 2018, 154, 26–33. [Google Scholar] [CrossRef]
- Bakirman, T.; Gumusay, M.U. A Novel GIS-MCDA-Based Spatial Habitat Suitability Model for Posidonia Oceanica in the Mediterranean. Environ. Monit Assess 2020, 192, 231. [Google Scholar] [CrossRef] [PubMed]
- Ivanov, A.Y.; Gerivani, H.; Evtushenko, N.V. Characterization of Natural Hydrocarbon Seepage in the South Caspian Sea off Iran Using Satellite SAR and Geological Data. Mar. Georesources Geotechnol. 2020, 38, 527–538. [Google Scholar] [CrossRef]
- Antonioli, F.; De Falco, G.; Lo Presti, V.; Moretti, L.; Scardino, G.; Anzidei, M.; Bonaldo, D.; Carniel, S.; Leoni, G.; Furlani, S.; et al. Relative Sea-Level Rise and Potential Submersion Risk for 2100 on 16 Coastal Plains of the Mediterranean Sea. Water 2020, 12, 2173. [Google Scholar] [CrossRef]
- Alarcón, P.A.E.; Lambertucci, S.A. A Three-Decade Review of Telemetry Studies on Vultures and Condors. Mov. Ecol. 2018, 6, 13. [Google Scholar] [CrossRef] [PubMed]
- Torri, M.; Corrado, R.; Falcini, F.; Cuttitta, A.; Palatella, L.; Lacorata, G.; Patti, B.; Arculeo, M.; Mifsud, R.; Mazzola, S.; et al. Planktonic Stages of Small Pelagic Fishes (Sardinella Aurita and Engraulis Encrasicolus) in the Central Mediterranean Sea: The Key Role of Physical Forcings and Implications for Fisheries Management. Prog. Oceanogr. 2018, 162, 25–39. [Google Scholar] [CrossRef]
- Farhadinia, M.S.; Johnson, P.J.; Macdonald, D.W.; Hunter, L.T.B. Anchoring and Adjusting amidst Humans: Ranging Behavior of Persian Leopards along the Iran-Turkmenistan Borderland. PLoS ONE 2018, 13, e0196602. [Google Scholar] [CrossRef]
- Hadjikyriakou, T.G.; Nwankwo, E.C.; Virani, M.Z.; Kirschel, A.N.G. Habitat Availability Influences Migration Speed, Refueling Patterns and Seasonal Flyways of a Fly-and-Forage Migrant. Mov. Ecol. 2020, 8, 10. [Google Scholar] [CrossRef]
- Shirmard, H.; Farahbakhsh, E.; Heidari, E.; Beiranvand Pour, A.; Pradhan, B.; Müller, D.; Chandra, R. A Comparative Study of Convolutional Neural Networks and Conventional Machine Learning Models for Lithological Mapping Using Remote Sensing Data. Remote Sens. 2022, 14, 819. [Google Scholar] [CrossRef]
- Sekandari, M.; Masoumi, I.; Pour, A.B.; Muslim, A.M.; Hossain, M.S.; Misra, A. ASTER and WorldView-3 Satellite Data for Mapping Lithology and Alteration Minerals Associated with Pb-Zn Mineralization. Geocarto Int. 2022, 37, 1782–1812. [Google Scholar] [CrossRef]
- Ali-Bik, M.W.; Hassan, S.M.; Abou El Maaty, M.A.; Abd El Rahim, S.H.; Abayazeed, S.D.; Wahab, W.A. The Late Neoproterozoic Pan-African Low-Grade Metamorphic Ophiolitic and Island-Arc Assemblages at Gebel Zabara Area, Central Eastern Desert, Egypt: Petrogenesis and Remote Sensing—Based Geologic Mapping. J. Afr. Earth Sci. 2018, 144, 17–40. [Google Scholar] [CrossRef]
- Honarvar, B.; Lankarani, K.B.; Kharmandar, A.; Shaygani, F.; Zahedroozgar, M.; Rahmanian Haghighi, M.R.; Ghahramani, S.; Honarvar, H.; Daryabadi, M.M.; Salavati, Z.; et al. Knowledge, Attitudes, Risk Perceptions, and Practices of Adults toward COVID-19: A Population and Field-Based Study from Iran. Int. J. Public Health 2020, 65, 731–739. [Google Scholar] [CrossRef]
- Mansour, S.; Al Kindi, A.; Al-Said, A.; Al-Said, A.; Atkinson, P. Sociodemographic Determinants of COVID-19 Incidence Rates in Oman: Geospatial Modelling Using Multiscale Geographically Weighted Regression (MGWR). Sustain. Cities Soc. 2021, 65, 102627. [Google Scholar] [CrossRef]
- Mansour, E. Profiling Information Needs and Behaviour of Syrian Refugees Displaced to Egypt: An Exploratory Study. Inf. Learn. Sci. 2018, 119, 161–182. [Google Scholar] [CrossRef]
- Mohammadi, A.; Mollalo, A.; Bergquist, R.; Kiani, B. Measuring COVID-19 Vaccination Coverage: An Enhanced Age-Adjusted Two-Step Floating Catchment Area Model. Infect. Dis. Poverty 2021, 10, 118. [Google Scholar] [CrossRef]
- Halimi, L.; Bagheri, N.; Hoseini, B.; Hashtarkhani, S.; Goshayeshi, L.; Kiani, B. Spatial Analysis of Colorectal Cancer Incidence in Hamadan Province, Iran: A Retrospective Cross-Sectional Study. Appl. Spat. Anal. 2020, 13, 293–303. [Google Scholar] [CrossRef]
- Kiani, B.; Hashemi Amin, F.; Bagheri, N.; Bergquist, R.; Mohammadi, A.A.; Yousefi, M.; Faraji, H.; Roshandel, G.; Beirami, S.; Rahimzadeh, H.; et al. Association between Heavy Metals and Colon Cancer: An Ecological Study Based on Geographical Information Systems in North-Eastern Iran. BMC Cancer 2021, 21, 414. [Google Scholar] [CrossRef] [PubMed]
- Chavehpour, Y.; Rashidian, A.; Woldemichael, A.; Takian, A. Inequality in Geographical Distribution of Hospitals and Hospital Beds in Densely Populated Metropolitan Cities of Iran. BMC Health Serv. Res. 2019, 19, 614. [Google Scholar] [CrossRef] [PubMed]
- Akkan, C.; Karadayi, M.A.; Ekinci, Y.; Ülengin, F.; Uray, N.; Karaosmanoğlu, E. Efficiency Analysis of Emergency Departments in Metropolitan Areas. Socio-Econ. Plan. Sci. 2020, 69, 100679. [Google Scholar] [CrossRef]
- Erdin, C.; Akbaş, H.E. A Comparative Analysis of Fuzzy TOPSIS and Geographic Information Systems (GIS) for the Location Selection of Shopping Malls: A Case Study from Turkey. Sustainability 2019, 11, 3837. [Google Scholar] [CrossRef]
- Erbaş, M.; Kabak, M.; Özceylan, E.; Çetinkaya, C. Optimal Siting of Electric Vehicle Charging Stations: A GIS-Based Fuzzy Multi-Criteria Decision Analysis. Energy 2018, 163, 1017–1031. [Google Scholar] [CrossRef]
- Kabak, M.; Erbaş, M.; Çetinkaya, C.; Özceylan, E. A GIS-Based MCDM Approach for the Evaluation of Bike-Share Stations. J. Clean. Prod. 2018, 201, 49–60. [Google Scholar] [CrossRef]
- Blomenkemper, P.; Kerp, H.; Abu Hamad, A.; DiMichele, W.A.; Bomfleur, B. A Hidden Cradle of Plant Evolution in Permian Tropical Lowlands. Science 2018, 362, 1414–1416. [Google Scholar] [CrossRef] [PubMed]
- Rahman, M.T.; Nahiduzzaman, K.M. Examining the Walking Accessibility, Willingness, and Travel Conditions of Residents in Saudi Cities. Int. J. Environ. Res. Public Health 2019, 16, 545. [Google Scholar] [CrossRef]
- Hadjimitsis, D.; Schreier, G.; Kontoes, H.; Ansmann, A.; Komodromos, G.; Themistocleous, K.; Neocleous, K.; Michaelides, S.; Mamouri, R.; Papoutsis, I.; et al. The ERATOSTHENES Centre of Excellence (ECoE) as a Digital Innovation Hub for Earth Observation. In Detection and Sensing of Mines, Explosive Objects, and Obscured Targets XXV; SPIE: Bellingham, WA, USA, 2020; Volume 11418, pp. 114–125. [Google Scholar]
- Chawla, I.; Karthikeyan, L.; Mishra, A.K. A Review of Remote Sensing Applications for Water Security: Quantity, Quality, and Extremes. J. Hydrol. 2020, 585, 124826. [Google Scholar] [CrossRef]
- Karthikeyan, L.; Chawla, I.; Mishra, A.K. A Review of Remote Sensing Applications in Agriculture for Food Security: Crop Growth and Yield, Irrigation, and Crop Losses. J. Hydrol. 2020, 586, 124905. [Google Scholar] [CrossRef]
- Leone, G. 2017 Mediterranean Quality Status Report. 2017. Available online: https://www.medqsr.org/background-ci19 (accessed on 7 June 2023).
Disclaimer/Publisher’s Note: The statements, opinions and data contained in all publications are solely those of the individual author(s) and contributor(s) and not of MDPI and/or the editor(s). MDPI and/or the editor(s) disclaim responsibility for any injury to people or property resulting from any ideas, methods, instructions or products referred to in the content. |
© 2023 by the authors. Licensee MDPI, Basel, Switzerland. This article is an open access article distributed under the terms and conditions of the Creative Commons Attribution (CC BY) license (https://creativecommons.org/licenses/by/4.0/).