
Open-Pit Mining Area Extraction from High-Resolution Remote Sensing Images Based on EMANet and FC-CRF


Abstract
:
1. Introduction
2. Material, Methods and Training Process
2.1. Data Set
2.2. EMANet Based on the Expectation-Maximization Attention
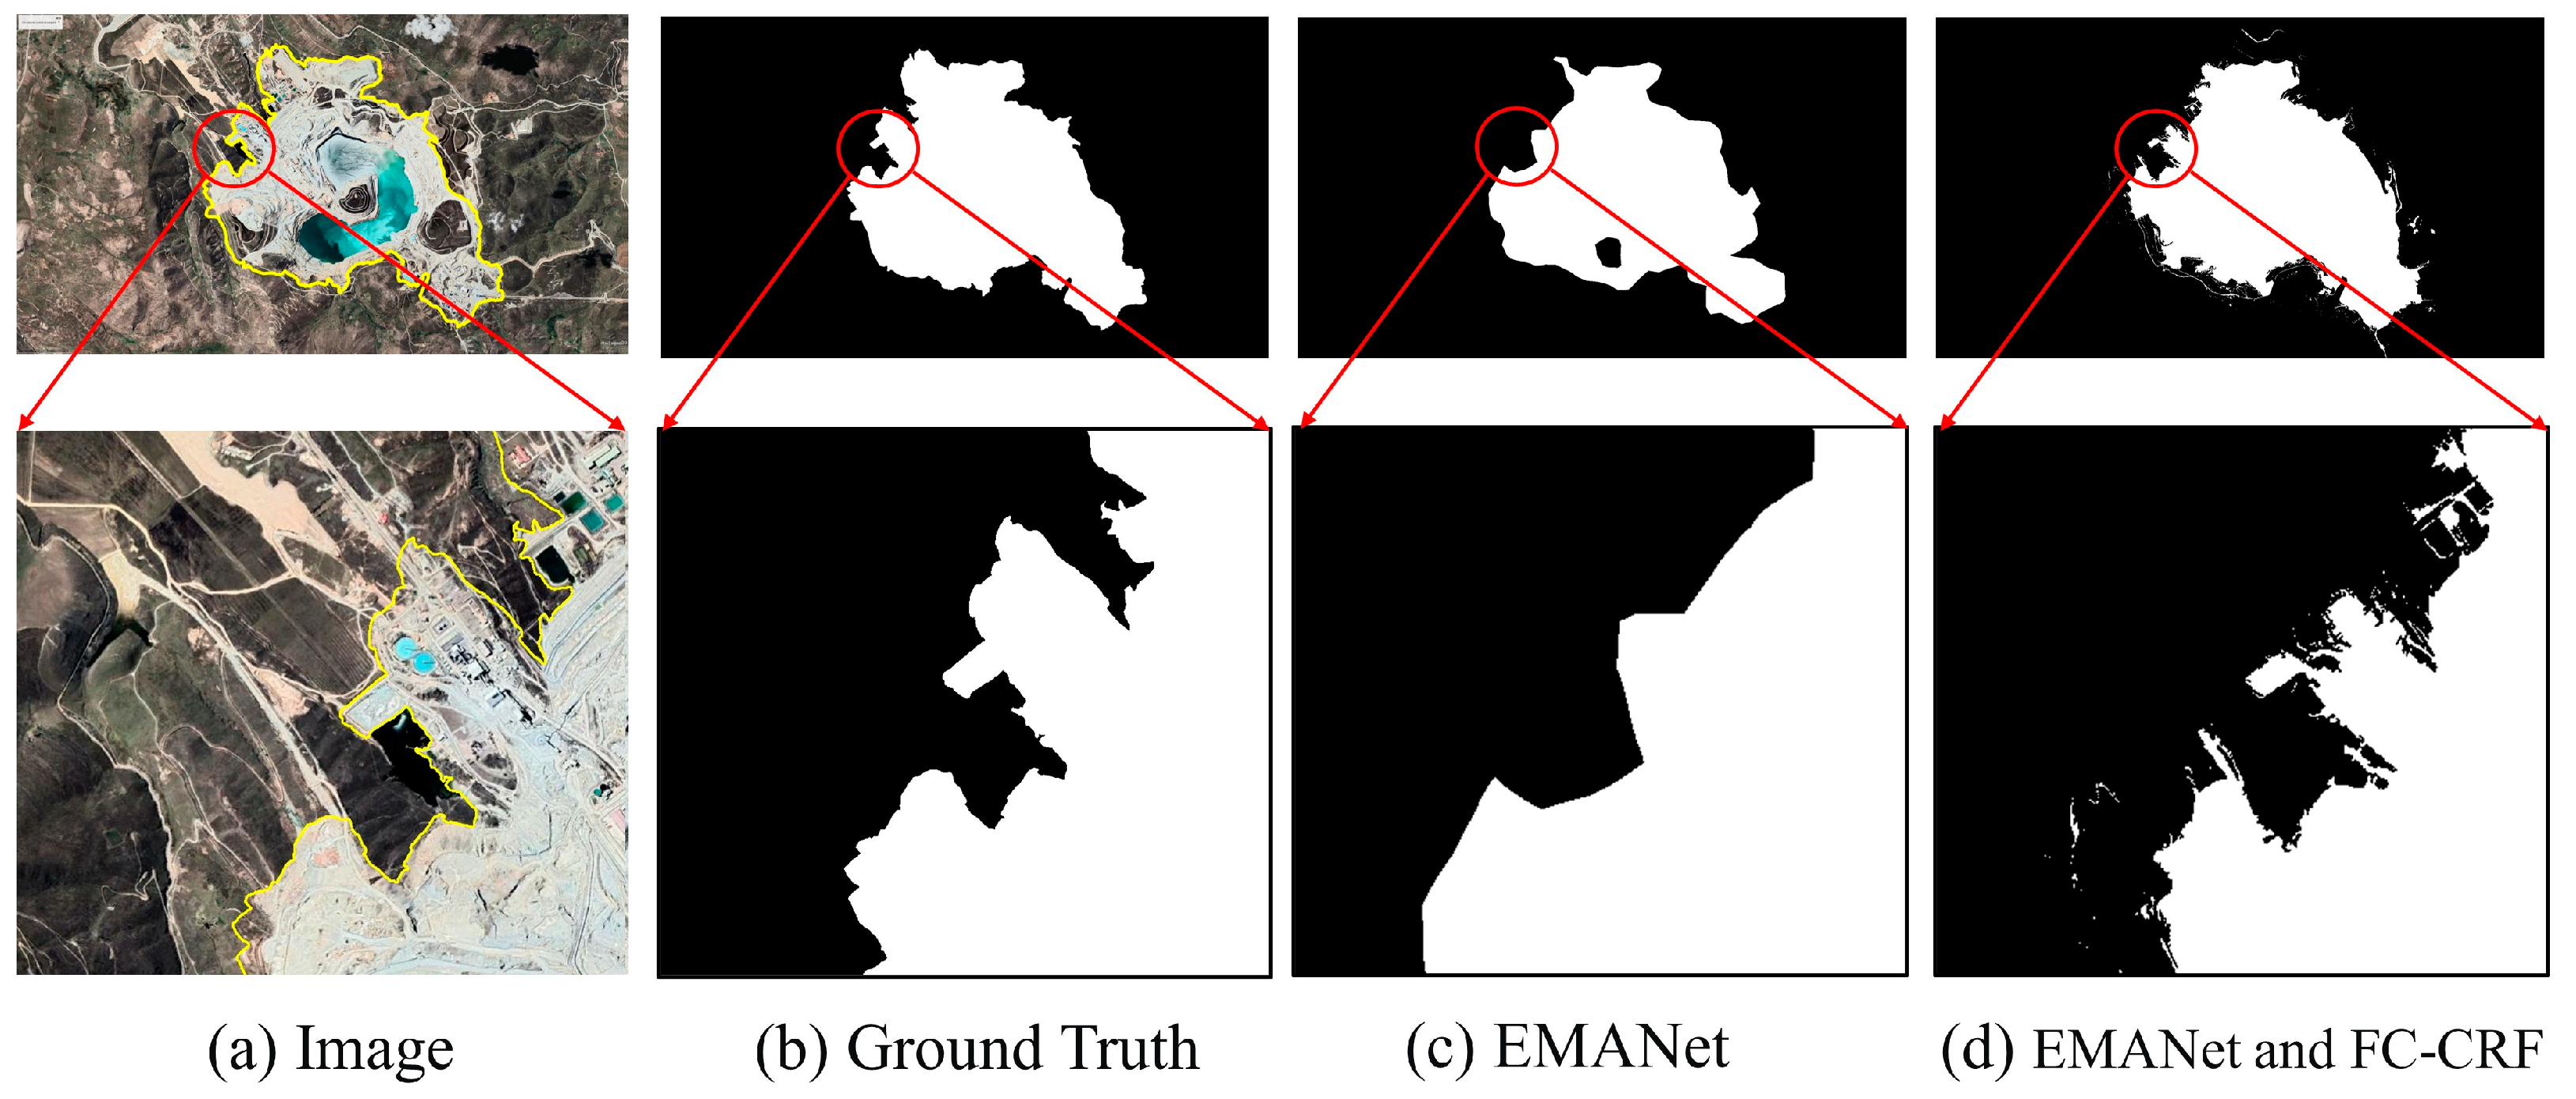
2.3. Postprocessing Based on FC-CRF
2.4. Training Process
3. Results
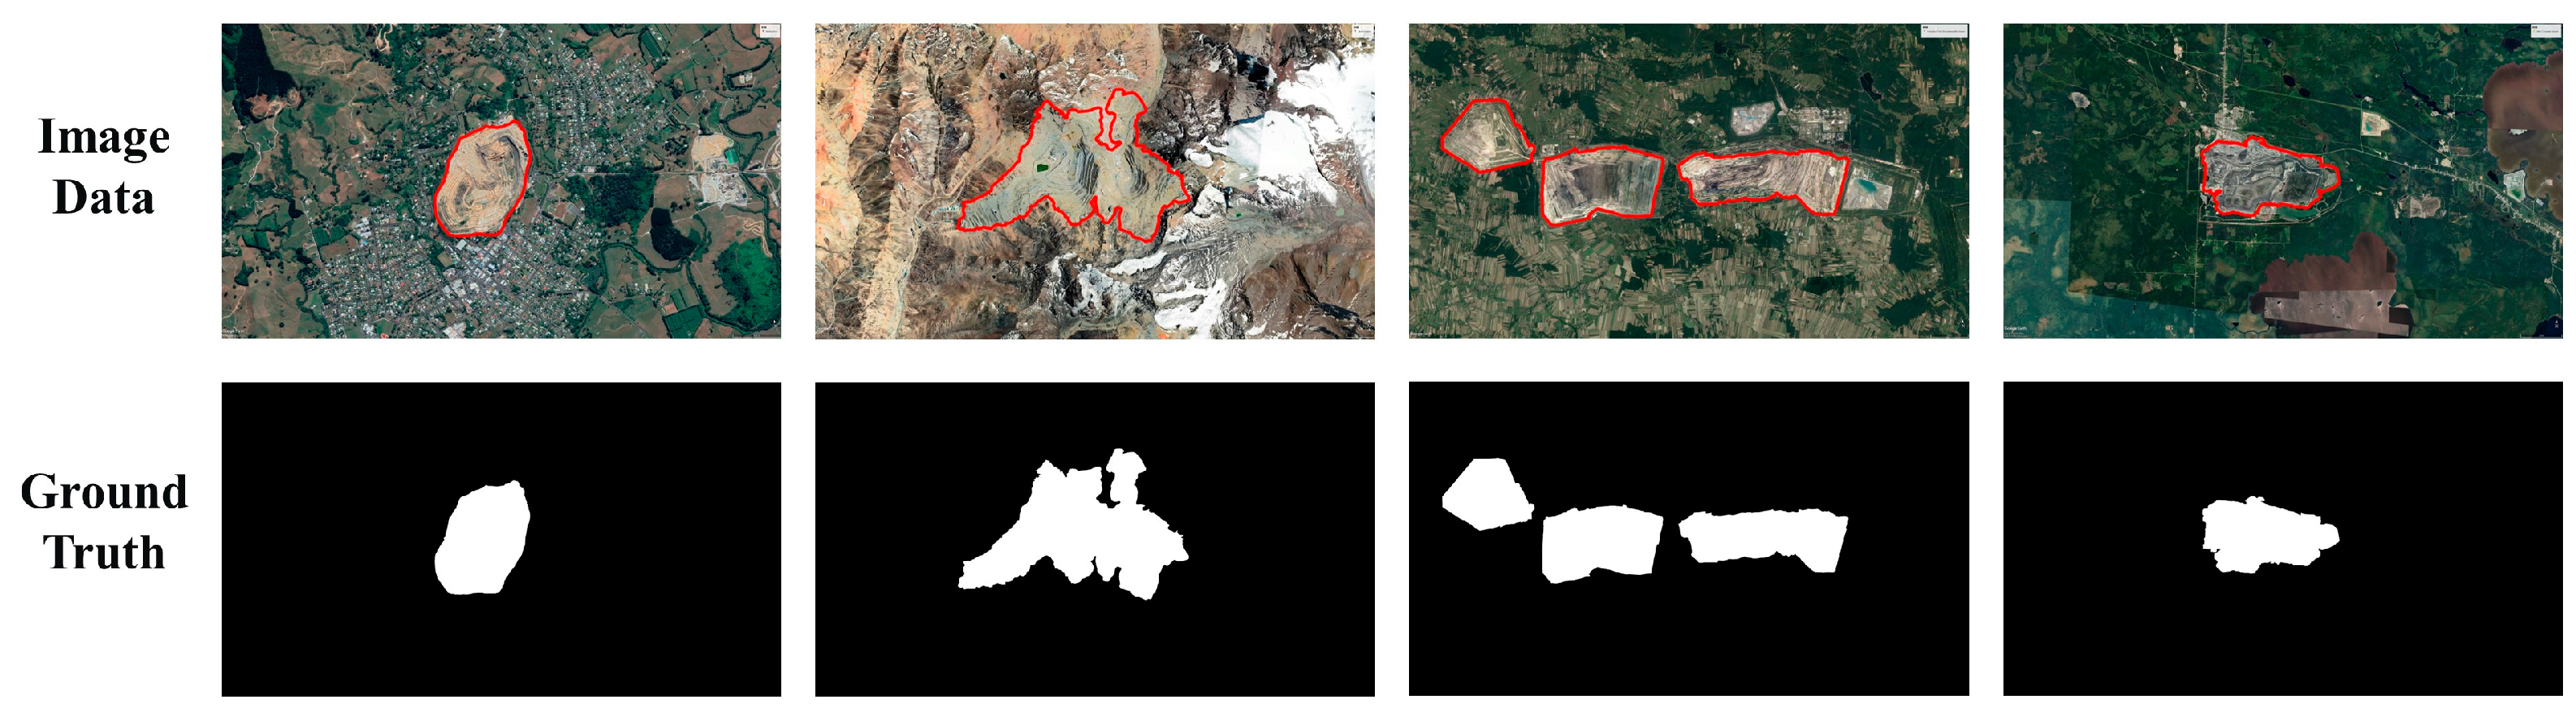
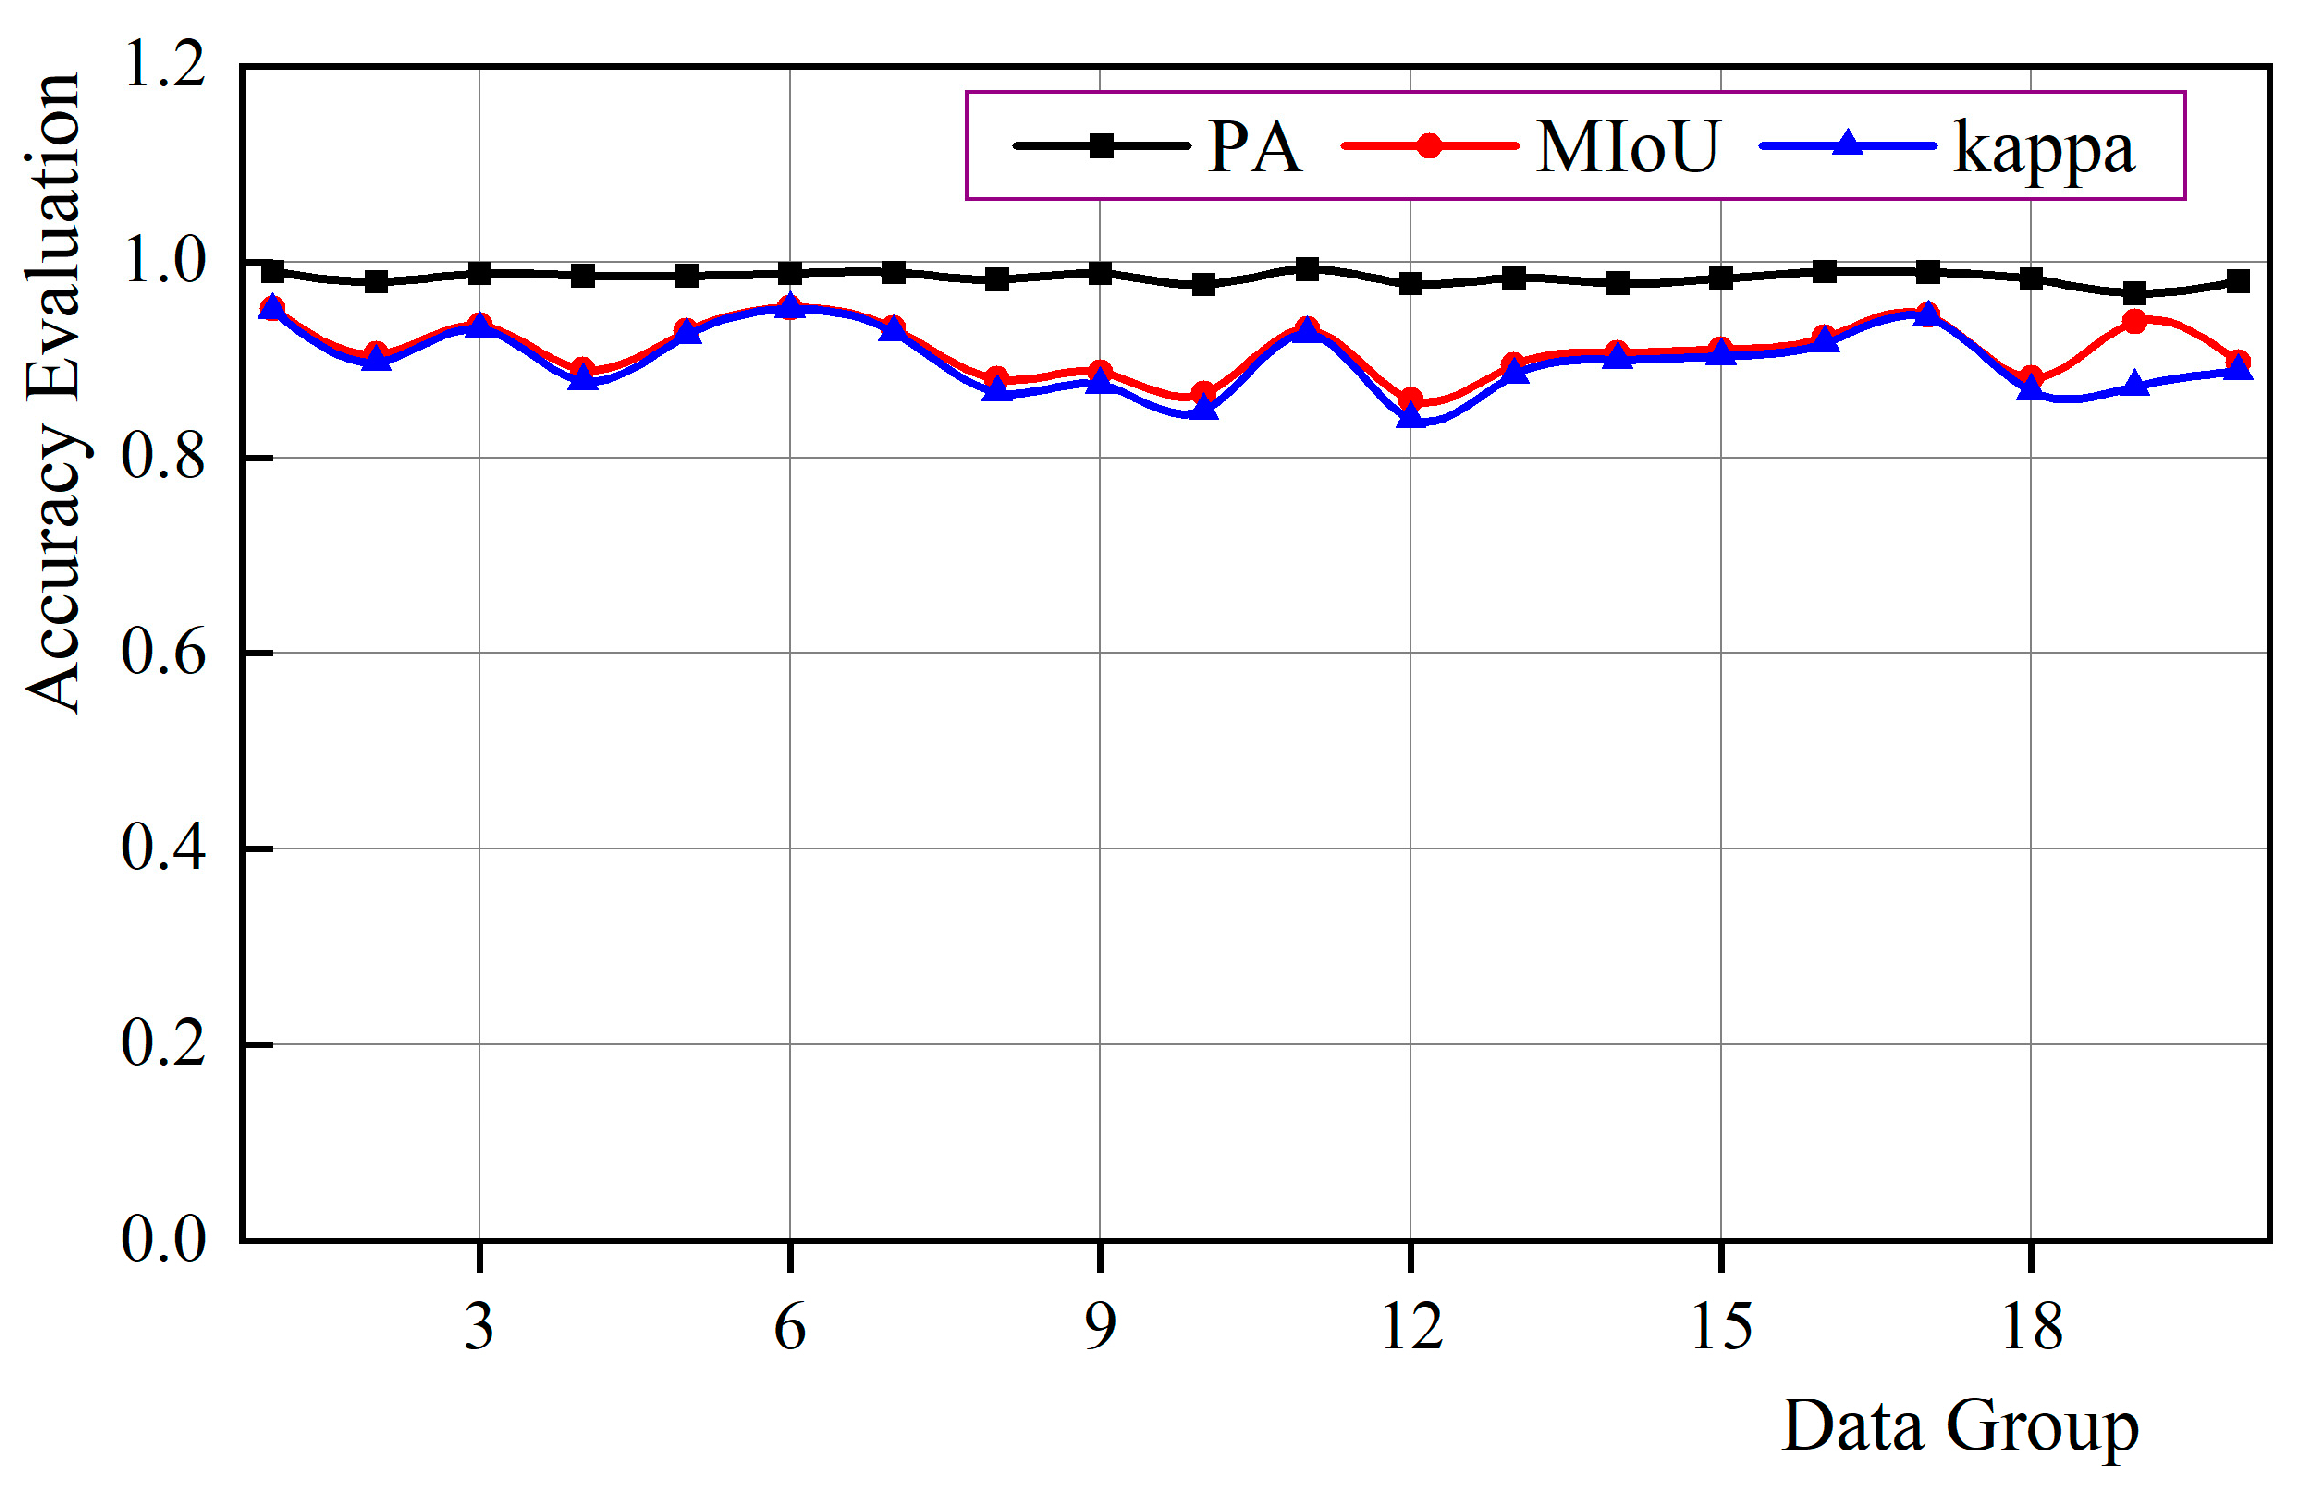
3.1. Test Results and Accuracy Evaluation
- (1)
- Test results;
- (2)
- Accuracy evaluation;
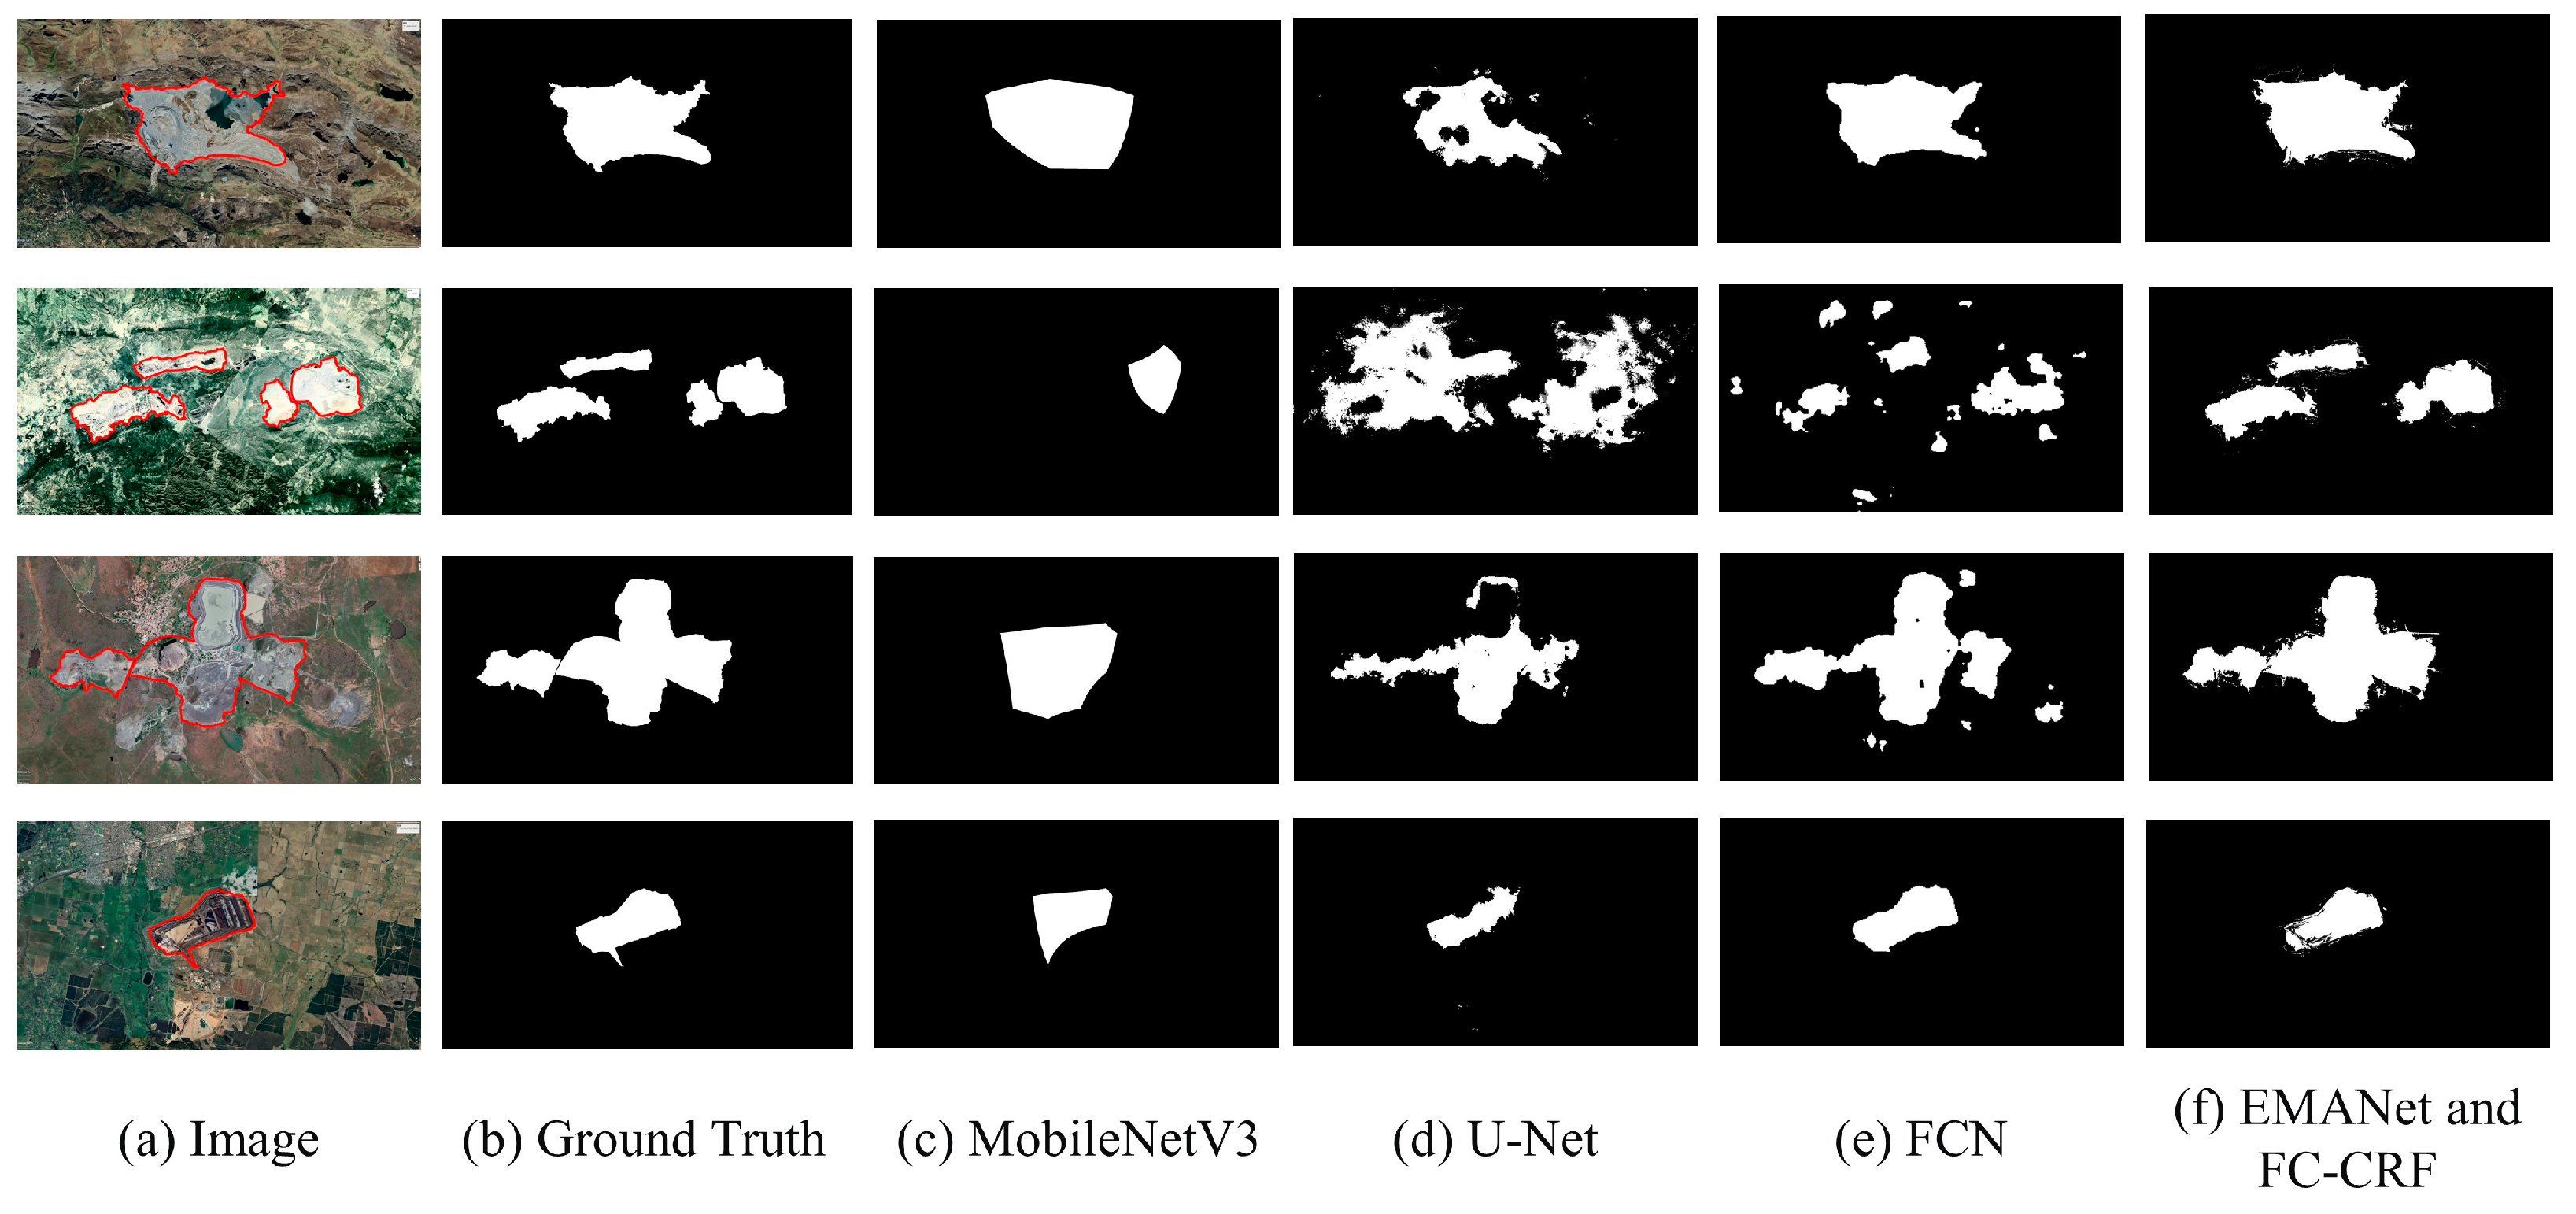
3.2. Comparison
4. Discussion
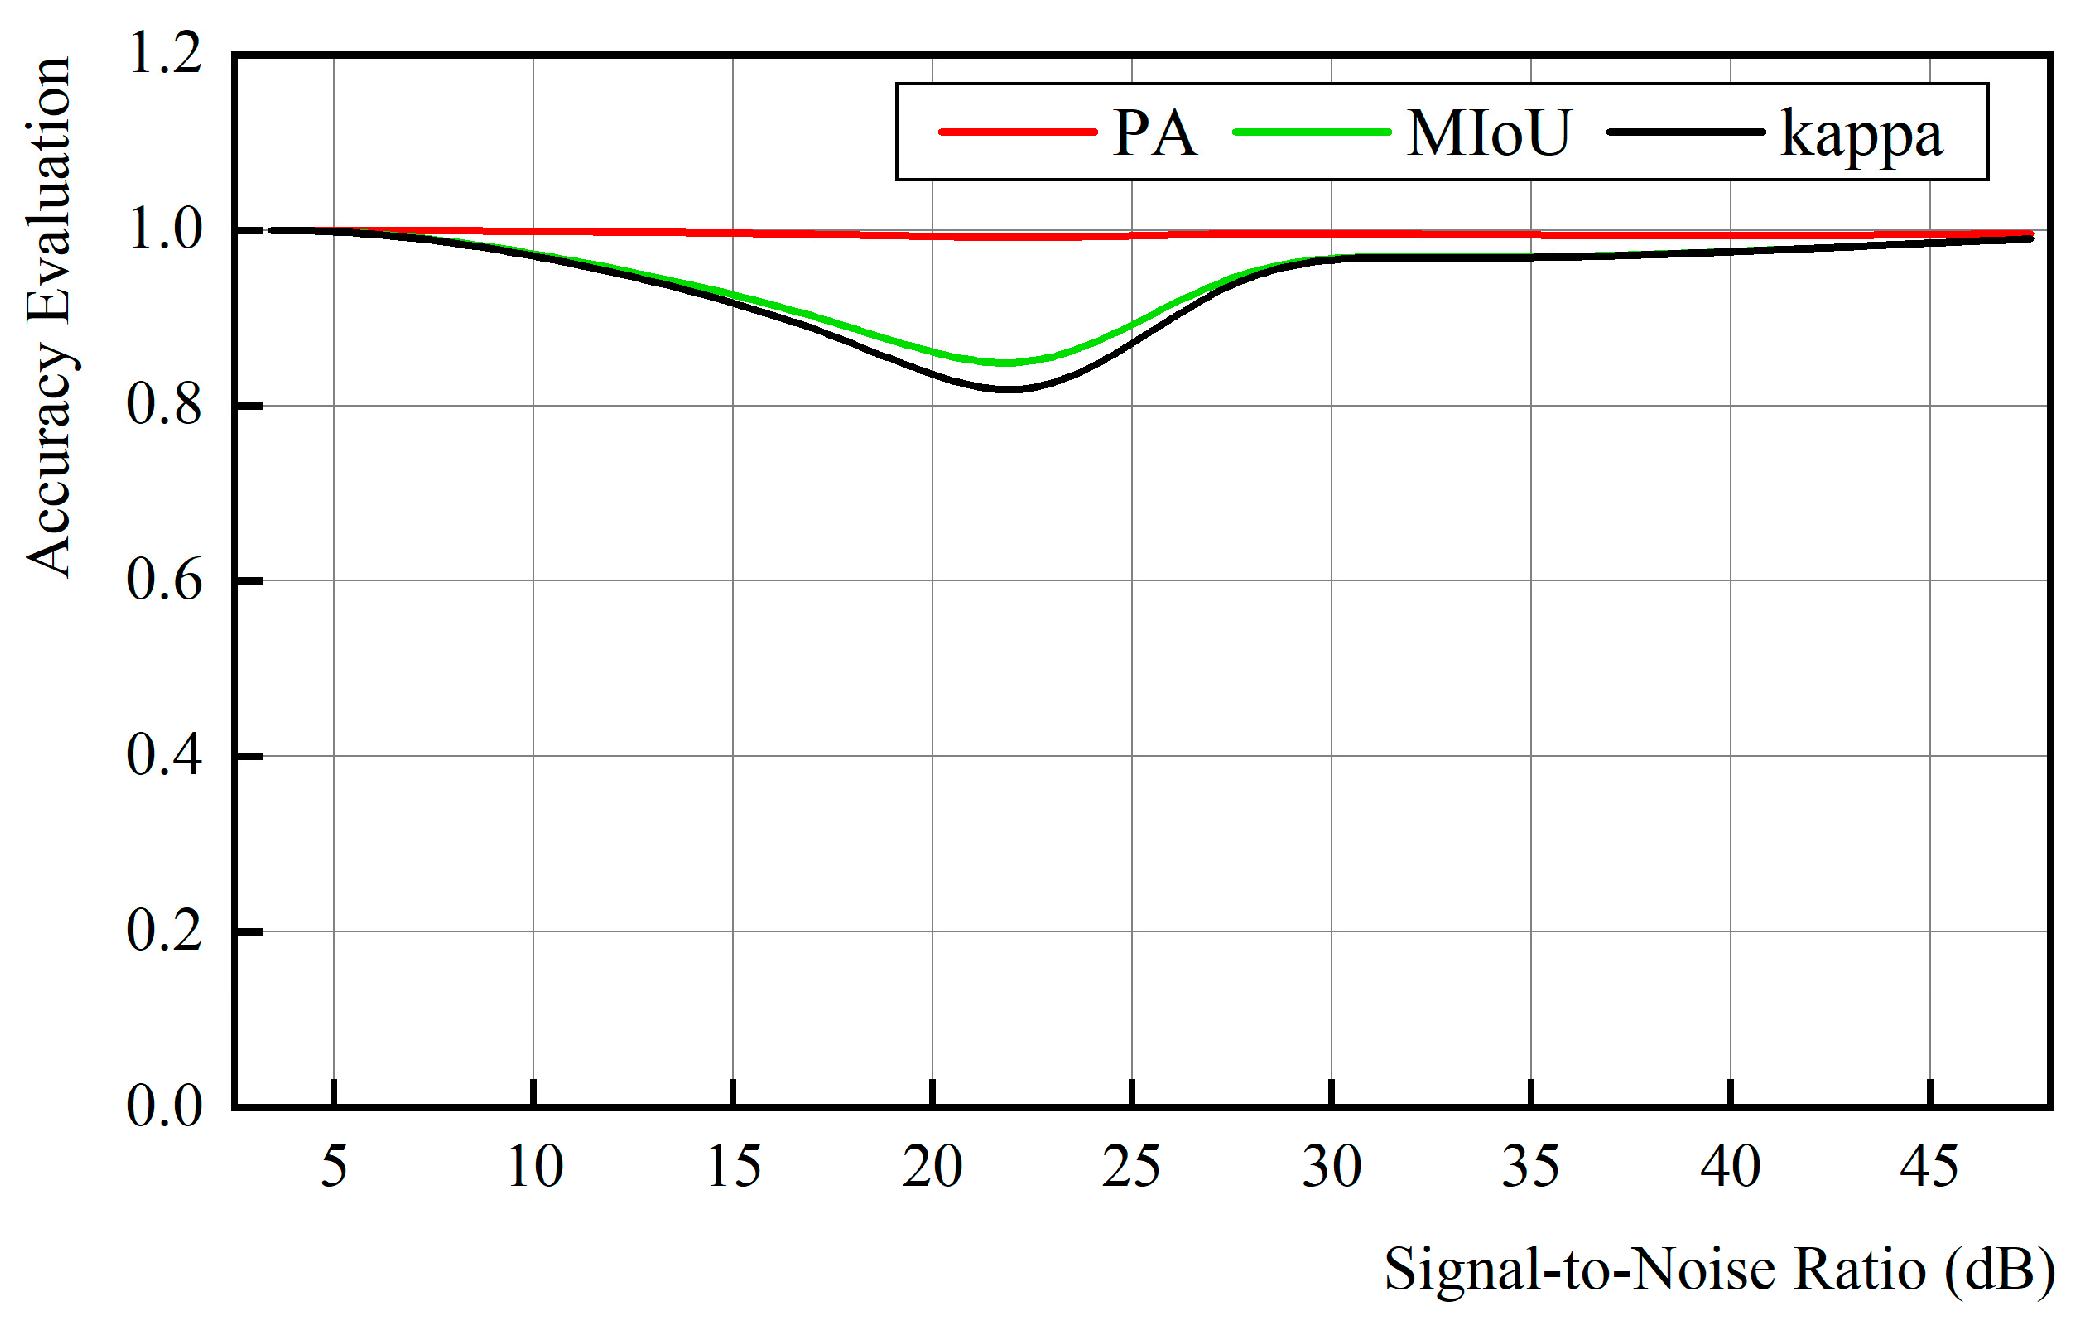
- (1)
- Effect of signal-to-noise ratio
- (2)
- Limitations and Potential Improvements
5. Conclusions
Author Contributions
Funding
Data Availability Statement
Acknowledgments
Conflicts of Interest
References
- Du, S.; Li, W.; Li, J.; Du, S.; Zhang, C.; Sun, Y. Open-Pit Mine Change Detection from High Resolution Remote Sensing Images Using DA-UNet++ and Object-Based Approach. Int. J. Min. Reclam. Environ. 2022, 36, 512–535. [Google Scholar] [CrossRef]
- Guo, J.; Li, Q.; Xie, H.; Li, J.; Qiao, L.; Zhang, C.; Yang, G.; Wang, F. Monitoring of Vegetation Disturbance and Restoration at the Dumping Sites of the Baorixile Open-Pit Mine Based on the LandTrendr Algorithm. Int. J. Environ. Res. Public Health 2022, 19, 9066. [Google Scholar] [CrossRef]
- Du, S.; Du, S.; Liu, B.; Zhang, X. Incorporating DeepLabv3+ and Object-Based Image Analysis for Semantic Segmentation of Very High Resolution Remote Sensing Images. Int. J. Digit. Earth 2021, 14, 357–378. [Google Scholar] [CrossRef]
- Wang, C.; Chang, L.; Zhao, L.; Niu, R. Automatic Identification and Dynamic Monitoring of Open-Pit Mines Based on Improved Mask R-CNN and Transfer Learning. Remote Sens. 2020, 12, 3474. [Google Scholar] [CrossRef]
- Chen, W.; Li, X.; He, H.; Wang, L. A Review of Fine-Scale Land Use and Land Cover Classification in Open-Pit Mining Areas by Remote Sensing Techniques. Remote Sens. 2018, 10, 15. [Google Scholar] [CrossRef] [Green Version]
- Li, X.; Zhang, X.; Shen, W.; Zeng, Q.; Chen, P.; Qin, Q.; Li, Z. Research on the Mechanism and Control Technology of Coal Wall Sloughing in the Ultra-Large Mining Height Working Face. Int. J. Environ. Res. Public Health 2023, 20, 868. [Google Scholar] [CrossRef] [PubMed]
- Mas, J.-F.; Lemoine-Rodríguez, R.; González-López, R.; López-Sánchez, J.; Piña-Garduño, A.; Herrera-Flores, E. Land Use/Land Cover Change Detection Combining Automatic Processing and Visual Interpretation. Eur. J. Remote Sens. 2017, 50, 626–635. [Google Scholar] [CrossRef]
- Maxwell, A.E.; Warner, T.A.; Fang, F. Implementation of Machine-Learning Classification in Remote Sensing: An Applied Review. Int. J. Remote Sens. 2018, 39, 2784–2817. [Google Scholar] [CrossRef] [Green Version]
- Chen, W.; Li, X.; Wang, L. Fine Land Cover Classification in an Open Pit Mining Area Using Optimized Support Vector Machine and WorldView-3 Imagery. Remote Sens. 2020, 12, 82. [Google Scholar] [CrossRef] [Green Version]
- Yu, X.; Zhang, K.; Zhang, Y. Land Use Classification of Open-Pit Mine Based on Multi-Scale Segmentation and Random Forest Model. PLoS ONE 2022, 17, e0263870. [Google Scholar] [CrossRef]
- Liu, R.; Yang, X.; Xu, C.; Wei, L.; Zeng, X. Comparative Study of Convolutional Neural Network and Conventional Machine Learning Methods for Landslide Susceptibility Mapping. Remote Sens. 2022, 14, 321. [Google Scholar] [CrossRef]
- Minaee, S.; Boykov, Y.Y.; Porikli, F.; Plaza, A.J.; Kehtarnavaz, N.; Terzopoulos, D. Image Segmentation Using Deep Learning: A Survey. IEEE Trans. Pattern Anal. Mach. Intell. 2021, 44, 3523–3542. [Google Scholar] [CrossRef]
- Zhang, L.; Shen, W.; Li, X.; Wang, Y.; Qin, Q.; Lu, X.; Xue, T. Abutment Pressure Distribution Law and Support Analysis of Super Large Mining Height Face. Int. J. Environ. Res. Public. Health 2023, 20, 227. [Google Scholar] [CrossRef] [PubMed]
- Chen, T.; Zheng, X.; Niu, R.; Plaza, A. Open-Pit Mine Area Mapping With Gaofen-2 Satellite Images Using U-Net+. IEEE J. Sel. Top. Appl. Earth Obs. Remote Sens. 2022, 15, 3589–3599. [Google Scholar] [CrossRef]
- Ullo, S.L.; Mohan, A.; Sebastianelli, A.; Ahamed, S.E.; Kumar, B.; Dwivedi, R.; Sinha, G.R. A New Mask R-CNN-Based Method for Improved Landslide Detection. IEEE J. Sel. Top. Appl. Earth Obs. Remote Sens. 2021, 14, 3799–3810. [Google Scholar] [CrossRef]
- Xie, H.; Pan, Y.; Luan, J.; Yang, X.; Xi, Y. Semantic Segmentation of Open Pit Mining Area Based on Remote Sensing Shallow Features and Deep Learning. In Big Data Analytics for Cyber-Physical System in Smart City. BDCPS 2020. Advances in Intelligent Systems and Computing; Atiquzzaman, M., Yen, N., Xu, Z., Eds.; Springer: Singapore, 2021; pp. 52–59. [Google Scholar]
- Du, S.; Xing, J.; Li, J.; Du, S.; Zhang, C.; Sun, Y. Open-Pit Mine Extraction from Very High-Resolution Remote Sensing Images Using OM-DeepLab. Nat. Resour. Res. 2022, 31, 3173–3194. [Google Scholar] [CrossRef]
- Xie, H.; Pan, Y.; Luan, J.; Yang, X.; Xi, Y. Open-Pit Mining Area Segmentation of Remote Sensing Images Based on DUSegNet. J. Indian. Soc. Remote Sens. 2021, 49, 1257–1270. [Google Scholar] [CrossRef]
- Fengji Zhang, Y.W.; Fengji Zhang, Y.W. Opencast Mining Area Intelligent Extraction Method for Multi-source Remote Sensing Image based on Improved DenseNet. Remote Sens. Technol. Appl. 2020, 35, 673–684. [Google Scholar] [CrossRef]
- Cheng, G.; Xie, X.; Han, J.; Guo, L.; Xia, G.-S. Remote Sensing Image Scene Classification Meets Deep Learning: Challenges, Methods, Benchmarks, and Opportunities. IEEE J. Sel. Top. Appl. Earth Obs. Remote Sens. 2020, 13, 3735–3756. [Google Scholar] [CrossRef]
- Li, X.; Zhong, Z.; Wu, J.; Yang, Y.; Lin, Z.; Liu, H. Expectation-Maximization Attention Networks for Semantic Segmentation. In Proceedings of the 2019 IEEE/CVF International Conference on Computer Vision (ICCV), Seoul, Republic of Korea, 27 October–2 November 2019; pp. 9166–9175. [Google Scholar]
- Krähenbühl, P.; Koltun, V. Efficient Inference in Fully Connected CRFs with Gaussian Edge Potentials. Adv. Neural Inf. Process. Syst. 2011, 24, 109–117. [Google Scholar]
- Russell, B.C.; Torralba, A.; Murphy, K.P.; Freeman, W.T. LabelMe: A Database and Web-Based Tool for Image Annotation. Int. J. Comput. Vis. 2008, 77, 157–173. [Google Scholar] [CrossRef]
- Buslaev, A.; Iglovikov, V.I.; Khvedchenya, E.; Parinov, A.; Druzhinin, M.; Kalinin, A.A. Albumentations: Fast and Flexible Image Augmentations. Information 2020, 11, 125. [Google Scholar] [CrossRef] [Green Version]
- Wang, X.; Girshick, R.; Gupta, A.; He, K. Non-Local Neural Networks; CVF: New York, NY, USA, 2018; pp. 7794–7803. [Google Scholar]
- Wu, X.; Kumar, V.; Ross Quinlan, J.; Ghosh, J.; Yang, Q.; Motoda, H.; McLachlan, G.J.; Ng, A.; Liu, B.; Yu, P.S.; et al. Top 10 Algorithms in Data Mining. Knowl. Inf. Syst. 2008, 14, 1–37. [Google Scholar] [CrossRef] [Green Version]
- He, K.; Zhang, X.; Ren, S.; Sun, J. Deep Residual Learning for Image Recognition. In Proceedings of the 2016 IEEE Conference on Computer Vision and Pattern Recognition (CVPR), Las Vegas, NV, USA, 27–30 June 2016; pp. 770–778. [Google Scholar]
- Lafferty, J.; McCallum, A.; Pereira, F. Conditional Random Fields: Probabilistic Models for Segmenting and Labeling Sequence Data. Departmental Papers (CIS). 2001. Available online: https://repository.upenn.edu/items/c9aea099-b5c8-4fdd-901c-15b6f889e4a7 (accessed on 29 July 2023).
- Jadon, S. A Survey of Loss Functions for Semantic Segmentation. In Proceedings of the 2020 IEEE Conference on Computational Intelligence in Bioinformatics and Computational Biology (CIBCB), Via del Mar, Chile, 27–29 October 2020; pp. 1–7. [Google Scholar]
- McHugh, M.L. Interrater Reliability: The Kappa Statistic. Biochem. Medica 2012, 22, 276–282. [Google Scholar] [CrossRef]
- Howard, A.; Sandler, M.; Chu, G.; Chen, L.-C.; Chen, B.; Tan, M.; Wang, W.; Zhu, Y.; Pang, R.; Vasudevan, V.; et al. Searching for MobileNetV3. In Proceedings of the IEEE/CVF International Conference on Computer Vision (ICCV), Seoul, Republic of Korea, 27 October–2 November 2019; pp. 1314–1324. [Google Scholar]
- Ronneberger, O.; Fischer, P.; Brox, T. U-Net: Convolutional Networks for Biomedical Image Segmentation. In Proceedings of the Medical Image Computing and Computer-Assisted Intervention–MICCAI 2015; Navab, N., Hornegger, J., Wells, W.M., Frangi, A.F., Eds.; Springer International Publishing: Cham, Switzerland, 2015; pp. 234–241. [Google Scholar]
- Long, J.; Shelhamer, E.; Darrell, T. Fully Convolutional Networks for Semantic Segmentation. In Proceedings of the IEEE Conference on Computer Vision and Pattern Recognition (CVPR), Boston, MA, USA, 7–12 June 2015; pp. 3431–3440. [Google Scholar]
- Zhang, J.; Li, X.; Qin, Q.; Wang, Y.; Gao, X. Study on Overlying Strata Movement Patterns and Mechanisms in Super-Large Mining Height Stopes. Bull. Eng. Geol. Env. 2023, 82, 142. [Google Scholar] [CrossRef]
- Liu, S.; Sun, H.; Zhang, D.; Yang, K.; Wang, D.; Li, X.; Long, K.; Li, Y. Nuclear Magnetic Resonance Study on the Influence of Liquid Nitrogen Cold Soaking on the Pore Structure of Different Coals. Phys. Fluids 2022, 35, 012009. [Google Scholar] [CrossRef]
- Tan, X.; Xiao, Z.; Wan, Q.; Shao, W. Scale Sensitive Neural Network for Road Segmentation in High-Resolution Remote Sensing Images. IEEE Geosci. Remote Sens. Lett. 2020, 18, 533–537. [Google Scholar] [CrossRef]
- Zhu, M.; Xie, G.; Liu, L.; Wang, R.; Ruan, S.; Yang, P.; Fang, Z. Strengthening Mechanism of Granulated Blast-Furnace Slag on the Uniaxial Compressive Strength of Modified Magnesium Slag-Based Cemented Backfilling Material. Process Saf. Environ. Prot. 2023, 174, 722–733. [Google Scholar] [CrossRef]
- Wang, G.; Wu, M.; Wei, X.; Song, H. Water Identification from High-Resolution Remote Sensing Images Based on Multidimensional Densely Connected Convolutional Neural Networks. Remote Sens. 2020, 12, 795. [Google Scholar] [CrossRef] [Green Version]
- Liu, S.; Sun, H.; Zhang, D.; Yang, K.; Li, X.; Wang, D.; Li, Y. Experimental Study of Effect of Liquid Nitrogen Cold Soaking on Coal Pore Structure and Fractal Characteristics. Energy 2023, 275, 127470. [Google Scholar] [CrossRef]
- Amitrano, D.; Guida, R.; Iervolino, P. Semantic Unsupervised Change Detection of Natural Land Cover With Multitemporal Object-Based Analysis on SAR Images. IEEE Trans. Geosci. Remote Sens. 2021, 59, 5494–5514. [Google Scholar] [CrossRef]
- Liu, S.; Li, X. Experimental Study on the Effect of Cold Soaking with Liquid Nitrogen on the Coal Chemical and Microstructural Characteristics. Env. Sci. Pollut. Res. 2023, 30, 36080–36097. [Google Scholar] [CrossRef] [PubMed]
- Lv, Z.; Liu, T.; Wan, Y.; Benediktsson, J.A.; Zhang, X. Post-Processing Approach for Refining Raw Land Cover Change Detection of Very High-Resolution Remote Sensing Images. Remote Sens. 2018, 10, 472. [Google Scholar] [CrossRef] [Green Version]


| EMANet | EMANet and FC-CRF | |
|---|---|---|
| PA | 97.77% | 98.09% |
| MIoU | 87.67% | 89.48% |
| kappa | 86.28% | 88.48% |
| MobileNetV3 | U-Net | FCN | EMANet and FC-CRF | |
|---|---|---|---|---|
| PA | 94.83% | 93.18% | 95.74% | 98.09% |
| MIoU | 74.36% | 67.07% | 78.04% | 89.48% |
| kappa | 67.53% | 54.87% | 80.56% | 88.48% |
Disclaimer/Publisher’s Note: The statements, opinions and data contained in all publications are solely those of the individual author(s) and contributor(s) and not of MDPI and/or the editor(s). MDPI and/or the editor(s) disclaim responsibility for any injury to people or property resulting from any ideas, methods, instructions or products referred to in the content. |
© 2023 by the authors. Licensee MDPI, Basel, Switzerland. This article is an open access article distributed under the terms and conditions of the Creative Commons Attribution (CC BY) license (https://creativecommons.org/licenses/by/4.0/).
Share and Cite
Ren, Z.; Wang, L.; He, Z. Open-Pit Mining Area Extraction from High-Resolution Remote Sensing Images Based on EMANet and FC-CRF. Remote Sens. 2023, 15, 3829. https://doi.org/10.3390/rs15153829
Ren Z, Wang L, He Z. Open-Pit Mining Area Extraction from High-Resolution Remote Sensing Images Based on EMANet and FC-CRF. Remote Sensing. 2023; 15(15):3829. https://doi.org/10.3390/rs15153829
Chicago/Turabian StyleRen, Zili, Liguan Wang, and Zhengxiang He. 2023. "Open-Pit Mining Area Extraction from High-Resolution Remote Sensing Images Based on EMANet and FC-CRF" Remote Sensing 15, no. 15: 3829. https://doi.org/10.3390/rs15153829
APA StyleRen, Z., Wang, L., & He, Z. (2023). Open-Pit Mining Area Extraction from High-Resolution Remote Sensing Images Based on EMANet and FC-CRF. Remote Sensing, 15(15), 3829. https://doi.org/10.3390/rs15153829