Article

Mapping Photovoltaic Panels in Coastal China Using Sentinel-1 and Sentinel-2 Images and Google Earth Engine

1
Department of Geography and Spatial Information Techniques, Ningbo University, Ningbo 315211, China
2
Ningbo Universities Collaborative Innovation Center for Land and Marine Spatial Utilization and Governance Research, Ningbo 315211, China
3
Donghai Academy, Ningbo University, Ningbo 315211, China
*
Author to whom correspondence should be addressed.
Remote Sens. 2023, 15(15), 3712; https://doi.org/10.3390/rs15153712
Submission received: 12 June 2023 / Revised: 21 July 2023 / Accepted: 24 July 2023 / Published: 25 July 2023
(This article belongs to the Section Remote Sensing Image Processing)

Abstract

:
Photovoltaic (PV) panels convert sunlight into electricity, and play a crucial role in energy decarbonization, and in promoting urban resources and environmental sustainability. The area of PV panels in China’s coastal regions is rapidly increasing, due to the huge demand for renewable energy. However, a rapid, accurate, and robust PV panel mapping approach, and a practical PV panel classification strategy for large-scale applications have not been established. Here, we developed a new approach that uses spectral and textural features to identify and map the PV panels there were in coastal China in 2021 using multispectral instrument (MSI) and synthetic aperture radar (SAR) images, and the Google Earth Engine (GEE), to differentiate PV panels according to their underlying surface properties. Our 10-m-spatial-resolution PV panel map had an overall accuracy of 94.31% in 2021. There was 510.78 km2 of PV panels in coastal China in 2021, which included 254.47 km2 of planar photovoltaic (PPV) panels, 170.70 km2 of slope photovoltaic (SPV) panels, and 85.61 km2 of water photovoltaic (WPV) panels. Our resultant PV panel map provides a detailed dataset for renewable layouts, ecological assessments, and the energy-related Sustainable Development Goals (SDGs).

Graphical Abstract

1. Introduction

Since the onset of the Industrial Revolution, global population growth and rapid productivity development have resulted in an increase in demand for energy in human activities [1,2]. Unfortunately, fossil fuel energy consumption has accelerated global warming through greenhouse gas emissions, which has substantially harmed human wellbeing and ecological security [3]. However, renewable energy sources offer an effective solution to reduce carbon emissions [4,5]. In the age of electrical engineering and the information era, decarbonized electricity is the primary form of clean energy supply [6]. The 2030 Agenda for Sustainable Development aims to ensure universal access to affordable, reliable, sustainable, and modern energy, with solar energy being an optimal choice to meet future energy demands, due to its usability, capacity, cost, and efficiency advantages [7]. Photovoltaic (PV) technology is an effective means of converting sunlight into electricity and reducing greenhouse gas emissions [8]. The cost of photovoltaic panel installation has gradually decreased with improvements in photovoltaic materials and the expansion of the photovoltaic industry.
Countries worldwide are making significant efforts to implement photovoltaic power generation projects, to achieve sustainable development goals. As of 2021, the global photovoltaic installed capacity exceeded 175 gigawatts (GW), and the cumulative photovoltaic installed capacity surpassed 942 GW, which substantially contributes to energy decarbonization. Despite being the world’s largest developing country, and having the highest carbon emissions [9], China has implemented various policies and measures to address this issue. In September 2020, China set the ambitious target to achieve carbon peak by 2030, by promoting energy conservation, emission reduction, economic transformation, and energy structure adjustments [10,11]. Notably, China’s photovoltaic industry has experienced an impressive growth in the past five years, with the annual power generation having increased by over 20%. Consequently, China has become the fastest-growing country in this area, with a photovoltaic installed capacity of 54.9 GW, and a cumulative installed capacity of 308.5 GW in 2021, which accounted for almost one-third of the world’s photovoltaic installed capacity.
Photovoltaic power generation converts solar radiation into electrical energy using crystalline silicon panels. The layout of these panels is closely related to the intensity of solar radiation and the duration of sunshine. There are two main installation methods: centralized and distributed. Centralized photovoltaic panels are typically installed in sunny areas, such as low hills, deserts, water surfaces, and abandoned mines. In contrast, distributed photovoltaic panels are usually installed on the surfaces of buildings, including greenhouses and factories. The construction of photovoltaic power stations has given rise to new models, such as agriculture–photovoltaic complementarity, fishery–photovoltaic complementarity, and forestry–photovoltaic complementarity. These stations have alleviated energy-based poverty, and promoted economic development [12]. However, the large-scale distribution of photovoltaic panels can occupy a substantial area of the land surface. Photovoltaic panel installation in inland waters may influence flood control ability. Photovoltaic panel construction on a sunny slope may destroy native vegetation, and may increase the risk of fire disasters [13]. In China, the installation of photovoltaic panels in riverways, lakes, and reservoirs is prohibited, and it is not permitted for photovoltaic hybrid projects to occupy cultivated or forest lands. Additionally, distributed photovoltaic installation in population-dense areas may cause noise, light pollution, and other issues. On the other hand, installing photovoltaic panels on water surfaces created by abandoned mines and mining subsidence areas can effectively restore ecology, and promote economic development. As the photovoltaic power generation industry continues to rapidly develop, there is an urgent need for the precise monitoring of these panels [14].
The current research on photovoltaic power generation primarily focuses on the development of photovoltaic materials [15], the potential assessment of photovoltaic power generation [16,17], photovoltaic panel monitoring [18], and analyses of the effects of photovoltaic power generation [19]. Common methods used to identify photovoltaic panels include participatory cartography [20], deep learning [21,22], and the random forest method [23]. The photovoltaic indexes were reported in the latest study [24]. The data types mainly include aerial RGB images [25], multispectral images [26], hyperspectral images [27], and thermal infrared images [28]. The area of solar panels is small and distributed. Low-spatial-resolution images result in a high level of error in recognizing distributed photovoltaic panels. High-spatial-resolution images, such as UAV thermal infrared images, can be used to accurately detect photovoltaic panels, but they are disadvantageous in the large-scale mapping of photovoltaic panels. Visual interpretation achieves high accuracy, but its time and labor consumption hinder its extensive implementation in the recognition of photovoltaic panels. Additionally, the speed of data updates is frequently sluggish. Deep learning methods, such as convolutional neural networks (CNNs) and recurrent neural networks (RNNs), have been employed in the extraction of high-resolution photovoltaic panel images, but they demand significant computational resources [29,30]. The combination of the random forest method and Sentinel satellite images has significant advantages in the recognition accuracy and calculation efficiency regarding photovoltaic panels. Limited by the spatial resolution, large-scale photovoltaic panel mapping is presently mainly dominated by the Landsat series data. The spatial resolution of Landsat is 30 m, and the pixel width is larger than the width of the photovoltaic panel, which may lead to an overestimation of the photovoltaic panel area. Currently, there is a notable mismatch between the spatial distribution of electricity consumption and solar energy resources. The research on photovoltaic panel classification has predominantly concentrated on regions with ample solar energy resources, while regions characterized by a high electricity demand and a pressing need for energy structure adjustments have received limited attention.
The environmental impact of photovoltaic panels varies according to latitude and altitude [31]. Installing photovoltaics in arid areas reduces the solar radiation absorbed by the surface under the PV panels, which creates a cold island effect that affects the surrounding area of the photovoltaic power station [32], reduces water evaporation, and increases vegetation growth [33]. Different underlying surfaces have different natural conditions that alter the environmental effects of the photovoltaic panels. Currently, few studies exist on the classification of photovoltaic panels on different underlying surfaces, and there is no secondary classification system for photovoltaic panels. The environmental impact of photovoltaic panels has not been a focus, and this is not conducive to environmental effect analysis and illegal installation monitoring.
The objectives of our study were to: (1) map the photovoltaic panels in China’s coastal regions at a high spatial resolution, by integrating spectral information and textural features; (2) differentiate PV panels, using their underlying surface properties; and (3) analyze the spatial distribution characteristics of PV panels, and their impact on vegetation, in China’s coastal regions.

2. Materials and Methods
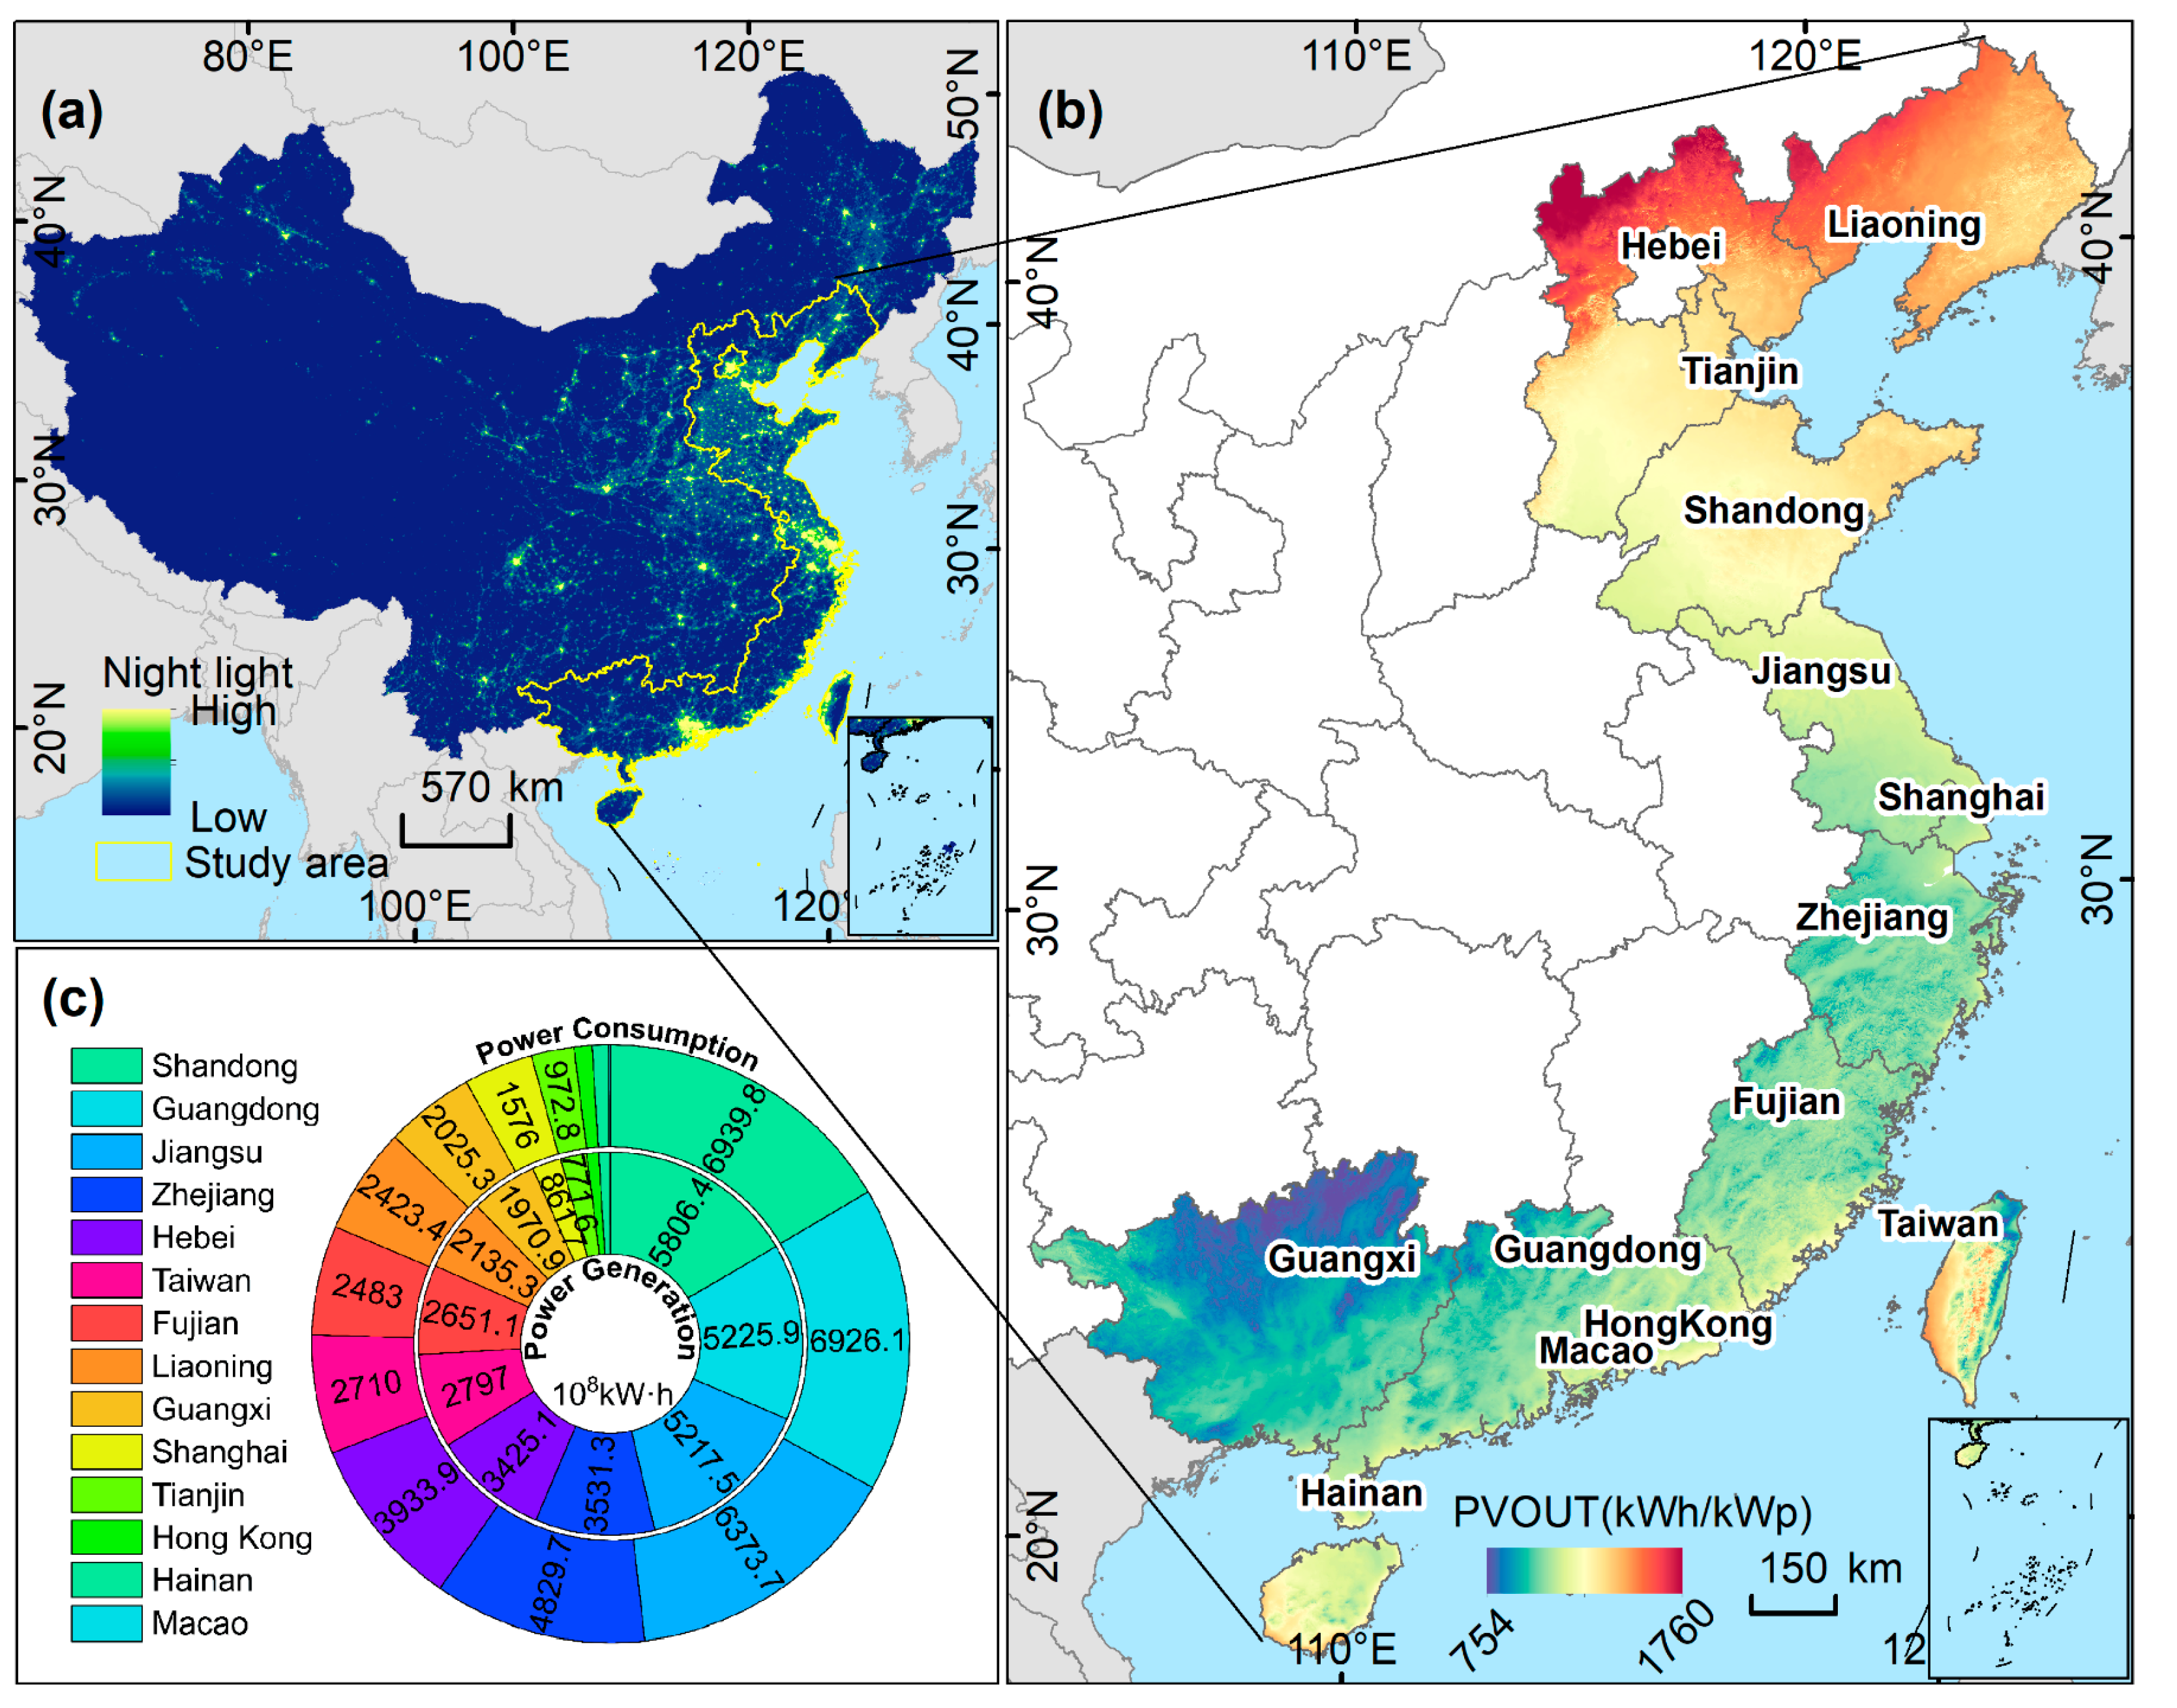
2.1. Study Area

China’s coastal regions encompass 14 provincial administrative regions, spanning approximately 1.34 × 10⁶ km2 and crossing multiple climate zones, including tropical, subtropical, and temperate regions. These regions are among the most economically developed areas in China, with dense populations, industrial clusters, and a high electricity consumption (Figure 1a). From north to south, these regions are home to four traditional industrial bases: South Central Liaoning, Beijing–Tianjin–Tangshan, the Yangtze River Delta, and the Pearl River Delta. They also comprise three high-tech industrial belts: Beijing–Tianjin–Shijiazhuang, Shanghai–Nanjing–Hangzhou, and the Pearl River Delta. In 2020, the total population of China’s coastal regions was about 46.25% of the national population, the GDP was about 56.15% of the national GDP, and the power consumption was about 53.45% of the nation’s demand. Except for in Fujian and Taiwan, the power consumption of the regions was higher than the supply, and the power gap was 691.95 billion kWh (Figure 1c). China’s coastal regions have some photovoltaic power generation potential (Figure 1b). The traditional industrial base of these regions, and the widespread high-tech enterprises create a promising market demand for renewable energy.

2.2. Data Sources

2.2.1. Satellite Datasets

The remote sensing images were obtained exclusively from the Google Earth Engine (GEE) platform. The Sentinel-1 synthetic-aperture radar (SAR) is a dual-polarization SAR C-band instrument operating at 5.405 GHz (C band) with a spatial resolution of 10 m and a repeat cycle of 6 days at the equator. The data acquisition was not affected by cloud coverage, and the monitoring data were effectively acquired continuously, irrespective of the weather. The GEE platform has eliminated thermal noise, and implemented radiometric calibration and terrain correction for the SAR ground range detected images. On the other hand, the Sentinel-2 multispectral instrument (MSI) dataset is a high-spatial-resolution multispectral dataset with a repeat cycle of 5 days at the equator, and a highest spatial resolution of 10 m. However, the quality of the data collected was sensitive to cloud coverage. Nevertheless, the GEE platform implemented geometric calibration, radiometric calibration, and atmospheric calibration to improve the data quality. We collected all the available 3801 SAR images, and 35,358 MSI images from 1 January 2021 to 31 December 2021 in GEE, to map the coastal PV panels (Figure 2a).

2.2.2. Other Auxiliary Data
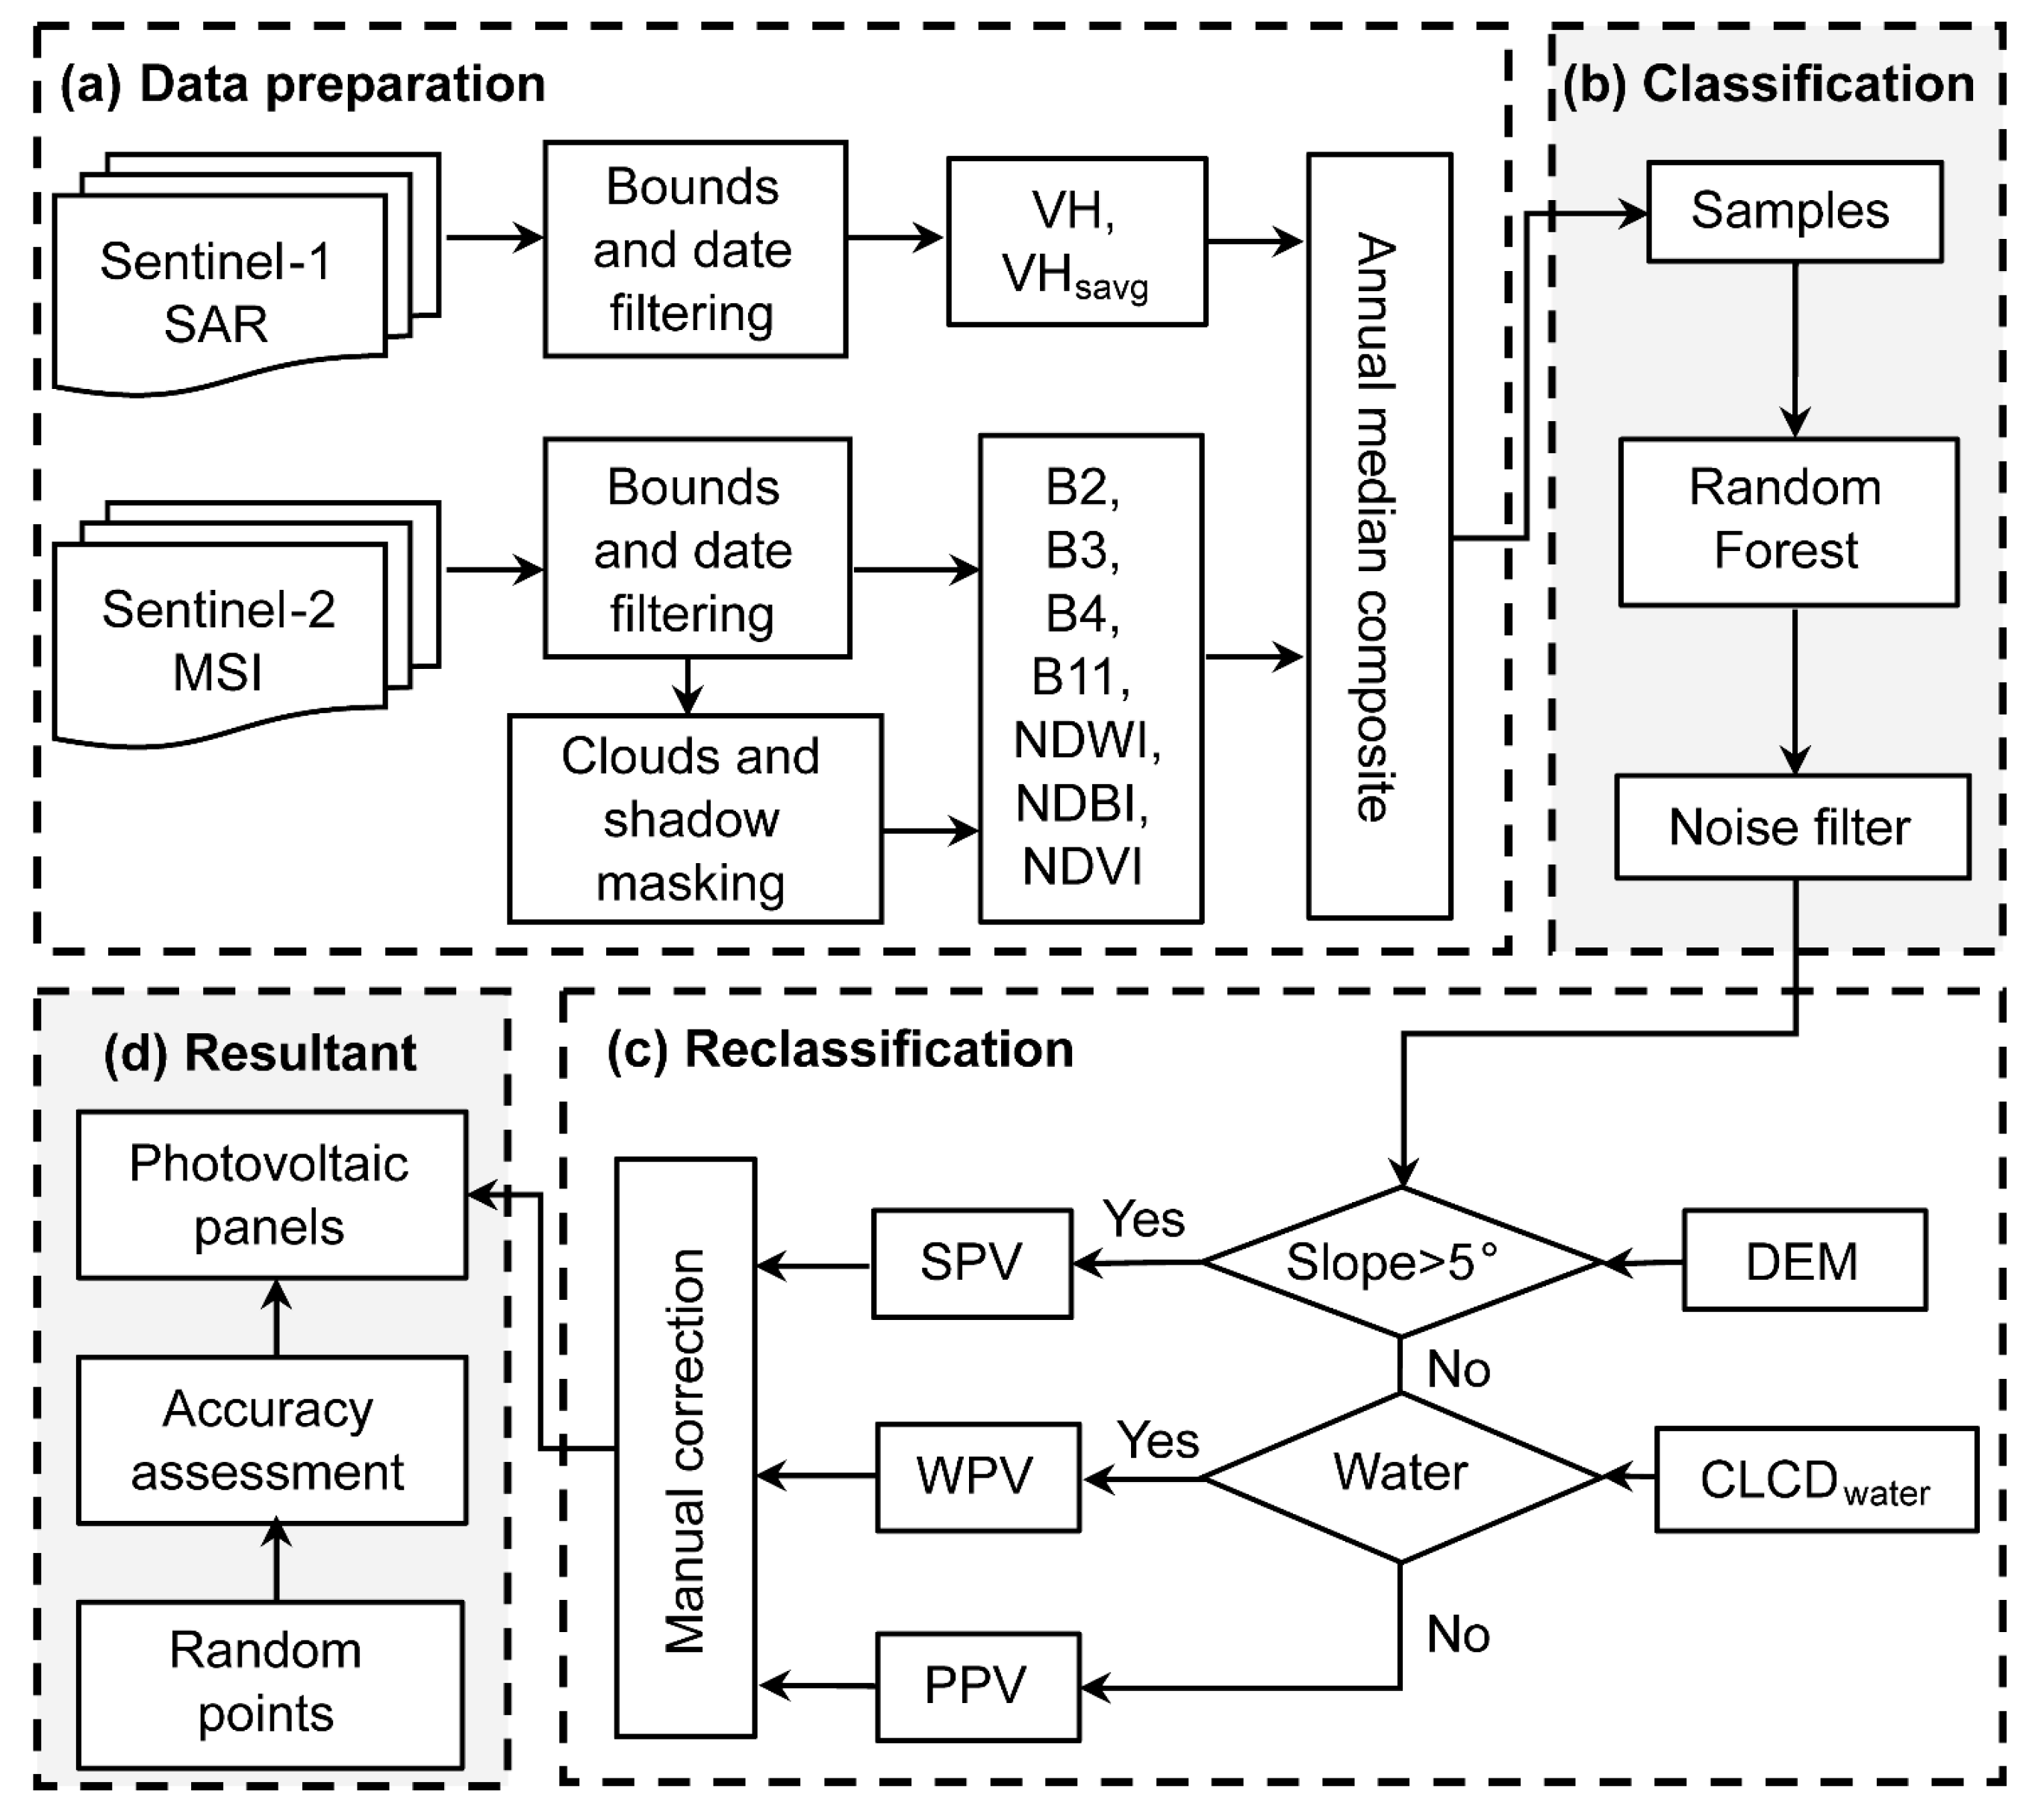
To differentiate slope photovoltaic panels (SPV), water photovoltaic panels (WPV), and planar photovoltaic panels (PPV), DEM data and historical water body data are essential. NASA Digital Elevation Model (NASADEM) filled in missing data using the Shuttle Radar Topography Mission (SRTM), which improved both the accuracy and coverage of the original data, and enabled the more precise calculation of the slope data. The China Land Cover Dataset (CLCD) was created by extracting stable sample features and time-series data from all the available Landsat images on the GEE platform. Using the random forest classifier and spatial–temporal filtering and logical reasoning, the first annual land-cover dataset of China was extracted for the period between 1990 and 2021, with a spatial resolution of 30 m. This dataset shows good spatial–temporal consistency, and is useful in spatial–temporal change detection [34].

2.3. Methods

We have developed a pixel-based approach for mapping PV panels. The processing workflow comprised four steps (Figure 3): (a) the preprocessing of the satellite images and the calculation of the characteristic bands; (b) the building of a classifier by selecting the sample points and performing post-classification processing; (c) the distinction of photovoltaic panels using the underlying surface properties; and (d) the random selection of verification points, to assess the accuracy of the approach.

2.3.1. Preprocessing of Satellite Images and Calculation of Characteristic Bands

The satellite images were screened on the GEE platform, using the study area scope and time. The MSI images were pre-processed to eliminate clouds and shadows, using the quality assessment (QA) bands and cloud-mask algorithm. We separately synthesized the medians of all the SAR and MSI images in 2021, as the imagery. The reflectivity of the solar array at the near-infrared bands and visible bands is relatively low, but its reflectivity at the far-infrared band is relatively high [35]. Photovoltaic panels are typically arranged in matrices, separated by roads, which forms specific textures [36]. Therefore, combining spectral information and textural characteristics can improve the recognition accuracy of photovoltaic panels.
To extract the spectral features, the Blue (B2), Green (B3), Red (B4), and Shortwave Infrared 1 (B11) bands were selected from the MSI. We calculated the normalized difference vegetation index (NDVI) [37], normalized difference built-up index (NDBI) [38], and normalized difference water index (NDWI) [39]. The backscattering coefficient in the Sentinel SAR images can reflect the texture information of surface objects. Textural features were extracted from Sentinel SAR images through the selection of the VH band and calculation of the gray co-occurrence matrix. The sum average (VHsavg) was chosen for the texture characteristic bands [36].

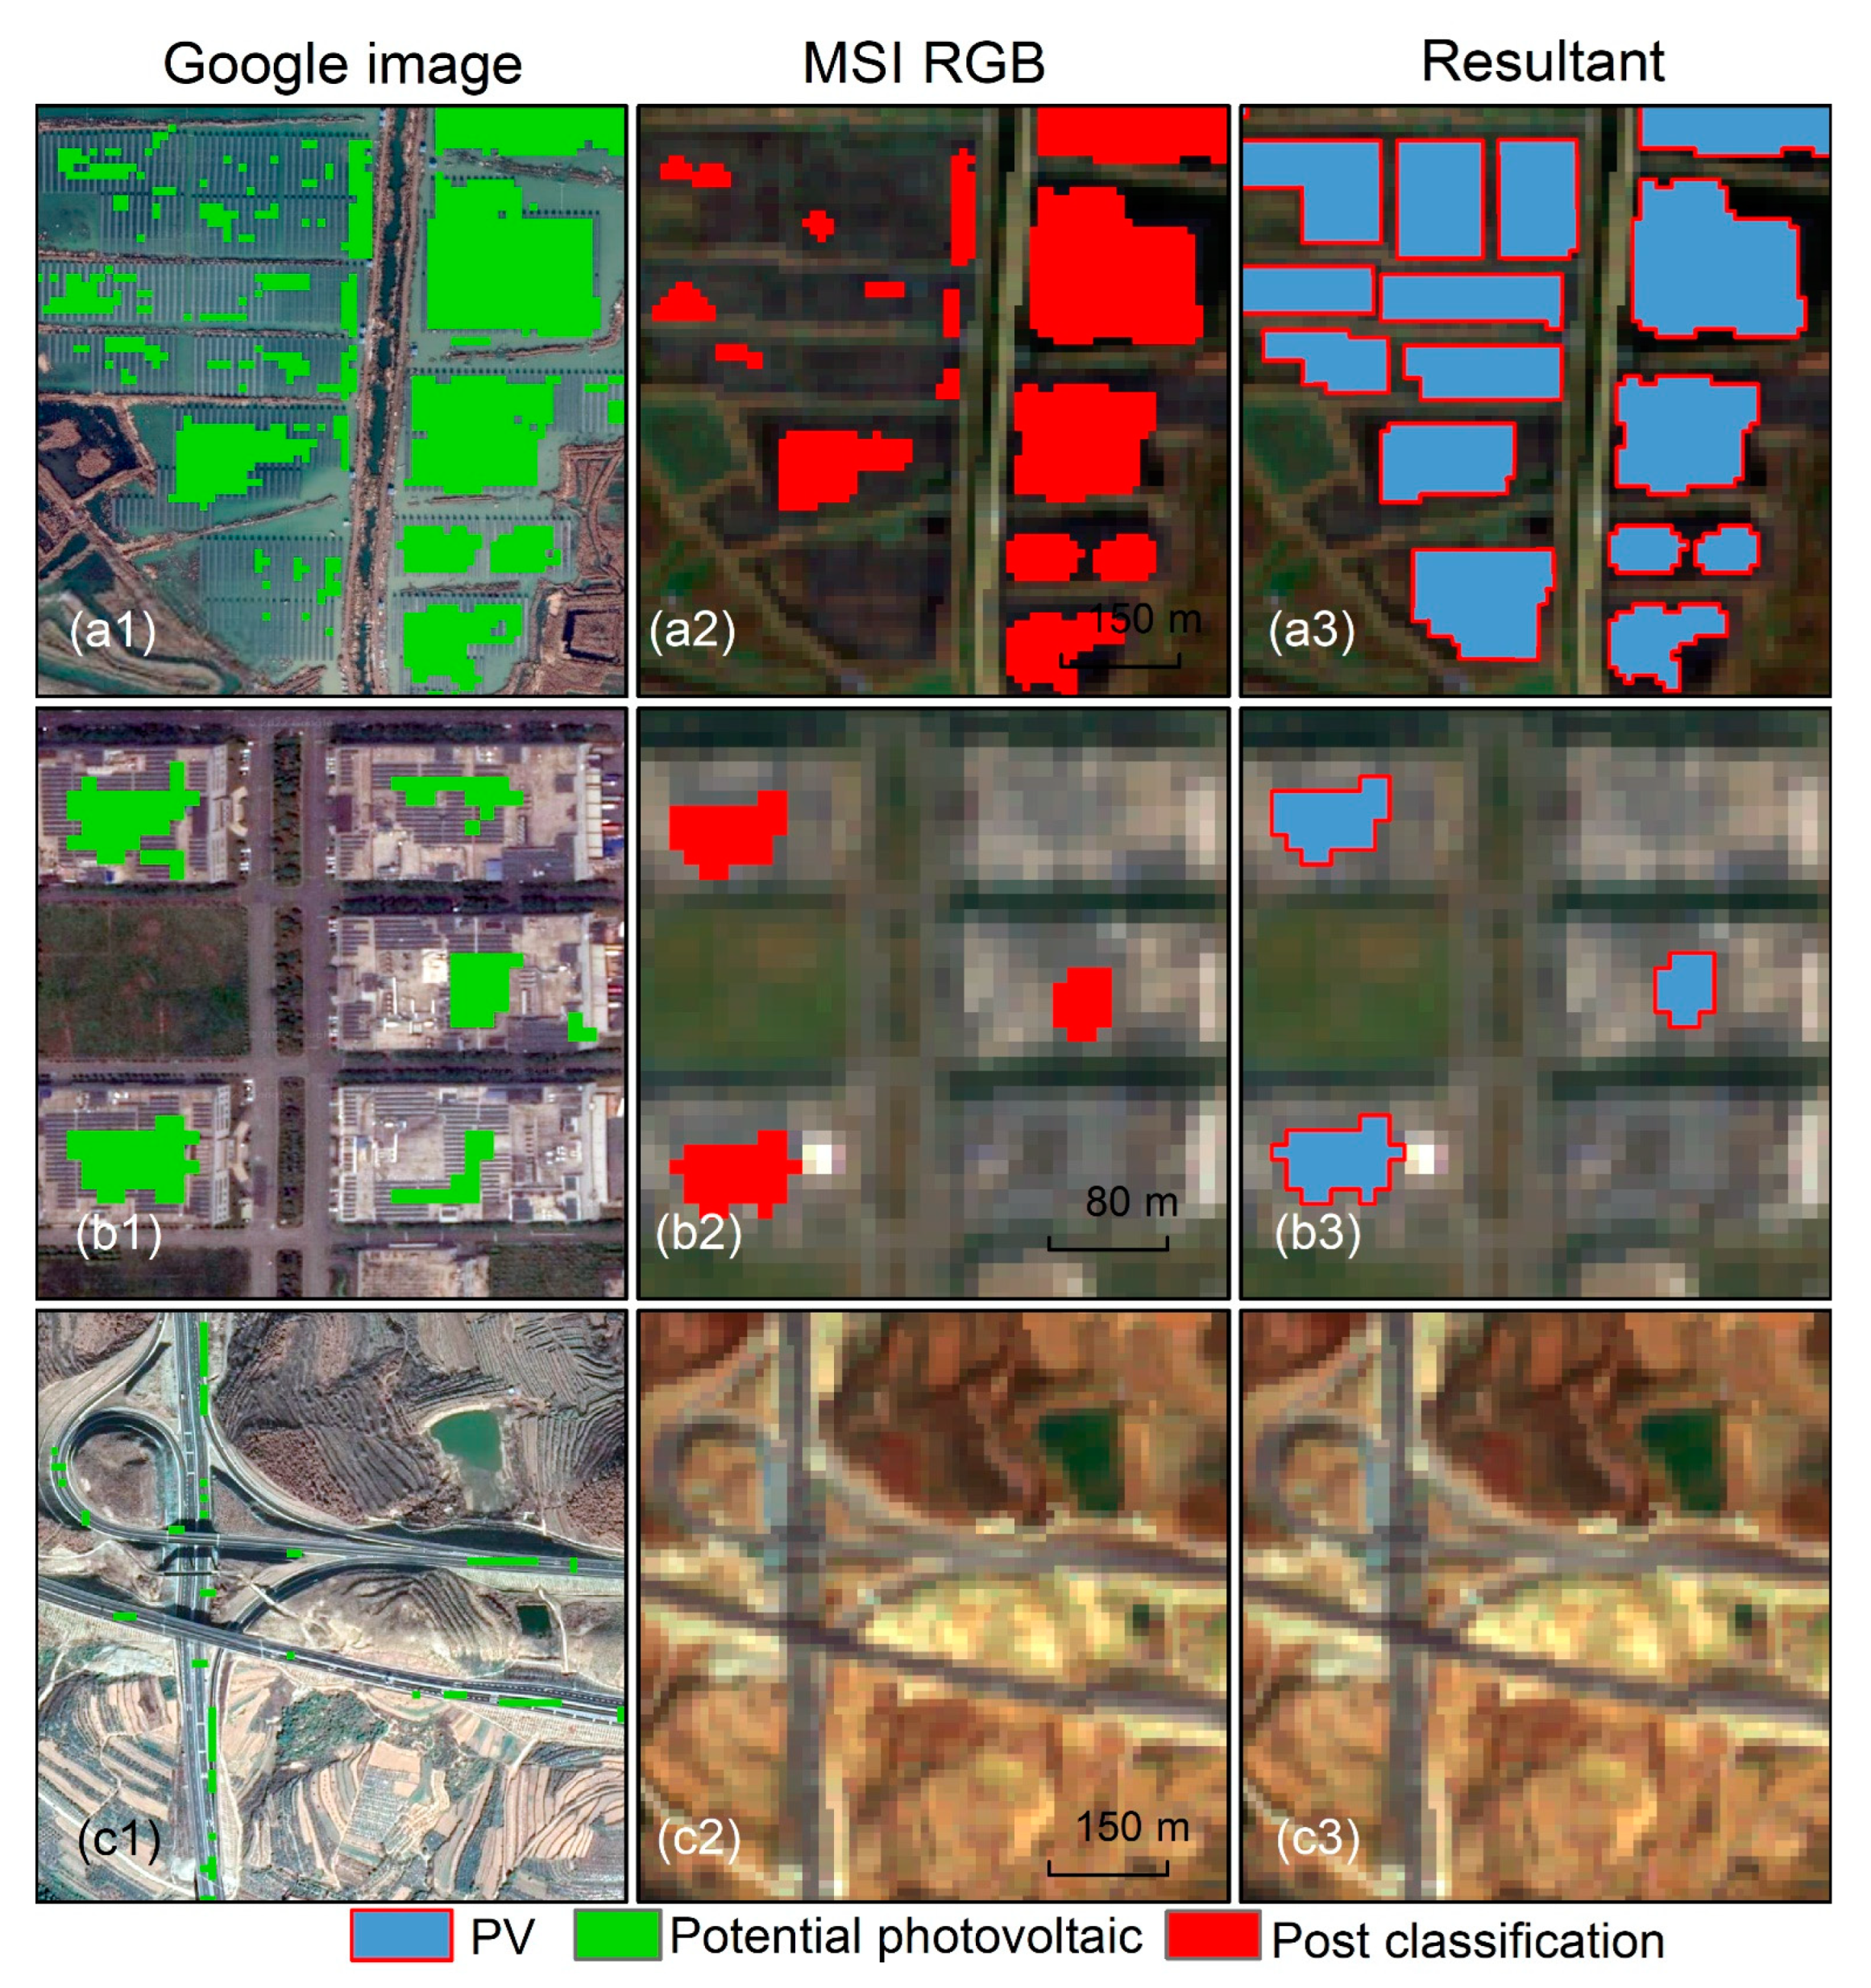
2.3.2. Build Classifier and Make Post-Classification Processing

The random forest (RF) classifier generates multiple decision trees through the random selection of training samples and variable subsets [40]. This approach yields a high classification accuracy, computational efficiency, and stability when processing multidimensional data [41]. The quantity and area of the sample points can significantly affect the classification results of the random forest. To ensure optimal results, the area of training samples should account for about 0.25% of the total study area [42]. For our study, we labeled 10,526 vector polygons from Google images and MSI RGB images, using the visual discrimination method, as samples, of which 8053 were photovoltaic sample points, and 2473 were non-PV (NOPV) sample points. The total area covered by the PV samples was approximately 2701.86 km2, which accounted for about 0.2% of the total study area. The NOPV sample area was approximately 2639.83 km2. We collected the central points of the sample vector polygons, and plotted the sample distribution map (Figure 2c). The classification results of the RF were found to be insensitive to the number of trees [43]. To enhance the computational efficiency, we constructed a random forest classifier on the GEE platform with 200 trees, while retaining the default values for the other parameters.
During the identification process, photovoltaic panels can be subject to interference from materials of the same spectrum but a different composition, as well as materials of different spectra but an identical composition. This interference can manifest as salt-and-pepper noise in the potential photovoltaic panels. To address this issue, we employed the Smoothing and Aggregation techniques in ENVI for the morphological processing of the classified data. Specifically, we set the Smooth Kernel Size to three, which effectively removed speckling noise during the cleanup. Additionally, we filtered out regions with fewer than nine clustered pixels, to ensure the accuracy of our results.

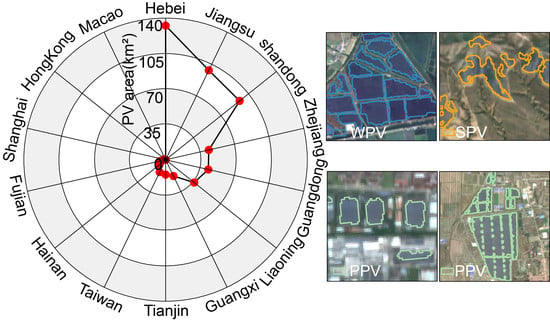
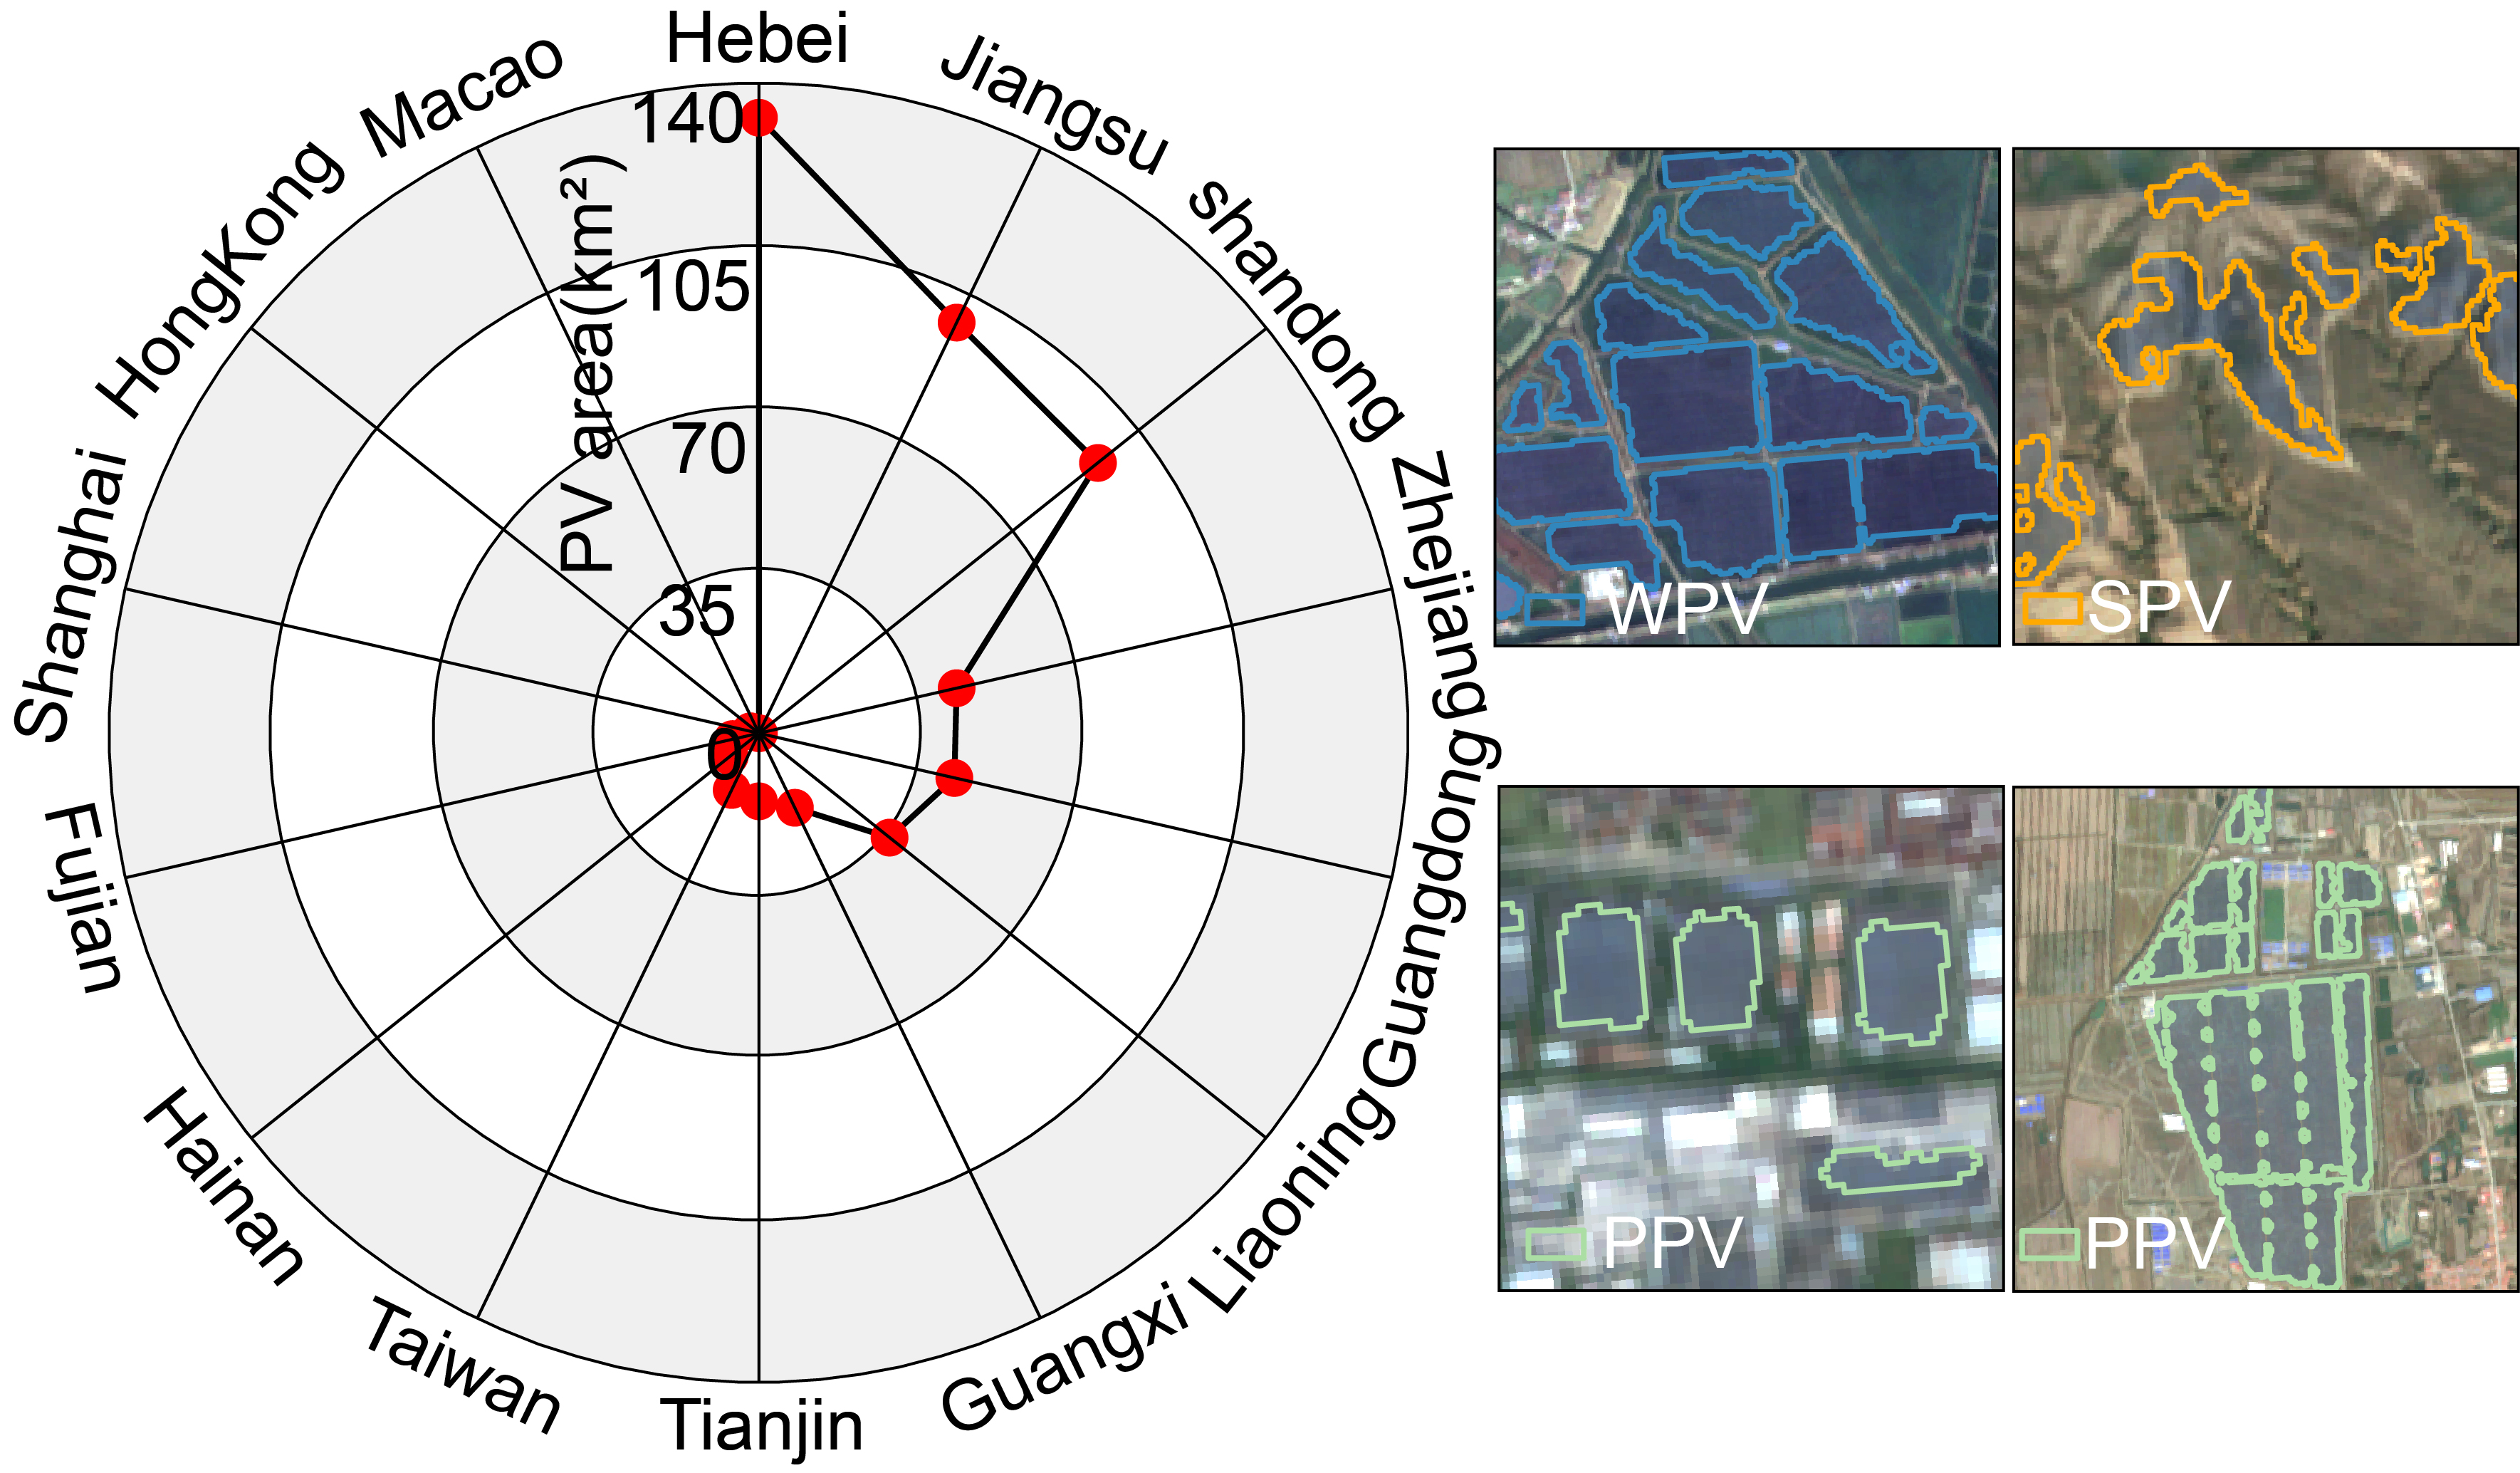
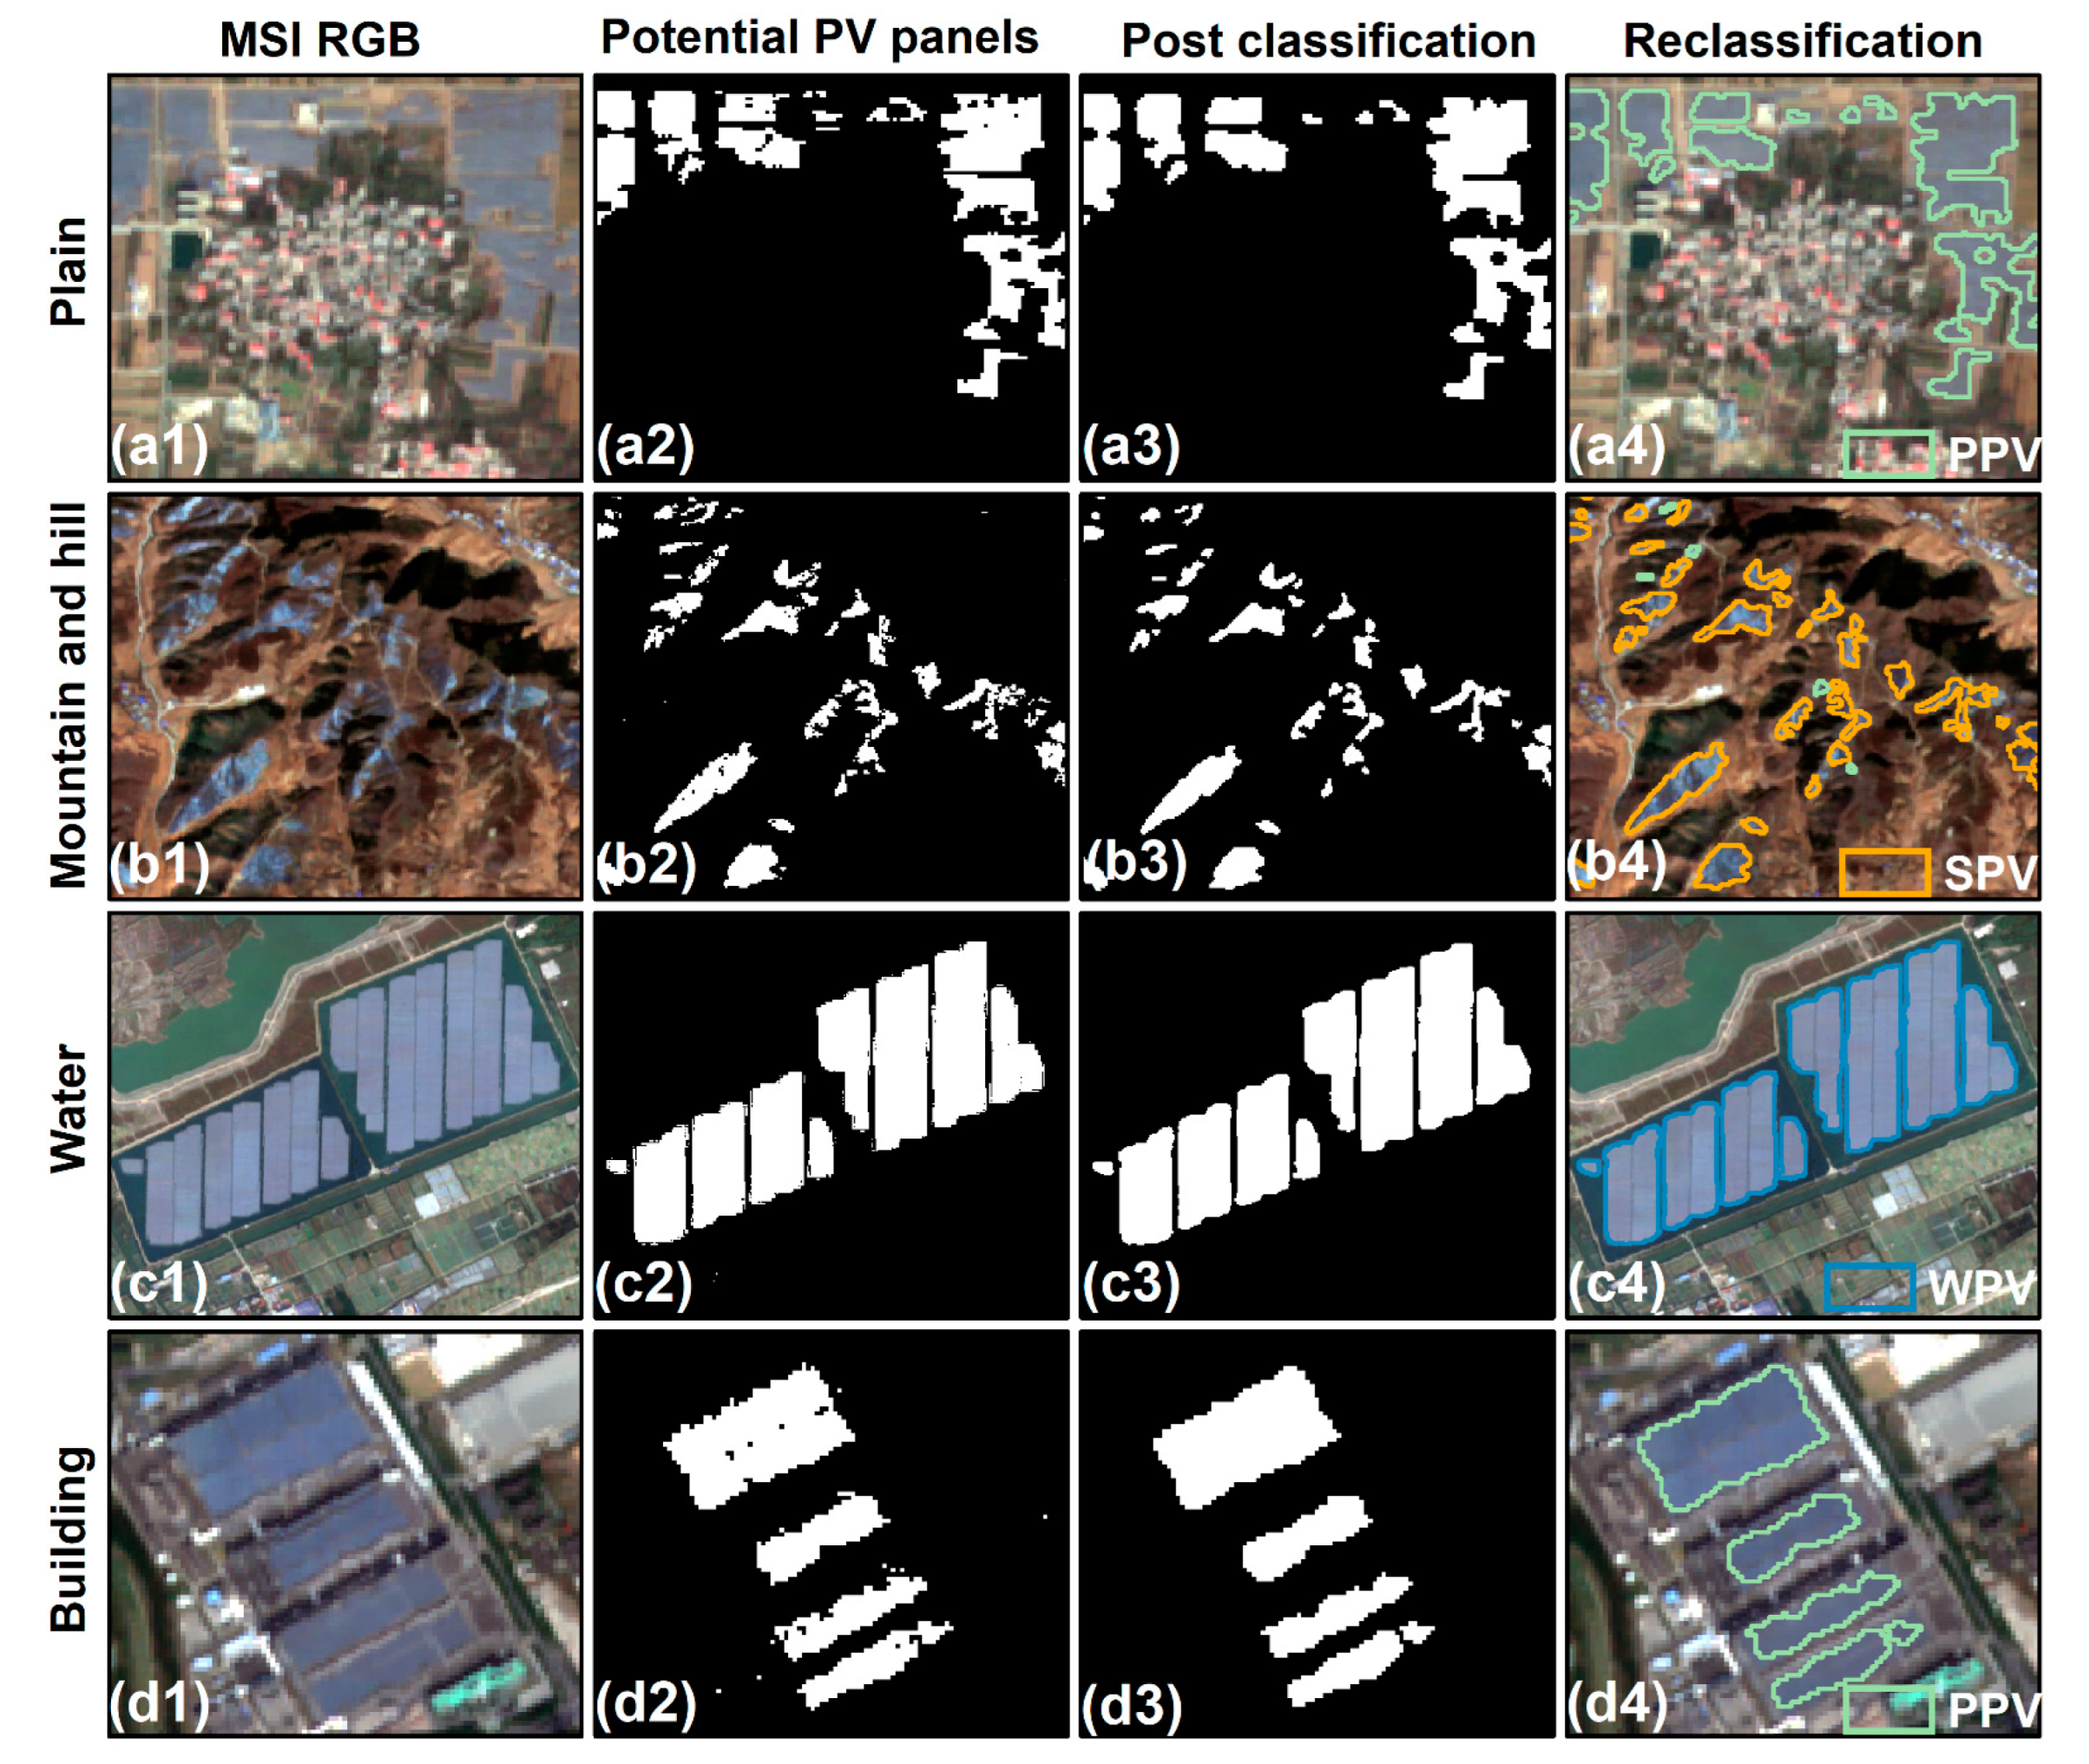
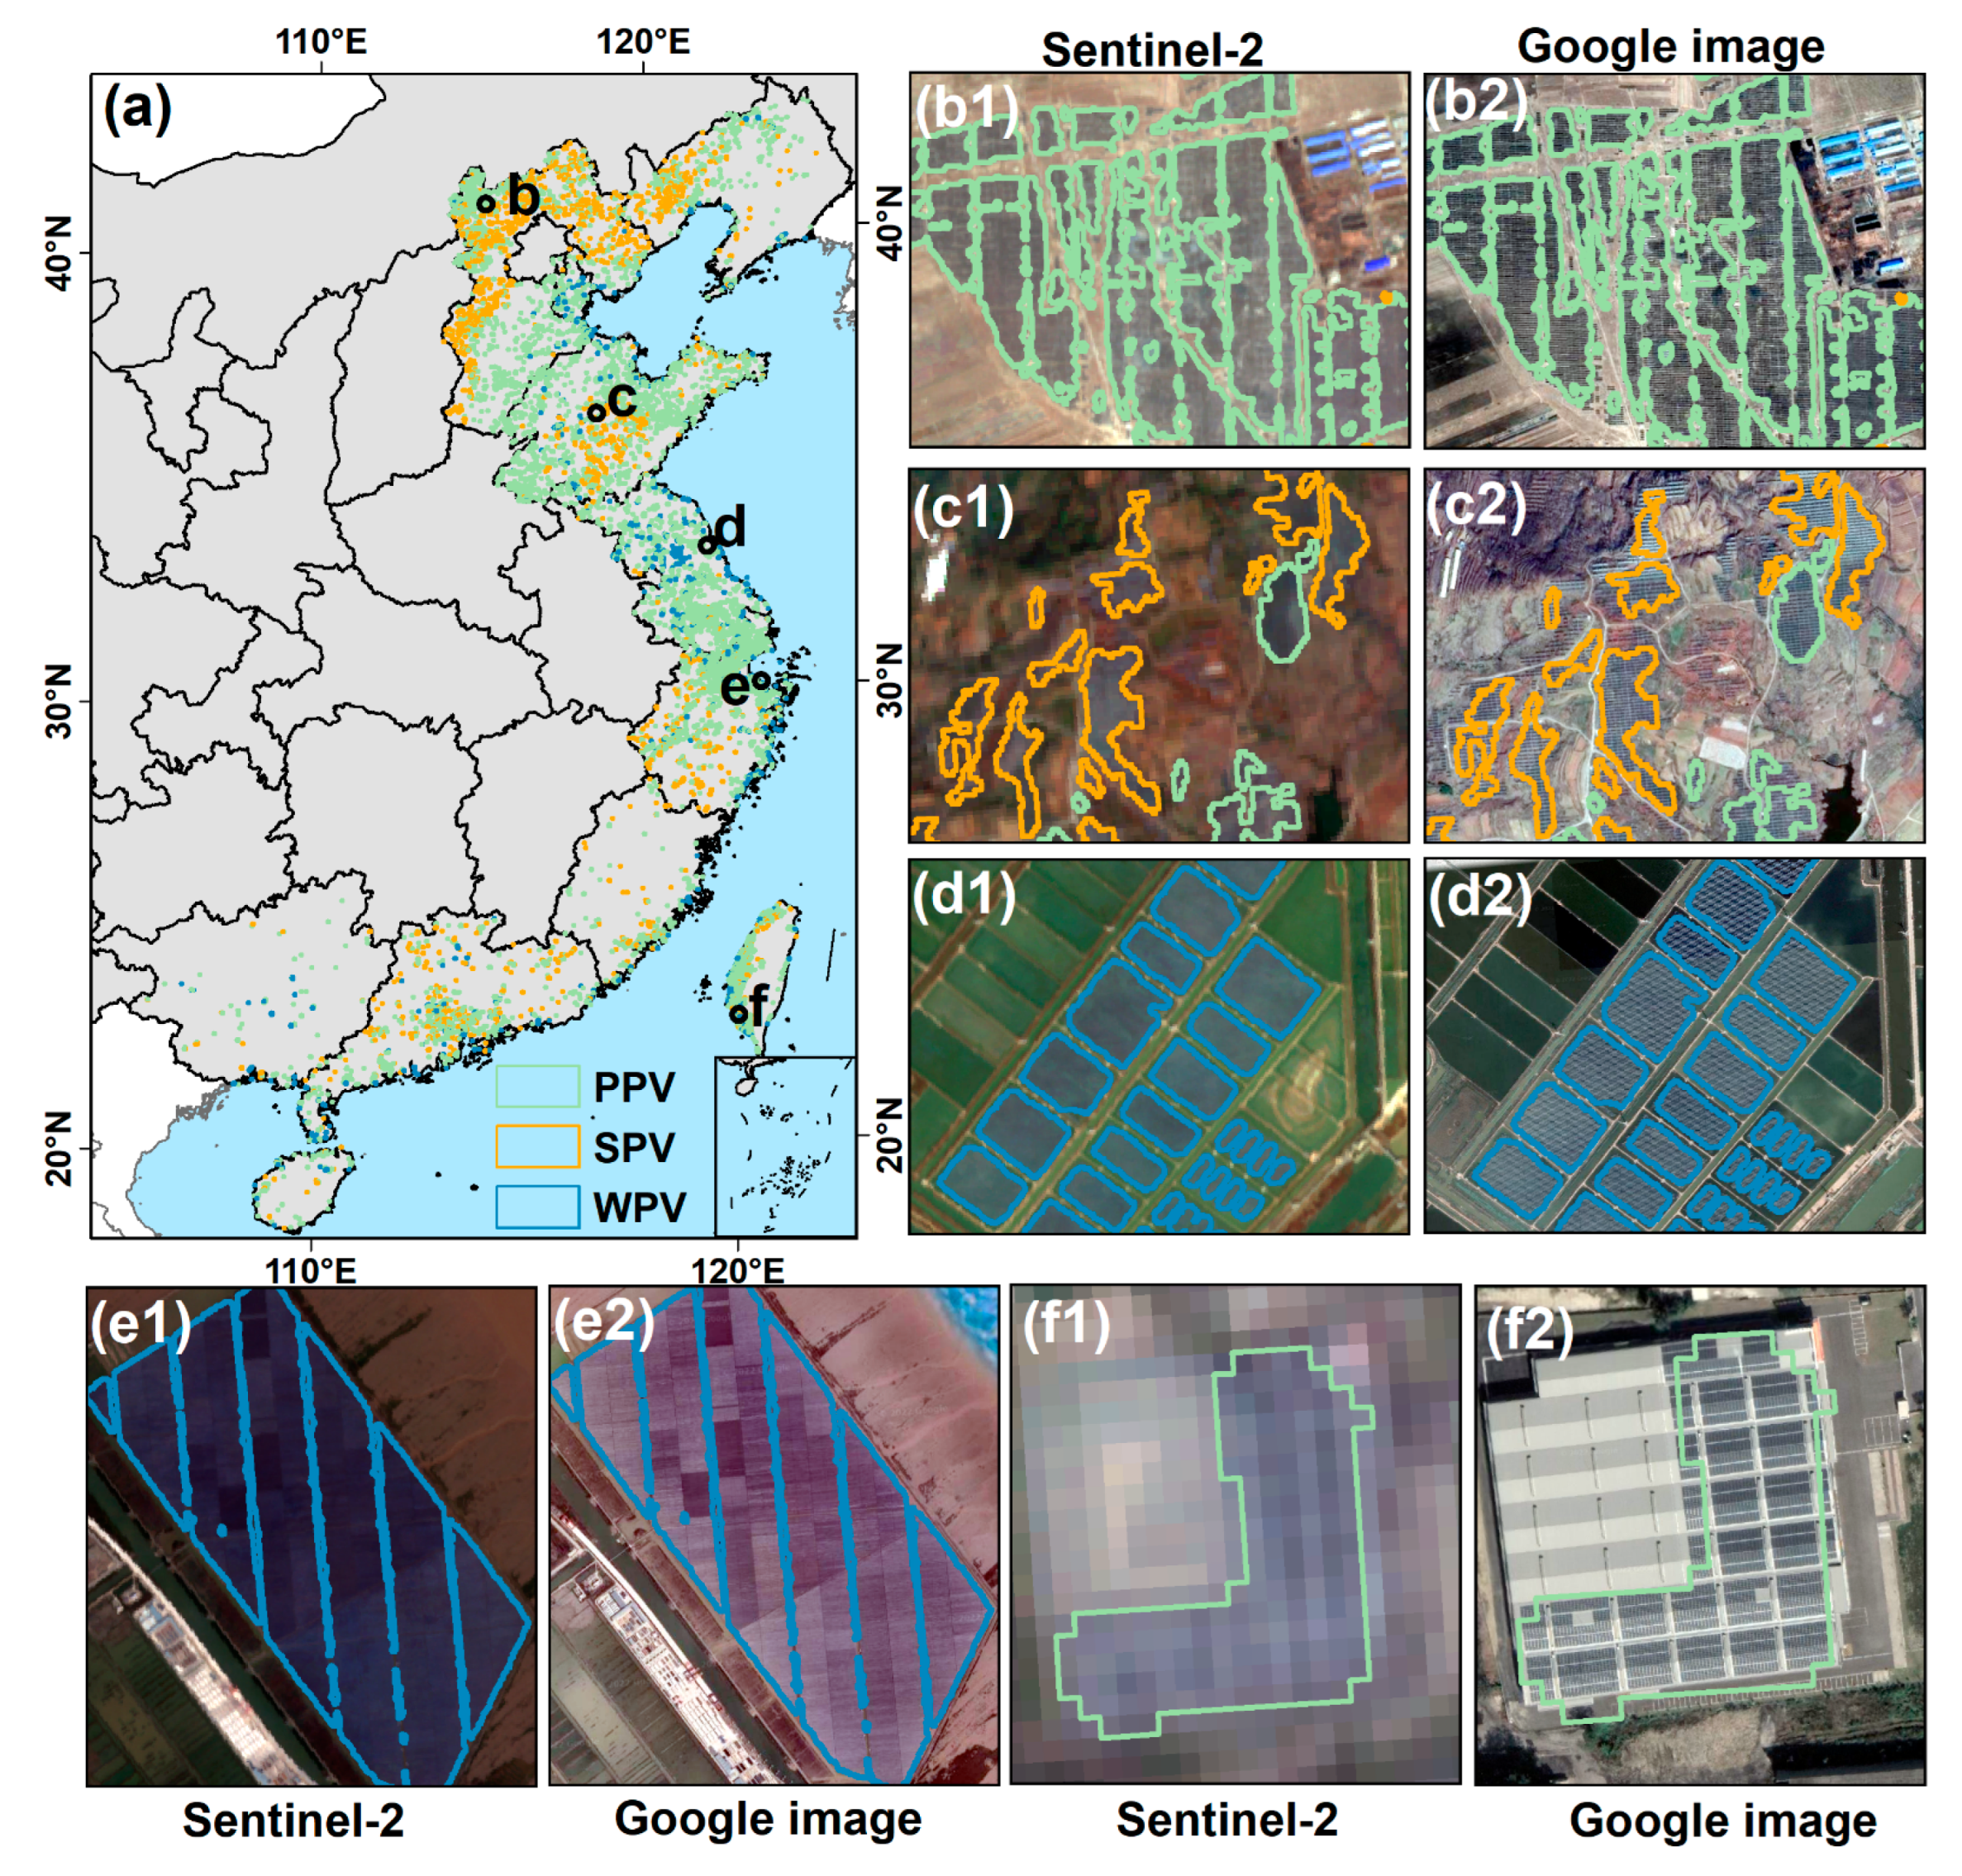
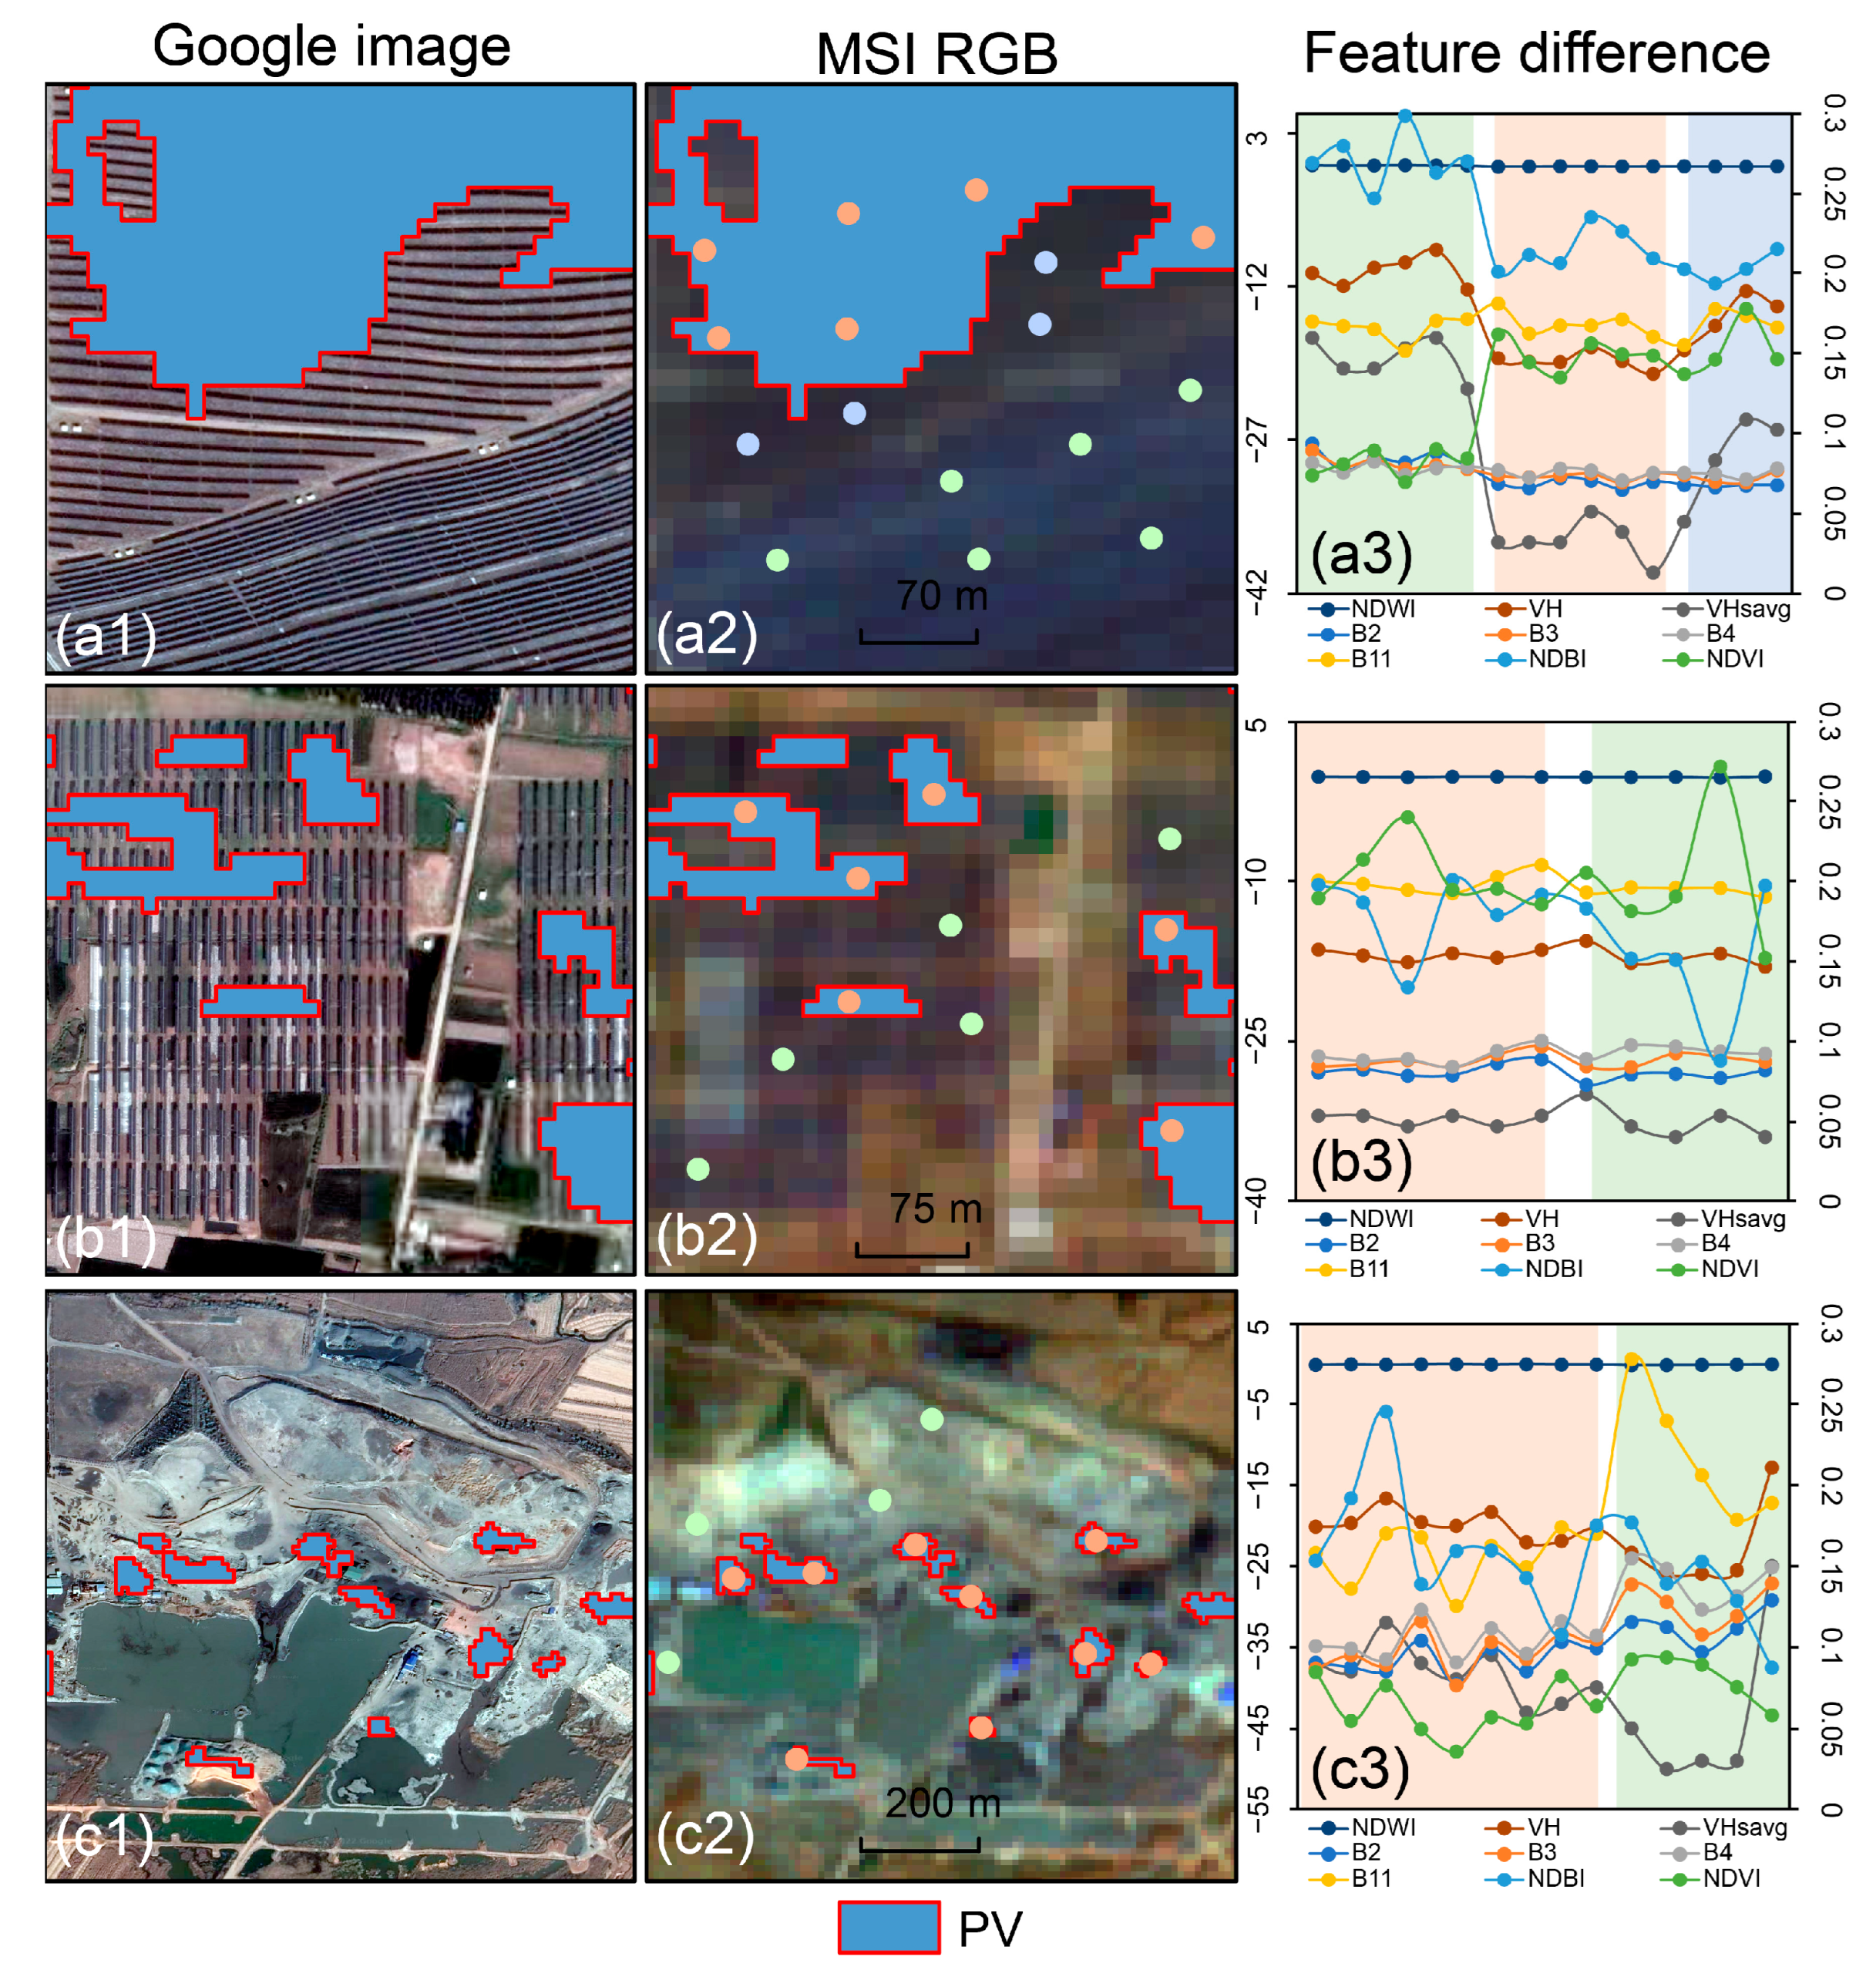
2.3.3. Differentiation of PV Panels

Photovoltaic panels installed on various underlying surfaces may result in disparate ecological and environmental effects. To categorize the photovoltaic panels using the properties of the underlying surface, those installed on slopes greater than 5° were classified as SPV, while those installed on water surfaces were designated as WPV. The remaining panels were classified as PPV. WPV panels have the potential to alter the spectral characteristics of the water body, leading to the misinterpretation of the water surface as a non-water body. To mitigate the impact of land-cover interpretation errors on WPV panels, the water bodies in CLCD products from 2015 and 2021 were superimposed as the underlying surfaces for the SPV assessment. Furthermore, we performed manual visual calibration of the secondary classification of photovoltaic panels, by superimposing Google images in QGIS. Figure 4 illustrates the diverse processing outcomes of photovoltaic panels on different underlying surfaces.

2.3.4. Accuracy Assessment

The photovoltaic panel map of China’s coastal regions in 2021 was extracted by combining machine learning and manual visual interpretation. To verify the accuracy of the extraction results, 7000 verification points were produced randomly, including 2754 NOPV verification points, 1074 WPV verification points, 1173 SPV verification points, and 1999 PPV verification points (Figure 5). We calculated the classification results of the various processing stages based on the confusion matrix, as well as the producer accuracy, user accuracy, overall accuracy (OA), and kappa coefficient for the different PV types. The producer accuracy measures the proportion of the actual positive instances that are correctly identified by a classifier. The user accuracy measures the proportion of the predicted positive instances that are actually true positives. The OA measures the proportion of the correctly classified instances, out of the total number of instances [44,45].

3. Results

3.1. Extraction Results and Precision Verification

3.1.1. Accurate Assessment of the Different Processing Maps

The overall accuracies of the potential photovoltaic panels, post-classification processing, and reclassifying were 95.07%, 93.07%, and 94.31%, respectively. The kappa coefficients were 0.86, 0.88, and 0.89, respectively. Due to the lack of morphological calculation for potential photovoltaic panels, there is little overlap between the validation points and noise, which resulted in a higher overall accuracy, but with obvious salt-and-pepper noise visually. The accuracy decreased after the post-classification processing, with reduced noise, and the accuracy improved after the visual interpretation correction (Table 1).

3.1.2. Accuracy of Different Types of PV

The classification accuracy of different photovoltaic types on different land surfaces is primarily influenced by the slope and the water distribution. The four types of photovoltaic panels, namely NOPV, PPV, SPV, and WPV, have the respective user accuracies of 87.80%, 87.78%, 94.89%, and 89.16%. The overall classification accuracy of the four types of photovoltaic panels is 89.06%. The inaccurate recognition of water bodies may cause WPV panels to be mistakenly identified as non-water areas during land-use classification, which results in a relatively lower user accuracy for PPV and WPV panels, compared to SPV panels (Table 2).

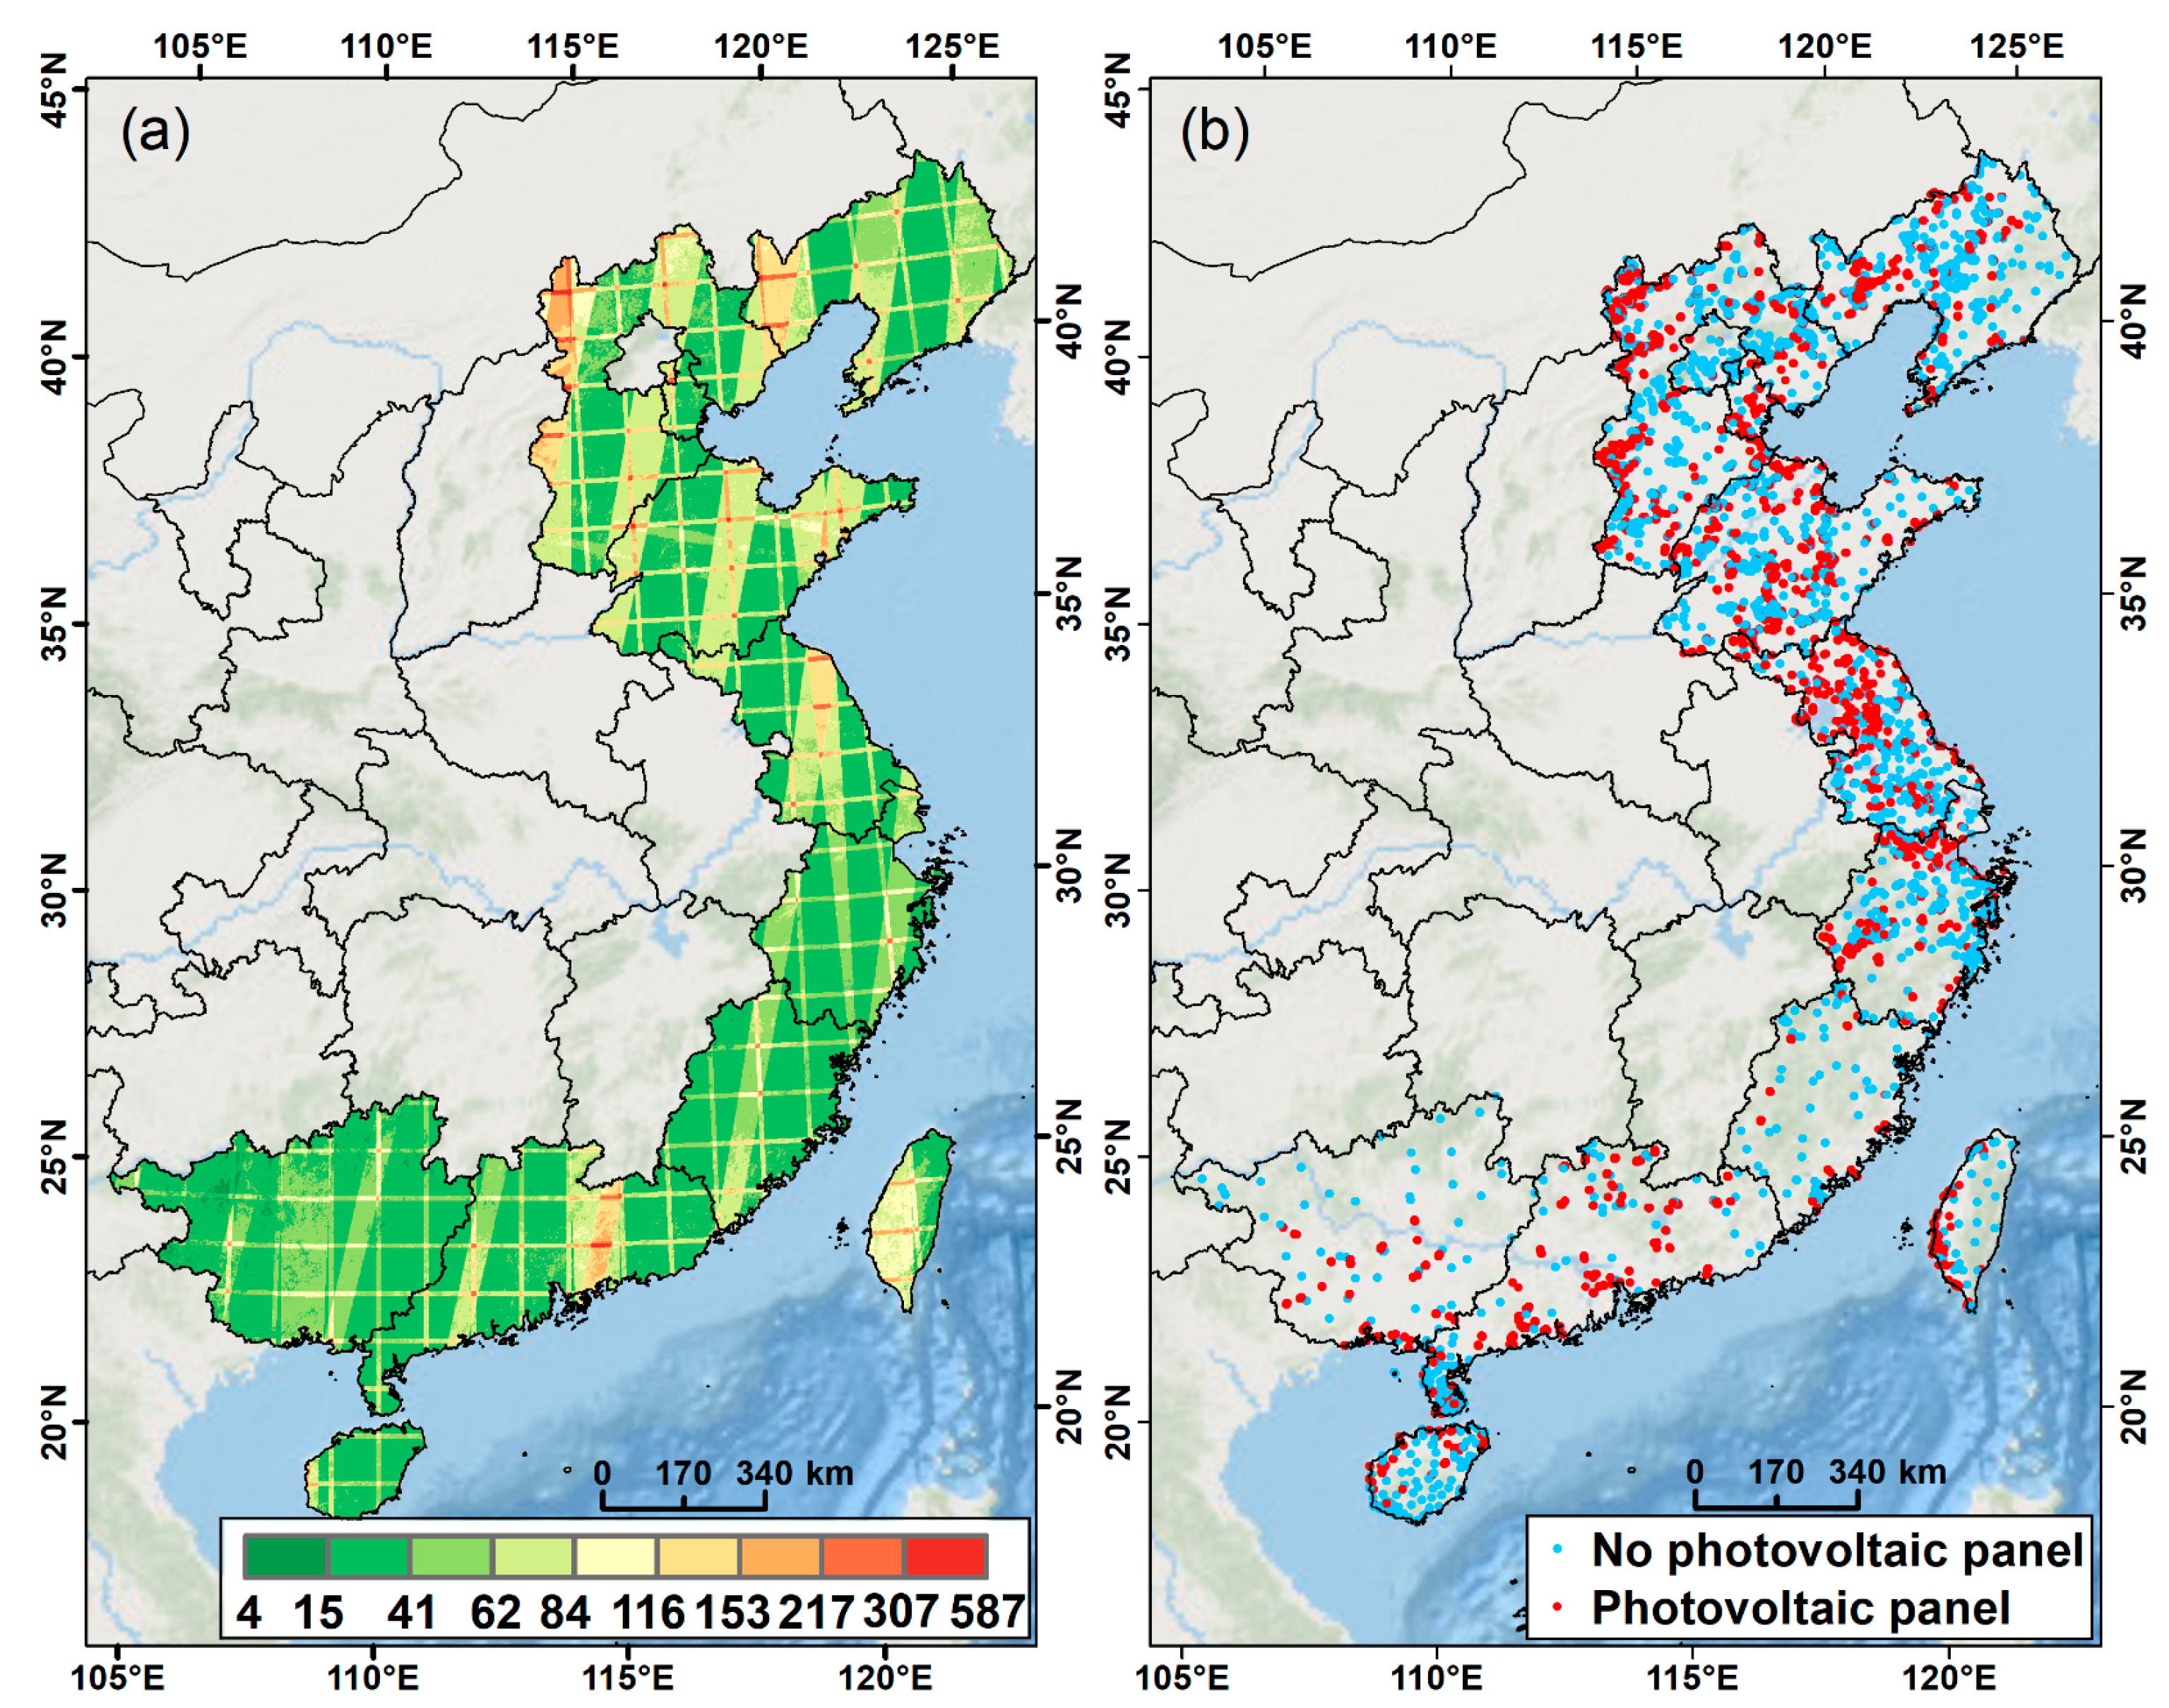
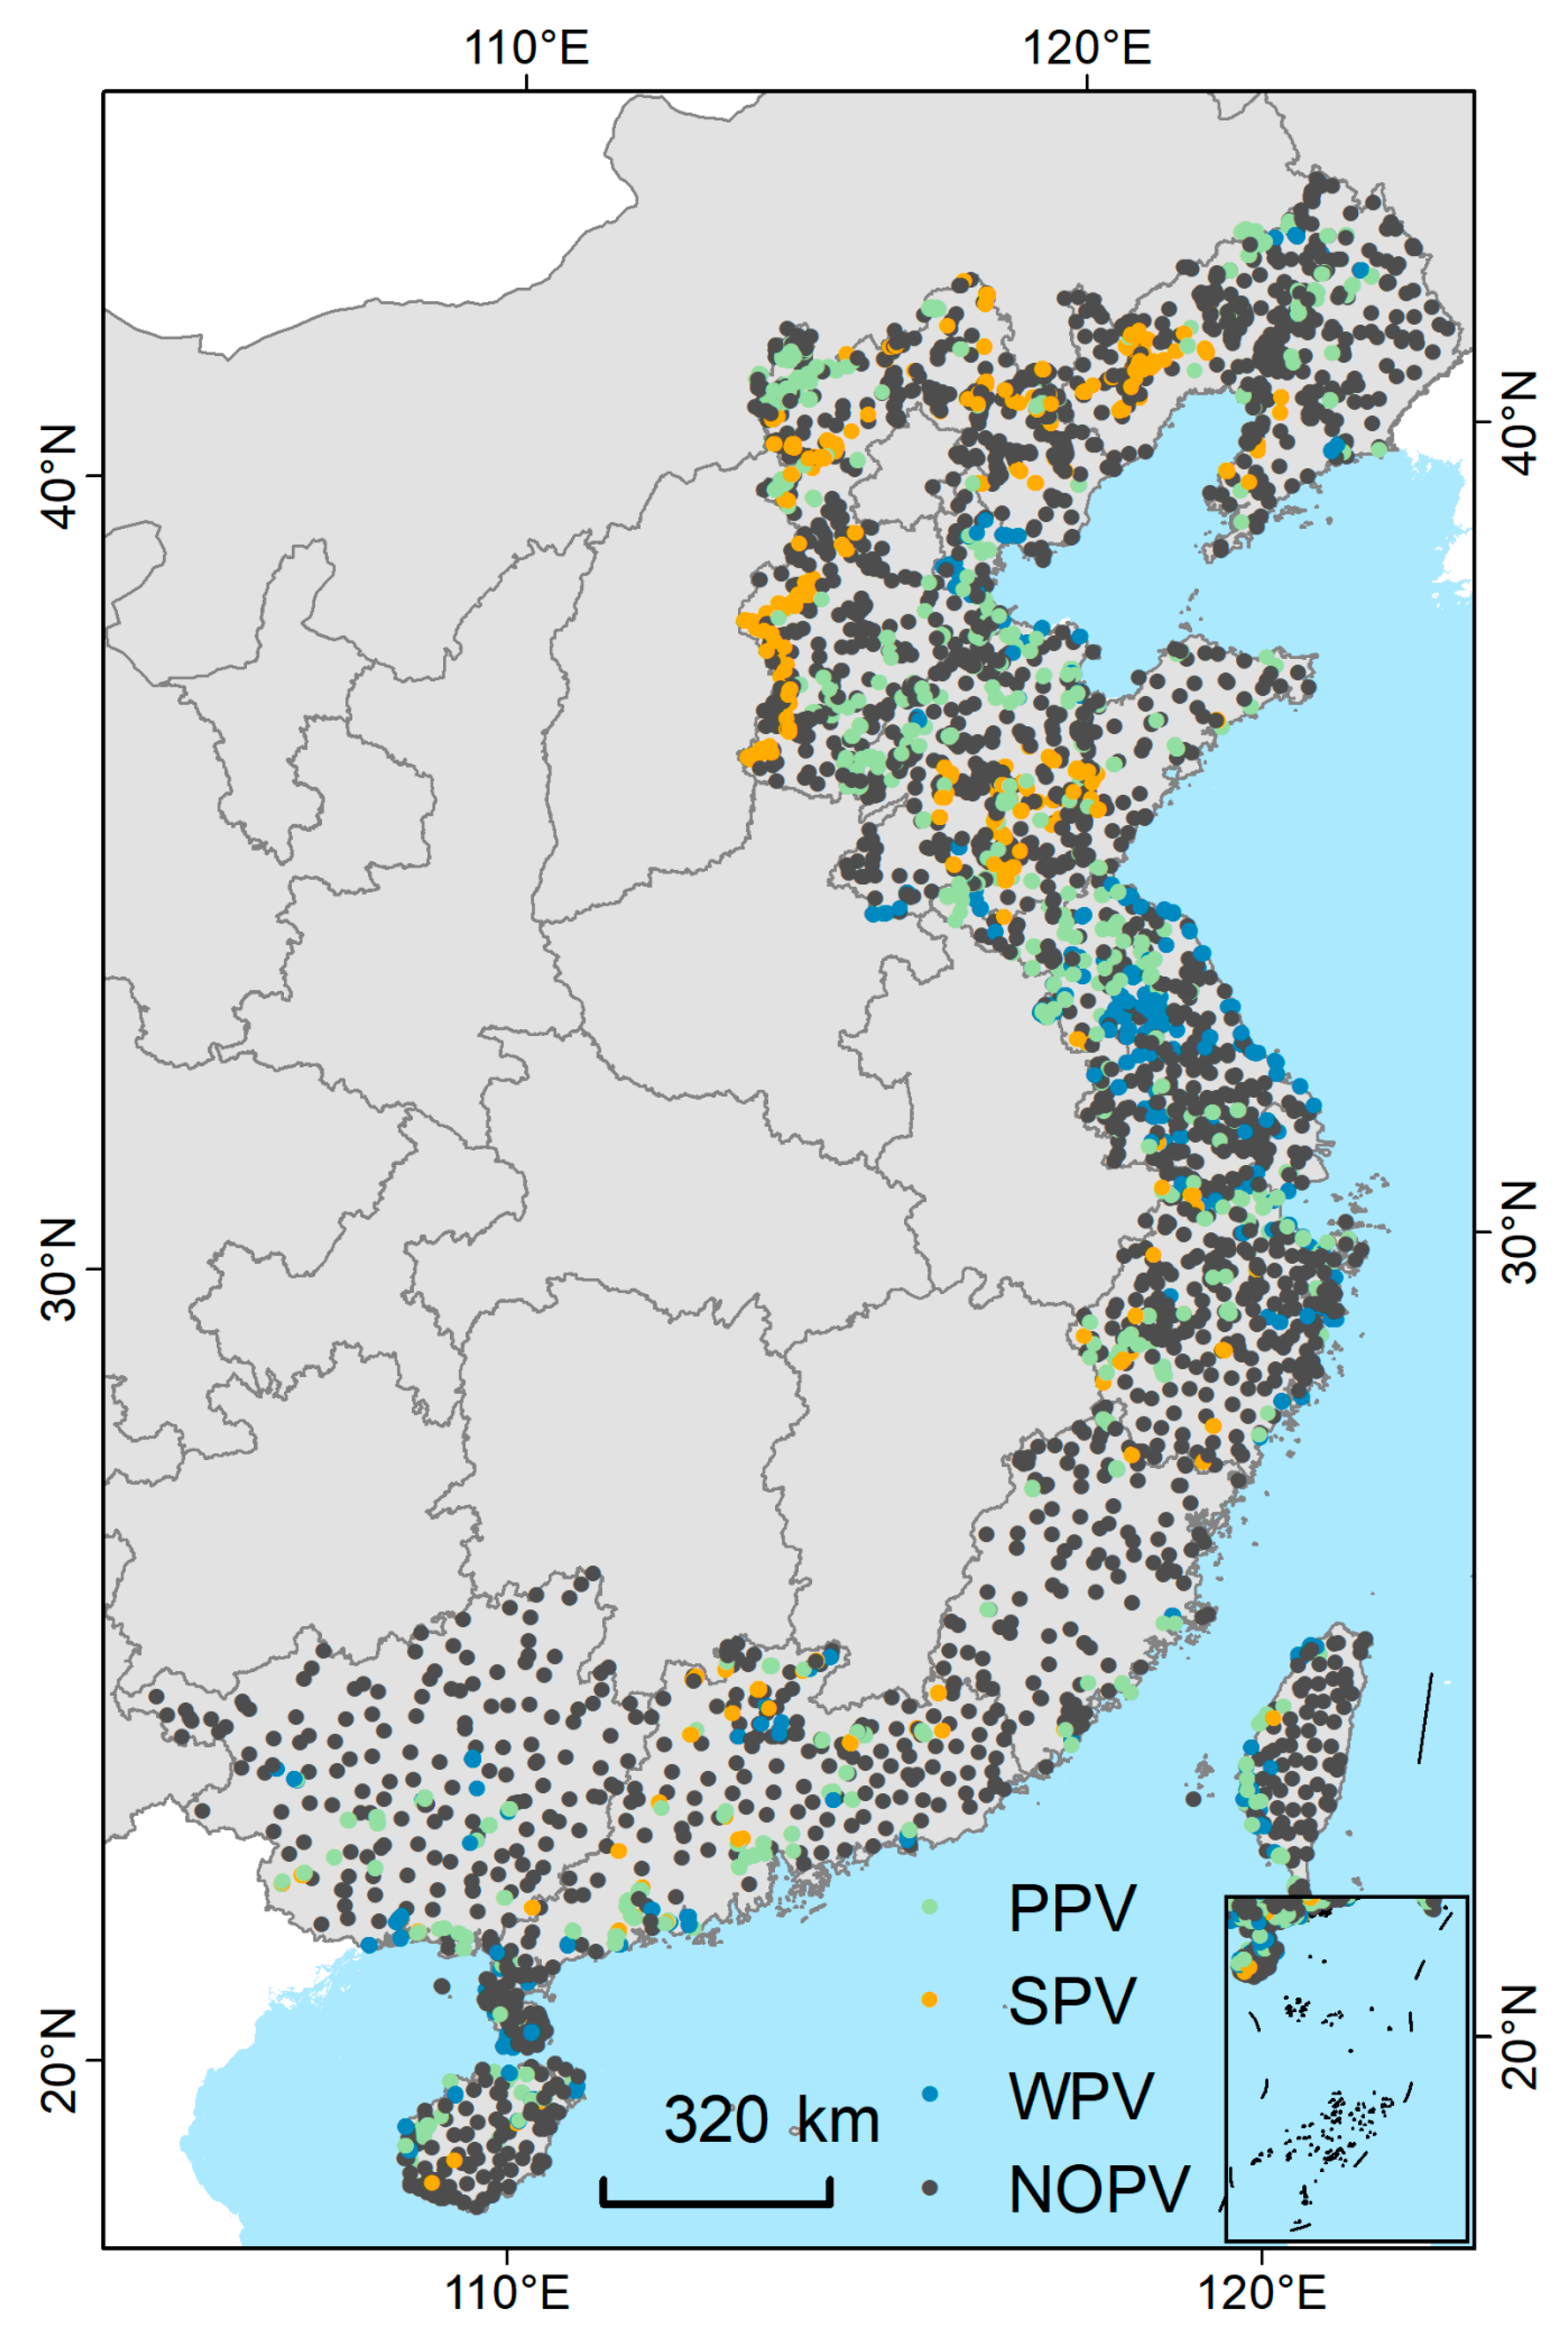
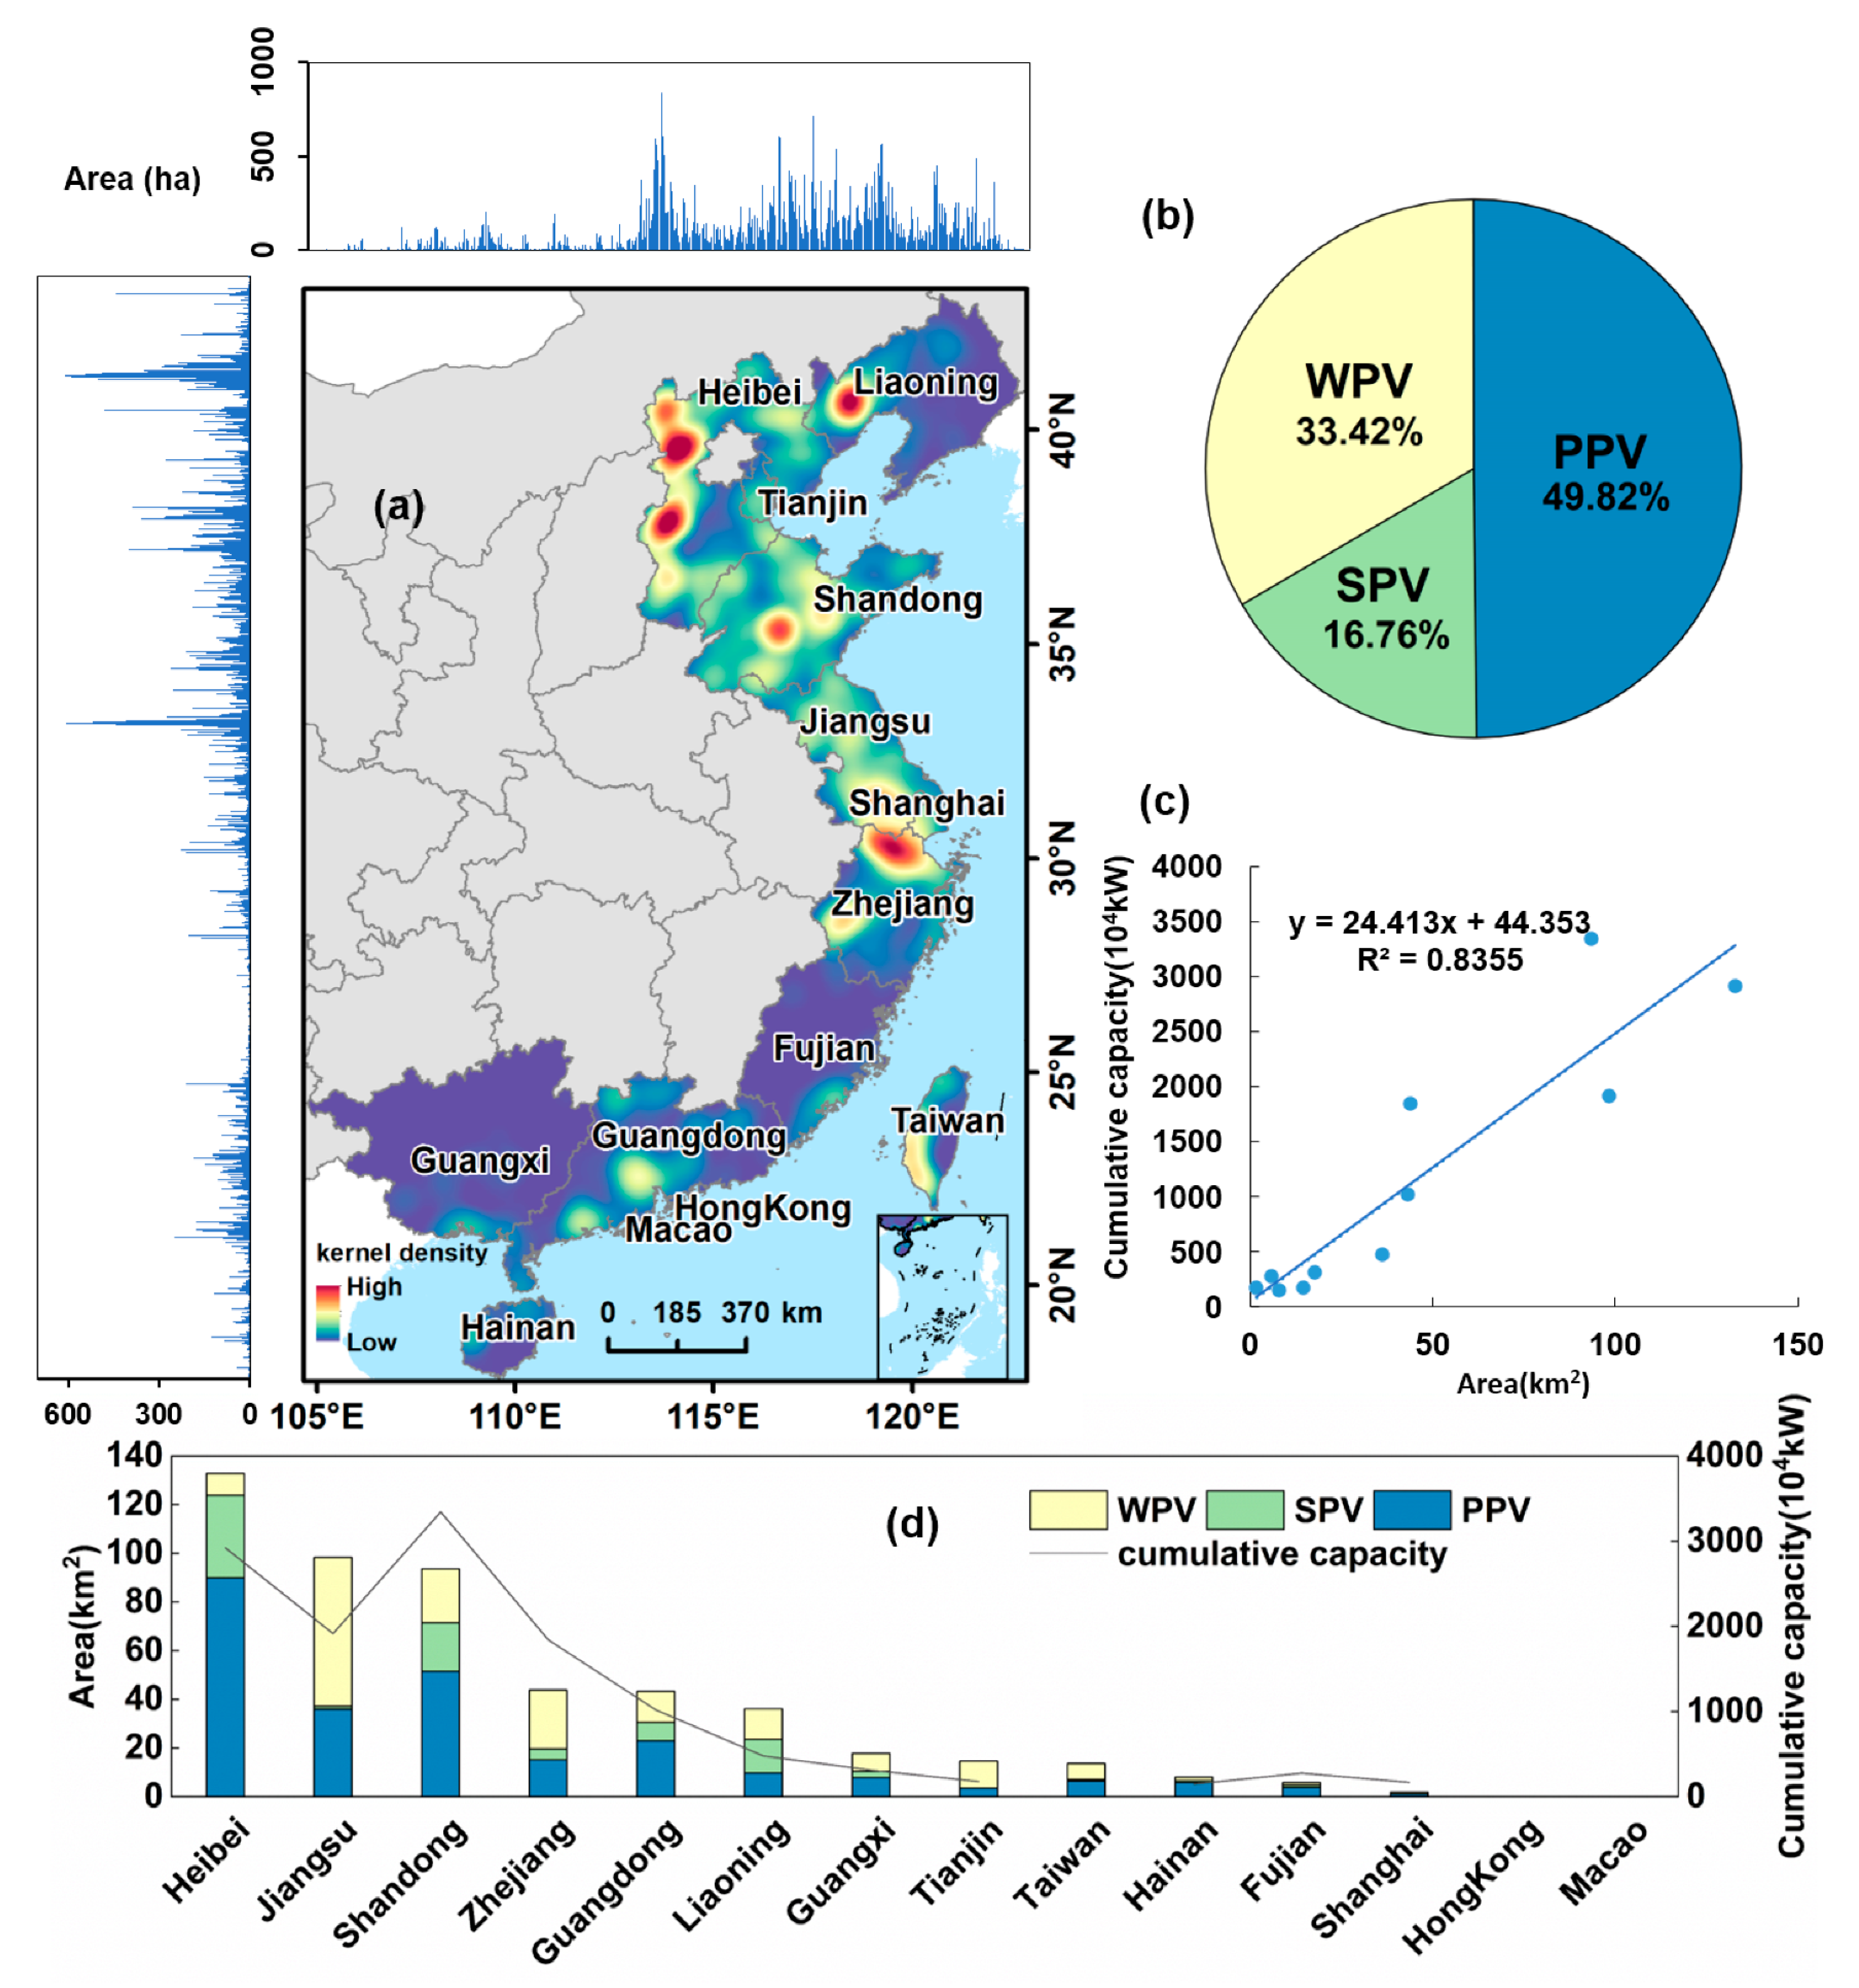
3.2. Spatial Distribution of Photovoltaic Panels

The kernel density distribution map of photovoltaic panels in China’s coastal regions is shown in Figure 6a. Given the spatial positions, the photovoltaic panels were concentrated in the western region of Liaoning, the western region of Hebei, the middle region of Shandong, the southern region of Jiangsu, the northern region of Zhejiang, and the southwestern region of Taiwan. Generally, there were more photovoltaic panels in northern China, but fewer in southern China.
The total area of photovoltaic panels in China’s coastal regions in 2021 was about 510.78 km2, and the average PV panel density reached 378.77 m2 per km2. The photovoltaic panel area in the different regions, and the cumulative grid-connected capacity in 2021 are shown in Figure 6d. The photovoltaic panel areas in Hebei, Jiangsu, and Shandong were relatively large (132.84 km2, 98.35 km2, and 93.63 km2), and accounted for about 63.71% of total photovoltaic panel area in the coastal regions. Moreover, these three provinces are the regions with the highest grid-connected capacity. Specifically, Shandong has the highest grid-connected capacity (3.34 × 10⁷ kW). The photovoltaic panel area of Hong Kong and Macao was the smallest, which accounted for less than 1 km2. In 2021, the photovoltaic cumulative grid-connected capacity and the photovoltaic panel area presented a linear relationship. The grid-connected capacity per 1 km2 of photovoltaic panel area was approximately 2.44 × 10⁵ kW (Figure 6c). Among the three types of photovoltaic panels, PPV, WPV, and SPV accounted for about 49.82%, 33.42%, and 16.76%, respectively (Figure 6b). The PPV panels were mainly distributed in Hebei, Shandong, and Jiangsu. The WPV panels were mainly distributed in Jiangsu, Zhejiang, and Shandong. The SPV panels were mainly distributed in Hebei, Shandong, and Liaoning (Figure 6d). The composition of the three PV types was different in different regions. In Hebei, PPV and SPV accounted for the largest area (89.97 km2 and 33.84 km2) in the study area. Jiangsu possessed the largest area of WPV panels (61.17 km2), which accounted for 35.90% of the total area of WPV panels. For Jiangsu, Zhejiang, Tianjin, Taiwan, and Hong Kong, WPV was the most common panel type, and SPV was the most common in Liaoning. In other regions, PPV was the major PV type.
The provinces with the highest photovoltaic panel area per square kilometer, ranked from highest to lowest, were as follows: Tianjin, Jiangsu, Hebei, Shandong, Zhejiang, Taiwan, Guangdong, Liaoning, Shanghai, Hainan, Guangxi, Fujian, Hong Kong, and Macao, respectively. The PV panel area per square kilometer (in square meters) was 1225.77, 943.21, 703.25, 594.87, 408.42, 366.42, 242.99, 240.03, 219.83, 198.83, 75.25, 46.85, and 39.11, respectively. Hebei has the highest density of both PPV and SPV panels, whereas Jiangsu has the highest density of WPV panels.
The SPV panels were mainly found in mountainous and hilly regions. The WPV panels were distributed in lakes, reservoirs, rivers, and tidal areas. SPV and WPV were mainly concentrated types. The PPV panels were mainly located on plains and on building surfaces, including some distributed types (Figure 7a). In different regions, photovoltaic panels were concentrated at different positions. The photovoltaic panels in the western region of Liaoning and the western region of Hebei were mainly concentrated on mountain and hill surfaces. Some photovoltaic panels in the middle of Shandong were installed on low-hill surfaces. Photovoltaic panels were installed on cultivated land and on greenhouses in plains regions. Due to the low terrain and developed industries in the southern region of Jiangsu and the northern region of Zhejiang, photovoltaic panels were mainly installed on residential buildings, factories, and some water surfaces. The photovoltaic panels in the southwest region of Taiwan were mainly installed on the water surface, flat areas, and factory buildings.

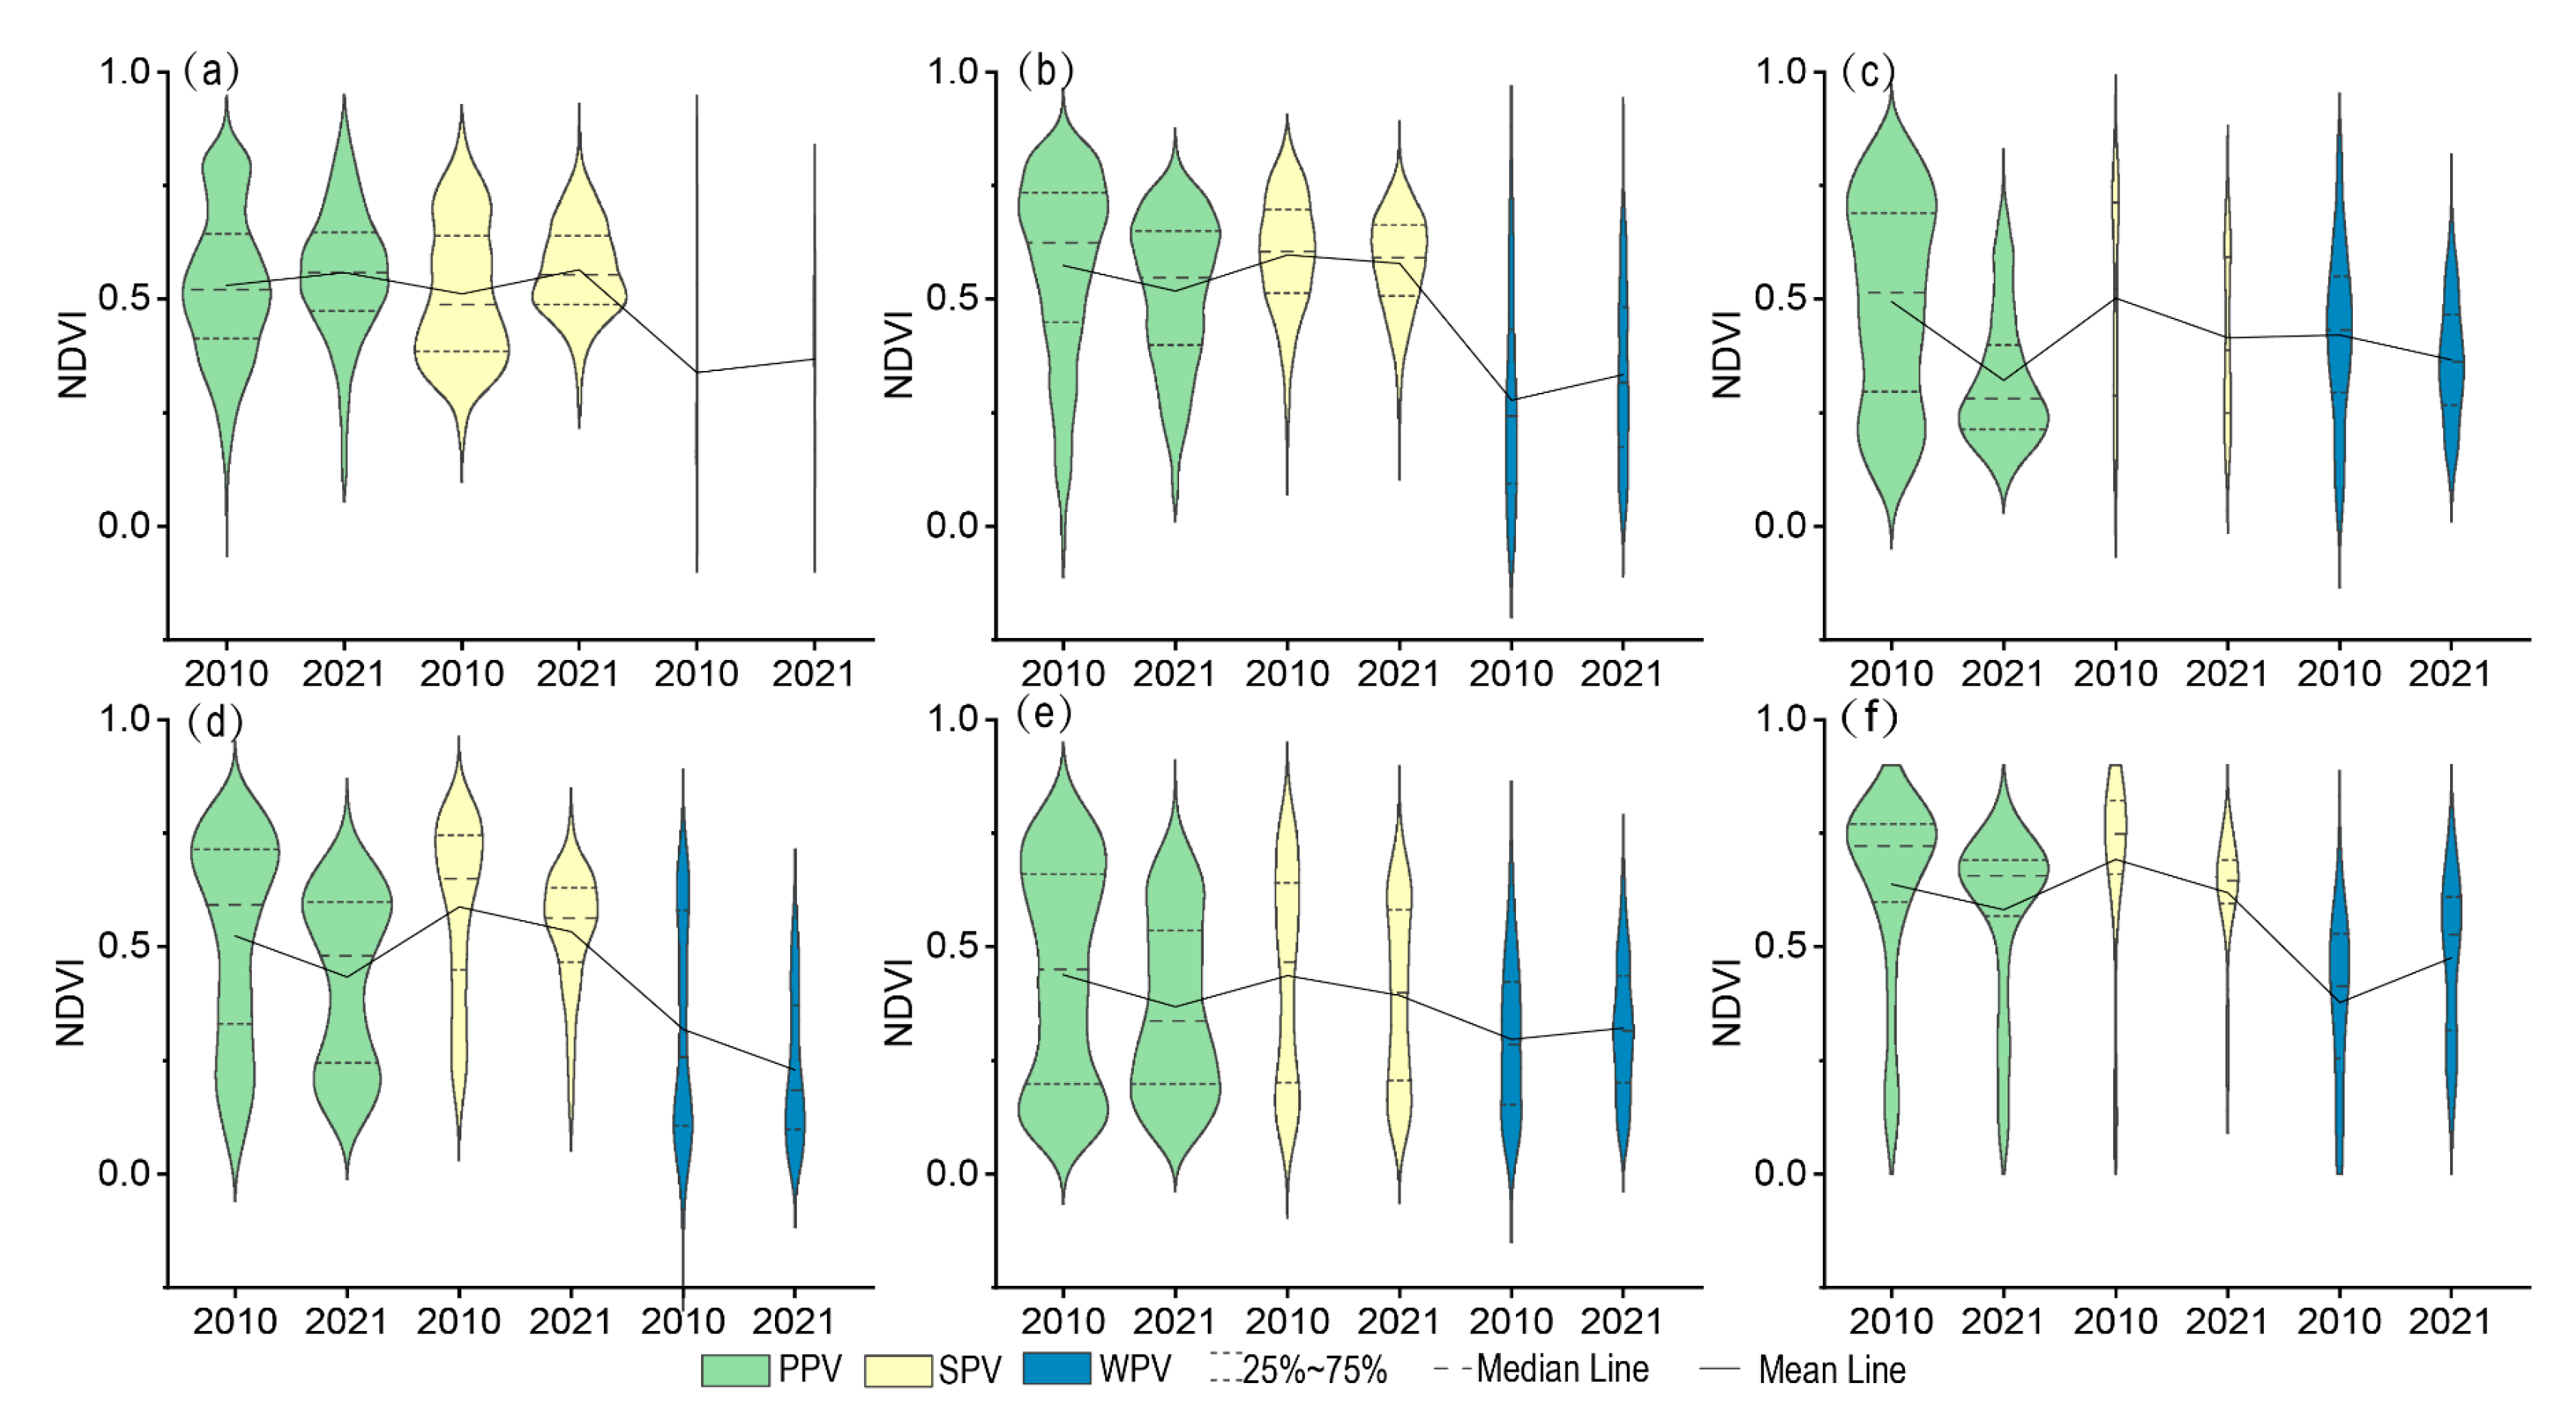
3.3. The Impact of Photovoltaic Panels on Vegetation

The installation of photovoltaic panels on various underlying surfaces causes different environmental impacts, with the most significant being changes in the landscape. The vegetation on the surface is most affected by the installation of photovoltaic panels. NDVI is an accurate gauge of vegetation biomass and growth status. Using statistical data, there were relatively few photovoltaic installations in the study area in the year 2010. To examine the variations in the vegetation before and after photovoltaic installation, we selected the Landsat dataset, and synthesized the annual NDVI averages for 2010 and 2021 using Google Earth Engine. To reduce the effects caused by differences in the vegetation type, we divided the photovoltaic panels of the coastal regions of China into six subsets using China’s climate division, and compared and analyzed the impacts of photovoltaic installation on different underlying surfaces under different climates. The climate zones from north to south are the middle temperate zone, southern temperate zone, northern subtropical zone, middle subtropical zone, southern subtropical zone, and middle tropical zone.
In China’s coastal regions, photovoltaic panels are primarily installed in the south temperate, north subtropical, and middle temperate zones. The efficiency of photovoltaic power generation is significantly affected by temperature and weather conditions, with high temperatures resulting in a reduced efficiency. Thus, the environmental conditions are crucial in determining the layout of PV power plants. The PV types underlying each climate zone vary considerably, with PPV panels being primarily installed in the middle and south temperate zones, SPV panels in the same zones, and WPV panels in the south temperate and north subtropical zones (Table 3).
The NDVI values before the installation of photovoltaic panels varied in different regions. Overall, the NDVI is higher on slopes than on planar ground and water surfaces. The mean and median NDVI values of the PPV panels in the middle temperate zone are higher than those of the SPV and WPV panels. In the south temperate zone, the mean NDVI of SPV panels is higher than that of PPV panels, but the median is lower. In other regions, the mean and median NDVI values of SPV panels are higher than those of PPV and WPV panels. The vegetation level is lower in water bodies, and the NDVI of WPV panels is the smallest. After the installation of photovoltaic panels, the range of NDVI extremes becomes smaller, which indicates a reduction in NDVI differences (Figure 8).
The NDVI before and after the installation of PV panels varied among the climate zones. After the installation of photovoltaic panels on planar ground and slopes in the middle temperate zone, the NDVI increased, while in other regions, the NDVI decreased after the installation of photovoltaic panels on planar ground and slopes. After the installation of WPV panels in water bodies in the north subtropical and central subtropical zones, the NDVI of the water bodies decreased, while, in other regions, it increased. The PPV panels in the north subtropical and south subtropical zones has distinct high and low value areas, mainly because the PPV panels are mainly installed on flat ground with a slope less than 5°, including flat ground with vegetation and building surfaces. Many building surfaces in the Yangtze River Delta region of the north subtropical zone, and in the Pearl River Delta and Taiwan in the south subtropical zone have installed a large number of photovoltaic panels, and the NDVI of building surfaces is relatively low, which results in the aggregation of NDVI in low-value areas (Figure 8).

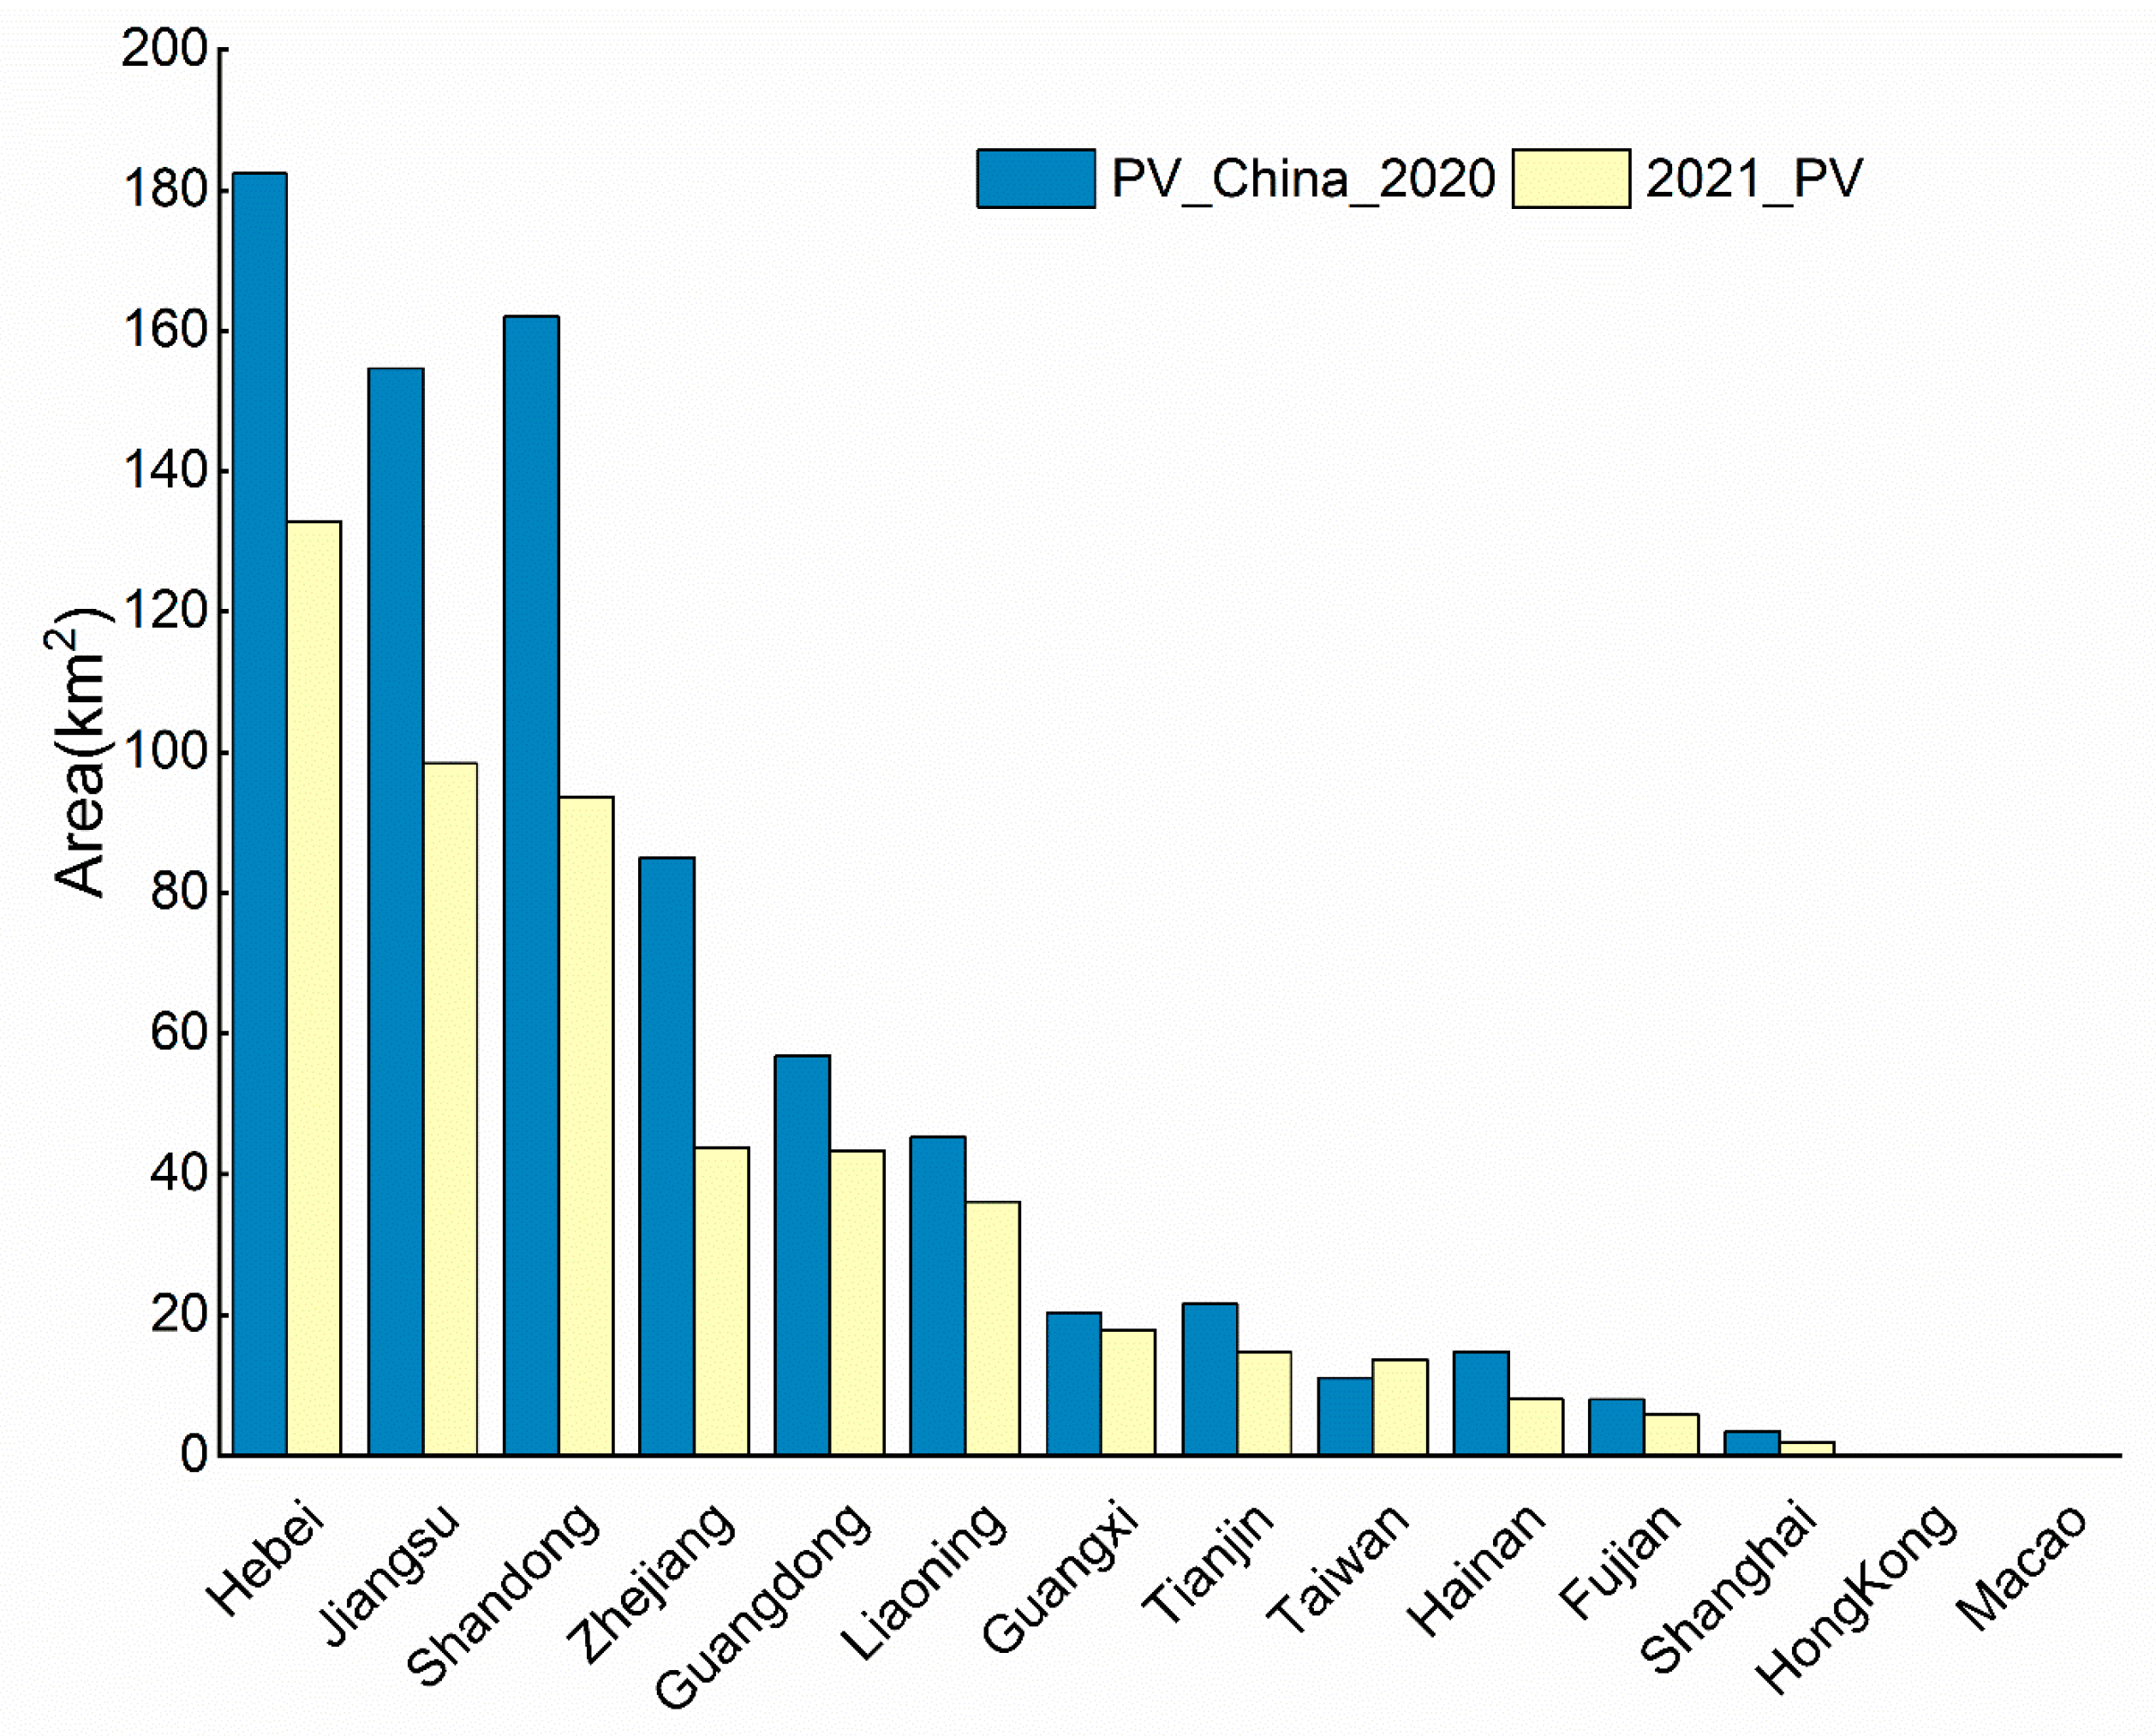
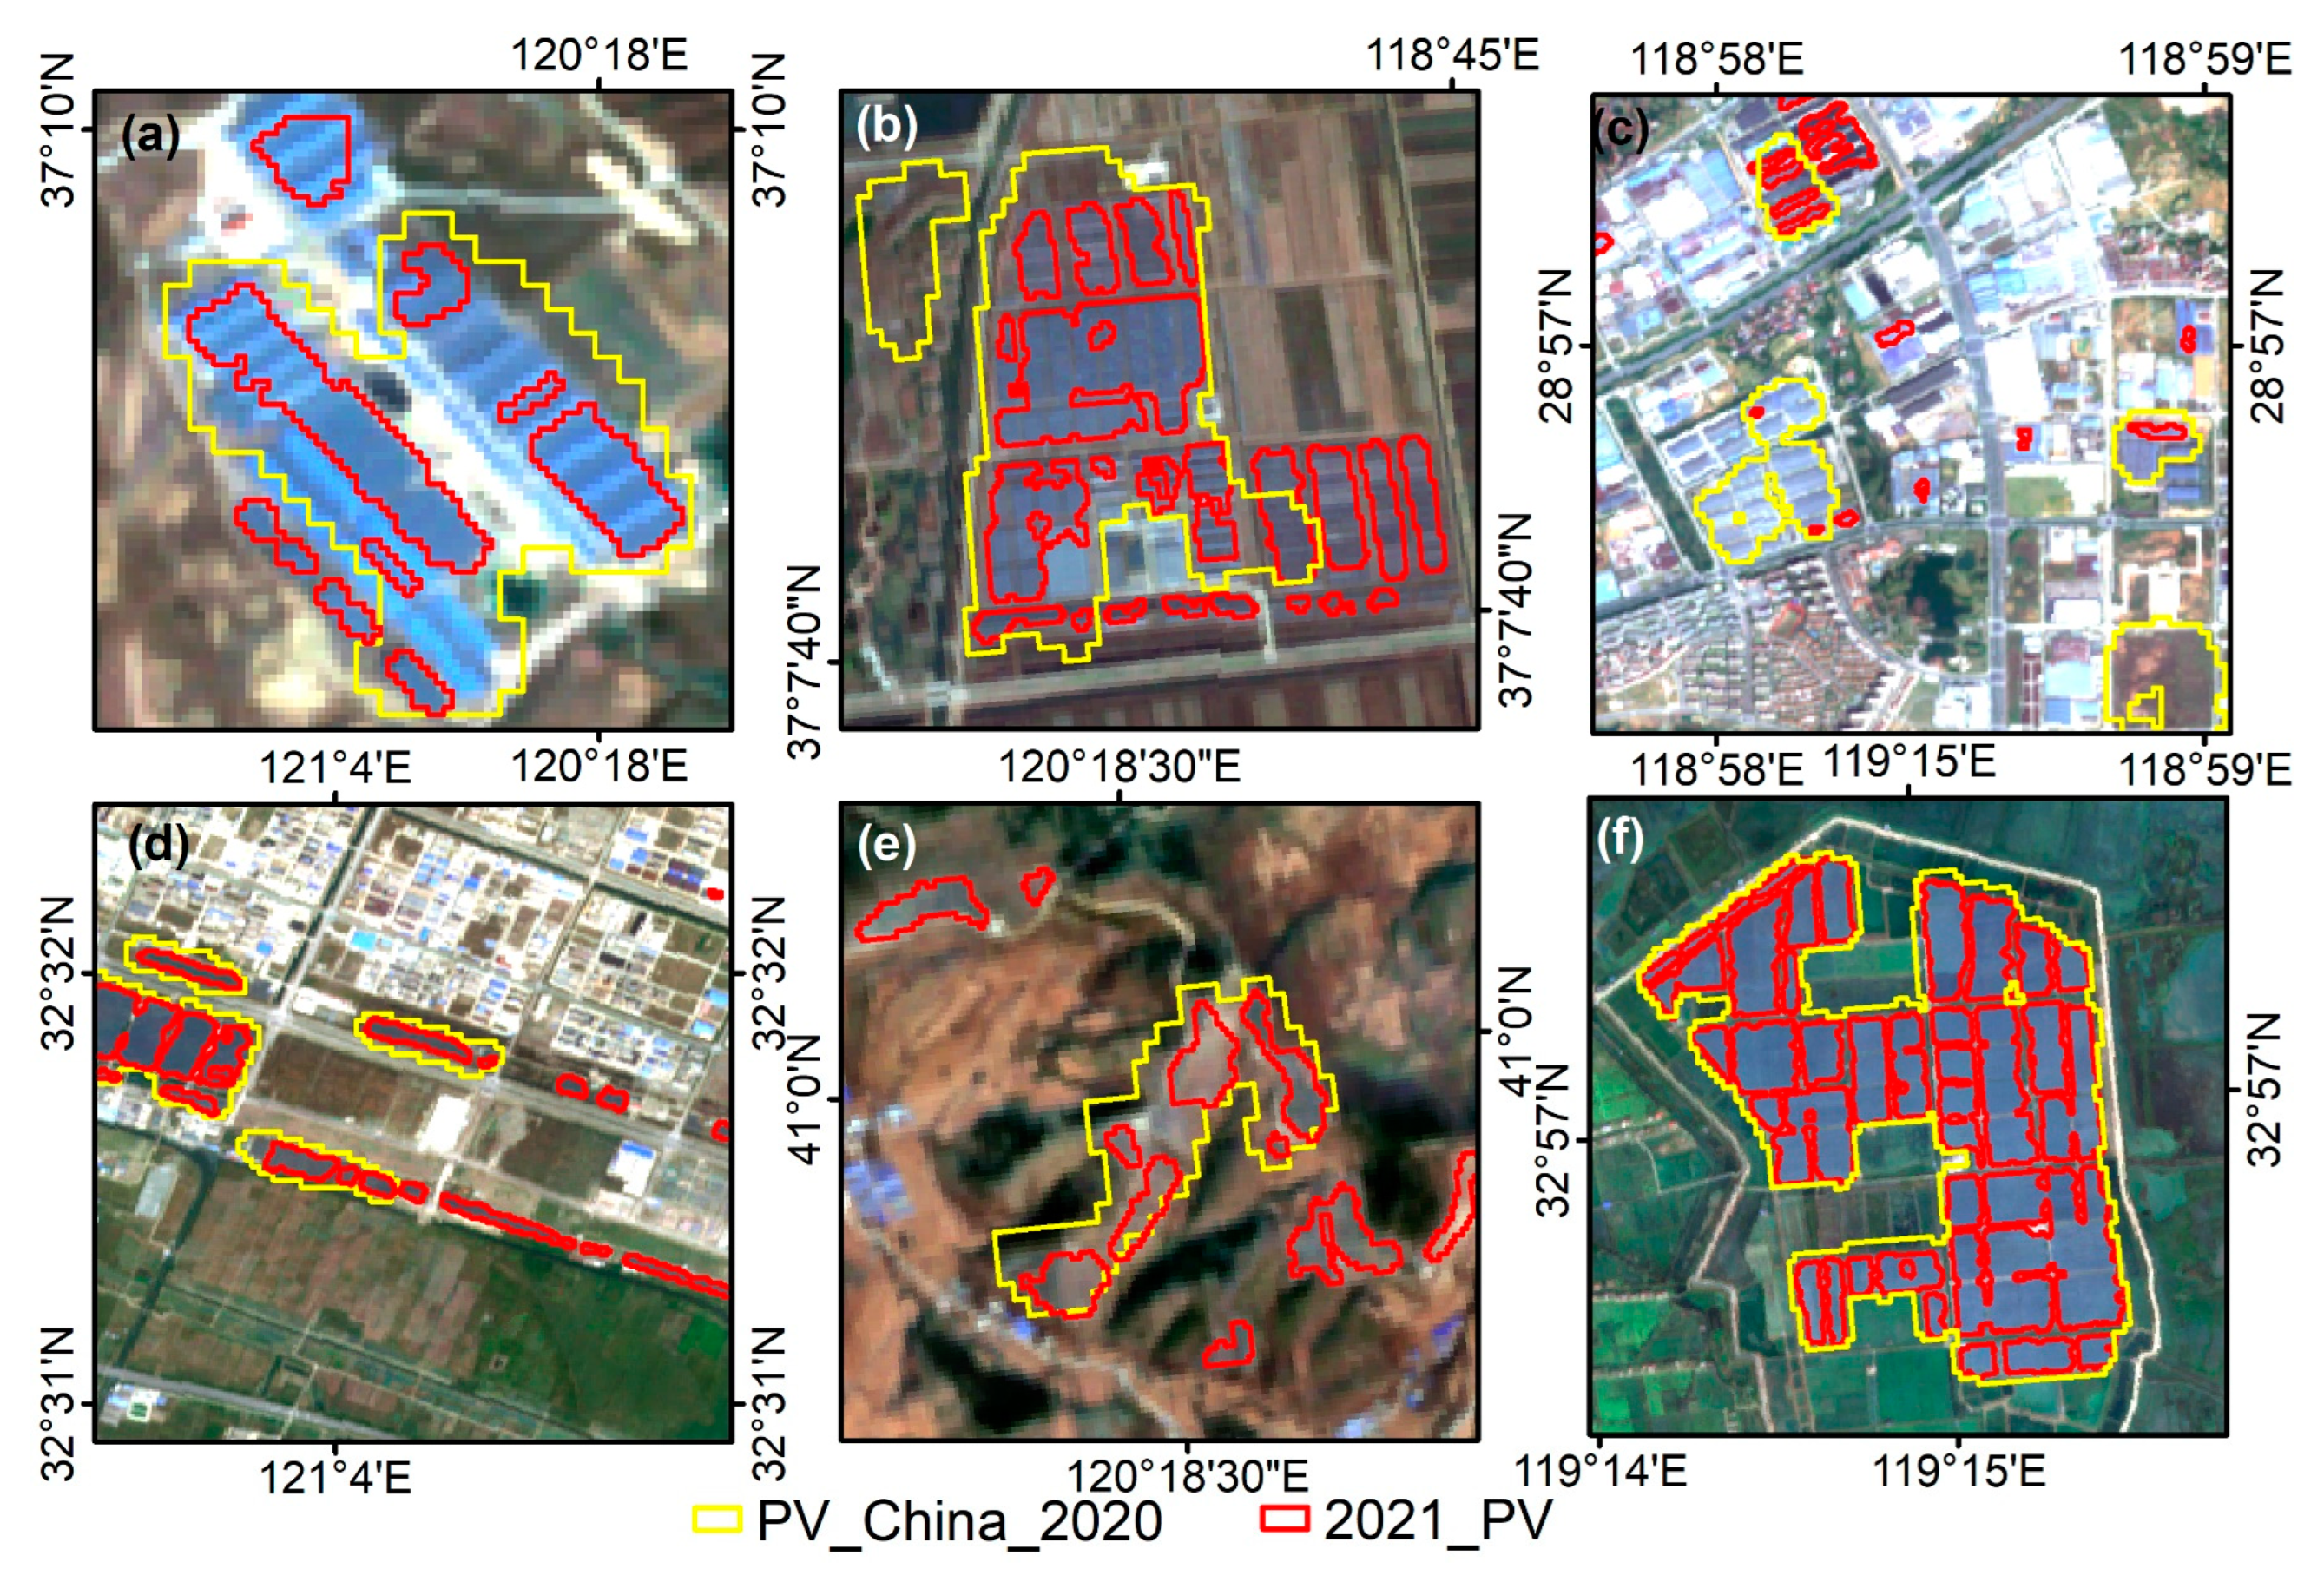
3.4. Comparison of Different Data

The photovoltaic power generation station data (PV_China_2020) in China in 2020 were obtained from the GEE platform, using the random forest algorithm. The data sources were Landsat images, and the spatial resolution was 30 m [46]. In contrast, our PV map (2021_PV) had the higher spatial resolution of 10 m. The timing of the mapping of PV_China_2020 and 2021_PV was different. The general trends of the two data types were consistent. The area of PV_China_2020 was larger than 2021_PV in most coastal regions, while the area of 2021_PV in Taiwan was larger than PV_China_2020 (Figure 9).
We chose the photovoltaic panels installed before 2020 for comparison. The background images in Figure 10 were formed by combining the MSI RGB bands in 2020. Due to differences in the image spatial resolution and extraction techniques, the two datasets display varying degrees of precision for the same objects. The 2021_PV dataset has a higher spatial resolution, and more accurately depicts the photovoltaic panel details. Additionally, 2021_PV exhibits an improved identification accuracy for these panels in China’s coastal regions, because of differences in the study area. It is worth noting that the PV_China_2020 dataset underwent morphological operations during the post-classification processing, which captured more photovoltaic panels on fragmented building surfaces. However, this process may have overestimated the panel area (Figure 10a). Both datasets display varying degrees of inaccuracies on building surfaces and hilly mountainous terrain (Figure 10c,e). The 2021_PV dataset accurately depicts small and narrowly distributed photovoltaic panels (Figure 10b,d). On flat terrain, both datasets exhibit a high identification accuracy, with the 2021_PV dataset providing more precise details (Figure 10f).

4. Discussion

4.1. Reliability of the PV Panel Mapping

Here, we developed a mapping approach for China’s coastal photovoltaic panels, using Sentinel-1 and Sentinel-2, on the GEE platform. This is the first study to differentiate between types of photovoltaic panels at a 10-m spatial resolution along the coastal regions of China. The successful implementation of this study was attributed to three factors, including high0spatial-resolution cloud-free satellite imagery, robust classification methods, and practical strategies for differentiating the photovoltaic panel types.
Firstly, photovoltaic panels are typically installed in areas with ample solar radiation. The coastal regions of China are situated within monsoon climate zones, characterized by abundant precipitation and distinct seasonal variations. Clouds, cloud shadows, and terrain shadows can significantly impact the observation quality of optical imagery [47], with notable differences between the study area’s northern and southern regions, and the surface reflectance is easily influenced by the phenological period. To address these issues, we utilized median synthesis on all effective pixels in GEE, to avoid cloud-layer impacts on the pixel spectra and textural features, while maintaining phenological period consistency [48]. During the sample-labeling process, we utilized a combination of high-resolution Google images and MSI RGB images, to minimize the temporal disparities between the samples and the images. This approach proved effective in reducing classification errors.
Secondly, we selected the random forest classifier, as its faster processing of multisource data, higher classification accuracy, and fewer required parameters made it the ideal choice for photovoltaic panel extraction from the SAR and MSI images [49,50]. Additionally, we visually selected 10,526 surface samples, and judged 7000 random verification points visually. We also performed artificial visual correction with the classification results. The combination of machine learning classification and visual interpretation achieved a higher overall accuracy in the extraction of photovoltaic panels in China’s coastal regions.
Finally, different regions have different environmental conditions, and classifying photovoltaic panel types according to the nature of the underlying surface was conducive to analyzing changes in the environment before and after the photovoltaic panel installation.

4.2. Source of Errors in the PV Panel Map

Photovoltaic panels are installed in various ways across different regions. Major sources of errors include different spectra of the same object, and the same spectra from different objects. Differences in the installation direction and distance result in notable variations in the photovoltaic panel matrix’s spectral and textural information, thereby hindering full recognition. Figure 11(a1) demonstrates that photovoltaic panels installed horizontally over vast distances exhibit different characteristics from those that are installed at a slope with minimal row differentiation. In addition, the reflectivity of high-density photovoltaic panels was higher for bands B2, VH, and VHsavg (Figure 11(a3)). The spectral information of photovoltaic panels on complicated surface objects, such as those on an agricultural greenhouse, was influenced by complicated background pixels, and was thus significantly different from the NDVI and NDBI of surface photovoltaic panels (Figure 11(b3)). Due to the large study area and the large number of pixels in the calculation, the study area was divided into blocks under the limited calculation capacity. The spectra and textural information varied significantly among different positions in the mining areas. In a unit block, mining samples might be insufficient, and they might be recognized as two surface objects, due to the great differences in characteristics. Thus, some mining samples were wrongly classified as photovoltaic panels during interpretation (Figure 11(c3)).
Differences in feature bands can lead to incomplete photovoltaic identification (Figure 12(a1)), and small photovoltaic panels that are identified may be eliminated during post-processing (Figure 12(a2)). Manual visual interpretation can improve the accuracy of the results (Figure 12(a3)). Although the distributed photovoltaic panels installed on buildings can be recognized due to their small areas, they might be broken and removed as salt-and-pepper noise during the morphological calculation and, thus, some photovoltaic panels on buildings might be missed (Figure 12(d3)). Additionally, road edges might be recognized as photovoltaic panels, but they were all removed during the post-classification processing (Figure 12(c3)).

4.3. Potential Applications of the Identification Approach, and Challenges Faced by PV Development

To extract photovoltaic panels, we used a comprehensive approach that integrated both cloud and local processing with machine learning and visual interpretation. Textural features and spectral information are also integrated into this approach. Our method established a framework for mapping high-spatial-resolution photovoltaic panels over large areas, and produced data products that can be used to monitor the photovoltaic panel area. Our classification method can distinguish between PPV, SPV, and WPV panels, using the underlying surface type, which serves as a basis for exploring the ecological effects of photovoltaic panels. This method can be applied to obtain large-scale and long-term spatial data on PV panels, playing a pivotal role in the spatial layout and management of these panels. Nevertheless, the interpretation accuracy of the distributed photovoltaic panels installed on greenhouses, in residential areas, and on factories requires improvement, as it is influenced by the image resolution and classification algorithms. Furthermore, photovoltaic panels covering water bodies, farmland, grassland, and building surfaces are often difficult to accurately differentiate, and can instead be identified as water bodies, farmland, or grassland. The process of extracting photovoltaic panels can enhance the accuracy of land-cover mapping.
Photovoltaic panels can be classified into centralized and distributed types, using their installation scale. Centralized photovoltaic panels are larger in size, and produce electricity that is connected to the grid. They are mainly distributed in desert areas, on water surfaces, on mountain slopes, and in plains areas that have a substantial surface area, and they serve as the primary source of photovoltaic power. The distributed photovoltaic panels are mainly installed in regions close to residential areas, such as roofs and agricultural greenhouses. The composite installation mode makes full use of stereoscopic spaces. Distributed photovoltaic panels are primarily located near human settlements, including homes and agricultural greenhouses. The combined installation fully exploits the vertical space, with a smaller area for the photovoltaic panels. The generated electricity is mainly for local consumption, while some of it is connected to the grid.
Despite their provision of substantial clean energy, we cannot ignore the ecological and environmental issues that photovoltaic power generates during its production and operation. The production of crystalline silicon photovoltaic components and cells produces harmful substances and carbon emissions. Although the lifespan of these components is long, it still poses economic and technical issues related to recycling and the non-harmful treatment of waste photovoltaic modules [51]. The main challenge is to improve the photoelectric conversion efficiency [52]. Photovoltaic panel installations can alter the humidity, temperature, light, sound, and other factors that can directly or indirectly impact biodiversity and ecosystem development, and even lead to fires and light pollution. Furthermore, dust, solar radiation, and temperature have a considerable impact on the power generation efficiency of panels. Therefore, sensible placement, better materials, and increased recycling are ways to promote sustainable development in photovoltaic power [53,54].

5. Conclusions

Photovoltaic power generation is an effective way for China’s coastal regions to achieve energy decarbonization and environmentally sustainable development. The accurate mapping of photovoltaic panels provides visual spatial data for monitoring photovoltaic panel layouts, and evaluating the effect of photovoltaic power generation on ecology and the environment. Here, we used satellite surface reflectance data, a large-scale high-resolution mapping method, a cloud computing platform, machine learning, and manual visual interpretation to produce photovoltaic panel maps with high accuracy. We also classified photovoltaic panels by type, according to their underlying surface properties.
We generated a detailed 10-m PV panel map of coastal China in 2021, and we found that the total area of photovoltaic panels in China’s coastal regions was about 510.78 km2. The PV panels could be classified into PPV, SPV, and WPV panels, according to their underlying surface properties. PPV panels accounted for the highest proportion of the area. Photovoltaic panels were mainly concentrated in the northern regions of the study area, and there were large-scale photovoltaic power generation sites in Hebei, Jiangsu, and Shandong. After the morphological calculation and artificial visual correction, the overall accuracy of our photovoltaic panel classification was 94.31%. The overall accuracy of the different types of photovoltaic panels was 89.06%. The photovoltaic panels that are interpreted at a high spatial resolution can describe details more thoroughly. When photovoltaic panels are installed, they alter the original landscape, and can potentially harm local vegetation. Different types of photovoltaic panels have varying impacts on the vegetation in different climatic regions. Photovoltaic panels usually reduce the green cover of the land surface, but installing photovoltaic panels in the middle temperate region will promote vegetation growth.

Author Contributions

Conceptualization, H.Z., Y.L. and J.L.; methodology, H.Z., J.L. and Y.L.; soft-ware, H.Z. and P.T.; validation, H.Z. and J.Z.; data curation, H.Z. and J.Z.; writing—original draft preparation, H.Z.; writing—review and editing, P.T.; visualization, H.Z. and Y.L.; supervision, J.L. All authors have read and agreed to the published version of the manuscript.

Funding

This research was funded by the National Natural Science Foundation of China (42276234, 41976209, 42206236).

Data Availability Statement

The data presented in this study are available on request from the corresponding author.

Acknowledgments

The authors express their gratitude to the editors and the anonymous reviewers for providing valuable comments and suggestions to improve the paper.

Conflicts of Interest

The authors declare no conflict of interest.

References

  1. Asif, M.; Muneer, T. Energy supply, its demand and security issues for developed and emerging economies. Renew. Sustain. Energy Rev. 2007, 11, 1388–1413. [Google Scholar] [CrossRef]
  2. Wrigley, E.A. Energy and the English industrial revolution. Philos. Trans. R. Soc. A Math. Phys. Eng. Sci. 2013, 371, 20110568. [Google Scholar] [CrossRef] [PubMed]
  3. Shindell, D.; Smith, C.J. Climate and air-quality benefits of a realistic phase-out of fossil fuels. Nature 2019, 573, 408–411. [Google Scholar] [CrossRef] [Green Version]
  4. Lin, B.; Zhu, J. The role of renewable energy technological innovation on climate change: Empirical evidence from China. Sci. Total Environ. 2019, 659, 1505–1512. [Google Scholar] [CrossRef]
  5. Zheng, H.; Song, M.; Shen, Z. The evolution of renewable energy and its impact on carbon reduction in China. Energy 2021, 237, 121639. [Google Scholar] [CrossRef]
  6. Williams, J.H.; DeBenedictis, A.; Ghanadan, R.; Mahone, A.; Moore, J.; Morrow, W.R., III; Price, S.; Torn, M.S. The technology path to deep greenhouse gas emissions cuts by 2050: The pivotal role of electricity. Science 2012, 335, 53–59. [Google Scholar] [CrossRef] [Green Version]
  7. Kannan, N.; Vakeesan, D. Solar energy for future world:-A review. Renew. Sustain. Energy Rev. 2016, 62, 1092–1105. [Google Scholar] [CrossRef]
  8. Parida, B.; Iniyan, S.; Goic, R. A review of solar photovoltaic technologies. Renew. Sustain. Energy Rev. 2011, 15, 1625–1636. [Google Scholar] [CrossRef]
  9. Zhang, Z.; Chen, M.; Zhong, T.; Zhu, R.; Qian, Z.; Zhang, F.; Yang, Y.; Zhang, K.; Santi, P.; Wang, K. Carbon mitigation potential afforded by rooftop photovoltaic in China. Nat. Commun. 2023, 14, 2347. [Google Scholar] [CrossRef]
  10. Liu, J.; Lu, Y. Research on the evaluation of China’s photovoltaic policy driving ability under the background of carbon neutrality. Energy 2022, 250, 123809. [Google Scholar] [CrossRef]
  11. Louwen, A.; Van Sark, W.G.; Faaij, A.P.; Schropp, R.E. Re-assessment of net energy production and greenhouse gas emissions avoidance after 40 years of photovoltaics development. Nat. Commun. 2016, 7, 13728. [Google Scholar] [CrossRef] [Green Version]
  12. Chang, I.-S.; Liu, H.; Wu, J.; Zhou, C.; Zheng, L. Process analysis of poverty eradication in China: A case study on photovoltaic projects for poverty alleviation. Environ. Impact Assess. Rev. 2021, 90, 106630. [Google Scholar] [CrossRef]
  13. Vaverková, M.D.; Winkler, J.; Uldrijan, D.; Ogrodnik, P.; Vespalcová, T.; Aleksiejuk-Gawron, J.; Adamcová, D.; Koda, E. Fire hazard associated with different types of photovoltaic power plants: Effect of vegetation management. Renew. Sustain. Energy Rev. 2022, 162, 112491. [Google Scholar] [CrossRef]
  14. Yang, Y.; Xia, S. China must balance renewable energy sites. Science 2022, 378, 609. [Google Scholar] [CrossRef]
  15. Romano, V.; Agresti, A.; Verduci, R.; D’Angelo, G. Advances in perovskites for photovoltaic applications in space. ACS Energy Lett. 2022, 7, 2490–2514. [Google Scholar] [CrossRef]
  16. Chen, Z.; Yu, B.; Li, Y.; Wu, Q.; Wu, B.; Huang, Y.; Wu, S.; Yu, S.; Mao, W.; Zhao, F. Assessing the potential and utilization of solar energy at the building-scale in Shanghai. Sustain. Cities Soc. 2022, 82, 103917. [Google Scholar] [CrossRef]
  17. Qiu, T.; Wang, L.; Lu, Y.; Zhang, M.; Qin, W.; Wang, S.; Wang, L. Potential assessment of photovoltaic power generation in China. Renew. Sustain. Energy Rev. 2022, 154, 111900. [Google Scholar] [CrossRef]
  18. Gallardo-Saavedra, S.; Hernández-Callejo, L.; Duque-Perez, O. Image resolution influence in aerial thermographic inspections of photovoltaic plants. IEEE Trans. Ind. Inform. 2018, 14, 5678–5686. [Google Scholar] [CrossRef]
  19. Liao, M.; Zhang, Z.; Jia, J.; Xiong, J.; Han, M. Mapping China’s photovoltaic power geographies: Spatial-temporal evolution, provincial competition and low-carbon transition. Renew. Energy 2022, 191, 251–260. [Google Scholar] [CrossRef]
  20. Mauro, G.; Lughi, V. Mapping land use impact of photovoltaic farms via crowdsourcing in the Province of Lecce (Southeastern Italy). Sol. Energy 2017, 155, 434–444. [Google Scholar] [CrossRef] [Green Version]
  21. Jiang, H.; Yao, L.; Lu, N.; Qin, J.; Liu, T.; Liu, Y.; Zhou, C. Multi-resolution dataset for photovoltaic panel segmentation from satellite and aerial imagery. Earth Syst. Sci. Data 2021, 13, 5389–5401. [Google Scholar] [CrossRef]
  22. Jie, Y.; Ji, X.; Yue, A.; Chen, J.; Deng, Y.; Chen, J.; Zhang, Y. Combined multi-layer feature fusion and edge detection method for distributed photovoltaic power station identification. Energies 2020, 13, 6742. [Google Scholar] [CrossRef]
  23. Xia, Z.; Li, Y.; Guo, X.; Chen, R. High-resolution mapping of water photovoltaic development in China through satellite imagery. Int. J. Appl. Earth Obs. Geoinf. 2022, 107, 102707. [Google Scholar] [CrossRef]
  24. Stid, J.T.; Shukla, S.; Anctil, A.; Kendall, A.D.; Rapp, J.; Hyndman, D.W. Solar array placement, electricity generation, and cropland displacement across California’s Central Valley. Sci. Total Environ. 2022, 835, 155240. [Google Scholar] [CrossRef]
  25. Kuo, C.-F.J.; Chen, S.-H.; Huang, C.-Y. Automatic detection, classification and localization of defects in large photovoltaic plants using unmanned aerial vehicles (UAV) based infrared (IR) and RGB imaging. Energy Convers. Manag. 2023, 276, 116495. [Google Scholar]
  26. Plakman, V.; Rosier, J.; van Vliet, J. Solar park detection from publicly available satellite imagery. GISci. Remote Sens. 2022, 59, 461–480. [Google Scholar] [CrossRef]
  27. Czirjak, D.W. Detecting photovoltaic solar panels using hyperspectral imagery and estimating solar power production. J. Appl. Remote Sens. 2017, 11, 026007. [Google Scholar] [CrossRef]
  28. Du, B.; He, Y.; He, Y.; Duan, J.; Zhang, Y. Intelligent classification of silicon photovoltaic cell defects based on eddy current thermography and convolution neural network. IEEE Trans. Ind. Inform. 2019, 16, 6242–6251. [Google Scholar] [CrossRef]
  29. Kruitwagen, L.; Story, K.; Friedrich, J.; Byers, L.; Skillman, S.; Hepburn, C. A global inventory of photovoltaic solar energy generating units. Nature 2021, 598, 604–610. [Google Scholar] [CrossRef] [PubMed]
  30. Ortiz, A.; Negandhi, D.; Mysorekar, S.R.; Nagaraju, S.K.; Kiesecker, J.; Robinson, C.; Bhatia, P.; Khurana, A.; Wang, J.; Oviedo, F. An artificial intelligence dataset for solar energy locations in India. Sci. Data 2022, 9, 497. [Google Scholar] [CrossRef] [PubMed]
  31. Zhang, X.; Xu, M. Assessing the effects of photovoltaic powerplants on surface temperature using remote sensing techniques. Remote Sens. 2020, 12, 1825. [Google Scholar] [CrossRef]
  32. Guoqing, L.; Hernandez, R.R.; Blackburn, G.A.; Davies, G.; Hunt, M.; Whyatt, J.D.; Armstrong, A. Ground-mounted photovoltaic solar parks promote land surface cool islands in arid ecosystems. Renew. Sustain. Energy Transit. 2021, 1, 100008. [Google Scholar] [CrossRef]
  33. Xia, Z.; Li, Y.; Zhang, W.; Guo, S.; Zheng, L.; Jia, N.; Chen, R.; Guo, X.; Du, P. Quantitatively distinguishing the impact of solar photovoltaics programs on vegetation in dryland using satellite imagery. Land Degrad. Dev. 2023; Early View. [Google Scholar] [CrossRef]
  34. Yang, J.; Huang, X. The 30 m annual land cover dataset and its dynamics in China from 1990 to 2019. Earth Syst. Sci. Data 2021, 13, 3907–3925. [Google Scholar] [CrossRef]
  35. Xia, Z.; Li, Y.; Chen, R.; Sengupta, D.; Guo, X.; Xiong, B.; Niu, Y. Mapping the rapid development of photovoltaic power stations in northwestern China using remote sensing. Energy Rep. 2022, 8, 4117–4127. [Google Scholar] [CrossRef]
  36. Zhang, X.; Zeraatpisheh, M.; Rahman, M.M.; Wang, S.; Xu, M. Texture is important in improving the accuracy of mapping photovoltaic power plants: A case study of Ningxia Autonomous Region, China. Remote Sens. 2021, 13, 3909. [Google Scholar] [CrossRef]
  37. Tucker, C.J. Red and photographic infrared linear combinations for monitoring vegetation. Remote Sens. Environ. 1979, 8, 127–150. [Google Scholar] [CrossRef] [Green Version]
  38. Zha, Y.; Gao, J.; Ni, S. Use of normalized difference built-up index in automatically mapping urban areas from TM imagery. Int. J. Remote Sens. 2003, 24, 583–594. [Google Scholar] [CrossRef]
  39. McFeeters, S.K. The use of the Normalized Difference Water Index (NDWI) in the delineation of open water features. Int. J. Remote Sens. 1996, 17, 1425–1432. [Google Scholar] [CrossRef]
  40. Breiman, L. Random forests. Mach. Learn. 2001, 45, 5–32. [Google Scholar] [CrossRef] [Green Version]
  41. Belgiu, M.; Drăguţ, L. Random forest in remote sensing: A review of applications and future directions. ISPRS J. Photogramm. Remote Sens. 2016, 114, 24–31. [Google Scholar] [CrossRef]
  42. Colditz, R.R. An evaluation of different training sample allocation schemes for discrete and continuous land cover classification using decision tree-based algorithms. Remote Sens. 2015, 7, 9655–9681. [Google Scholar] [CrossRef] [Green Version]
  43. Du, P.; Samat, A.; Waske, B.; Liu, S.; Li, Z. Random forest and rotation forest for fully polarized SAR image classification using polarimetric and spatial features. ISPRS J. Photogramm. Remote Sens. 2015, 105, 38–53. [Google Scholar] [CrossRef]
  44. Congalton, R.G. A review of assessing the accuracy of classifications of remotely sensed data. Remote Sens. Environ. 1991, 37, 35–46. [Google Scholar] [CrossRef]
  45. Stehman, S.V.; Foody, G.M. Key issues in rigorous accuracy assessment of land cover products. Remote Sens. Environ. 2019, 231, 111199. [Google Scholar] [CrossRef]
  46. Zhang, X.; Xu, M.; Wang, S.; Huang, Y.; Xie, Z. Mapping photovoltaic power plants in China using Landsat, random forest, and Google Earth Engine. Earth Syst. Sci. Data 2022, 14, 3743–3755. [Google Scholar] [CrossRef]
  47. Wang, X.; Xiao, X.; Zou, Z.; Hou, L.; Qin, Y.; Dong, J.; Doughty, R.B.; Chen, B.; Zhang, X.; Chen, Y. Mapping coastal wetlands of China using time series Landsat images in 2018 and Google Earth Engine. ISPRS J. Photogramm. Remote Sens. 2020, 163, 312–326. [Google Scholar] [CrossRef]
  48. Flood, N. Seasonal composite Landsat TM/ETM+ images using the medoid (a multi-dimensional median). Remote Sens. 2013, 5, 6481–6500. [Google Scholar] [CrossRef] [Green Version]
  49. Pal, M. Random forest classifier for remote sensing classification. Int. J. Remote Sens. 2005, 26, 217–222. [Google Scholar] [CrossRef]
  50. Van Tricht, K.; Gobin, A.; Gilliams, S.; Piccard, I. Synergistic use of radar Sentinel-1 and optical Sentinel-2 imagery for crop mapping: A case study for Belgium. Remote Sens. 2018, 10, 1642. [Google Scholar] [CrossRef] [Green Version]
  51. Liu, C.; Zhang, Q.; Wang, H. Cost-benefit analysis of waste photovoltaic module recycling in China. Waste Manag. 2020, 118, 491–500. [Google Scholar] [CrossRef]
  52. Herez, A.; El Hage, H.; Lemenand, T.; Ramadan, M.; Khaled, M. Review on photovoltaic/thermal hybrid solar collectors: Classifications, applications and new systems. Sol. Energy 2020, 207, 1321–1347. [Google Scholar] [CrossRef]
  53. Tawalbeh, M.; Al-Othman, A.; Kafiah, F.; Abdelsalam, E.; Almomani, F.; Alkasrawi, M. Environmental impacts of solar photovoltaic systems: A critical review of recent progress and future outlook. Sci. Total Environ. 2021, 759, 143528. [Google Scholar] [CrossRef] [PubMed]
  54. Sun, Y.; Zhu, D.; Li, Y.; Wang, R.; Ma, R. Spatial modelling the location choice of large-scale solar photovoltaic power plants: Application of interpretable machine learning techniques and the national inventory. Energy Convers. Manag. 2023, 289, 117198. [Google Scholar] [CrossRef]
Figure 1. (a) The location of the study area and the brightness of the night light; (b) the long-term yearly average of the potential PV electricity production period from 2007 to 2018, with data sourced from https://globalsolaratlas.info/map (accessed on 6 August 2022); and (c) the electricity production and consumption in different regions.
Remotesensing 15 03712 g001
Figure 2. (a) The spatial distribution of the cloudless Sentinel-2 image frequency, and (b) the spatial distributions of the photovoltaic panel and non-photovoltaic panel sample points.
Remotesensing 15 03712 g002
Figure 3. Workflow for mapping the PV panels. It includes four parts: (a) data collection and preprocessing, (b) construction of classifier and post-classification processing, (c) differentiation of PV panel types, and (d) accuracy assessment of PV maps.
Remotesensing 15 03712 g003
Figure 4. The identification results for the different PV types. (ad) indicate different underlying surface types; (14) denote different processing results.
Remotesensing 15 03712 g004
Figure 5. The spatial distribution of the verification points.
Remotesensing 15 03712 g005
Figure 6. The spatial distribution and statistics of the photovoltaic panels. (a) The spatial distribution of the photovoltaic panels; (b) the proportions of the different PV types; (c) the correlation between the PV panel area and grid-connected capacity in the different regions; and (d) the statistics on the different PV types in different regions. To avoid inconsistent statistical standards, we did not analyze the photovoltaic cumulative capacity for Hong Kong, Macao, or Taiwan in 2021.
Remotesensing 15 03712 g006
Figure 7. Photovoltaic panels installed on different substrates. (a) The spatial distribution of different types of photovoltaic panels; (b) photovoltaic panels installed on the plains; (c) photovoltaic panels installed on hillsides; (d) photovoltaic panels installed on water; (e) photovoltaic panels installed on the tidal flat; and (f) photovoltaic panels installed on a building. 1 and 2 respectively represent Sentinel-2 RGB images and Google images.
Remotesensing 15 03712 g007
Figure 8. The NDVI of different types of photovoltaic panels before and after installation in different climate zones: (a) mid-temperate, (b) south-temperate, (c) north-subtropical, (d) mid-subtropical, (e) south-subtropical, and (f) mid-tropical.
Remotesensing 15 03712 g008
Figure 9. Comparison of the PV_China_2020 and 2021_PV areas in different regions.
Remotesensing 15 03712 g009
Figure 10. A comparison between the two data types from different underlying surfaces. (a,c) represent PV panels installed on building surfaces, (b) represents PV panels installed on flat ground surfaces, (d,f) represent PV panels installed on water surfaces, and (e) represents PV panels installed on hilly surfaces.
Remotesensing 15 03712 g010
Figure 11. Analysis of errors caused by differences in the feature bands. (ac) are photovoltaic panels in different regions; (13) are Google images, MIS RGB images, and the feature-difference analysis.
Remotesensing 15 03712 g011
Figure 12. Analysis of errors caused by post classification. (ac) are photovoltaic panels in different regions; (13) are Google images, MIS RGB images, and the resultant map.
Remotesensing 15 03712 g012
Table 1. The accuracy of the different processing procedures.
NOPVPVProducer Accuracy
Potential
photovoltaic
NOPV269728897.93%
PV57395893.22%
User accuracy90.35%98.58%95.07% (OA)
Post-classificationNOPV271244398.47%
PV42380389.57%
User accuracy85.96%98.91%93.07% (OA)
ReclassificationNOPV273638099.35%
PV18386691.05%
User accuracy87.80%99.54%94.31% (OA)
Table 2. The accuracy for the different types of photovoltaic panels.
NOPVPPVSPVWPVProducer Accuracy
NOPV27362201174399.35%
PPV1216315216381.59%
SPV6441003485.51%
WPV0104186480.45%
User accuracy87.80%87.78%94.89%89.16%89.06% (OA)
Table 3. The area of photovoltaic panels in different climate zones (km2).
Climate ZonesPPVSPVWPV
Mid-temperate68.0421.649.65
South-temperate107.8846.2864.58
North-subtropical35.372.9270.31
Mid-subtropical13.147.918.75
South-subtropical27.236.3216.64
Mid-tropical3.320.450.36
Disclaimer/Publisher’s Note: The statements, opinions and data contained in all publications are solely those of the individual author(s) and contributor(s) and not of MDPI and/or the editor(s). MDPI and/or the editor(s) disclaim responsibility for any injury to people or property resulting from any ideas, methods, instructions or products referred to in the content.

