Article

A Probabilistic Approach to Mapping the Contribution of Individual Riverine Discharges into Liverpool Bay Using Distance Accumulation Cost Methods on Satellite Derived Ocean-Colour Data

1
Centre for Environment Fisheries and Aquaculture Science (Cefas), Weymouth DT4 8UB, UK
2
Centre for Environment Fisheries and Aquaculture Science (Cefas), Lowestoft NR33 0HT, UK
3
Collaborative Centre for Sustainable Use of the Seas, University of East Anglia, Norwich NR4 7TJ, UK
*
Author to whom correspondence should be addressed.
Remote Sens. 2023, 15(14), 3666; https://doi.org/10.3390/rs15143666
Submission received: 31 May 2023 / Revised: 17 July 2023 / Accepted: 20 July 2023 / Published: 23 July 2023
(This article belongs to the Special Issue Recent Advances in Water Quality Monitoring)

Abstract

:
Assessments of the water quality in coastal zones often rely on indirect indicators from contributing river inputs and the neighbouring ocean. Using a novel combination of distance accumulation cost methods and an ocean-colour product derived from SENTINEL-3 data, we developed a probabilistic method for the assessment of dissolved inorganic nitrogen (DIN) in Liverpool Bay (UK) for the period from 2017 to 2020. Using our approach, we showed the annual and monthly likelihood of DIN exposure from its 12 major contributory rivers. Furthermore, we generated monthly risk maps showing the probability of DIN exposure from all rivers, which revealed a seasonal variation of extent and location around the bay. The highest likelihood of high DIN exposure throughout the year was in the estuarine regions of the Dee, Mersey, and Ribble, along with near-shore areas along the north Wales coast and around the mouth of the rivers Mersey and Ribble. There were seasonal changes in the risk of DIN exposure, and this risk remained high all year for the Mersey and Dee estuary regions. In contrast, for the mouth and near the coastal areas of the Ribble, the DIN exposure decreased in spring, remained low during the summer and early autumn, before displaying an increase during winter. Our approach offers the ability to assess the water quality within coastal zones without the need of complex hydrodynamic models, whilst still having the potential to apportion nutrient exposure to specific riverine inputs. This information can help to prioritise how direct mitigation strategies can be applied to specific river catchments, focusing the limited resources for coastal zone and river basin management.

1. Introduction

Our coastal waters are important systems, being at the interface between land-based activity and our marine waters. Rivers discharge into our estuaries and coastal waters, putting coastal systems at a higher risk from the negative impacts of land-based pollution [1,2]. Estuaries are sinks for organic matter and nutrients entering both from their catchments and the adjacent lands and urban areas and, in turn, they transport such materials to the adjacent coast [3,4]. The inland expansion of urban settlements and an increased human population place an increased burden on the surrounding coastal environment, leading to the increased delivery of pollutants, both natural and artificial, from the terrestrial watershed [5,6,7].
Human and industrial wastes are often discharged into upstream watercourses, for example through the combined sewer overflow (CSO) system, and in the UK, these point sources of pollution were a major contributory factor to coastal and terrestrial waterbody eutrophication prior to the 1980s [8,9,10,11]. Concerted action during the 80s and 90s significantly reduced the discharged effluents from wastewater treatment plants in the UK, which resulted in major improvements in coastal water quality [9,12]. These achievements are easily lost, and increased pressure on water treatment plants through population increase and reductions in monitoring oversight can result in a return to point discharges affecting water quality [11]. However, the intensification of agriculture has also placed a burden on the water quality of rivers and receiving coastal waters [13,14,15,16]. The use of monoculture crops has resulted in a reliance on pesticides, and the application of artificial fertilisers has increased the nutrient loads entering watersheds [15]. Arable and pastural practices have often become decoupled, changing the dynamics of sustainable nutrient use. Unlike the CSOs mentioned above, these agricultural sources of pollution are diffuse (spread unevenly across the landscape) and can build up in natural sinks in the environment [17]. Nitrogen is delivered mainly in its soluble forms (nitrate, nitrite, and ammonium) and enters surface water and groundwater either from run-off from the land or through percolation via the soil [18]. These soluble forms can remain and build up within sinks over many decades before a tipping point is reached and they begin to infiltrate river and coastal environments [14,19]. Phosphorous, delivered in the soluble form phosphate, is readily retained in soils and sediments, and it is believed there is a widespread phosphate overabundance in some UK soils through its overuse in agriculture [20]. Phosphate was a major issue in point source pollution prior to the 1980s, being heavily used in household and industrial detergents. Reductions in detergent use have reduced the levels of this nutrient entering UK water courses [21,22].
As a river discharges into the marine environment, it creates an area of buoyant freshwater radiating from the mouth of the river, called the river plume. Plumes can be categorised into ‘riverine’ and ‘estuarine’ types based on the degree of mixing that occurs prior to their entry into the ocean [23]. A riverine plume is dominated by the influx of freshwater discharge, such that the freshwater is discharged over the shelf waters without mixing due to tidal or other factors. In contrast, with an estuarine plume, a significant amount of mixing takes place, often within an enclosed basin, before the plume is discharged into the shelf waters. A river plume is an area typified by a lower salinity and increased surface temperature, and can include nutrients and other elements, such as plastics flushed from the terrestrial watershed [24]. The extent of a river plume varies enormously between different rivers and at different times of the year, as it depends on the complex interplay between many hydrodynamic factors, including the depth of the water, the rate and degree of the mixing of stratified water layers, tidal and residual currents, and climatic factors such as wind direction [24]. The dynamics of the plume are further complicated when two or more rivers discharge into the same coastal area [25,26,27].
In 2019, only 16% of the surface water bodies in England had a good ecological status according to Water Framework Directive (WFD) assessments [28], and diffuse pollution from agriculture remains one of the major causes of these assessment failures. An improved understanding of the interactions between catchment activities and the coastal environment are important to guiding the prioritisation of best management practices and urban improvements. Whilst the UK has been assessing the state of its transitional and coastal waters under the WFD (and the new Water Framework Regulations—WFR), the assessment of a coastal area is limited to 1 nm from the shore. In turn, the offshore assessment areas used to assess eutrophication under the OSPAR Comprehensive Procedure [18] can extend to larger areas, diluting the impact of these coastal waters. Recent work [29] has identified plume extents from Liverpool Bay that extend further than the WFD assessment areas, but are still relatively nearshore. The nutrient and plankton dynamics in these plume areas need to be considered in their own right, and not as the edge of the WFD or the initial zone in the OSPAR offshore area [18]. Mapping plume waters using remote sensing and the water quality gradients within has been used successfully in monitoring programs, providing a tool to increase the data frequency and connect catchment activities to the transport of pollutants into the marine environment [29,30,31].
Liverpool Bay is a shallow coastal section of the semi-enclosed Irish Sea, lying off the north coast of Wales and the west coast of England. The bay receives freshwater input from English rivers, including the Mersey, Ribble, and the English section of the Dee, which flow through heavily industrialised and highly populated areas, and Welsh rivers such as the Clwyd and Conwy, which flow through the more pristine rural catchments of north Wales and the Snowdonia National Park. The bay has large tidal currents, with a spring tidal range in excess of 10 m, which has important implications for the fate of freshwater influxes. The bay represents a Region of Freshwater Influence (ROFI) and the dynamics of freshwater and saltwater mixing throughout the water column are strongly influenced by estuarine outflows that are typically high-intensity and short-duration events [32]. This is further complicated by the salinity and temperature gradients that can affect the buoyancy of the freshwater plume with an increase in stratification during the summer months. The degree and extent of the stratification and mixing of the freshwater plume is, therefore, a complex interaction of tidal, wind, temperature, and salinity differences, and the intensity and duration of the outflows from the estuaries around the bay [32,33].
The UK Marine Strategy consists of a framework for achieving a good environmental status through protection, the prevention of deterioration, and where applicable, the restoration of the marine environment, whilst allowing for the sustainable use of marine resources. In an environment with multiple influxes of nutrients entering a complex hydrodynamic domain, being able to understand the relative contributions of each source to elevated nutrient levels is important for targeting alleviation measures. Further, bridging the gap between the riverine input and its inland source within the terrestrial watershed would enable management scenarios to be tested and evaluated. In this regard, the aim of this study was to (a) develop a model of probable exposure to dissolved inorganic nitrogen (DIN) of coastal waters in Liverpool Bay, based on empirical Earth Observation (EO) data; and (b) enable the apportionment of DIN in the Liverpool Bay river plume to individual riverine inputs.

2. Materials and Methods

2.1. Study Area

Liverpool Bay is situated in the eastern section of the Irish Sea off the northwest coast of England and the northeast coast of Wales (Figure 1). It is a shallow bay (<50 m) receiving freshwater input from 12 major rivers along the coastline. The major rivers with coastal outlets are the Clwyd, Dee, Mersey, Ribble, and Wyre, accounting for significant annual discharge and DIN input into the bay [31]. Other rivers discharging into the coastal zone include the Conwy, Alt, Lune, Keer, Bela (including Kent), Leven, and Duddon.

2.2. DIN Discharge Loads from Rivers into Liverpool Bay

Measurements from the Environment Agency Water Quality stations and discharge data from the National River Flow Archive (https://nrfa.ceh.ac.uk/; (accessed on 19 January 2023) see Supplementary Materials Table S1 for details) were used to calculate the DIN load for each of the 12 major riverine inputs into Liverpool Bay for the period from 2010 to 2020. Briefly, the combined gauged daily flow data were obtained for the river(s) feeding into the bay, with any missing readings substituted with a separate mean daily gauged flow rate for each river. A mean monthly DIN concentration was obtained from the EA water quality archive. If a direct measurement of DIN was not available, the sum of the total oxidised nitrogen and ammoniacal nitrogen was used instead. The daily DIN load was calculated using Equation (1) and summed monthly to produce monthly estimates for each month between 2010 and 2020, using a standard approach [34].
D I N   L o a d k g   N = 86.4 × F l o w   R a t e m 3   s 1 × D I N   C o n c e n t r a t i o n m g   L 1

2.3. Earth Observation Data Processing and Generation of the River Plume Boundary

The Forel-Ule (FU) scale consists of 21 colours and is used to visually identify optical water types [35,36,37]. The Forel-Ule Index (FUI) was derived from the FU scale using the X, Y, and Z tristimulus values in the chromaticity diagram, which correspond to red (X), green (Y), and blue (Z) in the visible light spectrum, based on camera or satellite images [36,38,39]. The FUI derived from Sentinel-3 has been used to map the extent of flood plumes, with FU values of 10 or above being representative of riverine-influenced areas (primary, secondary, and tertiary plumes) [40]. In our study, the FUI was derived for the study area using Sentinel-3 OLCI level 1C data, which were atmospherically corrected using POLYMER [41]. An updated open-source FUME repository was deployed to generate the FUI values. For each month, the median, mean, minimum, maximum, standard deviation, standard error, and number of observations of the FUI were calculated from all the available images (for a detailed description of the methodology, see links in the Data Availability statement). Using the FUI values, the maximum extent of the river plume was determined across the whole time series to provide a boundary to constrain the analysis. To do so, cells with an FUI value of 10 or above and with an overall frequency above 0.5 across the whole time series (that is, present for at least 30 out of the 60 months), were considered as part of the river plume. The resultant map was refined by using focal statistics to remove isolated cells and create a continuous plume boundary edge. All the subsequent analyses used the monthly median value of the FUI.

2.4. Current Direction in Liverpool Bay

The direction of the residual surface-level currents in Liverpool Bay is largely influenced by the prevailing wind direction [42]. Modelled surface current velocities were obtained from the Atlantic-European North West Shelf-Ocean Physics Reanalysis dataset. Monthly mean current velocities (eastward and northward) from the geographical extent between 54.5°N and 53°N and −4.5°E and −2.75°E, the period from 2017 to 2021, and water depths between 0 and 100 m were downloaded from Copernicus (for details see the Data Availability Statement. Using R [43] and the packages raster [44], rgdal [45], and plotly [46], the geographical current direction was resolved using the vertical (vo) and horizontal (uo) velocities, and the monthly mean angular direction was calculated for each grid cell for the years from 2017 to 2021. The output direction raster was resampled and interpolated in ArcGIS Pro to a grid cell size of 0.003° × 0.003°, using a bilinear approach to match the resolution of the satellite-derived plume boundary. The monthly residual current direction rasters used in the distance accumulation are shown in the Supplementary Materials (Figure S1). These match the north to northwest residual current direction in Liverpool Bay [32,47,48].

2.5. Generation of Monthly DIN Exposure Risk Maps for the Liverpool Bay River Plume

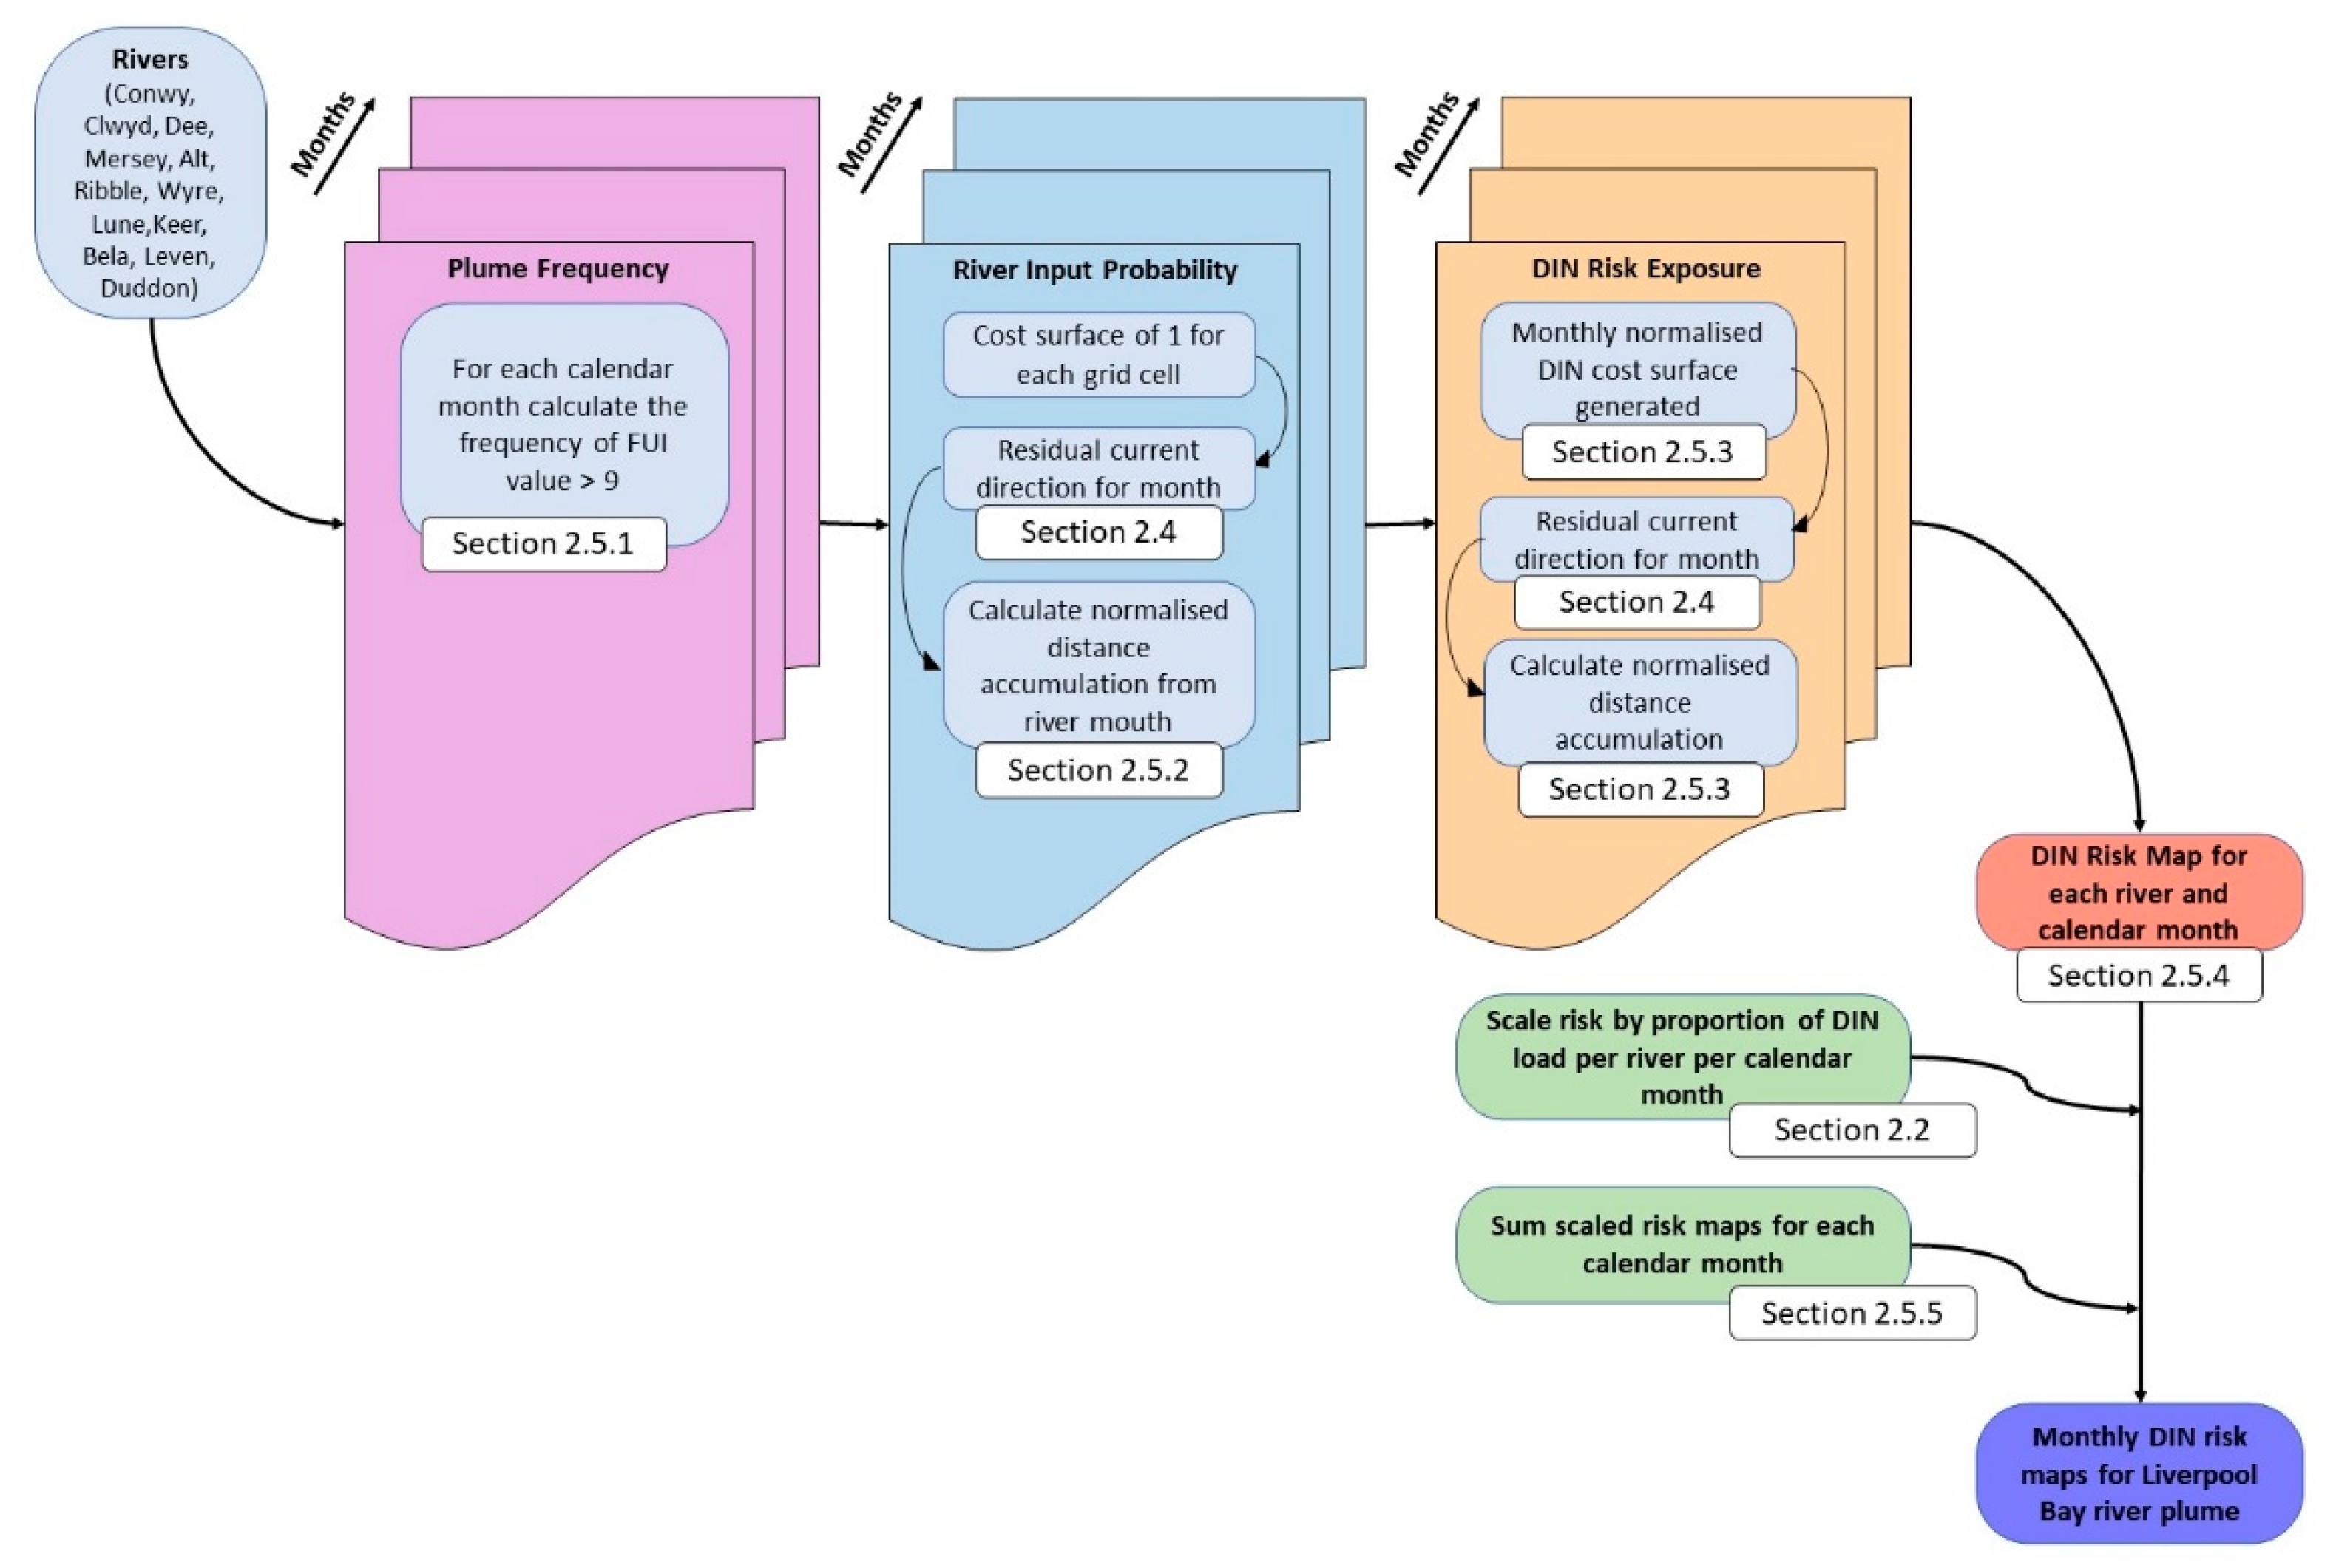
A probabilistic approach was used to determine the contribution of different rivers in the formation of an overall monthly DIN exposure risk map. The workflow comprised the generation of probability maps for the presence of the river plume at each grid cell, the likelihood of riverine inputs from a specific river reaching the grid cell, and the likelihood of DIN in the plume at the grid cell having the river as its source (Figure 2). Individual monthly river risk maps were generated and combined, using an average of the proportion of the DIN loads from the river, to create monthly DIN exposure risk maps.

2.5.1. Spatial Plume Frequency Maps

The presence of the river plume from the satellite-derived FUI values was determined using established techniques [29,30]. All the monthly median FUI layers were reclassified for the presence of the river plume (FUI value ≥ 10), and for each calendar month, the frequency of the plume presence was calculated for the same months between 2017 and 2021. For grid cells with no available FUI data, the frequency was taken only for those months with data present.

2.5.2. Spatial Probability of Riverine Input across the River Plume

For each of the 12 major rivers feeding into the Liverpool Bay study area, for each calendar month, a distance accumulated cost approach was used to calculate the probability of riverine input from each individual river reaching a location within the plume. For each grid cell across the river plume, the cost of moving across the cell was set at 1. This cost surface was used in the distance accumulation approach for each of the 12 rivers in turn, using the Distance Accumulation tool from the spatial analyst toolbox in ArcGIS Pro 2.9.0. This approach was performed for each month, both with and without the residual current direction as the input horizontal factor. Where the current direction was used, the horizontal factor was a linear function of the horizontal relative moving angle with a zero factor of 1, a cut angle of 181°, and a slope of 0.01. The resulting distance accumulation raster was normalised by subtracting the cost at each cell from the maximum cost across the river plume and dividing this by the maximum cost across the river plume. This gave a normalised probability scale from 0 (location with the highest associated cost) to 1 at the source outlet.

2.5.3. Spatial Normalised Potential of DIN in the River Plume

To generate a cost surface for DIN, the observed FUI was used as a proxy for the normalised concentration of DIN in the surface water. A quantitative analysis of the correlation between the FUI and in situ measurements of nitrate, nitrite, and ammonium for Liverpool Bay was extensively covered in [29]. The observed DIN values were estimated from the observed values of nitrate, nitrite, and ammonium taken at 202 sample points around Liverpool Bay between 2017 and 2021 (see Supplementary Materials Figure S2.1 for details). All FUI values below 10 were assumed to be offshore and given a maximal normalised cost of 0.9, and estuarine water (FUI of 21) was given a normalised cost of 0.1. For FUI values between 10 and 21, a LOESS correlation between the observed DIN and FUI values was used to obtain the normalised cost for each FUI value (Supplementary Materials Figure S2.2). The function used to create the normalised cost values is shown in the Supplementary Materials Figure S2.2c.
In a two-step process, normalised cost surfaces were generated from the median FUI values for each calendar month between 2017 and 2021. In the first step, a mean of the FUI monthly values was calculated, with missing data values ignored. Seasonal cost surfaces were generated in a similar way, except that the mean was taken for all the months in that season. In the second step, the value of the FUI at each grid cell was converted into a normalised cost value using the normalised cost function (Supplementary Materials Figure S2.2). This resulted in monthly and seasonal cost surfaces that were used in the distance accumulation approach (see Supplementary Materials Figure S4).
Finally, to generate the spatial grids of the normalised potential of DIN presence, the cost surfaces described above were used with the distance accumulation tool for each river, month, and/or season. These distance accumulation surfaces were normalised against the maximum cost, taking the maximum cost as 0. This approach was performed with and without the residual current direction as the input horizontal factor. Where the direction of the current was used, the horizontal factor was a linear function of the horizontal relative moving angle with a zero factor of 1, a cut angle of 181°, and a slope of 0.01.

2.5.4. Calculation of Risk of DIN Exposure in the River Plume from Individual Rivers

For each cell in the 0.003° × 0.003° (WGS84) grid, the risk (probability PExp) that the cell could be exposed to DIN input from a given river r was calculated using Equation (2) below as the product of the probability that water from river r reached the cell (Pr), the frequency of a river plume at that location over the specified time period (FPlume), and the normalised potential of DIN presence at that location from river r ( C ¯ D I N ; derived using the cost surface derived in Section 2.5.3).
P E x p ( r ) = P r × F P l u m e × C ¯ D I N ( r )
River risk maps for each river were reclassified into 1% groupings and converted into polygons using ArcGIS Pro. All polygons with a risk of 75% or over were extracted, combined, and converted into line features. The line features in the coastal zone were extracted and smoothed to create contour lines representing the boundary of risk above 75%.

2.5.5. Calculation of Risk of DIN Exposure in the River Plume from All River Inputs

The DIN exposure risk maps produced in Section 2.5.4 represent the risk of DIN exposure of each grid cell based on individual rivers discharging into Liverpool Bay. To consider the different levels of the DIN load from each river, all river risk maps (PExp) were multiplied by the proportional input of the DIN (PropDIN) for that month, averaged over the period from 2010 to 2020. For each month, these proportional risk maps were summed to create an overall DIN risk exposure map (RTotal), according to Equation (3) below.
P E x p T o t a l = i = 1 r P E x p × P r o p D I N
The monthly risk maps were used to generate risk frequency maps, showing the number of months, as a fraction of a year, that each cell was exposed to any risk (risk value greater than 0) or to a risk of at least 0.5, meaning that the location had a 50% likelihood of being exposed to DIN above the background (open sea) level, in that month or year.

3. Results

3.1. Boundary Extent and Seasonal Frequency of the Primary River Plume

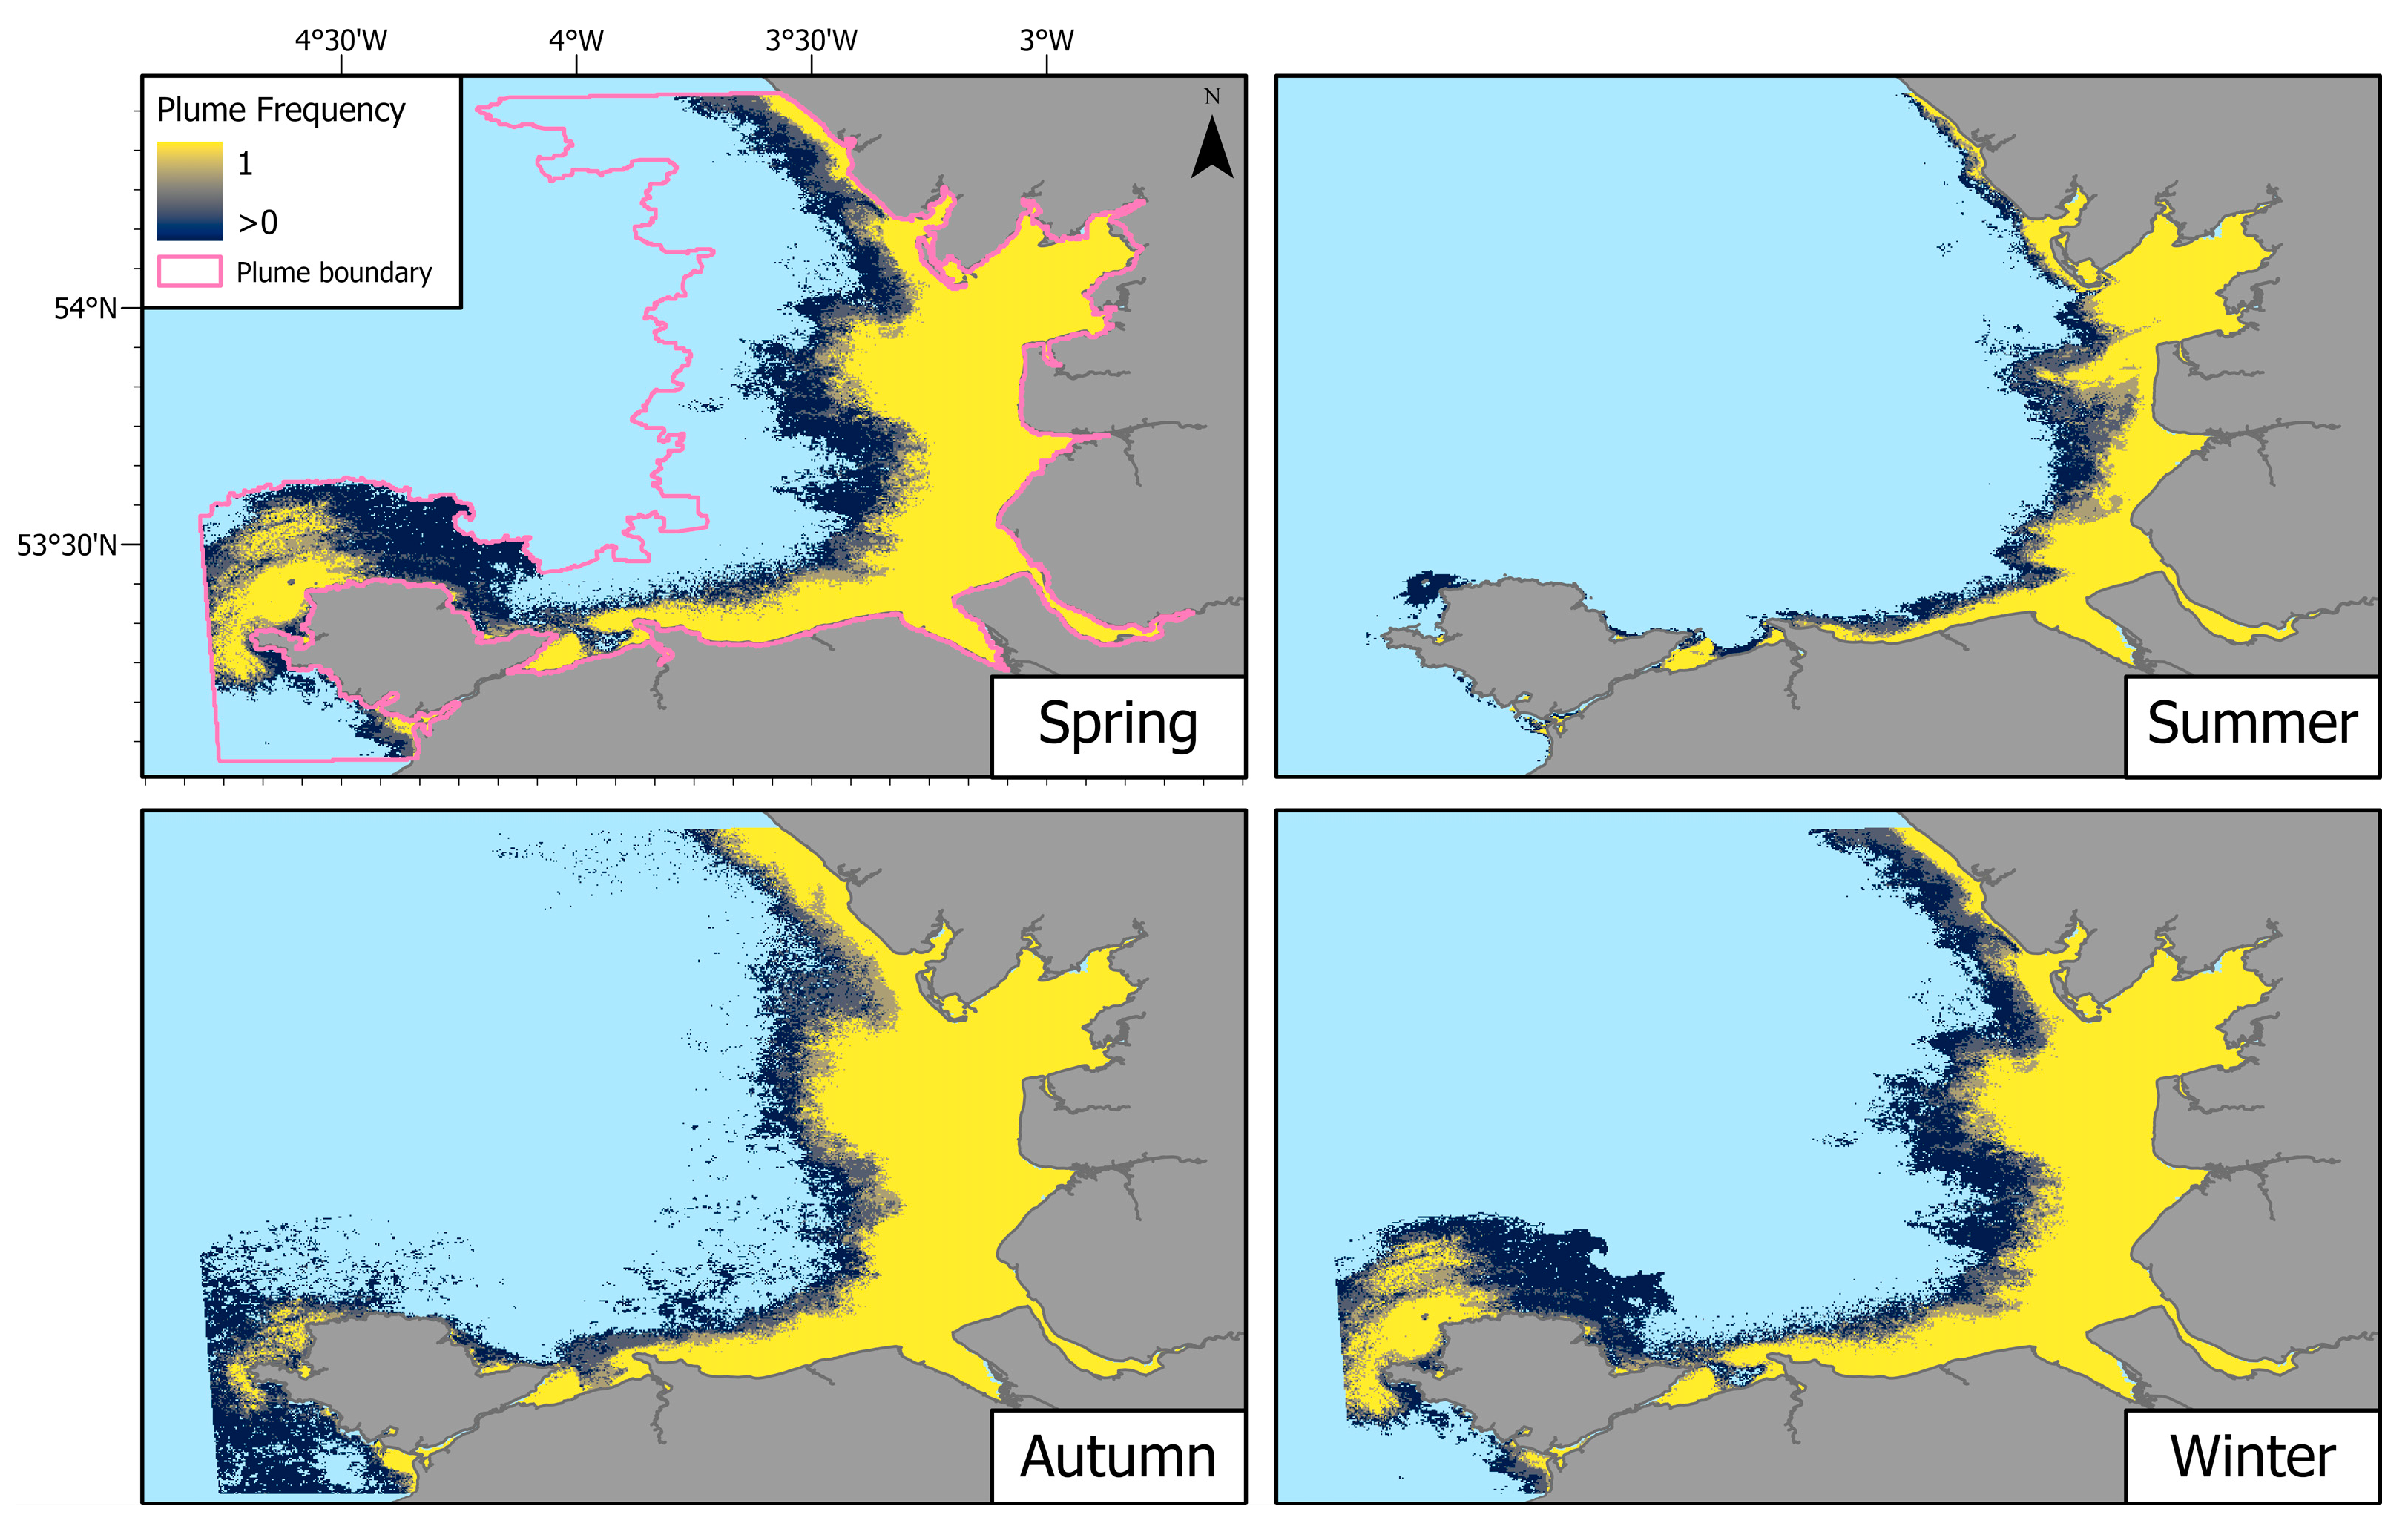
The extent of the freshwater river plume estimated using FUI values has a coverage area of 8468 km2 and a maximum westerly extent of 4.2° out from the English coastline, in agreement with [32] (Figure 3). The seasonal frequency of the river plume between 2017 and 2021, as indicated by an FUI of 10 or above, is shown in Figure 3. As expected, this shows that the plume had the greatest extent in the winter months (December to February), when the river discharges were highest, and this receded during spring (March to May) to the smallest extent in the summer (June to August). A similar seasonal pattern was found in [29], where a monthly river discharge was analysed against the FUI derived plume extent between 2017 and 2020. The increase in the plume extent was highest off the coast of Blackpool around Shell Flat, with only marginal increases along the northwest coast of Wales. Individual calendar monthly plume frequency maps are shown in the Supplementary Materials Figure S3.

3.2. Spatial Probability of Riverine Input into the Plume

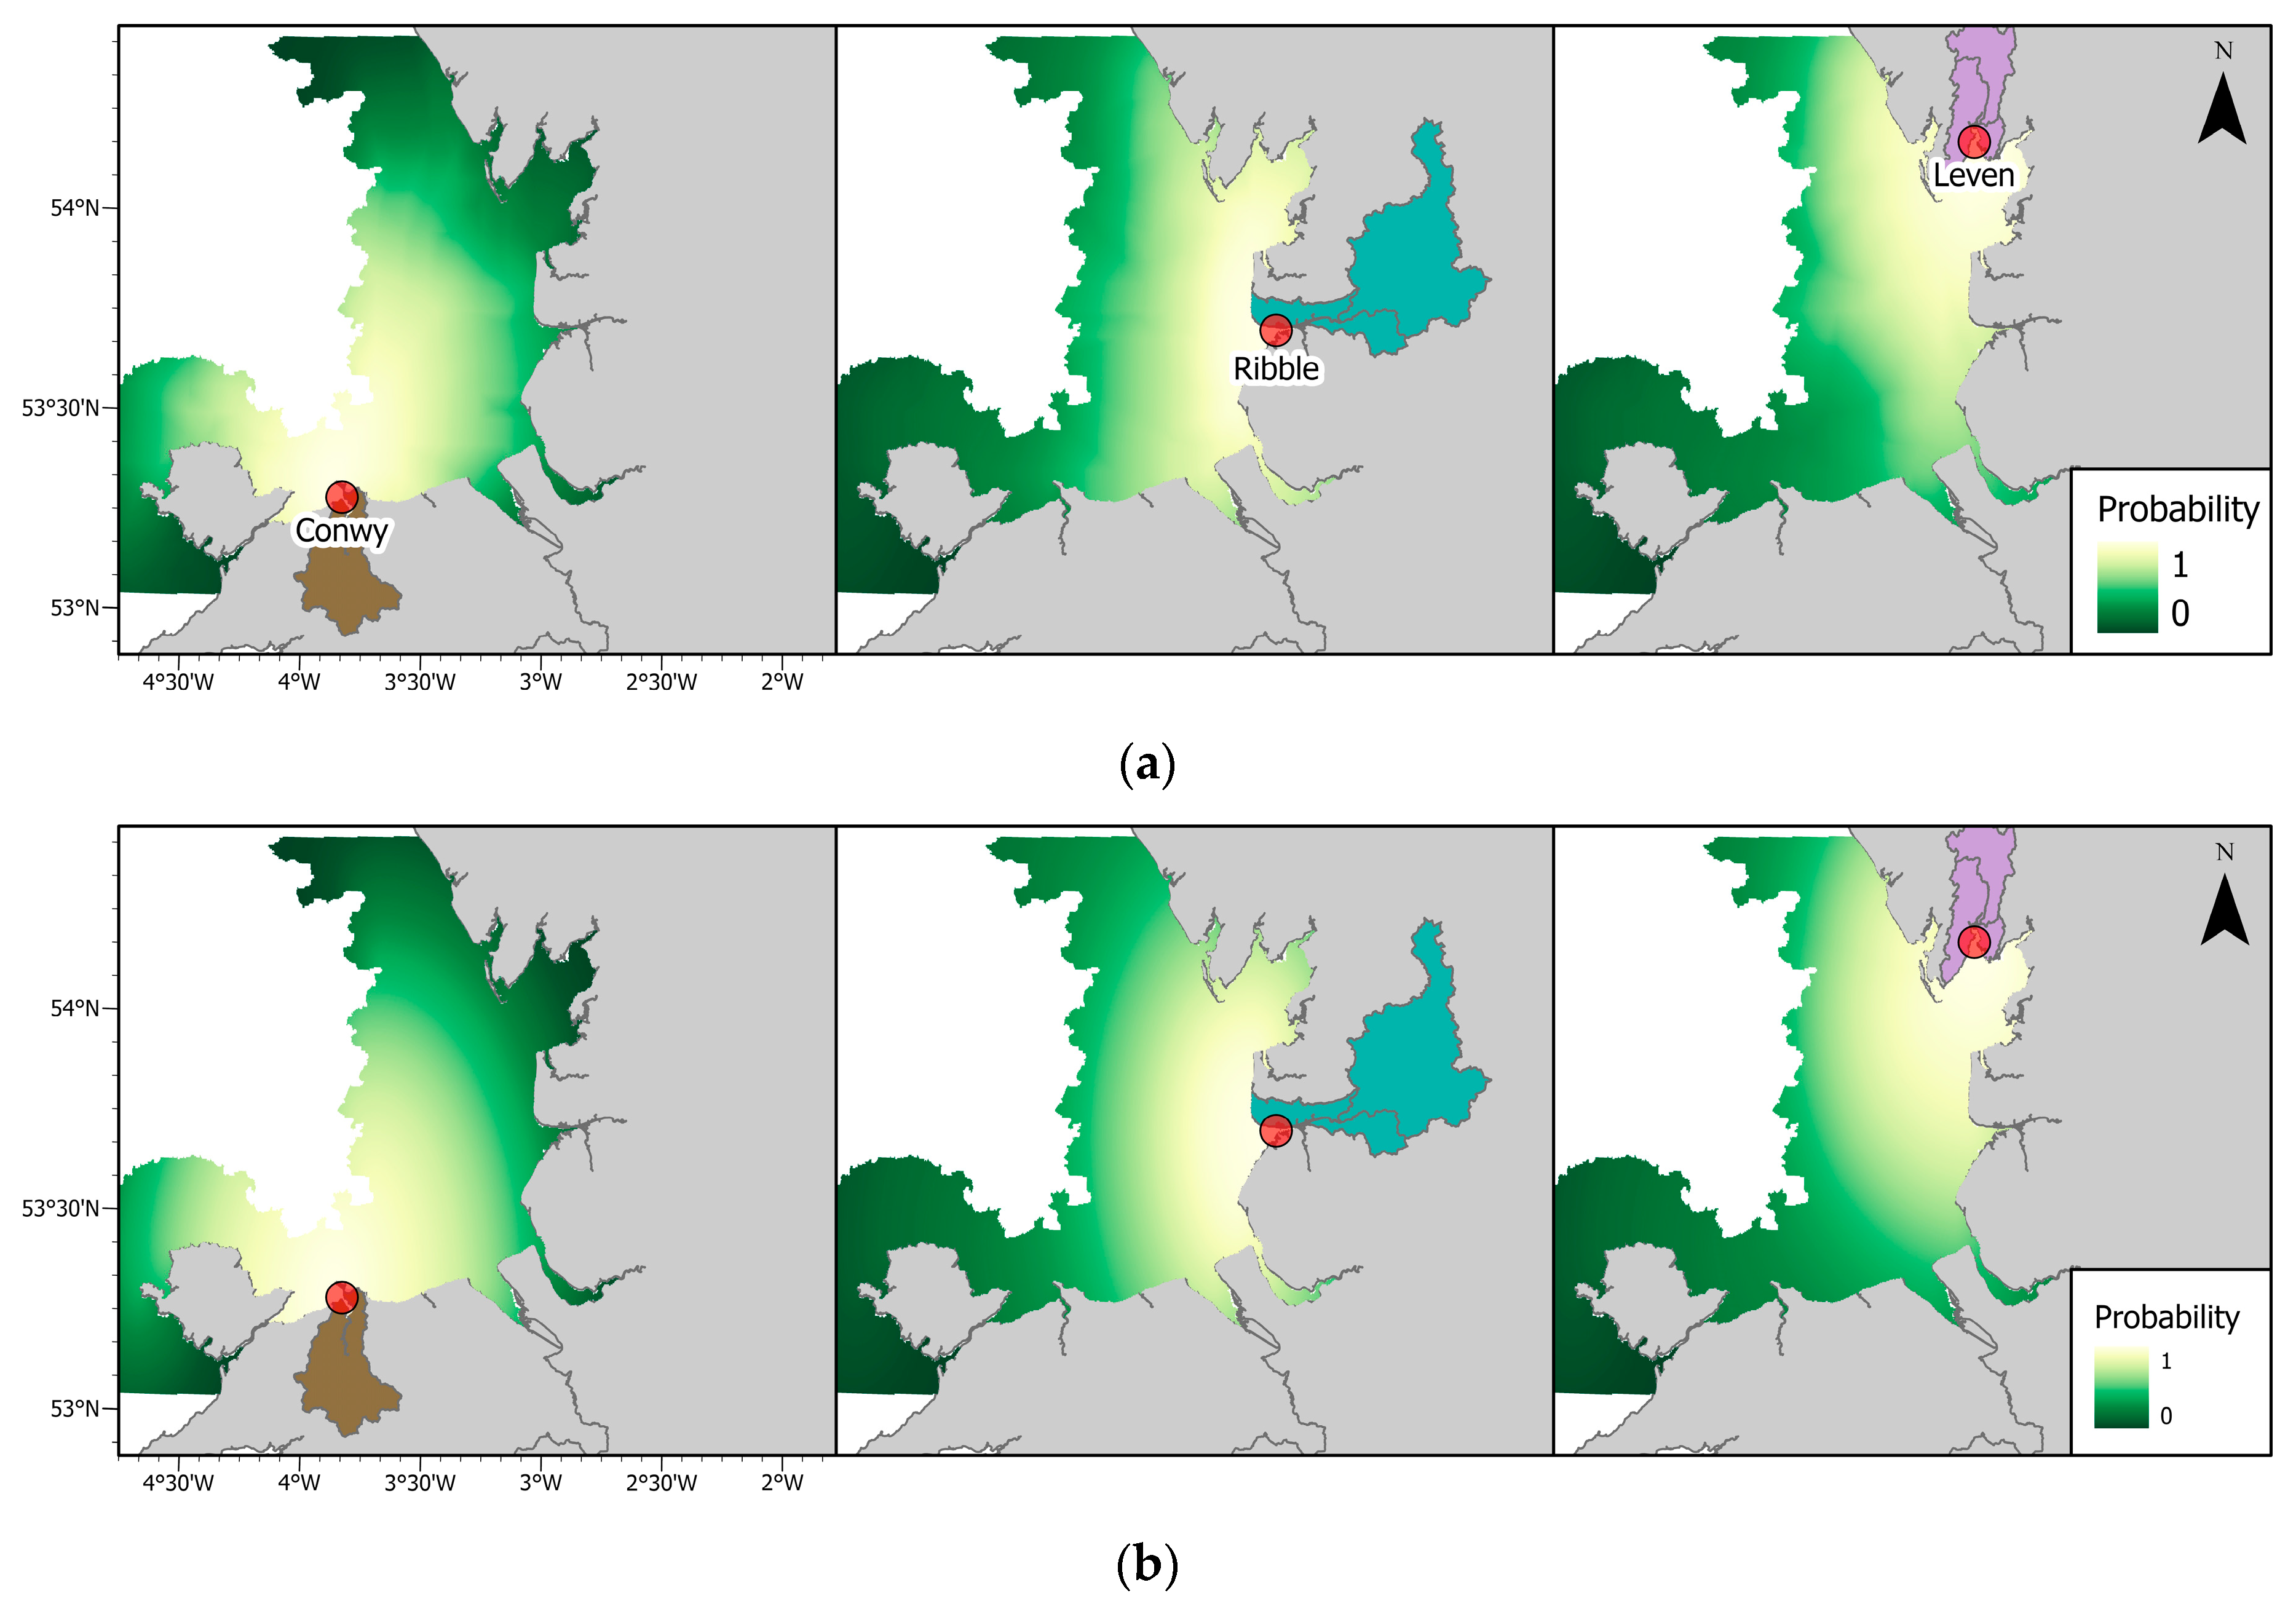
The river plume in Liverpool Bay consists of a complex interaction of all the inputs from the rivers along the coast. The dispersal of the inputs from an individual river will depend on the interplay of different factors, including the volume and concentration of the discharge, the tidal cycle and hydrodynamics of the estuarine area, weather conditions such as the strength and direction of the wind, the surface mixing in the coastal waters, and the velocity of the residual current. In the absence of suitable in situ observations at daily and sub-daily time resolutions, in particular, for the volume and concentration of the DIN in the discharge, a distance accumulation approach was used to generate the spatial probability of the riverine inputs reaching a given grid cell within the plume. Figure 4 shows example riverine spatial probabilities for July, for the inputs from the rivers Conwy, Ribble, and Leven. In Figure 4a, the residual current for July was used to generate the spatial probabilities, whereas in Figure 4b, no current direction was employed. The results show small, but potentially significant, differences in the likelihood of riverine inputs to the plume. For example, for Conwy, there is an increased likelihood of its riverine input reaching more northerly and westerly regions, for Ribble, the likelihood is concentrated more along the western coastline, and for Leven, there is a decrease in the likelihood of its riverine input reaching the Ribble estuary.

3.3. Normalised Distance Accumulation Grids of DIN from the Major Rivers

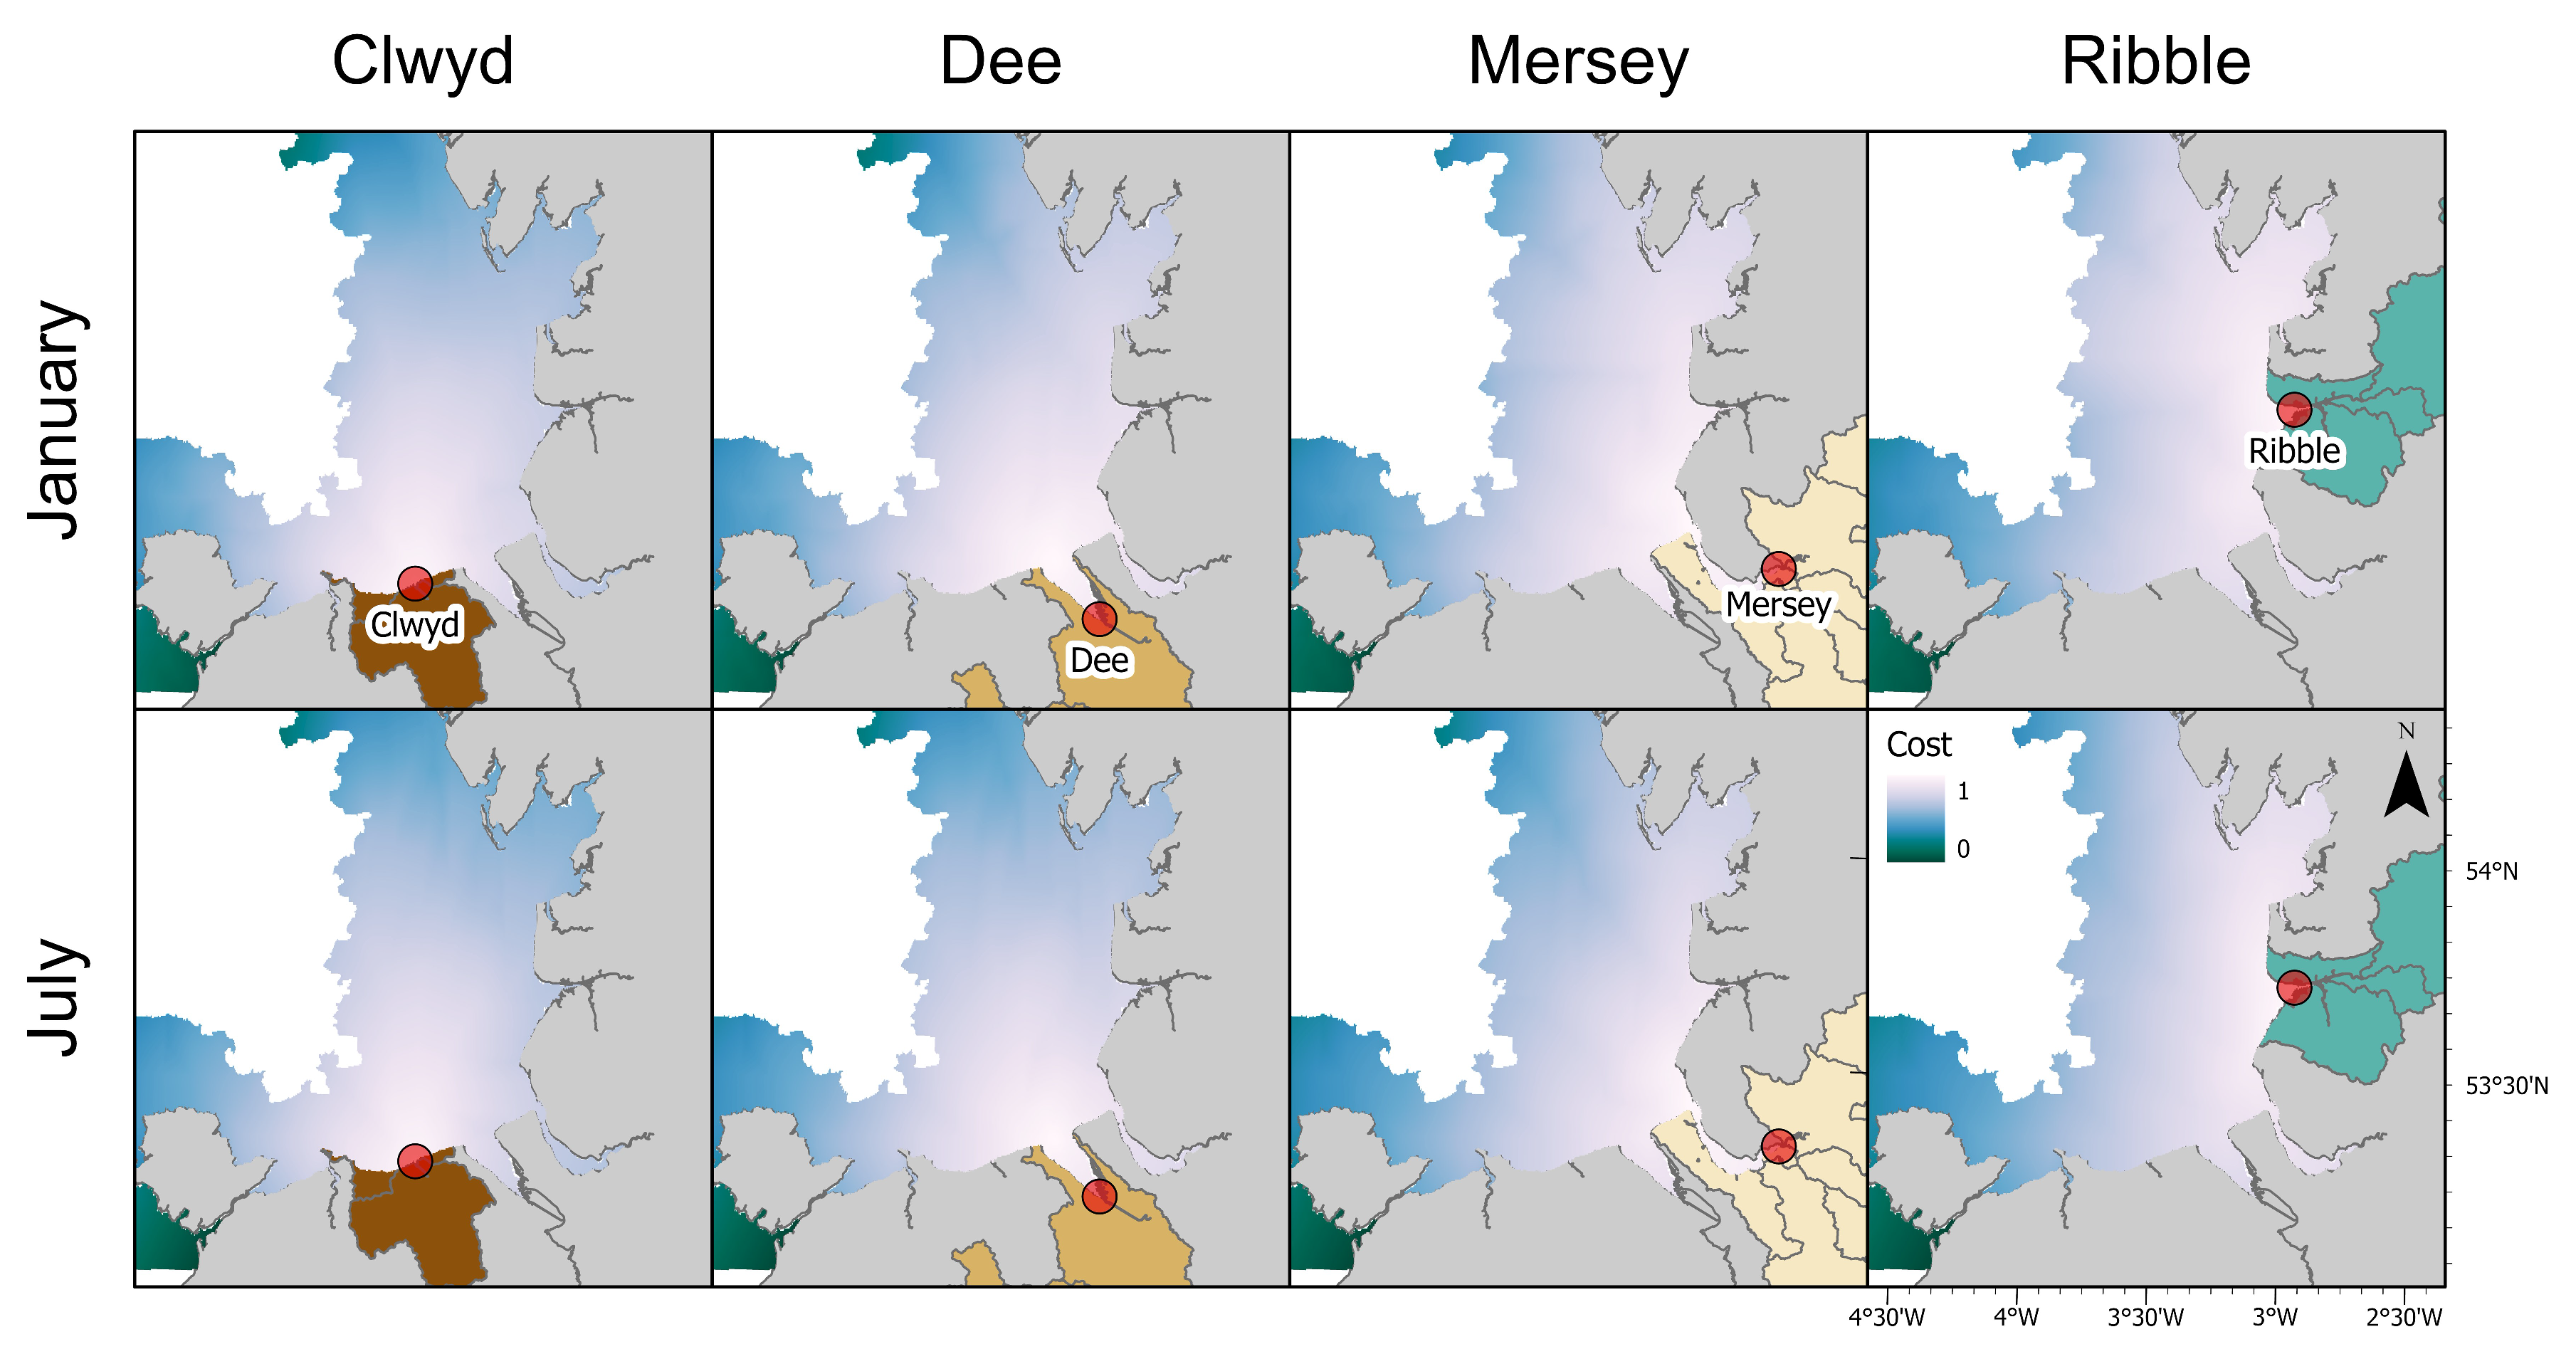
Monthly DIN cost surfaces were used to generate distance accumulation surfaces for each calendar month, for each major river inlet. The cost distance maps were normalised; Figure 5 shows the maps for January and July for the four rivers that supply the greatest inputs to the bay. These maps show the potential level of DIN supplied by individual rivers for each month.

3.4. DIN Exposure Risk Maps for Riverine Inputs into Liverpool Bay

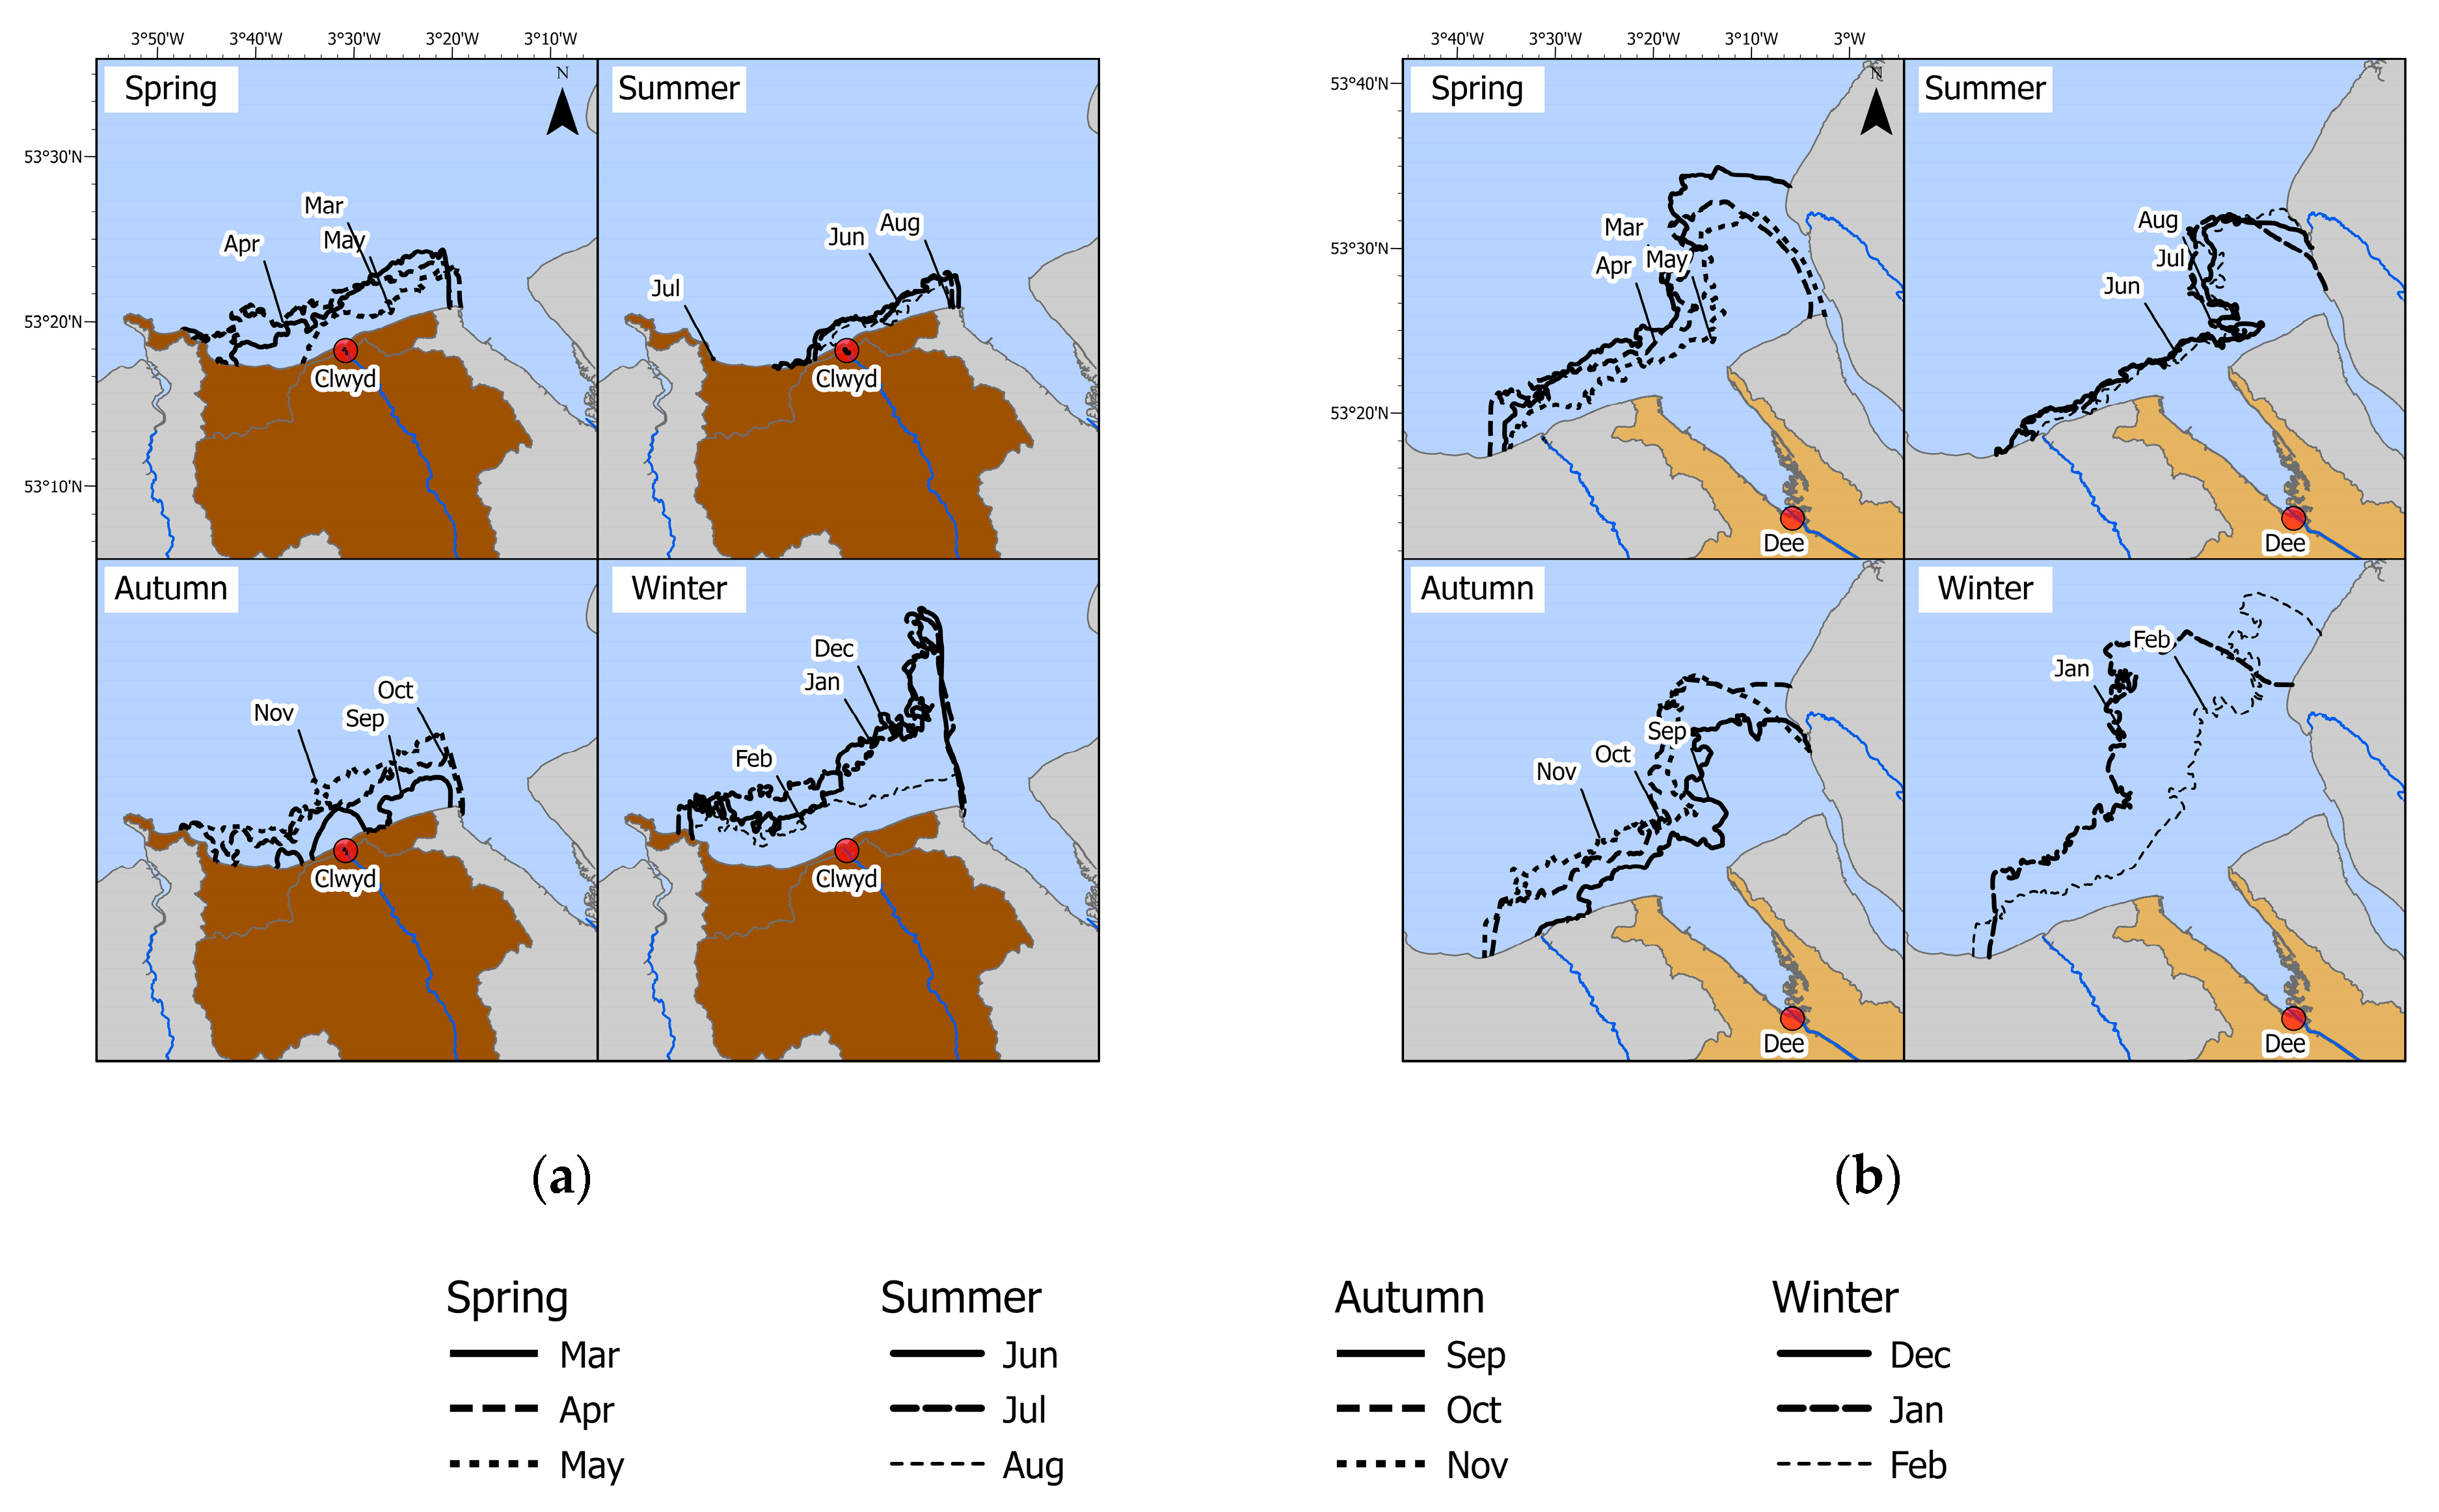
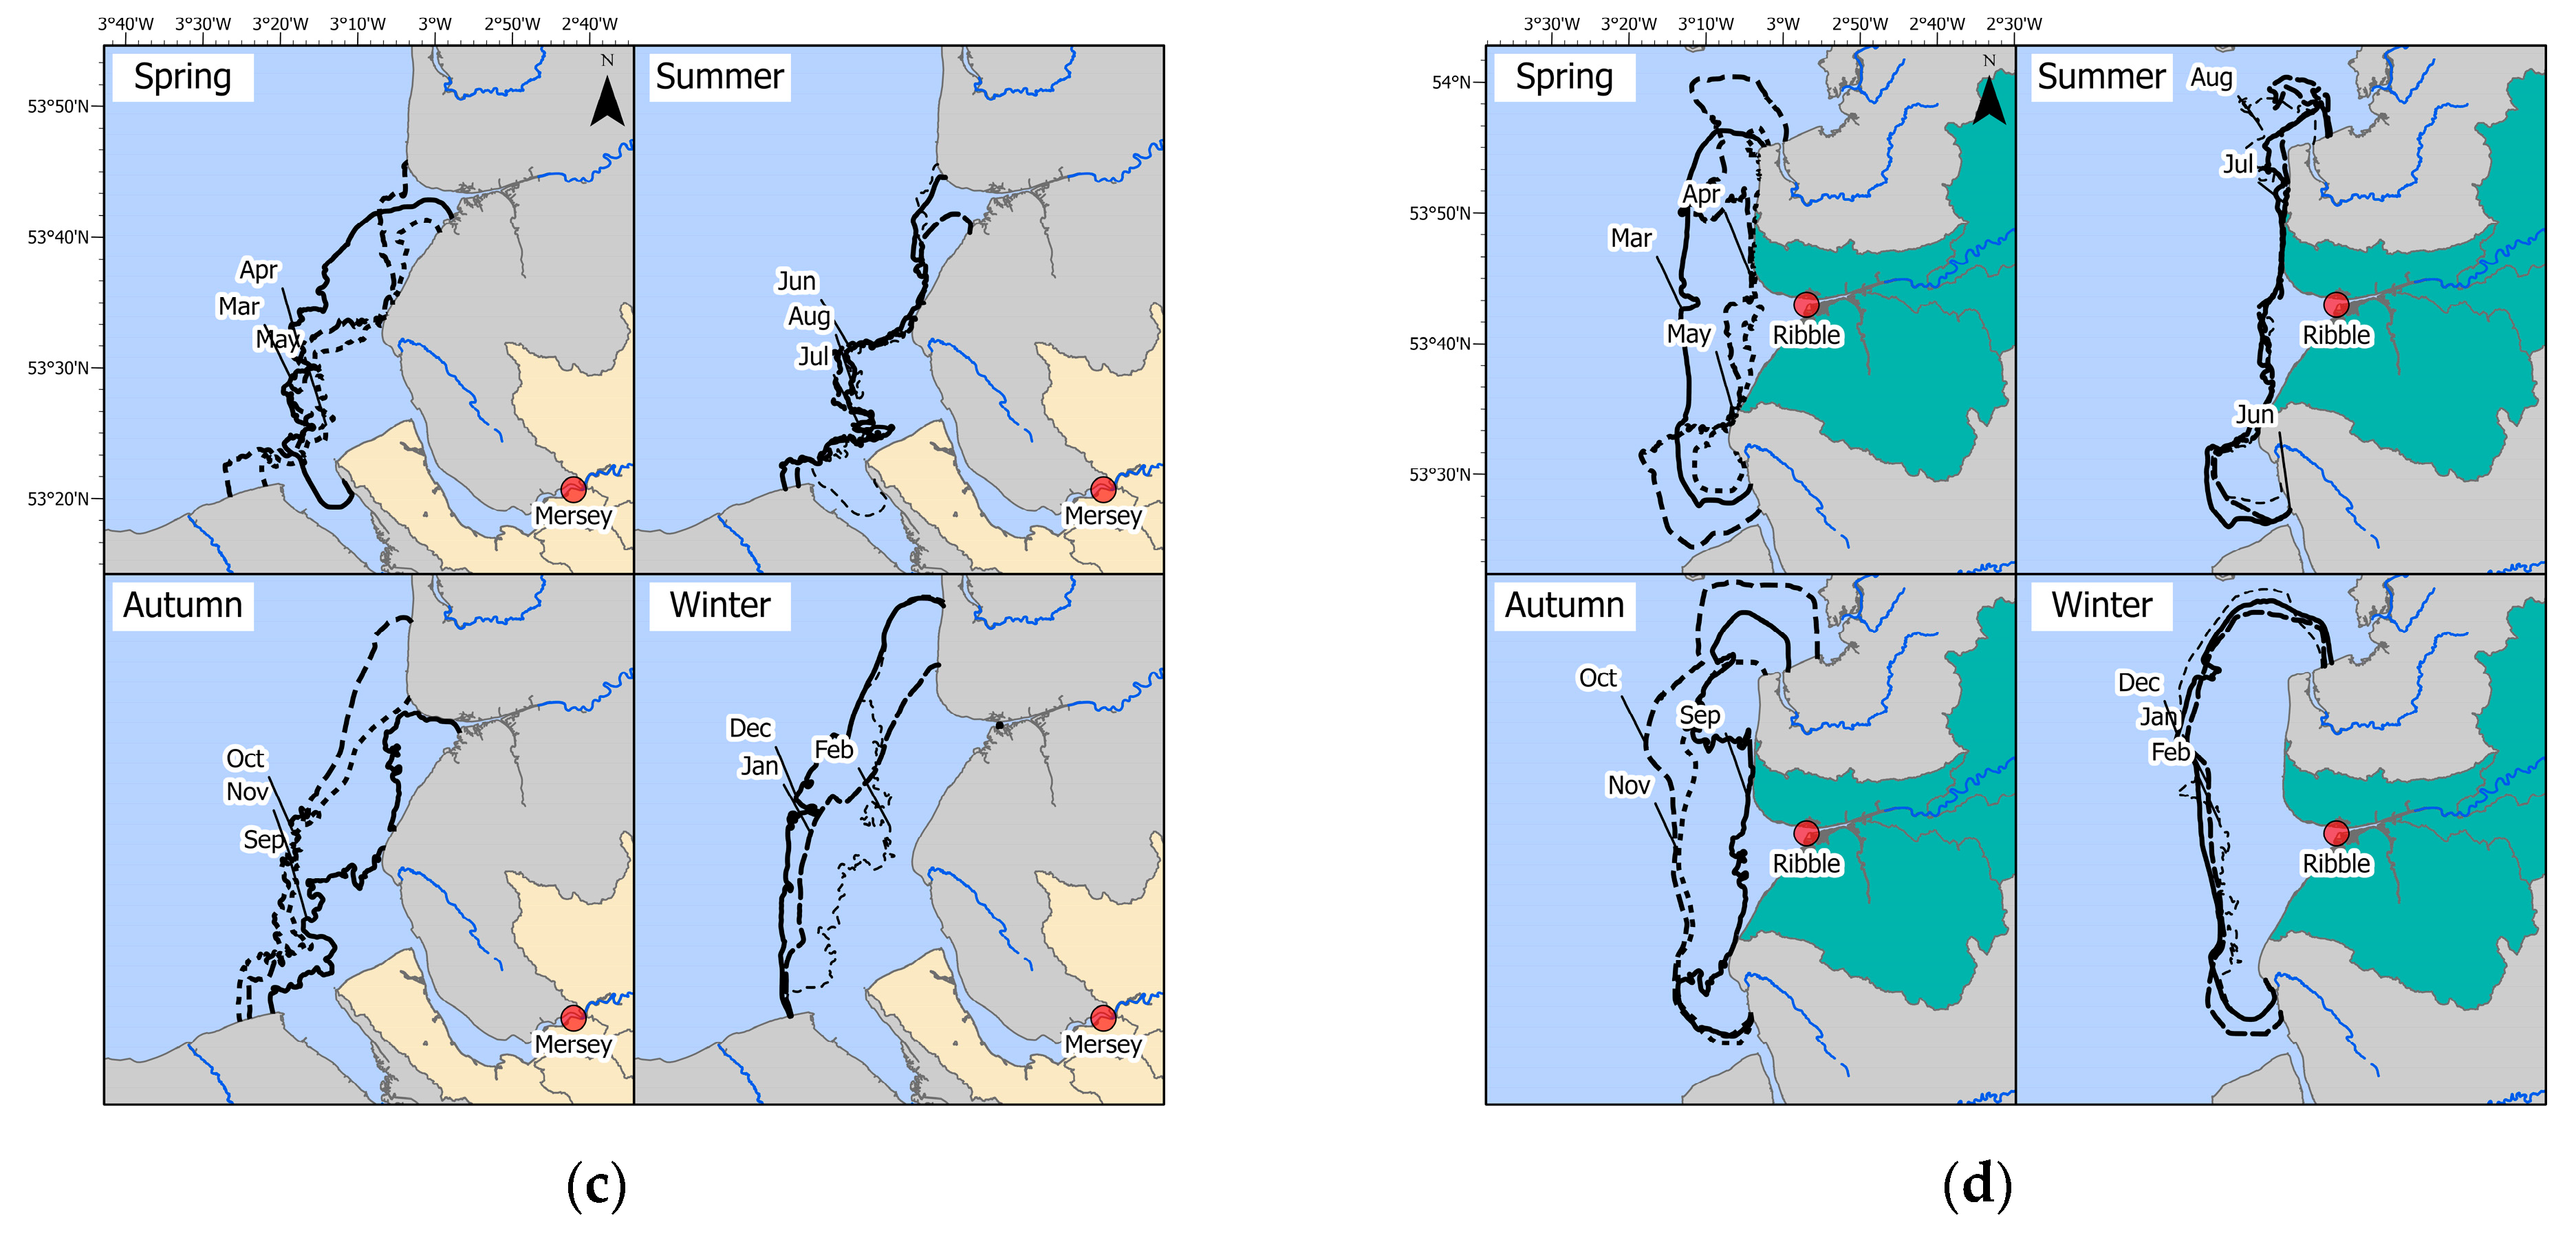
The risk of exposure to DIN from the 12 major rivers was calculated for each month and, using these, a contour line was generated, marking the boundary of the areas of coastal waters adjacent to each river mouth where the likelihood of DIN exposure from that river was 0.75 or above. Example maps for Clwyd, Dee, Mersey, and Ribble are shown in Figure 6, with monthly contour lines plotted for each month within the four seasons. These maps show that, for each river, the greatest exposure risk was local to the estuary mouth and that the exposure risk was greatest in winter, decreasing marginally over autumn, with significant declines in spring and the smallest extent in summer.
For the River Clwyd in summer, the DIN exposure risk was concentrated to the nearshore waters to the east of the mouth of the river, probably reflecting the influence of the residual current direction. During the autumn months, this risk extended further offshore and began to increase along the westerly coast as the level of DIN load from the river increased. This peaked in winter, with a large increase in its extent to the east of the river mouth, at the intersection with the discharge from the River Dee. A similar pattern was observed for the River Dee, although the extent to the east of the river mouth was much larger and the difference to the westerly extent was more pronounced in the summer months. The extent across the easterly and westerly nearshore waters increased through autumn and peaked in December and January. February showed a marked decrease in extent and the risk boundary resembled that observed during the spring months.
The 0.75 risk contour for Ribble was restricted to the nearshore coastal waters north and south of the mouth of the river. This was pronounced during the summer months and extended towards open ocean during the autumn months. In addition, the risk contour moved further north and receded marginally from the extreme southern extent. In contrast to the Clwyd and Dee, November showed the greatest extent and was matched by all of the winter months, including February, during which, no recession of the boundary was observed. Interestingly, the greatest incursion into the Mersey was observed during the spring, particularly during April.
Throughout the year, the 0.75 risk contour for the River Mersey extended into the mouths of the River Dee to the south and the Ribble to the north. The nearshore extent increased significantly north and south along the coast during October and November. Unlike the Rivers Clwyd, Dee, and Ribble, the extent started to recede in January and the most westerly edge moved eastwards. The incursion along the nearshore waters to the west of the mouth of the Dee resumed in the spring.

3.5. Scaling Probabilistic Risk Maps to Reflect the Differing Riverine DIN Discharge Loads

The probabilistic risk maps generated for each river assumed an equal discharge of DIN into the Liverpool Bay area, which is not the case. The DIN loads for each of the 12 major inlets into Liverpool Bay were calculated for the period from 2010 to 2020 (see Section 2.2). The average annual input of DIN from the 12 rivers was 156,181 MT and was greatest in the months from November to March, with totals of 13,988 MT, 22,948 MT, 20,876 MT, and 18,096 MT for November, December, January, and February, respectively (Table 1). The Mersey was the greatest annual contributor of DIN, with a mean annual load of 63,862 MT, followed by the Ribble (25,186 MT), the Dee (24,308 MT), and the Clwyd (13,979 MT).
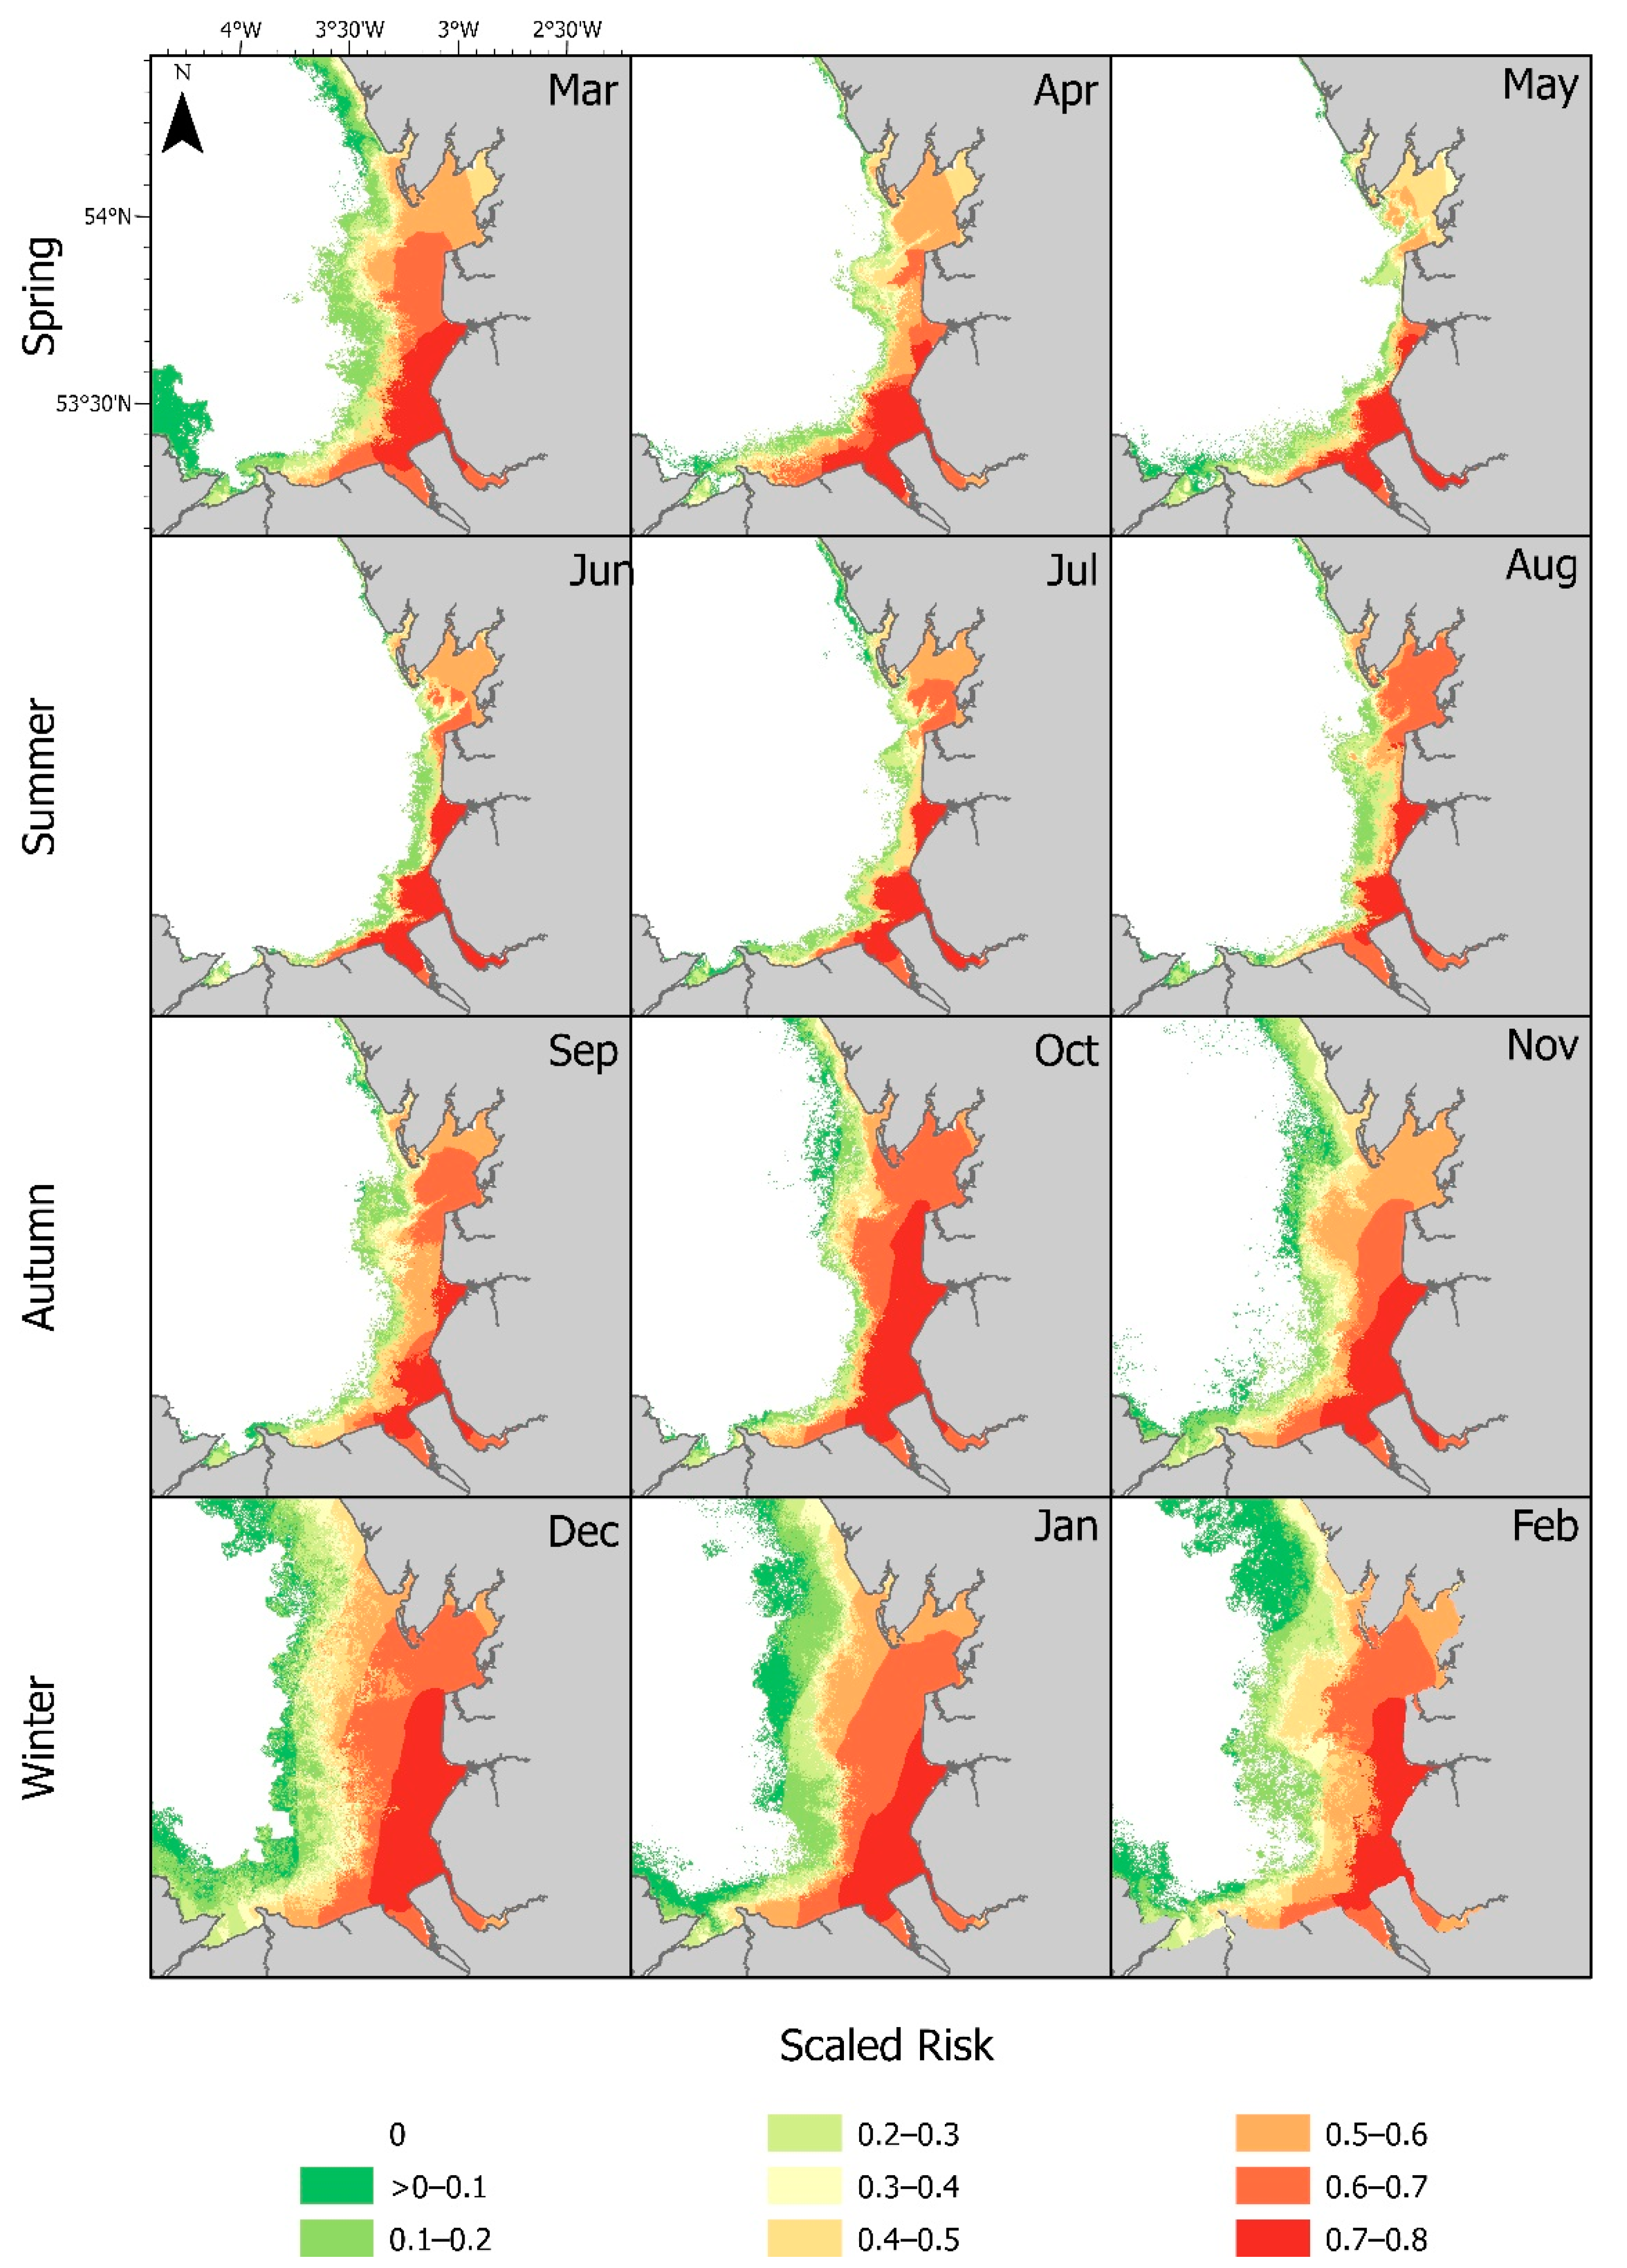
The monthly proportions of DIN entering Liverpool Bay from the river inputs were used to scale the probabilistic river risk maps, which were then summed to obtain the probabilistic total exposure risk to DIN for each calendar month (Figure 7). Due to the distance accumulation source being located at the mouth of the river, the upstream areas of the Rivers Dee, Mersey, and Ribble showed a moderate decrease in their scaled risk to DIN due to a processing artefact. Aside from this, the maps aligned closely with the non-cohesive sediment distribution map generated using a hydrodynamic model by Huang et al., 2015, and revealed that the estuarine regions of the Dee, Mersey, and Ribble, along with near-shore coastal areas from the Dee estuary to Colwyn Bay, around Taylors Bank and Horse Bank, had the greatest probability of DIN exposure during the year. The DIN exposure risk changed throughout the year. For example, the risk remained high throughout the year for the Mersey and Dee estuarine regions, but decreased in April and May for the mouth of the Ribble, and remained low along the near-shore Blackpool coast and Shell Flat between April and September, before increasing between October and February. By using river probability maps (Supplementary Materials Figure S5) and maps of the percentage of DIN risk from each river (Supplementary Materials Figure S6), we were able to resolve the rivers contributing to these observed effects. For example, the change in risk for the Ribble mouth and Shell Flat was due to discharge from the rivers Wyre and Mersey. Changes in the risk pattern along the Blackpool near-shore were predominantly due to discharge from the Ribble and the Wyre.

3.6. Annual Exposure Risk to DIN in Liverpool Bay

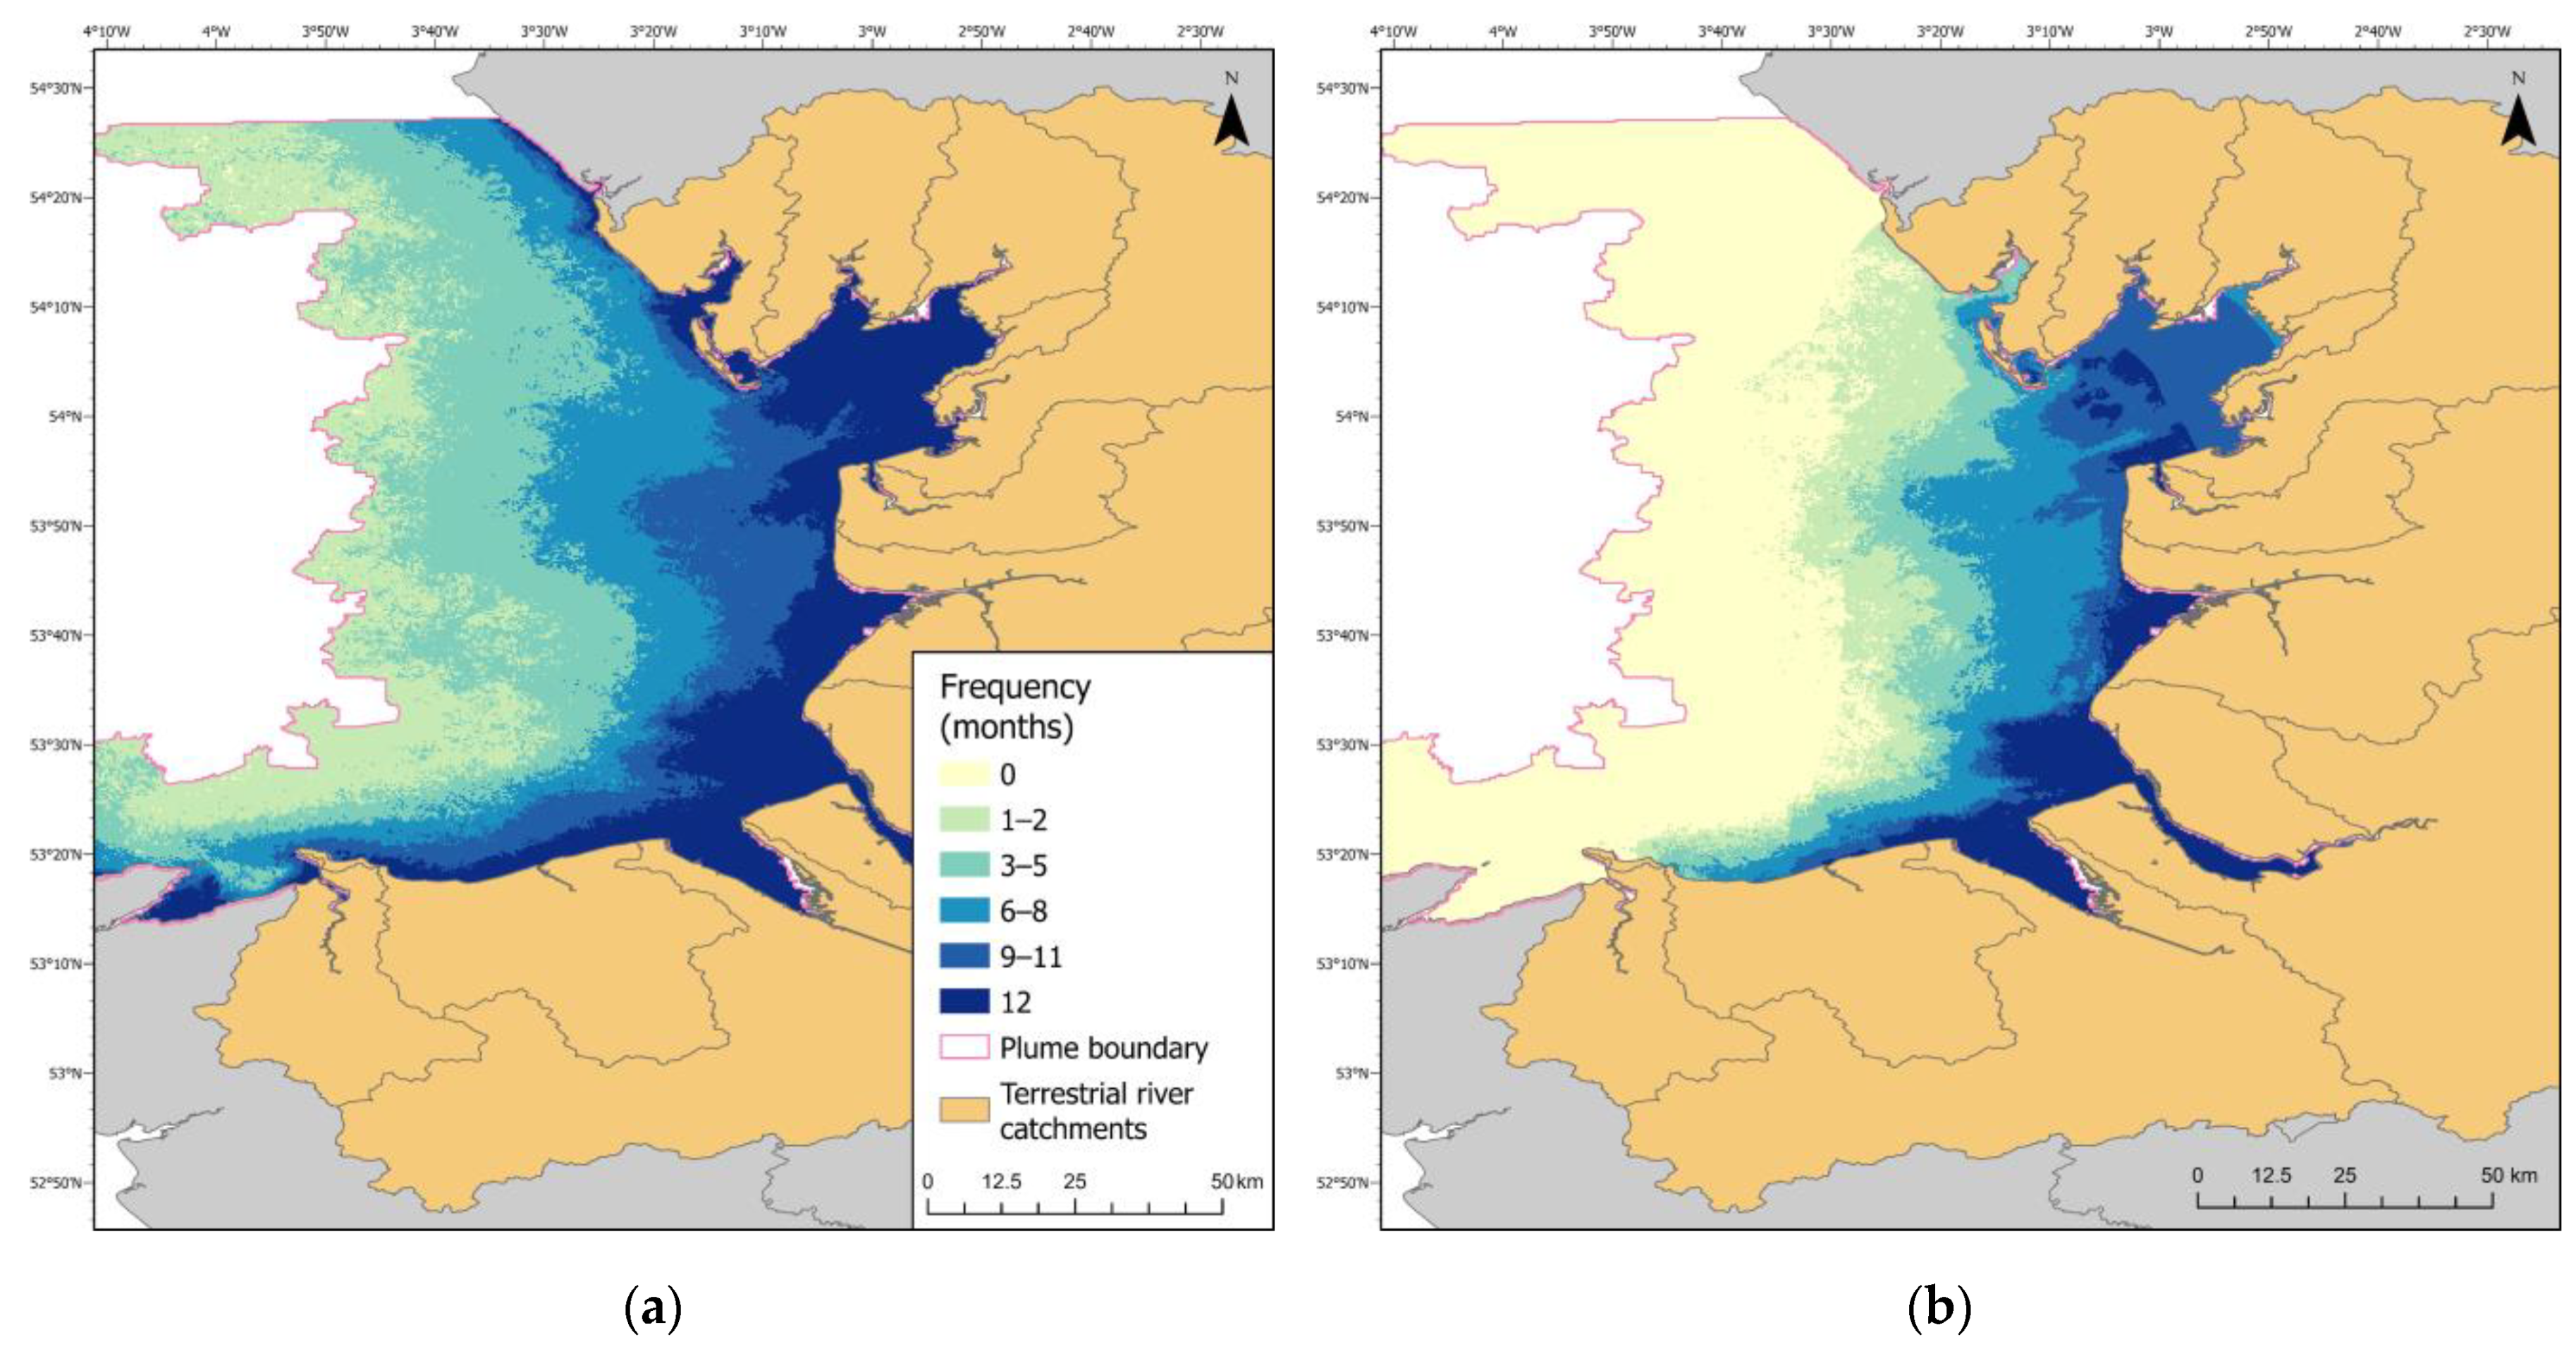
Using the monthly DIN exposure risk maps, the frequency that a grid cell was exposed to the risk of DIN exposure was determined. For example, if a location had a risk exposure value above 0 for 3 months of the year, then this cell was given a frequency value of 0.25. The frequency was stratified into classes for no exposure, exposure every month, and exposure for 9 to 11 months, 6 to 8 months, 3 to 5 months, and 1 to 2 months. This was performed for any monthly DIN risk (Figure 8a) and only for monthly risk frequencies greater than 0.5 (Figure 8b).
There was a constant DIN exposure risk throughout the year for all the nearshore waters along the Liverpool Bay coastline. However, the scale of this risk differed, with a constant risk level above 0.5 only observed in the mouths of the Rivers Ribble, Dee, and Mersey, and the nearshore regions connecting these river mouths. Interestingly, the area of risk with a frequency of 9–11 months was much lower than that for 6–8 months, or for all 12 months, both for all risks, and solely for risk levels above 0.5 (Table 2). This is consistent with the observations in Section 3.4, showing the risk contours for the major rivers.

4. Discussion

Riverine inputs to the ocean are a major contributor of freshwater, along with transported substances such as nutrients, heavy metals, plastics, microbes, and other substances of concern [49]. Monitoring programmes to assess the quality of coastal zone waters, typically for bathing or shellfish hygiene, often use low-frequency, in situ measurements, usually sampled close to the shoreline, to indicate the status of the water with respect to threshold levels of pollutants [31,50,51,52]. Whilst these methods consider the directly observed measurements of the pollutant of concern, there is concern over the representativeness of such point data, especially in a turbulent environment [33]. In contrast, hydrodynamic models can be used to provide a detailed representation of the fate of advected material in estuarine and coastal regions [53,54,55]. In shallow ROFI such as Liverpool Bay, these models rely on a complex set of forcing parameters, including wind speed and direction, sporadic and highly variable discharges and pollutant loads from the river sources, and shallow waters with strong tidal influences [47,56]. Such approaches inevitably involve a simplification of the processes and complexity, thereby placing limits on their ability to hindcast and forecast [57]. Furthermore, model validation relies on a comprehensive range of ground-truth data that is seldom available [54], and often these complex models are used for river basin management without due consideration of their limitations [57].
In this paper, we presented a probabilistic approach to the spatial mapping of the advected dissolved inorganic nitrogen (DIN) from the riverine inputs to Liverpool Bay, which coupled remote sensing data with distance accumulation methodology. Our approach was based on [58], which used ocean colour data derived from MODIS-Aqua true-color satellite data to model the DIN and sediment transported in the river plume from seven rivers discharging into the Great Barrier Reef (GBR), Australia. In our case, the individual extents of the plumes from the 12 rivers discharging into the Liverpool Bay region were unavailable, likely due to the complex nature of the currents within Liverpool Bay and difficulty in locating and apportioning the low-salinity water to each river across the entire bay [48,59]. Therefore, a novel method was devised using a probabilistic approach to define the likelihoods of river plume presence, freshwater input from each river, and the presence of DIN. Moreover, we used ocean-colour classes based on the FUI Forel-Ule index scale, consisting of 21 colour classes. Álvarez-Romero et al., 2013 [58], used six colour classes; therefore, the remote sensing data used in our study should provide a better resolution of the differences in DIN levels. Both approaches represent a compromise between observational modelling with limited empirical data and complex hydrodynamic modelling [60]. They both use large-extent empirical data to determine river plume boundary and composition, and both adopt a structured approach that can be used to apportion the source material within a plume. Whilst the approach described in this paper has the benefit of being applicable to other plumes where the extent is unknown, it is limited to only producing a likelihood of DIN being present, without indicating any scale of the level of DIN.
The application of remote sensing to the generation of large-scale observational data (for example for sea surface temperature) is commonplace, and has been suggested as a means of providing observational data for hydrodynamic model validation [33]. By using remote sensing data, one ensures the realisation of a large spatial and temporal extent: in this study, data from nearly 8500 km2 were used at a monthly frequency over a 5-year period. Moreover, remote sensing data offer the opportunity for the near real-time estimation of the water quality across a river plume. However, it is important to note that the use of such data only considers the water surface layer and, therefore, information within the water column is absent. Furthermore, the use of satellite-derived ocean colour to estimate the concentration of a component can be straightforward when the component is optically active [61,62], but in our case, the ocean-colour acted as a proxy for the DIN concentration and, therefore, represents an estimation of the concentration. Whilst a strong correlation between ocean colour and DIN concentration was observed in our study and elsewhere [29,58], it is not a direct measure of this concentration, and could be influenced by the varying presence of coloured dissolved organic matter or coloured sediments. To mitigate this, the correlation between the local in situ DIN concentrations and the corresponding derived FUI was used, along with a normalised function mapping of the FUI value with a relative level of DIN. Ocean colour has been used routinely for mapping phytoplankton blooms, sediment [63], and CDOM [64,65], and future work will expand the process outlined here to map these components.
Understanding the nature of riverine input is an important tool for the prioritisation of remedial actions and mitigation measures [58,60,66]. Using a similar approach to the one adopted here, Devlin et al., 2012 [67], were able to map the contribution of individual rivers to the DIN and Total Suspended Sediment (TSS) pollution on the GBR. This enabled source apportionment to the land-use practices within the catchments of the rivers, and provided evidence to direct and prioritise mitigation strategies. In our study, the risk of DIN exposure along the north Wales coast was predominantly influenced by the Rivers Clwyd, Conwy, and Dee, the latter having a significant contribution; the River Dee contributed 66% and 58% of the cumulative risk in summer and winter, respectively, compared to 33% and 41% for the River Clwyd, and less than 1% for the River Conwy (Supplementary Materials Table S2). This would indicate a high priority for mitigation measures to reduce DIN risk. In future, it is envisaged that, by coupling our approach to catchment-based models, such as the Soil and Water Assessment Tool (SWAT) [67], the identification of the major sources of anthropogenic DIN will enable the prioritisation of land management practice changes to reduce the risk of high DIN loading. In a study in 2015, impacts on the coastal environment of land-based solutions to conserve terrestrial ecosystems in catchments discharging into the Gulf of California were assessed [58]. They were able to prioritise land management strategies and show the trade-off between conversation and coastal zone impact.
Recent work [31] has shown the benefit of the integration of eutrophication condition indicators obtained from different directives using a variety of data sources, including remote sensing, ecosystem models, and freshwater inputs. Currently, the monitoring and assessment of the nutrient and plankton dynamics within coastal/estuarine environments sit as an end point for WFD assessments and the initiation point for OSPAR assessments. The complex hydrodynamics of coastal zones, coupled with variable intermittent and high-volume inputs, indicate that these regions warrant a separate, but integrated, assessment and monitoring process to fully understand the impacts of nutrient enrichment on UK coastal waters. The results of this study provide a tool to map the risk of DIN in plume-influenced waters, adding value to both nearshore WFR assessments and assessments of plume-influenced areas under OSPAR and the UK Marine Strategy. At different times of year, contributing river catchments experience different weather and nutrient inputs (diffuse and point source); therefore, their contributions to the water quality within combined river plumes vary. Understanding these relationships and resolving the source apportionment could lead to strategies for remediating specific coastal water quality issues, by targeting the contributing rivers and quantifying the influence of these rivers and their associated catchment activities on the marine environment. Knowledge of which rivers influence which locations, and by how much, can provide valuable information for the prioritisation of targeted mitigation measures to improve the ecological health of UK coastal and marine waters.

5. Conclusions

The coastal zone in Liverpool Bay is a complex setting with varied inputs of freshwater and advected compounds from the land undergoing mixing with seawater. This mixing is heavily influenced by tidal conditions and the volume and condition of the freshwater loads. This produces a temporally and spatially diverse environment, causing problems in the assessment of the pollutant loading in this zone, since it is insufficient to simply consider the riverine and open sea inputs in isolation. As shown in this study, the transport and distribution of transported material is variable, producing “hot spots” with increased contamination at different locations during different times of the year. Using a probabilistic approach with satellite-derived ocean-colour data, we attempted to resolve this issue by considering the temporal and spatial distribution of DIN within the Liverpool Bay coastal zone, providing an additional evidence base for assessment methods. Adopting a structured approach starting at the river catchment level facilitated the source apportionment of the DIN risk exposure map, with the potential of linking it to land-based catchment models. At present, the use of satellite products in the current approach limits the assessment of surface waters in coastal zones. Fundamentally, any dataset with estimated DIN concentrations could be used, provided it has a sufficiently large spatial extent. Therefore, the approach can be adapted when new data become available. Future work will attempt to generate a composite in situ map at a large spatial extent, to validate the DIN probability maps and as a potential dataset to underpin the approach.

Supplementary Materials

The following supporting information can be downloaded at: https://www.mdpi.com/article/10.3390/rs15143666/s1, ProbabilisticPlumeMapping_RemoteSensing.doc containing Figure S1, Residual current maps for Liverpool Bay; Figure S2.1, Map of the water quality sample locations extracted from the UK Environment Agency and ICES monitoring programmes; Figure S2.2, Correlation of Forel-Ule value and nutrient concentrations; Figure S3, Liverpool Bay river plume monthly frequency maps; Figure S4, Cost surface maps for DIN in the Liverpool Bay plume; Figure S5, Riverine DIN input as a percentage of the cumulative DIN risk; Figure S6, Spatial maps of the percentage of the cumulative probability that water from a river reaches a location within the study area river plume; Table S1, Source of in situ data for river flow and nutrient inputs for rivers inputting into the Liverpool Bay study area; Table S2, Contribution of Conwy, Clwyd and Dee to the DIN exposure risk along the north Wales coast.

Author Contributions

Conceptualization, R.H. (Richard Heal) and M.J.D.; methodology, R.H. (Richard Heal); formal analysis, R.H. (Richard Heal), L.F., T.S. and R.H. (Richard Harrod); data curation, K.C.; writing—original draft preparation, R.H. (Richard Heal), M.J.D. and N.G.; writing—review and editing, R.H. (Richard Heal), L.F., M.J.D. and N.G. All authors have read and agreed to the published version of the manuscript.

Funding

This research was funded by the Department for Environment, Food and Rural Affairs (Defra) as part of the marine arm of the Natural Capital and Ecosystem Assessment (NCEA) programme. The marine NCEA programme is leading the way in supporting Government ambition to integrate natural capital approaches into decision making for the marine environment. Find out more at https://www.gov.uk/government/publications/natural-capital-and-ecosystem-assessment-programme.

Data Availability Statement

Data used in the calculation of the residual current direction were downloaded from Copernicus (cmems_mod_nws_phy-uv_my_7km-3D_P1M m dataset; https://doi.org/10.48670/moi-00059) from https://data.marine.copernicus.eu/product/NWSHELF_MULTIYEAR_PHY_004_009/download (accessed on 8 October 2022). Details on the derivation of FUI using Sentinel-3, including coding scripts can be found in the GitHub repository https://github.com/CefasRepRes/FUME.git. Coding scripts and markdown documents used to generate the normalized cost surfaces can be found in the GitHub repository https://github.com/CefasRepRes/Probabilistic_Nutrient_Mapping_LiverpoolBay.git.

Acknowledgments

The authors would like to acknowledge Paulette Posen for advice, support and manuscript checking prior to submission.

Conflicts of Interest

The authors declare no conflict of interest. The funders had no role in the design of the study; in the collection, analyses, or interpretation of data; in the writing of the manuscript; or in the decision to publish the results.

References

  1. Paerl, H.W. Assessing and Managing Nutrient-Enhanced Eutrophication in Estuarine and Coastal Waters: Interactive Effects of Human and Climatic Perturbations. Ecol. Eng. 2006, 26, 40–54. [Google Scholar] [CrossRef]
  2. Billen, G.; Garnier, J.; Némery, J.; Sebilo, M.; Sferratore, A.; Barles, S.; Benoit, P.; Benoît, M. A Long-Term View of Nutrient Transfers through the Seine River Continuum. Sci. Total Environ. 2007, 375, 80–97. [Google Scholar] [CrossRef] [PubMed]
  3. Bricker, S.B.; Longstaff, B.; Dennison, W.; Jones, A.; Boicourt, K.; Wicks, C.; Woerner, J. Effects of Nutrient Enrichment in the Nation’s Estuaries: A Decade of Change. Harmful Algae 2008, 8, 21–32. [Google Scholar] [CrossRef]
  4. Paerl, H.W. Controlling Eutrophication along the Freshwater–Marine Continuum: Dual Nutrient (N and P) Reductions Are Essential. Estuaries Coasts 2009, 32, 593–601. [Google Scholar] [CrossRef] [Green Version]
  5. Wurtsbaugh, W.A.; Paerl, H.W.; Dodds, W.K. Nutrients, Eutrophication and Harmful Algal Blooms along the Freshwater to Marine Continuum. WIREs Water 2019, 6, e1373. [Google Scholar] [CrossRef]
  6. Hantoro, I.; Löhr, A.J.; Van Belleghem, F.G.A.J.; Widianarko, B.; Ragas, A.M.J. Microplastics in Coastal Areas and Seafood: Implications for Food Safety. Food Addit. Contam. Part A 2019, 36, 674–711. [Google Scholar] [CrossRef]
  7. Zhang, M.; Sun, X.; Xu, J. Heavy Metal Pollution in the East China Sea: A Review. Mar. Pollut. Bull. 2020, 159, 111473. [Google Scholar] [CrossRef]
  8. Macdonald, A.M.; Edwards, A.C.; Pugh, K.B.; Balls, P.W. Soluble Nitrogen and Phosphorus in the River Ythan System, U.K.: Annual and Seasonal Trends. Water Res. 1995, 29, 837–846. [Google Scholar] [CrossRef]
  9. Bowes, M.J.; Smith, J.T.; Neal, C.; Leach, D.V.; Scarlett, P.M.; Wickham, H.D.; Harman, S.A.; Armstrong, L.K.; Davy-Bowker, J.; Haft, M.; et al. Changes in Water Quality of the River Frome (UK) from 1965 to 2009: Is Phosphorus Mitigation Finally Working? Sci. Total Environ. 2011, 409, 3418–3430. [Google Scholar] [CrossRef] [PubMed]
  10. Bowes, M.J.; Palmer-Felgate, E.J.; Jarvie, H.P.; Loewenthal, M.; Wickham, H.D.; Harman, S.A.; Carr, E. High-Frequency Phosphorus Monitoring of the River Kennet, UK: Are Ecological Problems Due to Intermittent Sewage Treatment Works Failures? J. Environ. Monit. 2012, 14, 3137. [Google Scholar] [CrossRef] [Green Version]
  11. Vane, C.H.; Kim, A.W.; Lopes Dos Santos, R.A.; Moss-Hayes, V. Contrasting Sewage, Emerging and Persistent Organic Pollutants in Sediment Cores from the River Thames Estuary, London, England, UK. Mar. Pollut. Bull. 2022, 175, 113340. [Google Scholar] [CrossRef] [PubMed]
  12. Johnstone, D.; Horan, N. Institutional Developments, Standards and River Quality: A UK History and Some Lessons for Industrialising Countries. Water Sci. Technol. 1996, 33, 211–222. [Google Scholar] [CrossRef]
  13. Skinner, J.A.; Lewis, K.A.; Bardon, K.S.; Tucker, P.; Catt, J.A.; Chambers, B.J. An Overview of the Environmental Impact of Agriculture in the U.K. J. Environ. Manag. 1997, 50, 111–128. [Google Scholar] [CrossRef] [Green Version]
  14. Withers, P.J.A.; Lord, E.I. Agricultural Nutrient Inputs to Rivers and Groundwaters in the UK: Policy, Environmental Management and Research Needs. Sci. Total Environ. 2002, 282–283, 9–24. [Google Scholar] [CrossRef]
  15. Moss, B. Water Pollution by Agriculture. Philos. Trans. Biol. Sci. 2008, 363, 659–666. [Google Scholar] [CrossRef] [PubMed] [Green Version]
  16. Burgan, H.I.; Icaga, Y.; Bostanoglu, Y.; Kilit, M. Water Quality Tendency of Akarçay River between 2006–2011. Pamukkale J. Eng. Sci. 2013, 19, 127–132. [Google Scholar] [CrossRef]
  17. Collins, A.L.; McGonigle, D.F. Monitoring and Modelling Diffuse Pollution from Agriculture for Policy Support: UK and European Experience. Environ. Sci. Policy 2008, 11, 97–101. [Google Scholar] [CrossRef]
  18. Devlin, M.; Brodie, J. Nutrients and Eutrophication. In Marine Pollution—Monitoring, Management and Mitigation; Reichelt-Brushett, A., Ed.; Springer Textbooks in Earth Sciences, Geography and Environment; Springer Nature: Cham, Switzerland, 2023; pp. 75–100. ISBN 978-3-031-10126-7. [Google Scholar]
  19. Withers, P.; Neal, C.; Jarvie, H.; Doody, D. Agriculture and Eutrophication: Where Do We Go from Here? Sustainability 2014, 6, 5853–5875. [Google Scholar] [CrossRef] [Green Version]
  20. Ulén, B.; Bechmann, M.; Fölster, J.; Jarvie, H.P.; Tunney, H. Agriculture as a Phosphorus Source for Eutrophication in the North-West European Countries, Norway, Sweden, United Kingdom and Ireland: A Review. Soil Use Manag. 2007, 23, 5–15. [Google Scholar] [CrossRef]
  21. Jarvie, H.P.; Neal, C.; Withers, P.J.A. Sewage-Effluent Phosphorus: A Greater Risk to River Eutrophication than Agricultural Phosphorus? Sci. Total Environ. 2006, 360, 246–253. [Google Scholar] [CrossRef]
  22. Neal, C.; Jarvie, H.P.; Withers, P.J.A.; Whitton, B.A.; Neal, M. The Strategic Significance of Wastewater Sources to Pollutant Phosphorus Levels in English Rivers and to Environmental Management for Rural, Agricultural and Urban Catchments. Sci. Total Environ. 2010, 408, 1485–1500. [Google Scholar] [CrossRef] [PubMed]
  23. Dagg, M.; Benner, R.; Lohrenz, S.; Lawrence, D. Transformation of Dissolved and Particulate Materials on Continental Shelves Influenced by Large Rivers: Plume Processes. Cont. Shelf Res. 2004, 24, 833–858. [Google Scholar] [CrossRef]
  24. Horner-Devine, A.R.; Hetland, R.D.; MacDonald, D.G. Mixing and Transport in Coastal River Plumes. Annu. Rev. Fluid Mech. 2015, 47, 569–594. [Google Scholar] [CrossRef]
  25. Devlin, M.; Petus, C.; Da Silva, E.; Tracey, D.; Wolff, N.; Waterhouse, J.; Brodie, J. Water Quality and River Plume Monitoring in the Great Barrier Reef: An Overview of Methods Based on Ocean Colour Satellite Data. Remote Sens. 2015, 7, 12909–12941. [Google Scholar] [CrossRef] [Green Version]
  26. Osadchiev, A.; Zavialov, P. Structure and Dynamics of Plumes Generated by Small Rivers. In Estuaries and Coastal Zones—Dynamics and Response to Environmental Changes; Pan, J., Devlin, A., Eds.; IntechOpen: London, UK, 2020; ISBN 978-1-78985-579-1. [Google Scholar]
  27. Fournier, S.; Lee, T. Seasonal and Interannual Variability of Sea Surface Salinity Near Major River Mouths of the World Ocean Inferred from Gridded Satellite and In-Situ Salinity Products. Remote Sens. 2021, 13, 728. [Google Scholar] [CrossRef]
  28. Environment Agency. River Basin Planning: Progress Report. Available online: https://www.gov.uk/government/publications/river-basin-planning-progress-report/river-basin-planning-progress-report (accessed on 25 May 2023).
  29. Fronkova, L.; Greenwood, N.; Martinez, R.; Graham, J.A.; Harrod, R.; Graves, C.A.; Devlin, M.J.; Petus, C. Can Forel–Ule Index Act as a Proxy of Water Quality in Temperate Waters? Application of Plume Mapping in Liverpool Bay, UK. Remote Sens. 2022, 14, 2375. [Google Scholar] [CrossRef]
  30. Álvarez-Romero, J.G.; Devlin, M.; Teixeira Da Silva, E.; Petus, C.; Ban, N.C.; Pressey, R.L.; Kool, J.; Roberts, J.J.; Cerdeira-Estrada, S.; Wenger, A.S.; et al. A Novel Approach to Model Exposure of Coastal-Marine Ecosystems to Riverine Flood Plumes Based on Remote Sensing Techniques. J. Environ. Manag. 2013, 119, 194–207. [Google Scholar] [CrossRef] [Green Version]
  31. Greenwood, N.; Devlin, M.J.; Best, M.; Fronkova, L.; Graves, C.A.; Milligan, A.; Barry, J.; Van Leeuwen, S.M. Utilizing Eutrophication Assessment Directives From Transitional to Marine Systems in the Thames Estuary and Liverpool Bay, UK. Front. Mar. Sci. 2019, 6, 116. [Google Scholar] [CrossRef] [Green Version]
  32. Polton, J.A.; Palmer, M.R.; Howarth, M.J. Physical and Dynamical Oceanography of Liverpool Bay. Ocean. Dyn. 2011, 61, 1421–1439. [Google Scholar] [CrossRef]
  33. Sánchez-Arcilla, A.; Wolf, J.; Monbaliu, J. Oceanography at Coastal Scales: Introduction to the Special Issue on Results from the EU FP7 FIELD_AC Project. Cont. Shelf Res. 2014, 87, 1–6. [Google Scholar] [CrossRef]
  34. Littlewood, I. Estimating Contaminant Loads in Rivers: A Review; IH Report, Report number 117; Institute of Hydrology: Wallingford, UK, 1992. [Google Scholar]
  35. Garaba, S.; Friedrichs, A.; Voß, D.; Zielinski, O. Classifying Natural Waters with the Forel-Ule Colour Index System: Results, Applications, Correlations and Crowdsourcing. Int. J. Environ. Res. Public Health 2015, 12, 16096–16109. [Google Scholar] [CrossRef] [Green Version]
  36. Van Der Woerd, H.J.; Wernand, M. True Colour Classification of Natural Waters with Medium-Spectral Resolution Satellites: SeaWiFS, MODIS, MERIS and OLCI. Sensors 2015, 15, 25663–25680. [Google Scholar] [CrossRef] [Green Version]
  37. Pitarch, J.; Van Der Woerd, H.J.; Brewin, R.J.W.; Zielinski, O. Optical Properties of Forel-Ule Water Types Deduced from 15 Years of Global Satellite Ocean Color Observations. Remote Sens. Environ. 2019, 231, 111249. [Google Scholar] [CrossRef]
  38. Stockman, A. CIE Physiologically Based Color Matching Functions and Chromaticity Diagrams. In Encyclopedia of Color Science and Technology; Luo, M.R., Ed.; Springer: New York, NY, USA, 2016; pp. 165–173. ISBN 978-1-4419-8070-0. [Google Scholar]
  39. Van Der Woerd, H.; Wernand, M. Hue-Angle Product for Low to Medium Spatial Resolution Optical Satellite Sensors. Remote Sens. 2018, 10, 180. [Google Scholar] [CrossRef] [Green Version]
  40. Petus, C.; Waterhouse, J.; Lewis, S.; Vacher, M.; Tracey, D.; Devlin, M. A Flood of Information: Using Sentinel-3 Water Colour Products to Assure Continuity in the Monitoring of Water Quality Trends in the Great Barrier Reef (Australia). J. Environ. Manag. 2019, 248, 109255. [Google Scholar] [CrossRef] [PubMed]
  41. Verspecht, F.; Rippeth, T.P.; Simpson, J.H.; Souza, A.J.; Burchard, H.; Howarth, M.J. Residual Circulation and Stratification in the Liverpool Bay Region of Freshwater Influence. Ocean. Dyn. 2009, 59, 765–779. [Google Scholar] [CrossRef]
  42. R Core Team. R: A Language and Environment for Statistical Computing. R Foundation for Statistical Computing, Vienna, Austria. 2021. Available online: https://www.R-Project.Org/ (accessed on 1 March 2023).
  43. Hijmans, R.J. Raster: Geographic Data Analysis and Modeling. 2021. Available online: https://CRAN.R-project.org/package=raster (accessed on 1 March 2023).
  44. Bivand, R.; Keitt, T.; Rowlingson, B. Rgdal: Bindings for the “Geospatial” Data Abstraction Library. 2021. Available online: https://CRAN.R-project.org/package=rgdal (accessed on 1 March 2023).
  45. Sievert, C. Interactive Web-Based Data Visualization with R, Plotly, and Shiny; Chapman and Hall/CRC: Boca Raton, FL, USA, 2020; ISBN 978-1-138-33145-7. [Google Scholar]
  46. Verspecht, F.; Rippeth, T.P.; Howarth, M.J.; Souza, A.J.; Simpson, J.H.; Burchard, H. Processes Impacting on Stratification in a Region of Freshwater Influence: Application to Liverpool Bay. J. Geophys. Res. 2009, 114, C11022. [Google Scholar] [CrossRef] [Green Version]
  47. Howarth, M.J.; Balfour, C.A.; Player, R.J.J.; Polton, J.A. Assessment of Coastal Density Gradients near a Macro-Tidal Estuary: Application to the Mersey and Liverpool Bay. Cont. Shelf Res. 2014, 87, 73–83. [Google Scholar] [CrossRef]
  48. Sharples, J.; Middelburg, J.J.; Fennel, K.; Jickells, T.D. What Proportion of Riverine Nutrients Reaches the Open Ocean? Riverine Nutrients Reaching the Ocean. Glob. Biogeochem. Cycles 2017, 31, 39–58. [Google Scholar] [CrossRef] [Green Version]
  49. Allan, I.; Vrana, B.; Greenwood, R.; Mills, G.; Roig, B.; Gonzalez, C. A “Toolbox” for Biological and Chemical Monitoring Requirements for the European Union’s Water Framework Directive. Talanta 2006, 69, 302–322. [Google Scholar] [CrossRef] [PubMed]
  50. Bean, T.P.; Greenwood, N.; Beckett, R.; Biermann, L.; Bignell, J.P.; Brant, J.L.; Copp, G.H.; Devlin, M.J.; Dye, S.; Feist, S.W.; et al. A Review of the Tools Used for Marine Monitoring in the UK: Combining Historic and Contemporary Methods with Modeling and Socioeconomics to Fulfill Legislative Needs and Scientific Ambitions. Front. Mar. Sci. 2017, 4, 263. [Google Scholar] [CrossRef] [Green Version]
  51. Wu, M.-L.; Wang, Y.-S.; Sun, C.-C.; Wang, H.; Dong, J.-D.; Yin, J.-P.; Han, S.-H. Identification of Coastal Water Quality by Statistical Analysis Methods in Daya Bay, South China Sea. Mar. Pollut. Bull. 2010, 60, 852–860. [Google Scholar] [CrossRef] [PubMed]
  52. Statham, P.J. Nutrients in Estuaries—An Overview and the Potential Impacts of Climate Change. Sci. Total Environ. 2012, 434, 213–227. [Google Scholar] [CrossRef]
  53. Tong, X.; Mohapatra, S.; Zhang, J.; Tran, N.H.; You, L.; He, Y.; Gin, K.Y.-H. Source, Fate, Transport and Modelling of Selected Emerging Contaminants in the Aquatic Environment: Current Status and Future Perspectives. Water Res. 2022, 217, 118418. [Google Scholar] [CrossRef] [PubMed]
  54. Uzun, P.; Farazande, S.; Guven, B. Mathematical Modeling of Microplastic Abundance, Distribution, and Transport in Water Environments: A Review. Chemosphere 2022, 288, 132517. [Google Scholar] [CrossRef] [PubMed]
  55. Xing, J.; Chen, S. A Process Study of the Interaction of Tidal Currents, Tidal Mixing and Density Gradients in a Region of Freshwater Influence. J. Mar. Syst. 2017, 172, 51–63. [Google Scholar] [CrossRef]
  56. Falconer, R.; Lin, B.; Harpin, R. Environmental Modelling in River Basin Management. Int. J. River Basin Manag. 2005, 3, 169–184. [Google Scholar] [CrossRef]
  57. Álvarez-Romero, J.G.; Pressey, R.L.; Ban, N.C.; Brodie, J. Advancing Land-Sea Conservation Planning: Integrating Modelling of Catchments, Land-Use Change, and River Plumes to Prioritise Catchment Management and Protection. PLoS ONE 2015, 10, e0145574. [Google Scholar] [CrossRef] [Green Version]
  58. O’Neill, C.K.; Polton, J.A.; Holt, J.T.; O’Dea, E.J. Modelling Temperature and Salinity in Liverpool Bay and the Irish Sea: Sensitivity to Model Type and Surface Forcing. Ocean Sci. 2012, 8, 903–913. [Google Scholar] [CrossRef]
  59. Wolff, N.H.; Da Silva, E.T.; Devlin, M.; Anthony, K.R.N.; Lewis, S.; Tonin, H.; Brinkman, R.; Mumby, P.J. Contribution of Individual Rivers to Great Barrier Reef Nitrogen Exposure with Implications for Management Prioritization. Mar. Pollut. Bull. 2018, 133, 30–43. [Google Scholar] [CrossRef]
  60. Jafar-Sidik, M.; Bowers, D.G.; Griffiths, J.W. Remote Sensing Observations of Ocean Colour Using the Traditional Forel-Ule Scale. Estuar. Coast. Shelf Sci. 2018, 215, 52–58. [Google Scholar] [CrossRef]
  61. Groom, S.; Sathyendranath, S.; Ban, Y.; Bernard, S.; Brewin, R.; Brotas, V.; Brockmann, C.; Chauhan, P.; Choi, J.; Chuprin, A.; et al. Satellite Ocean Colour: Current Status and Future Perspective. Front. Mar. Sci. 2019, 6, 485. [Google Scholar] [CrossRef] [Green Version]
  62. Guillou, N.; Rivier, A.; Gohin, F.; Chapalain, G. Modeling Near-Surface Suspended Sediment Concentration in the English Channel. JMSE 2015, 3, 193–215. [Google Scholar] [CrossRef] [Green Version]
  63. Fournier, S.; Chapron, B.; Salisbury, J.; Vandemark, D.; Reul, N. Comparison of Spaceborne Measurements of Sea Surface Salinity and Colored Detrital Matter in the Amazon Plume: SSS-Cdm Comparison in the Amazon Plume. J. Geophys. Res. Ocean. 2015, 120, 3177–3192. [Google Scholar] [CrossRef] [Green Version]
  64. Schroeder, T.; Devlin, M.J.; Brando, V.E.; Dekker, A.G.; Brodie, J.E.; Clementson, L.A.; McKinna, L. Inter-Annual Variability of Wet Season Freshwater Plume Extent into the Great Barrier Reef Lagoon Based on Satellite Coastal Ocean Colour Observations. Mar. Pollut. Bull. 2012, 65, 210–223. [Google Scholar] [CrossRef] [PubMed]
  65. Beher, J.; Possingham, H.P.; Hoobin, S.; Dougall, C.; Klein, C. Prioritising Catchment Management Projects to Improve Marine Water Quality. Environ. Sci. Policy 2016, 59, 35–43. [Google Scholar] [CrossRef] [Green Version]
  66. Devlin, M.J.; McKinna, L.W.; Álvarez-Romero, J.G.; Petus, C.; Abott, B.; Harkness, P.; Brodie, J. Mapping the Pollutants in Surface Riverine Flood Plume Waters in the Great Barrier Reef, Australia. Mar. Pollut. Bull. 2012, 65, 224–235. [Google Scholar] [CrossRef] [PubMed]
  67. Arnold, J.G.; Kiniry, J.R.; Srinivasan, R.; Williams, J.R.; Haney, E.B.; Neitsch, S.L. Soil and Water Assessment Tool Input/Output File Documentation Version 2009; Texas Water Resources Institute: College Station, TX, USA, 2011. [Google Scholar]
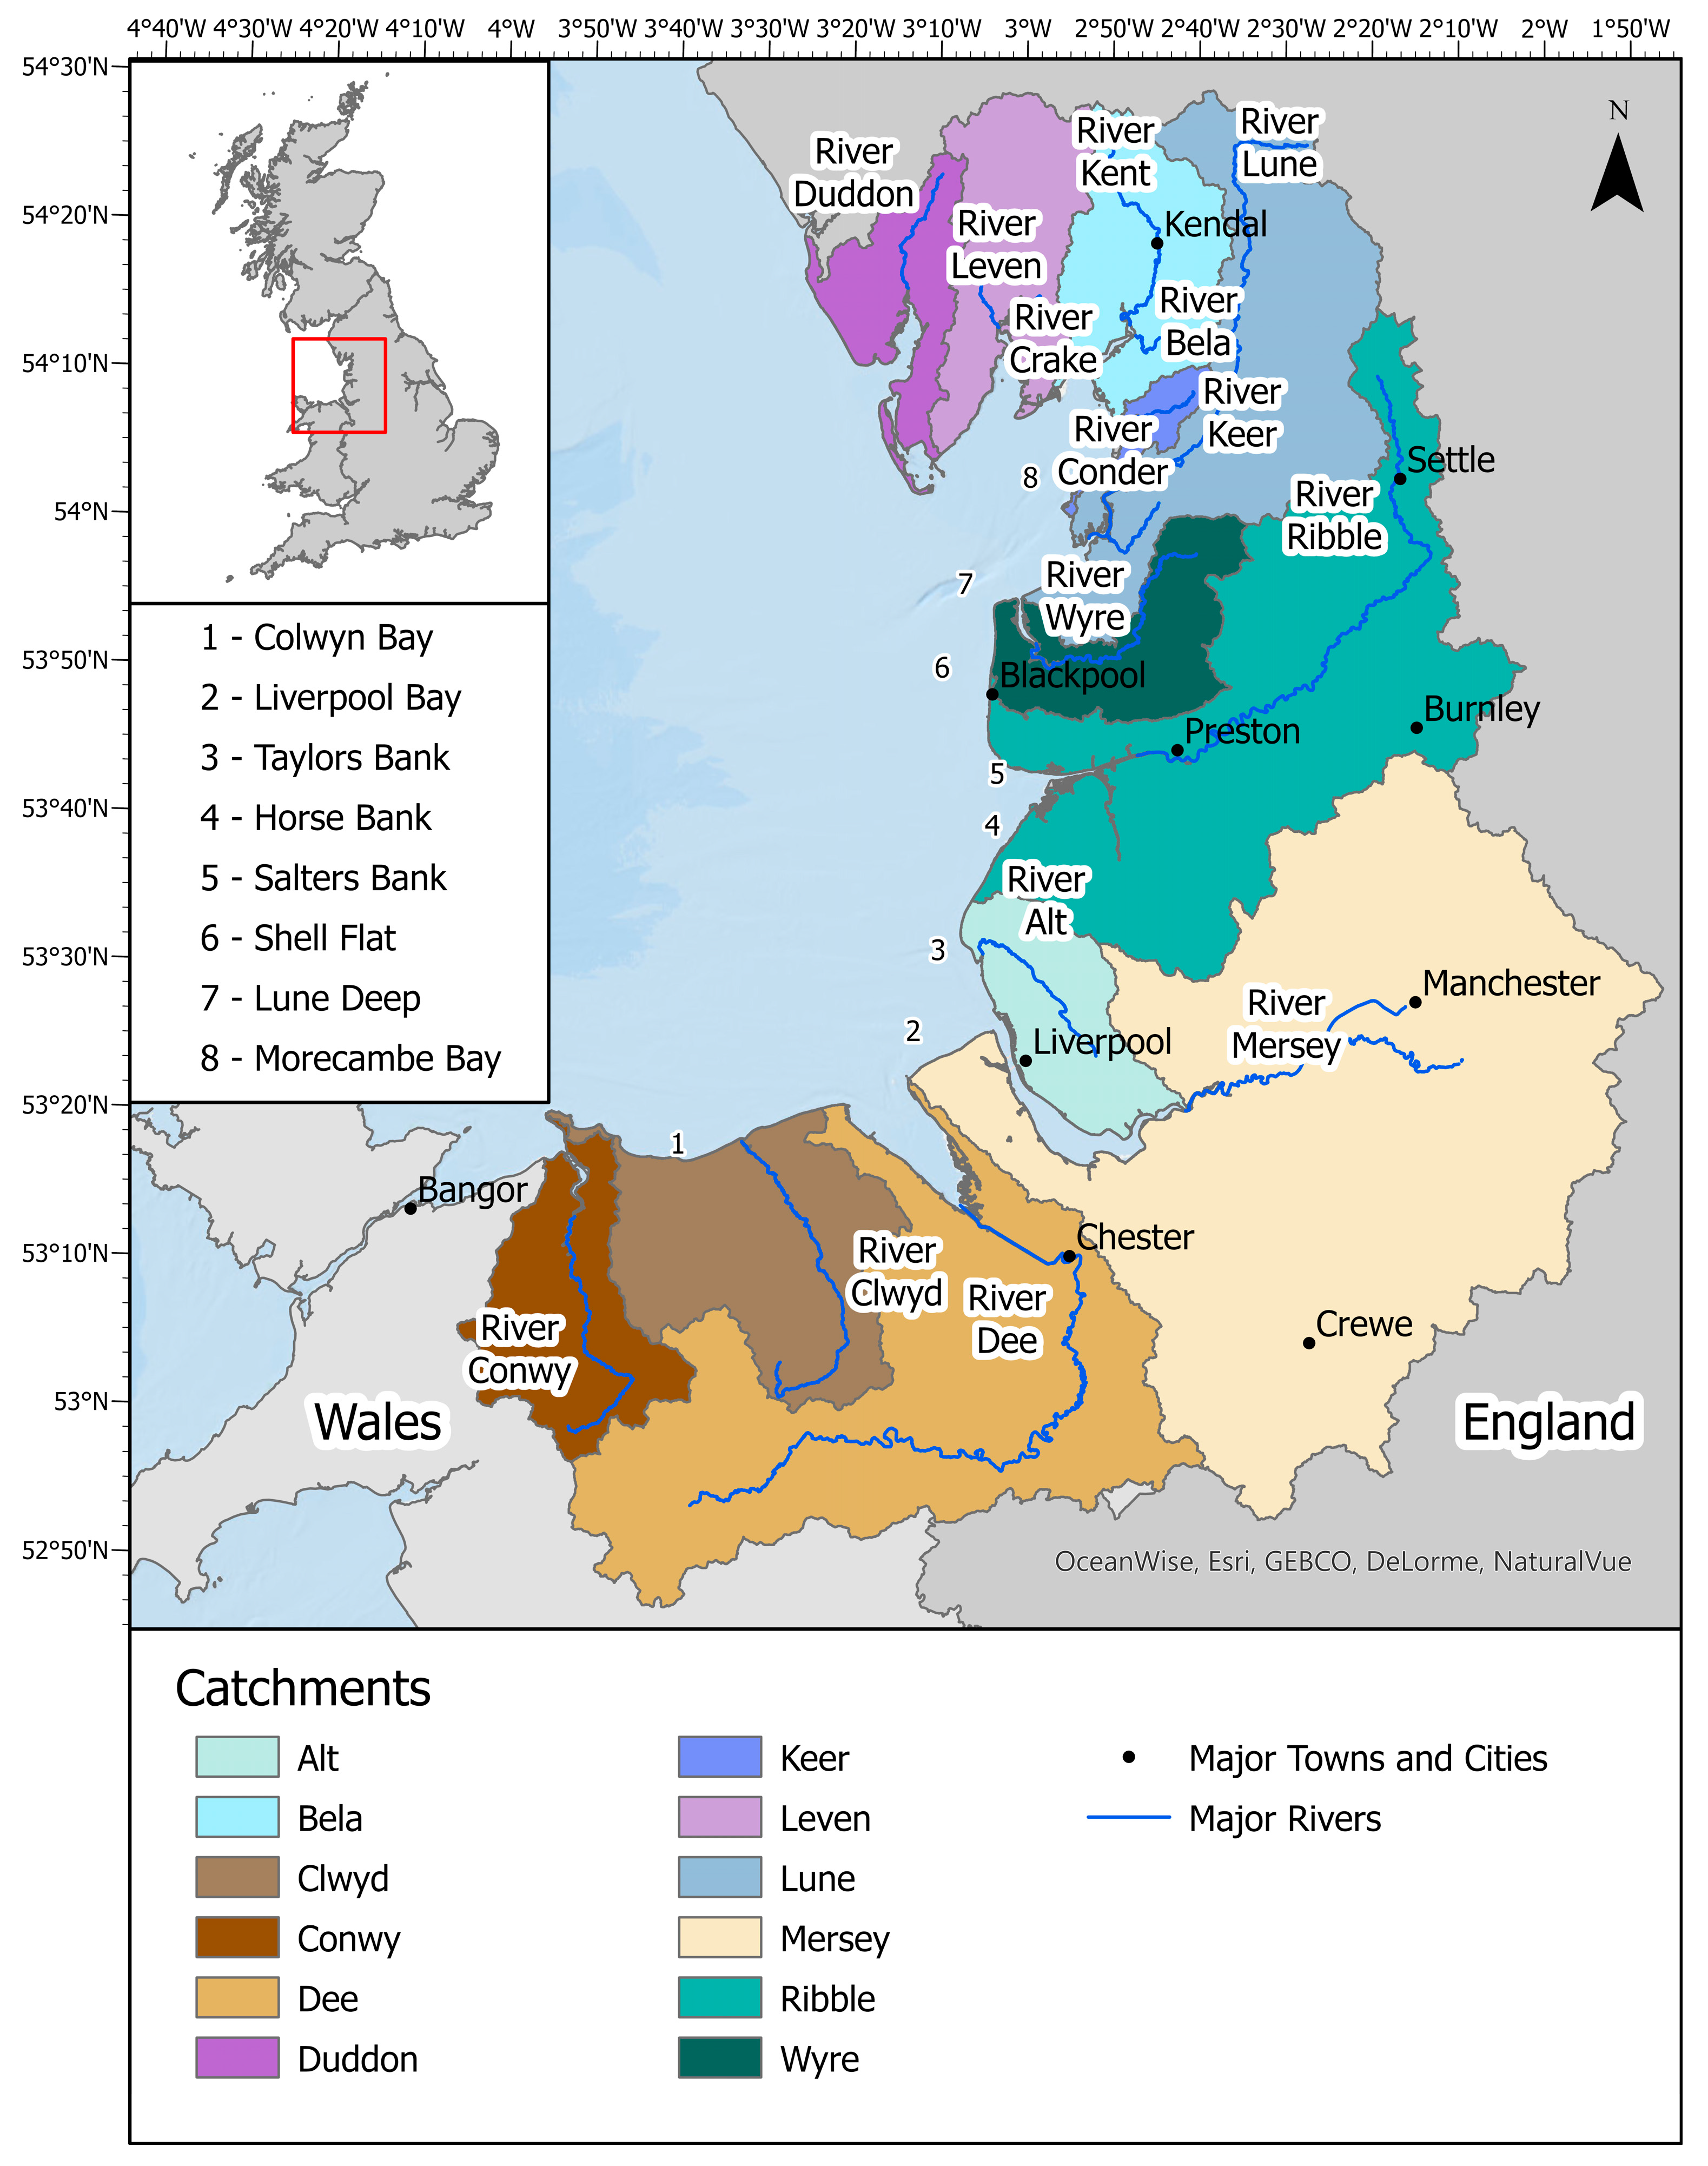
Figure 1. Study area of Liverpool Bay, showing the major catchments and coastal features.
Remotesensing 15 03666 g001
Figure 2. Overview of the workflow used in this study to generate monthly DIN exposure risk maps using a probabilistic approach. Details of the individual processing steps are given in the following sections.
Remotesensing 15 03666 g002
Figure 3. Seasonal distribution of the river plume in Liverpool Bay as determined by a FUI value of 10 or above.
Remotesensing 15 03666 g003
Figure 4. (a) Map of the probability of inputs to Liverpool Bay from the major rivers Conwy, Ribble, and Leven in July, with the influence of the residual current incorporated; (b) Map of the probability of inputs to Liverpool Bay from the major rivers Conwy, Ribble, and Leven in July, with no influence of the residual current. Red circles indicate the river mouth.
Remotesensing 15 03666 g004
Figure 5. Normalised cost distance maps of DIN for Liverpool Bay for January and July for the 4 major riverine inputs of DIN.
Remotesensing 15 03666 g005
Figure 6. Contour maps showing the 0.75 probability envelope of DIN exposure for seasonal riverine inputs to Liverpool Bay for each month: (a) River Clwyd; (b) River Dee; (c) River Mersey; and (d) River Ribble.
Remotesensing 15 03666 g006aRemotesensing 15 03666 g006b
Figure 7. Scaled DIN exposure risk map in Liverpool Bay based on proportional riverine DIN input from the rivers Conwy, Clwyd, Dee, Mersey, Alt, Ribble, Wyre, Lune, Keer, Bela, Leven, and Duddon.
Remotesensing 15 03666 g007
Figure 8. Maps showing the frequency of DIN exposure risk in the river plume off Liverpool Bay: (a) map showing the frequency of where DIN exposure is greater than 0 across the plume; (b) map showing the areas of DIN exposure risk with a level greater than 0.5 (b).
Remotesensing 15 03666 g008
Table 1. Mean monthly DIN loads for the major river inputs into Liverpool Bay, calculated from river discharges and DIN concentrations for the period 2010 to 2020. Values shown are metric tonnes (MT).
RiverJan.Feb.Mar.Apr.MayJun.Jul.Aug.Sep.Oct.Nov.Dec.
Clwyd23922216138889248251334933152991414012573
Dee4457320819591749139312437878751174142520473994
Mersey659758446763434251214927440450034150437955616772
Ribble3328299418118385332160159816981404191019984914
Lune9238061991133511457863270268511894
Bela2116208219037315514777859751208148617022759
Leven532550354214138141139229194309403487
Others *531396310133117107172186201250365555
Total20,87618,09614,687901283709682829110,160913010,94113,98822,948
* Rivers Alt, Conwy, Duddon, Kent, and Wyre combined.
Table 2. Areal size of the river plume in Liverpool Bay with an annual frequency of DIN exposure greater than 0 (all risks), or greater than 0.5. Value in brackets represents the percentage area of the plume.
Annual Frequency of DIN Exposure Risk
(Months at Risk)
Area with DIN Exposure Risk Greater than 0 (km2)Area with DIN Exposure Risk Greater than 0.5 (km2)
026.8 (0.3)5148.6 (60.8)
1–22832.4 (33.4)984.3 (11.6)
3–52518.6 (29.7)643.3 (7.6)
6–81072.0 (12.7)750.6 (8.9)
9–11511.5 (6.0)365.9 (4.3)
121511.7 (17.8)580.4 (6.8)
Disclaimer/Publisher’s Note: The statements, opinions and data contained in all publications are solely those of the individual author(s) and contributor(s) and not of MDPI and/or the editor(s). MDPI and/or the editor(s) disclaim responsibility for any injury to people or property resulting from any ideas, methods, instructions or products referred to in the content.