Article

Isolating the Source Region of Infrasound Travel Time Variability Using Acoustic Sensors on High-Altitude Balloons

by
Elizabeth A. Silber
1,* and
Daniel C. Bowman
2
1
Geophysics, Sandia National Laboratories, Albuquerque, NM 87123, USA
2
Multi-Modal Geophysics and Data Analytics, Sandia National Laboratories, Albuquerque, NM 87123, USA
*
Author to whom correspondence should be addressed.
Remote Sens. 2023, 15(14), 3661; https://doi.org/10.3390/rs15143661
Submission received: 22 June 2023 / Revised: 19 July 2023 / Accepted: 20 July 2023 / Published: 22 July 2023
(This article belongs to the Section Atmospheric Remote Sensing)

Abstract

:
High-altitude balloons carrying infrasound sensor payloads can be leveraged toward monitoring efforts to provide some advantages over other sensing modalities. On 10 July 2020, three sets of controlled surface explosions generated infrasound waves detected by a high-altitude floating sensor. One of the signal arrivals, detected when the balloon was in the acoustic shadow zone, could not be predicted via propagation modeling using a model atmosphere. Considering that the balloon’s horizontal motion showed direct evidence of gravity waves, we examined their role in infrasound propagation. Implementation of gravity wave perturbations to the wind field explained the signal detection and aided in correctly predicting infrasound travel times. Our results show that the impact of gravity waves is negligible below 20 km altitude; however, their effect is important above that height. The results presented here demonstrate the utility of balloon-borne acoustic sensing toward constraining the source region of variability, as well as the relevance of complexities surrounding infrasound wave propagation at short ranges for elevated sensing platforms.

Graphical Abstract

1. Introduction

1.1. High-Altitude Infrasound Platforms

Acoustic waves in the frequency range below ~20 Hz (the lower threshold of human hearing) and down to the atmospheric Brunt–Väisälä frequency are known as infrasound. A variety of natural and anthropogenic impulsive sources can generate infrasound, e.g., volcanoes, meteors, lightning, ocean waves, explosions, and rockets (e.g., [1,2,3,4,5,6]). Since acoustic attenuation, or the loss of acoustic energy, increases as the inverse square of the frequency [7], infrasonic waves can travel through Earth’s atmosphere over vast distances, traversing hundreds or even thousands of kilometers, carrying information about the source and sampling the propagation medium along their path (e.g., [8]).
Conventional infrasound sensors are typically deployed as ground-based installations, emplaced either as a single microbarometer station or arranged into a multi-sensor array to resolve the direction of an arriving signal (e.g., [9]). In recent years, however, there has been a (re)emergence of high-altitude sensors suspended from balloons [10] or tethered aerostats [11,12]. While the concept of airborne infrasound sensing dates back over 50 years, there were only two documented studies during the 20th century [13,14].
Emplacement of microbarometers on high-altitude floating platforms offers advantages such as monitoring regions of Earth (e.g., oceans) that are inaccessible to other sensing modalities and directly probing acoustic propagation channels in Earth’s atmosphere [10,15]. Another key application of such systems is the exploration of extraterrestrial planets with harsh atmospheres, e.g., Venus [16,17] or gas giants [18]. Considering that the horizontal motion of a balloon is driven by prevailing stratospheric winds, the level of wind-induced background noise is also presumably lower than that in a ground-based sensing environment [19], although a recent study noted the presence of numerous as yet unidentified sources of relatively high noise in one data set [20].
Because balloon-borne acoustic sensing is still considered an emerging technology, there are very few studies describing the intricacies associated with infrasound propagation from ground-based sources to free-floating, high-altitude receivers (e.g., [21,22]). The source–receiver geometry introduces inherent differences in propagation conditions and poses challenges that are not present in conventional ground-to-ground sensing. For example, in order to reach a receiver situated in the stratosphere, infrasound rays generated by the ground-based source will typically have high launch angles and, depending on the location of the receiver, undergo a near-vertical propagation, traversing the stratified layers of the atmosphere rather than being trapped in usual propagation waveguides (e.g., [23]). While ground-to-ground infrasound propagation at short and long ranges has been extensively studied and well-understood (e.g., [23,24,25,26]), the opposite is true for balloon-borne infrasound propagation.

1.2. Variability of Infrasound at Elevated Receivers

One of the major challenges in infrasound monitoring is presented by the propagation medium itself. Some of the factors that affect infrasound propagation are non-linear effects, diffraction, scattering, attenuation, turbulence, temperature and wind stratification, and atmospheric tidal effects (e.g., [8,23,27,28,29,30,31,32]). In addition to large-scale structures that affect infrasound propagation on a seasonal and diurnal basis, dynamic changes in the atmosphere may occur on timescales that are shorter than the time it takes for an infrasonic wave to travel from source to receiver, even at regional distances. In particular, fine-scale internal gravity wave structures (e.g., [33,34]) have been shown to perturb the local wind field on short timescales, which could explain propagation in shadow zones in cases where no signal is theoretically predicted (e.g., [28,35,36,37,38]). Earlier studies showed that for near-surface propagation, small-scale variations could be significant at ranges as short as only a few kilometers (e.g., [24,39]), illustrating the importance of considering range-dependent propagation in modeling efforts. However, for balloon-borne acoustic sensing, where rays propagate upward at steep angles rather than within horizontal waveguides, it has been shown that infrasound is less susceptible to small-scale structures at distances up to a few tens of kilometers [40]. This could be leveraged toward isolating the region where small-scale variations might have the most significant effect.
In contrast to ground-to-ground geometry, studies exploring the effect of gravity waves on short-range propagation (<200km) for high-altitude infrasound are scarce. There are only a couple of studies on this topic in the literature—one describes infrasound propagation from high-altitude impulsive sources down to ground-based receivers [41], and the other one applies the problem to balloon-borne infrasound [42]. Silber and Brown [41] investigated the effect of gravity wave-induced perturbations to the windfield on infrasound generated by meteoroids in the mid and upper atmosphere (up to 100 km) to explain acoustic arrivals that were predicted not to exist but were still detected by ground-based microbarometers. Bird, Lees, Kero, and Bowman [42] considered the effect of random small-scale perturbations on the wind velocity to explain the observed signal arrivals. Herein, small-scale perturbations refer to gravity wave-induced perturbations with wavelengths larger than that of infrasound.
For high-altitude infrasound sensing, no studies to date have directly explored the effect of gravity wave perturbations to the wind field on acoustic wave propagation and signal arrival times. The likely presence of small-scale structures caused by gravity waves has been noted in relation to high-altitude balloon infrasound sensing at regional distances [20,43,44]. In their investigation of event localization by a balloon-borne infrasound sensor network, Bowman and Albert [44] noted that some signals were detected despite the receiver being within a predicted shadow zone. They postulated that this was direct evidence of wind perturbations in the lower stratosphere but did not pursue this line of inquiry any further. Other studies utilized the measurements of the horizontal drift in the sensor-carrying balloon to uncover the presence of small-scale structures that were not readily explained by a model atmosphere, but the effect these had on infrasound propagation was not directly probed [20,43]. Moreover, Poler et al. [45] directly recorded mountain-generated gravity waves during a balloon flight over the Andes Mountains. Bowman and Krishnamoorthy [40] showed that direct arrivals (no reflections or refractions) associated with a ground-based source are readily and accurately predicted at high-altitude receivers. This contradicts common knowledge applicable to propagation relevant to the ground-to-ground geometry and also indicates that vertically-launched infrasound rays will be less prone to atmospheric variability that typically affects horizontally propagating waves. Thus, in theory, high-altitude infrasound sensing can also be leveraged toward isolating the region where atmospheric variations might have the largest effect, which is highly relevant to future deployment planning and for refining balloon-borne infrasound sensing, as well as for ground-based infrasound detections and modeling of short range (<300 km) elevated sources (e.g., meteoroids, rocket launches, orbital debris re-entry).
There are a variety of approaches and methodologies to rigorously represent small-scale variations in the atmosphere. Despite ongoing advancements in that area, each approach has its deficiencies, and there is no single model that can perfectly describe temporal atmospheric specifications as a function of all possible short-scale effects. Thus, with that in mind, our goal is not to test various models nor to develop new ones but to use a simple approach to determine the source region of variability, irrespective of the exact nature of the variability itself. In this work, we embark on isolating the variability source region responsible for signals that might be directly observed but otherwise predicted to lie in an acoustic shadow zone. Specifically, we explore the effect of perturbations due to gravity waves as a simple approach to constrain the atmospheric region of interest.
To this end, we explore the effect of gravity wave perturbations to the wind field on the arrival times of infrasound waves generated by a series of explosions that were detonated as a part of a field experiment in 2020 to study acoustic propagation and balloon-borne sensor detection efficiency [46]. This is the first study where gravity wave-induced perturbations are applied to the local wind field to examine the effect on airwave arrival times at an elevated, free-floating receiver at regional distances.
Since the sensor was located at an altitude of 20 km, we were able to determine that these perturbations are located above the troposphere and lower stratosphere. This would not have been possible to assert with a ground-based sensor. The results presented here demonstrate the complexities surrounding infrasound wave propagation, even at very short ranges, and the importance of including fine-scale structures in modeling efforts.
This paper is organized as follows. In Section 2, we describe the field experiment. In Section 3 and Section 4, respectively, we present infrasound detections and ray tracing. Observations of small-scale perturbations are discussed in Section 5. Our modeling efforts and the corresponding results are described in Section 6. Our conclusions are given in Section 7.

2. Experiment

A zero-pressure, helium-filled balloon was launched from Lemitar, NM, USA (34.162° N, 106.902° W) on 10 July 2020, around 12:00 UTC (6:00 MDT). The Raven Aerostar (Sioux Falls, SD, USA) Cyclone balloon was 10 m in diameter. The payload consisted of a Paroscientific (Bellevue, WA, USA) Digiquartz infrasound microbarometer and an InertialSense (Provo, UT, USA) microINS Rugged inertial measurement unit (IMU), both of which were fitted into a foam shipping container (mass 1.5 kg, dimensions 20 × 25 × 23 cm3) and then suspended 30 m below the balloon gondola by 500 lb test paracord.
The acoustic sources for the test were three pairs of 1 ton of trinitrotoluene (TNT) equivalent (1 t of TNT = 4.184·109 J) surface chemical explosions, detonated at the Energetic Materials Research and Testing Center (EMRTC) in Socorro, NM (34.0596°N, 106.9910°W). We refer to the three pairs of explosions as Events 1, 2, and 3 and denote individual detonations within each pair as A and B. The explosions in each pair of events were detonated 30 s apart, with Events 1A, 2A, and 3A taking place at 15:40, 16:40, and 19:30 UTC (9:40, 10:40, and 13:30 MDT), respectively (Table 1). Further details on the instrumentation and active-source test are given by Bowman, Rouse, Krishnamoorthy, and Silber [46].

3. Infrasound Detections

The acoustic waves generated by all three pairs of explosions were detected by the floating sensor. The geographical locations of the balloon at the time of each detection are plotted in Figure 1 and indicated with yellow circles. As seen on the map, the balloon was drifting away from the location of detonations (white circle) in the northwest direction, consistent with stratospheric winds blowing westward in the summer months in the northern hemisphere. In all cases, the balloon was floating at an altitude of ~20.5 km above the surface.
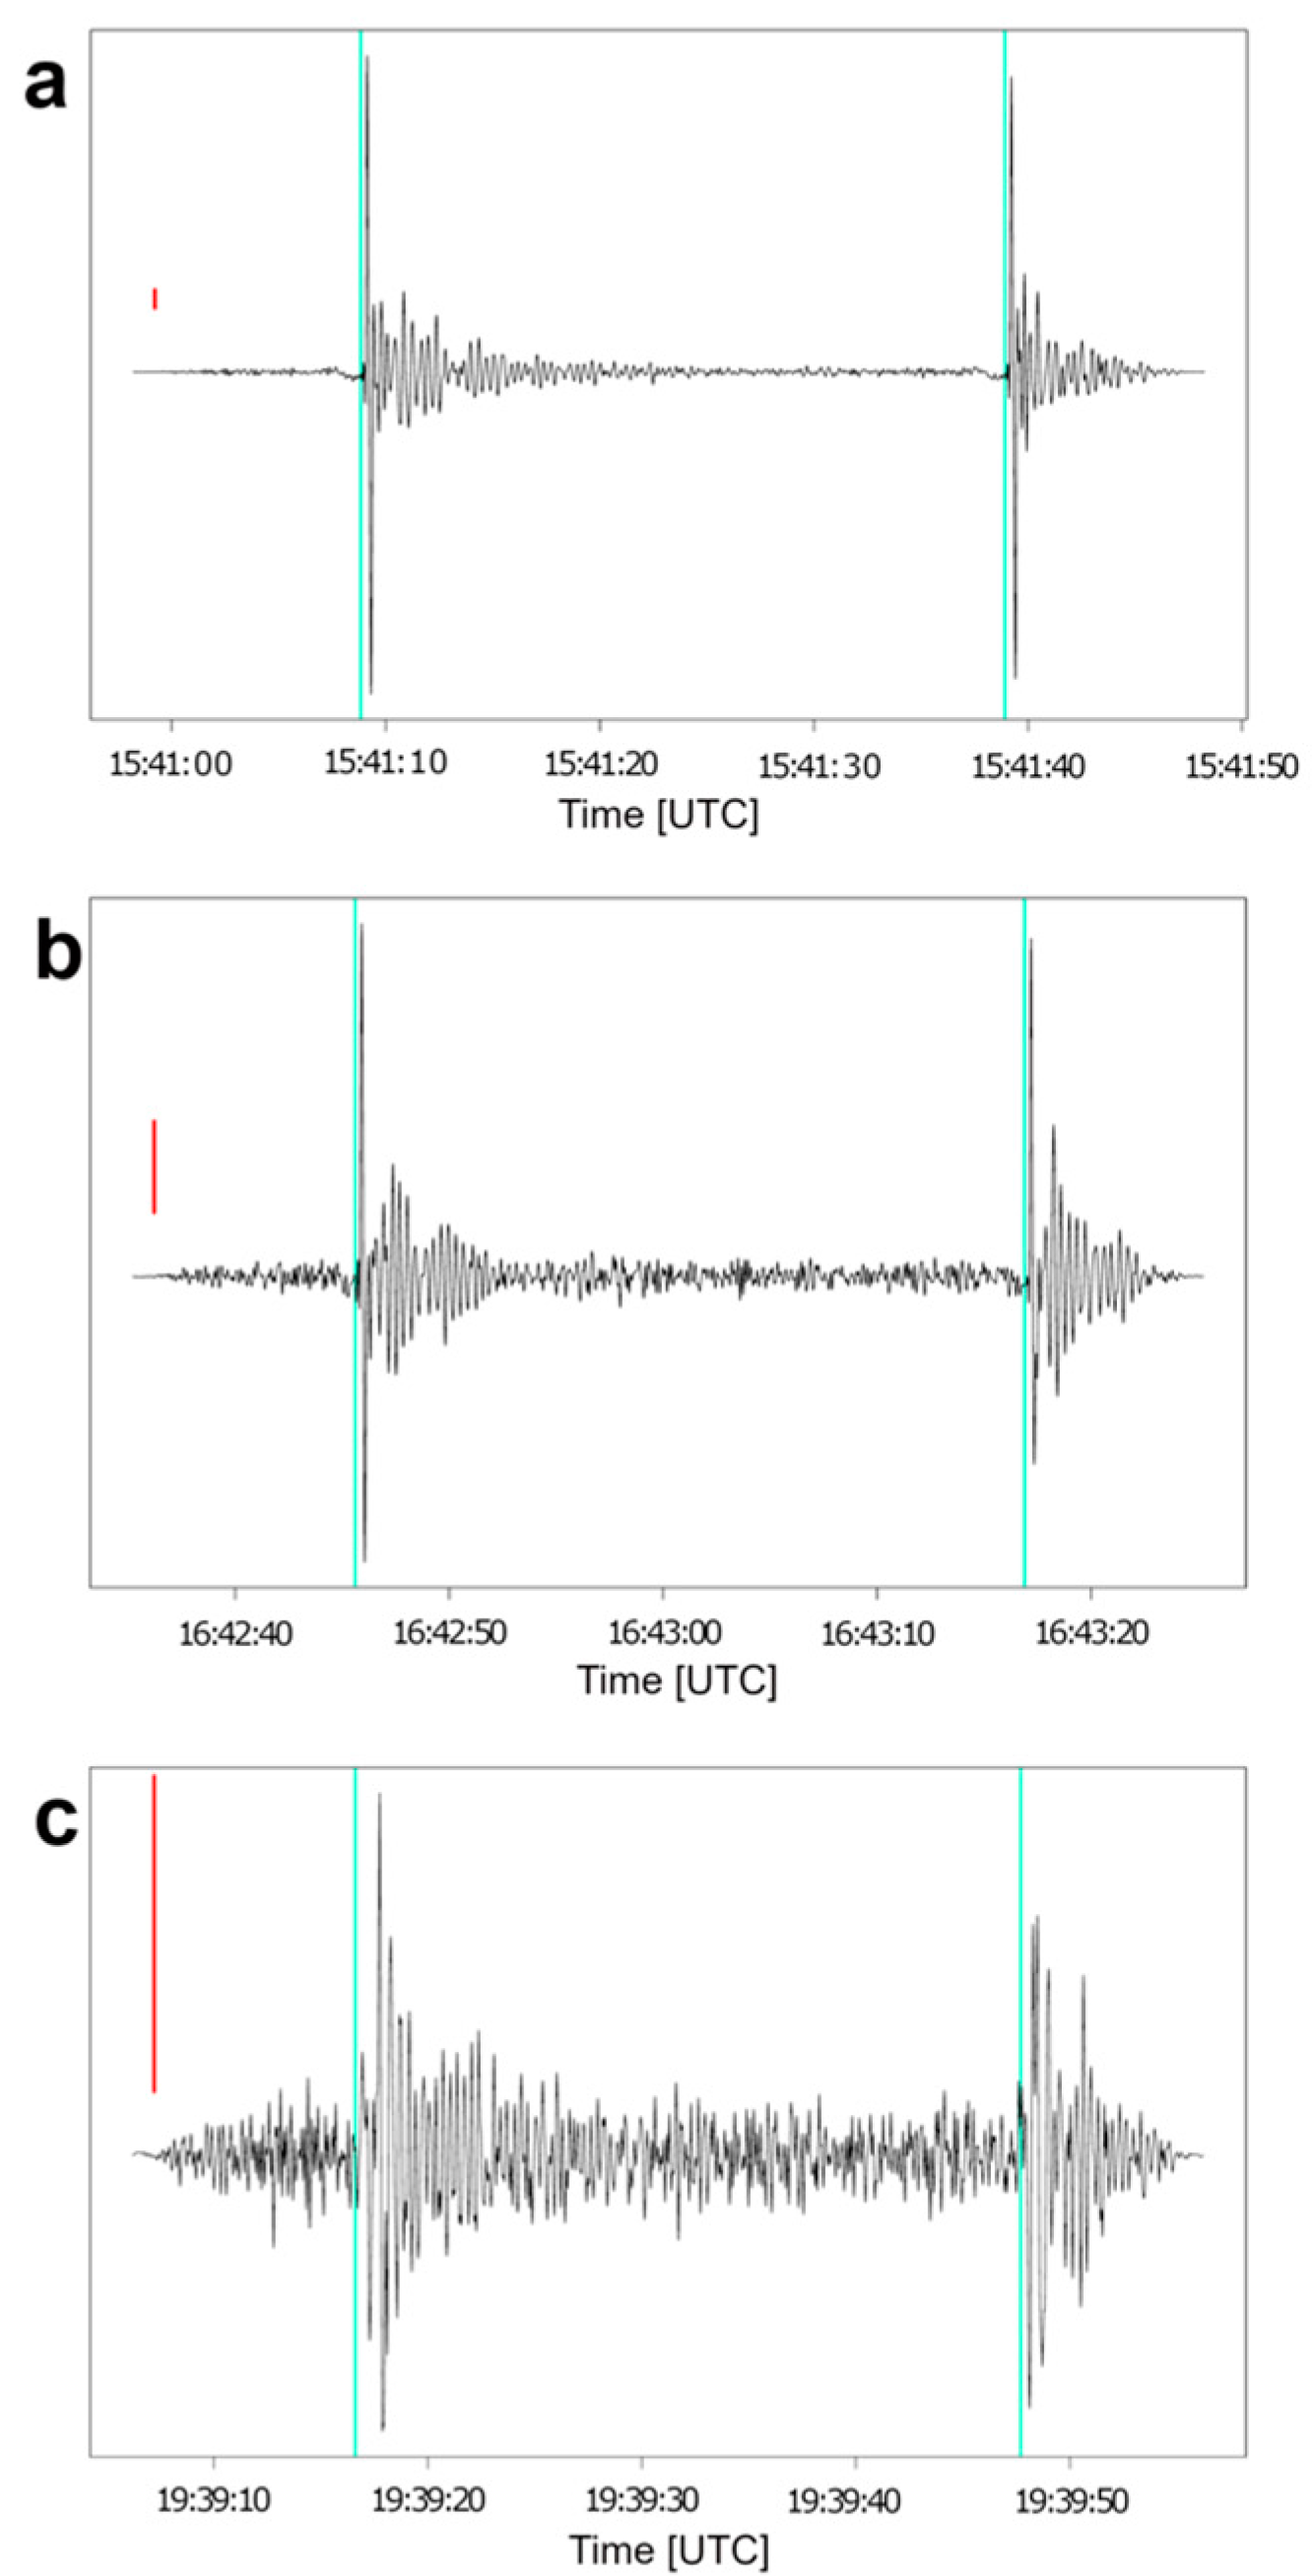
Events 1AB and 2AB were detected 69 and 166 s after the detonations, with signal celerities of 297 m/s and 316 m/s, respectively. Event 1A was detected at 15:41:09 UTC, followed by Event 1B 30 s later. The balloon was very close to the explosion at a horizontal separation of 10.4 km. By the time the second pair of explosions were detonated, the balloon had drifted further away. At the time of the detection, the balloon was situated at 48.2 km horizontal range. The airwave from Event 2A arrived at 16:42:46 UTC, and the signal from Event 2B arrived 31 s later. By the time the third pair of explosions was detonated, the airborne sensor had drifted 169 km away. The signal was received 557 s after the first detonation and 558 s after the second detonation. The onset of the Event 3A and 3B airwave arrival was at 19:39:17 UTC and 19:39:48 UTC, respectively, corresponding to the signal celerity of 304 m/s. The detection details, including the signal travel times and location of the balloon at the time of each detection, are listed in Table 2. Figure 2 shows the signals generated by each pair of explosions. The main arrival in all three cases is an N-wave, typical of explosive sources (e.g., [47]). We applied a 0.5–8 Hz bandpass Butterworth filter to the time series (see [46] for more details).

4. Ray Tracing

There are several approaches to model infrasound propagation in the atmosphere. Finite element, finite difference, and spectral element methods (e.g., [25,35,48]) can produce full-waveform synthetics, but getting their solutions to the required order of accuracy is computationally expensive. Modal and parabolic equation (PE) methods (e.g., [49,50,51]) can account for effects such as scattering and propagation in a moving medium, but the challenges still exist for very wide propagation angles (e.g., [24,52,53]). PE methods can also be computationally expensive. However, it is noteworthy to emphasize that in most cases, the commonly accepted approaches (e.g., PE methods) to describe infrasound propagation are not appropriate for balloon-borne infrasound because of the specific source–receiver geometry and near-vertical propagation (if the source is ground-based).
Geometric ray tracing is a computationally fast method based on high-frequency eikonal and transport approximations (e.g., [54]) which take into account atmospheric specifications and is a reference tool used to study infrasound propagation in the atmosphere (e.g., [55,56,57,58,59]). While geometric ray tracing has some inherent limitations, such as neglecting diffraction and scattering, it provides a robust approximation of infrasound propagation, which can be leveraged towards source localization and atmospheric sounding (e.g., [55,56,60]).
Geometric ray tracing is well-suited for frequencies typically observed by high-altitude sensors, as well as high elevation sources and steep angle arrivals, and therefore it has been extensively used to describe balloon-borne infrasound propagation (e.g., [20,40,42,43,44]). In fact, previous studies involving balloon-borne infrasound have shown that geometric ray tracing accurately describes direct airwave arrivals and travel times for direct arrivals (e.g., [40]). Due to its favorable characteristics, geometric ray tracing is our method of choice for gathering numerical data in this work.
Ray tracing was performed using the open-source InfraGA/GeoAC software package [54,61,62]. The code has numerous built-in functionalities, including an option to shoot rays (in 2D and 3D Cartesian and 3D spherical geometry) at a full range of elevation angles to assess propagation paths between source and receiver. The infraGA package can also estimate ray spreading and geometric attenuation. As predictions in propagation modeling rely on atmospheric specifications, such as temperature, wind speed, and wind direction, we first obtained the relevant atmospheric data to be used as inputs in infraGA.
Temperature and wind data as a function of altitude were generated through the Ground-to-Space (G2S) model [63] hosted by the National Center for Physical Acoustics. The profiles were obtained for a given location and hour corresponding to the time when each pair of explosions were detonated (15:00, 16:00, and 19:00 UTC). Radiosonde data (i.e., temperature, wind speed, and wind direction as a function of altitude) from a nearby station (USM00072365, 35.0378° N, 106.6219° W) were also collected (corresponding to 12:00 UTC on July 10, and 00:00 UTC on July 11). Radiosonde data are freely available for download from the Integrated Global Radiosonde Archive (IGRA) website. The radiosonde wind data are reported in the form of wind speed and direction—these values were converted to zonal (east–west) and meridional (north–south) components to match the G2S format. Since the radiosonde data extend to an altitude of approximately 30 km, the temperature and wind profiles were combined with the G2S model atmosphere by a smooth spline interpolation [64]. We “stitched” the radiosonde data collected at 12:00 UTC to the G2S model atmosphere at 15:00 UTC (Event 1), 16:00 UTC (Event 2), and 19:00 UTC (Event 3). However, for Event 3, we also built an additional atmospheric profile consisting of the radiosonde data collected at 00:00 UTC (Jul 11) and the G2S profile generated at 19:00 UTC. We refer to the stitched profiles as hybrid atmosphere profiles since they consist of two data sets. In Table 3, we summarize the atmospheric profiles tested.
We used the 3D Stratified Spherical Propagation mode (infraga-sph -prop) in infraGA, assuming a range-independent velocity model based on the effective sound speed approximation. This is an appropriate assumption because the horizontal range of <200 km is much less than the distance at which range-dependent propagation becomes significant [61]. The atmosphere can be specified by a single file, as it is assumed that it varies only as a function of altitude. The rays were launched at an azimuth corresponding to that of the balloon at the time of each detection. The launch angles varied from 0.5° to 89° from horizontal, in 0.5° increments.
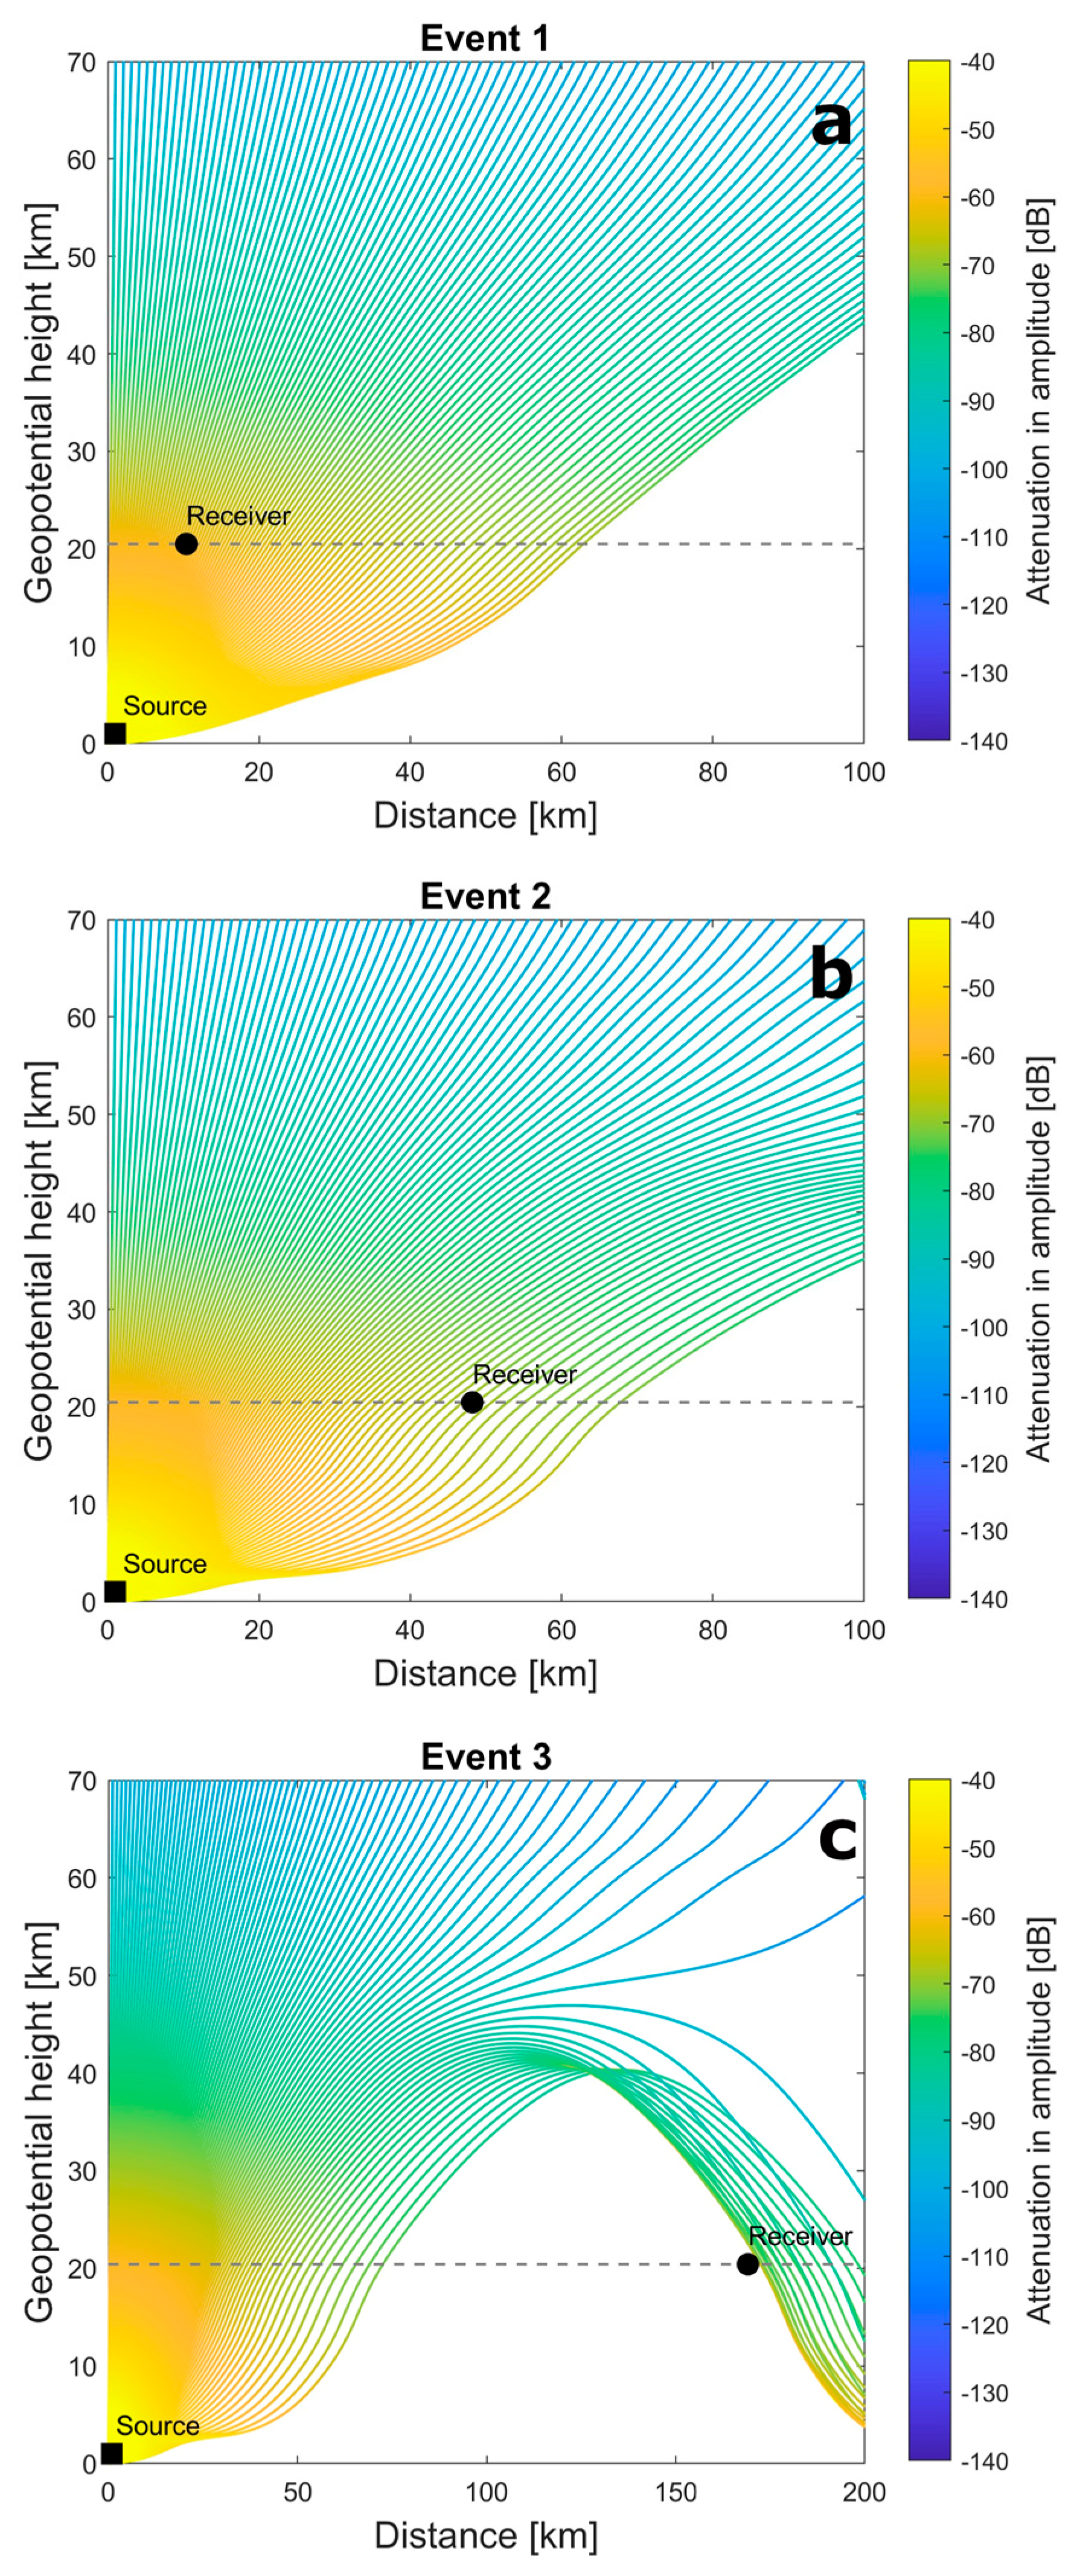
The ray tracing results are shown in Figure 3. At the time Event 1 and Event 2 were detected, the balloon was situated well within the acoustic zone, at a 10–48 km horizontal range, and along a direct acoustic propagation path. Ray tracing using both the standalone G2S model atmosphere and the hybrid atmosphere readily predicted the airwave arrivals consistent with the observed arrival times. Similar results were also reported previously for balloon infrasound at distances of several tens of kilometers [40]. Regardless of the atmospheric specifications profile used, the ray tracing results were a near exact match to the observed signal travel times, attesting to the fact that direct arrivals at high launch angles are less susceptible to small-scale fluctuations. However, for Event 3, ray tracing indicated that the balloon was at the outer edge of the acoustic shadow zone, in the region where the infrasound wave refracts from the stratosphere and before it bounces off the surface. In addition to using the standalone G2S model atmosphere, we also ran ray tracing exploiting the hybrid atmospheric profiles. Regardless of the atmospheric profile used (G2S model or hybrid), none of the ray tracing runs could produce a viable acoustic path between the source and the receiver. In all scenarios, the receiver remained in the acoustic shadow zone. We did another set of ray tracing runs for Event 3, increasing the launch angle density (0.1°) to test whether the modeling was resolving the edge of the acoustic shadow zone. Again, the results showed that the balloon was situated in an acoustic shadow zone.

5. Perturbations Due to Gravity Waves

The atmosphere is a dynamic and complex medium that undergoes changes on small and large scales, oftentimes hindering efforts to adequately characterize infrasound signal detections not only from far-field sources but also those at regional distances (e.g., [36,65]). Atmospheric specifications currently available from models and observations are expected to provide a reasonable estimate of various parameters, including the presence of propagation waveguides. Some examples of atmospheric data sources include numerical prediction weather centers (e.g., the European Centre for Medium-Range Weather Forecasts or ECMWF), atmospheric climate reanalysis efforts (the Modern-Era Retrospective Analysis for Research and Applications (MERRA)), models such as Ground-to-Space (G2S), and instrument measurements (e.g., the Integrated Global Radiosonde Archive (IGRA)). In addition to models underpredicting temperature and wind speed in the stratospheric region [66], none of these capture nor account for small-scale fluctuations.
The problem of unusual and unexpected acoustic arrivals, such as detections of infrasonic signals in acoustic shadow zones, is a well-known occurrence (e.g., [4]). Numerous studies have investigated this problem, but primarily in the context of ground-based infrasound sensing (e.g., [28,35,36,37,67,68]). Among other variables, small-scale internal atmospheric gravity perturbations have been recognized as an important factor that can affect infrasound propagation, including the signal ‘leakage’ into shadow zones (e.g., [28,67,69]).
Silber and Brown [41] investigated direct arrivals at regional distances (<300 km), where the source was at a high altitude (<100 km) and the receiver was ground-based. They found a notable portion of infrasound detections of bright meteors that could not be explained by ray tracing given a realistic atmosphere comprised of radiosonde measurements and a model atmosphere. Bright meteors (also known as fireballs and bolides) are produced when sufficiently large and fast meteoroids enter dense regions of the atmosphere. These objects also generate a shockwave which, given favorable conditions, could be detected at the ground in the form of infrasound (e.g., [70]). The observed arrivals were correctly predicted through propagation modeling only after the implementation of gravity wave perturbations to the wind field, demonstrating that small-scale structures can have a significant effect on infrasound even at short distances [41].
With respect to infrasound wave propagation between a free-floating high-altitude sensor and a stationary ground source, Bird et al. [42] derived small-scale perturbations using the sum of sinusoids with random wavelengths and applied them to the wind field profile to explain the observed infrasound signal arrivals. Those perturbations were stochastic in nature but derived based on a normal distribution centered at some value along the entire profile and, thus, did not follow a typical pattern of gravity wave amplitudes as a function of altitude. Nevertheless, their study demonstrated that introducing small-scale variations to the wind field can explain observed infrasound signals.
During its flight, a balloon is carried by winds, both during its ascent/descent and after it reaches the neutral buoyancy altitude. The flight metadata collected by the GPS logger also contains information about the horizontal speed of the balloon as a function of time and altitude, which can be used to infer the atmospheric conditions and, in particular, the presence and magnitude of small-scale fluctuations [20,43,44]. Young et al. [43] noted that the oscillations in the zonal component of the balloon drift velocity were reminiscent of gravity wave wind perturbations, with the magnitude of these oscillations within 5–10 m/s of the G2S values. Bowman and Albert [44] also noted direct evidence of wind perturbations from gravity waves in the lower stratosphere by leveraging the measurements in the horizontal balloon motion during its flight. Their observation, consistent with radiosonde measurements that also show horizontal wind perturbations from gravity waves (e.g., [71]), led to the conclusion that the presence of a signal at some of the balloon-borne sensors was indeed due to gravity wave-induced perturbations. Furthermore, Silber et al. [20] found a significant deviation in both zonal and meridional components of the horizontal balloon oscillations compared to that of the G2S model and radiosonde. While the G2S model atmosphere and radiosonde profiles were in good agreement, to within approximately 10 m/s, the balloon-measured horizontal oscillations were much more pronounced and deviated significantly from both the G2S and radiosonde values. For example, at the balloon float altitudes (18–20 km), the difference in the zonal component was as much as 50 m/s [20].
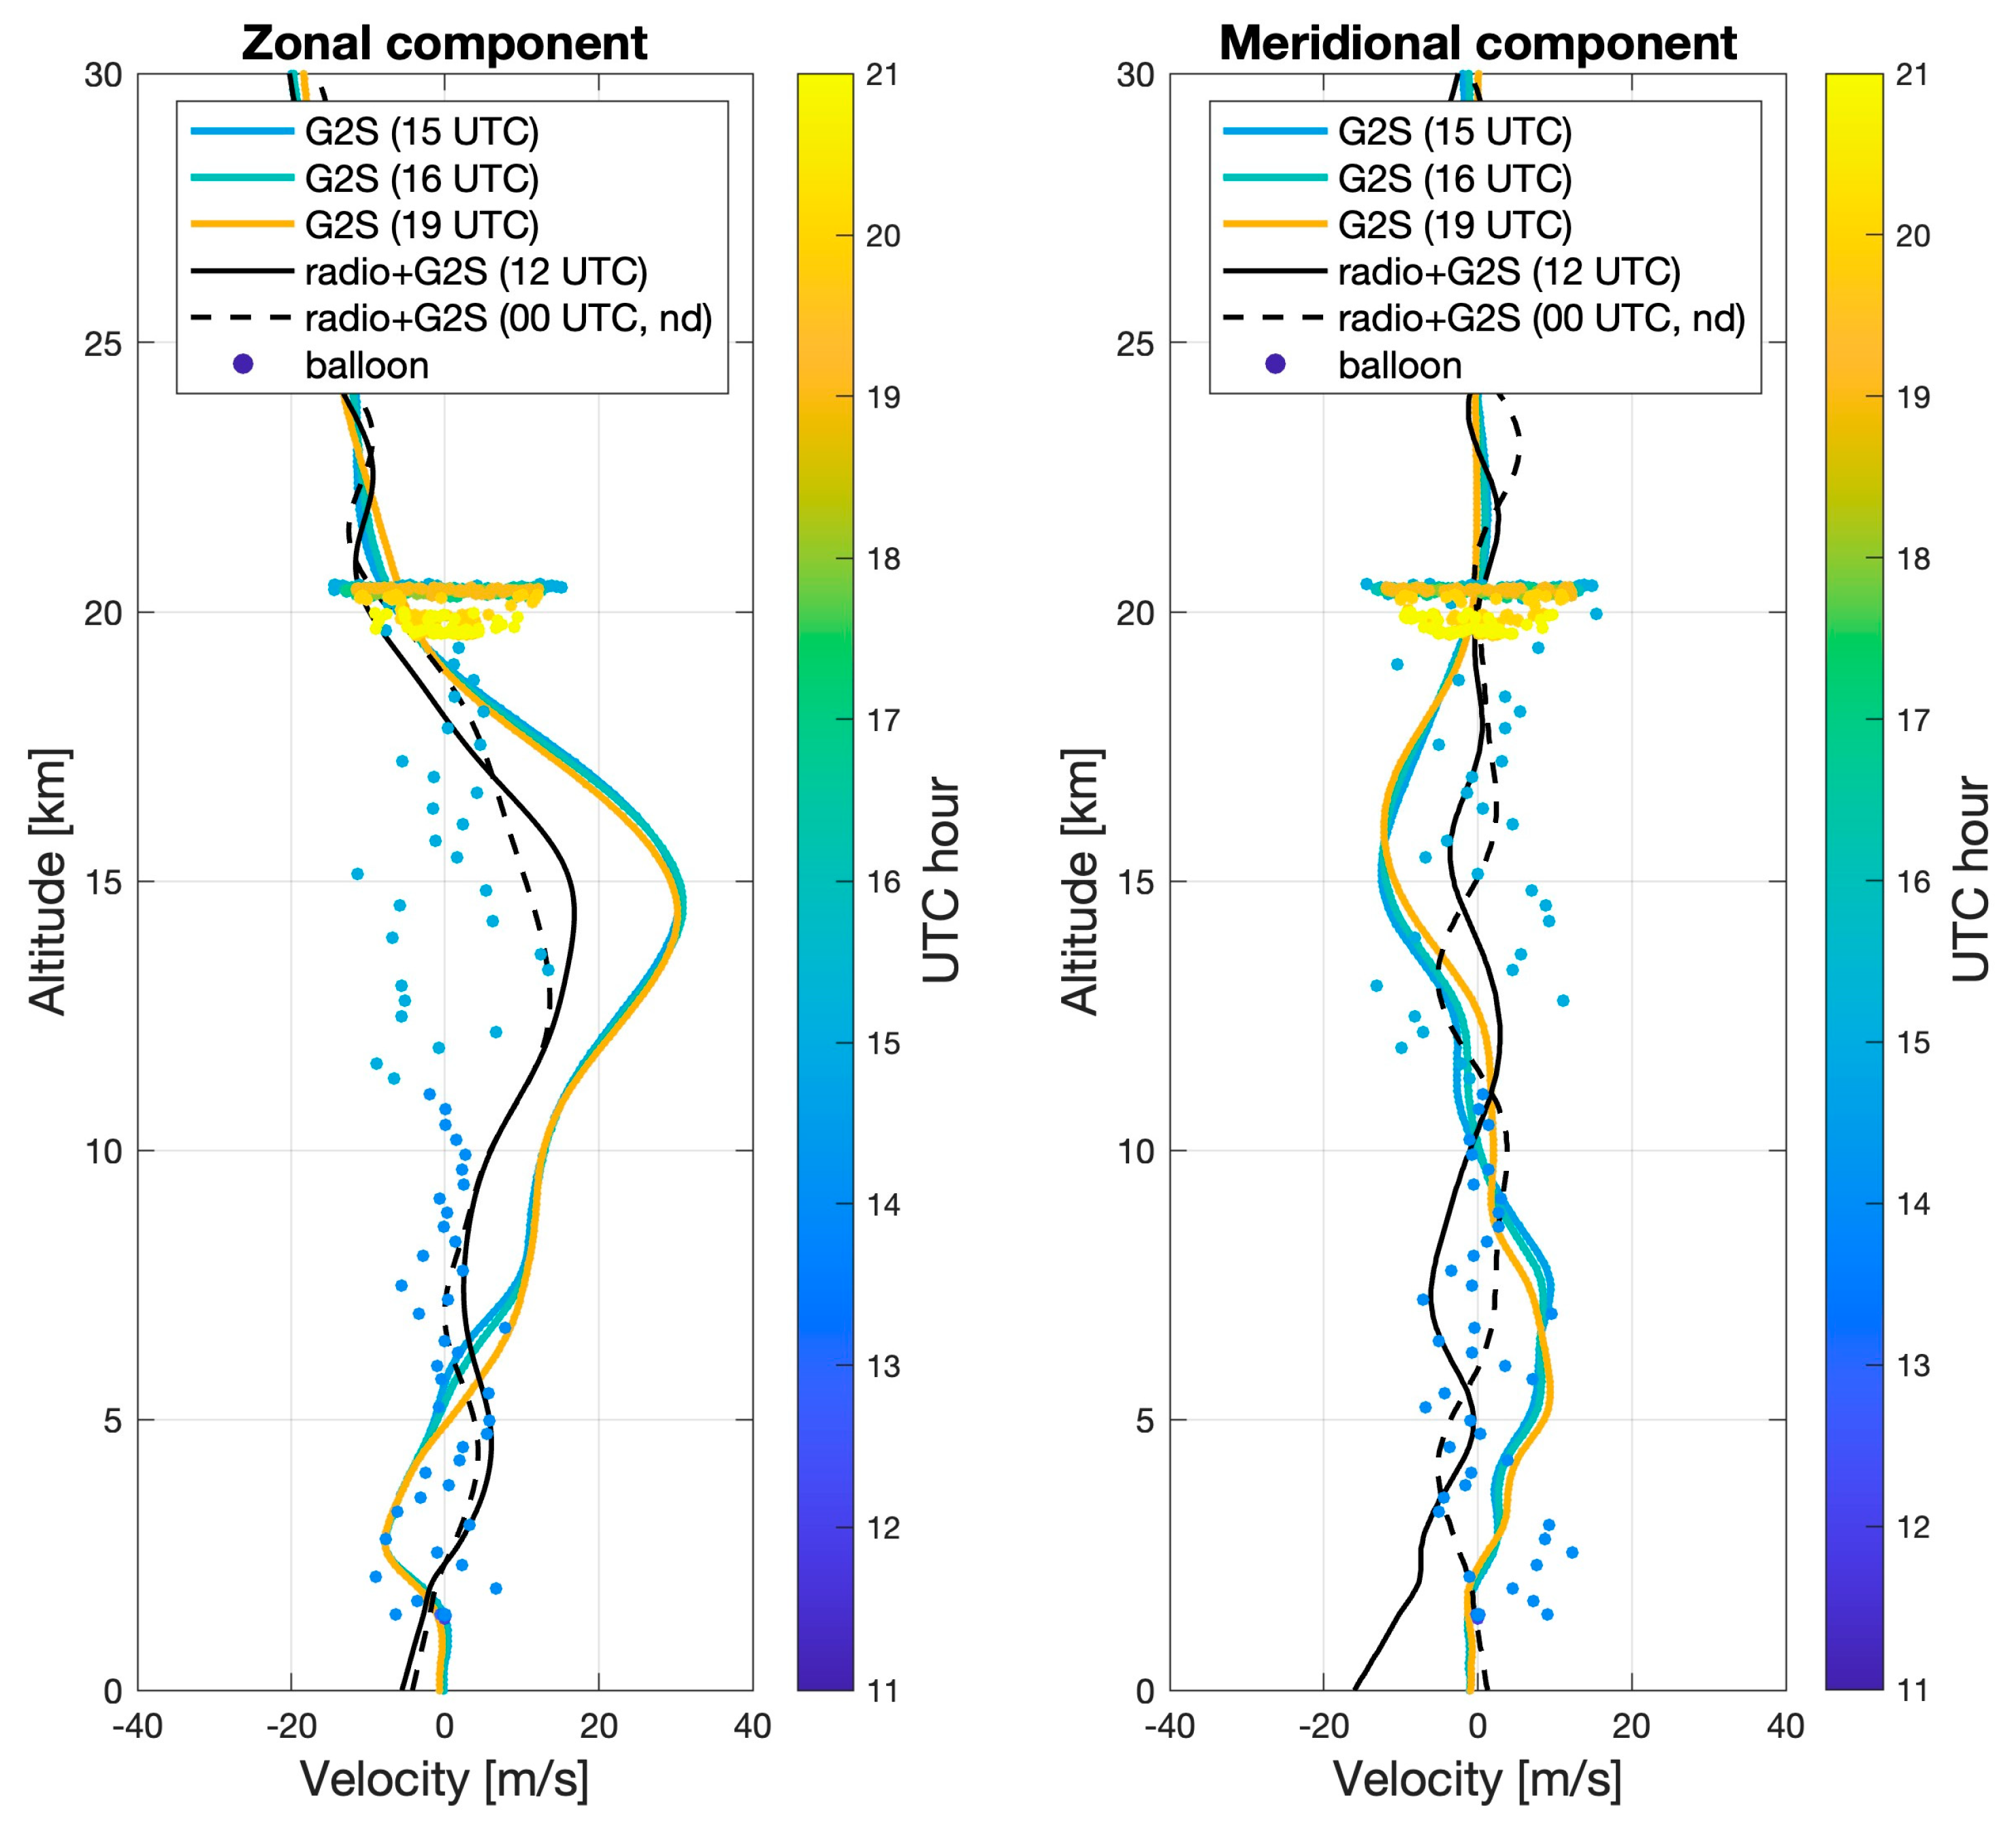
To evaluate whether gravity waves might be responsible for the Event 3 signal arrival in a predicted acoustic shadow zone, we plotted and compared atmospheric profiles and the horizontal drift velocity of the balloon (Figure 4). We first tabulated the horizontal drift speed of the balloon throughout the entire flight, including the ascent, and then converted those values to the zonal and meridional components. The G2S model atmosphere profiles do not exhibit significant variations on an hour-to-hour basis, from 15:00 UTC to 19:00 UTC. The radiosonde profiles (and therefore hybrid profiles) differ from the standalone G2S model atmosphere, but this is expected to some degree because radiosonde data correspond to real-life measurements for the given time and location. Overall, the differences between the G2S model atmosphere and the hybrid atmospheres vary and, in some instances, are demonstrably significant. For example, the wind velocity deviations in the zonal component at 15 km altitude exceed the expected amplitude of gravity wave perturbations at that same altitude (e.g., [33]).
There is a significant degree of variation in the horizontal motion of the balloon. The magnitude of the horizontal oscillations, relative to the G2S model and hybrid atmospheric profiles, was, on average, ~5 m/s, with the maximum at ~15 m/s for both components. However, compared to the G2S model values, the difference in the zonal component at around 15 km altitude was the greatest and ranged from 35–40 m/s. During the balloon flight at its natural buoyancy altitude, these oscillations can again be seen, varying by approximately ±15 m/s. Consistent with previous studies, the horizontal motion signature of the balloon is indicative of the gravity wave-induced small-scale structures [20,43,44,72].

6. Event 3 Propagation Modeling with Gravity Wave Perturbations

In light of observational evidence pointing to the presence of gravity waves (Figure 4), we elected to test whether applying gravity wave perturbations to the wind field might lead to predictions consistent with observations. As mentioned in Section 1, our goal is to constrain the region of greatest variability as it relates to high-altitude acoustic sensing.
We apply a simple approach by exclusively exploring the effect of gravity wave perturbations irrespective of other effects. As a first-order approximation, geometric ray tracing is appropriate to use for the purpose of this investigation because it can handle a large span of launch angles (e.g., very steep angles) and the frequencies are sufficiently high (e.g., [40,42]) (also see Section 4). Furthermore, an earlier, similar study demonstrated the utility of infraGA in handling perturbed atmospheric profiles [42].
We first applied gravity wave perturbations to the wind field by following the Monte Carlo-type approach employed by Silber and Brown [41] in their study of short-range acoustic signal propagation from meteoroids. Silber and Brown (2014) used the gravity wave perturbations to the local wind field scheme implemented in the InfraMAP software package [73,74]. In InfraMAP, the Gardner et al. [75] 2D horizontal wave number spectrum model is used to simulate the characteristics of the gravity wave field with a random-phase technique [76] in order to perturb the mean wind profile. Details about this implementation are available in Norris and Gibson [73] and Norris, Gibson, and Bongiovanni [31] and will not be further discussed here.
As described in Section 4, we used three atmospheric profiles (G2S and hybrid) for Event 3 ray tracing. We use these profiles again but with gravity wave perturbations included in the wind field. We also reiterate that the ‘small-scale’ perturbations have a wavelength greater than that of infrasound, and therefore, geometric ray tracing is applicable to the problem at hand.
A total of 600 gravity wave perturbation realizations were applied to the wind velocity component of each of the three atmospheric profiles (see Table 3). To differentiate the newly acquired perturbed atmospheric profiles based on the unperturbed atmospheric profile, we place them into 3 groups of 600 as follows: Group 1 (Table 3, Column 1), Group 2 (Table 3, Column 2), and Group 3 (Table 3, Column 3).
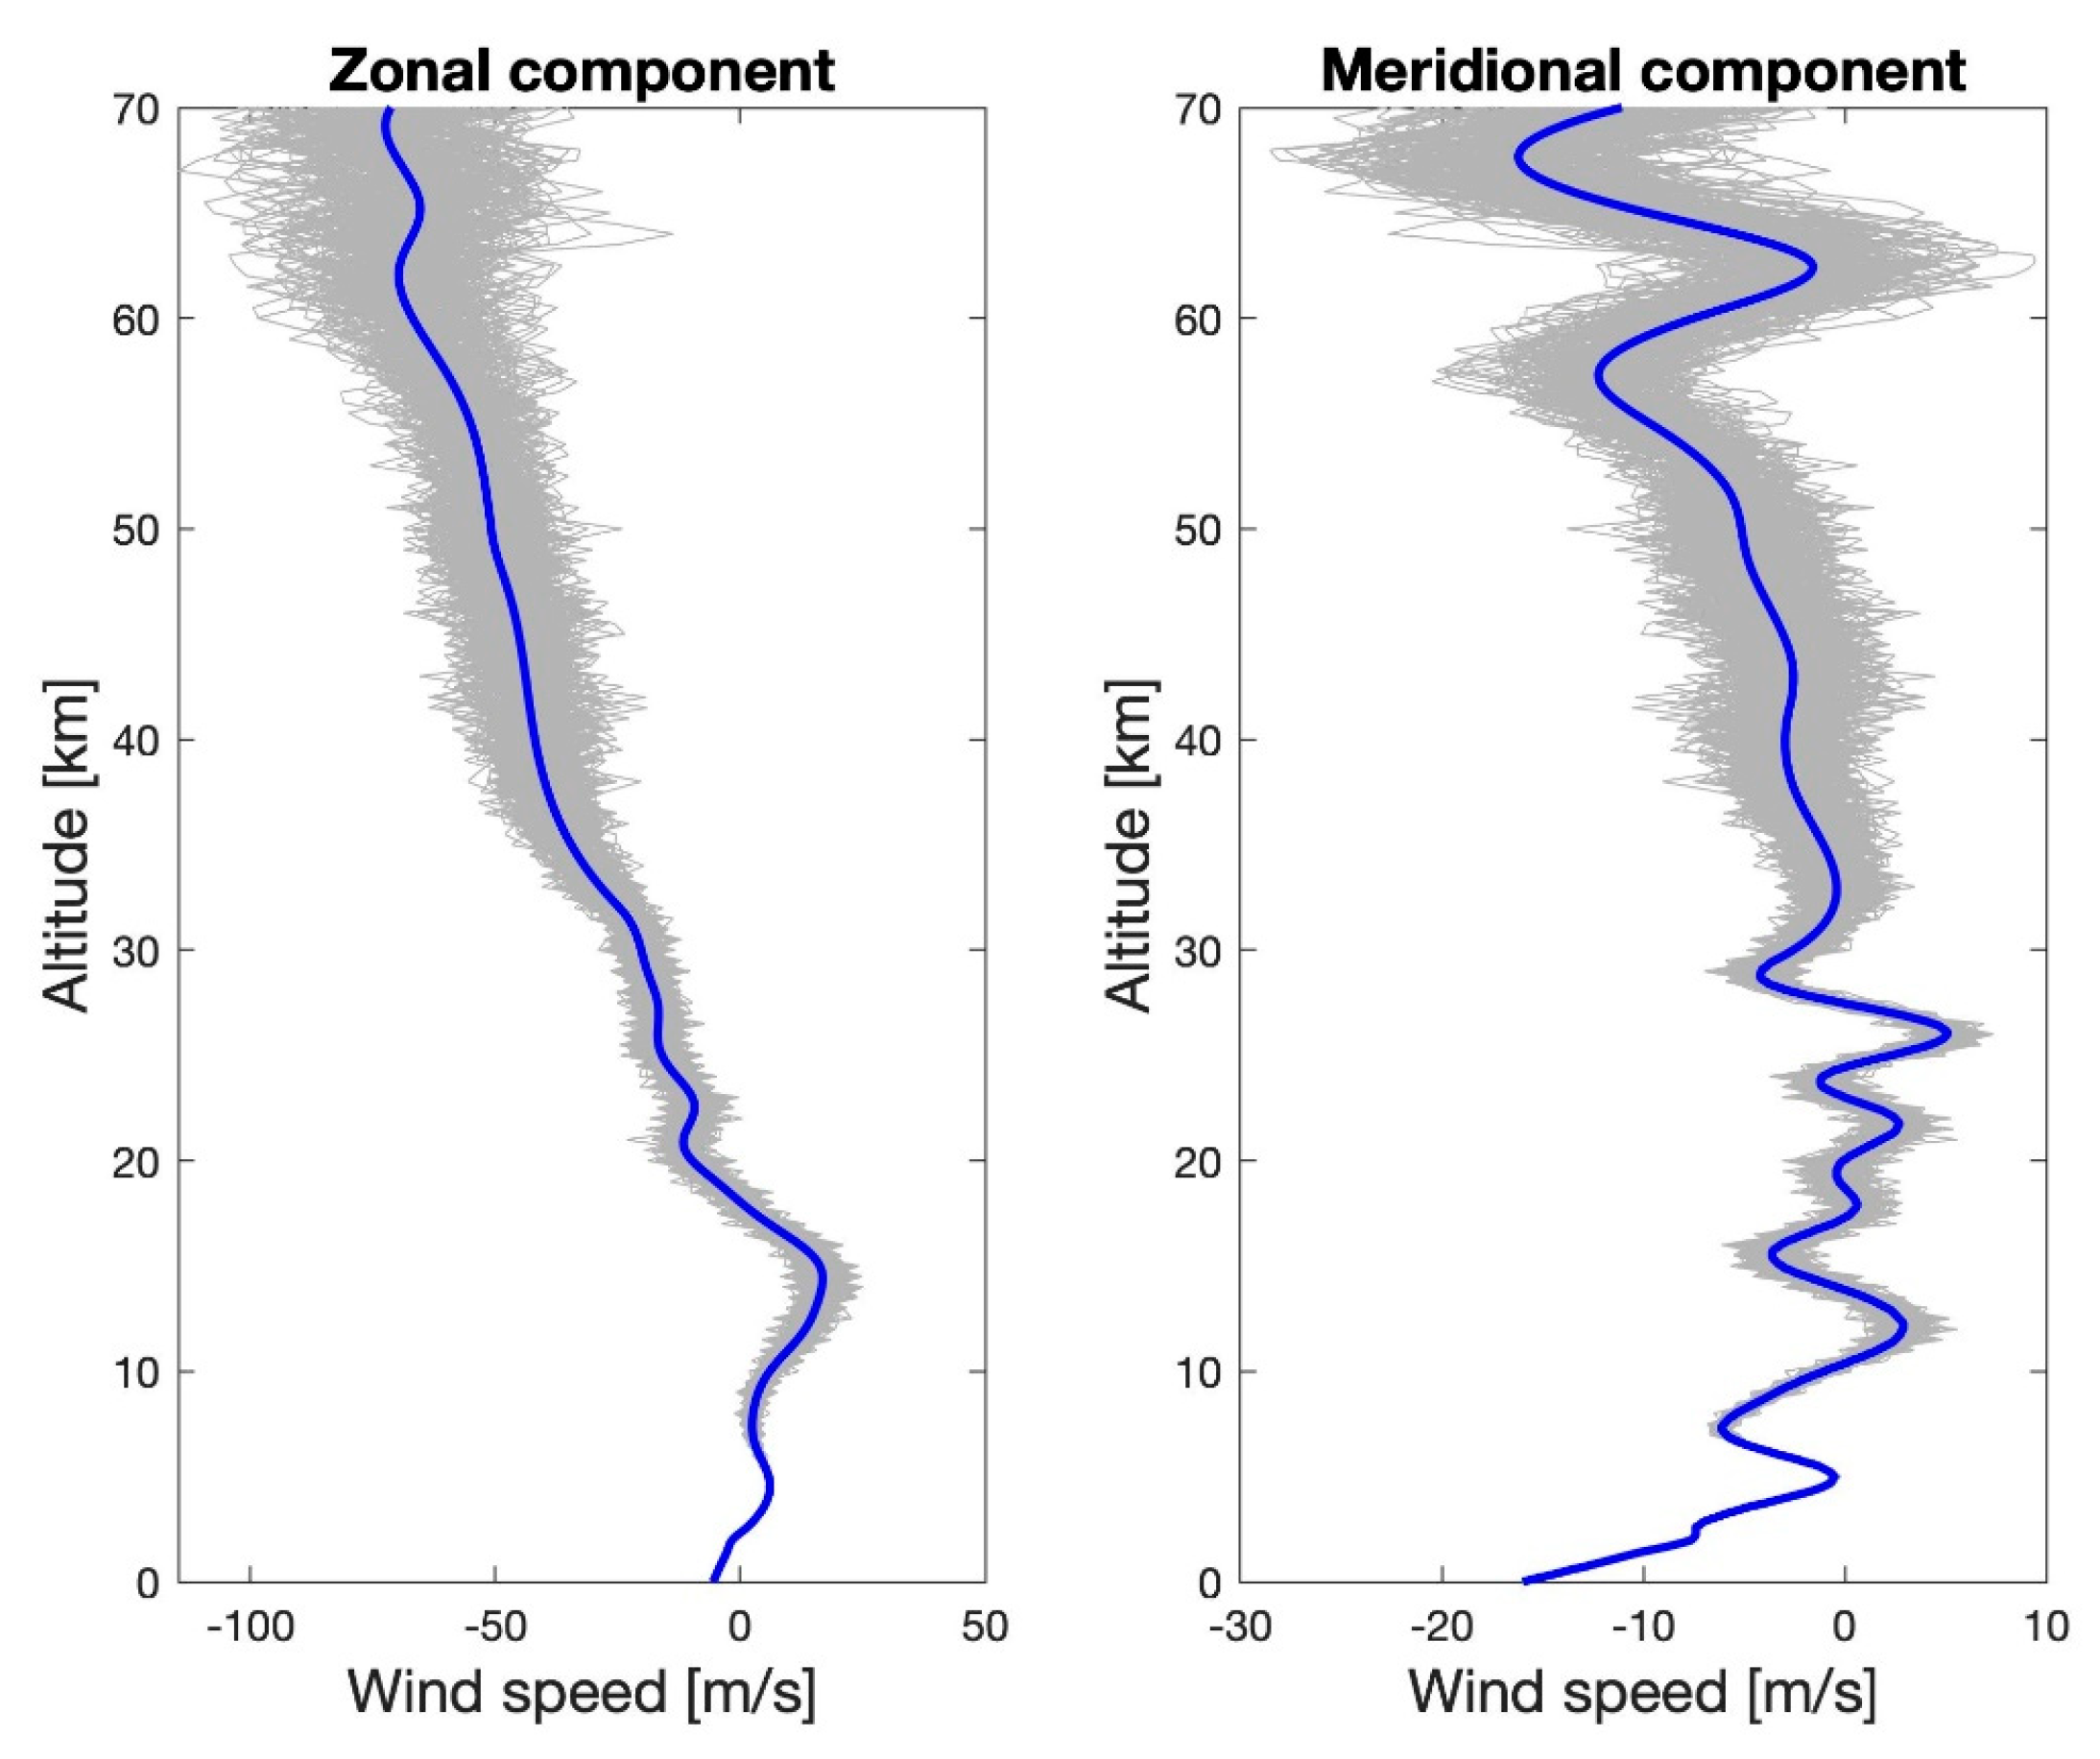
A representative sample of the perturbed profiles applied to a G2S model atmosphere is shown in Figure 5. The wind velocity was then broken into the zonal and meridional components as required by the InfraGA input format. For the purpose of ray tracing, each newly formed perturbed atmospheric profile was considered as a standalone input, corresponding to 1800 individual raytracing runs (3 groups of 600).
We utilized infraGA, this time using the eigenray search method (infraga-sph -eig_search) [61] to search for and identify acoustic propagation path(s) connecting the source and receiver. The ray tracing predictions using the spherical coordinate system are more robust (e.g., [77]). In this mode, the geographical coordinates of the source and the receiver are specified and used as input parameters (see Table 1 and Table 2). The infraGA methods only allow for an elevated source but not the receiver. Considering that this scenario is reversed in our study, i.e., the receiver is elevated while the source is at the ground level, we account for this by reversing the wind field direction. This method was previously applied and successfully used by Bowman and Krishnamoorthy [40]. Since the “source” in infraGA is the position of the balloon 20 km above the surface and the signal arrived from above, the ray launch angles were varied 0.5° (nearly horizontal) to 89.5° (nearly vertical) in 0.5° increments. We performed a total of 3600 ray tracing runs (corresponding to 1800 perturbed atmospheric profiles (600 per group) per event (3A and 3B)).
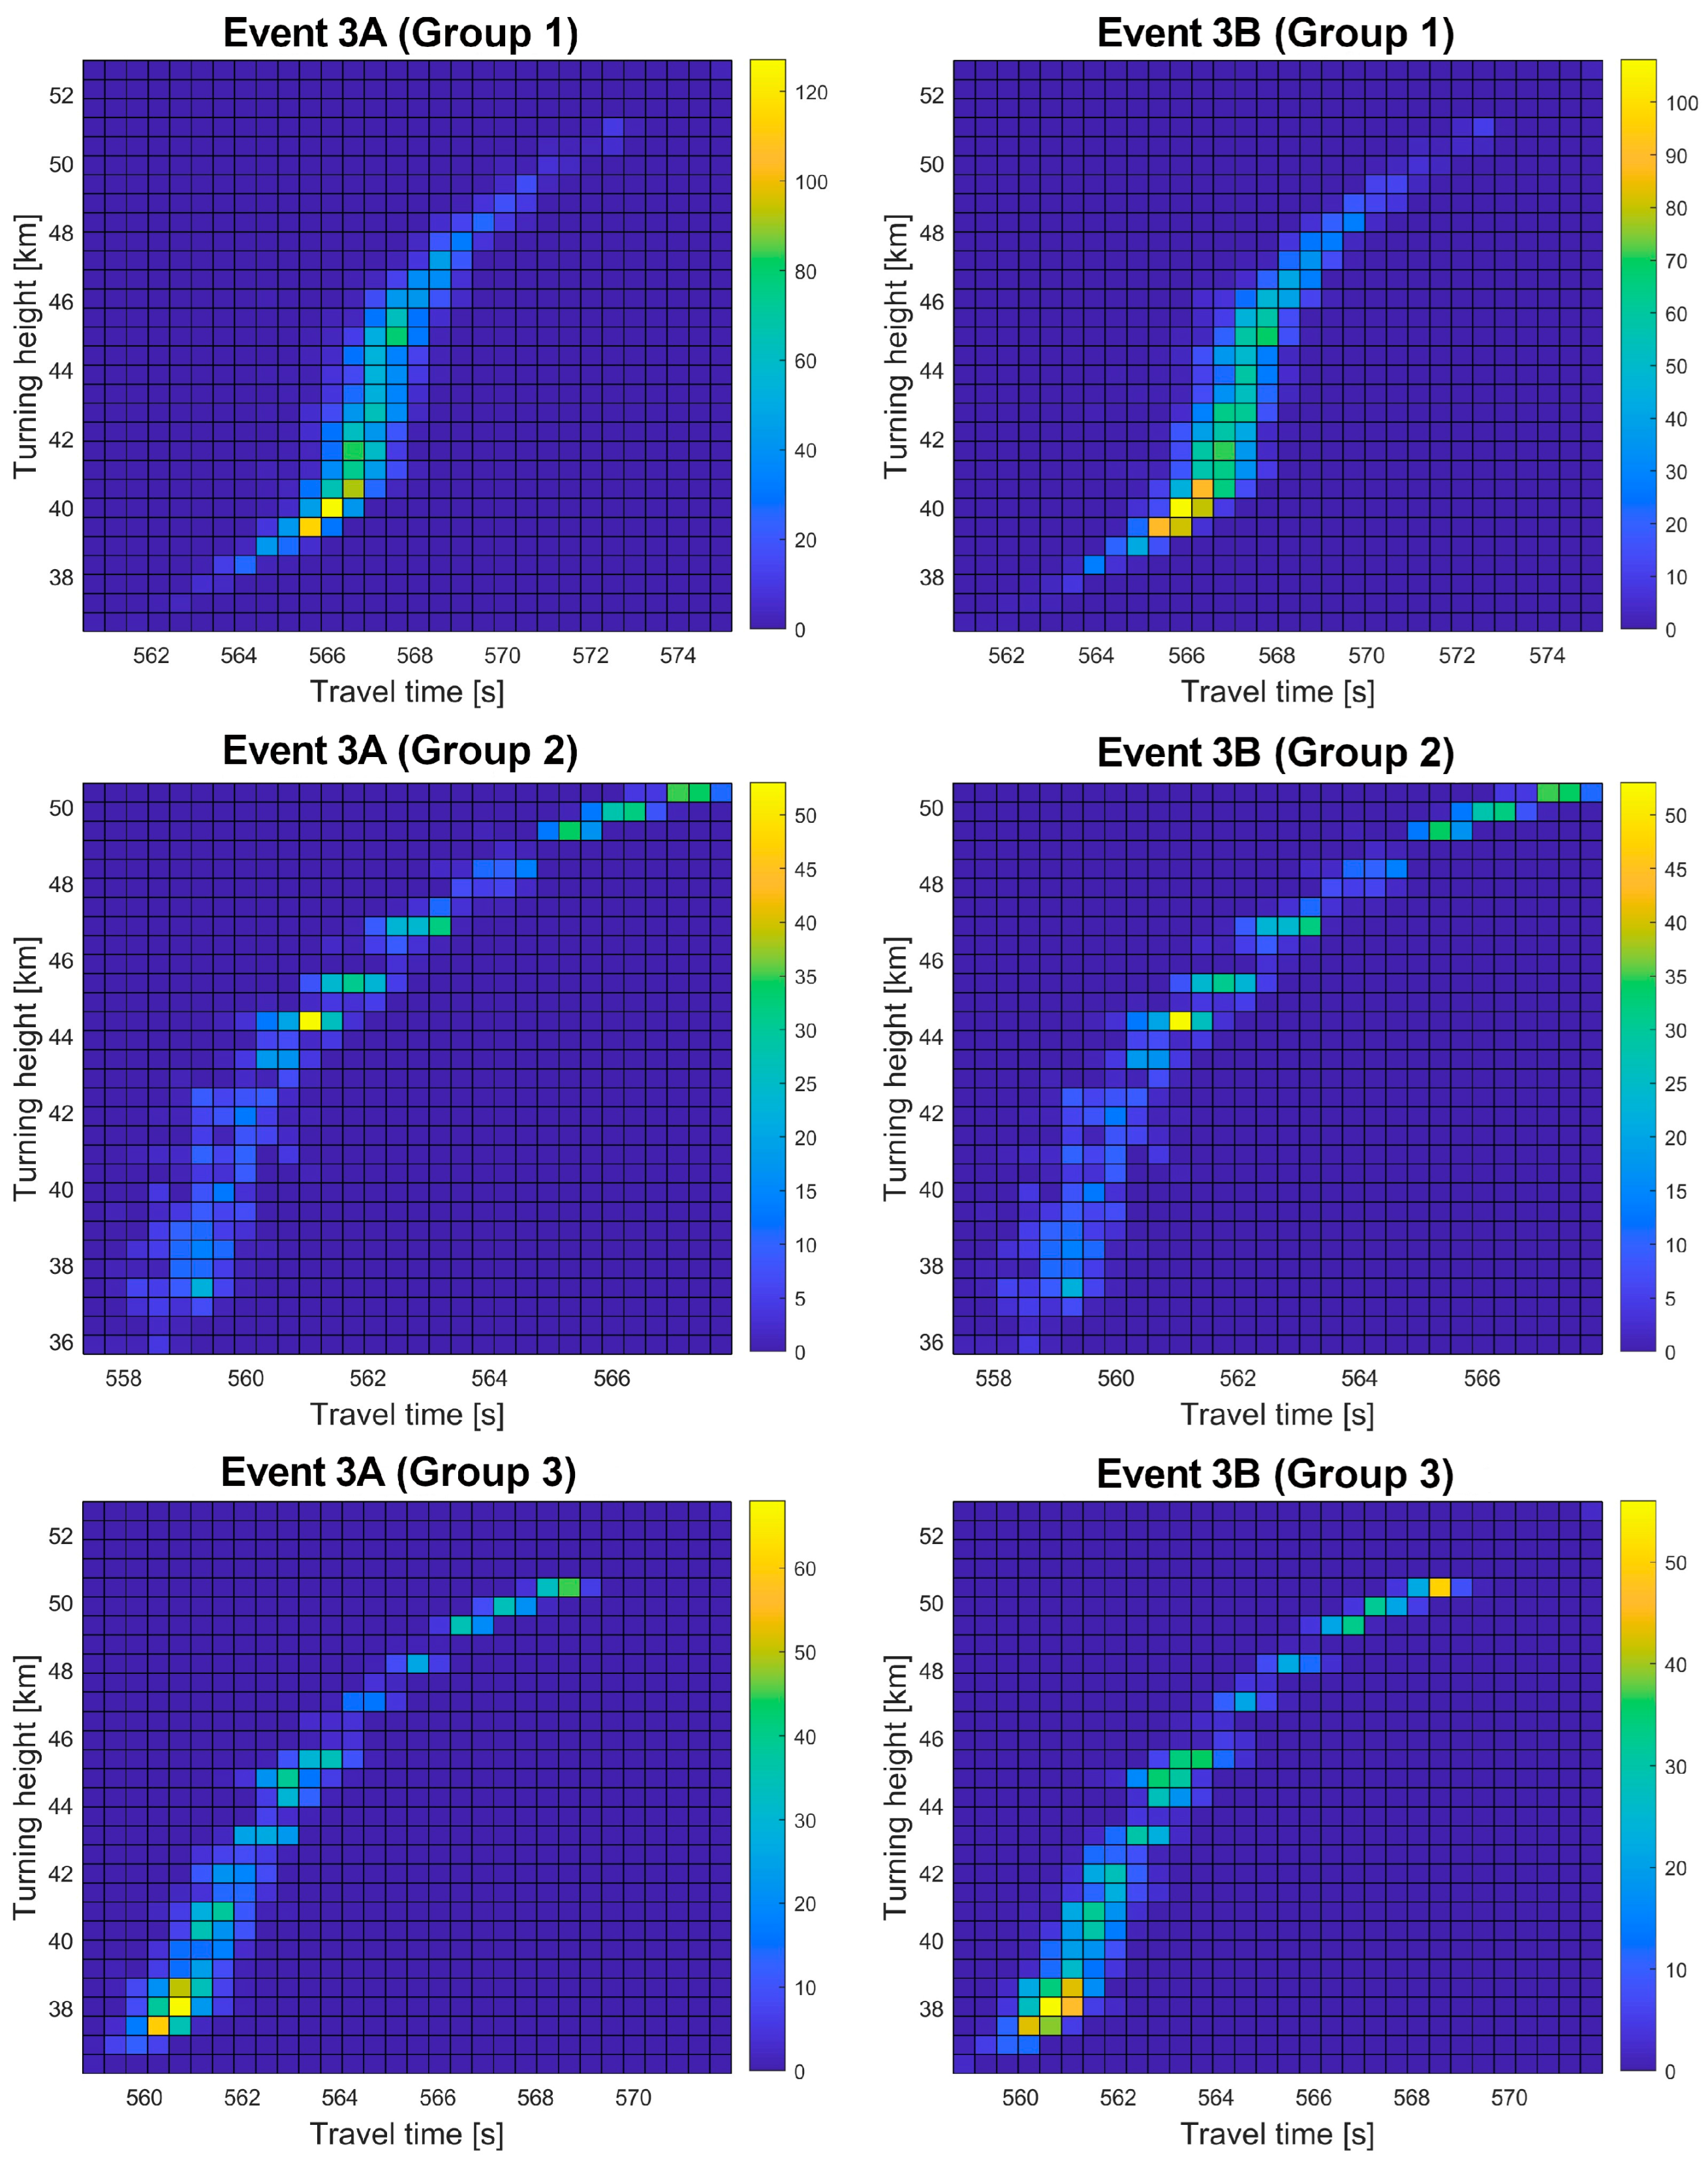
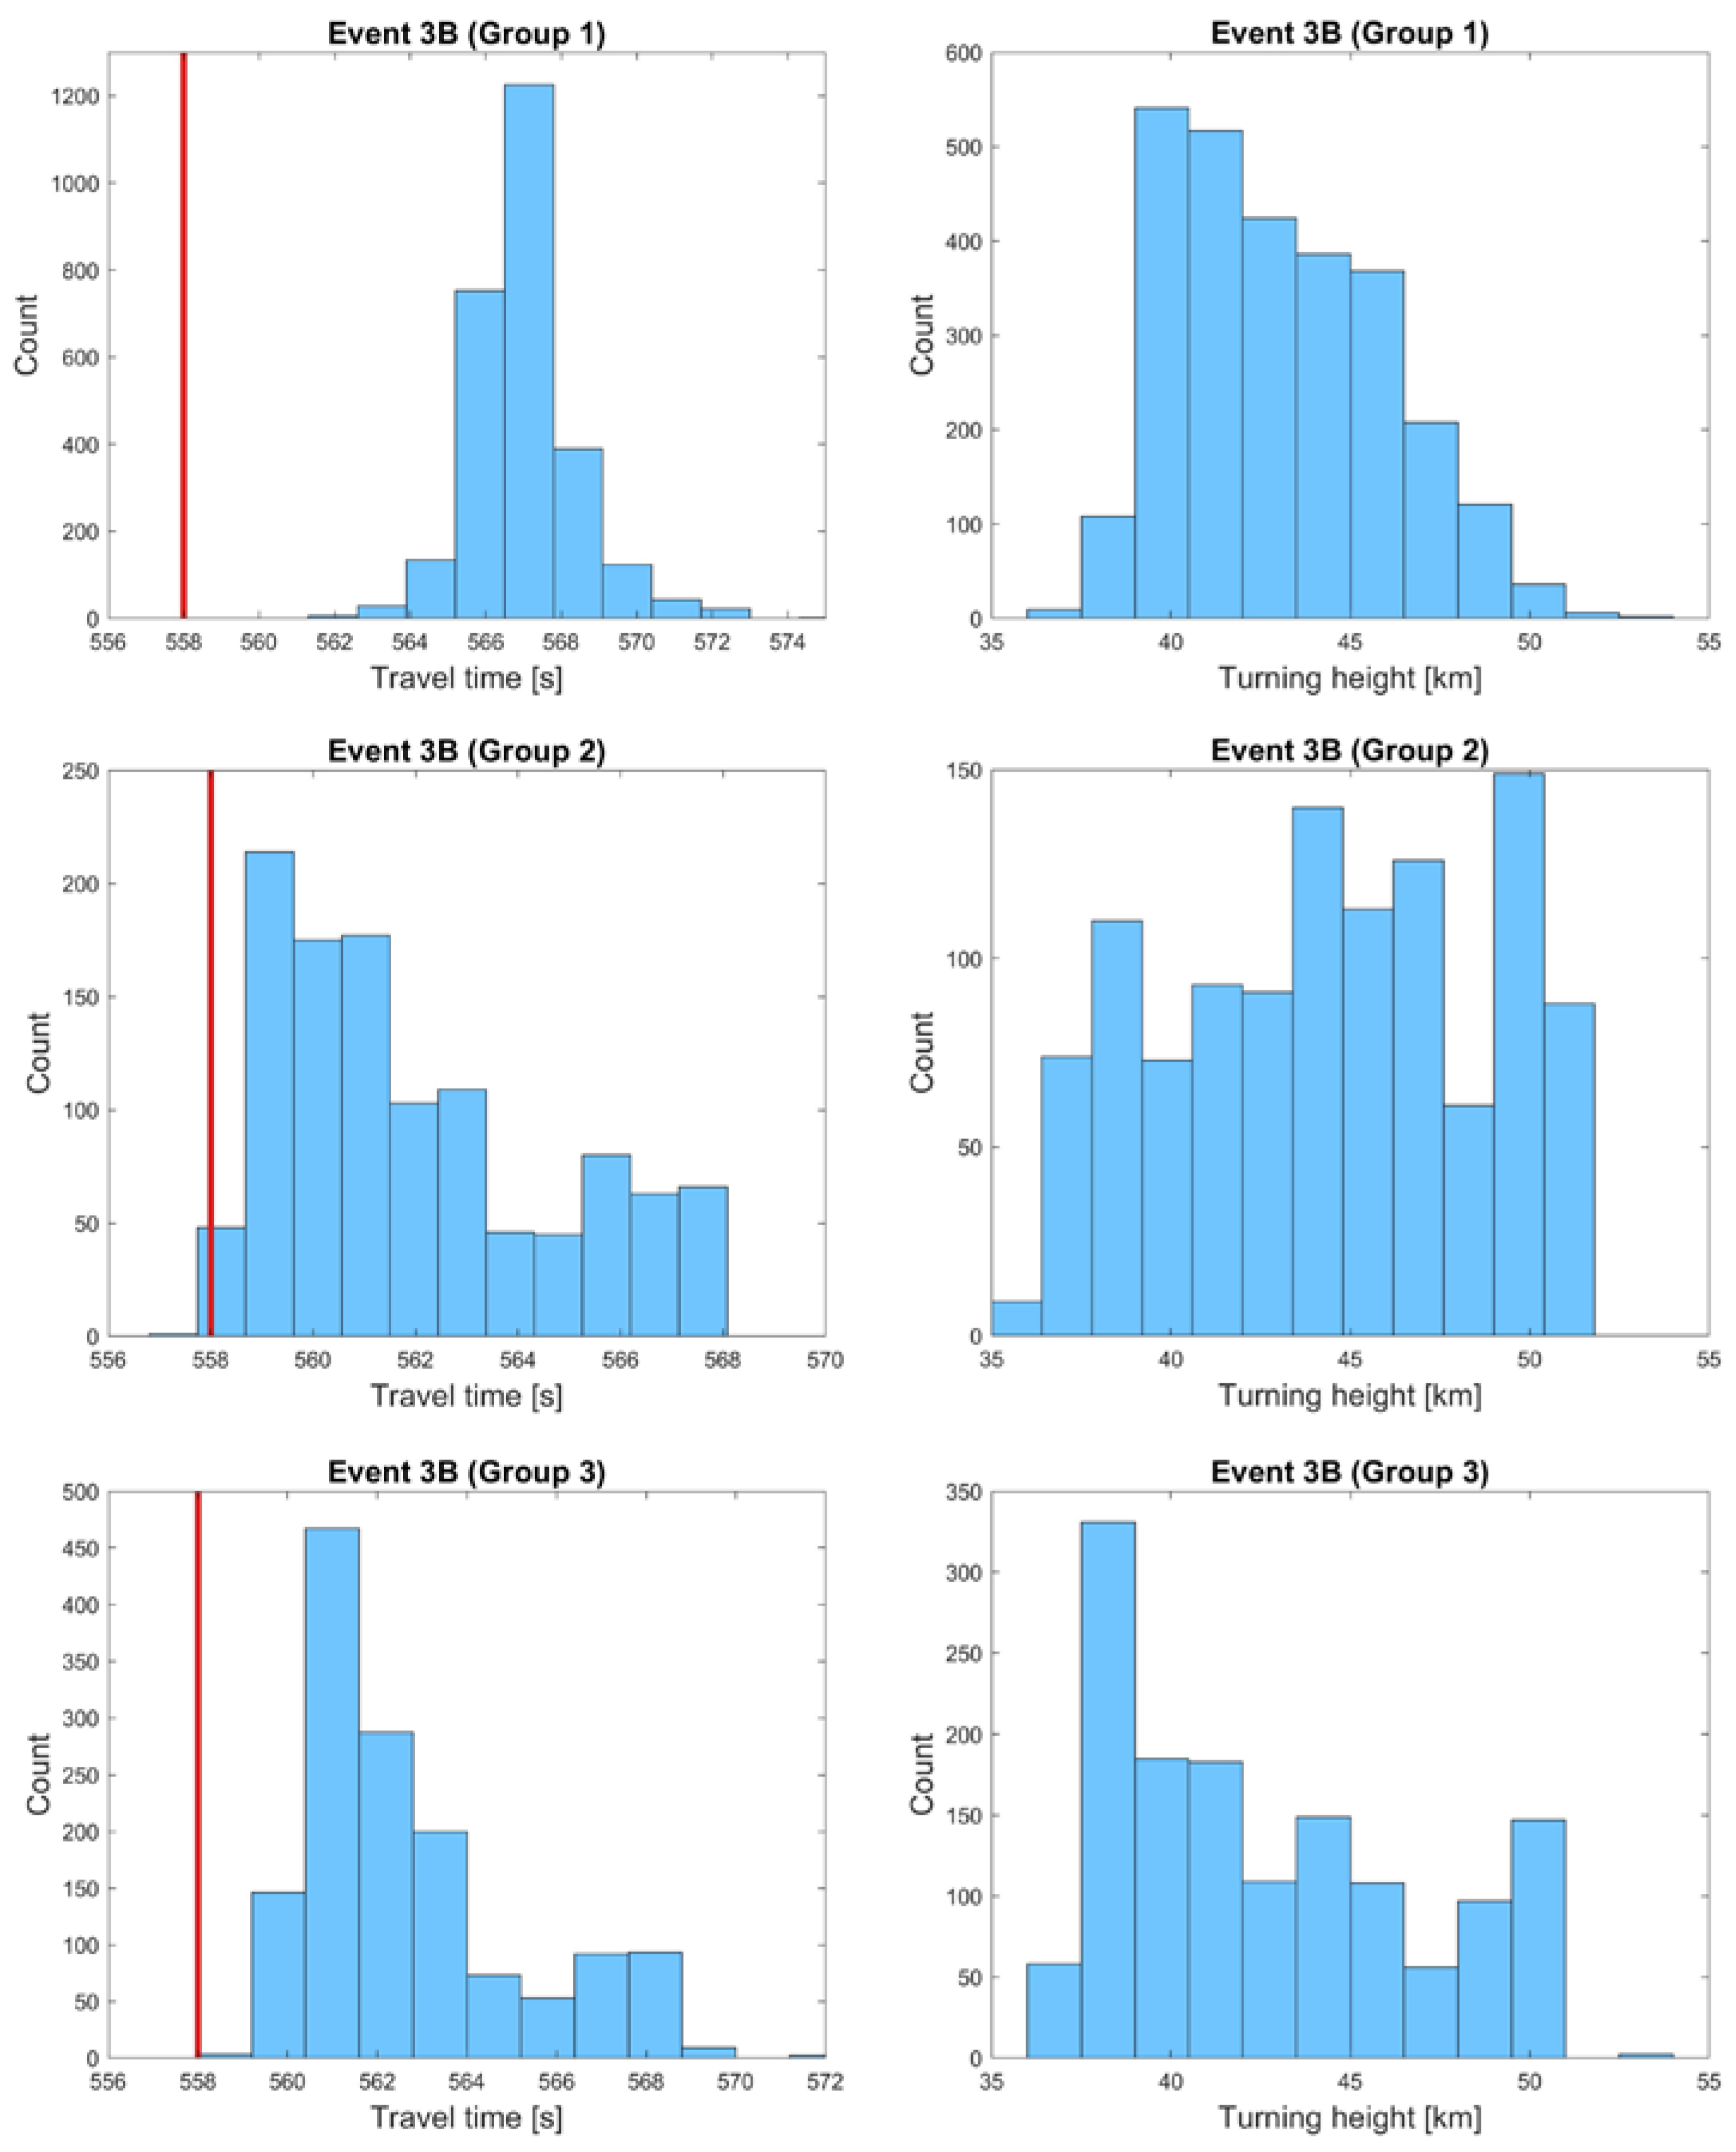
Depending on the group, 70% to 99% of perturbed profiles were conducive to generating at least one, and often several, eigenrays per atmosphere/run. The combined number of eigenrays across 600 runs per event in each group was ~2700 (Group 1), ~1100 (Group 3), and ~1400 (Group 3). Generally, if a ray tracing run with a given atmospheric profile results in multiple eigenrays, these rays might have different inclination angles and different turning heights. This is expected considering that small-scale perturbations to the wind field provide conditions necessary for multipathing. The ray travel times and ray turning heights are listed in Table 4. Figure 6 shows the density of eigenrays in the tht space, where t is the ray travel time, and ht is the ray turning height, i.e., the altitude at which the ray reflects towards the surface (see Figure 3). Since each one of the three groups of 600 perturbed atmospheres has its own unperturbed atmosphere, we plotted the results to reflect that. We also plotted the histograms to further visualize the distribution of ray travel times and ray turning heights (Figure 7). Noting that the results for Events 3A and 3B are very similar, we show the plots for Event 3B (Figure 7). Launch angles (from the position of the balloon) that resulted in eigenrays were confined to the angles between 30° and 45°.
We compared the predicted travel times for all eigenrays to the observed travel times to evaluate the combined effect of atmospheric conditions and small-scale perturbations to the wind field. To account for possible errors in instrumentation and user time picks, we allowed for ±1 s error in observed times and, therefore, assumed that any predicted rays arriving within that time relative to the observed travel times are consistent with observations. In Group 1, the apparent airwave travel time was heavily skewed towards values significantly greater than that corresponding to the observed travel time of 557 and 558 s for Events 3A and 3B, respectively. The fastest travel time achieved was 560 s for Event 3A and 561 s for Event 3B, and the longest was 575 s. The fastest arrivals were also associated with the lowest turning heights (centered around 40 km) (Figure 6 and Figure 7). The runs in Group 2 were the closest match to the observed airwave times and consistent with that observed for both Event 3A and 3B. Overall, the ray travel times were skewed toward lower values (Figure 7). In Group 3, the shortest predicted travel time was 558.6 s, within 1 s of the observed travel time, which fulfilled the “detection” criterion for Event 3B but not for 3A. The maximum travel time was 572 s. Similar to Group 2, the ray travel times in Group 3 were skewed towards lower values. In both cases, however, there is a non-negligible number of rays with slow phases, all of them associated with greater turning heights (Figure 6 and Figure 7). The range in the ray turning heights in Groups 1 and 3 was 36–53 km; however, in Group 2, the upper limit was 2.4 km lower (Table 4). The turning heights for the eigenrays that fall within ±1 s of the observed travel time were confined to the region between 36 and 42.5 km.
Our results illuminate the intricate complexities of the issue, especially for Event 3. In the case of direct arrivals (i.e., direct path between source and receiver, and no reflections or refractions) at a very close range and well within the acoustic zone, propagation modeling using the G2S model atmosphere readily yielded the results consistent with observations (Events 1 and 2). However, for Event 3, adding small-scale perturbations to the wind field significantly improved the results.
Gravity wave amplitudes are the largest in the middle atmosphere, and therefore, the stratosphere is where their effect on the local wind field is most prominent (e.g., [33,34,75]). Because of this, direct arrivals from the ground to the receiver situated at elevations lower than ~20 km are not expected to suffer from the effect of gravity wave structures in the same way as reflected and refracted signals that traverse greater distances and/or spend a portion of their paths at higher altitudes.
Specific to Event 3, we aimed to tackle a two-sided problem: (1) explain the signal detected in a classical near-field shadow zone by adding small-scale perturbations to the wind field (as these were directly observed in our balloon data), and (2) obtain predicted signal travel times consistent with that observed. By implementing gravity wave perturbations to the wind field, we demonstrated that eigenrays are possible regardless of the unperturbed atmospheric profile used, readily explaining the signal detection in the acoustic shadow zone. The acoustic wave underwent upward refraction before reaching the receiver, thereby spending enough time in the stratosphere where gravity wave amplitudes are non-negligible. Our findings are consistent with previous studies that also mention gravity wave perturbations as an important factor behind signal detections in an acoustic shadow zone (e.g., [65,67,78]).
Despite concerted efforts to accurately represent atmospheric specifications at any given location, there are examples where such specifications do not always appropriately describe infrasound propagation at regional distances, even with the implementation of small-scale perturbations (e.g., [78]). Our results also show that even though there are eigenrays, it does not necessarily follow that any of the predicted signal travel times would appropriately describe that observed, adding another layer of complexity. This is likely due to the atmospheric specifications not being represented accurately enough either through the G2S model or the measurements. Out of 1800 perturbed profiles used in this study (600 profiles per one unperturbed atmospheric specification), only Group 2 atmospheric profiles resulted in travel times consistent with that observed. Radiosonde measurements are collected every 12 h, and the conditions are not expected to remain unchanged in between. However, despite being collected many hours before Event 3, radiosonde data still provide a more viable solution, demonstrating the importance of real-life measurements.

7. Conclusions

Balloon-borne sensors can probe the atmosphere during the flight to provide important clues about the local wind conditions and small-scale fluctuations. In this work, we demonstrated that direct acoustic arrivals (i.e., no reflections or refractions) that were well within the acoustic zone (Events 1 and 2) were readily predicted via propagation modeling. However, arrivals detected while the balloon was within the acoustic shadow zone (Event 3) were explained by the implementation of gravity wave perturbations to the wind field for all atmospheric profiles used in propagation modeling. Signal travel times for Event 3 were correctly predicted by a group of 600 perturbed profiles that were derived based on the unperturbed atmospheric profile consisting of radiosonde data and the G2S model atmosphere. Our study suggests that the effect of gravity waves is non-negligible even at regional distances (<200 km), especially for infrasound reflecting from the stratosphere before reaching the floating receiver. At regional distances, it is imperative to have robust atmospheric specifications, especially at altitudes where gravity wave perturbation amplitudes are small relative to intrinsic differences among various atmospheric models. Future studies should compare different models that include small-scale perturbations to explore possible deficiencies and identify factors that will lead to the refinement of current models. Another path of investigation should include rigorous analyses of small-scale fluctuations and how their interactions might affect infrasound propagation at regional scales.

Author Contributions

Conceptualization, E.A.S. and D.C.B.; methodology and formal analysis, E.A.S.; data curation, D.C.B.; writing—original draft preparation, E.A.S.; writing—review and editing, E.A.S. and D.C.B.; visualization, E.A.S. and D.C.B.; project administration and funding acquisition, D.C.B. All authors have read and agreed to the published version of the manuscript.

Funding

The authors acknowledge support from the DARPA AtmoSense program under Contract No. 067201110A. The balloon flight was performed with support from the NASA Flight Opportunities Program. This research was also funded by the National Nuclear Security Administration, Defense Nuclear Nonproliferation Research and Development (NNSA DNN R&D). The authors acknowledge important interdisciplinary collaboration with scientists and engineers from LANL, LLNL, MSTS, PNNL, and SNL. The research was also funded by Contract No. 80 NM0018D004 with the National Aeronautics and Space Administration.

Data Availability Statement

All software packages and atmospheric data used in this work are open source. The InfraGA software package can be downloaded from https://github.com/LANL-Seismoacoustics/infraGA. The Google map in Figure 1 was generated using a modified version of the MATLAB code written by Bar–Yehuda, https://github.com/zoharby/plot_google_map/tree/master. Radiosonde data are available from Integrated Global Radiosonde Archive (IGRA), https://www.ncei.noaa.gov/data/integrated-global-radiosonde-archive.

Acknowledgments

Sandia National Laboratories is a multimission laboratory managed and operated by National Technology & Engineering Solutions of Sandia, LLC, a wholly-owned subsidiary of Honeywell International Inc., for the U.S. Department of Energy’s National Nuclear Security Administration under Contract No. DE-NA0003525. This paper describes objective technical results and analysis. Any subjective views or opinions that might be expressed in the paper do not necessarily represent the views of the U.S. Department of Energy or the United States Government. The authors thank Phil Blom for discussions on InfraGA ray tracing code and Bill McIntosh and Nelia Dunbar for the use of their property during the balloon launch. The authors also thank the four anonymous reviewers for their helpful comments.

Conflicts of Interest

The authors declare no conflict of interest.

References

  1. Bedard, A.; Georges, T. Atmospheric infrasound. Acoust. Aust. 2000, 28, 47–52. [Google Scholar] [CrossRef]
  2. Garcés, M.; Willis, M.; Hetzer, C.; Le Pichon, A.; Drob, D. On using ocean swells for continuous infrasonic measurements of winds and temperature in the lower, middle, and upper atmosphere. Geophys. Res. Lett. 2004, 31, L19304. [Google Scholar] [CrossRef]
  3. Pilger, C.; Hupe, P.; Gaebler, P.; Ceranna, L. 1001 Rocket Launches for Space Missions and Their Infrasonic Signature. Geophys. Res. Lett. 2021, 48, e2020GL092262. [Google Scholar] [CrossRef]
  4. Negraru, P.T.; Golden, P.; Herrin, E.T. Infrasound Propagation in the “Zone of Silence”. Seismol. Res. Lett. 2010, 81, 614–624. [Google Scholar] [CrossRef]
  5. Matoza, R.; Fee, D.; Green, D.; Mialle, P. Volcano Infrasound and the International Monitoring System. In Infrasound Monitoring for Atmospheric Studies: Challenges in Middle Atmosphere Dynamics and Societal Benefits; Le Pichon, A., Blanc, E., Hauchecorne, A., Eds.; Springer International Publishing: Cham, Switzerland, 2019; pp. 1023–1077. [Google Scholar]
  6. Silber, E.A.; ReVelle, D.O.; Brown, P.G.; Edwards, W.N. An estimate of the terrestrial influx of large meteoroids from infrasonic measurements. J. Geophys. Res. 2009, 114, E08006. [Google Scholar] [CrossRef] [Green Version]
  7. Evans, L.B.; Bass, H.E.; Sutherland, L.C. Atmospheric Absorption of Sound: Theoretical Predictions. J. Acoust. Soc. Am. 1972, 51, 1565–1575. [Google Scholar] [CrossRef]
  8. de Groot-Hedlin, C.D.; Hedlin, M.A.H.; Drob, D. Atmospheric variability and infrasound monitoring. In Infrasound Monitoring for Atmospheric Studies; Le Pichon, E.B.A., Hauchecorne, A., Eds.; Springer: New York, NY, USA, 2010. [Google Scholar]
  9. Hedlin, M.A.H.; Garces, M.; Bass, H.; Hayward, C.; Herrin, G.; Olson, J.; Wilson, C. Listening to the secret sounds of Earth’s atmosphere. Eos Trans. AGU 2002, 83, 557–565. [Google Scholar] [CrossRef]
  10. Bowman, D.C.; Lees, J.M. Infrasound in the middle stratosphere measured with a free-flying acoustic array. Geophys. Res. Lett. 2015, 42, 10010–10017. [Google Scholar] [CrossRef]
  11. Garcia, R.F.; Martire, L.; Chaigneau, Y.; Cadu, A.; Mimoun, D. An active source seismo-acoustic experiment using tethered balloons to validate instrument concepts and modelling tools for atmospheric seismology. Geophys. J. Int. 2020, 225, 186. [Google Scholar] [CrossRef]
  12. Krishnamoorthy, S.; Komjathy, A.; Pauken, M.T.; Cutts, J.A.; Garcia, R.F.; Mimoun, D.; Cadu, A.; Sournac, A.; Jackson, J.M.; Lai, V.H.; et al. Detection of Artificially Generated Seismic Signals Using Balloon-Borne Infrasound Sensors. Geophys. Res. Lett. 2018, 45, 3393–3403. [Google Scholar] [CrossRef] [Green Version]
  13. Weaver, R.L.; McAndrew, J. The Roswell Report: Fact Versus Fiction in the New Mexico Desert; 1428994920; Diane Publishing: Collingdale, PA, USA, 1995; p. 881. [Google Scholar]
  14. Wescott, J.W. Acoustic Detection of High-Altitude Turbulence; Michigan Univ Ann Arbor: Ann Arbor, MI, USA, 1964; p. 62. [Google Scholar]
  15. Bowman, D.C.; Lees, J.M. Upper atmosphere heating from ocean-generated acoustic wave energy. Geophys. Res. Lett. 2018, 45, 5144. [Google Scholar] [CrossRef]
  16. Stevenson, D.J.; Cutts, J.A.; Mimoun, D.; Arrowsmith, S.; Banerdt, W.B.; Blom, P.; Brageot, E.; Brissaud, Q.; Chin, G.; Gao, P. Probing the Interior Structure of Venus; Keck Institute for Space Studies: Pasadena, CA, USA, 2015. [Google Scholar]
  17. Krishnamoorthy, S.; Bowman, D.C. A “Floatilla” of Airborne Seismometers for Venus. Geophys. Res. Lett. 2023, 50, e2022GL100978. [Google Scholar] [CrossRef]
  18. Bowman, D.C. Airborne Infrasound Makes a Splash. Geophys. Res. Lett. 2021, 48, e2021GL096326. [Google Scholar] [CrossRef]
  19. Krishnamoorthy, S.; Bowman, D.C.; Komjathy, A.; Pauken, M.T.; Cutts, J.A. Origin and mitigation of wind noise on balloon-borne infrasound microbarometers. J. Acoust. Soc. Am. 2020, 148, 2361. [Google Scholar] [CrossRef] [PubMed]
  20. Silber, E.A.; Bownman, D.C.; Ronac Giannone, M. Detection of the Large Surface Explosion Coupling Experiment by a sparse network of balloon-borne infrasound sensors. Remote Sens. 2023, 15, 542. [Google Scholar] [CrossRef]
  21. Bowman, D.C.; Lees, J.M. A Comparison of the Ocean Microbarom Recorded on the Ground and in the Stratosphere. J. Geophys. Res. Atmos. 2017, 122, 9773–9782. [Google Scholar] [CrossRef]
  22. Bowman, D.; Lees, J.; Cutts, J.; Komjathy, A.; Young, E.; Seiffert, K.; Boslough, M.; Arrowsmith, S. Geoacoustic observations on drifting balloon-borne sensors. In Infrasound Monitoring for Atmospheric Studies; Springer: Berlin/Heidelberg, Germany, 2019; pp. 125–171. [Google Scholar]
  23. Hedlin, M.A.H.; Walker, K.; Drob, D.P.; de Groot-Hedlin, C.D. Infrasound: Connecting the solid earth, oceans, and atmosphere. Annu. Rev. Earth Planet. Sci. 2012, 40, 327–354. [Google Scholar] [CrossRef] [Green Version]
  24. Wilson, D.K.; Ostashev, V.E.; Shaw, M.J.; Muhlestein, M.B.; Weatherly, J.W.; Swearingen, M.E.; McComas, S.L. Infrasound Propagation in the Arctic; Cold Regions Research and Engineering Laboratory (U.S.): Hanover, NH, USA, 2021; p. 90. [Google Scholar]
  25. de Groot-Hedlin, C.D. Infrasound propagation in tropospheric ducts and acoustic shadow zones. J. Acoust. Soc. Am. 2017, 142, 1816–1827. [Google Scholar] [CrossRef]
  26. Drob, D.P.; Garces, M.; Hedlin, M.; Brachet, N. The Temporal Morphology of Infrasound Propagation. Pure Appl. Geophys. 2010, 167, 437–453. [Google Scholar] [CrossRef]
  27. Sutherland, L.C.; Bass, H.E. Atmospheric absorption in the atmosphere up to 160 km. J. Acoust. Soc. Am. 2004, 115, 1012–1032. [Google Scholar] [CrossRef]
  28. Hedlin, M.A.H.; Walker, K.T. A study of infrasonic anisotropy and multipathing in the atmosphere using seismic networks. Philos. Trans. R. Soc. A: Math. Phys. Eng. Sci. 2013, 371, 20110542. [Google Scholar] [CrossRef] [Green Version]
  29. Kulichkov, S. On the Prospects for Acoustic Sounding of the Fine Structure of the Middle Atmosphere. In Infrasound Monitoring for Atmospheric Studies; Le Pichon, A., Blanc, E., Hauchecorne, A., Eds.; Springer: Dordrecht, The Netherlands, 2010; pp. 511–540. [Google Scholar]
  30. Garces, M.A.; Hansen, R.A.; Lindquist, K.G. Traveltimes for infrasonic waves propagating in a stratified atmosphere. Geophys. J. Int. 1998, 135, 255–263. [Google Scholar] [CrossRef] [Green Version]
  31. Norris, D.; Gibson, R.; Bongiovanni, K. Numerical Methods to Model Infrasonic Propagation Through Realistic Specifications of the Atmosphere. In Infrasound Monitoring for Atmospheric Studies; Le Pichon, A., Blanc, E., Hauchecorne, A., Eds.; Springer: Dordrecht, The Netherlands, 2010; pp. 541–573. [Google Scholar]
  32. Sabatini, R.; Marsden, O.; Bailly, C.; Gainville, O. Three-dimensional direct numerical simulation of infrasound propagation in the Earth’s atmosphere. J. Fluid Mech. 2019, 859, 754–789. [Google Scholar] [CrossRef] [Green Version]
  33. Fritts, D.C.; Alexander, M.J. Gravity wave dynamics and effects in the middle atmosphere. Rev. Geophys. 2003, 41, 1–124. [Google Scholar]
  34. Nappo, C.J. An Introduction to Atmospheric Gravity Waves, 2nd ed.; Academic Press: Cambridge, MA, USA, 2013; Volume 102. [Google Scholar]
  35. Ostashev, V.E.; Chunchuzov, I.P.; Wilson, D.K. Sound propagation through and scattering by internal gravity waves in a stably stratified atmosphere. J. Acoust. Soc. Am. 2005, 118, 3420–3429. [Google Scholar] [CrossRef] [Green Version]
  36. Green, D.N.; Vergoz, J.; Gibson, R.; Le Pichon, A.; Ceranna, L. Infrasound radiated by the Gerdec and Chelopechene explosions: Propagation along unexpected paths. Geophys. J. Int. 2011, 185, 890–910. [Google Scholar] [CrossRef] [Green Version]
  37. Ceranna, L.; Le Pichon, A.; Green, D.N.; Mialle, P. The Buncefield explosion: A benchmark for infrasound analysis across Central Europe. Geophys. J. Int. 2009, 177, 491–508. [Google Scholar] [CrossRef] [Green Version]
  38. Kulichkov, S.N.; Bush, G.A.; Svertilov, A.I. New type of infrasonic arrivals in the geometric shadow region at long distances from explosions. Izv. Atmos. Ocean. Phys. 2002, 38, 397–402. [Google Scholar]
  39. Averbuch, G.; Ronac-Giannone, M.; Arrowsmith, S.; Anderson, J.F. Evidence for Short Temporal Atmospheric Variations Observed by Infrasonic Signals: 1. The Troposphere. Earth Space Sci. 2022, 9, e2021EA002036. [Google Scholar] [CrossRef]
  40. Bowman, D.C.; Krishnamoorthy, S. Infrasound from a buried chemical explosion recorded on a balloon in the lower stratosphere. Geophys. Res. Lett. 2021, 48, e2021GL094861. [Google Scholar] [CrossRef]
  41. Silber, E.A.; Brown, P.G. Optical observations of meteors generating infrasound—I: Acoustic signal identification and phenomenology. J. Atmos. Sol. Terr. Phys. 2014, 119, 116–128. [Google Scholar] [CrossRef] [Green Version]
  42. Bird, E.J.; Lees, J.M.; Kero, J.; Bowman, D.C. Topographically Scattered Infrasound Waves Observed on Microbarometer Arrays in the Lower Stratosphere. Earth Space Sci. 2022, 9, e2022EA002226. [Google Scholar] [CrossRef]
  43. Young, E.F.; Bowman, D.C.; Lees, J.M.; Klein, V.; Arrowsmith, S.J.; Ballard, C. Explosion-generated infrasound recorded on ground and airborne microbarometers at regional distances. Seismol. Res. Lett. 2018, 89, 1497–1506. [Google Scholar] [CrossRef]
  44. Bowman, D.C.; Albert, S.A. Acoustic event location and background noise characterization on a free flying infrasound sensor network in the stratosphere. Geophys. J. Int. 2018, 213, 1524–1535. [Google Scholar] [CrossRef] [Green Version]
  45. Poler, G.; Garcia, R.F.; Bowman, D.C.; Martire, L. Infrasound and Gravity Waves Over the Andes Observed by a Pressure Sensor on Board a Stratospheric Balloon. J. Geophys. Res. Atmos. 2020, 125, e2019JD031565. [Google Scholar] [CrossRef]
  46. Bowman, D.C.; Rouse, J.W.; Krishnamoorthy, S.; Silber, E.A. Infrasound direction of arrival determination using a balloon-borne aeroseismometer. JASA Express Lett. 2022, 2, 054001. [Google Scholar] [CrossRef]
  47. Silber, E.; Brown, P. Infrasound Monitoring as a Tool to Characterize Impacting Near-Earth Objects (NEOs). In Infrasound Monitoring for Atmospheric Studies: Challenges in Middle Atmosphere Dynamics and Societal Benefits; Le Pichon, A., Blanc, E., Hauchecorne, A., Eds.; Springer International Publishing: Cham, Switzerland, 2019; pp. 939–986. [Google Scholar]
  48. Brissaud, Q.; Martin, R.; Garcia, R.F.; Komatitsch, D. Hybrid Galerkin numerical modelling of elastodynamics and compressible Navier–Stokes couplings: Applications to seismo-gravito acoustic waves. Geophys. J. Int. 2017, 210, 1047–1069. [Google Scholar] [CrossRef] [Green Version]
  49. Waxler, R.; Assink, J.; Velea, D. Modal expansions for infrasound propagation and their implications for ground-to-ground propagation. J. Acoust. Soc. Am. 2017, 141, 1290–1307. [Google Scholar] [CrossRef] [PubMed]
  50. Assink, J.; Waxler, R.; Velea, D. A wide-angle high Mach number modal expansion for infrasound propagation. J. Acoust. Soc. Am. 2017, 141, 1781–1792. [Google Scholar] [CrossRef]
  51. Collins, M.D.; Evans, R.B. A two-way parabolic equation for acoustic backscattering in the ocean. J. Acoust. Soc. Am. 1992, 91, 1357–1368. [Google Scholar] [CrossRef]
  52. Ostashev, V.E.; Muhlestein, M.B.; Wilson, D.K. Extra-wide-angle parabolic equations in motionless and moving media. J. Acoust. Soc. Am. 2019, 145, 1031–1047. [Google Scholar] [CrossRef]
  53. Wilson, D.K.; Shaw, M.J.; Ostashev, V.E.; Muhlestein, M.B.; Alter, R.E.; Swearingen, M.E.; McComas, S.L. Numerical modeling of mesoscale infrasound propagation in the Arctic. J. Acoust. Soc. Am. 2022, 151, 138–157. [Google Scholar] [CrossRef]
  54. Blom, P. GeoAc: Numerical Tools to Model Acoustic Propagation in the Geometric Limit; Los Alamos National Laboratory: Los Alamos, NM, USA, 2014. [Google Scholar]
  55. Koch, K.; Pilger, C.; Czanik, C.; Bondár, I. The 12 December 2017 Baumgarten Gas Hub Explosion: A Case Study on Understanding the Occurrence of a Large Infrasound Azimuth Residual and a Lack of Seismic Observations. Pure Appl. Geophys. 2020, 177, 4957–4970. [Google Scholar] [CrossRef]
  56. Park, J.; Hayward, C.; Stump, B.W. Assessment of infrasound signals recorded on seismic stations and infrasound arrays in the western United States using ground truth sources. Geophys. J. Int. 2018, 213, 1608–1628. [Google Scholar] [CrossRef] [Green Version]
  57. Smink, M.M.E.; Assink, J.D.; Bosveld, F.C.; Smets, P.S.M.; Evers, L.G. A Three-Dimensional Array for the Study of Infrasound Propagation Through the Atmospheric Boundary Layer. J. Geophys. Res. Atmos. 2019, 124, 9299–9313. [Google Scholar] [CrossRef]
  58. De Negri, R.; Matoza, R.S. Rapid Location of Remote Volcanic Infrasound Using 3D Ray Tracing and Empirical Climatologies: Application to the 2011 Cordón Caulle and 2015 Calbuco Eruptions, Chile. J. Geophys. Res. Solid Earth 2023, 128, e2022JB025735. [Google Scholar] [CrossRef]
  59. Obenberger, K.S.; Bowman, D.C.; Dao, E. Identification of Acoustic Wave Signatures in the Ionosphere From Conventional Surface Explosions Using MF/HF Doppler Sounding. Radio Sci. 2022, 57, e2021RS007413. [Google Scholar] [CrossRef]
  60. Albert, S.A. Atmospheric Structure Prediction for Infrasound Propagation Modeling Using Deep Learning. Earth Space Sci. 2022, 9, e2022EA002233. [Google Scholar] [CrossRef]
  61. Blom, P.; Waxler, R. Modeling and observations of an elevated, moving infrasonic source: Eigenray methods. J. Acoust. Soc. Am. 2017, 141, 2681–2692. [Google Scholar] [CrossRef] [PubMed]
  62. Blom, P.; Waxler, R. Impulse propagation in the nocturnal boundary layer: Analysis of the geometric component. J. Acoust. Soc. Am. 2012, 131, 3680–3690. [Google Scholar] [CrossRef]
  63. Drob, D.P.; Picone, J.M.; Garces, M. Global morphology of infrasound propagation. J. Geophys. Res. 2003, 108, 1–12. [Google Scholar] [CrossRef]
  64. Edwards, W.N.; Brown, P.G.; Weryk, R.J.; ReVelle, D.O. Infrasonic Observations of Meteoroids: Preliminary Results from a Coordinated Optical-radar-infrasound Observing Campaign. In Advances in Meteoroid and Meteor Science; Trigo-Rodríguez, J.M., Rietmeijer, F.J.M., Llorca, J., Janches, D., Eds.; Springer: New York, NY, USA, 2008; pp. 221–229. [Google Scholar]
  65. Pilger, C.; Streicher, F.; Ceranna, L.; Koch, K. Application of propagation modeling to verify and discriminate ground-truth infrasound signals at regional distances. InfraMatics 2013, 2013, 39–55. [Google Scholar] [CrossRef] [Green Version]
  66. Le Pichon, A.; Assink, J.D.; Heinrich, P.; Blanc, E.; Charlton-Perez, A.; Lee, C.F.; Keckhut, P.; Hauchecorne, A.; Rüfenacht, R.; Kämpfer, N.; et al. Comparison of co-located independent ground-based middle atmospheric wind and temperature measurements with numerical weather prediction models. J. Geophys. Res. Atmos. 2015, 120, 8318–8331. [Google Scholar] [CrossRef] [Green Version]
  67. Chunchuzov, I.; Kulichkov, S.; Perepelkin, V.; Ziemann, A.; Arnold, K.; Kniffka, A. Mesoscale variations in acoustic signals induced by atmospheric gravity waves. J. Acoust. Soc. Am. 2009, 125, 651–663. [Google Scholar] [CrossRef] [PubMed]
  68. Hedlin, M.A.; Drob, D.P. Statistical characterization of atmospheric gravity waves by seismoacoustic observations. J. Geophys. Res. Atmos. 2014, 119, 5345–5363. [Google Scholar] [CrossRef]
  69. Drob, D.P.; Broutman, D.; Hedlin, M.A.; Winslow, N.W.; Gibson, R.G. A method for specifying atmospheric gravity wavefields for long-range infrasound propagation calculations. J. Geophys. Res. 2013, 118, 3933. [Google Scholar] [CrossRef]
  70. Silber, E.A.; Boslough, M.; Hocking, W.K.; Gritsevich, M.; Whitaker, R.W. Physics of meteor generated shock waves in the Earth’s atmosphere—A review. Adv. Space Res. 2018, 62, 489–532. [Google Scholar] [CrossRef] [Green Version]
  71. Zhang, S.D.; Yi, F.; Huang, C.M.; Huang, K.M. High vertical resolution analyses of gravity waves and turbulence at a midlatitude station. J. Geophys. Res. Atmos. 2012, 117, D02103. [Google Scholar] [CrossRef] [Green Version]
  72. Chunchuzov, I.; Kulichkov, S.; Perepelkin, V.; Popov, O.; Firstov, P.; Assink, J.D.; Marchetti, E. Study of the wind velocity-layered structure in the stratosphere, mesosphere, and lower thermosphere by using infrasound probing of the atmosphere. J. Geophys. Res. Atmos. 2015, 120, 8828–8840. [Google Scholar] [CrossRef]
  73. Norris, D.; Gibson, R. Integration of Enhanced Propagation, Environmental Variability, and Network Performance Models into the InfraMAP Software Toolkit; BBN Technologies: Arlington, VA, USA, 2007; p. 69. [Google Scholar]
  74. Norris, D.; Gibson, R. InfraMAP Enhancements: Environmental/Propagation Variability and Localization Accuracy of Infrasonic Networks. In Proceedings of the 24th Seismic Research Review—Nuclear Explosion Monitoring: Innovation and Integration, Ponte Vedra Beach, FL, USA, 17–19 September 2002. [Google Scholar]
  75. Gardner, C.S.; Hostetler, C.A.; Franke, S.J. Gravity wave models for the horizontal wave number spectra of atmospheric velocity and density fluctuations. J. Geophys. Res. Atmos. 1993, 98, 1035–1049. [Google Scholar] [CrossRef]
  76. Peitgen, H.-O.; Saupe, D. The Science of Fractal Images; Springer: Berlin/Heidelberg, Germany, 1988. [Google Scholar]
  77. Blom, P. Modeling infrasonic propagation through a spherical atmospheric layer—Analysis of the stratospheric pair. J. Acoust. Soc. Am. 2019, 145, 2198–2208. [Google Scholar] [CrossRef] [PubMed]
  78. Smets, P.S.M.; Evers, L.G.; Näsholm, S.P.; Gibbons, S.J. Probabilistic infrasound propagation using realistic atmospheric perturbations. Geophys. Res. Lett. 2015, 42, 6510–6517. [Google Scholar] [CrossRef]
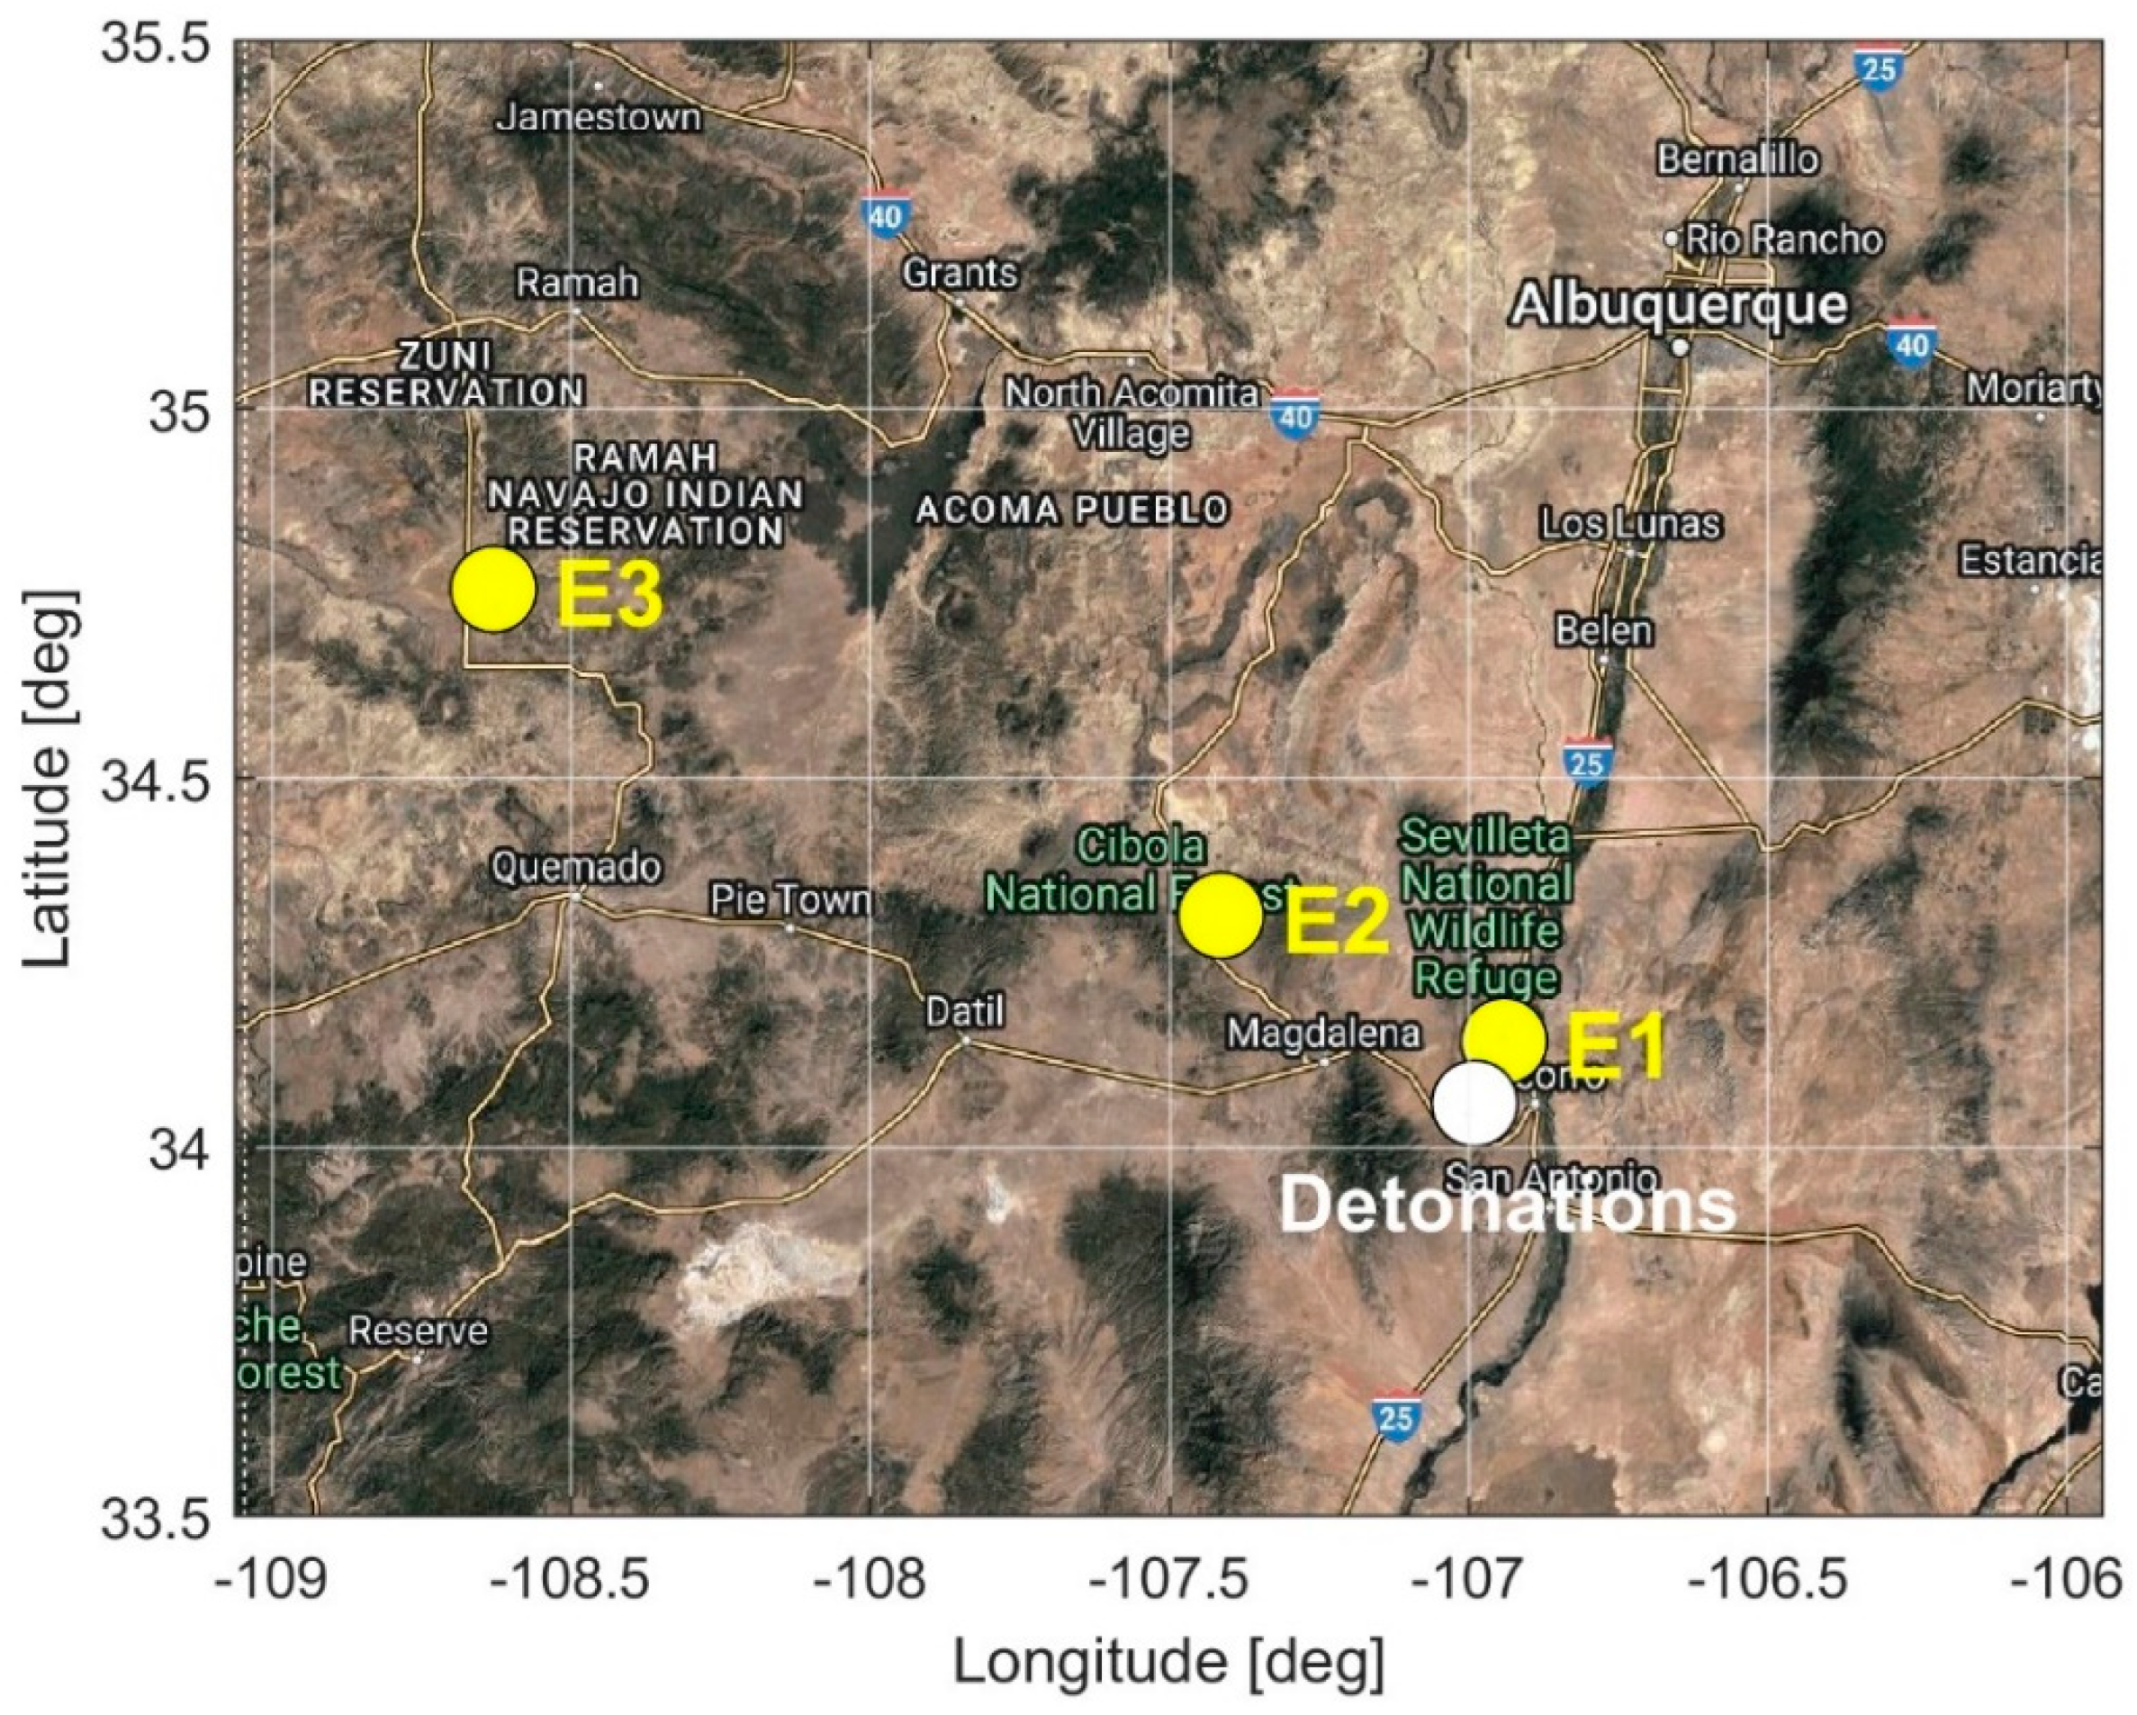
Figure 1. Map showing the event and balloon geographical locations. The event (detonations) location is denoted with the white circle. Yellow circles show the locations of the balloon when Events 1–3 (E1–E3) detections were made.
Remotesensing 15 03661 g001
Figure 2. Filtered waveforms with time picks for (a) Event 1, (b) Event 2, and (c) Event 3 explosion pairs. The red bar denotes the amplitude of 0.25 Pa, while the vertical green bars show time picks for each arrival.
Remotesensing 15 03661 g002
Figure 3. Ray tracing results for (a) Event 1, (b) Event 2, and (c) Event 3. The airborne sensor was situated within the acoustic zone when Events 1AB and 2AB were detected. Only one receiver point is shown for each event since the spatial difference traversed by the balloon between subsequent detonation detections was too small to be discernable on the scale shown.
Remotesensing 15 03661 g003
Figure 4. Altitude versus velocity for the zonal (left) and meridional (right) wind components. The color bar represents the UTC hour corresponding to the data plotted, except for the radiosonde profiles (black lines). Radiosonde data are from 12:00 UTC on July 10 (solid line) and 00:00 UTC the next day (dashed line). For better visualization, we “zoom in” to the region up to an altitude of 30 km, also noting that beyond this point, there is no radiosonde (or balloon) data, and the G2S profiles are very similar.
Remotesensing 15 03661 g004
Figure 5. Example of perturbation realizations (grey lines) applied to a G2S model atmosphere. Note that the horizontal scale (wind velocity) is different in the two panels. The blue lines represent the model atmosphere zonal (left panel) and meridional (right panel) components of the wind velocity.
Remotesensing 15 03661 g005
Figure 6. Density of eigenrays in travel time—turning height space. Note that the scale is not uniform across panels. Each group has 600 perturbed atmospheric profiles: Group 1 (top), Group 2 (middle), and Group 3 (bottom).
Remotesensing 15 03661 g006
Figure 7. Event 3B histograms with eigenray travel times (left) and ray turning heights (right) for the three groups of 600 perturbed atmospheres. Red lines denote the observed travel time. Note that the horizontal scale in travel times is not uniform across panels. Each group has 600 perturbed atmospheric profiles: Group 1 (top), Group 2 (middle), and Group 3 (bottom).
Remotesensing 15 03661 g007
Table 1. Summary of event particulars on 10 July 2020. The event times are rounded up to the nearest second.
EventLatitude [°N]Longitude [°E]Time [MDT]Time [UTC]
1A34.0595−106.9909:40:0015:40:00
1B34.0595−106.9919:40:3015:40:30
2A34.0596−106.99110:40:0016:40:00
2B34.0596−106.99110:40:3016:40:30
3A34.0596−106.99013:30:0019:30:00
3B34.0596−106.99113:30:3019:30:30
Table 2. Summary of detection particulars on July 10, 2020. The times are rounded up to the nearest second.
EventArrival Time [UTC]Travel Time [s]Horizontal Range [km]Signal Celerity [m/s]Latitude [°N]Longitude [°E]Alt
[km]
1A15:41:096910.429734.144−106.94120.487
1B15:41:396910.429734.145−106.94620.482
2A16:42:4616648.231634.314−107.41420.451
2B16:43:1716748.531634.316−107.41820.452
3A19:39:17557169.130434.756−108.62920.413
3B19:39:48558169.430434.758−108.63220.413
Table 3. Atmospheric profiles tested in our study. Note that the hybrid model is a combination of the G2S and radiosonde profiles, as described in the main text.
EventG2S Time [UTC]Hybrid: G2S + RadiosondeHybrid: G2S + Radiosonde
Radiosonde Time [UTC]Radiosonde Time [UTC]
115:0012:00
216:0012:00
319:0012:0000:00 (next day)
Table 4. Summary of ray tracing results. The observed travel times were 557 s (Event 3A) and 558 s (Event 3B).
Group/
Event
Average Travel Time [s]Travel Time, Min–Max [s]Average Turning Height [km]Turning Height, Min–Max [km]
1/3A567.0 ± 1.4560.4–575.243.0 ± 2.936.4–53.0
1/3B567.0 ± 1.4560.8–575.243.0 ± 2.936.4–53.0
2/3A562.0 ± 2.7557.3–568.044.4 ± 4.235.7–50.6
2/3B562.0 ± 2.7557.3–568.044.4 ± 4.235.7–50.6
3/3A562.7 ± 2.5558.7–572.042.6 ± 4.336.1–53.0
3/3B561.8 ± 2.5558.6–571.942.7 ± 4.236.1–53.0
Disclaimer/Publisher’s Note: The statements, opinions and data contained in all publications are solely those of the individual author(s) and contributor(s) and not of MDPI and/or the editor(s). MDPI and/or the editor(s) disclaim responsibility for any injury to people or property resulting from any ideas, methods, instructions or products referred to in the content.