Article

Evaluation of the Stability of Muddy Coastline Based on Satellite Imagery: A Case Study in the Central Coasts of Jiangsu, China

1
School of Geography and Planning, Chizhou University, Chizhou 247000, China
2
Key Laboratory of Coastal Zone Exploitation and Protection, Ministry of Natural Resources, Nanjing 210023, China
3
Application Research Center of Remote Sensing for Natural Resources, Chizhou University, Chizhou 247000, China
4
School of Geography and Ocean Science, Nanjing University, Nanjing 210023, China
*
Author to whom correspondence should be addressed.
Remote Sens. 2023, 15(13), 3323; https://doi.org/10.3390/rs15133323
Submission received: 8 May 2023 / Revised: 27 June 2023 / Accepted: 27 June 2023 / Published: 29 June 2023

Abstract

:
Monitoring the coastline dynamic can provide the basis for the balance of sediment erosion and deposition. The evaluation of coastal stability is beneficial to decision makers for the rational development and ecological conservation of coastal resources. The present study first collected 61 scenes of remote sensing images and extracted the multi-temporal coastlines from the years 1990–2020 in Jiangsu Province, China using an improved waterline method. Given the characteristics of gentle slopes of our study area, we modified the coastlines using actual tidal level data to avoid the influence from different tidal regimes. Finally, the coastal stability analysis was conducted on the central coast of Jiangsu, which experiences frequent changes in erosion and siltation. The results showed that the coastline has changed significantly; the natural coastline decreased by 116 km, while the artificial coastline increased by 108 km. the area of tidal flats decreased by 1152 km2, and the average width of the tidal flats decreased from 8.83 km to 3.55 km. In general, the coastline advanced seawards for many years, mainly due to sediment siltation and tidal flat reclamation, with annual average rates of siltation and reclamation of 9.67 km/a and 40.75 km/a, respectively. The node of siltation and erosion migrated 1.8 km southwards, moving from the Sheyang Estuary to the Doulong Port. The coastal stability gradually decreased from north to south, by values of 88.5 km (40%) for stable coast and 63.97 km (28.9%) for extremely unstable coast. The most unstable coast came from frequent reclamation areas. The method in this study is expected to provide a reference for evaluating the stability of typical muddy coasts, and our results can provide a basis for the sustainable development, utilization, and protection of coastal areas.

1. Introduction

Coastlines are the boundary between land and sea and are commonly defined as the high tidal level averaged from tidal station data over many years [1]. The influence of ocean dynamics, storm surges, and tidal fluctuation results in dramatic changes in coastlines [2], presented by either advancing seawards or retreating landwards. The changes in coastlines vary spatially and temporally, and they consequently lead to differences on the stability of the coasts [3]. Therefore, the timely and accurate extraction of the coastline is a prerequisite for evaluating coastal stability.
Remote sensing technology has become an important means of monitoring coastal environments due to its advantages of large-scale coverage and highly frequent repeatability [4,5,6]. It has been used in studies of erosion and siltation [7,8,9,10], coastal vulnerability [11,12,13], and tidal flat stability [3,14,15,16]. In addition, the extraction of the waterline (i.e., the instantaneous boundary between the sea and the land) from satellite remote sensing images has become recently prevalent among coastal research. Previous studies for extracting waterlines are mostly based on digital image processing techniques. These methods mainly include single-band threshold segmentation [17,18,19], the threshold segmentation method using the normalized difference water body index (NDWI) [20], the improved normalized difference water index (MNDWI) [21,22], pixel classification [23,24], edge detection [25], and object-oriented methods [26,27]. Among these methods, threshold segmentation is simple and easy to conduct, but the threshold is usually hard to determine, which influences the extraction accuracy. The edge detection method identifies line-shaped targets quickly, but the connectivity of the targets as potential waterlines is relatively poor. The object-oriented method combines spectral, shape, texture, and other features to detect the waterline under relatively complex backgrounds. However, this method is more suitable for the classification of high-resolution images rather than medium-resolution images.
As the instantaneous boundaries between sea and land, waterlines change periodically along with tidal fluctuations. The different tidal levels lead to different waterlines corresponding to imaging times. Predictably, if the instantaneous waterline is directly used as the coastline, a large uncertainty will be involved. Therefore, some scholars have proposed an intertidal terrain correction method, which can convert waterlines to coastlines using the slope and tidal levels from coastal tide stations [28,29,30,31,32,33]. In addition, with the rapid development of geographical information technology, a python toolkit based on Google Earth Engine has been developed to extract coastlines from publicly available satellite images [34].
Many studies have identified the typical features of tidal flats using multi-temporal remote sensing imagery or the time-series of remote sensing imagery [35,36]. Based on which, the geomorphic evolution of coastal tidal flats [37,38,39,40] and the stability of coastlines were quantitatively analyzed [41]. Other scholars have combined tidal level observational data and slope information and have compared the change in the position of the coastline after tidal level correction [2,42]. This method has been applied to various coasts [43,44,45], harbors [46], and islands and reefs [47]. The United States Geological Survey (USGS) also introduced the Digital Shoreline Analysis System (DSAS), which analyzed the end-point and average rates of change to a baseline using multi-temporal remote sensing data [48]. The DSAS has been widely used to quantitatively analyze the stability of coastlines and to predict future coastline movement.
The central coasts of Jiangsu Province, China, have mostly silty and muddy soils, with gentle slopes and abundant tidal flat resources, which is one of the most typical regions to study the geomorphological evolution of tidal flats in China, and even the world. Therefore, with the support of multi-source and medium-spatial resolution remote sensing images, the objectives of this study were to (1) extract the coastline from the years 1990–2020 and quantitatively analyze the changes in natural and artificial coastlines; (2) calculate the distances and the rates of coastline change over 30 years with the assistance of the DSAS and analyze changes in the erosion and siltation of the coastlines; and (3) evaluate the stability of the central Jiangsu coasts quantitatively. The study is expected to provide valuable references on the evolution and stability of tidal flats for coastal areas, and the related results can support the sustainable development of coastal economy and society, which is of great practical significance.

2. Study Area and Datasets

2.1. Study Area

The central coasts of Jiangsu range from 32°30′ to 33°28′N and 120°40′ to 121°30′E, with a coastline is about 364.5 km (Figure 1). The tide is dominated by a semi-diurnal tide. There are commonly two high tides and two low tides per day (Figure S1); the heights of the two high or low tides are not equal [40], and the greatest mean tide range exists in the section from Jiang Port to Xiaoyangkou Port, with a recorded tidal range of 9.28 m [49]. The sediments transported from both the Yangtze River and the ancient Yellow Rivers have gradually bred really abundant tidal flats along the coastal areas. Large-scale submarine radiation sand ridges (RSRs) have also been formed at Jiang Port [50], with more than 70 sand ridges and tidal channels between sand ridges extending from the nearshore to the sea. According to a special survey and evaluation, the coasts of Jiangsu have the most abundant resources of tidal flats in China, with a total area of 5001 km2 of mudflats, accounting for about one-fourth of the total tidal flats in China. In addition, the RSR is the most special coastal sedimentary geomorphic system, with the largest area of typical underwater sand ridge groups, with an area of ~2017 km2 at the lowest tide [37]. However, given the huge potential for coastal development in China [51], this area is also the most vulnerable geomorphic unit impacted by intensive human activities [52,53].

2.2. Datasets

2.2.1. Remote Sensing Data and Preprocessing

The acquisition of remote sensing images is the first step to identifying and extracting coastlines. Considering the availability and accessibility of historical satellite images, we selected the Thematic Mapper (TM) and Operation Land Imager (OLI) from the Landsat satellite and the charge-coupled device (CCD) images from the HJ-1 satellite. The Landsat images were retrieved from the online platform provided by Google Earth Engine (GEE), which has an extensive repository of publicly available and ready-to-use geospatial datasets [54]; meanwhile, the HJ-1 images were acquired through the China Centre for Resources Satellite Data and Application (https://data.cresda.cn/, accessed on 26 March 2012). The high quality of the abovementioned resources covered our study area during the years 1990–2020 with a spatial resolution of 30 m. To eliminate the errors caused by atmospheric conditions, our study first used the surface reflectance data provided by GEE, and 87 scenes of images with a coverage less than 5% were selected. Secondly, based on visual interpretation and the observation data from tide stations, the images of medium and high tide levels were excluded. Finally, a total of 61 scenes of low tide and high-quality images were selected for the extraction of the waterline. For a few HJ-1 CCD images, visual inspection revealed an obvious position deviation of 3–10 pixels compared to the Landsat TM/OLI images (Figure S2). Therefore, these HJ-1 images were further geo-corrected based on Landsat images, and more than ten ground control points at road intersections, farmland, and pond corners were selected. After the correction, the geometric error of each HJ-1 image was less than 0.5 pixel, and all images were projected to the Universal Transverse Mercator North 50 Zone with the WGS-84 datum.

2.2.2. Tidal Level Data

The result of coastline extraction was directly related to the exposure range of tidal flats, and the determination of whether a tidal flat was at the high or low tide level was mainly based on the observational data from tide stations. The tide level data were obtained from the China Oceanic Information Network (https://www.nmdis.org.cn/, accessed from 1999 to 2020) and the present study measured tide level data. The hourly predicted tide level was from the tide gauging stations of Sheyang, Dafeng, Xinyang, Lvsi, Jiang port, Xiaoyang, Yangkou, and Chenjiawu ports from north to south, and the spatial distribution of these tidal stations is shown in Figure 1. These data were collected from the years 1990–2020 to judge the tidal status corresponding to the image acquisition.

2.2.3. DEM Data

Digital elevation model (DEM) data can provide important basic data for the analysis of topography, hydrology, and watersheds. In general, basin analysis mostly uses Advanced Spaceborne Thermal Emission and Reflection Radiometer Global DEM (ASTER GDEM) data with a spatial resolution of 30 m. However, the GDEM cannot satisfy the demand of a detailed analysis of tidal flats because the terrain of tidal flats along the central Jiangsu coasts is relatively flat with gentle slope (ranging from 0.5‰ to 1.2‰). In order to reflect the fluctuation of tidal flats, three periods of DEM data generated by high-resolution airborne Light Detection and Ranging (LiDAR) were collected at low tides. Specifically, one LiDAR DEM with the spatial resolution of 5 m was collected from April to May in 2006, and two other DEMs with the spatial resolution of 2 m were collected in 2010 and 2014, covering the coastal tidal flats from the mouth of Sheyang to Jueju Estuary and the radiating sandbanks.

3. Methodology

3.1. Extraction of Waterlines

The rapid and accurate extraction of the waterlines is the precondition for analyzing the spatial and temporal changes of coastlines. In our study, according to several common methods of waterline extraction [22,23,24,26,27], we proposed a strategy that combined the water body index, threshold segmentation, and mathematical morphology to identify the waterlines of our study area (Figure 2). First, we selected 61 scenes of satellite images that present water and land boundaries clearly and processed them with geometric and atmospheric correction [55]. Second, according to the bands from different images, NDWI or MNDWI indices were calculated for preliminarily separating water from land. Next, the canny operator was introduced to refine the results of water indices, and the closing operation from mathematical morphology was used to connect the broken lines of the sea–land boundary [56]. Finally, we converted the binary raster to polylines after removing tiny patches with an area less than 50 pixels. Using the above methods, we obtained the waterlines for the study area from the years 1990–2020.

3.2. Extraction of Coastlines

Due to the influence of the tides, the waterline at different imaging times is usually substantially different, and it would be a large error if the instantaneous waterline was directly used as the coastline. In response to the above problems, the tide level observed at different tide stations was used to correct the waterlines and derive the coastlines [32]. Specifically, the steps for correcting the waterlines to coastlines are as follows. (i) Waterline delineation discretization: Since the tide level and slope for the same waterline tend to be different among locations, we divided the waterline at intervals of 500 m and obtained multiple discrete points, and this interval can be reduced for the estuaries with complex geomorphology. (ii) Split line generation: At each discrete point, a vertical line was generated perpendicular to the waterline, and it was defined as the split line; in the vicinity of the tortuous shorelines, the split line was manually adjusted so that it was basically perpendicular to the waterlines. (iii) Tide level assignment: Corresponding to the time of each waterline acquired, we mapped the tidal level for the whole study area by interpolating the data from each tide gauging station; Afterwards, the tide level was assigned to the discrete points by extracting the values from the tidal level map using point locations. (iv) Tidal slope estimate: Each split line was used to calculate the coordinates and tidal levels of the discrete points from two waterlines, and the average tidal slope delimited within the two waterlines was estimated. (v) Coastline extraction: he average slope was combined with the mean high tide level, the position of the discrete points was deduced on the profile line, and the coastline was generated by connecting the deduced positions of the discrete points (Figures S3 and S4). The natural coastline can be deduced by the above steps, while the artificial coastlines were identified by visual interpretation. Finally, the various parts of the coastline were connected to obtain a continuous coastline. It should be noted that the uncertainties caused by tidal channels and reclamation activities on the local slope were not considered.
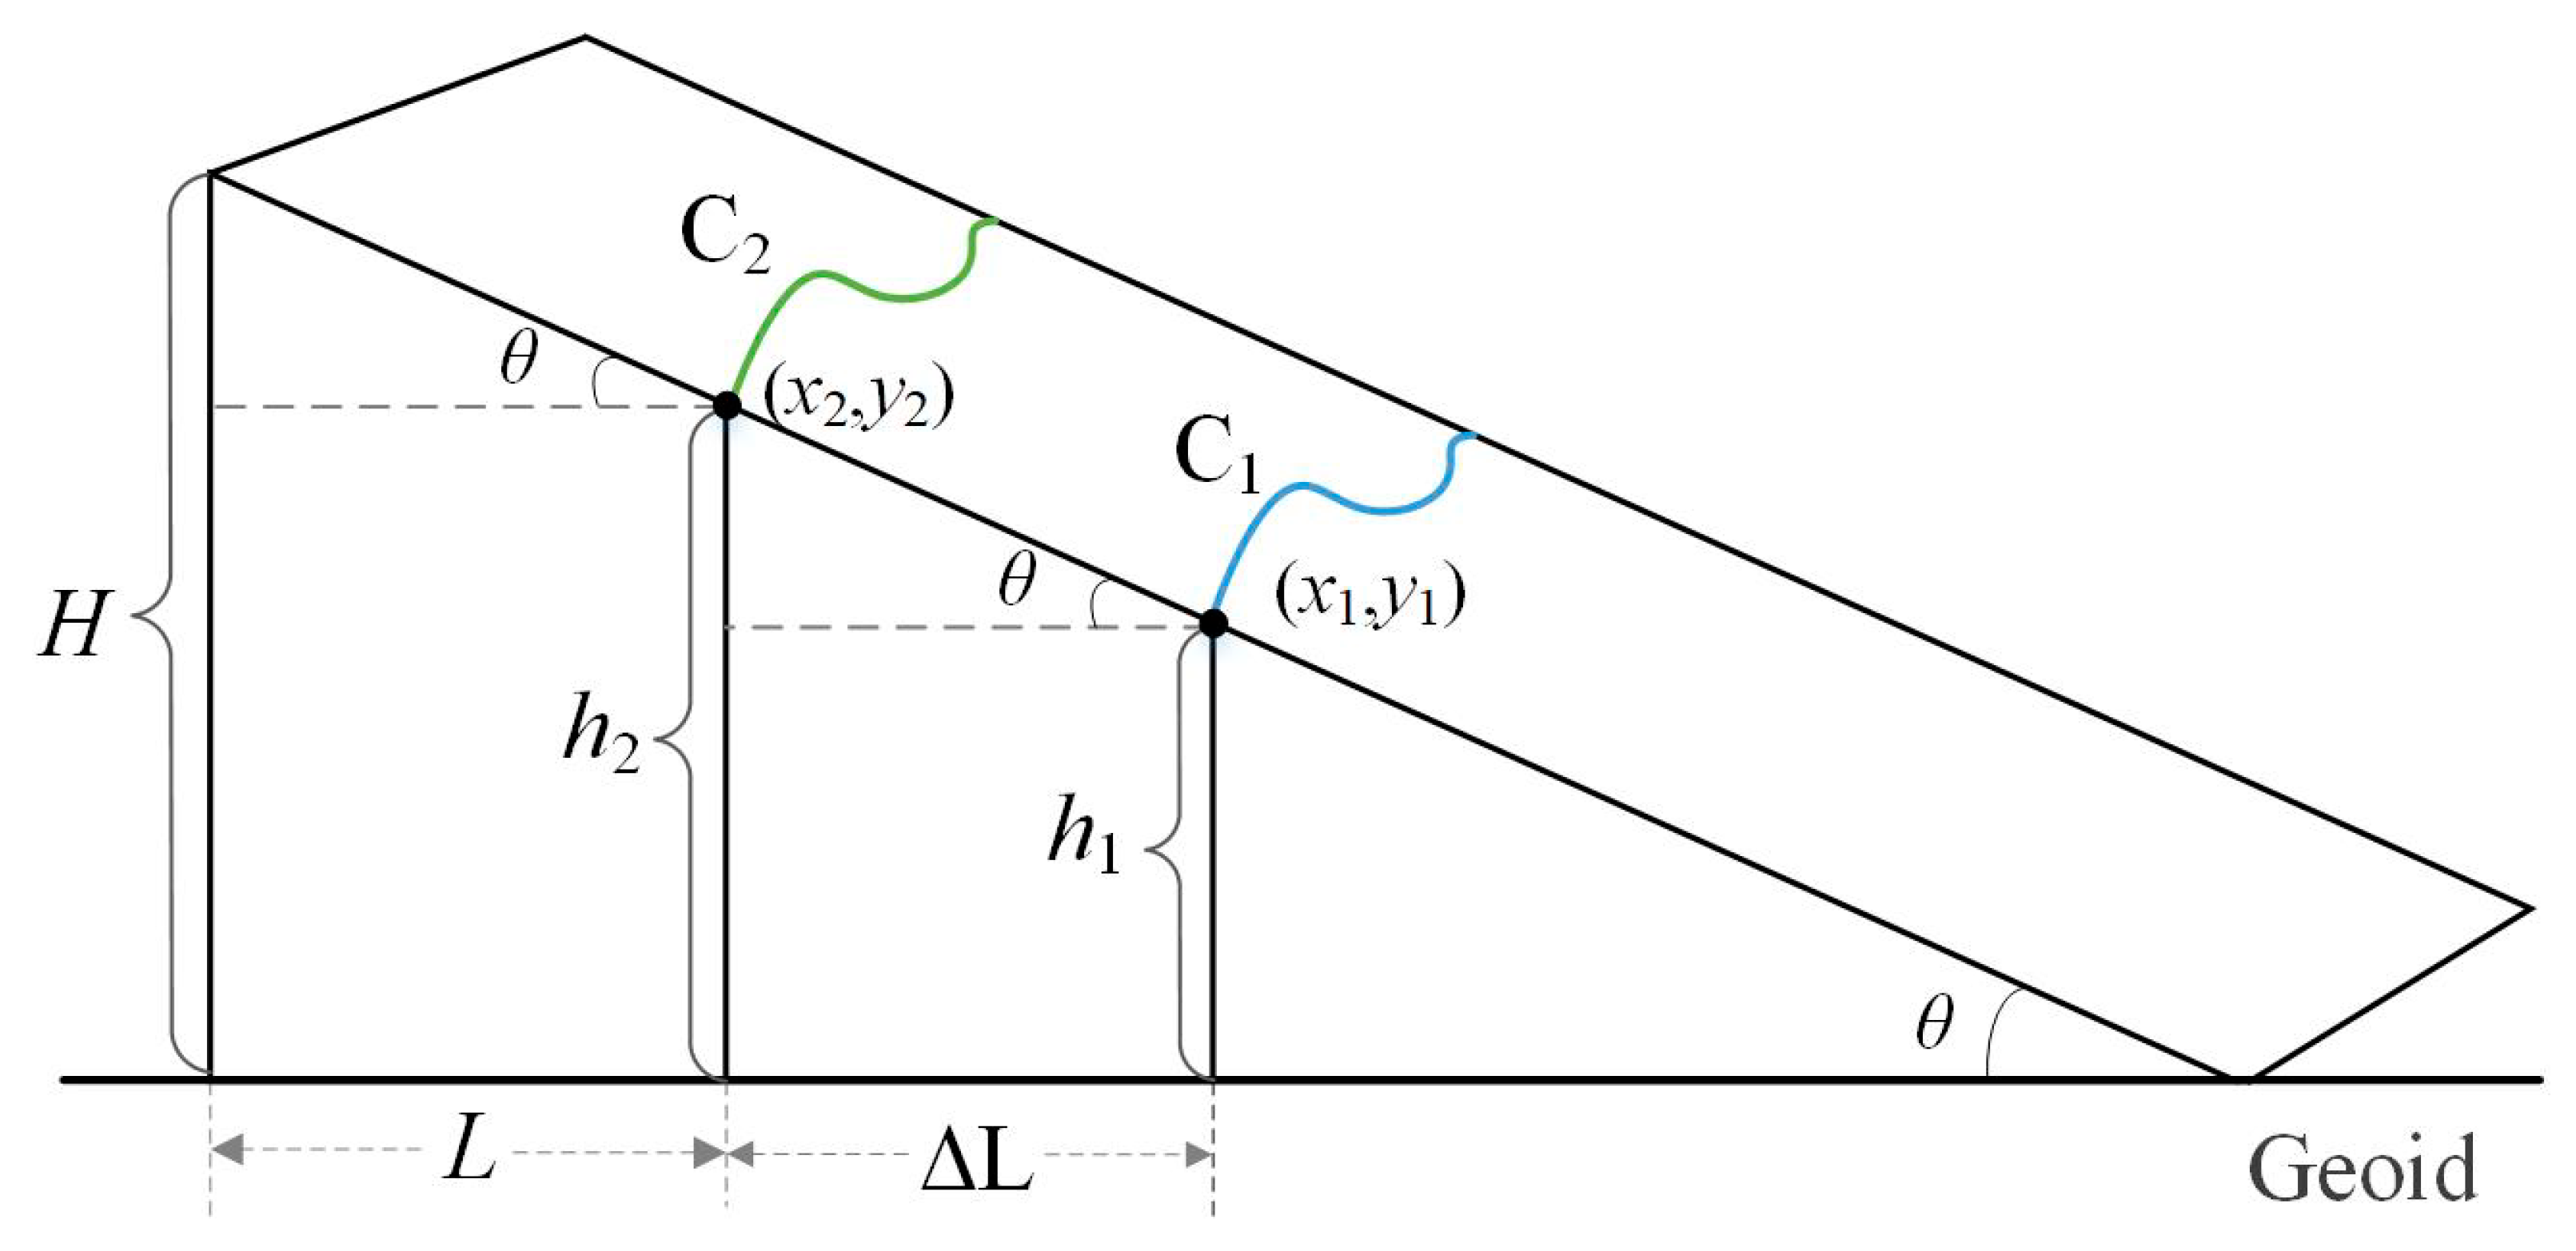
The two images were taken as examples to illustrate the process of extracting the coastline (Figure 3). Assuming that the waterlines acquired at two imaging times are C1 and C2, respectively, the horizontal distance is ΔL, which can be calculated through the coordinates of discrete points, and the tide heights of the two waterlines are h1 and h2 (h2 > h1), then:
θ = arctan [ h 2 h 1 / Δ L ]
L = ( H h 2 ) / t a n θ
where θ is the tidal slope; (x1, y1) and (x2, y2) are the coordinates of two discrete points; H is the tidal height of the mean high tidal level, and L is the distance from the waterline to the coastline; that is, L is the distance that should be correct [32].
The coastline along the central coast of Jiangsu is composed of natural and artificial coastlines. Among them, the natural coastline includes muddy coastlines and estuarine coastlines. Most parts of the muddy coasts were deduced using the aforementioned approach, but for some coasts with large curvature, the outer edges of salt marsh vegetation towards to the sea were used as coastlines. For estuarine parts, the sudden expansion of the river to the sea can be regarded as the coastline. For the artificial coasts, the outside boundaries closest to the tidal flats were first identified. This is easy to complete by visually interpreting remote sensing images since the boundaries are usually the seawalls of reclaimed areas and constructed ports with outstanding spectral features. If the average high tide lines were estimated landwards to the boundaries, the artificial coastlines were delimited using the boundaries; otherwise, the average high tide lines were used. Finally, the natural coastlines and artificial coastlines were connected to form continuous coastlines.

3.3. Analysis of Coastline Changes

To quantitatively analyze the spatio-temporal dynamics of coastlines, we determined a baseline as the reference. The baseline is generally determined according to the direction of the whole coast and is simultaneously parallel to the coastlines from each period. Given that the direction of the central Jiangsu coast changes obviously at the Jiang Port, the baseline was set with two segments, the northern part from Sheyang Estuary to Jiang Port and the southern from Jiang Port to Xiaoyang Estuary. Specifically, we first generated a buffer landward to the coastline of 1990 with a radius of 500 m; then, we slightly adjusted the turning points of the buffer boundary to make it as straight as possible; finally, two baselines were extracted from the buffer boundary for the northern and southern parts. Afterwards, the DSAS (vers. 3.2) developed by USGS was used to generate profiles perpendicular to the baseline at 500 m intervals toward to the sea. The coastal erosion and siltation changes at the profiles were quantitatively analyzed by counting the distance, using Equations (3) and (4) [32]:
D = 1 n k = 1 n L k
D = 1 n k = 1 n L k
where D is the distance representing the change in coastline, D ¯ is the average change distance, n is the number of profile lines perpendicular to the baselines, with a total of 443 lines, Lk is the distance of coastline change along the kth profile, and |Lk| is the absolute distance of the k profile.
The location at the intersection of the profile line and the coastline in each year can be used to calculate the distance that the coastline moves seawards or retreats landwards. Then, the annual average rate for coastline changes can be calculated using Equation (5):
S Y i = A v e D i + A v e D i + t 1 t 2
where SYi is the annual average rate of coastline changes from period t1 to t2, |AveDi −| and |AveDi +| are the cumulative distances of the coastline retreating landward and advancing seaward at the ith profile, and t1 and t2 are the starting and ending years, respectively.

3.4. Evaluation of Coastal Stability

Coastal stability can be represented by the horizontal distance among the coastlines advancing seawards or retreating landwards [57]. Under the dual influence of natural and anthropogenic factors, the stable coast indicates that the coastline location did not change significantly for many years, and the distance of advancing seaward or landward retreating of the coastline was small. On the contrary, the unstable coast showed that the change distance of the coastline was large, indicating an outstanding movement [32]. Based on the endpoint change rate of the coastline over 30 years, combined with the number of divided profile lines, we calculated the stability index (Equation (6)) and classified the coastal stability in central Jiangsu into four types according to the natural breakpoint method: stable, relatively stable, unstable, and extremely unstable coasts:
E = 1 n i = 1 n S Y i
where E denotes the stability index of the coastline from period t1 to t2, n is the number of profile lines, and i is the ith profile line. The greater the value of E, the more unstable the coast was.

4. Results

4.1. Results of Coastline Extraction

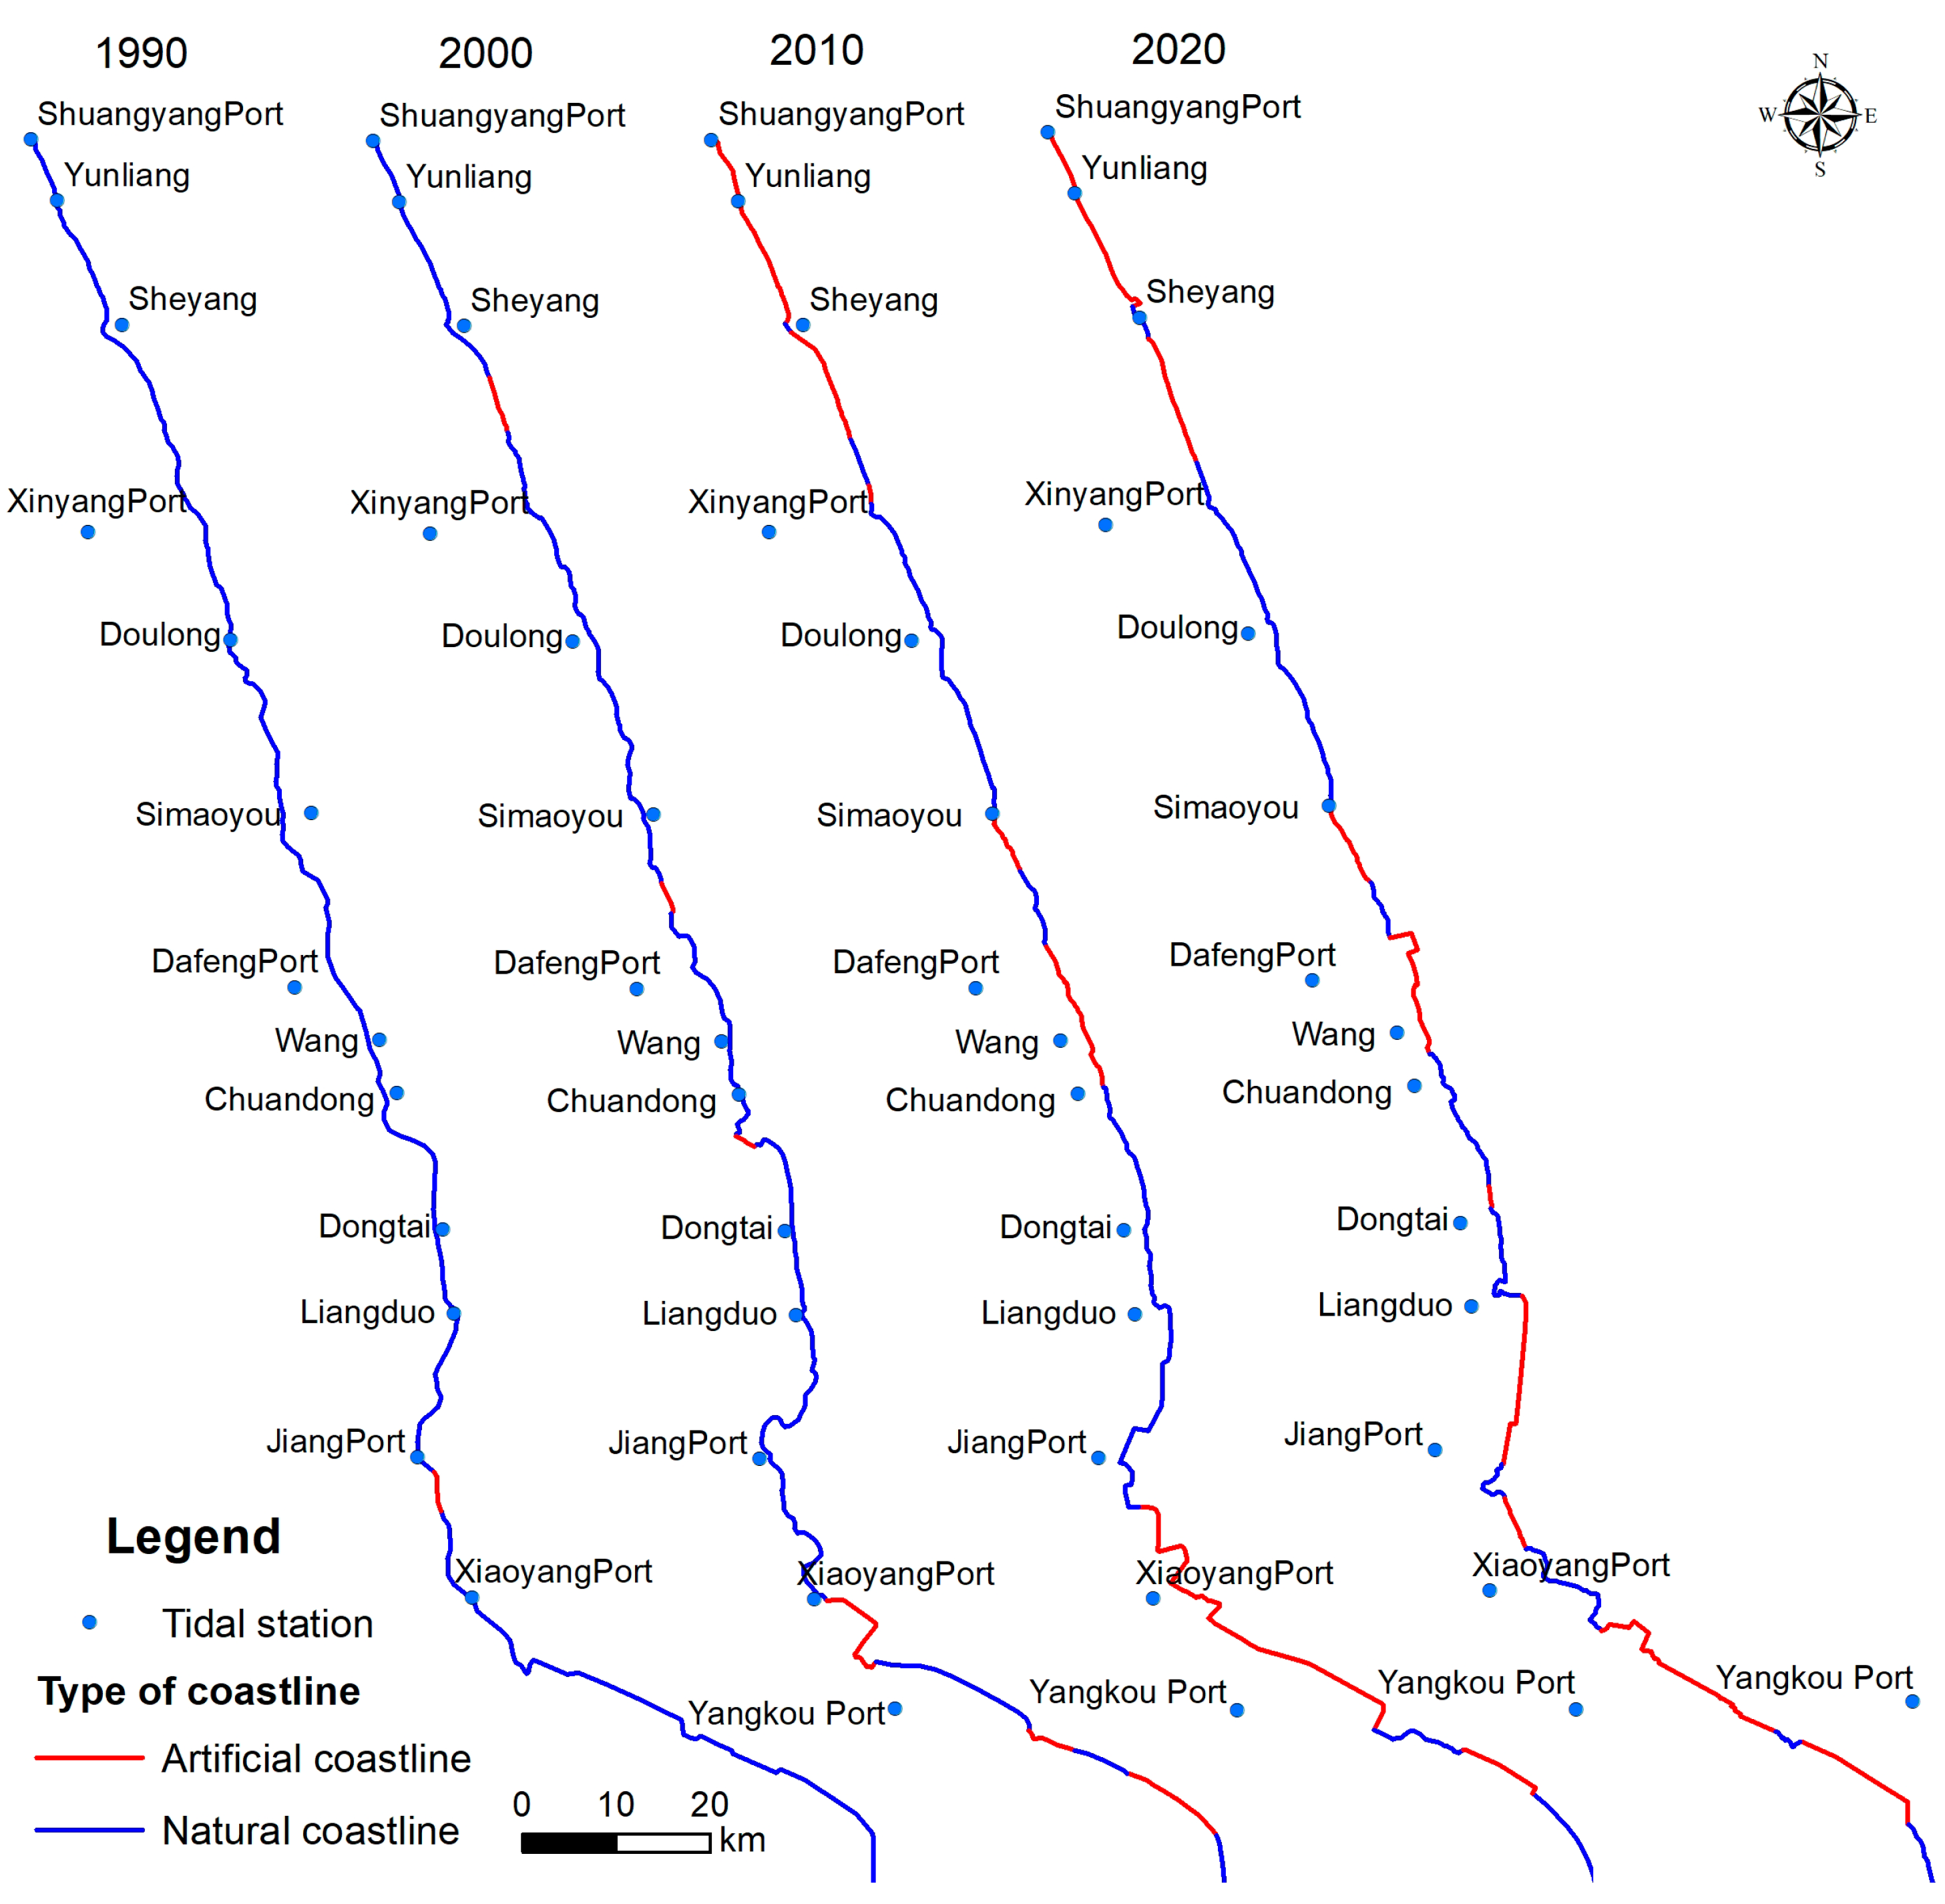
We obtained the coastline from the years 1990 to 2020 after correcting the instantaneous waterlines. Considering the imaging quality and monitoring period, the Landsat images were preferred. For the years when Landsat images were unavailable, the HJ-1 CCD images were used as complement. A total of 31 coastlines were obtained after tide correction, eight of them were extracted from the Landsat-8 OLI images, and 22 of them were extracted from the Landsat-5 TM images, and only one coastline was extracted from HJ-1 CCD (Figure S5). To clearly demonstrate the spatial changes of coastlines in different years, our study presented the coastlines at 10-year intervals from 1990 to 2020, and the results corresponding to the four periods (the years of 1990, 2000, 2010, and 2020) were shown in Figure 4. The results showed that due to the rapid development of the coastal areas in central Jiangsu, the natural coastlines declined, and the artificial coastlines increased as a result of a large amount of replacement from the natural coastline to artificial coastline. Specifically, all the coastlines slightly increased from 238.1 km to 249.1 km in the past 30 years, which is due to the increase of artificial coastline. The natural coastline greatly decreased from 233.8 to 118.5 km, while the artificial coastline rapidly increased from 4.3 to 130.7 km. In terms of temporal dimensions, the increment of artificial coastline mostly took place from 1990 to 2015, especially after 2009, when tidal flat reclamation and port construction projects sprawled rapidly. However, the length of artificial coastline remained almost unchanged after 2015 because coastal reclamation and construction were strictly controlled. In terms of spatial dimensions, the artificial coastline mainly occurred from the Biandan to the Sheyang Estuary of the northern Jiangsu coasts, as well as from the Xiaoyang to the Yangkou Port of the southern Jiangsu coasts. The natural coastline was mainly concentrated on the Sheyang to Liangduo Estuary, with a relatively straight distribution, which was scattered for other places. It is worth mentioning that some ports were constructed relatively early, while the coastline was advancing seaward; thus, the ports were not distributed along coastlines.

4.2. Lateral Movement of the Coastlines

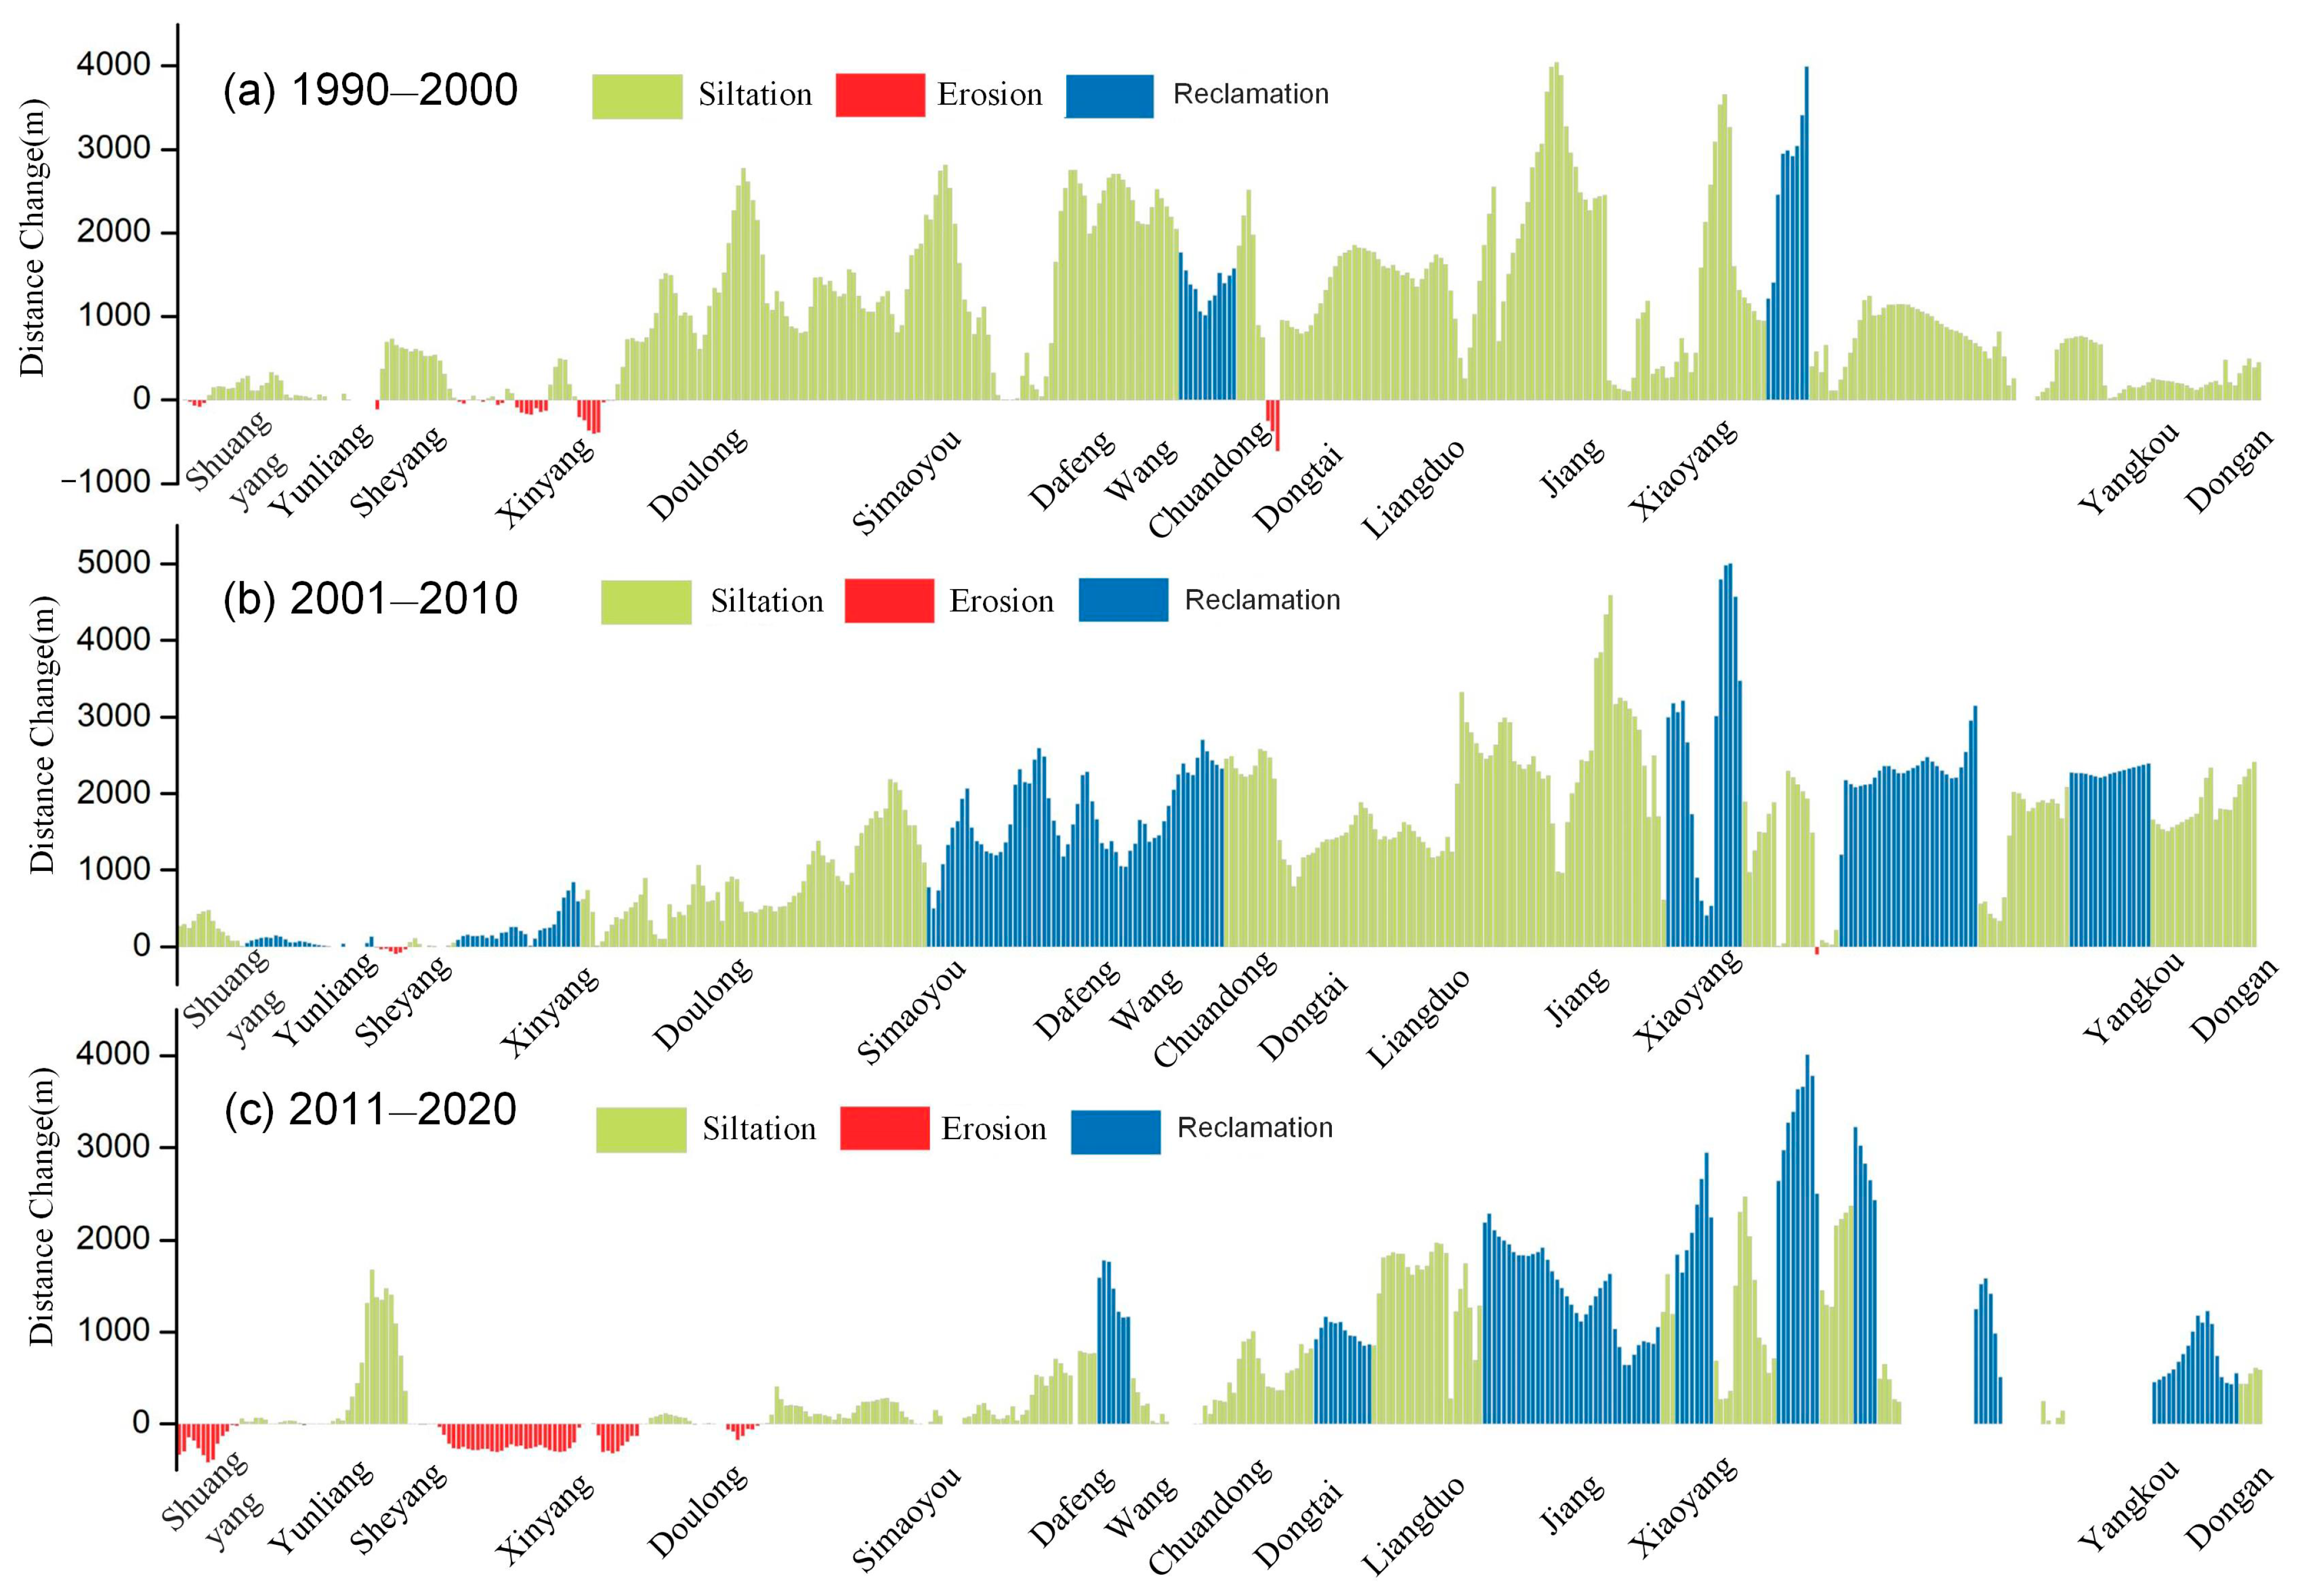
To provide detailed changes in the coastline during each period, we divided the study period into three decades every 10 years (Figure 5). The results showed that the coastlines along central Jiangsu generally moved toward the sea in the past 30 years, mainly resulting from sediment siltation and tidal flat reclamation. However, the change in coastlines varied significantly for different decades. In the 1990s, the coastlines were generally silted up, with the length of silted coasts reaching 198.5 km. The reclaimed coastline was mainly distributed from the Wang Harbor to the Chuandong Estuary and the south of the Xiaoyang Harbor, with the length of 10.5 km. In the 2000s, the coastlines were basically prograding, and the length of reclaimed coastline increased significantly compared to that in the 1990s. The reclaimed coastlines mainly occurred from the Simaoyou to the Chuandong Estuary and to the south of Xiaoyang Port, with a length of 88.5 km, ~40% of the total coastlines. In the 2010s, the most remarkable changes of the coastline occurred from the Liangduo Estuary to the south of Xiaoyang Port, and the changes were dominated by both siltation and reclamation. The lengths of silted and reclaimed coastlines were 102.5 km and 57 km, while the length of unchanged coastlines accounted for 28.5 km. During this period, the 33 km coastlines experienced ongoing erosion, mainly located to the north of Shuangyang Port and the coast from the Sheyang Estuary to Doulong Port. This was because the tidal flats along the northern Jiangsu coasts were narrow, and they were frequently affected by human activities such as tidal flat reclamation and port construction. Therefore, the northern coastlines gradually changed from natural coastline to artificial coastline, resulting in direct connection to the sea. As a result, the erosion node gradually moved from north to south (about 1.8 km), and the southern Doulong Port can be considered the transition zone from erosion to siltation during this decades.
The change rate of the coastline was calculated based on the change distance and the corresponding time interval. The coastline changed with different directions, sometimes moving seawards or retreating landwards, both of them being actual changes in the coastline. Therefore, in order to record these two statuses, we recorded the change in distance to the sea and land as positive and negative, respectively, and the actual changes for the whole coastline were defined as the sum of the absolute distance from the two situations. The results showed that changes in the coastlines of central Jiangsu mainly resulted from siltation and reclamation from 1990 to 2020 (Figure 6). Only a few coastlines, which were located between the Shuangyang Port and the Yunliang Estuary in the abandoned Yellow River delta and the coastline near Xinyang Port, suffered erosion, with a total coastline length of 11.5 km. In terms of the change rate, the coastlines between the Shuangyang and Xinyang Port were relatively small (annual average erosion rate of 5 m/a). The trend of moving seawards was evident for the central and southern coastlines, among which siltation mainly occurred from the Doulong Port to the Simaoyou Estuary and the southern Chuandong Estuary. These two coastal zones are the red-crowned crane and elk nature reserves, where the natural coastlines were well preserved from any reclaimed and constructed activities. Except for these regions, large-scale reclamation activities were main driving forces for the coastline advancing to the sea, which are densely distributed between the Simaoyou Estuary and Yangkou Port. The length for reclaimed coastlines reached 129 km (58.37% of the total coastline), with an average annual rate of 1.20 km/a. The new area developed through tidal flat reclamation was 1057 km2 from 1990 to 2020.

4.3. Stability of the Central Jiangsu Coast

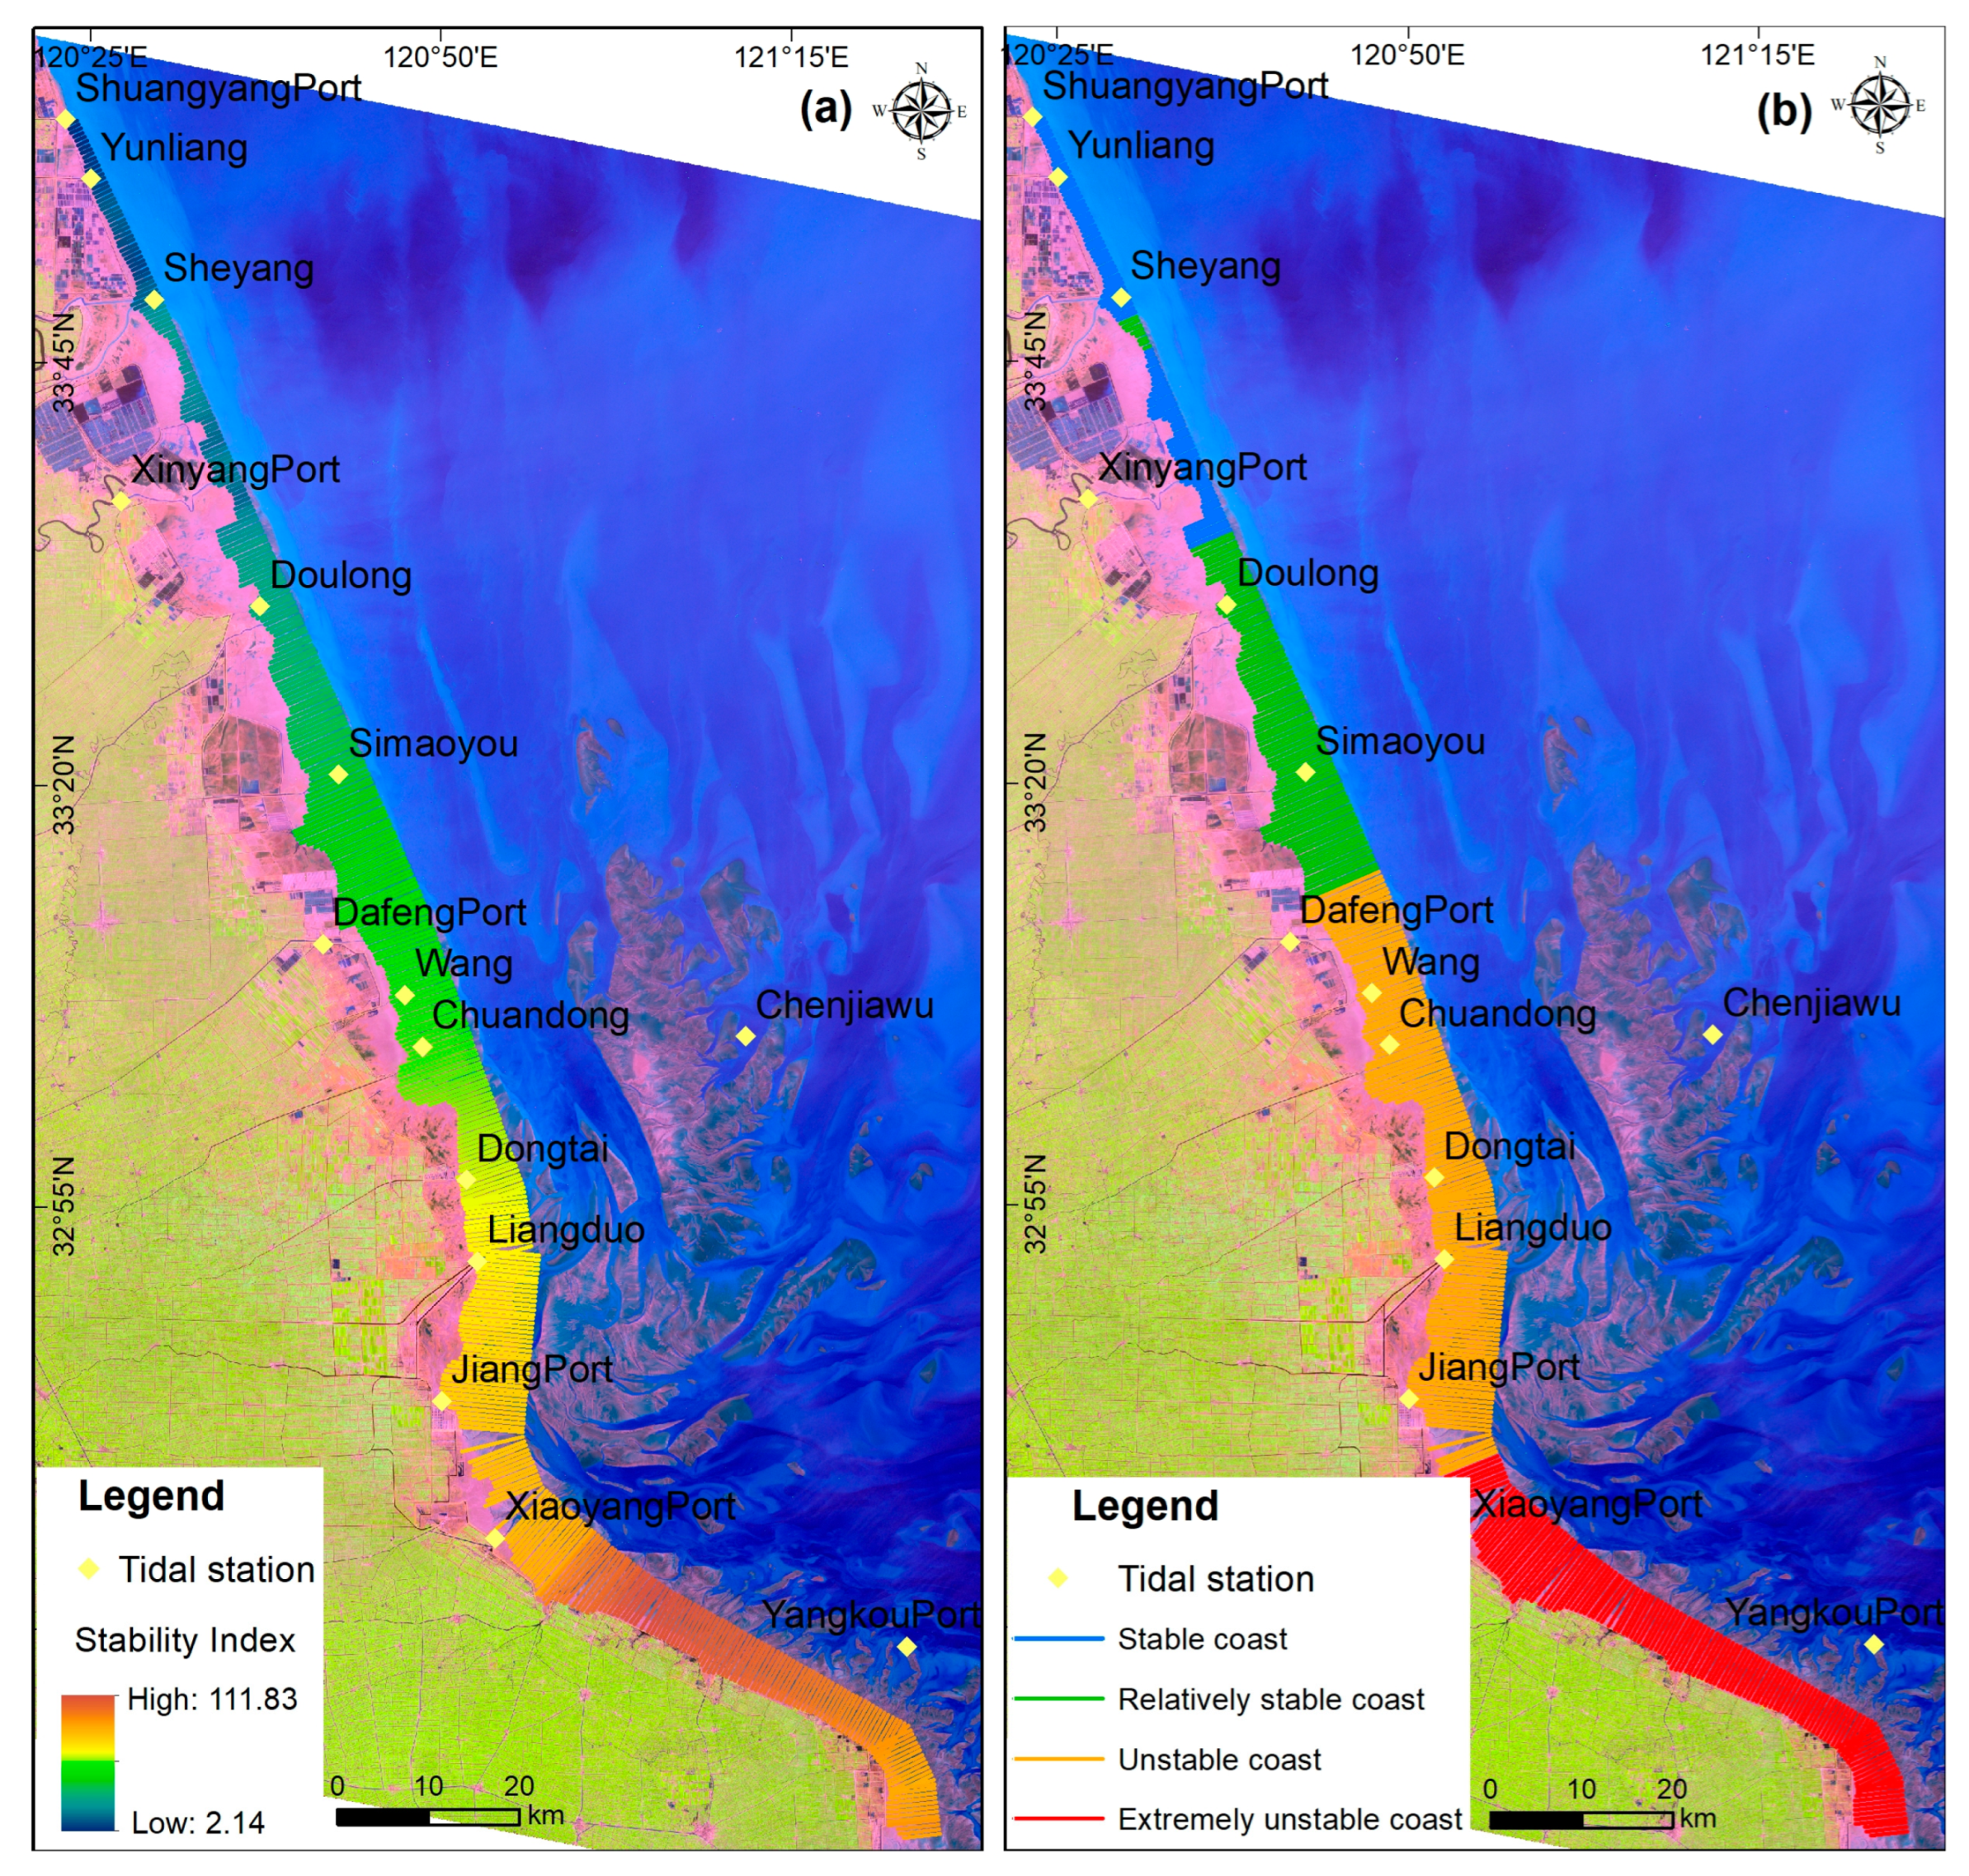
The stability for the central Jiangsu coast was calculated using the stability index, and then, each area was assigned a stability grade to evaluate the stability. The stability index ranged from 2.14 to 111.83 and obviously increased from north to south (Figure 7a). According to the classification criteria defined in Table 1, combined with the number of profile lines and the actual situation in the study area, we divided the stability index into four categories: stable, relatively stable, unstable, and extremely unstable coasts, using the natural breakpoint method (Figure 7b).
It can be seen from Figure 7 that the stability characteristics of the coastlines were stable in the north and unstable in the south, and the stability generally decreased from north to south. Specifically, there was 45 km of stable coast distributed in the north of Xinyang Port, and an additional 43.5 km of relatively stable coast was mainly distributed from the south of Xinyang Port to the north of the Simaoyou Estuary. We grouped these two parts into stable coasts, accounting for 40% of the total coastlines. The extremely unstable coasts appeared in the south of Xiaoyang Port, with a length of ~63.97 km (28.9% of the total), and the remaining coasts were classified as unstable.
In terms of each county along the coast, the most coasts in Sheyang County were stable, along with 3.5 km of relatively stable coasts. Dafeng County was composed of relatively stable and unstable coasts, accounting for 60% and 40%, respectively. For Dongtai County, the coastline of which was 39.26 km, all of the coasts were unstable because a large number of natural coastlines were converted into artificial coastlines through large-scale reclamation activities. More than 71% of the coasts of Rudong County were extremely unstable, and other coasts belonged to the unstable group, with a length of 64 km. Therefore, Sheyang County in the north had the most stable coast and the best coastal protection. In contrast, Dongtai County had the poorest coast stability, and special attention should be paid to the supervision and protection of the city’s coastal zone during the future development and use of coastal resources.

5. Discussion

5.1. Influence of Reclamation on Coastal Stability

Jiangsu is a rapidly developing province located on the eastern coast of China. With rapid socio-economic development and a continuous increase in population, the limited land hardly meets the requirements. Therefore, tidal flat reclamation has become a main way to relieve the pressure from population growth and urban expansion [58]. Large-scale tidal flat reclamation activities would inevitably have a strong impact on coastal stability [59]. The main types of reclamation in the central Jiangsu coasts include coastal dams, aquaculture ponds, farmland, and salt farms [60,61]. These reclaimed areas are usually surrounded by seawalls, which are characterized as having regular shapes and obvious spectral features. After visually interpreting the remote sensing images, we obtained the distribution and evolution of reclaimed areas in our study area from the years 1990–2020.
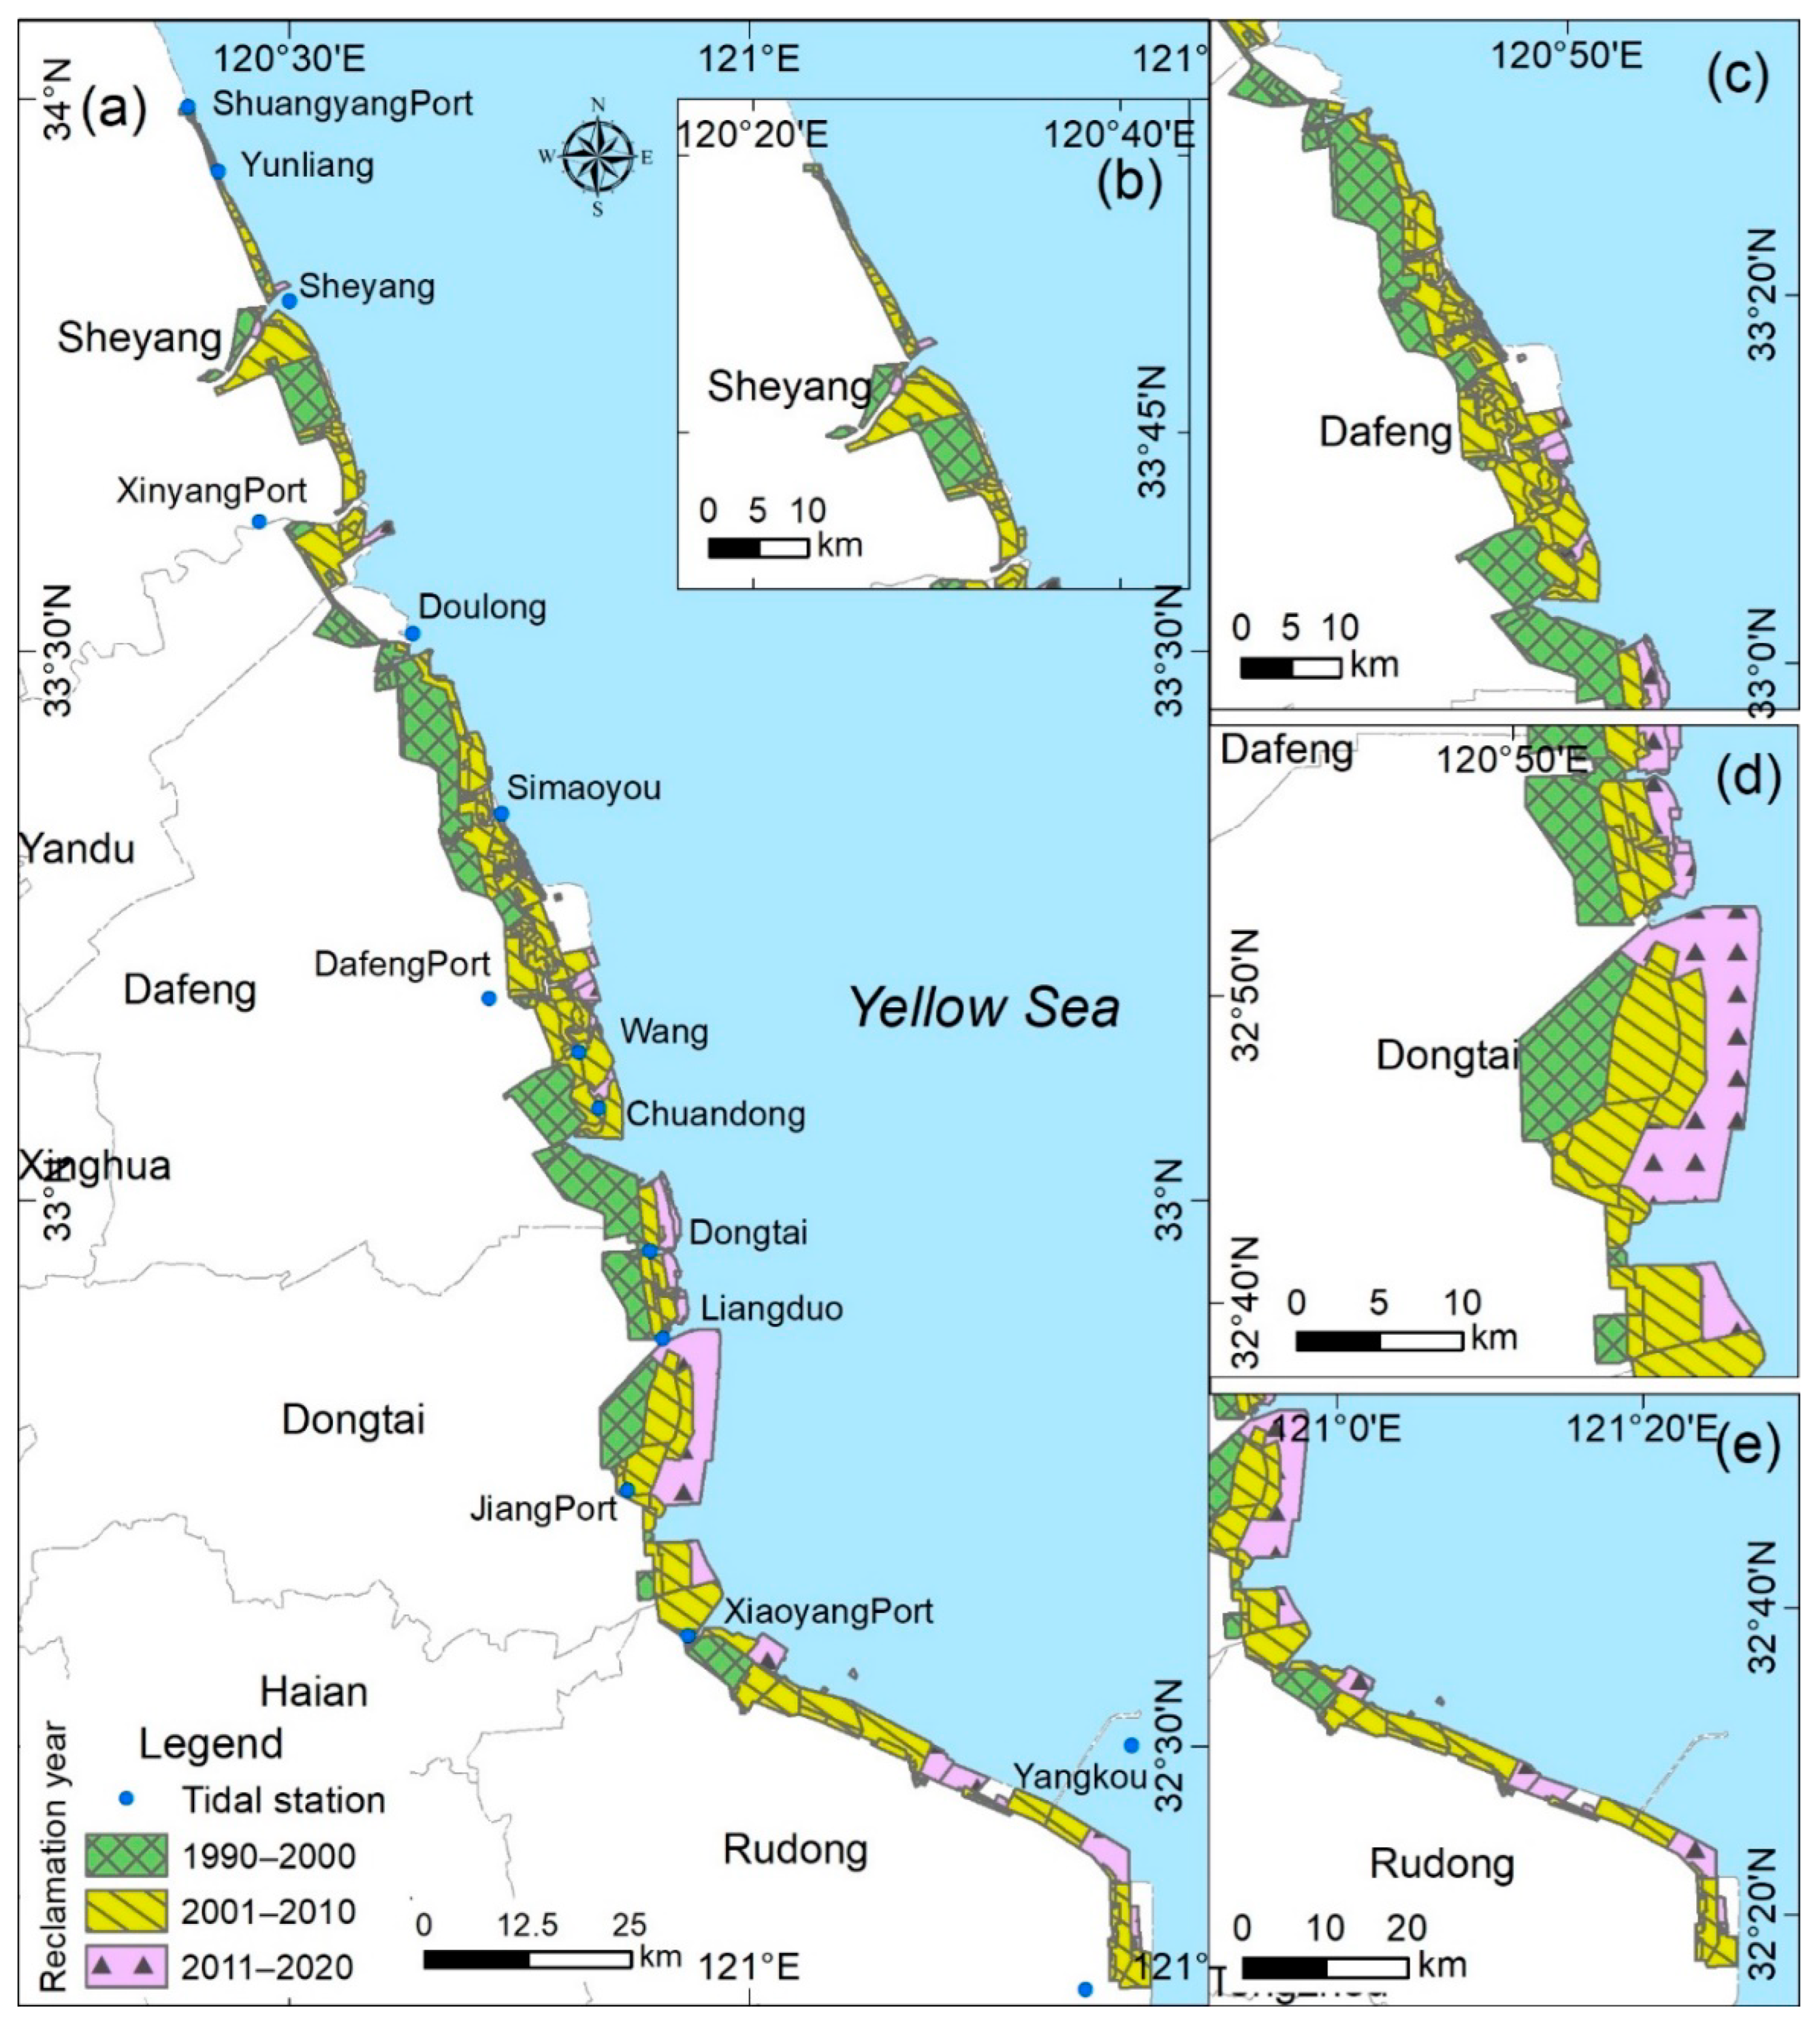
A total area of 1057 km2 has been reclaimed along the central Jiangsu coast since 1990, with the first peak of 109.84 km2 in 2000 and the second peak of 122.45 km2 in 2013. Accordingly, the reclamation experienced three phases in 10-year-intervals. In the 1990s, 237.9 km2 was reclaimed (22.5% of the total), and the reclaimed areas were mainly concentrated on the central coasts from the Chuandong to the Liangduo Estuaries and the north of Jiang Port. The tidal reclamation flourished during the 2000s, when the newly reclaimed areas reached 654.7 km2 (61.9% of the total). They either concentrated along the northern coasts from the Sheyang Estuary to Xinyang Port, or scattered in the central and southern coasts. The reclaimed areas shrunk substantially during the 2010s, and only 165.1 km2 of the area was reclaimed (15.6% of the total). The reclaimed areas were mainly distributed from the Dongtai Gate to Jiang Port and the south of Yangkou Port (Figure 8). The implementation of the policy of prohibiting reclamation after 2017 may be the reason for a significant decrease in reclaimed areas along the central Jiangsu coasts during this period.
Although tidal flat reclamation can complement areas to some extent, it also alters the geomorphology of tidal flats and damages coastal wetlands, which inevitably triggers a series of problems related to resources, ecology, and the environment [62,63,64]. Moreover, they have certain impacts on coastal stability and may affect future development and construction in coastal zones [65]. By overlaying the distribution of reclamation areas and stability results, we found that reclamation leads to the coastline continuously advancing toward the sea. As a result, the most reclaimed areas were unstable coasts, especially for the Jiang Port and its south coasts. In contrast, only a small area located between the Shuangyang and Dafeng Ports in the north was reclaimed, and the coast for this region was relatively stable. Our findings indicate that large-scale reclamation indeed impacted the stability of the central coast of Jiangsu, thus hindering the sustainability of future development and construction. Most coastlines from the Dafeng to Jiang Ports in the central and southern Jiangsu coast were unstable and extremely unstable coasts; thus, the protection and management of this region should be strengthened for the sake of the sustainable goals on coastal resource development.

5.2. Limitations and Prospects

Our study provides insight on the evaluation of coastal stability for central Jiangsu, but there are still some limitations. First, there is the geometric bias that existed between the Landsat and HJ-1 images we used. Given that the spatial resolution of these images is 30 m, the bias maybe hamper the identification accuracy of artificial coastlines (e.g., seawalls) and vegetation boundaries (e.g., salt marsh edges). Second, the coastlines were corrected from the waterlines, and they can hardly represent the state throughout the entire year since the waterlines and tide levels change at any time. Finally, the driving forces affecting coastal stability were not fully taken into account, especially for natural factors such as sediment supply and transport, tidal channels, salt marshes, as well as sea level changes [58,66,67].
For future studies, we plan to obtain a more accurate evaluation of coastal stability by improving the spatial and temporal resolution of multi-sourced remote sensing data. Meanwhile, we will also grade coastal stability more reasonably by selecting typical sample areas, sampling beach surface sediments, and conducting regular field measurements. Finally, based on the remote sensing images and field survey data, we will propose a more comprehensive model for analyzing coastal stability, which is expected to further deepen the understanding of the evolutionary process of tidal flats and muddy coasts of our study area.

6. Conclusions

Our study annually extracted the coastline in central Jiangsu Province, China, during the years 1990–2020, using multi-source, medium-resolution remote sensing images. With the assistance of the DSAS system, our study quantitatively analyzed the length and type of coastline and the distance and rate of lateral movement of the coastlines, and it found changes in the erosion and siltation of coastlines. Based on this, a stability index was proposed to evaluate the coastal stability in central Jiangsu. Our findings demonstrated that the type of coastline gradually changed from natural to artificial, and the area of tidal flats was significantly reduced. The coastline was mainly affected by siltation and reclamation and moved seawards generally; the endpoints of siltation and erosion shifted 1.8 km to the south. The coastal stability in central Jiangsu gradually decreased from the north to the south. A total of 40% of the total coastlines was stable and relatively stable, occurring in the north of Dafeng Harbor; 28.9% of the total coastlines was extremely unstable and was distributed in the south of Jiang port; and frequent reclaimed areas were mostly located along unstable coastlines. Our findings on the coastal stability can provide a basis for the planning of coastal development and construction. The presented methods are expected to provide a beneficial reference for evaluating the coastal stability of typical muddy coasts.

Supplementary Materials

The following supporting information can be downloaded at: https://www.mdpi.com/article/10.3390/rs15133323/s1. Table S1: The remote sensing data used in this study; Table S2: The classification criteria of coastal stability; Figure S1: Hourly tidal level curve of Sheyang estuary, Jiang port, and Yangkou port tidal gauge stations from 23–24 February 2018; Figure S2: The mis-registration among HJ-1 and Landsat satellite images before geo-correction. (a) before geometric correction, (b) after geometric correction; Figure S3: Flowchat of the tide correction method of waterline; Figure S4: Schematic diagram of method for calculating the waterline by tide-level correction; Figure S5: Coastlines in central coast of Jiangsu from 1990 to 2020.

Author Contributions

Conceptualization, B.Z. and Y.L.; methodology, B.Z.; software, B.Z.; validation, L.W.; formal analysis, B.Z.; investigation, L.W.; writing—original draft preparation, B.Z.; writing—review and editing, Y.L.; visualization, L.W.; supervision, B.Z.; project administration, B.Z. and Y.L.; funding acquisition, B.Z. and Y.L. All authors have read and agreed to the published version of the manuscript.

Funding

This research was funded by the National Natural Science Foundation of China (grant number 41971378), the Excellent Young Talent Fund Program of Higher Education Institutions of Anhui Province (gxyqZD2020050), the Open Fund of the Key Laboratory of Coastal Zone Exploitation and Protection, Ministry of Natural Resources of China (grant number 2021CZEPK06), and the Natural Science Research Project of Chizhou University (grant number CZ2022YJRC06).

Data Availability Statement

The data used in this study are available upon request from the first author.

Acknowledgments

The authors are grateful to the United States Geological Survey (USGS) and Google Earth Engine (GEE) for providing Landsat-8 images and to the China Central Resources for Satellite Data and Applications (CCRSDA) for providing HJ-1 images. Note that any errors or shortcomings in the paper are the responsibility of the authors.

Conflicts of Interest

The authors declare no conflict of interest.

References

  1. Noujas, V.; Thomas, K.V.; Badarees, K.O. Shoreline management plan for a mudbank dominated coast. Ocean Eng. 2016, 112, 47–65. [Google Scholar] [CrossRef]
  2. Chen, W.-W.; Chang, H.-K. Estimation of shoreline position and change from satellite images considering tidal variation. Estuar. Coast. Shelf Sci. 2009, 84, 54–60. [Google Scholar] [CrossRef]
  3. Zhao, B.; Liu, Y.; Wang, L.; Liu, Y.; Sun, C.; Fagherazzi, S. Stability evaluation of tidal flats based on time-series satellite images: A case study of the Jiangsu central coast, China. Estuar. Coast. Shelf Sci. 2022, 264, 107697. [Google Scholar] [CrossRef]
  4. Liu, C.; Xiao, Y.; Yang, J. A Coastline Detection Method in Polarimetric SAR Images Mixing the Region-Based and Edge-Based Active Contour Models. IEEE Trans. GRS. 2017, 55, 3735–3747. [Google Scholar] [CrossRef]
  5. Sagar, S.; Roberts, D.; Bala, B.; Lymburner, L. Extracting the intertidal extent and topography of the Australian coastline from a 28 year time series of Landsat observations. Remote Sens. Environ. 2017, 195, 153–169. [Google Scholar] [CrossRef]
  6. Sun, C.; Li, J.; Liu, Y.; Zhao, S.; Zheng, J.; Zhang, S. Tracking annual changes in the distribution and composition of saltmarsh vegetation on the Jiangsu coast of China using Landsat time series–based phenological parameters. Remote Sens. Environ. 2023, 284, 113370. [Google Scholar] [CrossRef]
  7. Moussaid, J.; Fora, A.A.; Zourarah, B.; Maanan, M.; Maanan, M. Using automatic computation to analyze the rate of shoreline change on the Kenitra coast, Morocco. Ocean Eng. 2015, 102, 71–77. [Google Scholar] [CrossRef]
  8. Murray, N.J.; Phinn, S.R.; DeWitt, M.; Ferrari, R.; Johnston, R.; Lyons, M.B.; Clinton, N.; Thau, D.; Fuller, R.A. The global distribution and trajectory of tidal flats. Nature 2019, 565, 222–225. [Google Scholar] [CrossRef]
  9. Neelamani, S. Coastal erosion and accretion in Kuwait—Problems and management strategies. Ocean Coast. Manag. 2018, 156, 76–91. [Google Scholar] [CrossRef]
  10. Wang, X.; Zhang, W.; Yin, J.; Wang, J.; Ge, J.; Wu, J.; Luo, W.; Lam, N.S.N. Assessment of coastal erosion vulnerability and socio-economic impact along the Yangtze River Delta. Ocean Coast. Manag. 2021, 215, 105953. [Google Scholar] [CrossRef]
  11. Hamid, A.I.A.; Din, A.H.M.; Abdullah, N.M.; Yusof, N.; Hamid, M.R.A.; Shah, A.M. Exploring space geodetic technology for physical coastal vulnerability index and management strategies: A review. Ocean Coast. Manag. 2021, 214, 105916. [Google Scholar] [CrossRef]
  12. Husnayaen Rimba, A.B.; Osawa, T.; Parwata, I.N.S.; As-syakur, A.R.; Kasim, F.; Astarini, I.A. Physical assessment of coastal vulnerability under enhanced land subsidence in Semarang, Indonesia, using multi-sensor satellite data. Adv. Space Res. 2018, 61, 2159–2179. [Google Scholar] [CrossRef]
  13. McLaughlin, S.; Cooper, J.A.G. A multi-scale coastal vulnerability index: A tool for coastal managers? Env. Hazards 2010, 9, 233–248. [Google Scholar] [CrossRef]
  14. Dellepiane, S.; De Laurentiis, R.; Giordano, F. Coastline extraction from SAR images and a method for the evaluation of the coastline precision. Pattern Recognit. Lett. 2004, 25, 1461–1470. [Google Scholar] [CrossRef]
  15. Liu, Y.; Pu, Y.; Li, M.; Yang, J.; Shu, Y. Tidal flat stability analysis based on GIS & RS technology: A case study in Dongsha sandbank, offshore the coast of Jiangsu province. Geospat. Inf. Sci. 2007. [Google Scholar]
  16. Xu, H.; Jia, A.; Song, X.; Bai, Y. Suitability evaluation of carrying capacity and utilization patterns on tidal flats of Bohai Rim in China. J. Environ. Manag. 2022, 319, 115688. [Google Scholar] [CrossRef]
  17. Otsu, N. A Threshold Selection Method from Gray-Level Histograms; IEEE: Piscataway, NJ, USA, 1979. [Google Scholar]
  18. Pardo-Pascual, J.E.; Almonacid-Caballer, J.; Ruiz, L.A.; Palomar-Vázquez, J. Automatic extraction of shorelines from Landsat TM and ETM+ multi-temporal images with subpixel precision. Remote Sens. Environ. 2012, 123, 1–11. [Google Scholar] [CrossRef] [Green Version]
  19. Ryu Joo-Hyung Won, J.-S.; Min, K.D. Waterline extraction from Landsat TM data in a tidal flat: A case study in Gomso Bay, Korea. Remote Sens. Environ. 2002, 83, 442–456. [Google Scholar]
  20. McFeeters, S.K. The use of the Normalized Difference Water Index (NDWI) in the delineation of open water features. Int. J. Remote Sens. 1996, 17, 1425–1432. [Google Scholar] [CrossRef]
  21. Cao, W.; Zhou, Y.; Li, R.; Li, X. Mapping changes in coastlines and tidal flats in developing islands using the full time series of Landsat images. Remote Sens. Environ. 2020, 239, 111665. [Google Scholar] [CrossRef]
  22. Xu, H. Modification of normalised difference water index (NDWI) to enhance open water features in remotely sensed imagery. Int. J. Remote Sens. 2006, 27, 3025–3033. [Google Scholar] [CrossRef]
  23. Baselice, F.; Ferraioli, G. Unsupervised Coastal Line Extraction from SAR Images. IEEE Geosci. Remote Sens. 2013, 10, 1350–1354. [Google Scholar] [CrossRef]
  24. Toure, S.; Diop, O.; Kpalma, K.; Maiga, A. Shoreline Detection using Optical Remote Sensing: A Review. ISPRS Int. J. Geo–Inf. 2019, 8, 75. [Google Scholar] [CrossRef] [Green Version]
  25. Liu, H.; Jezek, K.C. Automated extraction of coastline from satellite imagery by integrating Canny edge detection and locally adaptive thresholding methods. Int. J. Remote Sens. 2004, 25, 937–958. [Google Scholar] [CrossRef]
  26. Walter, V. Object-based classification of remote sensing data for change detection. ISPRS J. Photogramm. 2004, 58, 225–238. [Google Scholar] [CrossRef]
  27. Rasuly, A.; Naghdifar, R.; Rasoli, M. Monitoring of Caspian Sea Coastline Changes Using Object-Oriented Techniques. Procedia Env. Sci. 2010, 2, 416–426. [Google Scholar] [CrossRef] [Green Version]
  28. Mason, D.C.; Davenport, I.J.; Robinson, G.J.; Flather, R.A.; McCartney, B.S. Construction of an inter-tidal digital elevation model by the ‘Water-Line’ Method. Geophys. Res. Lett. 1995, 22, 3187–3190. [Google Scholar] [CrossRef]
  29. Ryu, J.-H.; Kim, C.-H.; Lee, Y.-K.; Won, J.-S.; Chun, S.-S.; Lee, S. Detecting the intertidal morphologic change using satellite data. Estuar. Coast. Shelf Sci. 2008, 78, 623–632. [Google Scholar] [CrossRef]
  30. Zhao, B.; Guo, H.; Yan, Y.; Wang, Q.; Li, B. A simple waterline approach for tidelands using multi-temporal satellite images: A case study in the Yangtze Delta. Estuar. Coast. Shelf Sci. 2008, 77, 134–142. [Google Scholar] [CrossRef]
  31. Liu, Y.; Huang, H.; Qiu, Z.; Fan, J. Detecting coastline change from satellite images based on beach slope estimation in a tidal flat. Int. J. Appl. Earth Obs. 2013, 23, 165–176. [Google Scholar] [CrossRef]
  32. Zhang, Y.; Zhang, J.; Li, X.; Jing, X.; Yang, J. Stability of continental coastline in China since 1990. Sci. Geogr. Sin. 2015, 35, 1288–1293. (In Chinese) [Google Scholar]
  33. Chen, W.; Zhang, D.; Cui, D.; Lv, L.; Xie, W.; Shi, S.; Hou, Z. Monitoring spatial and temporal changes in the continental coastline and the intertidal zone in Jiangsu province, China. Acta Geogr. Sin. 2018, 73, 1365–1380. (In Chinese) [Google Scholar]
  34. Vos, K.; Splinter, K.D.; Harley, M.D.; Simmons, J.A.; Turner, I.L. CoastSat: A Google Earth Engine-enabled Python toolkit to extract shorelines from publicly available satellite imagery. Env. Model Softw. 2019, 122, 104528. [Google Scholar] [CrossRef]
  35. Liu, Y.; Li, M.; Mao, L.; Cheng, L.; Chen, K. Seasonal Pattern of Tidal-Flat Topography along the Jiangsu Middle Coast, China, Using HJ-1 Optical Images. Wetlands 2013, 33, 871–886. [Google Scholar] [CrossRef]
  36. Wang, X.; Xiao, X.; Zou, Z.; Chen, B.; Ma, J.; Dong, J.; Doughty, R.B.; Zhong, Q.; Qin, Y.; Dai, S.; et al. Tracking annual changes of coastal tidal flats in China during 1986–2016 through analyses of Landsat images with Google Earth Engine. Remote Sens. Environ. 2020, 238, 110987. [Google Scholar] [CrossRef]
  37. Kang, Y.; Ding, X.; Xu, F.; Zhang, C.; Ge, X. Topographic mapping on large-scale tidal flats with an iterative approach on the waterline method. Estuar. Coast Shelf Sci. 2017, 190, 11–22. [Google Scholar] [CrossRef]
  38. Mason, D.C.; Scott, T.R.; Dance, S.L. Remote sensing of intertidal morphological change in Morecambe Bay, U.K., between 1991 and 2007. Estuar. Coast. Shelf Sci. 2010, 87, 487–496. [Google Scholar] [CrossRef] [Green Version]
  39. Ryu, J.-H.; Choi, J.-K.; Lee, Y.-K. Potential of remote sensing in management of tidal flats: A case study of thematic mapping in the Korean tidal flats. Ocean Coast. Manag. 2014, 102, 458–470. [Google Scholar] [CrossRef]
  40. Wang, Y.; Liu, Y.; Jin, S.; Sun, C.; Wei, X. Evolution of the topography of tidal flats and sandbanks along the Jiangsu coast from 1973 to 2016 observed from satellites. ISPRS J. Photogramm. 2019, 150, 27–43. [Google Scholar] [CrossRef]
  41. Behling, R.; Milewski, R.; Chabrillat, S. Spatiotemporal shoreline dynamics of Namibian coastal lagoons derived by a dense remote sensing time series approach. Int. J. Appl. Earth Obs. 2018, 68, 262–271. [Google Scholar] [CrossRef] [Green Version]
  42. Lee, Y.-K.; Ryu, J.-H.; Choi, J.-K.; Soh, J.-G.; Eom, J.-A.; Won, J.-S. A Study of Decadal Sedimentation Trend Changes by Waterline Comparisons within the Ganghwa Tidal Flats Initiated by Human Activities. J. Coast. Res. 2011, 276, 857–869. [Google Scholar] [CrossRef]
  43. Cui, B.-L.; Li, X.-Y. Coastline change of the Yellow River estuary and its response to the sediment and runoff (1976–2005). Geomorphology 2011, 127, 32–40. [Google Scholar] [CrossRef]
  44. Hou, X.; Wu, T.; Hou, W.; Chen, Q.; Wang, Y.; Yu, L. Characteristics of coastline changes in mainland China since the early 1940s. Sci. China Earth Sci. 2016, 59, 1791–1802. [Google Scholar] [CrossRef]
  45. Jayson-Quashigah, P.-N.; Addo, K.A.; Kodzo, K.S. Medium resolution satellite imagery as a tool for monitoring shoreline change. Case study of the Eastern coast of Ghana. J. Coast. Res. 2013, 65, 511–516. [Google Scholar] [CrossRef]
  46. Zhu, L.; Wu, J.; Xu, Z.; Xu, Y.; Lin, J.; Hu, R. Coastline movement and change along the Bohai Sea from 1987 to 2012. J. Appl. Remote Sens. 2014, 8, 083585. [Google Scholar] [CrossRef]
  47. Purkis, S.J.; Gardiner, R.; Johnston, M.W.; Sheppard, C.R.C. A half-century of coastline change in Diego Garcia–The largest atoll island in the Chagos. Geomorphology 2016, 261, 282–298. [Google Scholar] [CrossRef]
  48. Thieler, E.R.; Himmelstoss, E.A.; Zichichi, J.L.; Ergul, A. The Digital Shoreline Analysis System (DSAS) Version 4.0—An ArcGIS Extension for Calculating Shoreline Change; U.S. Geological Survey: Reston, VA, USA, 2009. [Google Scholar]
  49. Gong, Z.; Wang, Z.; Stive, M.; Zhang, C.; Chu, A. Process-Based Morphodynamic Modeling of a Schematized Mudflat Dominated by a Long-Shore Tidal Current at the Central Jiangsu Coast, China. J. Coast. Res. 2012, 28, 1381–1392. [Google Scholar] [CrossRef]
  50. Zhang, W.; Zhang, X.; Huang, H.; Wang, Y.; Fagherazzi, S. On the morphology of radial sand ridges. Earth Surf. Proc. Land. 2020, 45, 2613–2630. [Google Scholar] [CrossRef]
  51. Wang, Y. Environment and Resources of the South Yellow Sea Radial Sand Ridge Group; Ocean Press: Beijing, China, 2014. (In Chinese) [Google Scholar]
  52. Wang, Y.P.; Gao, S.; Jia, J.; Thompson, C.E.L.; Gao, J.; Yang, Y. Sediment transport over an accretional intertidal flat with influences of reclamation, Jiangsu coast, China. Mar. Geol. 2012, 291–294, 147–161. [Google Scholar] [CrossRef]
  53. Zhang, R. Suspended sediment transport processes on tidal mud flat in Jiangsu Province, China. Estuar. Coast. Shelf Sci. 1992, 35, 225–233. [Google Scholar]
  54. Gorelick, N.; Hancher, M.; Dixon, M.; Ilyushchenko, S.; Thau, D.; Moore, R. Google Earth Engine: Planetary-scale geospatial analysis for everyone. Remote Sens. Environ. 2017, 202, 18–27. [Google Scholar] [CrossRef]
  55. Dong, Y.; Liu, Y.; Hu, C.; Xu, B. Coral reef geomorphology of the Spratly Islands: A simple method based on time-series of Landsat-8 multi-band inundation maps. ISPRS J. Photogramm. Remote Sens. 2019, 157, 137–154. [Google Scholar] [CrossRef]
  56. Serra, J. Image Analysis and Mathematical Morphology; Academic Press: Cambridge, MA, USA, 1982. [Google Scholar]
  57. Zhang, R. Equilibrium state of tidal flat: A case study at the inner edge of the Radial Sand Ridges off Jiangsu coast. Chin. Sci. Bulletin. 1995, 40, 347–350. (In Chinese) [Google Scholar]
  58. Kirwan, M.L.; Megonigal, J.P. Tidal wetland stability in the face of human impacts and sea-level rise. Nature 2013, 504, 53–60. [Google Scholar] [CrossRef] [PubMed]
  59. Li, L.; Li, G.; Du, J.; Wu, J.; Cui, L.; Chen, Y. Effects of tidal flat reclamation on the stability of coastal wetland ecosystem services: A case study in Jiangsu Coast, China. Ecol. Indic. 2022, 145, 109697. [Google Scholar] [CrossRef]
  60. Zhao, S.; Liu, Y.; Li, M.; Sun, C.; Zhou, M.; Zhang, H. Analysis of Jiangsu Tidal Flats Reclamation from 1974 to 2012 Using Remote Sensing. China Ocean Eng. 2015, 29, 143–154. [Google Scholar] [CrossRef]
  61. Xu, N.; Wang, Y.; Huang, C.; Jiang, S.; Jia, M.; Ma, Y. Monitoring coastal reclamation changes across Jiangsu Province during 1984–2019 using landsat data. Mar. Policy. 2022, 136, 104887. [Google Scholar] [CrossRef]
  62. Huang, Y.; Li, Y.; Chen, Q.; Huang, Y.; Tian, J.; Cai, M.; Huang, Y.; Jiao, Y.; Yang, Y.; Du, X.; et al. Effects of reclamation methods and habitats on macrobenthic communities and ecological health in estuarine coastal wetlands. Mar. Pollut. Bull. 2021, 168, 112420. [Google Scholar] [CrossRef]
  63. Tian, P.; Li, J.; Cao, L.; Pu, R.; Gong, H.; Liu, Y.; Zhang, H.; Chen, H. Impacts of reclamation derived land use changes on ecosystem services in a typical gulf of eastern China: A case study of Hangzhou bay. Ecol. Indic. 2021, 132, 108259. [Google Scholar] [CrossRef]
  64. Zhang, M.; Dai, Z.; Bouma, T.J.; Bricker, J.; Townend, I.; Wen, J.; Zhao, T.; Cai, H. Tidal-flat reclamation aggravates potential risk from storm impacts. Coast. Eng. 2021, 166, 103868. [Google Scholar] [CrossRef]
  65. Chen, X.; Yu, S.; Chen, J.; Zhang, C.; Dai, W.; Zhang, Q. Environmental Impact of Large-scale Tidal Flats Reclamation in Jiangsu, China. J. Coast. Res. 2020, 95, 315–319. [Google Scholar] [CrossRef]
  66. Du, J.; Shi, B.; Li, S.; Wang, Y. Muddy coast off Jiangsu, China: Physical, Ecological, and antheopogenic processes. In Sediment Dynamics of Chinese Muddy Coasts and Estuaries; Academic Press: Cambridge, MA, USA, 2019; pp. 24–49. [Google Scholar]
  67. Sun, C.; Li, J.; Liu, Y.; Liu, Y.; Liu, R. Plant species classification in salt marshes using phenological parameters derived from Sentinel-2 pixel-differential time-series. Remote Sens. Environ. 2021, 256, 112320. [Google Scholar] [CrossRef]
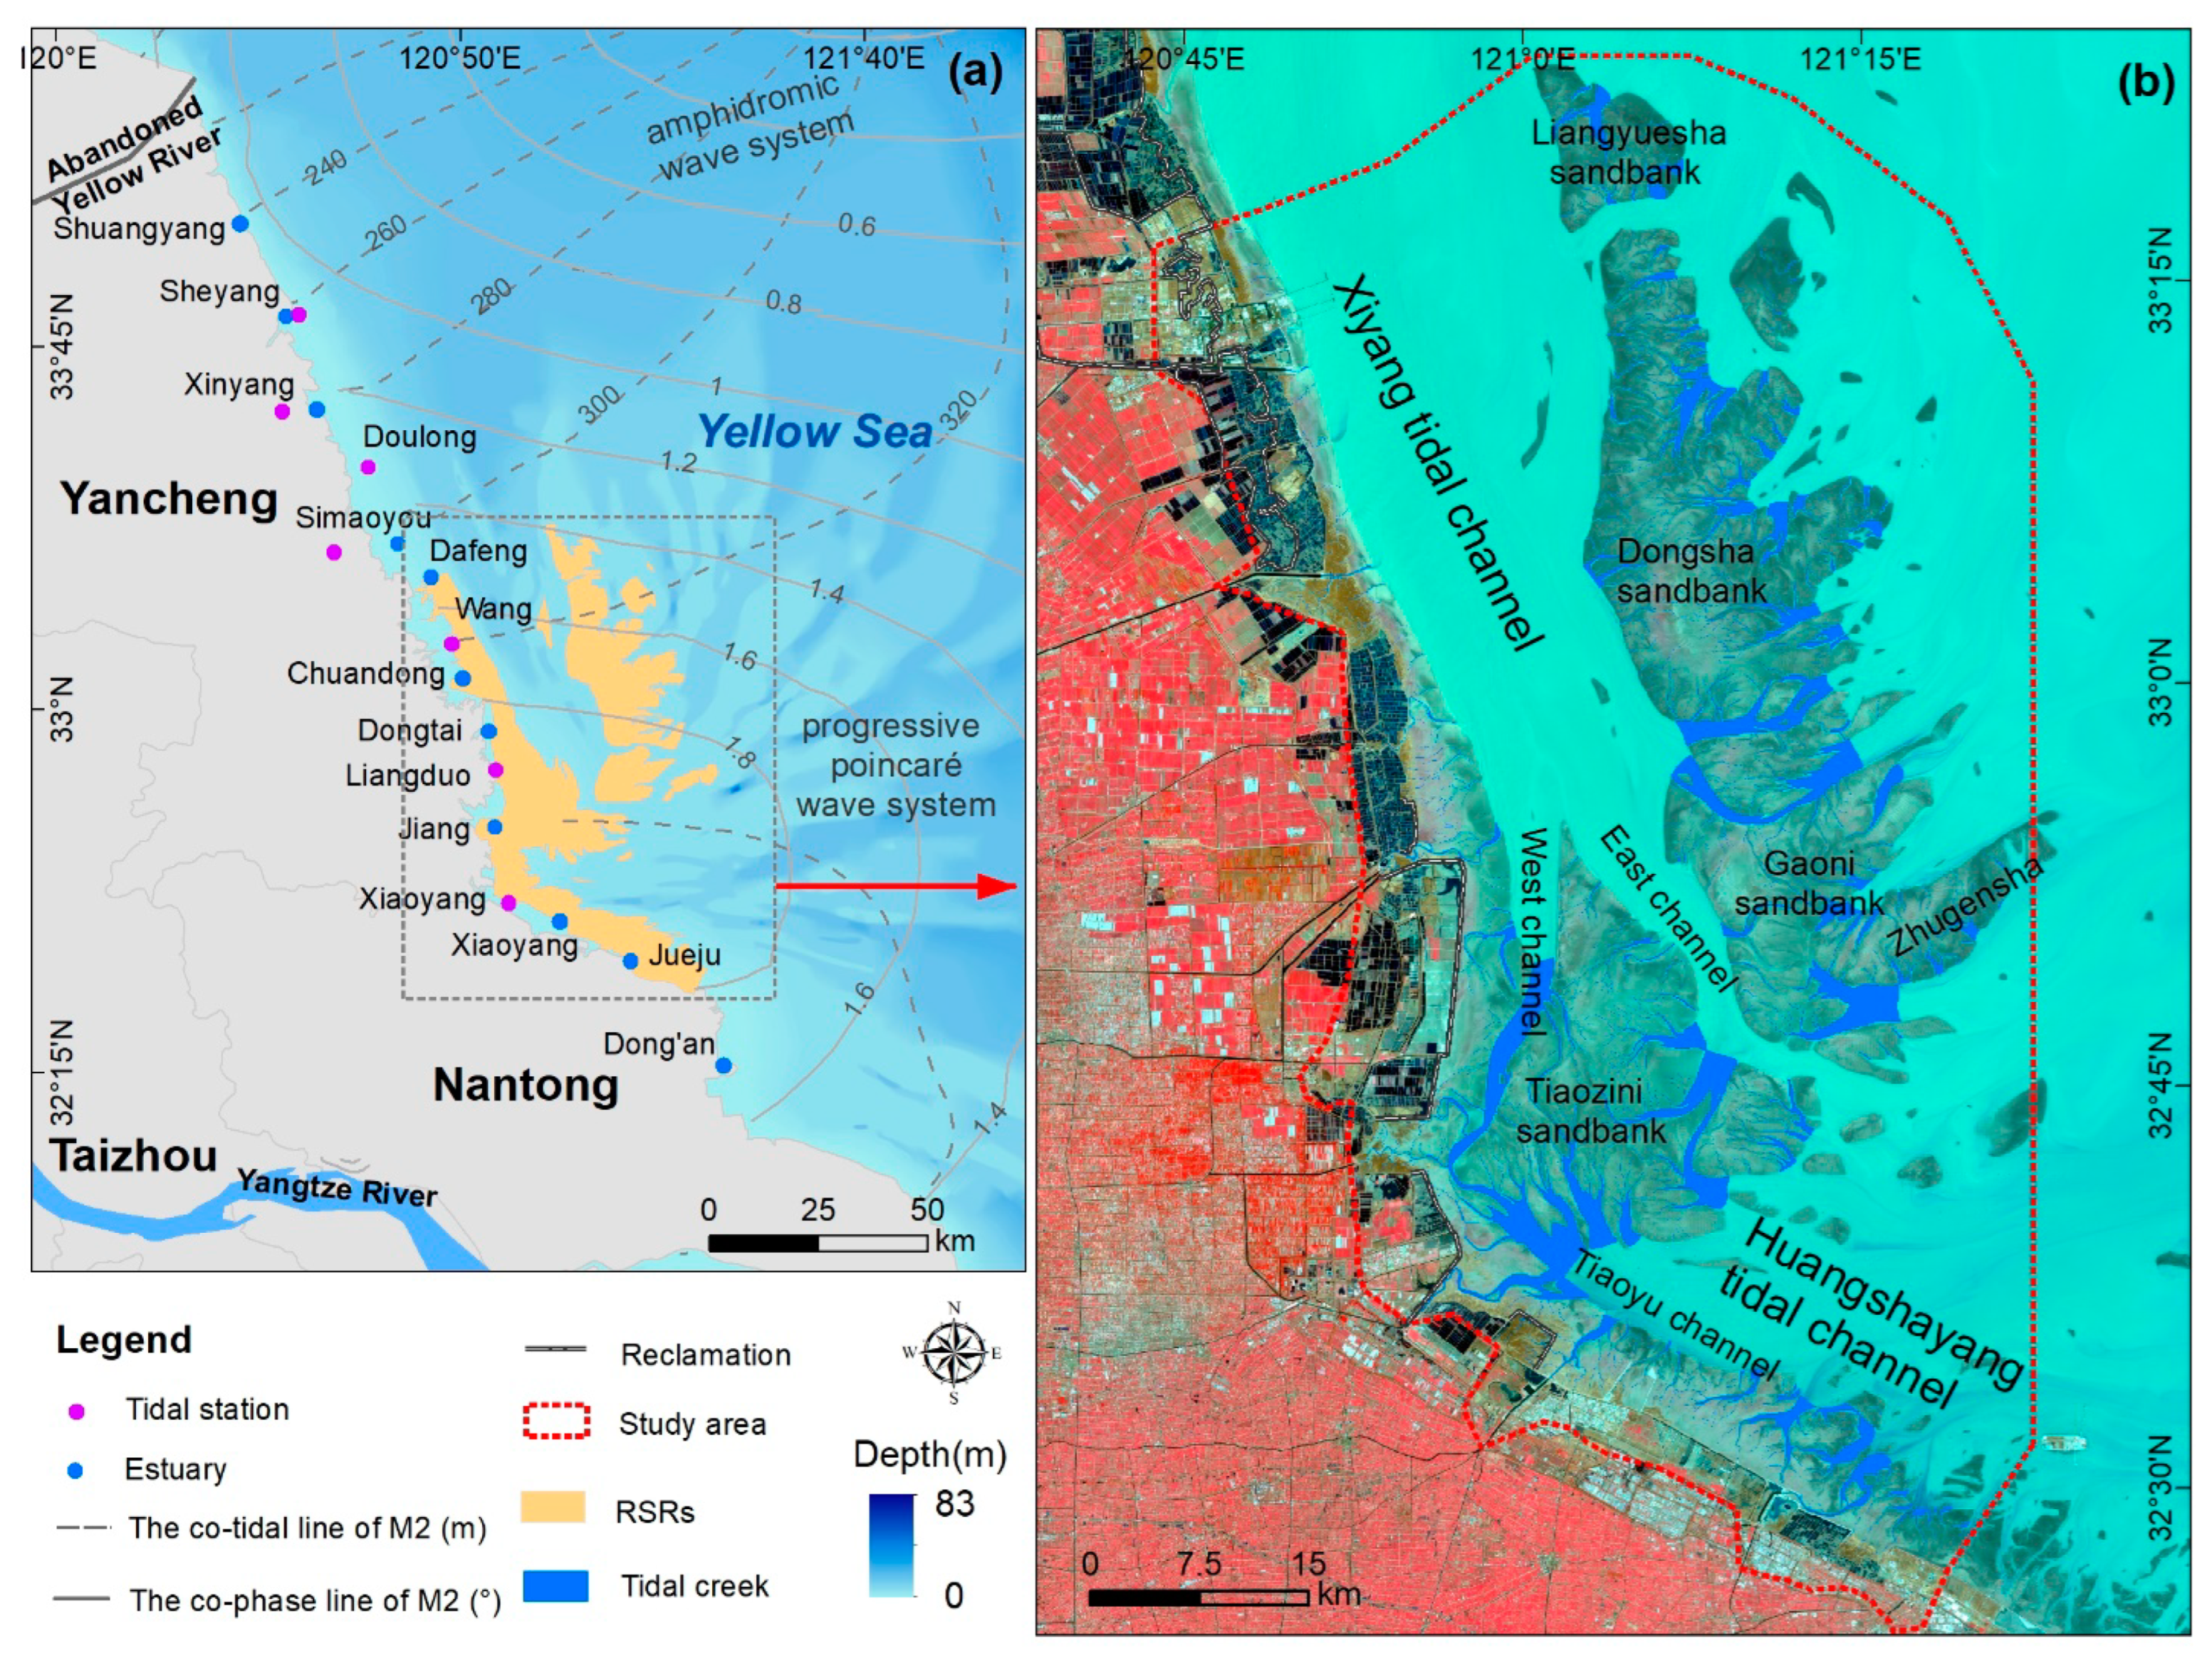
Figure 1. Location of the central Jiangsu coasts. (a) The orange shaded area indicates the extent of sand ridge in the study area; (b) the standard false-color composite (R: 5, G: 4, B: 3) of Landsat-8 OLI imaged at low tide, acquired at Greenwich Mean Time (GMT) 02:30:32, 23 February 2018.
Remotesensing 15 03323 g001
Figure 2. Waterline extraction based on edge detection and mathematical morphology. (a) Landsat-8 OLI standard false-color composite (R: 5, G: 4, B: 3), acquired on 23 February 2018; (b) MNDWI water index; (c) canny operator for water and land segmentation; (d) results of waterline extraction.
Remotesensing 15 03323 g002
Figure 3. Theory of coastline position modification. C1 and C2 are two waterlines acquired at different times.
Remotesensing 15 03323 g003
Figure 4. Changes in the type of coastline in the central Jiangsu coasts from 1990 to 2020.
Remotesensing 15 03323 g004
Figure 5. Lateral movement of the coastline in central Jiangsu from 1990 to 2020.
Remotesensing 15 03323 g005
Figure 6. Change rate of coastline in the central coast of Jiangsu from 1990 to 2020.
Remotesensing 15 03323 g006
Figure 7. Stability division along the central Jiangsu coast: (a) Spatial distribution of the stability index; (b) spatial distribution of stability grades.
Remotesensing 15 03323 g007
Figure 8. Spatio-temporal distribution of reclamation areas along the central coast of Jiangsu. (ae) Enlargement of partial reclamation areas.
Remotesensing 15 03323 g008
Table 1. The classification criteria of coastal stability.
Classification
Criteria
Stable
Coast
Relatively Stable CoastUnstable CoastExtremely Unstable Coast
Stability index EE ≤ 1515 < E ≤ 5050 < E ≤ 100E > 100
Disclaimer/Publisher’s Note: The statements, opinions and data contained in all publications are solely those of the individual author(s) and contributor(s) and not of MDPI and/or the editor(s). MDPI and/or the editor(s) disclaim responsibility for any injury to people or property resulting from any ideas, methods, instructions or products referred to in the content.