Article

Exploring the Potential of Solar-Induced Chlorophyll Fluorescence Monitoring Drought-Induced Net Primary Productivity Dynamics in the Huang-Huai-Hai Plain Based on the SIF/NPP Ratio

1
Anhui Province Key Lab of Farmland Ecological Conservation and Pollution Prevention, College of Resources and Environment, Anhui Agricultural University, Hefei 230036, China
2
Key Laboratory of JiangHuai Arable Land Resources Protection and Eco-Restoration, College of Resources and Environment, Anhui Agricultural University, Hefei 230036, China
*
Author to whom correspondence should be addressed.
Remote Sens. 2023, 15(13), 3276; https://doi.org/10.3390/rs15133276
Submission received: 29 April 2023 / Revised: 12 June 2023 / Accepted: 24 June 2023 / Published: 26 June 2023
(This article belongs to the Section Remote Sensing in Agriculture and Vegetation)

Abstract

:
Drought causes significant losses in vegetation net primary productivity (NPP). However, the lack of real-time, large-scale NPP data poses challenges in analyzing the relationship between drought and NPP. Solar-induced chlorophyll fluorescence (SIF) offers a real-time approach to monitoring drought-induced NPP dynamics. Using two drought events in the Huang–Huai–Hai Plain from 2010 to 2020 as examples, we propose a new SIF/NPP ratio index to quantify and evaluate SIF’s capability in monitoring drought-induced NPP dynamics. The findings reveal distinct seasonal changes in the SIF/NPP ratio across different drought events, intensities, and time scales. SIF demonstrates high sensitivity to commonly used vegetation greenness parameters for NPP estimation (R2 > 0.8, p < 0.01 for SIF vs NDVI and SIF vs LAI), as well as moderate sensitivity to land surface temperature (LST) and a fraction of absorbed photosynthetically active radiation (FAPAR) (R2 > 0.5, p < 0.01 for SIF vs FAPAR and R2 > 0.6, p < 0.01 for SIF vs LST). However, SIF shows limited sensitivity to precipitation (PRE). Our study suggests that SIF has potential for monitoring drought-induced NPP dynamics, offering a new approach for real-time monitoring and enhancing understanding of the drought–vegetation productivity relationship.

Graphical Abstract

1. Introduction

Net primary productivity (NPP) represents the fixation and conversion efficiency of photosynthetic products in plants, determines the net carbon input to terrestrial ecosystems, and is a key process in the carbon cycle [1]. With ongoing global climate change, the frequency and severity of droughts are increasing, leading to significant losses in terrestrial vegetation’s NPP [2,3,4]. Moreover, it also amplifies the uncertainties associated with carbon uptake and storage in terrestrial vegetation ecosystems [5,6]. Therefore, the real-time monitoring of drought-induced dynamic changes in vegetation NPP is an urgent issue that needs to be addressed.
Currently, regional- and global-scale NPP data are primarily obtained through mathematical model estimation and inversion. Predictive models for NPP estimation, such as the Carnegie–Ames–Stanford approach (CASA) and global production efficiency model (GLO-PEM), have been widely applied [7,8,9,10]. Furthermore, research has been conducted to utilize the normalized difference vegetation index (NDVI) for the estimation of NPP [11,12]. However, NPP derived from these models is uncertain and has limitations. First, fully quantifying the parameters that influence NPP changes during the estimation and inversion processes is difficult, leading to differences in the actual NPP. Second, spatial heterogeneity factors, such as vegetation coverage and water use efficiency, can introduce uncertainty into data inversion and estimation processes [13]. In addition, NPP derived from models relies on historical observation data and cannot satisfy research requirements for real-time NPP monitoring [14].
Solar-induced chlorophyll fluorescence (SIF), as a fluorescence signal of vegetation photosynthesis, exhibits great potential in monitoring drought-induced stress on vegetation [15,16]. Compared with traditional vegetation indices such as NDVI and enhanced vegetation index (EVI), SIF has the advantages of faster and more sensitive reflection of changes in vegetation physiological parameters. It can effectively characterize the impact of environmental stress on vegetation [17,18]. SIF shows tremendous potential in monitoring the effects of high temperature on crop stress and yield [19], the resistance and resilience of large-scale vegetation to drought [20], and provides a new perspective for studying the impact of drought on vegetation carbon uptake [21,22].
Furthermore, SIF has shown tremendous potential in estimating and monitoring vegetation productivity in real time [23,24,25]. Current research has demonstrated a close linear relationship between SIF and gross primary productivity (GPP) [26]. Combining SIF with proxy data on biological characteristics can appropriately capture vegetation dynamics and interannual variations under various climatic conditions [27,28]. Meanwhile, NPP is commonly considered as the portion of GPP that remains after subtracting vegetation respiration and exhibits a stable and close linear relationship with GPP [29,30]. The superiority of SIF in GPP-related studies together with the close relationship between GPP and NPP indicate that SIF also holds potential for characterizing and monitoring dynamic changes in NPP [31]. However, no studies have examined the potential relationships between SIF and drought-induced dynamic changes in NPP.
As research on SIF in vegetation productivity continues to advance [32,33], new opportunities arise for real-time monitoring of NPP dynamics [29,34,35]. Therefore, we established a novel ratio index, SIF/NPP, which links SIF with NPP for the first time. This index quantifies the relationship between SIF and NPP on an 8-day time scale. By analyzing the changes in the SIF/NPP ratio, we aim to investigate the relationship between SIF and NPP, validate the feasibility of using SIF to monitor NPP, and discuss the potential of SIF in monitoring the dynamic changes in NPP induced by drought. Drought plays a crucial role as a significant factor causing loss in NPP. Timely and accurate monitoring of vegetation NPP dynamics is essential for understanding vegetation ecological dynamics and formulating effective drought response measures [36].
This study aimed to quantify and evaluate the ability of SIF to monitor drought-induced dynamic changes in NPP using drought events in the Huang–Huai–Hai (HHH) Plain from 2010 to 2020 and explored the potential of SIF to monitor NPP dynamic changes during drought events. Most recent studies have explored the relationship between drought and NPP at an annual or monthly scale. However, an in-depth understanding of the relationship between drought and NPP at a finer time scale is lacking. Based on the analysis of the relationship between SIF and GPP, and NPP and GPP, we propose a new SIF/NPP ratio index to investigate drought-induced NPP dynamic changes on an 8-day time scale. We also quantified and evaluated the ability of SIF to monitor drought-induced NPP dynamic changes. Our study addressed three main issues: (1) whether SIF can monitor dynamic changes in NPP, (2) the ability of SIF to monitor dynamic changes in NPP during drought events, and (3) the response of SIF to other environmental factors affecting dynamic changes in NPP.

2. Materials and Methods

2.1. Study Area

The HHH Plain is an important agricultural production area in China. It is located between N30°–42° and E110°–125° (Figure 1). Land use data for the region were obtained from the National Basic Geographic Information Center Global Land Cover Data Product Service website (www.globeland30.org). The arable land area in this region accounts for approximately one-sixth of the total arable land area in China [37]. The HHH Plain has a warm–temperate semi-humid monsoon climate with an average annual temperature of 8–15 °C and annual precipitation of 500–950 mm. It is mainly planted with winter wheat and summer maize in rotation [38]. Owing to its monsoon climate, the HHH Plain is prone to drought [39].

2.2. Data

2.2.1. Global Orbiting Carbon Observatory-2 SIF (GOSIF) Products

GOSIF data represent a SIF dataset developed based on OCO-2 data, which have better spatial and temporal resolution than other SIF datasets. Moreover, these data have great potential for applications to assess terrestrial photosynthesis and ecosystem function and benchmark terrestrial biosphere and Earth system models [40]. We used the GOSIF dataset from 2010 to 2020 with a temporal resolution of 8 days and a spatial resolution of 0.05°.

2.2.2. GLASS NPP Products

The Global Land Surface Satellite (GLASS) NPP dataset includes 8-day interval data and annual data with a spatial resolution of 500 m. The GLASS NPP dataset was generated based on GLASS GPP data with a relative error of <25%; these data simulate the spatial and temporal variation in global vegetation productivity well and have large interannual variations in simulations [41]. In this study, the GLASS NPP dataset with an 8-day time interval from 2010 to 2020 was used. The spatial resolution of the dataset was downscaled to 0.05° to ensure that the GLASS NPP data maintained the same spatial and temporal resolution as the SIF dataset.

2.2.3. Ancillary Data

To assess the ability of SIF to monitor dynamic changes in NPP, we selected five environmental parameters commonly used for the estimation of NPP and analyzed the sensitivity of SIF to these environmental parameters. These environmental parameters included leaf area index (LAI), NDVI, land surface temperature (LST), fraction of absorbed photosynthetically active radiation (FAPAR), and precipitation (PRE).
The LST dataset was derived from the MOD11A2 product, which has a temporal resolution of 8 days and a spatial resolution of 500 m. The NDVI dataset was calculated based on the red and near-infrared bands of MOD09A1. This dataset has a temporal resolution of 8 days and a spatial resolution of 500 m. The FAPAR dataset was derived from the GLASS FAPAR product, which has a temporal resolution of 8 days and a spatial resolution of 0.05°. The GLASS FAPAR dataset calculates FAPAR values based on photosynthetically active radiation (PAR) transmittance throughout the canopy, thereby ensuring physical consistency between the LAI and FAPAR products [42]. GLASS FAPAR products have better quality and accuracy than similar datasets [43]. The LAI dataset was derived from the GLASS LAI product, which has a temporal resolution of 8 days and a spatial resolution of 0.05°. The GLASS LAI dataset is a true LAI generated using general regression neural networks (GRNNs) [44] that have been validated to have high accuracy and quality, as well as good spatial and temporal continuity, temporal stability, and vegetation phenology representativeness [45]. The PRE data were obtained from the Climate Hazards Group InfraRed Precipitation with Station (CHIRPS)-2.0 dataset [46], which combines climatology, 0.05° resolution satellite images, and in-situation data to form a gridded rainfall time series, showing great potential in trend analysis and seasonal drought monitoring.

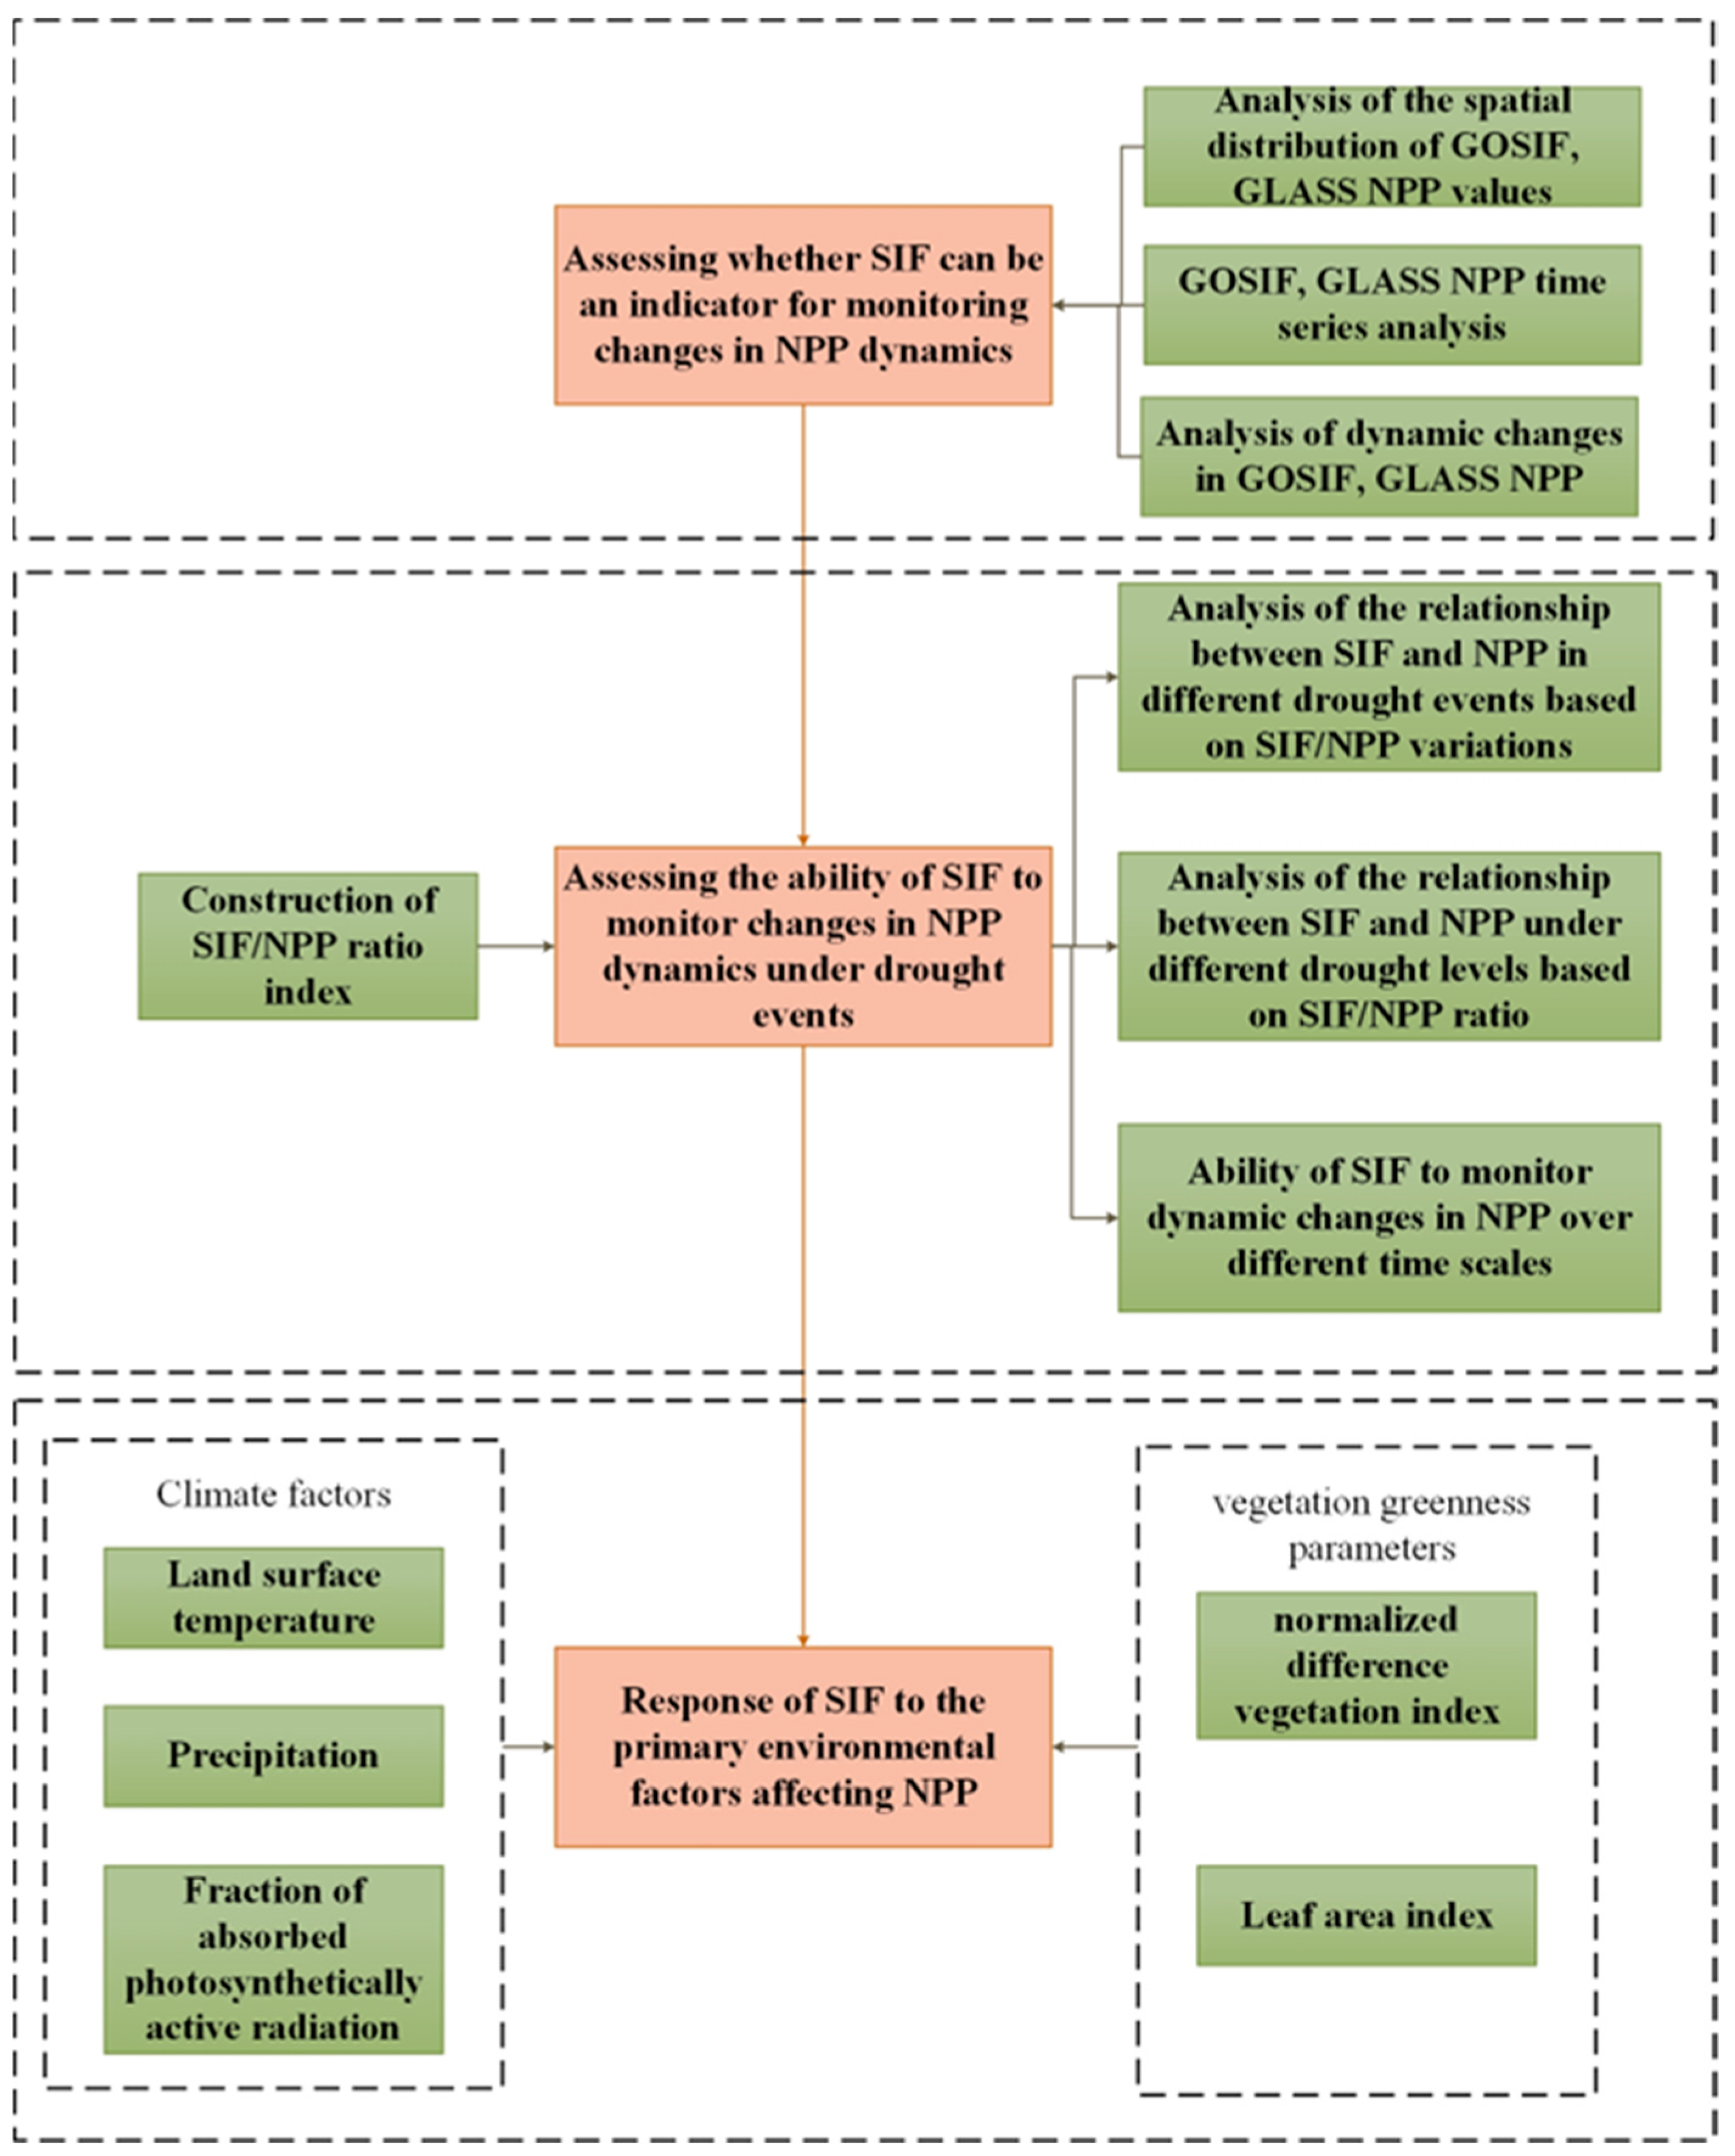
2.3. Overview of Research Methodology

The three-step framework for discussing the potential of monitoring NPP dynamic changes with SIF under drought events in this study is shown in Figure 2. Firstly, we examine the consistency between SIF and NPP in terms of numerical spatial distribution, spatiotemporal correlations, and dynamic trends. Second, we quantify the relationship between SIF and NPP by constructing the SIF/NPP ratio index, and we analyze and discuss the changes in the relationship between SIF and NPP from the perspectives of different drought events and drought levels. Finally, we discuss the sensitivity of SIF to the environmental parameters of the inverted NPP. Our study explores the potential of SIF to monitor the dynamic changes in NPP induced by drought through the above framework and provides a theoretical basis for understanding the relationship between SIF and NPP as well as monitoring the dynamic changes in NPP induced by drought.

2.4. Methods

2.4.1. Methods for Correlation Analysis between SIF and NPP

SIF shows potential for estimating vegetation productivity and monitoring drought stress on crops, yet there is currently no research establishing the potential correlation between SIF and NPP. Given the close relationship between GPP and NPP, there is an opportunity to explore the association between SIF and NPP [47,48]:
N P P = G P P R a    
where R a is the assimilation product consumed by the autotroph’s respiration.
Taking reference from current studies on the linear relationship between SIF and GPP [49,50,51], the derived equation and relationship between SIF and GPP are as follows:
G P P = P A R f P A R L U E P
where P A R is the value of the photosynthetically effective radiation received, f P A R is the fractional absorption rate of the radiation, and L U E P is the value of the absorbed photosynthetically effective radiation used for photosynthetic efficiency.
SIF can be similarly expressed as follows:
S I F λ = P A R f P A R L U E F λ f e s c λ
where λ is the spectral wavelength, L U E F λ is the light utilization efficiency of the SIF, and f e s c λ is used to account for the SIF escaping from the canopy into space.
Based on these two equations, the relationship between GPP and SIF can be expressed as follows:
G P P S I F λ L U E P L U E F λ
This relational equation quantifies the linear relationship between SIF and GPP and has been consistently confirmed in recent studies.
According to the above equation, we can deduce that there is a theoretical relationship between SIF and NPP. Since we cannot confirm whether the temporal and spatial relationship between SIF, NPP, and related environmental factors is a linear relationship, we used the Spearman analysis method to conduct pixel-by-pixel correlation analysis on the temporal data, calculating the correlation coefficient between the data and verifying the significance. The formula for the Spearman method is as follows:
c o r r X , Y = 1 n x i , j x ¯ y i , j y ¯ 1 n x i , j x ¯ 2 1 n y i , j y ¯ 2
where c o r r X , Y is the Spearman correlation coefficient, x i , j , y i , j are the two variables at coordinates (i,j) of the pixels, and x ¯ and y ¯ represent the time series of the two variables at the coordinates with mean values of (i,j).
The Spearman correlation coefficient ranged from [−1, 1]. If the calculated result tends to 1, then it means that the spatial–temporal changes in the two variables are highly synchronized; if the calculated result tends to −1, then it means that the two variables have opposite variability; and if the calculated result tends to 0, then it means that the changes in the two variables are not correlated.
Furthermore, the analysis of the relationship between SIF and environmental factors also employs the Spearman’s rank correlation method.

2.4.2. Standardized Anomaly Index

The standardized anomaly index is a common method for quantifying dynamic changes in data and is calculated as follows:
A i , j = X i , j X J ¯ σ j
where A i , j is the standardized distance level index for day j of year i, X i , j is the original image value for day j of year i, X J ¯ is the multiyear mean for day j, and σ j is the multi-year standard deviation value for day j. In our study, we calculated the standardized anomalies of GOSIF, GLASS NPP, and related environmental factors and characterized the multi-year dynamic changes in the data by constructing a time series of standardized anomaly values.

2.4.3. Time Lag Analysis

We conducted a time lag analysis between SIF and five environmental factors in order to better understand their response relationships. Since it is not yet clear whether there is a linear relationship between SIF and the environmental factors, we chose Spearman correlation analysis to calculate the time lag coefficients. We performed pixel-wise correlation analysis between SIF and the corresponding environmental factors, using an 8-day cycle (i.e., at days 0, 8, 16, etc. until the end of the drought). The calculation formula is as follows:
R i = c o r r X , Y i
where R i is the correlation coefficient, X represents the SIF data, Y i represents the data when Y lags by i days, and i denotes the number of lag days. The calculation result of R i ranges from [−1, 1]. When i is 0, R0 indicates the correlation between SIF and the concurrent environmental factor. When R i > R 0   , it indicates a time lag of i days between SIF and the environmental factor. When R i reaches its maximum value, we consider the maximum time lag period of i days between SIF and that environmental factor.

3. Results

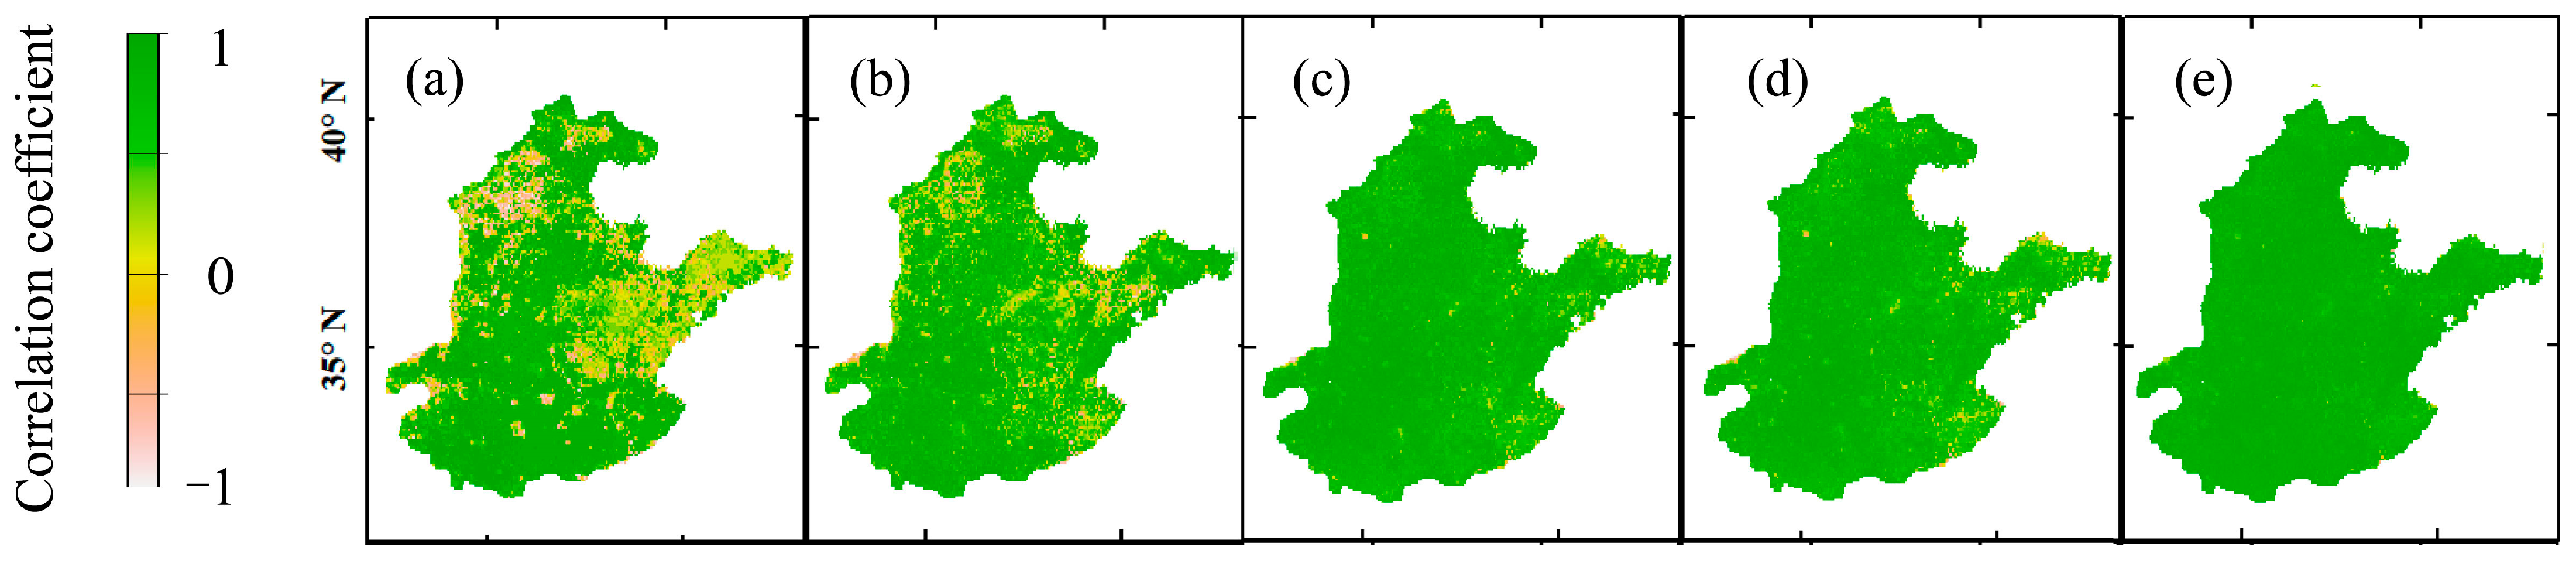
3.1. The Correlation between SIF and NPP

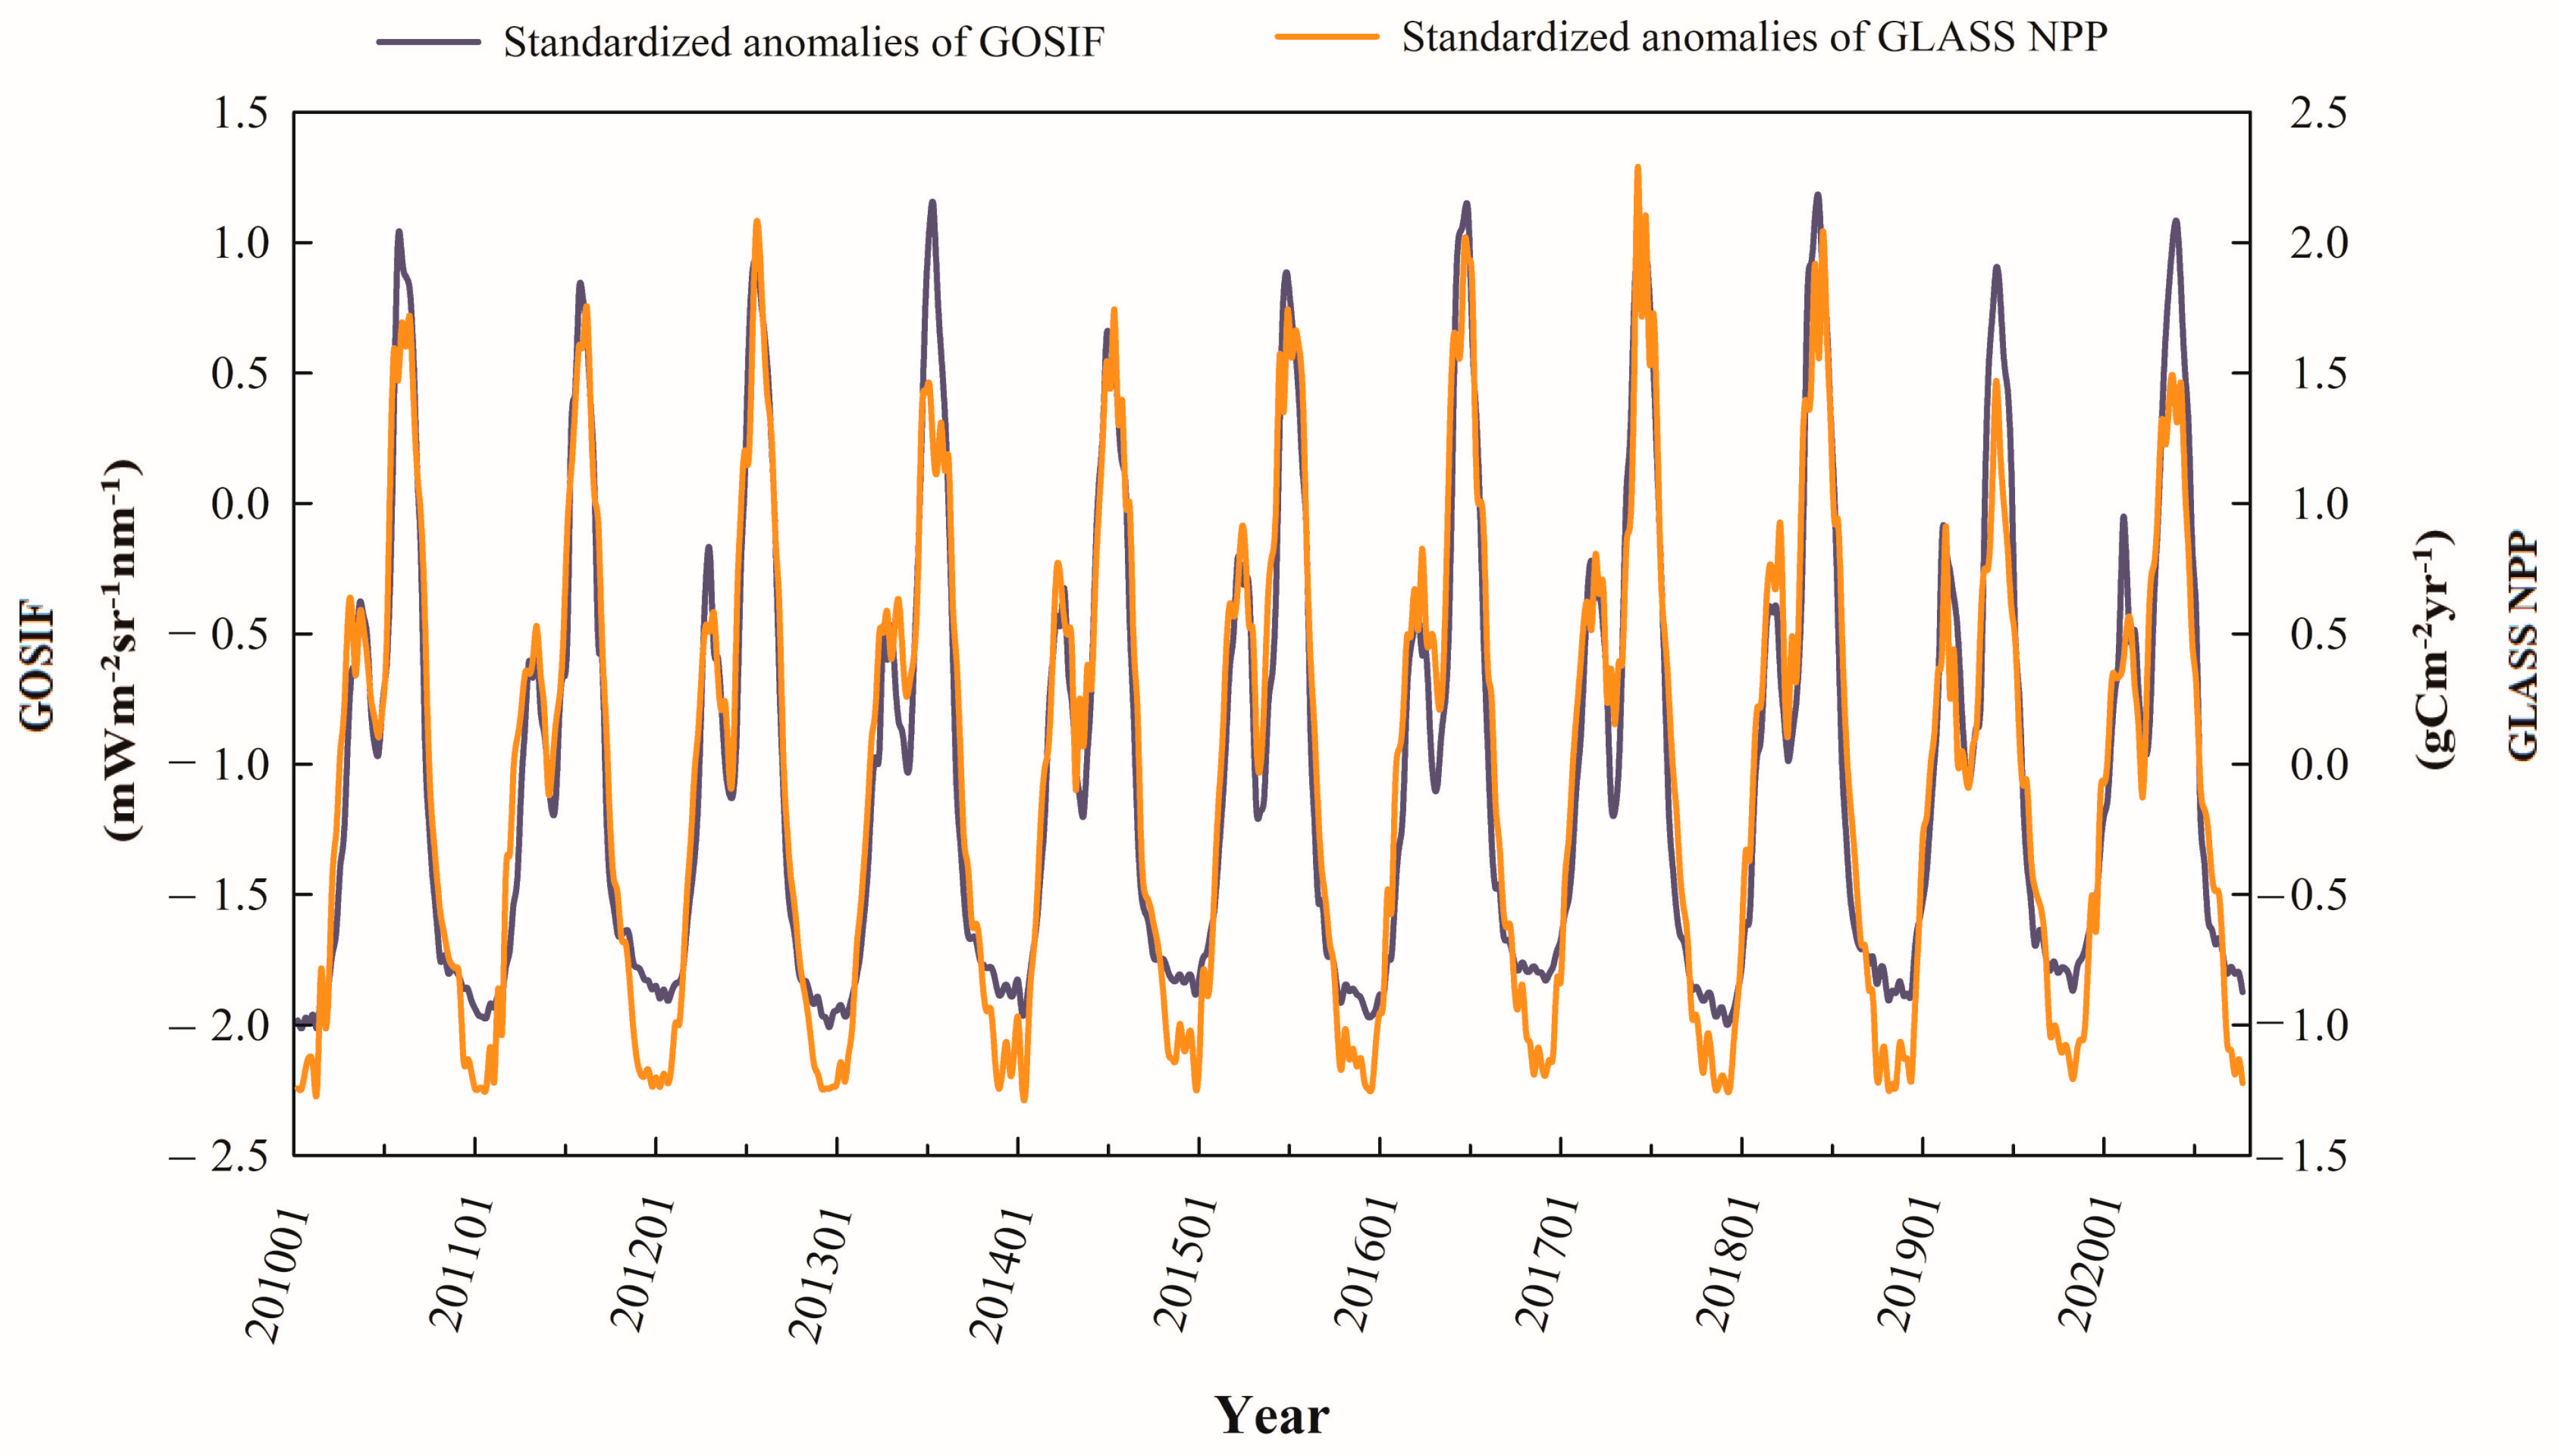
3.1.1. Spatiotemporal Patterns of SIF and NPP

To determine whether SIF has the potential to monitor dynamic changes in NPP, we compared and analyzed SIF and NPP data from several aspects. In our study, GOSIF and GLASS NPP data were used to represent SIF and NPP data, respectively. Compared with their counterparts, GOSIF and GLASS NPP have better quality and accuracy [40,41] and can characterize SIF and NPP scientifically.
First, the distributions of the GOSIF and GLASS NPP values were spatially compared. We calculated the 8-day average, maximum, and minimum values of GOSIF and NPP data from 2010 to 2020 (Figure 3). Comparing the three datasets, the distribution of GOSIF and GLASS NPP data essentially remained unchanged in terms of numerical distribution, with larger data values present in the southern part of the HHH Plain and smaller data values of data being scattered in the northern part of the HHH, showing an overall decreasing trend from south to north.
Second, the correlation between GOSIF and GLASS NPP was analyzed over time. We constructed a time series of GOSIF and GLASS NPP data for the period 2010–2020 and performed a pixel-by-pixel correlation analysis using the Spearman method. The results (Figure 4) show a good correlation between the two datasets over the long time series. The overall correlation coefficient R2 was >0.7, with only a low correlation observed in the small coastal water areas in the east.
Finally, we compared the dynamic changes in the two datasets. We calculated the standardized anomaly values of the GOSIF and GLASS NPP data from 2010 to 2020 to characterize the dynamic changes in the data (Figure 5). The results showed that the dynamic changes in GOSIF and GLASS NPP were highly consistent with similar patterns and cycles.
Based on the above results, we can preliminarily conclude that a linear relationship is present between SIF and NPP. Furthermore, SIF can, to a small extent, monitor dynamic changes in NPP. However, whether SIF can accurately monitor dynamic changes in NPP during drought events requires further evaluation and exploration.

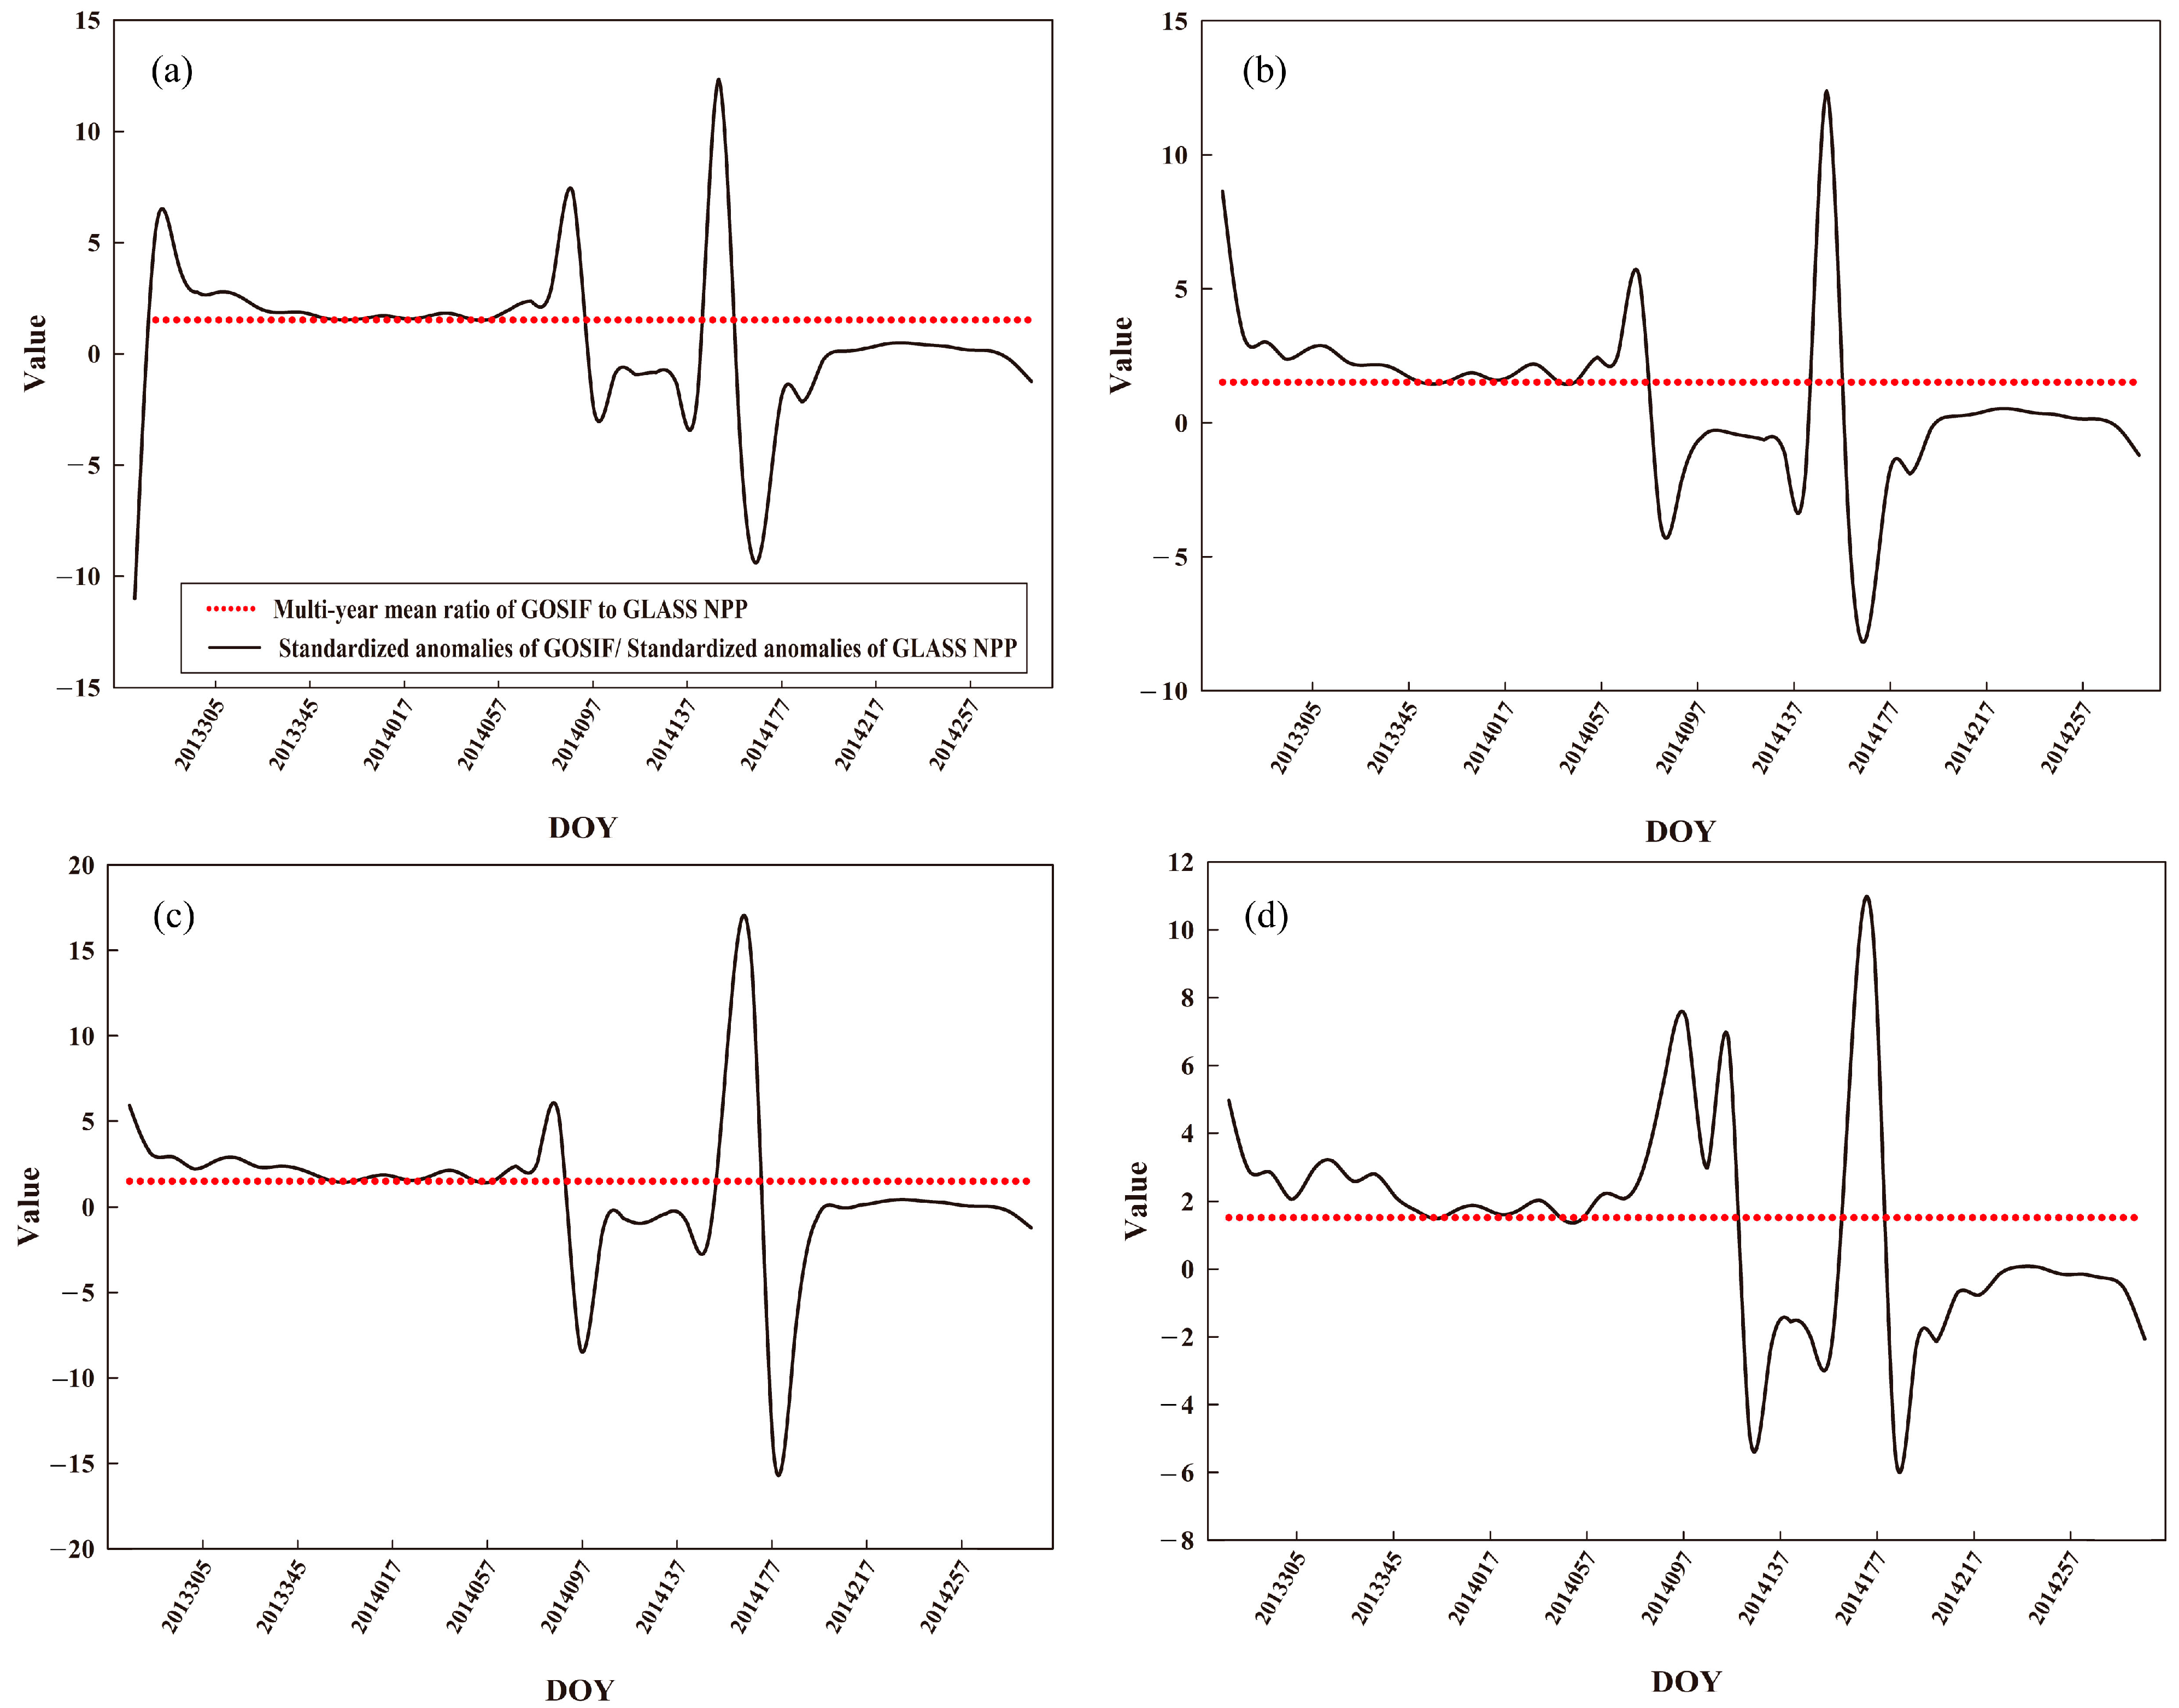
3.1.2. SIF/NPP Ratio Index

In this study, our initial progress was made by demonstrating the presence of a certain relationship between solar-induced fluorescence (SIF) and net primary productivity (NPP). However, an accurate quantitative relationship between the two was elusive. To address this, we developed an index that quantifies the relationship between SIF and NPP. By analyzing the fluctuations of this index, we can explore the potential of SIF monitoring for dynamic changes in NPP [52]. Several studies have provided compelling evidence that the SIF/GPP ratio index offers a scientifically robust approach to assess the relationship between SIF and gross primary productivity (GPP) [53,54,55]. Drawing from this accomplishment, we developed a ratio index between SIF and NPP to quantify their association:
r a t i o i , j = Δ S I F i , j Δ N P P i , j
where r a t i o i , j represents the ratio on day j of year i, Δ S I F i , j represents the image element average of the standard anomaly GOSIF on day j of year i, and Δ N P P i , j represents the image element average of the standard anomaly GLASS NPP on day j of year i.
The process of plant respiration represents an important factor that affects the linear relationship between SIF and NPP [56,57,58]. Nevertheless, our experimental findings, derived from the analysis of long-term spatiotemporal correlations between SIF and NPP, demonstrate a consistent and stable relationship. Consequently, when constructing the SIF/NPP ratio index, we omitted the consideration of plant respiration’s impact.
To evaluate the trend in SIF/NPP changes intuitively, we selected the SIF/NPP multi-year average value that reflected the data trend as the measurement indicator (the average ratio of SIF/NPP from 2010 to 2020 was 1.5189). When the SIF/NPP ratio is greater than the multi-year average ratio, the dynamic change trend in SIF is greater than that of NPP. When the SIF/NPP ratio is less than the multi-year average ratio and greater than 0, the overall trend in SIF change is smaller than that of NPP. When the SIF/NPP ratio is negative, the change trend in SIF is opposite to that of NPP.

3.2. Ability of SIF to Monitor Drought-Induced Changes in NPP Dynamics

In our previous studies, we calculated the monthly integrated standardized drought index (mISDI) for the HHH Plain. The mISDI is a drought index obtained through a cube algorithm that considers various factors, such as the drought index, LST, land cover, topography, and vegetation. Compared with traditional drought indices, the mISDI incorporates the impact of drought on vegetation and anomalies in soil moisture and the thermal environment, providing a new perspective for drought monitoring and studying the stress of drought on vegetation [59]. Based on the mISDI calculation results and run theory, the drought events during 2010–2020 were identified and quantified [60] (Table 1). Run theory is a common method used to identify drought events. In our study, events with an mISDI < −1 and a duration of over one month were considered drought events, and the duration, intensity, and severity of the droughts were calculated [61,62]. Drought events are listed in Table 2 below.
After identifying the drought periods, we conducted a correlation analysis between GOSIF and GLASS NPP for the four drought events. The pixel-wise correlation analysis results (Figure 6) showed that during the drought events from October 2013 to September 2014 and from May 2019 to December 2019, there was a strong correlation between SIF and NPP (overall R2 > 0.8, p < 0.05). However, there was no significant correlation between SIF and NPP during the drought event of May to June 2020. For the drought event spanning October to December 2020, there were evident spatiotemporal heterogeneities in the dynamic changes in SIF and NPP.
The correlation analysis of the dynamic changes between SIF and NPP during the drought events revealed that a higher correlation was observed over longer drought periods. Therefore, we selected two drought events, namely, from October 2013 to September 2014 and from May to December 2019, to investigate the capability of SIF in monitoring the dynamic changes in NPP and explore its potential in monitoring NPP dynamics during prolonged drought periods. We constructed SIF/NPP ratio time series with an 8-day temporal resolution during the drought periods and analyzed the dynamic changes in SIF/NPP ratios to examine the monitoring capacity of SIF for drought-induced NPP dynamics. During this process, a few GLASS NPP values were proximate to zero; in the division calculation, these values would cause abnormally large SIF/NPP results, leading to some interference and complexity in the analysis of the relationship between SIF and NPP. Therefore, we removed some SIF/NPP ratios when the GLASS NPP was <0.1 gCm−2yr−1.

3.2.1. Analysis of the Relationship between SIF and NPP in Different Drought Events Based on SIF/NPP Variations

During the drought events from October 2013 to September 2014 (Figure 7a), the SIF/NPP ratio was positive at the beginning of the drought and gradually decreased with a fluctuating trend. By the end of November 2013, the SIF/NPP ratio had decreased from 5 to approach the ratiomean of 1.5189, and remained proximate to this value from December 2013 to February 2014. During the later stages of drought, the SIF/NPP ratio fluctuated substantially. From March to mid-April 2014, the SIF/NPP ratio changed drastically, forming two intense peaks. At the end of March, the SIF/NPP ratio had a small peak close to 10, which dropped rapidly to approximately −10. In mid-May, the SIF/NPP ratio had another peak of approximately 10, which rapidly decreased to approximately −5. During the later stages of the drought, the SIF/NPP ratio gradually became positive. From mid-June 2014 to the end of the drought, SIF and NPP showed synchronous changes and their relationships were stable.
During the initial stage of the drought event, from May to December 2019 (Figure 7b), the SIF/NPP ratio fluctuated drastically for approximately three months. Near the end of May, the SIF/NPP ratio reached an extremely low value of approximately −16, then rapidly increased to approximately 13, and subsequently decreased to approximately −15. During this period, the relationship between SIF and NPP showed overall instability. From the end of July, the SIF/NPP ratio gradually returned to positive values and approached stability, with a trend close to the multi-year average SIF/NPP. At this point, the relationship between SIF and NPP changed from asynchronous to synchronous and gradually stabilized. Beginning in mid-September, the SIF/NPP ratio fluctuated again, with the ratio first dropping to approximately −5 and then rapidly rising to approximately 15. At this point, the relationship between SIF and NPP was unstable. From mid-October, the SIF/NPP ratio gradually stabilized and approached the multi-year average. During this time, the SIF and NPP trends were synchronous, and the relationship between the two was relatively stable.
In both drought events, the SIF/NPP time series changes exhibited clear seasonality and showed similar characteristics at the same time points. During the late spring, spring–summer, and summer–autumn transitions, the dynamic changes in NPP and SIF were not synchronized, and the SIF/NPP ratio showed large fluctuations. At this time, the dynamic changes in SIF and NPP were often not synchronized, and SIF could not accurately capture the dynamic changes in NPP induced by drought. In early spring, summer, autumn, and winter, the dynamic changes in SIF and NPP were synchronized. The SIF/NPP index in autumn and winter was close to the SIF/NPP multi-year average value. In summer, the dynamic change in NPP was greater than that in SIF, resulting in an SIF/NPP value smaller than the SIF/NPP multi-year average value. Overall, SIF and NPP maintained a stable linear relationship in summer, autumn, and winter; thus, SIF accurately monitored dynamic changes in NPP induced by drought.

3.2.2. Analysis of the Relationship between SIF and NPP under Different Drought Levels Based on SIF/NPP Ratio

In our previous study [60], run theory was mainly used to identify drought events. This method identifies and quantifies drought events from a global perspective. However, during droughts, the degree of drought is spatially heterogeneous owing to various natural and artificial factors. The drought events identified by run theory neglected the different degrees of drought in the local areas of the HHH Plain.
The monthly comprehensive drought index for the HHH Plain reveals that the two prolonged droughts included periods of mild, moderate, severe, and extreme drought conditions (apart from the initial stage of the 2019 drought, which did not exhibit extreme drought conditions). Consequently, we extracted the regions where different drought events occurred within the HHH Plain and calculated the average standard anomaly of GOSIF and GLASS NPP values in these regions. Subsequently, we constructed SIF/NPP time series with an 8-day interval to analyze the variations in SIF/NPP ratios during different drought events. Our aim is to explore the potential of SIF for monitoring dynamic changes in NPP under drought conditions of differing severity. During October 2013 and September 2014, the SIF/NPP ratio significantly changed during a mild drought event (Figure 8a). At the beginning of October, the ratio quickly increased from approximately −10 to approximately 6 before fluctuating and gradually stabilizing. During this period, the SIF/NPP ratio was relatively stable and a synchronous trend in change was present between SIF and NPP. In April 2014, the SIF/NPP ratio exhibited significant fluctuations for approximately 3.5 months, dropping rapidly from approximately 7 to −4. During this time, the relationship between SIF and NPP changed from synchronous to asynchronous, and this state of asynchronous change lasted for approximately one month. In mid-May, the SIF/NPP ratio underwent another substantial fluctuation and the relationship between SIF and NPP briefly changed from asynchronous to synchronous. From mid-July until the end of the drought, the SIF/NPP ratio gradually changed from negative to positive and then stabilized. The relationship between SIF and NPP became synchronous and gradually stabilized. The changes in the SIF/NPP ratio were similar in general and during severe drought events (Figure 8b,c). At the beginning of the drought, the SIF/NPP ratio was generally positive and exhibited fluctuations followed by stability, with a relatively stable relationship between SIF and NPP. From early April 2014 until July, the SIF/NPP ratio fluctuated significantly, similar to that observed during the mild drought event, and the dynamic relationship between SIF and NPP became asynchronous. From mid-July until the end of the drought, the SIF/NPP ratio gradually returned to positive values and stabilized thereafter. The relationship between SIF and NPP gradually became synchronous and the two became increasingly stable. In extremely severe drought events (Figure 8d), the trend in SIF/NPP ratio changes was similar to that observed in the other three types of droughts. However, overall, the SIF/NPP ratio exhibited more significant fluctuations, whereas in the later stages of drought, the SIF/NPP ratio was mostly negative, indicating asynchronous dynamic changes between SIF and NPP. These findings suggest that the relationship between SIF and NPP is unstable during extremely severe drought events and that the ability of SIF to monitor the dynamic changes in NPP induced by drought is weaker than its ability during other levels of drought.
Between May and December 2019, during a mild drought event (Figure 9a), the SIF/NPP ratio was negative from May to mid-July, indicating asynchronous changes between SIF and NPP. In approximately late July, the SIF/NPP ratio transitioned to positive values and gradually stabilized, demonstrating synchronous dynamics between SIF and NPP with a relatively stable relationship. From mid-September to mid-October, the SIF/NPP ratio underwent drastic fluctuation, dropping rapidly to approximately −10 before rising to approximately 17. During this period, the relationship between the SIF and NPP became asynchronous. From mid- to late-October until the end of the drought, the SIF/NPP ratio gradually declined, approaching the multi-year average ratio. At this time, the dynamic changes in SIF and NPP were similar and their relationship gradually stabilized. During a typical drought event (Figure 9b), the SIF/NPP ratio fluctuated significantly from May to mid-June. The ratio rapidly increased from approximately −3 to 11 before dropping rapidly to approximately −7. During this period, the relationship between SIF and NPP changed rapidly. From mid-late June, the SIF/NPP ratio became positive and gradually stabilized, indicating a synchronous trend in the dynamic changes between SIF and NPP, with a relatively stable relationship. From September to early October, the SIF/NPP ratio again showed substantial fluctuation, rapidly increasing from approximately −4 to 14. SIF and NPP showed an asynchronous trend during this period. From mid-October until the end of the drought, the SIF/NPP ratio gradually declined and approached the multi-year average value, and the linear relationship between SIF and NPP gradually stabilized. During a severe drought event (Figure 9c), the SIF/NPP ratio became positive around mid-May, indicating that the dynamic changes between SIF and NPP were gradually synchronized. However, the relationship between the two was not yet constant. In approximately early July, the SIF/NPP ratio gradually became negative, indicating gradual desynchronization in the dynamic changes between SIF and NPP. By mid-July, the SIF/NPP ratio gradually increased above zero and remained stable. Around mid-September, the SIF/NPP ratio began to become negative and remained unchanged for approximately half a month before turning positive again. This trend indicates a brief asynchrony in the dynamic changes between SIF and NPP. During an extremely severe drought event (Figure 9d), the trend in SIF/NPP change was similar to that of a severe drought event from June to December, and the relationship between SIF and NPP showed similar characteristics.
Four drought severity levels for the two drought events were compared. During the drought event from October 2013 to September 2014, the overall trend in the SIF/NPP ratio change was similar. The relationship between SIF and NPP was more stable in early spring, summer, autumn, and winter, whereas it was unstable during the spring–summer and summer–autumn transition periods, which was consistent with our overall drought event research results. In addition, the ability of SIF to monitor the dynamic changes in NPP induced by severe drought events was weaker than that of other drought severity levels. During the drought event from May to December 2019, significant differences were present in the SIF/NPP ratio among different drought severity levels from May to June, which was the spring–summer transition period, and the relationship between SIF and NPP was unstable. This result is consistent with that of our previous analysis. From July to the end of the drought, the trend in the SIF/NPP ratio changes was the same for different drought severity levels.

3.2.3. Ability of SIF to Monitor Dynamic Changes in NPP over Different Time Scales

The SIF/NPP ratio exhibited dynamic changes in different drought events and severity levels, and the change trend showed seasonality, similar to the results of SIF/GPP studies [54,63]. To further investigate the capability of SIF to monitor NPP dynamic changes at different drought timescales, we analyzed the correlation between SIF and NPP at 8-day intervals during two drought events that lasted for 8, 16, 24, and 32 days until the end of the drought. The correlation analysis experiment on the 8-day interval during the two drought events showed a similar relationship between SIF and NPP. The correlation between SIF and NPP did not change substantially between adjacent 8-day intervals. Therefore, we displayed the correlation analysis results using a 40-day interval (Figure 10 and Figure 11). At the beginning of the drought event, the monitoring capability of the SIF for NPP exhibited significant regional heterogeneity. As the duration of the drought event increased, the correlation between the SIF and NPP gradually strengthened. This correlation change indicates that SIF can effectively monitor long-term droughts. This conclusion is consistent with the findings of vegetation productivity research that plants grown in regions with favorable water and thermal conditions are extremely sensitive to long-term drought [64]. Therefore, when using SIF to monitor dynamic NPP changes during drought events, the timescale of the drought should be considered.

3.3. Response of SIF to the Primary Environmental Factors Affecting NPP

Through the discussion of overall drought events and drought events of varying severity in the HHH Plain, we can preliminarily determine that SIF has a certain potential for monitoring the dynamic changes in NPP induced by drought. In real-world environments, dynamic changes in NPP are influenced by various factors. To more accurately assess the ability of SIF to monitor drought-induced NPP dynamics, we considered both meteorological factors and vegetation physiological canopy factors. We selected five factors that influence or reflect dynamic changes in NPP and herein discuss the sensitivity of SIF to these factors. This further enabled us to evaluate the potential of SIF in monitoring the dynamic changes in NPP induced by drought.
We calculated the standard anomalies of various factors during the drought period at 8-day intervals as the dynamic change values of environmental factors. The obtained values then underwent analysis (Table 3 and Table 4). Subsequently, we constructed long-term time series of environmental factors during the drought period and performed pixel-wise correlation analysis with the standard anomaly GOSIF time series. The results (Figure 12) showed that, across different drought events, SIF exhibited consistent response levels to the same indicator while showing variations in response to other factors.
Among the five indices, SIF exhibited the strongest response to LAI, with R2 greater than 0.8 for both drought events in the HHH Plain; the response to NDVI was weaker than that to LAI but overall superior to the other three factors.
SIF exhibited similar spatial heterogeneity patterns in response to the FAPAR and LST. During the drought event from October 2013 to September 2014, SIF showed higher responsiveness to both indices in the central and northern regions of the HHH Plain, with R2 greater than 0.6 in most areas. The southern part of the HHH Plain exhibited comparatively low response levels. During the drought event from May to December 2019, SIF demonstrated higher responsiveness to FAPAR in the northern and eastern parts of the HHH Plain than in other regions. SIF showed a higher response to LST in the northern region (correlation coefficients mostly > 0.4) and lower values in the southern region. SIF showed a poor response to precipitation. In both drought events, SIF exhibited relatively high responsiveness to precipitation in only a few areas of the northern and central regions of the HHH Plain, while overall correlation coefficients in other regions remained low. Therefore, we conducted a time lag analysis between SIF and these three factors. Considering that the weaker correlations were primarily observed in the southern region of the HHH Plain in the pixel-wise analysis, we referred to the results of time lag analysis with the strongest correlation coefficients in the southern region as a reference to determine the lag periods between SIF and different parameters at the local level.
We conducted a time lag analysis of SIF versus FAPAR, LST, and PRE at an 8-day interval. The experimental results revealed different lag periods and time lags between SIF, FAPAR, and LST, whereas the time lag with precipitation was non-significant in both drought events. During the drought event from October 2013 to September 2014, SIF exhibited a lag of approximately 64 days with both FAPAR (Figure 13, Table 5) and LST (Figure 14, Table 6) in the southern region of the HHH Plain. In the drought event from May to December 2019, SIF values in the southern region exhibited a lag period of approximately 96 days with FAPAR (Figure 15, Table 7) and approximately 40 days with LST (Figure 16, Table 8).

4. Discussion

4.1. Potential for SIF to Monitor Changes in NPP Dynamics under Drought Events

Drought events are an important factor causing losses in vegetation NPP. Many studies have investigated the impact of drought on NPP, showing that drought can cause severe losses in NPP [65]. However, real-time monitoring of drought-induced dynamic changes in NPP is difficult, as large-scale NPP data cannot be obtained in real time. The rapid development of chlorophyll fluorescence remote sensing has provided a new perspective for monitoring drought-induced changes in vegetation productivity.
As a fluorescence signal indicating vegetation photosynthesis, SIF responds promptly to physiological changes induced by drought [66]. Our study conducted at an 8-day time scale demonstrates the significant potential of SIF for monitoring dynamic changes in NPP during drought events. During drought events in early spring, summer, autumn, and winter, the dynamic changes in SIF and NPP were not equal. In spring and winter, the dynamic changes in SIF were greater than those in NPP, whereas in summer the dynamic changes in NPP were synchronous. SIF can accurately reflect the dynamic changes in NPP induced by drought. However, during the spring–summer and summer–autumn transitions, when the physiological state of vegetation changes rapidly, the changes in SIF and NPP were not synchronous, and SIF could not accurately reflect the dynamic changes in NPP induced by drought. In addition, we explored the ability of SIF to monitor the dynamic changes in NPP induced by drought at different time scales. The results showed that as the duration of drought increases, the ability of SIF to monitor the dynamic changes in NPP becomes stronger. The ability of SIF to monitor the dynamic changes in NPP in long-term drought events was better than that in short-term drought events, which is consistent with the results of previous studies on the response of SIF at different drought timescales [67,68]. Moreover, SIF exhibits a good response to environmental variables influencing NPP changes. Previous studies have demonstrated the influence of meteorological factors and vegetation canopy structure on the dynamic changes in NPP [69,70] In our study, SIF showed a good overall response to the PAR absorption ratio and LST, with some regions showing a temporal lag. This spatiotemporal heterogeneity in response is similar to the spatiotemporal heterogeneity of NPP and climate factors [71]. However, SIF showed a poor response to PRE, which may have been due to a time lag in the response of vegetation photosynthesis to PRE [72,73,74]. In addition, SIF responded well to the vegetation canopy structure and greenness. Overall, SIF can accurately capture the changes in environmental variables that cause NPP changes, further verifying its ability to monitor dynamic changes in NPP induced by drought events [75].
Our study comprehensively analyzed the relationship between SIF and NPP during two long-term drought events in the HHH Plain at various aspects and scales, discussing and demonstrating the potential of SIF for monitoring dynamic changes in NPP induced by drought. When large-scale NPP data cannot be updated promptly, or real-time monitoring of drought-induced NPP dynamics is required, SIF can be used to monitor NPP dynamics. This provides a new perspective for real-time monitoring of drought-induced NPP dynamics and offers fresh insights into the relationship between SIF and NPP.

4.2. Methods for Monitoring Changes in NPP Dynamics during Drought Events

Currently, most research on NPP focuses on monitoring annual and monthly changes, and NPP variations at smaller timescales have not been considered. The impact of drought on vegetation is rapid and persistent. Monthly and annual studies cannot reflect the process changes in vegetation during drought events, resulting in an insufficient understanding of the relationship between drought and vegetation productivity. Our research improves time precision by analyzing the ability of SIF to monitor NPP dynamics during drought events on an 8-day time scale to better reveal the impact of drought on NPP and analyze the ability of SIF to monitor NPP dynamics during drought events.
In current research on the correlation between drought and NPP, several methods have been proposed to discuss the impact of drought on NPP. Lei et al. proposed a method to quantitatively evaluate the effects of different drought levels on grassland productivity using the Biome-BGC process model [57]. Liu et al. used Sen’s trend analysis to examine the changes in vegetation NPP, climate factors, and drought over time series. Based on the Mann–Kendall test for the significance of Sen’s trend, the authors also analyzed the response of vegetation NPP to climate factors and drought in different seasons, as well as their lag relationships. Vegetation dynamics in Central Asia were analyzed from 1982 to 2020 and the response of vegetation to climate factors and drought with a time lag was evaluated. Zhang et al. used the Lund–Potsdam–Jena model and NDVI to simulate the spatial distribution pattern and temporal trend in forest NPP in the Yangtze River Basin from 1982 to 2013 and discussed the impact of climate change and human activities on NPP through simple linear regression [55]. Additionally, the spatial efficiency metric (SPAEF) model can also be used to analyze the dynamic changes in NPP during drought events [70]. Our study proposes the use of the SIF/NPP ratio index to monitor the dynamic changes in NPP during drought events. This index is derived from previous research on the linear relationship between SIF and GPP, as well as the ratio between GPP and NPP [42]. In the absence of a clear linear relationship between SIF and NPP, the SIF/NPP ratio can quantify the linear relationship between SIF and NPP, and the dynamic changes in this relationship are intuitively reflected through the variations in the SIF/NPP ratio. In our study, the temporal series of SIF/NPP exhibited pronounced seasonality, consistent with current research on the relationship between SIF and vegetation productivity [49]. The SIF/NPP ratio showed significant fluctuations during spring and summer, which could be attributed to the influence of climatic factors such as precipitation and temperature during the growing season on the linear relationship between SIF and NPP. Additionally, variations in vegetation canopy structure, chlorophyll content, and different vegetation types can also impact the response to climate factors [43,44,67]. Therefore, when conducting research on the correlation between SIF and NPP, seasonal changes should be thoroughly considered.

4.3. Limitations and Shortcomings

This study has certain limitations and uncertainties. Firstly, in terms of data, the spatial resolution of the currently used GOSIF, GLASS NPP, and other environmental variable data is relatively coarse at 0.05°, which may affect the accuracy of the analysis.
Secondly, regarding the research methodology, although the SIF and NPP data in our experiments exhibit good spatiotemporal consistency, and the relationship between SIF and NPP can be inferred based on the correlation theories between GPP and NPP, as well as between SIF and GPP, it should be noted that the amount of carbon consumed by plant respiration is not a constant value in practice. It varies across different vegetation types and is influenced by environmental factors. Our research findings only discuss the potential of using SIF to monitor the dynamic changes in NPP induced by drought at a theoretical level. We validated our conclusions using satellite measurement data and model inversion data, without incorporating flux tower data or field experimental data. Therefore, the results and conclusions of this study have certain limitations.
In addition, regarding the analysis, we assessed the ability of SIF to monitor dynamic changes in NPP by using the average SIF/NPP ratio for the entire HHH Plain, which to some extent overlooks local variations in the ratio. Furthermore, we only conducted simple correlation analyses between SIF and NPP, as well as between SIF and five environmental factors, without considering the impact of factors such as topography, elevation, and canopy conditions on land vegetation NPP. Moreover, the experimental results mainly apply to the HHH Plain, and the generalizability to other regions remains unexplored.
In future research, we plan to integrate ground-based measurements to further investigate the impact of environmental factors and other variables on the relationship between SIF and NPP. This will enable us to uncover the complex nature of the linear or non-linear relationship between these two variables.

5. Conclusions

This study examined the potential for using SIF to monitor dynamic changes in NPP induced by drought, focusing on two long-term drought events in the HHH Plain from 2010 to 2020. Advanced GOSIF and GLASS NPP data were used to construct a SIF/NPP ratio index, quantifying the relationship between SIF and NPP. This relationship was examined across different time periods, severity levels, and temporal scales. We also examined the sensitivity of SIF to five environmental factors that influence dynamic changes in NPP. The analysis yielded the following conclusions.
Firstly, SIF can serve as an indicator for monitoring dynamic changes in NPP induced by drought. In long-term time series analysis during drought periods, SIF exhibits a high spatiotemporal correlation with NPP (R2 > 0.8, p < 0.01 between GOSIF and GLASS NPP). Across different drought events and varying levels of drought severity, SIF accurately captures the dynamic changes in NPP induced by drought.
Secondly, the SIF/NPP ratio index can reflect seasonal variations and accurately quantify dynamic changes in SIF and NPP during drought periods. Across different drought events and levels of severity, the SIF/NPP ratio remains relatively stable during the mid to late stages of summer, autumn, and winter drought events (with SIF/NPP close to the mean ratio of 1.5189). However, it shows significant fluctuations during the early stages of spring and early summer droughts, and during the transitions between spring–summer and summer–autumn (with larger deviations from the mean ratio of 1.5189).
Thirdly, SIF exhibits higher sensitivity to vegetation greenness indices affecting NPP changes (with R2 > 0.8, p < 0.01 for SIF and NDVI, and R2 > 0.8, p < 0.01 for SIF and LAI). SIF is also sensitive to the ratio of absorbed photosynthetically active radiation and surface temperature (with R2 > 0.5, p < 0.01 for SIF and FAPAR, and R2 > 0.6, p < 0.01 for SIF and LST), showing localized temporal lag in the southern part of the HHH Plain. However, SIF is less sensitive to precipitation.
In conclusion, SIF demonstrates promising potential for monitoring dynamic changes in NPP during drought events. In future studies, we aim to further investigate the relationship between SIF and NPP by incorporating ground flux observations and other data sources, explore the impact of different canopy conditions, topography, and spatial heterogeneity on SIF/NPP relationship, and integrate machine learning and other advanced methods to enhance understanding of the relationship between SIF and NPP.

Author Contributions

Conceptualization, Y.W. and J.L.; methodology, J.L. and Y.W.; formal analysis, Y.W., J.H., T.S., Y.T. and Y.G.; writing—original draft preparation, J.L. and Y.W.; writing—review and editing, J.L., Y.W. and J.H.; visualization, Y.W., T.S. and J.H.; project administration, J.L.; and funding acquisition, J.L. All authors have read and agreed to the published version of the manuscript.

Funding

This research was financially supported by The Natural Science Foundation of Anhui Province (No. 2108085MD129) and the Anhui New Era Education Quality Engineering Project (Graduate Education) (No. 2022zyxwjxalk039). The paper was also supported by Major Scientific Research Projects in Higher Education Institutions in Anhui Province (Grant No. 2022AH040338) and the National Natural Science Foundation of China (No. 41571400).

Data Availability Statement

The data used to support the findings of this study are available from the corresponding author upon request via email.

Conflicts of Interest

The authors declare that they have no conflict of interest.

References

  1. Hicks Pries, C.E.; Castanha, C.; Porras, R.C.; Torn, M.S. The whole-soil carbon flux in response to warming. Science 2017, 355, 1420–1423. [Google Scholar] [CrossRef] [Green Version]
  2. Ciais, P.; Reichstein, M.; Viovy, N.; Granier, A.; Ogee, J.; Allard, V.; Aubinet, M.; Buchmann, N.; Bernhofer, C.; Carrara, A.; et al. Europe-wide reduction in primary productivity caused by the heat and drought in 2003. Nature 2005, 437, 529–533. [Google Scholar] [CrossRef]
  3. Zhao, M.; Running, S.W. Drought-induced reduction in global terrestrial net primary production from 2000 through 2009. Science 2010, 329, 940–943. [Google Scholar] [CrossRef] [Green Version]
  4. Wan, W.; Liu, Z.; Li, J.; Xu, J.; Wu, H.; Xu, Z. Spatiotemporal patterns of maize drought stress and their effects on biomass in the Northeast and North China Plain from 2000 to 2019. Agric. For. Meteorol. 2022, 315, 108821. [Google Scholar] [CrossRef]
  5. Duan, W.; Maskey, S.; Chaffe, P.L.B.; Luo, P.; He, B.; Wu, Y.; Hou, J. Recent Advancement in Remote Sensing Technology for Hydrology Analysis and Water Resources Management. Remote Sens. 2021, 13, 1097. [Google Scholar] [CrossRef]
  6. Duan, W.; Zou, S.; Christidis, N.; Schaller, N.; Chen, Y.; Sahu, N.; Li, Z.; Fang, G.; Zhou, B. Changes in temporal inequality of precipitation extremes over China due to anthropogenic forcings. NPJ Clim. Atmos. Sci. 2022, 5, 33. [Google Scholar] [CrossRef]
  7. Wang, C.; Jiang, Q.o.; Deng, X.; Lv, K.; Zhang, Z. Spatio-Temporal Evolution, Future Trend and Phenology Regularity of Net Primary Productivity of Forests in Northeast China. Remote Sens. 2020, 12, 3670. [Google Scholar] [CrossRef]
  8. Liu, F.H.; Xu, C.Y.; Yang, X.X.; Ye, X.C. Controls of Climate and Land-Use Change on Terrestrial Net Primary Productivity Variation in a Subtropical Humid Basin. Remote Sens. 2020, 12, 3525. [Google Scholar] [CrossRef]
  9. Yuan, Z.; Wang, Y.; Xu, J.; Wu, Z. Effects of climatic factors on the net primary productivity in the source region of Yangtze River, China. Sci. Rep. 2021, 11, 1376. [Google Scholar] [CrossRef] [PubMed]
  10. Liu, Q.; Zhao, L.; Sun, R.; Yu, T.; Cheng, S.; Wang, M.; Zhu, A.; Li, Q. Estimation and Spatiotemporal Variation Analysis of Net Primary Productivity in the Upper Luanhe River Basin in China From 2001 to 2017 Combining with a Downscaling Method. IEEE J. Sel. Top. Appl. Earth Obs. Remote Sens. 2022, 15, 353–363. [Google Scholar] [CrossRef]
  11. Zhao, M.; Heinsch, F.A.; Nemani, R.R.; Running, S.W. Improvements of the MODIS terrestrial gross and net primary production global data set. Remote Sens. Environ. 2005, 95, 164–176. [Google Scholar] [CrossRef]
  12. Xu, C.; Li, Y.; Hu, J.; Yang, X.; Sheng, S.; Liu, M. Evaluating the difference between the normalized difference vegetation index and net primary productivity as the indicators of vegetation vigor assessment at landscape scale. Environ. Monit. Assess. 2012, 184, 1275–1286. [Google Scholar] [CrossRef] [PubMed]
  13. Sitch, S.; Huntingford, C.; Gedney, N.; Levy, P.E.; Lomas, M.; Piao, S.L.; Betts, R.; Ciais, P.; Cox, P.; Friedlingstein, P.; et al. Evaluation of the terrestrial carbon cycle, future plant geography and climate-carbon cycle feedbacks using five Dynamic Global Vegetation Models (DGVMs). Glob. Chang. Biol. 2008, 14, 2015–2039. [Google Scholar] [CrossRef]
  14. Zhang, X.; Zhang, Z.; Zhang, Y.; Zhang, Q.; Liu, X.; Chen, J.; Wu, Y.; Wu, L. Influences of fractional vegetation cover on the spatial variability of canopy SIF from unmanned aerial vehicle observations. Int. J. Appl. Earth Obs. Geoinf. 2022, 107, 102712. [Google Scholar] [CrossRef]
  15. Geng, G.; Yang, R.; Liu, L. Downscaled solar-induced chlorophyll fluorescence has great potential for monitoring the response of vegetation to drought in the Yellow River Basin, China: Insights from an extreme event. Ecol. Indic. 2022, 138, 108801. [Google Scholar] [CrossRef]
  16. Sun, Y.; Fu, R.; Dickinson, R.; Joiner, J.; Frankenberg, C.; Gu, L.; Xia, Y.; Fernando, N. Drought onset mechanisms revealed by satellite solar-induced chlorophyll fluorescence: Insights from two contrasting extreme events. J. Geophys. Res. Biogeosci. 2015, 120, 2427–2440. [Google Scholar] [CrossRef] [Green Version]
  17. Liu, L.; Yang, X.; Zhou, H.; Liu, S.; Zhou, L.; Li, X.; Yang, J.; Han, X.; Wu, J. Evaluating the utility of solar-induced chlorophyll fluorescence for drought monitoring by comparison with NDVI derived from wheat canopy. Sci. Total Environ. 2018, 625, 1208–1217. [Google Scholar] [CrossRef]
  18. Zhang, J.; Xiao, J.; Tong, X.; Zhang, J.; Meng, P.; Li, J.; Liu, P.; Yu, P. NIRv and SIF better estimate phenology than NDVI and EVI: Effects of spring and autumn phenology on ecosystem production of planted forests. Agric. For. Meteorol. 2022, 315, 108819. [Google Scholar] [CrossRef]
  19. Song, L.; Guanter, L.; Guan, K.; You, L.; Huete, A.; Ju, W.; Zhang, Y. Satellite sun-induced chlorophyll fluorescence detects early response of winter wheat to heat stress in the Indian Indo-Gangetic Plains. Glob. Chang. Biol. 2018, 24, 4023–4037. [Google Scholar] [CrossRef] [Green Version]
  20. Liu, Y.; You, C.; Zhang, Y.; Chen, S.; Zhang, Z.; Li, J.; Wu, Y. Resistance and resilience of grasslands to drought detected by SIF in inner Mongolia, China. Agric. For. Meteorol. 2021, 308–309, 108567. [Google Scholar] [CrossRef]
  21. Wu, L.; Wang, L.; Shi, C.; Yin, D. Detecting mangrove photosynthesis with solar-induced chlorophyll fluorescence. Int. J. Remote Sens. 2022, 43, 1037–1053. [Google Scholar] [CrossRef]
  22. Chen, S.; Huang, Y.; Wang, G. Detecting drought-induced GPP spatiotemporal variabilities with sun-induced chlorophyll fluorescence during the 2009/2010 droughts in China. Ecol. Indic. 2021, 121, 107092. [Google Scholar] [CrossRef]
  23. Liu, Y.; Dang, C.; Yue, H.; Lyu, C.; Dang, X. Enhanced drought detection and monitoring using sun-induced chlorophyll fluorescence over Hulun Buir Grassland, China. Sci. Total Environ. 2021, 770, 145271. [Google Scholar] [CrossRef]
  24. Wang, X.; Pan, S.; Pan, N.; Pan, P. Grassland productivity response to droughts in northern China monitored by satellite-based solar-induced chlorophyll fluorescence. Sci. Total Environ. 2022, 830, 154550. [Google Scholar] [CrossRef]
  25. Duveiller, G.; Filipponi, F.; Walther, S.; Köhler, P.; Frankenberg, C.; Guanter, L.; Cescatti, A. A spatially downscaled sun-induced fluorescence global product for enhanced monitoring of vegetation productivity. Earth Syst. Sci. Data 2020, 12, 1101–1116. [Google Scholar] [CrossRef]
  26. Pickering, M.; Cescatti, A.; Duveiller, G. Sun-induced fluorescence as a proxy for primary productivity across vegetation types and climates. Biogeosciences 2022, 19, 4833–4864. [Google Scholar] [CrossRef]
  27. Shekhar, A.; Buchmann, N.; Gharun, M. How well do recently reconstructed solar-induced fluorescence datasets model gross primary productivity? Remote Sens. Environ. 2022, 283, 113282. [Google Scholar] [CrossRef]
  28. Chen, S.; Huang, Y.; Gao, S.; Wang, G. Impact of physiological and phenological change on carbon uptake on the Tibetan Plateau revealed through GPP estimation based on spaceborne solar-induced fluorescence. Sci. Total Environ. 2019, 663, 45–59. [Google Scholar] [CrossRef] [PubMed]
  29. Chen, Y.; Feng, X.; Tian, H.; Wu, X.; Gao, Z.; Feng, Y.; Piao, S.; Lv, N.; Pan, N.; Fu, B. Accelerated increase in vegetation carbon sequestration in China after 2010: A turning point resulting from climate and human interaction. Glob. Chang. Biol. 2021, 27, 5848–5864. [Google Scholar] [CrossRef] [PubMed]
  30. Piao, S.; Sitch, S.; Ciais, P.; Friedlingstein, P.; Peylin, P.; Wang, X.; Ahlstrom, A.; Anav, A.; Canadell, J.G.; Cong, N.; et al. Evaluation of terrestrial carbon cycle models for their response to climate variability and to CO2 trends. Glob. Chang. Biol. 2013, 19, 2117–2132. [Google Scholar] [CrossRef] [Green Version]
  31. Guan, K.; Berry, J.A.; Zhang, Y.; Joiner, J.; Guanter, L.; Badgley, G.; Lobell, D.B. Improving the monitoring of crop productivity using spaceborne solar-induced fluorescence. Glob. Chang. Biol. 2016, 22, 716–726. [Google Scholar] [CrossRef] [PubMed]
  32. Magney, T.S.; Barnes, M.L.; Yang, X. On the Covariation of Chlorophyll Fluorescence and Photosynthesis Across Scales. Geophys. Res. Lett. 2020, 47, e2020GL091098. [Google Scholar] [CrossRef]
  33. Wu, L.; Zhang, X.; Rossini, M.; Wu, Y.; Zhang, Z.; Zhang, Y. Physiological dynamics dominate the response of canopy far-red solar-induced fluorescence to herbicide treatment. Agric. For. Meteorol. 2022, 323, 109063. [Google Scholar] [CrossRef]
  34. Chen, A.; Mao, J.; Ricciuto, D.; Xiao, J.; Frankenberg, C.; Li, X.; Thornton, P.E.; Gu, L.; Knapp, A.K. Moisture availability mediates the relationship between terrestrial gross primary production and solar-induced chlorophyll fluorescence: Insights from global-scale variations. Glob. Chang. Biol. 2021, 27, 1144–1156. [Google Scholar] [CrossRef] [PubMed]
  35. Wu, Y.; Zhang, Z.; Zhang, X.; Wu, L.; Zhang, Y. How Do Sky Conditions Affect the Relationships between Ground-Based Solar-Induced Chlorophyll Fluorescence and Gross Primary Productivity across Different Plant Types? J. Geophys. Res. Biogeosci. 2022, 127, e2022JG006865. [Google Scholar] [CrossRef]
  36. Nemani, R.R.; Keeling, C.D.; Hashimoto, H.; Jolly, W.M.; Piper, S.C.; Tucker, C.J.; Myneni, R.B.; Running, S.W. Climate-driven increases in global terrestrial net primary production from 1982 to 1999. Science 2003, 300, 1560–1563. [Google Scholar] [CrossRef] [PubMed] [Green Version]
  37. Liu, Y.; Long, H.; Li, T.; Tu, S. Land use transitions and their effects on water environment in Huang-Huai-Hai Plain, China. Land Use Policy 2015, 47, 293–301. [Google Scholar] [CrossRef]
  38. Kong, X.; Zhang, X.; Lal, R.; Zhang, F.; Chen, X.; Niu, Z.; Han, L.; Song, W. Groundwater Depletion by Agricultural Intensification in China’s HHH Plains, Since 1980s. Adv. Agron. 2016, 135, 59–106. [Google Scholar]
  39. Shi, W.; Wang, M.; Liu, Y. Crop yield and production responses to climate disasters in China. Sci. Total Environ. 2021, 750, 141147. [Google Scholar] [CrossRef]
  40. Li, X.; Xiao, J. A Global, 0.05-Degree Product of Solar-Induced Chlorophyll Fluorescence Derived from OCO-2, MODIS, and Reanalysis Data. Remote Sens. 2019, 11, 517. [Google Scholar] [CrossRef] [Green Version]
  41. Liang, S.; Bai, R.; Chen, X.; Cheng, J.; Fan, W.; He, T.; Jia, K.; Jiang, B.; Jiang, L.; Jiao, Z.; et al. Review of China’s land surface quantitative remote sensing development in 2019. J. Remote Sens. 2019, 24, 618–671. (In Chinese) [Google Scholar] [CrossRef]
  42. Xiao, Z.; Liang, S.; Wang, J.; Xiang, Y.; Zhao, X.; Song, J. Long-Time-Series Global Land Surface Satellite Leaf Area Index Product Derived From MODIS and AVHRR Surface Reflectance. IEEE Trans. Geosci. Remote Sens. 2016, 54, 5301–5318. [Google Scholar] [CrossRef]
  43. Xiao, Z.; Liang, S.; Sun, R. Evaluation of Three Long Time Series for Global Fraction of Absorbed Photosynthetically Active Radiation (FAPAR) Products. IEEE Trans. Geosci. Remote Sens. 2018, 56, 5509–5524. [Google Scholar] [CrossRef]
  44. Xiao, Z.; Liang, S.; Jiang, B. Evaluation of four long time-series global leaf area index products. Agric. For. Meteorol. 2017, 246, 218–230. [Google Scholar] [CrossRef]
  45. Xiao, Z.; Liang, S.; Wang, T.; Liu, Q. Reconstruction of Satellite-Retrieved Land-Surface Reflectance Based on Temporally-Continuous Vegetation Indices. Remote Sens. 2015, 7, 9844–9864. [Google Scholar] [CrossRef] [Green Version]
  46. Funk, C.; Peterson, P.; Landsfeld, M.; Pedreros, D.; Verdin, J.; Shukla, S.; Husak, G.; Rowland, J.; Harrison, L.; Hoell, A.; et al. The climate hazards infrared precipitation with stations—A new environmental record for monitoring extremes. Sci. Data 2015, 2, 150066. [Google Scholar] [CrossRef] [Green Version]
  47. Piao, S.; Friedlingstein, P.; Ciais, P.; Viovy, N.; Demarty, J. Growing season extension and its impact on terrestrial carbon cycle in the Northern Hemisphere over the past 2 decades. Glob. Biogeochem. Cycles 2007, 21, GB3018. [Google Scholar] [CrossRef]
  48. Goulden, M.L.; McMillan, A.M.S.; Winston, G.C.; Rocha, A.V.; Manies, K.L.; Harden, J.W.; Bond-Lamberty, B.P. Patterns of NPP, GPP, respiration, and NEP during boreal forest succession. Glob. Chang. Biol. 2011, 17, 855–871. [Google Scholar] [CrossRef] [Green Version]
  49. Guanter, L.; Zhang, Y.; Jung, M.; Joiner, J.; Voigt, M.; Berry, J.A.; Frankenberg, C.; Huete, A.R.; Zarco-Tejada, P.; Lee, J.E.; et al. Global and time-resolved monitoring of crop photosynthesis with chlorophyll fluorescence. Proc. Natl. Acad. Sci. USA 2014, 111, E1327–E1333. [Google Scholar] [CrossRef] [Green Version]
  50. Porcar-Castell, A.; Tyystjarvi, E.; Atherton, J.; van der Tol, C.; Flexas, J.; Pfundel, E.E.; Moreno, J.; Frankenberg, C.; Berry, J.A. Linking chlorophyll a fluorescence to photosynthesis for remote sensing applications: Mechanisms and challenges. J. Exp. Bot. 2014, 65, 4065–4095. [Google Scholar] [CrossRef] [Green Version]
  51. Sun, Y.; Frankenberg, C.; Wood, J.D.; Schimel, D.S.; Jung, M.; Guanter, L.; Drewry, D.T.; Verma, M.; Porcar-Castell, A.; Griffis, T.J.; et al. OCO-2 advances photosynthesis observation from space via solar-induced chlorophyll fluorescence. Science 2017, 358, eaam5747. [Google Scholar] [CrossRef] [PubMed] [Green Version]
  52. Gu, L.; Han, J.; Wood, J.D.; Chang, C.Y.; Sun, Y. Sun-induced Chl fluorescence and its importance for biophysical modeling of photosynthesis based on light reactions. New Phytol. 2019, 223, 1179–1191. [Google Scholar] [CrossRef] [PubMed] [Green Version]
  53. Wu, G.; Guan, K.; Jiang, C.; Kimm, H.; Miao, G.; Bernacchi, C.J.; Moore, C.E.; Ainsworth, E.A.; Yang, X.; Berry, J.A.; et al. Attributing differences of solar-induced chlorophyll fluorescence (SIF)-gross primary production (GPP) relationships between two C4 crops: Corn and miscanthus. Agric. For. Meteorol. 2022, 323, 109046. [Google Scholar] [CrossRef]
  54. Chen, R.; Liu, L.; Liu, X. Leaf chlorophyll contents dominates the seasonal dynamics of SIF/GPP ratio: Evidence from continuous measurements in a maize field. Agric. For. Meteorol. 2022, 323, 109070. [Google Scholar] [CrossRef]
  55. Cheng, X.; Hu, M.; Zhou, Y.; Wang, F.; Liu, L.; Wang, Y.; Huang, H.; Zhang, J. The divergence of micrometeorology sensitivity leads to changes in GPP/SIF between cork oak and poplar. Agric. For. Meteorol. 2022, 326, 109189. [Google Scholar] [CrossRef]
  56. Yan, Y.; Liu, X.; Wang, F.; Li, X.; Ou, J.; Wen, Y.; Liang, X. Assessing the impacts of urban sprawl on net primary productivity using fusion of Landsat and MODIS data. Sci. Total Environ. 2018, 613–614, 1417–1429. [Google Scholar] [CrossRef]
  57. Zhang, F.; Zhang, Z.; Kong, R.; Chang, J.; Tian, J.; Zhu, B.; Jiang, S.; Chen, X.; Xu, C.-Y. Changes in Forest Net Primary Productivity in the Yangtze River Basin and Its Relationship with Climate Change and Human Activities. Remote Sens. 2019, 11, 1451. [Google Scholar] [CrossRef] [Green Version]
  58. Liu, Y.; Liu, S.; Sun, Y.; Li, M.; An, Y.; Shi, F. Spatial differentiation of the NPP and NDVI and its influencing factors vary with grassland type on the Qinghai-Tibet Plateau. Environ. Monit. Assess. 2021, 193, 48. [Google Scholar] [CrossRef]
  59. Jiang, W.; Wang, L.; Zhang, M.; Yao, R.; Chen, X.; Gui, X.; Sun, J.; Cao, Q. Analysis of drought events and their impacts on vegetation productivity based on the integrated surface drought index in the Hanjiang River Basin, China. Atmos. Res. 2021, 254, 105536. [Google Scholar] [CrossRef]
  60. Wang, W.; Li, J.; Qu, H.; Xing, W.; Zhou, C.; Tu, Y.; He, Z. Spatial and Temporal Drought Characteristics in the Huanghuaihai Plain and Its Influence on Cropland Water Use Efficiency. Remote Sens. 2022, 14, 2381. [Google Scholar] [CrossRef]
  61. Aksoy, H.; Cetin, M.; Eris, E.; Burgan, H.I.; Cavus, Y.; Yildirim, I.; Sivapalan, M. Critical drought intensity-duration-frequency curves based on total probability theorem-coupled frequency analysis. Hydrol. Sci. J. 2021, 66, 1337–1358. [Google Scholar] [CrossRef]
  62. Won, J.; Kim, S. Ecological Drought Condition Index to Monitor Vegetation Response to Meteorological Drought in Korean Peninsula. Remote Sens. 2023, 15, 337. [Google Scholar] [CrossRef]
  63. Deng, Y.; Wu, D.; Wang, X.; Xie, Z. Responding time scales of vegetation production to extreme droughts over China. Ecol. Indic. 2022, 136, 108630. [Google Scholar] [CrossRef]
  64. Li, J.; Wang, Z.; Lai, C. Severe drought events inducing large decrease of net primary productivity in mainland China during 1982–2015. Sci. Total Environ. 2020, 703, 135541. [Google Scholar] [CrossRef]
  65. Zhou, Y.; Zhou, P. Decline in net primary productivity caused by severe droughts: Evidence from the Pearl River basin in China. Hydrol. Res. 2021, 52, 1559–1576. [Google Scholar] [CrossRef]
  66. Yoshida, Y.; Joiner, J.; Tucker, C.; Berry, J.; Lee, J.E.; Walker, G.; Reichle, R.; Koster, R.; Lyapustin, A.; Wang, Y. The 2010 Russian drought impact on satellite measurements of solar-induced chlorophyll fluorescence: Insights from modeling and comparisons with parameters derived from satellite reflectances. Remote Sens. Environ. 2015, 166, 163–177. [Google Scholar] [CrossRef]
  67. Liu, L.; Jiang, Y.; Gao, J.; Feng, A.; Jiao, K.; Wu, S.; Zuo, L.; Li, Y.; Yan, R. Concurrent Climate Extremes and Impacts on Ecosystems in Southwest China. Remote Sens. 2022, 14, 1678. [Google Scholar] [CrossRef]
  68. Guo, X.; Tong, S.; Ren, J.; Ying, H.; Bao, Y. Dynamics of Vegetation Net Primary Productivity and Its Response to Drought in the Mongolian Plateau. Atmosphere 2021, 12, 1587. [Google Scholar] [CrossRef]
  69. Tian, H.; Ji, X.; Zhang, F. Spatiotemporal Variations of Vegetation Net Primary Productivity and Its Response to Meteorological Factors across the Yellow River Basin during the Period 1981–2020. Front. Environ. Sci. 2022, 10, 949564. [Google Scholar] [CrossRef]
  70. Wang, Y.; Dai, E.; Wu, C. Spatiotemporal heterogeneity of net primary productivity and response to climate change in the mountain regions of southwest China. Ecol. Indic. 2021, 132, 108273. [Google Scholar] [CrossRef]
  71. Song, Y.; Wang, L.; Wang, J. Improved understanding of the spatially-heterogeneous relationship between satellite solar-induced chlorophyll fluorescence and ecosystem productivity. Ecol. Indic. 2021, 129, 107949. [Google Scholar] [CrossRef]
  72. Wang, X.; Wang, R.; Gao, J. Precipitation and soil nutrients determine the spatial variability of grassland productivity at large scales in China. Front. Plant. Sci. 2022, 13, 996313. [Google Scholar] [CrossRef] [PubMed]
  73. Zhao, Y.; Lu, X.; Wang, Y.; Bai, Y. How precipitation legacies affect broad-scale patterns of primary productivity: Evidence from the Inner Mongolia grassland. Agric. For. Meteorol. 2022, 320, 108954. [Google Scholar] [CrossRef]
  74. Liu, L.; Peng, J.; Li, G.; Guan, J.; Han, W.; Ju, X.; Zheng, J. Effects of drought and climate factors on vegetation dynamics in Central Asia from 1982 to 2020. J. Environ. Manag. 2022, 328, 116997. [Google Scholar] [CrossRef] [PubMed]
  75. Koch, J.; Demirel, M.C.; Stisen, S. The SPAtial EFficiency metric (SPAEF): Multiple-component evaluation of spatial patterns for optimization of hydrological models. Geosci. Model Dev. 2018, 11, 1873–1886. [Google Scholar] [CrossRef] [Green Version]
Figure 1. Location of the HHH Plain and land use types in the region.
Remotesensing 15 03276 g001
Figure 2. Flow chart of the research method.
Remotesensing 15 03276 g002
Figure 3. Spatial distribution of the GOSIF maximum (a), GLASS NPP maximum (b), GOSIF mean (c), GLASS NPP mean (d), GOSIF maximum (e), and GLASS NPP maximum (f) from 2010 to 2020.
Remotesensing 15 03276 g003
Figure 4. Results of the image-by-image correlation analysis of GOSIF and GLASS NPP in the HHH Plain from 2010 to 2020 (a) and significant values (b).
Remotesensing 15 03276 g004
Figure 5. Standardized GOSIF and GLASS NPP changes for the 8-day interval from 2010 to 2020.
Remotesensing 15 03276 g005
Figure 6. Results of the pixel-by-pixel correlation analysis between GOSIF and GLASS NPP (ad) and significant values (eh) from October 2013 to September 2014, May to December 2019, May to June 2020, and October to December 2020.
Remotesensing 15 03276 g006
Figure 7. Dynamic changes in SIF/NPP with 8-day time intervals from October 2013 to September 2014 (a) and May to December 2019 (b).
Remotesensing 15 03276 g007
Figure 8. Dynamic changes in SIF/NPP with an 8-day time interval in (a) mildly drought-affected regions, (b) moderately drought-affected regions, (c) severely drought-affected regions, and (d) extremely drought-affected regions from October 2013 to September 2014.
Remotesensing 15 03276 g008
Figure 9. Dynamic changes in SIF/NPP with an 8-day time interval in (a) mildly drought-affected regions, (b) moderately drought-affected regions, (c) severely drought-affected regions, and (d) extremely drought-affected regions from May to December 2019.
Remotesensing 15 03276 g009
Figure 10. Correlation between GOSIF and GLASS NPP during drought events of 40 (a), 80 (b), 120 (c), 160 (d), 200 (e), 240 (f), 280 (g), and 320 days (h) from October 2013 to September 2014.
Remotesensing 15 03276 g010
Figure 11. Correlation between GOSIF and GLASS NPP during drought events of 40 (a), 80 (b), 120 (c), 160 (d), and 200 days (e) from May to December 2019.
Remotesensing 15 03276 g011
Figure 12. Results of the correlation analysis between GOSIF and FAPAR (a), LAI (b), LST (c), NDVI (d), and rain (e) from October 2013 to September 2014, and between GOSIF and FAPAR (f), LAI (g), LST (h), NDVI (i), and PRE from May to December 2019 (j).
Remotesensing 15 03276 g012
Figure 13. Results of the correlation analysis between GOSIF and FAPAR lags of 16 (a), 32 (b), 48 (c), 64 (d), and 80 days (e) for the period October 2013 to September 2014.
Remotesensing 15 03276 g013
Figure 14. Results of the correlation analysis of GOSIF with LST lags of 8 (a), 24 (b), 40 (c), and 56 days (d) for the period October 2013 to September 2014.
Remotesensing 15 03276 g014
Figure 15. Results of the correlation analysis between SIF and FAPAR lags of 24 (a), 48 (b), 72 (c), 96 (d), and 112 days (e) for the period May to December 2019.
Remotesensing 15 03276 g015
Figure 16. Results of the correlation analysis between SIF and LST lags of 16 (a), 32 (b), 48 (c), and 64 days (d) for the period May to December 2019.
Remotesensing 15 03276 g016
Table 1. Degree of drought according to the mlSDI values.
mlSDIDrought Degree
0.5 ≤ mlSDImoist
−1 ≤ mlSDI ≤ 0.5normal
−2 ≤ mlSDI ≤ −1mild drought
−3 ≤ mlSDI ≤ −2moderate drought
−4 ≤ mlSDI ≤ −3severe drought
−5 ≤ mlSDI ≤ −4extreme drought
Table 2. Drought events from 2010 to 2020.
Drought Start and End TimeDegree of DroughtDuration of Drought in Months
October 2013 to September 2014mild drought12
May 2019 to December 2019mild drought8
May 2020 to June 2020mild drought2
October 2020 to December 2020mild drought3
Table 3. Statistical data of time series for the standardization of abnormal values of various factors from October 2013 to September 2014.
Factors1 MIN2 MAX3 MEAN4 STD
FAPAR−2.51582.82000.03110.6753
LAI−1.74101.8489−0.04540.3877
LST (°C)−1.15300.7844 0.01190.2290
NDVI−2.98193.3551−0.01590.6373
PRE (mm)−0.75332.4817−0.06160.4765
1 MIN, minimum; 2 MAX, maximum; 3 MEAN, mean; and 4 STD, standard deviation.
Table 4. Statistical data of time series for the standardization of abnormal values for various factors from May to December 2019.
Factors1 MIN2 MAX3 MEAN4 STD
FAPAR−2.26663.0376−0.01030.6904
LAI−1.34993.33130.19100.3694
LST (°C)−1.24840.6149−0.12450.2077
NDVI−3.59883.32040.1431 0.6047
PRE (mm)−0.75561.7718 −0.11180.3525
1 MIN, minimum; 2 MAX, maximum; 3 MEAN, mean; and 4 STD, standard deviation.
Table 5. Correlation between SIF and FAPAR at different lags in the southern HHH Plain from October 2013 to September 2014.
1 Days of Lag8 16 24 32 40 48 56 64 72 80
2 R20.180.210.250.320.470.540.650.710.590.48
1 Number of days of lag; 2 correlation coefficient.
Table 6. Correlation between SIF and LST at different lag periods in the southern HHH Plain from October 2013 to September 2014.
1 Days of Lag8 16 24 32 40 48
2 R20.360.420.520.650.750.72
1 Number of days lag; 2 correlation coefficient.
Table 7. Correlation between SIF and FAPAR at different lags in the southern HHH Plain from May to December 2019.
1 Days of Lag8 16 24 32 40 48 56 64 72 80 88 96 104
2 R20.420.360.340.480.460.520.540.530.560.550.640.720.68
1 Number of days lag; 2 correlation coefficient.
Table 8. Correlation between SIF and LST at different lags in the southern HHH Plain from May to December 2019.
1 Days Lag8 16 24 32 40 48 5664
2 R20.580.660.720.780.750.840.820.77
1 Number of days lag; 2 correlation coefficient.
Disclaimer/Publisher’s Note: The statements, opinions and data contained in all publications are solely those of the individual author(s) and contributor(s) and not of MDPI and/or the editor(s). MDPI and/or the editor(s) disclaim responsibility for any injury to people or property resulting from any ideas, methods, instructions or products referred to in the content.

