Article

Land Use/Land Cover Optimized SAR Coherence Analysis for Rapid Coastal Disaster Monitoring: The Impact of the Emma Storm in Southern Spain

by
Pedro Andrés Garzo
1,* and
Tomás Fernández-Montblanc
2
1
Instituto de Geología de Costas y del Cuaternario (IGCC—UNMDP/CIC), Instituto de Investigaciones Marinas y Costeras (IIMyC—CONICET/UNMDP), University of Mar del Plata, Funes 3350, Mar del Plata 7600, Argentina
2
Earth Sciences Department, University of Cádiz, INMAR, Av. República Saharaui s/n (11510), Puerto Real, 11003 Cádiz, Spain
*
Author to whom correspondence should be addressed.
Remote Sens. 2023, 15(13), 3233; https://doi.org/10.3390/rs15133233
Submission received: 16 April 2023 / Revised: 4 June 2023 / Accepted: 19 June 2023 / Published: 22 June 2023
(This article belongs to the Special Issue Remote Sensing and GIS Based Coastal Disaster Monitoring)

Abstract

:
The high exposure of coastal areas worldwide to natural and anthropogenic disasters emphasizes the relevance of disaster management processes that ensure a prompt damage detection and identification of affected areas. This paper aimed to develop a novel approach for disaster monitoring in coastal areas using SAR data. The method was based on an interferometric coherence difference analysis of Sentinel 1 data. To calibrate and validate the method, the Emma Storm, a severe coastal storm that affected the southwest coast of the Iberian Peninsula in 2018, was chosen as a case study. A coastal land use/land cover method optimization by optical and UAV field data resulted in an overall improvement of about 20% in the identification of disaster-affected areas by reducing false alarms by up to 33%. Finally, the method achieved hit and false alarm rates of about 80% and 20%, respectively, leading to the identification of approximately 30% (7000 ha) of the study area as being affected by the storm. Marshes and vegetated dunes were the most significantly impacted covers. In addition, SAR data enabled the impact assessment with a time lag of 2 days, contrasting the 25-day delay of optical data. The proposed method stands out as a valuable tool for regional-scale coastal disaster monitoring. In addition, it can be automated and operated at a low cost, making it a valuable tool for decision-making support.

1. Introduction

Coastal areas are essential environments for socio-economic development and human well-being [1]. Currently, over 40% of the world’s population resides within 100 km of the coast, and about 10% lives in coastal zones situated below 10 m of topographic altitude [2]. Furthermore, it is projected that the population density in these areas will increase by around 25% by 2050 [3]. The significance of these areas is linked to their multiple uses and opportunities due to their valuable ecosystem goods and services [4]. However, due to the high population density, concentration of economic activities, infrastructure, and cultural heritage assets, coastal areas are exposed to natural and anthropogenic disasters, which endangers their long-term sustainability [5,6]. Those disasters are particularly exacerbated by socio-economic conditions. It is estimated that over 28 million people living in deltas of developing or least-developing economies are highly vulnerable to coastal flooding [7] while projected scenarios of sea level rise are expected to have significant impacts on the developing world [8,9]. Furthermore, the rapid population growth of developing countries will increase the exposure and vulnerability conditions of coastal communities.
Sea level rise [10] and extreme climate events such as storms, cyclones, hurricanes, flooding, and heavy precipitation [11,12] have significant impacts on coastal areas, making them the most critical coastal hazards on a global scale. Additionally, human activities, such as construction of coastal infrastructure, sand mining, over-exploitation of coastal aquifers, coastal urbanization, and coastal afforestation, among other interventions, increase the coastal disaster risk and the vulnerability of coastal populations [13,14]. The primary impacts resulting from these coastal hazards include coastal erosion [15] and flooding [16].
Disaster management is defined as the process aimed at reducing the potential impacts of hazards, ensuring rapid support to victims, and developing effective disaster-recovery actions [17]. An effective disaster management process, as stated in [18], comprises at least four phases: mitigation, preparedness, response, and recovery. The first two phases occur before a disaster, while the remaining two happen after a disaster. This work mainly focuses on the response phase, which aims to detect damage quickly, assess it, and identify affected areas in the aftermath of a disaster. The products derived from the response phase are essential for subsequent stages, such as the recovery phase, as the urgency for decision-making and post-disaster emergency relief is high [19].
Remote sensing (RS) techniques and Geographic Information Systems (GIS) play a crucial role in all disaster management phases [3]. The great advances in computer sciences that occurred in the last decades have led to an improvement in GIS systems for disaster management [20]. However, in many cases, the response methods are not fast enough because they are inefficient and highly laborious [21]. Thus, the automatic and rapid generation of information and derived products is a key issue for early warning, information, and monitoring systems.
One of the primary applications of RS tools and geospatial technologies involves monitoring and detecting changes over the Earth’s surface using multi-temporal data [22]. Optical and multispectral RS sensors have been widely used for change detection studies across various applications [23,24,25,26,27,28,29]. In coastal studies, this data type has been extensively used to extract shoreline positional features [30,31,32] and to support automatic change detection methods [33,34].
Satellite images acquired from Synthetic Aperture RADAR (SAR) sensors have been underutilized in disaster monitoring studies due to their well-documented limitations, which include the presence of speckle noise [35], the inherent difficulties associated with geometric distortions, particularly in mountainous areas [36,37], and the complex and time-consuming methods related to data pre-processing [38]. Thus, some authors have proposed the combination of data from different sources, such as optical, SAR, or even LiDAR data [39], in order to overcome these challenges.
However, SAR sensors offer operational advantages over optical sensors as they operate in the microwave region of the electromagnetic spectrum and can work efficiently in any meteorological condition, providing full day–night coverage (all-day/all-weather conditions) [40,41]. They are referred to as active sensors because they do not require an external energy source to operate. As a result, SAR time series data are a valuable tool for coastal studies [42,43,44] and can provide fast and useful information during the recovery phase of coastal disaster management.
The operational capabilities of SAR data have led to significant advancements in new technologies and techniques over the last few decades [45]. SAR Interferometry (InSAR) is considered the main radar technique for studying Earth’s surface dynamics [46]. It has been utilized for monitoring surface deformations caused by earthquakes [47], landslides [48], ground subsidence [49], flooding and wetland dynamics [50], forestry [51], and urban studies [52], all of which are related to risk assessment. Nevertheless, the presence of speckle scattering over water surfaces adds complexity to the assessment of flooding events [53], which limits the effectiveness of SAR images for disaster monitoring in coastal and beach areas. Additionally, InSAR has been widely used for topographic applications, such as generating global DEMs like SRTM [54].
The main InSAR technique considered for disaster monitoring is coherence analysis [55]. It is based on the coherence magnitude, which measures the surface scattering correlation between two SAR images acquired for the same location but at different times [56,57]. Since coherence is highly sensitive to changes in surface properties between acquisitions, a decrease in coherence (decorrelation) is typically used to identify disaster-affected areas [58].
The coherence analysis technique has been extensively documented for various applications, including disaster monitoring. For instance, in desert areas of the Kubuqui Desert and United Arab Emirates desert, ref. [59,60] applied it to monitor aeolian erosion and dune motion, respectively, while ref. [61] studied fluvial and aeolian morphodynamics of two paleo-channels in the Egyptian Sahara Desert. In addition, ref. [62,63] used coherence analysis to monitor the activity of an open-pit iron mine in North Korea and four open-pit coal mines in China, respectively, while ref. [64] detected hurricane-triggered flooding in Houston, United States of America. Moreover, ref. [65] assessed a flooding event of the Richelieu River in Quebec, Canada, which occurred in early 2011, and ref. [66] evaluated changes over temperate and tropical forests in Romania and Brazil. Furthermore, ref. [57,67] used coherence analysis to study soil liquefaction, land subsidence, and surface displacements produced by the Tohoku earthquake (Japan) and the Meinong earthquake (Taiwan), respectively. Finally, ref. [68] detected active deformation areas due to volcanic activity in the Canary Island archipelago, and ref. [69] monitored landslide events triggered by heavy rainfalls in Cyprus.
The main aim of this work is to enhance existing InSAR techniques for disaster change assessment in coastal areas by developing an improved approach that takes into account the highly dynamic nature of these environments. The primary focus of this novel approach is to improve the capabilities of SAR data for the post-disaster response phase. The methodology involves conducting a coherence difference analysis using a Sentinel 1 (S1) dataset, while considering various coastal land use/land cover scenarios. To calibrate and validate the proposed method, the Emma Storm, a severe coastal storm that affected southern Spain in 2018, is chosen as a case study.
This paper is organized as follows: Section 2 provides an overview of the InSAR technique with a focus on coherence difference analysis. It also includes the characterization of the study area and the Emma Storm, as well as the proposed methodology and dataset information. In Section 3, the results of the coherence analysis are presented, including the method calibration and validation, and the assessment of the storm-affected area. Section 4 discusses these results, taking into account the advantages and disadvantages of the proposed approach. Finally, the main conclusions of this paper are summarized in Section 5.

2. Materials and Methods

2.1. Fundamentals of InSAR Technique

SAR images contain two types of information: phase and amplitude. The phase means the fraction of a complete wavelength cycle and represents the distance between the sensor antenna and the surface target. The amplitude is the strength of the scattered radar signal from the ground targets back to the sensor [57].
When working with a pair of Single Look Complex (SLC) SAR images acquired at different times, a complex interferogram can be produced [70]. It consists of estimating the backscatter amplitude and phase changes between observations and can be expressed as follows:
C 2 C 1 = A 1 A 2   e i Φ 2     Φ 1 ,
where C stand for the complex value image, A is the amplitude, and Φ is the phase; subscripts 1 and 2 refer to the master and slave images, respectively; e is the Euler’s number and i means an imaginary number (i = √(−1)). Master and slave denotation usually refers to the older and the more recent image, respectively.
The InSAR principle is based on the measurement of those phase differences between complex-valued SAR images acquired from different orbital positions and/or at different times. For this paper, we focus on those images acquired at different times and from different orbital positions corresponding to the so-called repeat-pass across interferometry [71]. Taking into account the distance difference between the sensor and the target surface in master and slave images, the interferometric phase can be estimated as follows [41]:
Φ = 4 π λ   · B ·   sin   θ     α ,
where B is the spatial baseline between images, θ is the incidence look angle, and α the tilt angle. The spatial baseline is a key parameter for the construction of an interferometric system. It represents the spatial separation between both acquisitions and can be decomposed into a parallel baseline (B∥) and a perpendicular baseline (B⊥) (Figure 1). At the same time, the temporal baseline (BTemp) represents the temporal separation between acquisitions [51].
When working with interferometric pairs (master and slave images) it is important to take into account an adequate B⊥ because it defines the sensitivity of the system to geometric decorrelation factors [41]. This issue will be explained in more depth in the following section. In order to do so, it is necessary to understand the concept of the critical baseline of the interferometric system. The critical baseline can be defined as follows:
B , crit = λ   · Br c   ·   Rtan θ   ς ,
where B⊥,crit is the critical baseline value, λ is the radar wavelength, Br is the system range bandwidth which leads to a zero geometric decorrelation, and R is the slant range distance. Finally, ς is the terrain slope; meanwhile, a good estimation of B⊥,crit can be obtained by using the incidence look angle only (θ).

2.2. Interferometric Coherence

The interferometric coherence (ץ) represents the surface scattering correlation between two SAR acquisitions [56]. Based on the equations presented in the previous section, it can be expressed as follows [55]:
γ = < C 1 C 2 > < C 1 2 > < C 2 2 > ,
where C1 and C2 are the master and slave complex-valued images, respectively. Brackets (<>) represents the speckle filtering for radar noise reduction [72]. γ is also a complex magnitude, whose modulus (|ץ|) indicates the correlation between acquisitions. This paper is mainly focused on estimating differences in |ץ| as an indicator of disaster-driven decorrelation processes.
Coherence (γ) values are estimated at a pixel-by-pixel scale and range from 0 to 1; a value of 1 indicates no change in the scattering properties between images. However, when the observed surface changes, the complex backscatter is affected and causes a decrease in the coherence values, which is called decorrelation. According to [58], the interferometric coherence suffers from three main factors of decorrelation: radar thermal noise decorrelation (ץN), geometric decorrelation (ץG), and temporal decorrelation (ץT).
Decorrelation due to thermal noise is determined by the signal-to-noise ratio of the radar system. In repeat-pass interferometry, both images’ radar signals are acquired by the same antenna; so, the variation of thermal noise can be assumed to be the same. Thus, ץN do not influence the coherence estimation by adding a source of decorrelation between acquisitions [57].
Geometric decorrelation is determined by the different illumination angles of the same ground resolution pixel at the master and slave acquisitions. Thus, ץG arises from the θ term involved in the critical baseline estimation (see Equation (3)). If the perpendicular baseline is major then critical baseline ץG becomes 0, causing a total decorrelation [73].
Finally, the temporal decorrelation is always present in the repeat-pass interferometry and it strongly depends on the temporal baseline (Btemp). The coherence loss in InSAR is primarily caused by changes in the geometry, structure, and dielectric properties of the imaged surface [73]. As a general rule, decorrelation tends to increase as the temporal baseline (i.e., the time interval between the two SAR images in a pair) increases [51].
The Coherence Difference Analysis (CDA) is based on the assumption that when natural or anthropogenic-induced hazards (e.g., coastal hazards) trigger damage over a defined area, the coherence estimation changes between the images acquired before and after the event [57]. Following [67], the CDA is carried out by the comparison between coherence maps generated from pre- and post-disaster SAR images. A master and a slave image are stacked for obtaining the pre-disaster coherence map while the same process is carried out for two post-disaster acquisitions. Finally, the coherence difference (ץdiff) is estimated as follows:
γ diff = γ   pre     γ   post   = γ N   pre     γ N   post · γ G   pre     γ G   post · γ T   pre     γ T   post ,
where pre and post super-indexes represent the pre- and post-disaster scenarios, respectively. As mentioned above, ץN can be equal or nearly equal when images correspond to the same acquisition sensor. In addition, ץG does not affect the coherence estimation when the InSAR system perpendicular baseline represents a highly insignificant value compared with the sensor critical baseline [41]. Thus, it is possible to consider that the disaster event led to a loss in the coherence by only affecting ץT. Finally, coherence difference expression can be re-written as follows:
γ diff = γ T   pre     γ T   post .
For the objectives of this paper, temporal decorrelation is considered the most significant factor for the Coherence Difference Analysis (CDA). According to [74], these effects occur randomly in the case of disaster events. However, temporal decorrelation is caused by differences in the structure and dielectric properties of the ground scatterers. Structure effects are related to geometric changes in scatterers’ roughness, size, or even land cover type [75]. Dielectric properties effects are linked to the water content (i.e., soil moisture) of the radar-illuminated surface [66], being an important parameter for storms, flooding, coastal storm surges, or river floods, among others.

2.3. Study Area and the Emma Storm

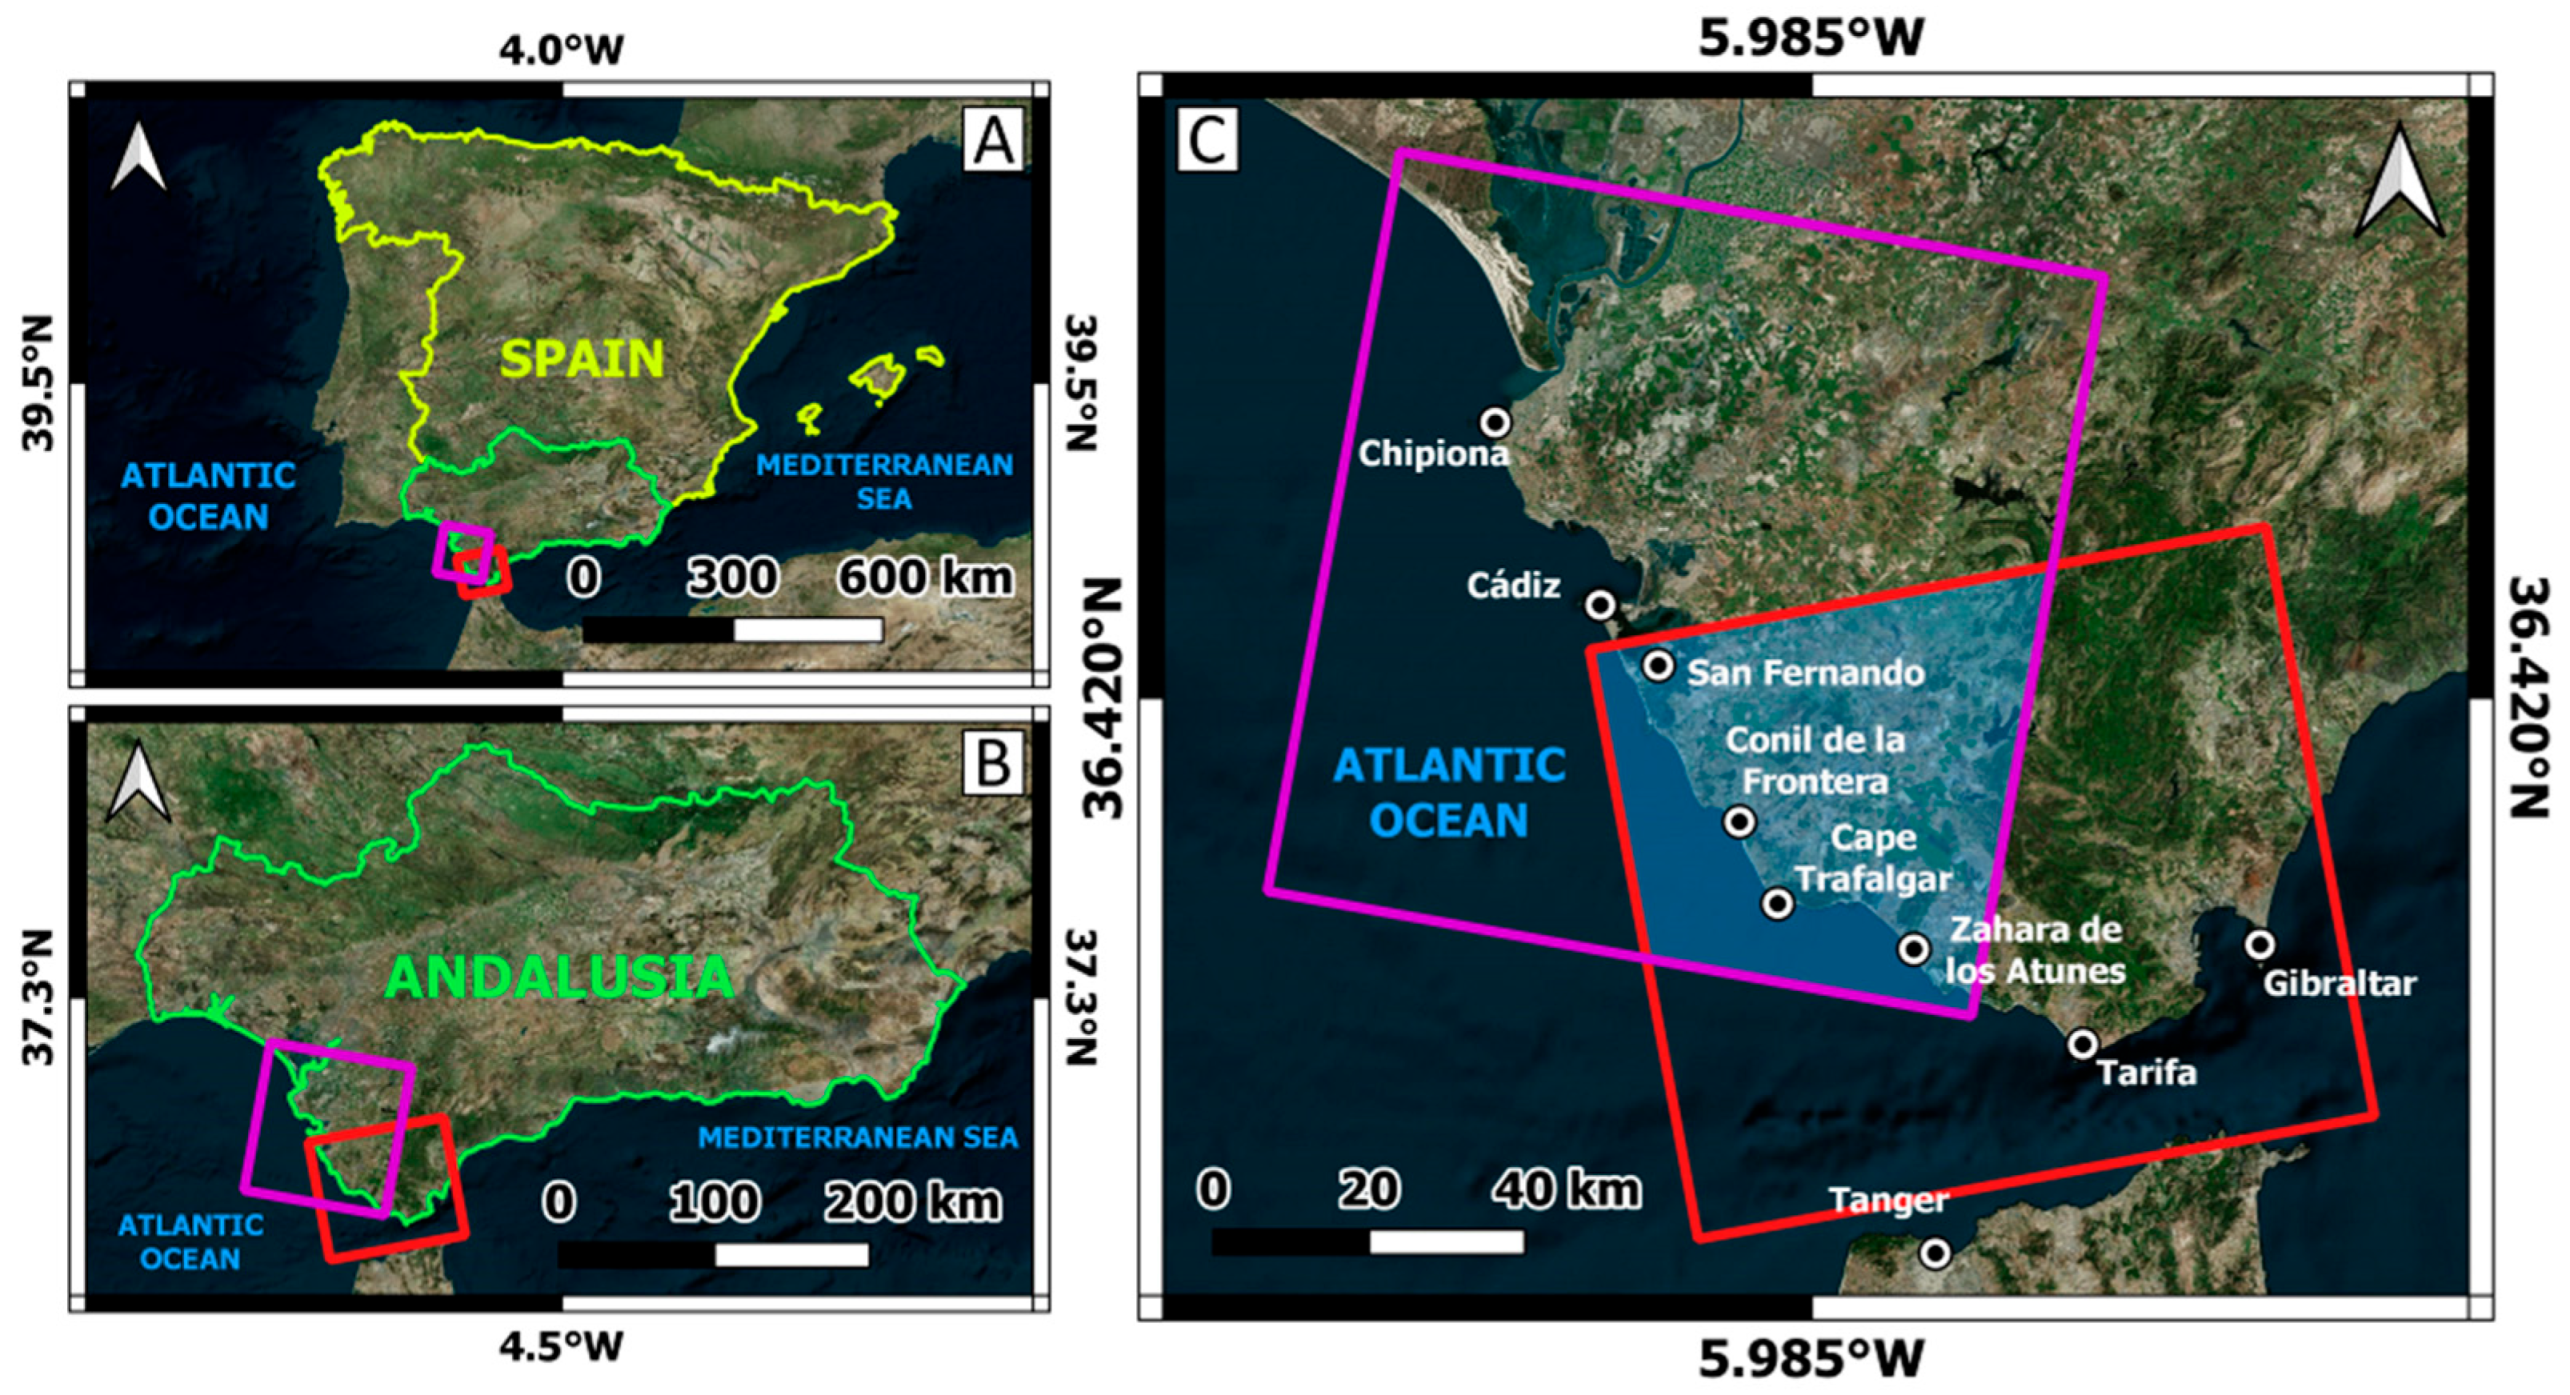
The study area is located in the Gulf of Cadiz in the southwest coast of the Iberian Peninsula. It extends from Cádiz to Bolonia (Figure 2). This delimitation resulted from the intersection between the ascending and the descending path of S1 data (see Section 2.4. below). The coastline shows a general orientation of NNW–SSE with the exception of W–E alignment associated with recent faults [76].
The study area can be characterized by a sandy shore with a relatively high fluvial sediment supply from great river basins such as the Guadalquivir River. Sediment is mainly composed by fine to medium quartz sand [76]. This coast presents low-lying areas (Cádiz Bay, Río Salado, Conil de La Frontera, Estuary of Barbate) with alternating cliff pocket beaches and open beaches with dune systems.
The study area can be considered as a mesotidal coast dominated by semidiurnal tides with a mean spring tidal range from 2.96 m in Cádiz to 2.30 m in Barbate [77]. West wave direction is the most frequent and WSW the most energetic direction. Low wave energy characterizes the average condition (Hs < 1 m at 90% of the average year), although Hs > 3 m in extreme conditions (105 h/year) [78]. The waves show increasing values from north to south, characterized by a narrow continental shelf. Contrarily, meteorological tides increase from south to north where values > 0.4 m are associated to the deeper low-pressure systems [79]. Prevailing winds blow from WSW (called Poniente), and ESE (called Levante) with lower frequency, but higher intensities control the aeolian sand transport in the study area [80].
The Emma Storm occurred between 28 February and 3 March 2018, affecting the SW of the Iberian Peninsula. It was characterized by its long duration (~153 h) and extreme wave height (4 m in average and reaching up to 6.8 at the peak). The prevailing wave direction was WSW. It was associated to a deep low pressures system that impacted the coast in spring tide condition, generating a storm surge of 0.4 that contributed to increasing the TWL up to 4 m [81]. Severe damages were registered in the Atlantic coast of Spain and Portugal, including a strong coastal erosion resulting in damages over walls, promenades, houses, and overwash areas, resulting in water and sediment piling over roads, car parks, and house yards [82].

2.4. Method Workflow

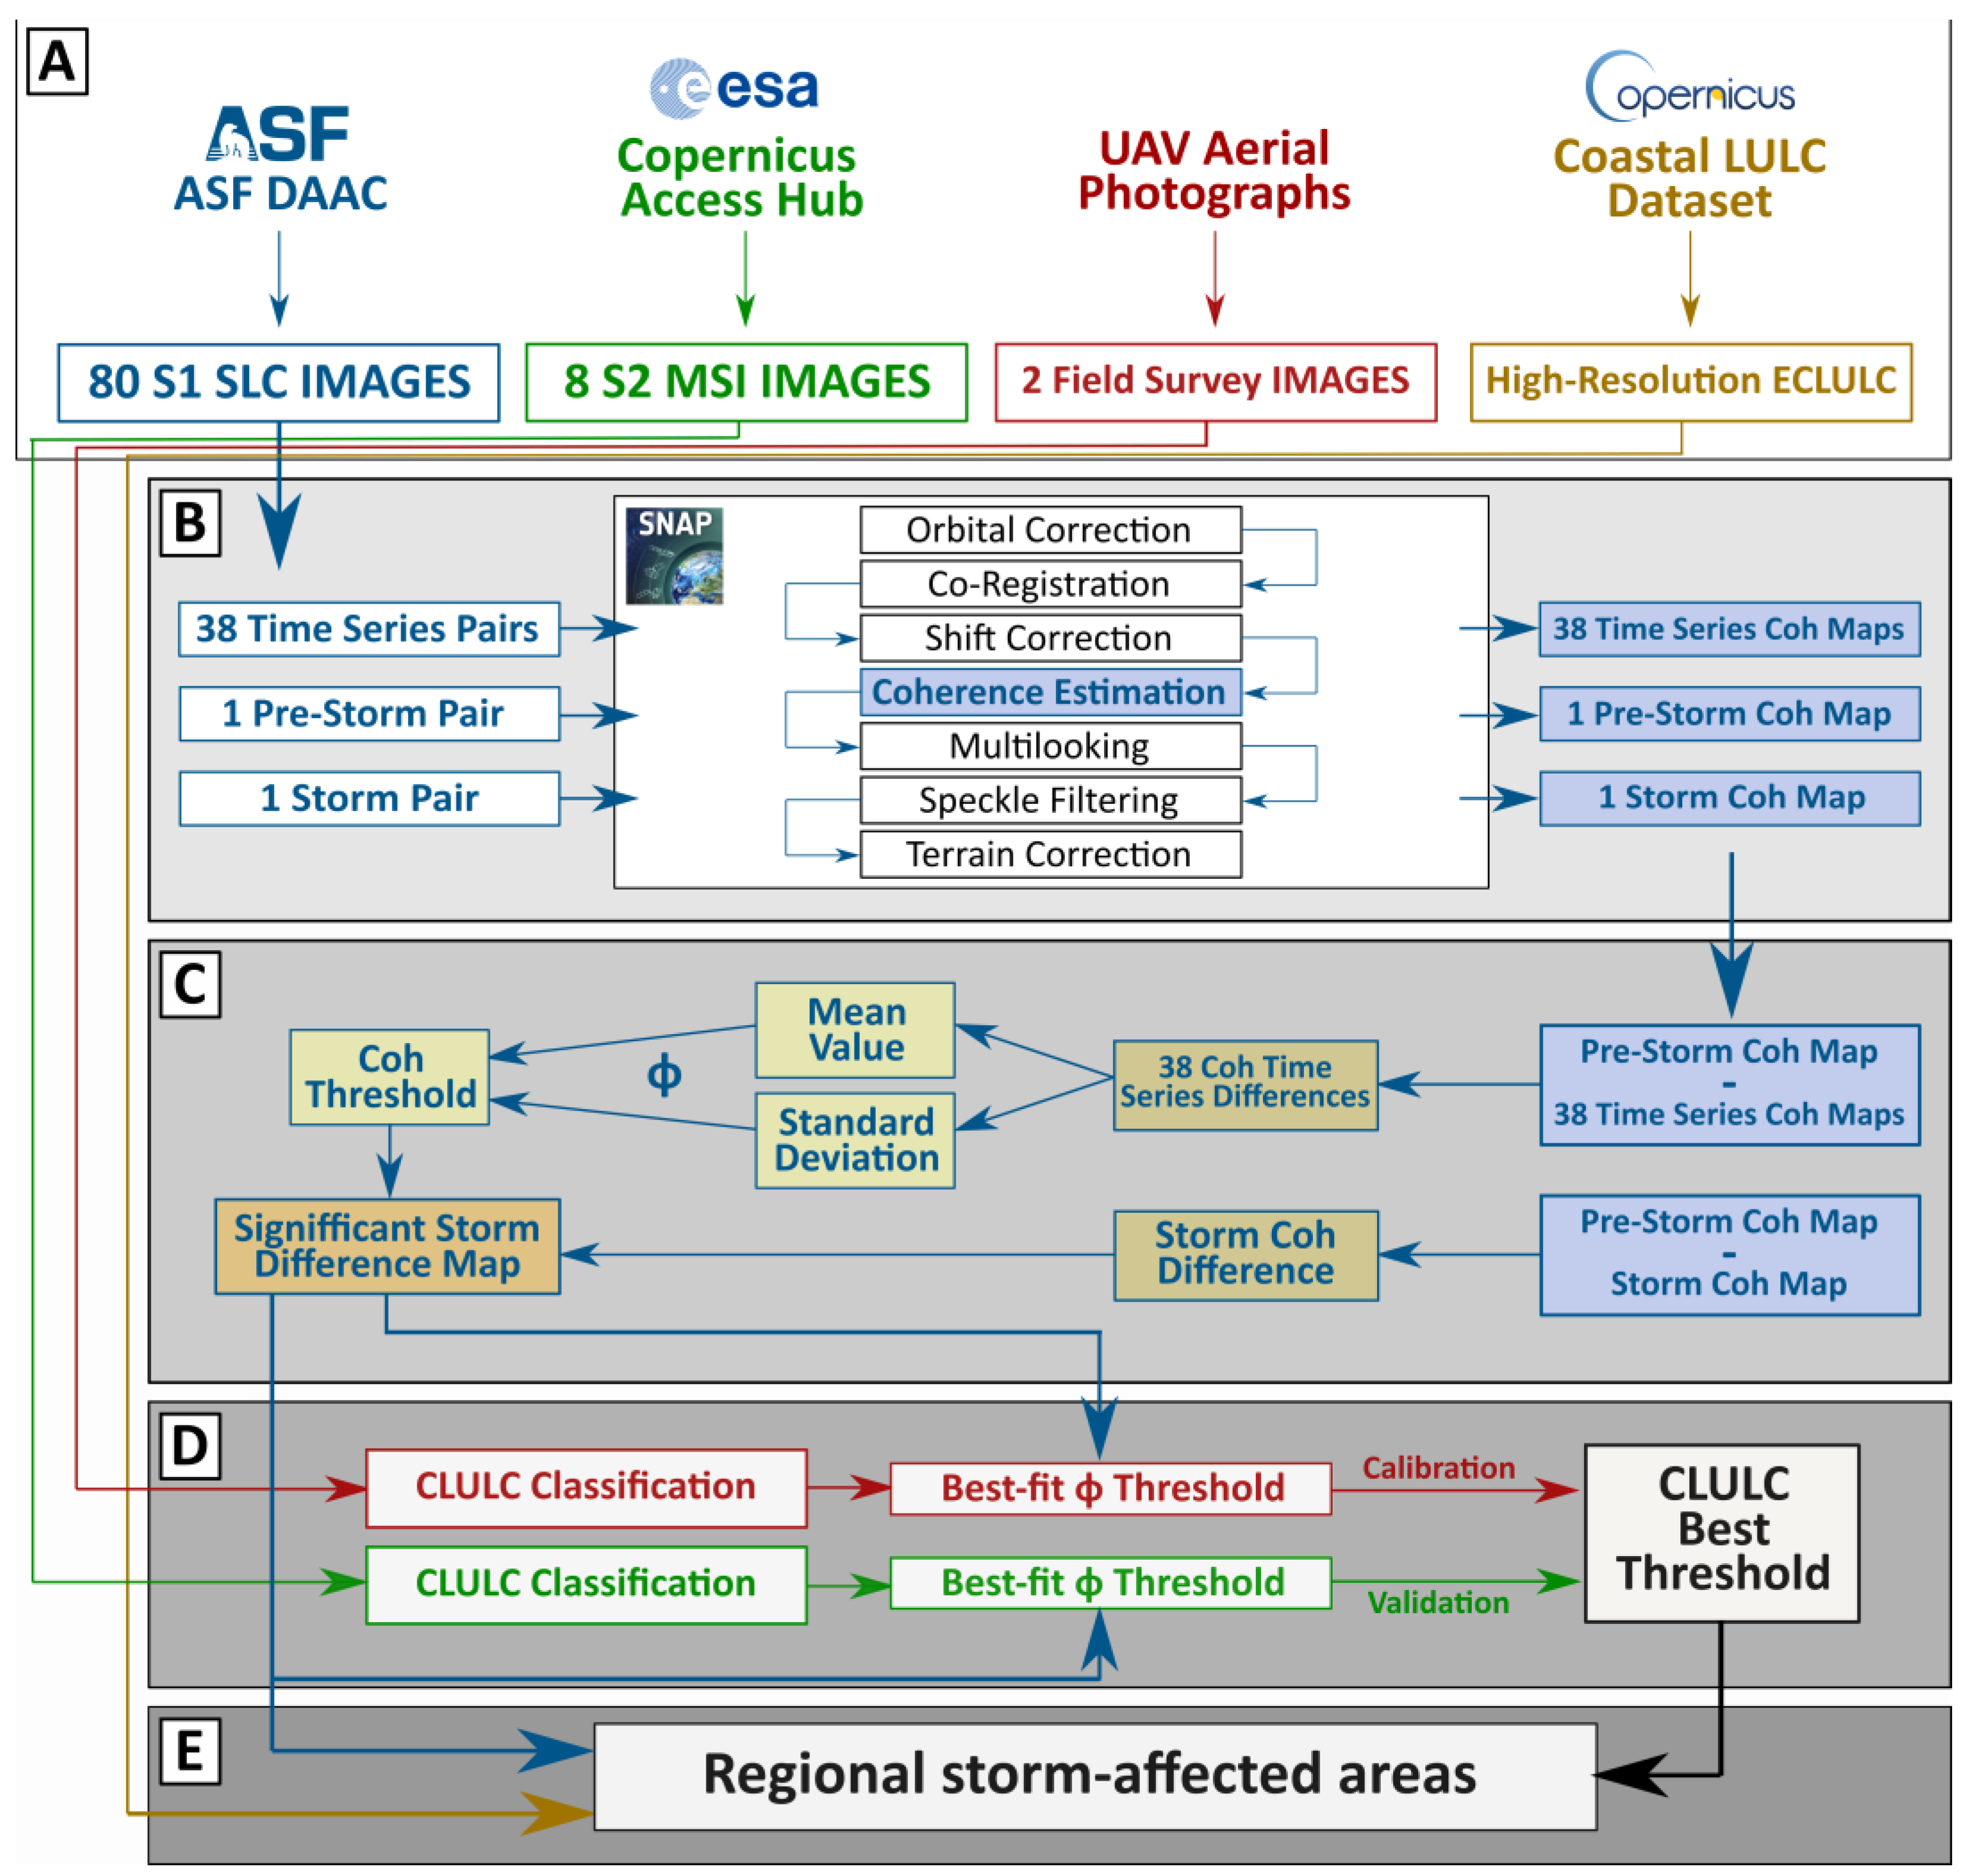
In order to develop the coastal land use/land cover enhanced method, five main steps were conducted: datasets acquisition, interferometric coherence processing and post-processing, coherence difference analysis, land use/land cover calibration and validation, and regional storm-affected areas assessment. Figure 3 schematically summarizes these steps, which are described in the following sections.

2.5. Datasets

2.5.1. Satellite Data

A total of 80 Copernicus Sentinel-1 (S1) SAR images acquired between June 2016 and March 2018 were used for this study (Table S1 at Supplementary Materials). These SAR images corresponded to Single Look Complex (IW Level-1 SLC) C-band (λ ≅ 5.6 cm) products based on a dual polarization (VV/VH). Its spatial resolution was of about 5 × 20 m (range × azimuth) and its temporal resolution ranged between 6 and 12 days. The data were divided into 40 ascending orbit images (Path: 74—Row: 113) and 40 descending orbit images (Path: 154—Row: 471) (Figure 2). S1 open and free-of-charge data were retrieved from ASF DAAC (https://asf.alaska.edu/; accessed on 10 March 2023) and processed by the European Space Agency (ESA).
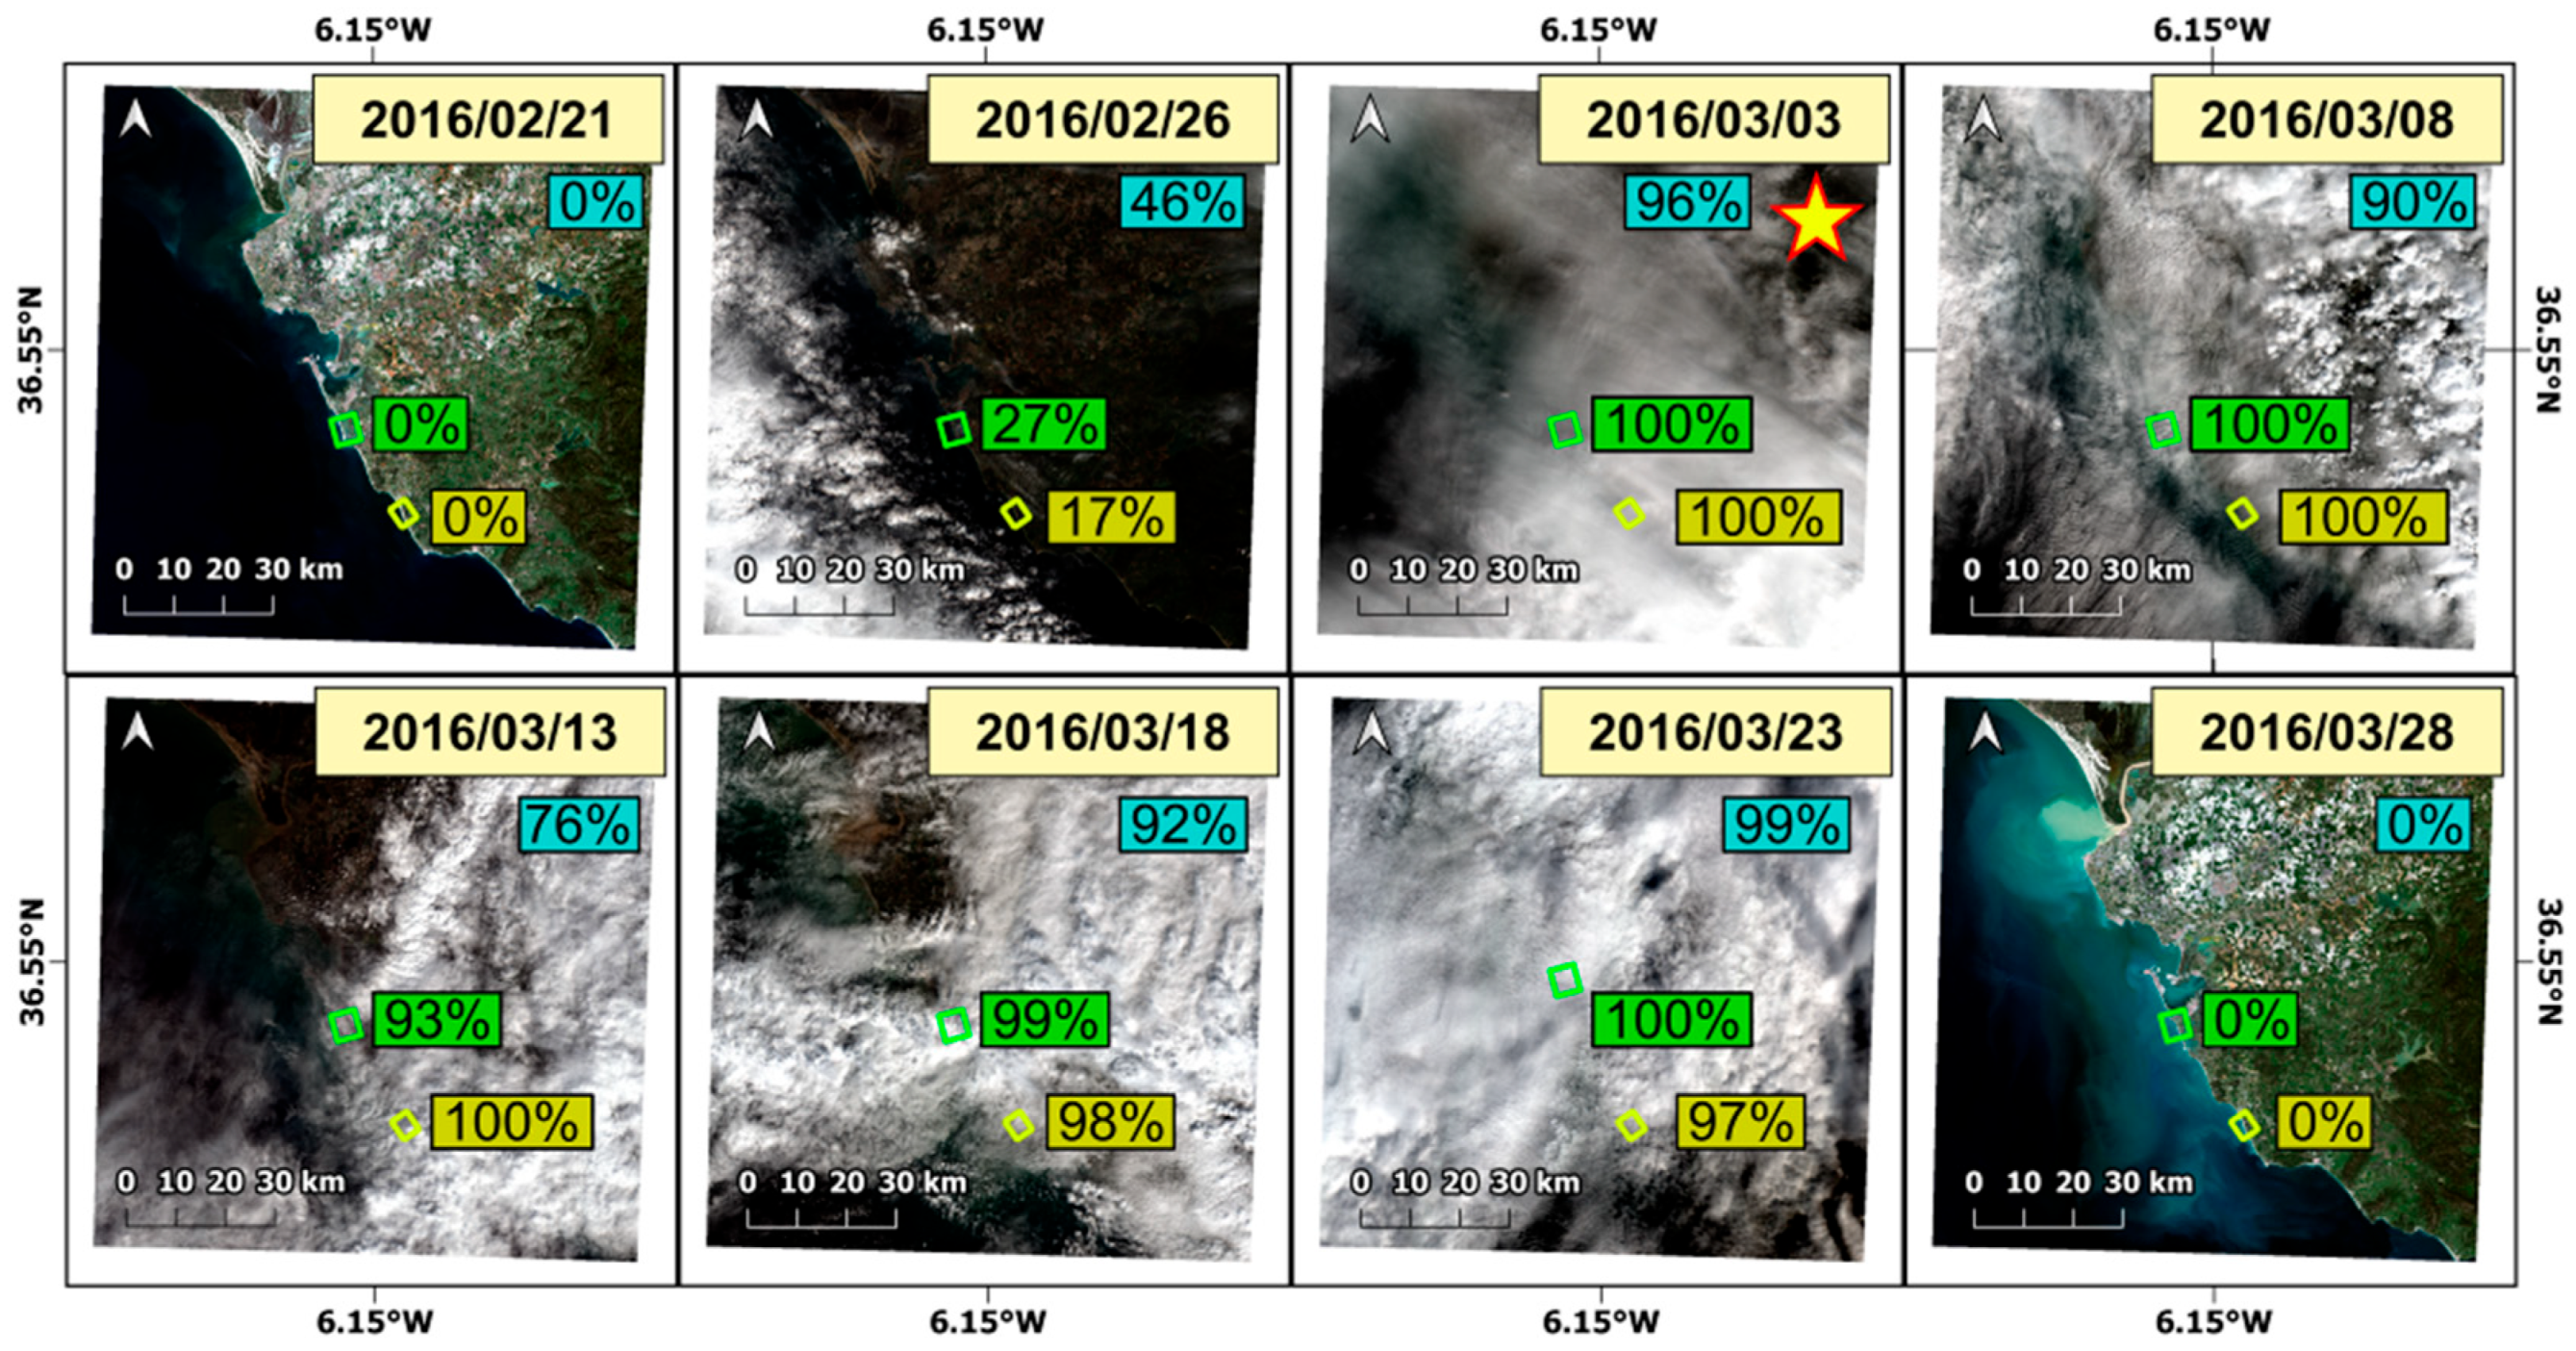
In addition, 8 optical Sentinel-2 (S2) MSI images for Conil de la Frontera (Figure 2) acquired between 21 February 2018 and 28 March 2018 were retrieved from the Copernicus Open Access Hub (ESA) (https://scihub.copernicus.eu/; accessed on 10 March 2023). These data corresponded to Level-1C products with a spatial coverage of 100 × 100 km and a spatial resolution of about 10 m in the RGB bands (Blue (~493 nm), Green (~560 nm), and Red (~665 nm)). All the data were collected for relative orbit No 137 and with a temporal resolution of 5 days.

2.5.2. UAV Aerial Photographs

Pre-storm and post-storm aerial photographs recorded in UAV-based field surveys were used. The images were georeferenced by using uniformly distributed RTK-DGPS control points around a beach area of ~0.3 km2 located in Camposoto Beach, San Fernando (Figure 2). It represented a spatial resolution of ~2.5 cm and was recorded at pre-storm (19 January 2018) and post-storm (7 March 2018) conditions. More information about the acquisition and images characteristics can be found in [80,83].

2.5.3. Coastal Zones Land Use/Land Cover Dataset

Finally, a high-resolution Coastal Zones Land Use/Land Cover layer for the coastline of Europe (ECLULC) (71.2°N–34.6°S; 24.5°W, 44.8°E) was used. It contains 71 thematic classes derived from a semi-automatic classification of very high-resolution satellite data. This ECLULC dataset is characterized by minimum mapping unit of 0.5 ha and minimum mapping width of 10 m. The positional accuracy is <5 m and the overall thematic accuracy is ≥85% (see [84] for further details).

2.6. InSAR Processing

The S1 dataset was firstly collected and pre-processed in order to obtain 20 ascending orbit (ASC) and 20 descending orbit (DESC) image pairs (Table S2 at Supplementary Materials), assuming a maximum time span of 12 days between acquisitions. These 40 image pairs were subsequently processed in order to generate 40 coherence maps. Interferometric coherence processing and post-processing was carried out by using the open-access and free-of-charge European Space Agency SNAP Software (SNAP, ESA Sentinel Application Platform v9.0, http://step.esa.int; accessed on 15 April 2023).
The coherence maps were obtained by following a classic interferometric workflow for Sentinel acquisitions [85]: firstly, images were orbitally corrected by applying the Sentinel Precise Auto-download orbit state vectors, back geocoded by SRTM1sec HGT for DEM-assisted co-registration of image pairs, and shift-corrected in range and azimuth by the Enhanced Spectral Diversity (ESD) operator. Subsequently, the coherence estimation was carried out. As suggested in [56], a 7 × 7-pixel coherence estimation window was applied. The post-processing steps for obtaining the final 40 coherence maps included a multilooking by 3 × 1 range/azimuth looks, obtaining a ground range square pixel of 13.25 m for ascending maps and 14.30 m for descending ones; Lee Speckle Filter application in order to reduce speckle noise [86]; and range doppler terrain correction for obtaining the full ground range detected image in geo-coordinates (WSG84), resulting in a pixel spacing of 13.96 × 12.55 m for ascending coherence maps and 13.94 × 14.70 m for descending ones.
The obtained coherence maps were divided into 36 time series dataset maps (18 ASC, 18 DESC), 2 pre-storm maps (1 ASC, 1 DESC), and 2 storm maps (1 ASC, 1 DESC). The time series dataset coherence maps were estimated between 1 June 2016 and 9 February 2018 with a temporal resolution of about a month in order to consider seasonal variability; the pre-storm coherence maps corresponded to the latest image pairs previous to the storm; the storm coherence maps were obtained taking into account those SAR images that temporally included the Emma Storm (Figure 4). The image availability allowed, on the one hand, to generate 12 coherence maps with a temporal baseline of 12 days between 1 June 2016 and 4 March 2017. On the other hand, 28 coherence maps with a 6-day temporal baseline were obtained from 4 March 2017 to 5 March 2018 (Table S1 at Supplementary Materials).

2.7. Coherence Difference Analysis

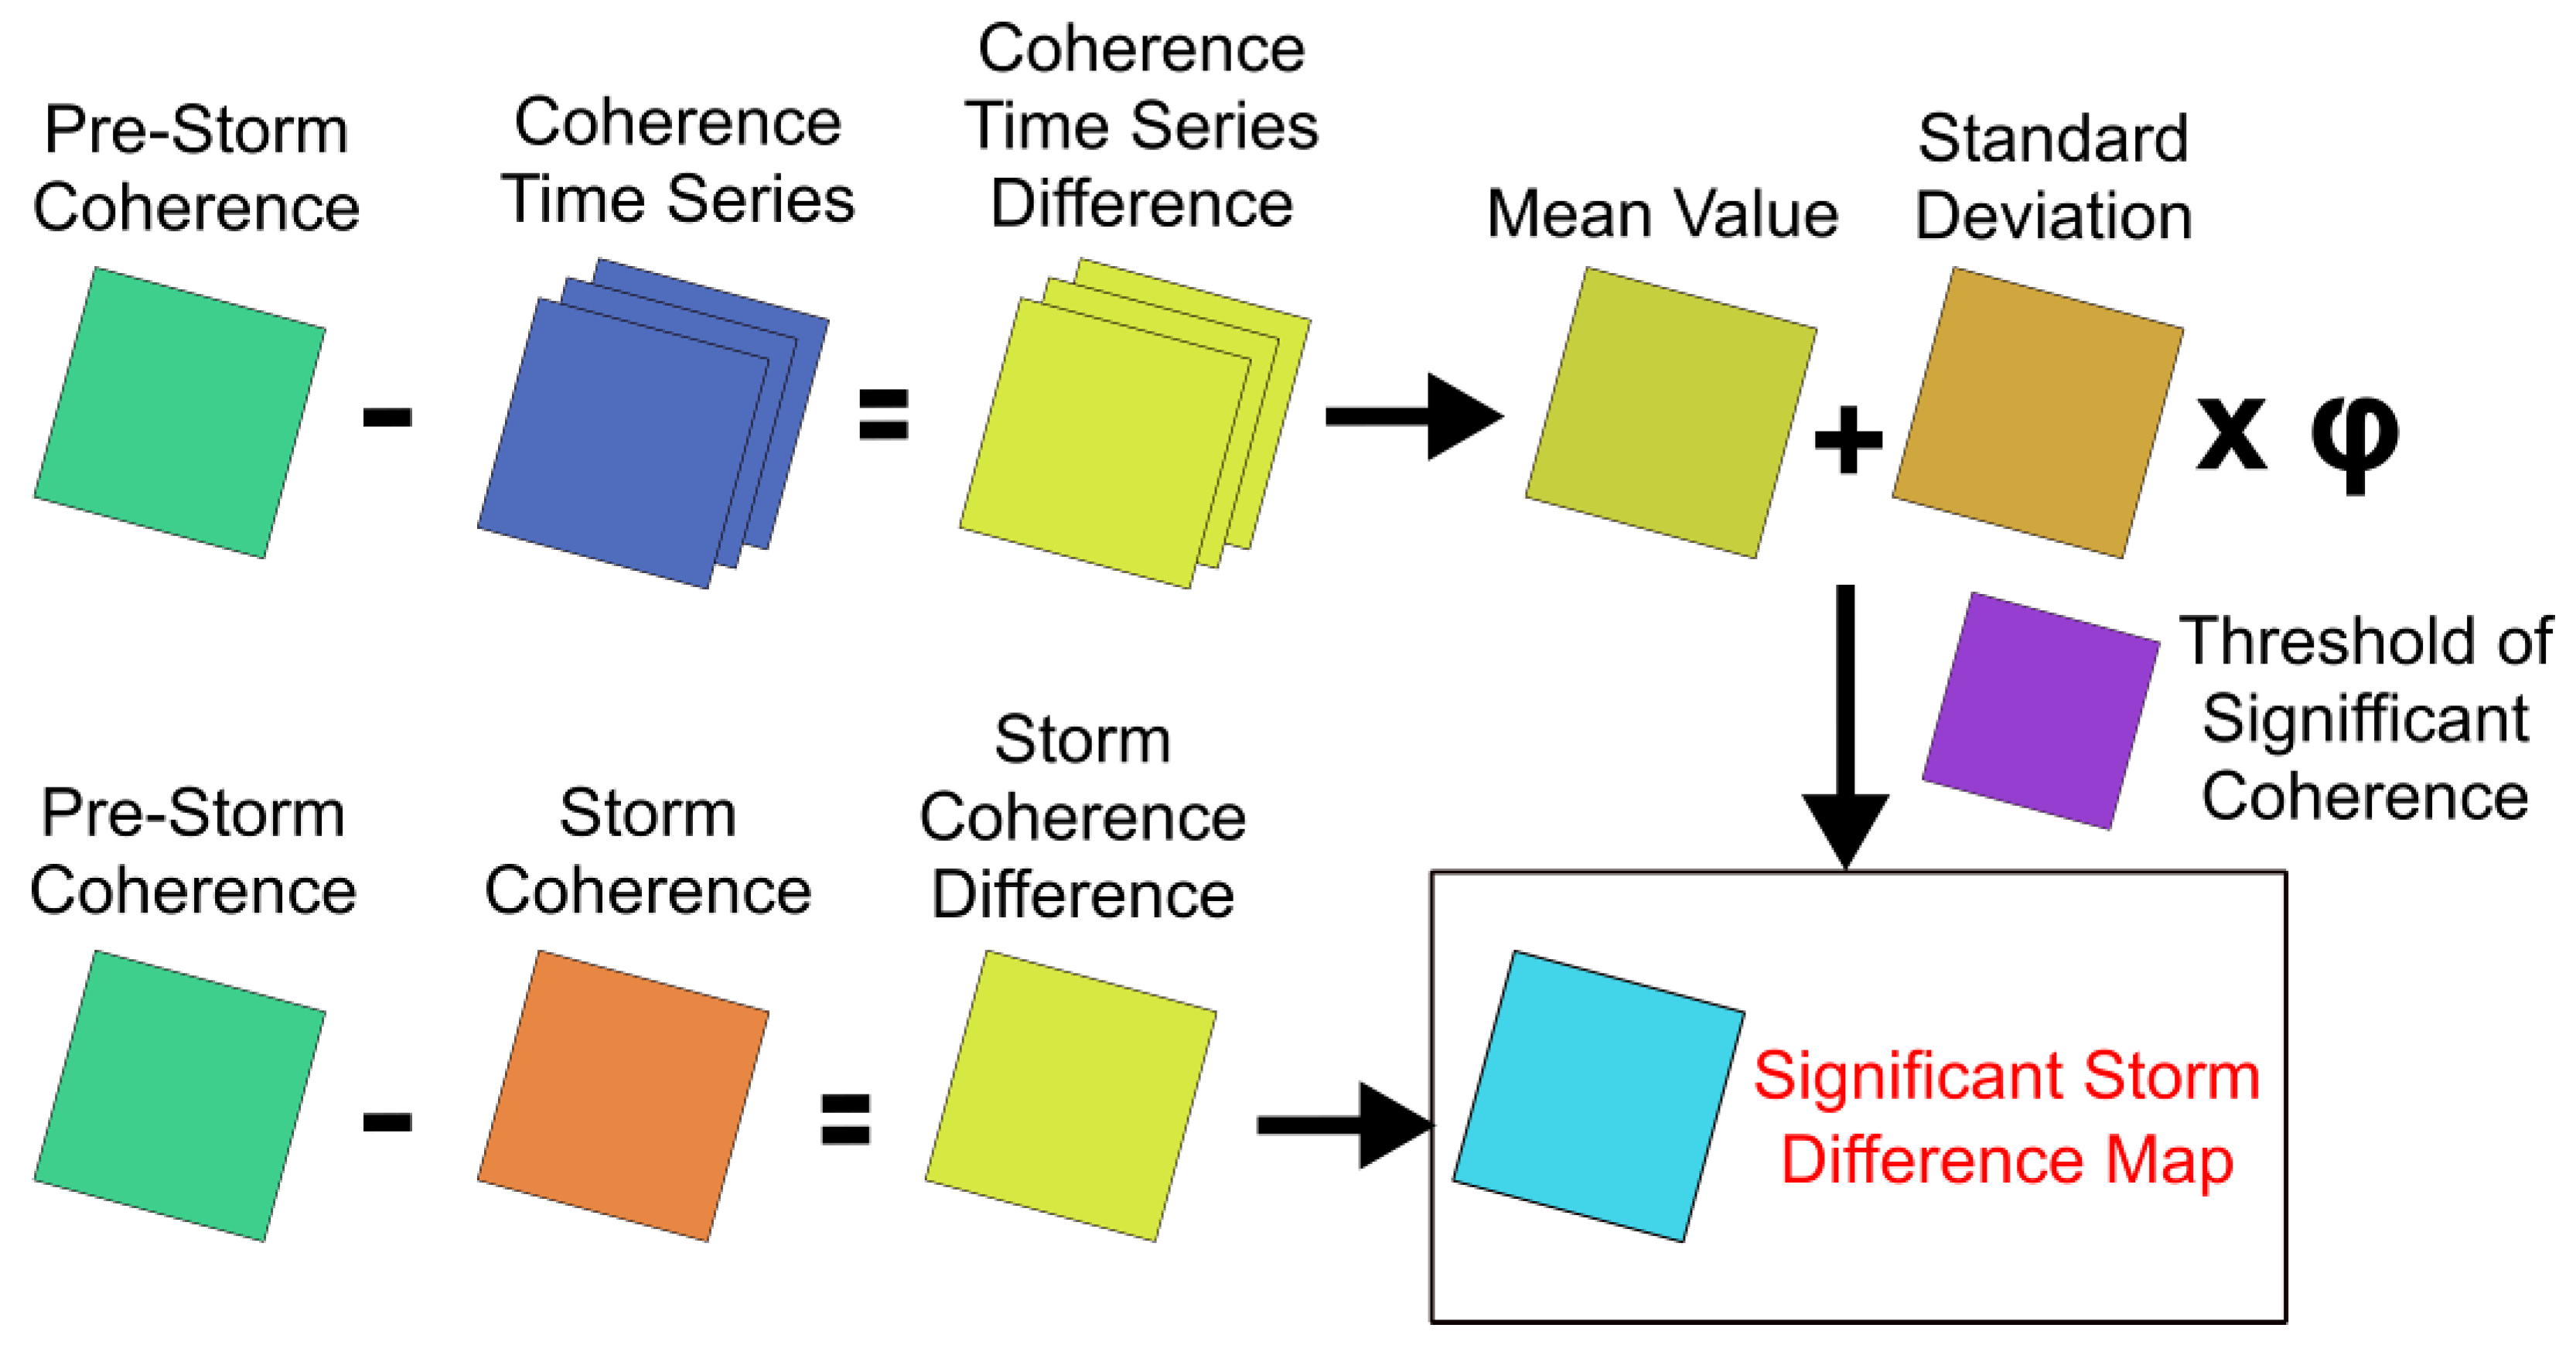
The CDA was conducted following the procedure described in [57,67]. It was based on different band arithmetic operations carried out using the graphical interface of the open-access QGIS v3.24 Software [87] (https://qgis.org/es/site/; accessed on 15 April 2023) for geospatial data processing. As a first step, the difference between pre-storm and storm coherence maps was estimated, obtaining a storm coherence difference map (see Equation (6) and Figure 5).
Subsequently, and in order to obtain a significant ץdiff value attributable to the occurrence of the Emma Storm, a coherence difference threshold approach was carried out [67]. For this purpose, the coherence time series maps (18 ASC/18 DESC) were also processed following Equation (6) by subtracting them from the pre-storm coherence maps. The obtained maps were analyzed in order to estimate the mean and standard deviation values at a pixel scale. Finally, the threshold estimation was made by the following:
γ diff thre = γ diff mean + γ diff std   · φ ,
where γ diff thre represented the coherence difference threshold for each pixel, γ diff mean and γ diff std were the mean pixel value and the standard deviation for the coherence difference dataset, respectively, and φ was a coefficient that represented a weighting factor for standard deviation.
According to [67], it is assumed that coherence difference at each pixel obeys a normal distribution by random surface cover changes. Thus, those pixels where γ diff   was greater than the γ diff thre could be considered to represent significant surface changes due to the storm disaster event. Given the highly dynamic character of the coastal environments, the threshold was estimated for different φ values (2, 2.25, 2.5, 2.75, and 3) in order to find the most suitable one. Finally, the γ diff   images obtained from pre- and post-storm coherence maps were filtered by using the different γ diff thre values, obtaining the storm-affected area.
These maps were subsetted to the area of interest, i.e., the intersection area between ascending and descending images (Figure 2), and filtered by using the Andalusian DEM [88] in order to discard those pixels which exceeded 8 m.a.s.l. (meters above sea level). This procedure was also carried out taking into account only those time series coherence maps (12 ASC/12 DESC) of the year prior to the storm (March 2017–February 2018) in order to analyze differences in the considered dataset time span.

2.8. Method Calibration by CLULC-Optimized Thresholds

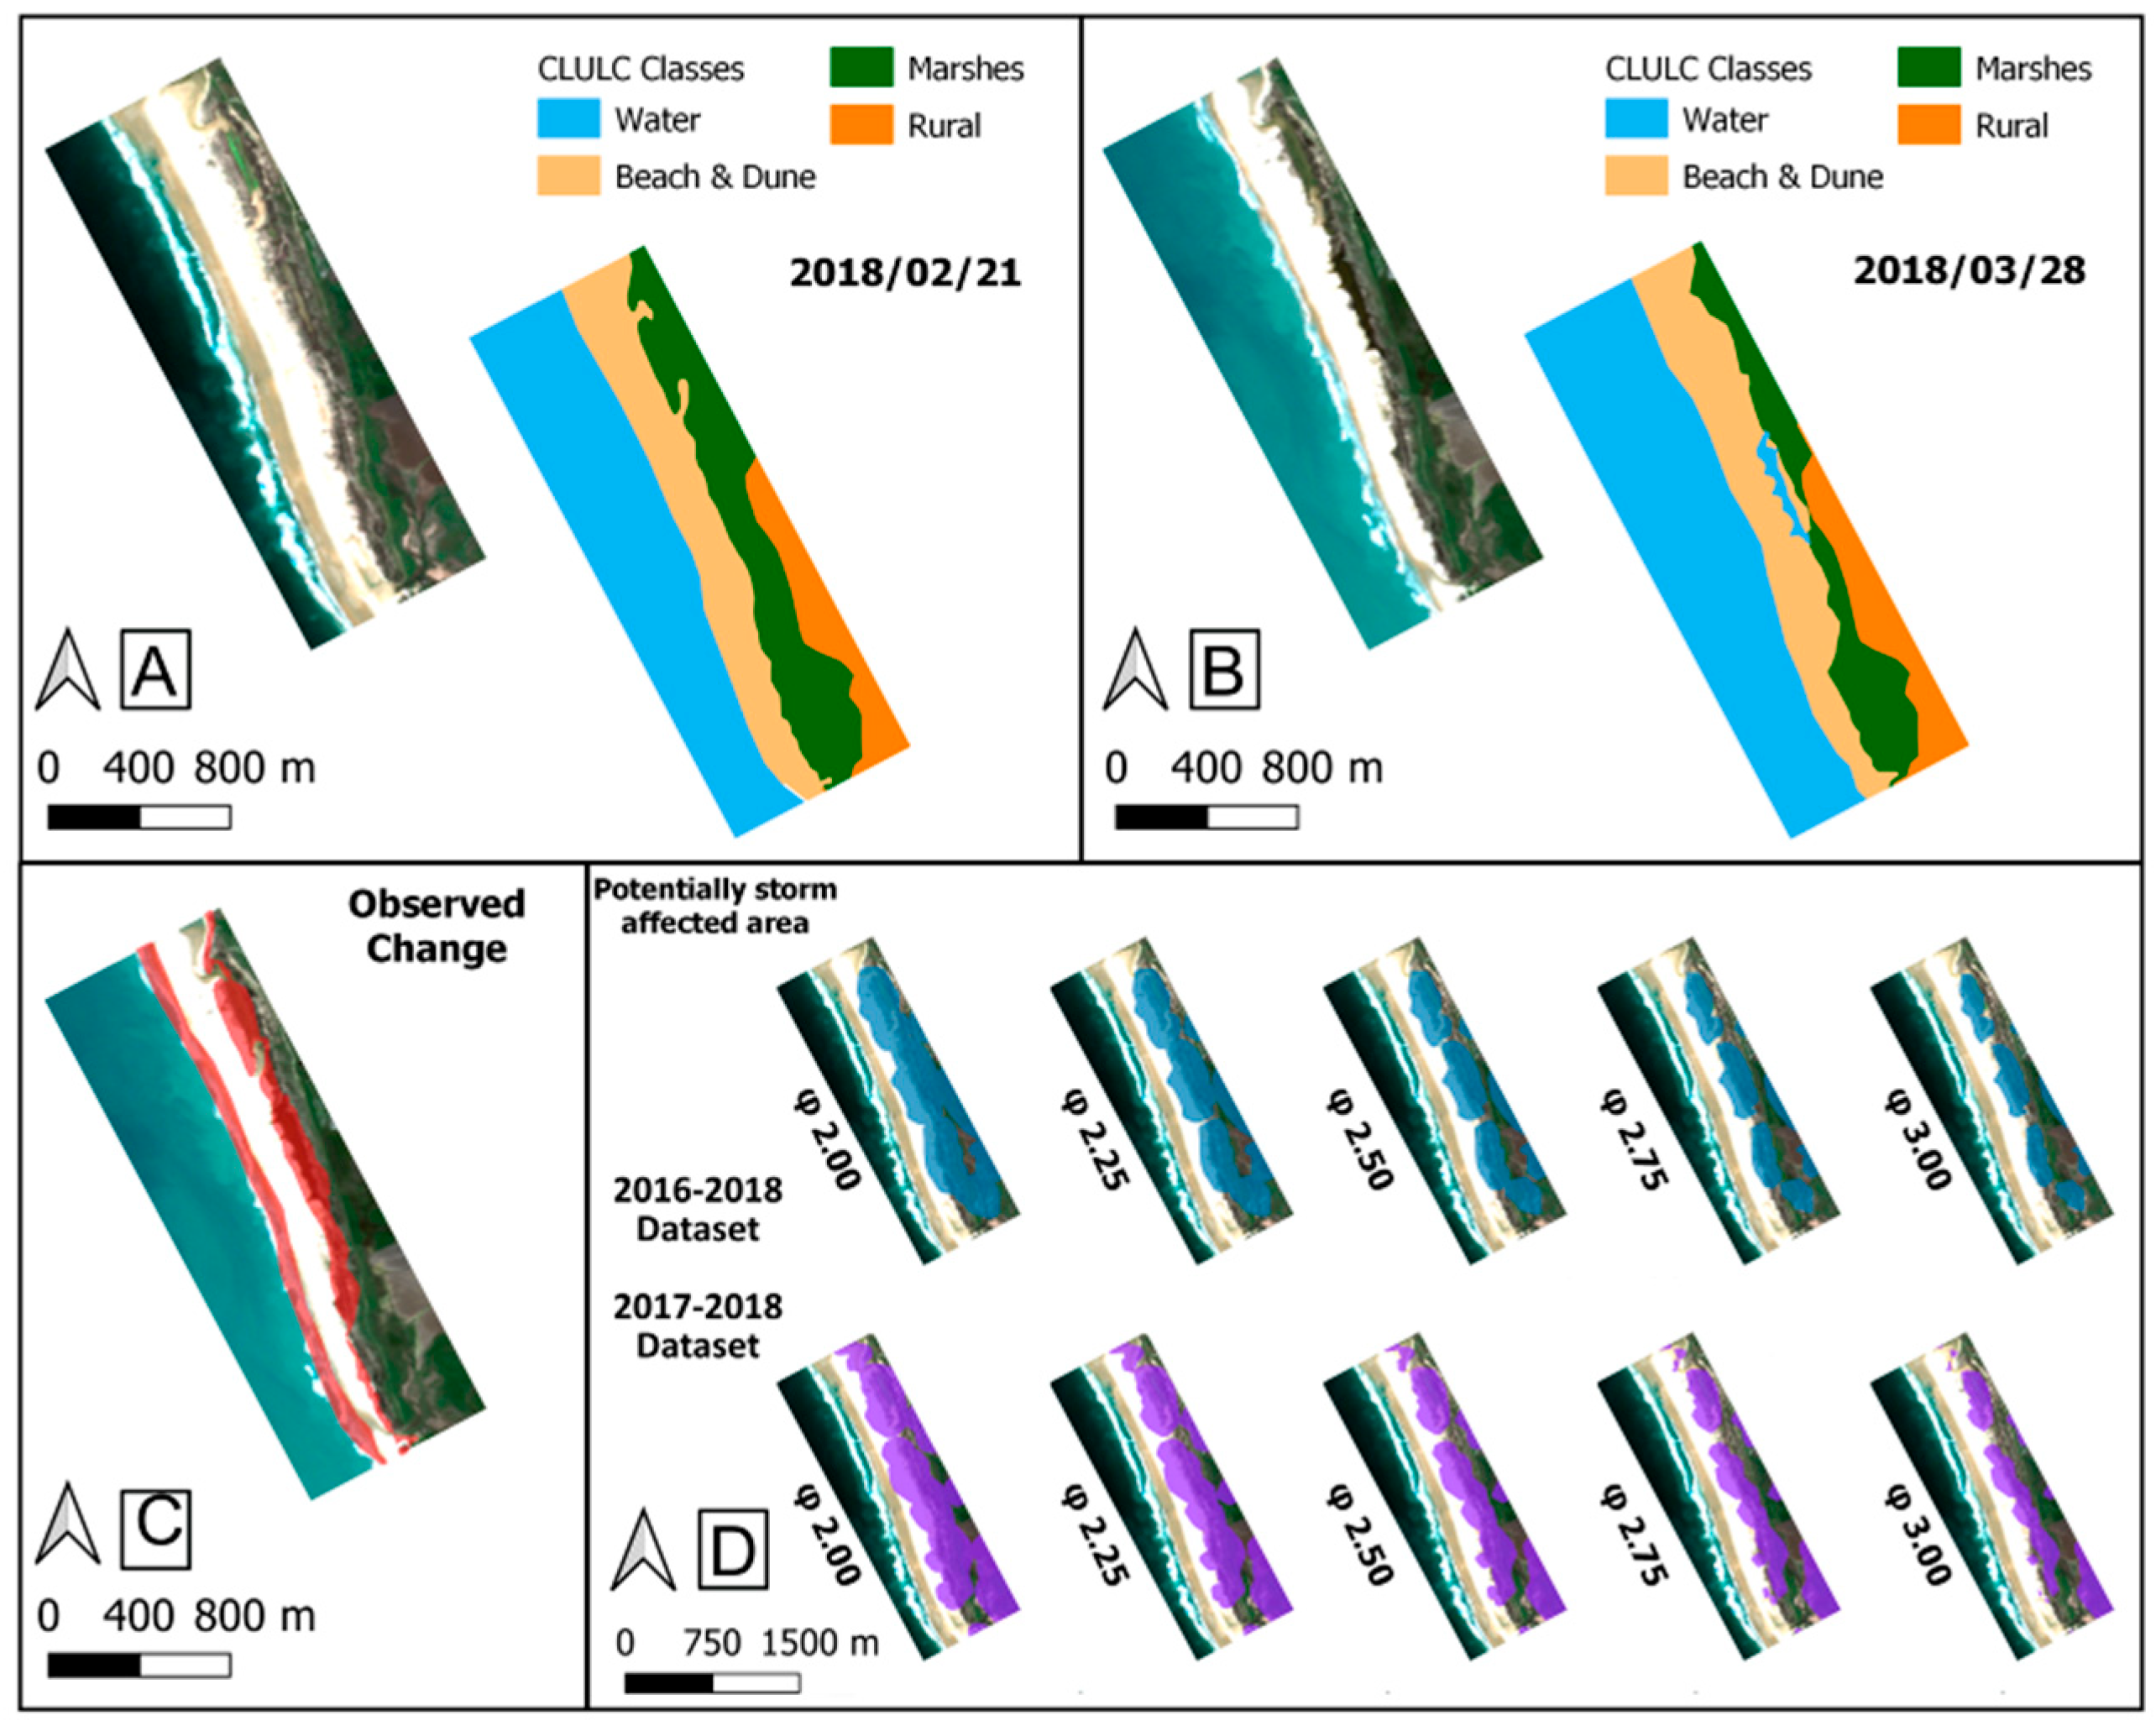
In order to calibrate the CDA for assessing the best-fit threshold (φ) value, a coastal land use/land cover (CLULC) classification was carried out for a test site corresponding to Camposoto Beach, San Fernando (Figure 2). The CLULC assessment consisted of a manual digitization of the different land coverages for pre- and post-storm UAV images and the identification of change areas. Six classes were taken into account based on previous knowledge of the study area: roads and railways, water, beach and non-vegetated dune systems, vegetated dunes, marshes, and rural use. These steps were also conducted using the QGIS v3.24 Software [87].
Subsequently, three skill indexes [89] were used in order to identify the best-fit threshold for each CLULC. The hit ratio (H%) defined as a proxy of agreement between estimated (radar) and observed (optical) storm-affected pixels, was calculated as follows:
H % = Ech     Och Och   ×   100 ,
where Ech ∩ Och represented the affected area accurately estimated by the CDA and Och was the whole observed change area by the CLULC change analysis. Since H% does not take into account over-predicted pixels, the false alarm ratio (F%) was also considered and defined as follows:
F % = Ech / Och Och   ×   100 ,
where Ech/Och were those pixels wrongly estimated by the CDA. Finally, the critical success index (C%) was estimated as follows:
C % = Ech     Och Ech     Och   ×   100 ,
where Ech ∪ Och represented the union of the CDA-estimated affected area and the observed change area by the CLULC analysis. The best-fit φ value for each coastal land use/land cover was taken into account by considering the higher C% value.

2.9. Validation of CLULC-Optimized Method

In order to validate the best-fit threshold value estimation, a CLULC classification was carried out for a second test site corresponding to Conil de La Frontera (Figure 2). This assessment was carried out following the same methodology as proposed for the Camposoto test site and taking into account the S2 dataset images.

2.10. Regional Extraction and Identification of Storm-Affected Areas

Finally, once the threshold values were calibrated and validated, the total storm-affected area was estimated based on the ECLULC dataset [84]. For this purpose, the 47 identified classes for the <8 m surface were recategorized into seven new classes: urban covers, rural covers, inland vegetation, vegetated dunes, beach and non-vegetated dune systems, marshes, and water. As well as for Section 2.8 and Section 2.9., GIS-based tools were implemented by the graphical interface of QGIS v3.24 software [87].

3. Results

3.1. Coherence Difference Analysis

As a first step, the storm coherence difference maps were estimated for both ascending and descending orbit images (Figure 6). Taking into account those pixels filtered by the Andalusian DEM (<8 m.a.s.l.) for the ascending path, the pre-storm coherence showed values ranging from 0.068 to 0.844 with (median = 0.574; Q1 = 0.373; Q3 = 0.769). The storm coherence values were estimated between 0.062 and 0.776 with a (median = 0.151; 25th quartile = 0.093; Q3 = 0.339). The descending orbit maps showed pre-storm coherence values from 0.063 to 0.840 (median = 0.419; Q1 = 0.203; Q3 = 0.665) and storm coherence values ranging from 0.066 to 0.878 (median = 0.167; Q1 = 0.071; Q3 = 0.371). The observed differences in the statistics results between pre-storm and storm maps denote an important decorrelation process between acquisitions. The ascending difference map showed values between −0.294 and 0.716 (median = 0.318; Q1 = 0.031; Q3 = 0.513) while the descending one ranged from −0.452 to 0.557 (median = 0.176; Q1 = −0.120; Q3 = 0.449). The spatial variability of these results showed that urban areas experienced less decorrelation processes than natural environments over coastal zones.
Coherence time series difference was estimated for both ascending and descending pairs, resulting in non-substantial variations. In the first case, the mean difference map ranged between −0.318 and 0.566 (median = 0.123; Q1 = −0.087; Q3 = 0.325) while the standard deviation map ranged between 0.041 and 0.256 (median = 0.127; Q1 = 0.095; Q3 = 0.204); in the second case, the average difference map ranged from −0.392 to 0.491 (median = 0.103; Q1 = −0.127; Q3 = 0.301) while the standard deviation was calculated between 0.033 and 0.298 (median = 0.157; Q1 = 0.110; Q3 = 0.229). The threshold maps were obtained taking into account the five different values of φ (2, 2.25, 2.5, 2.75, 3) (Figures S1 and S2 at Supplementary Materials).

3.2. Calibration of Coastal Disaster-Affected Areas by CLULC-Optimized Thresholds

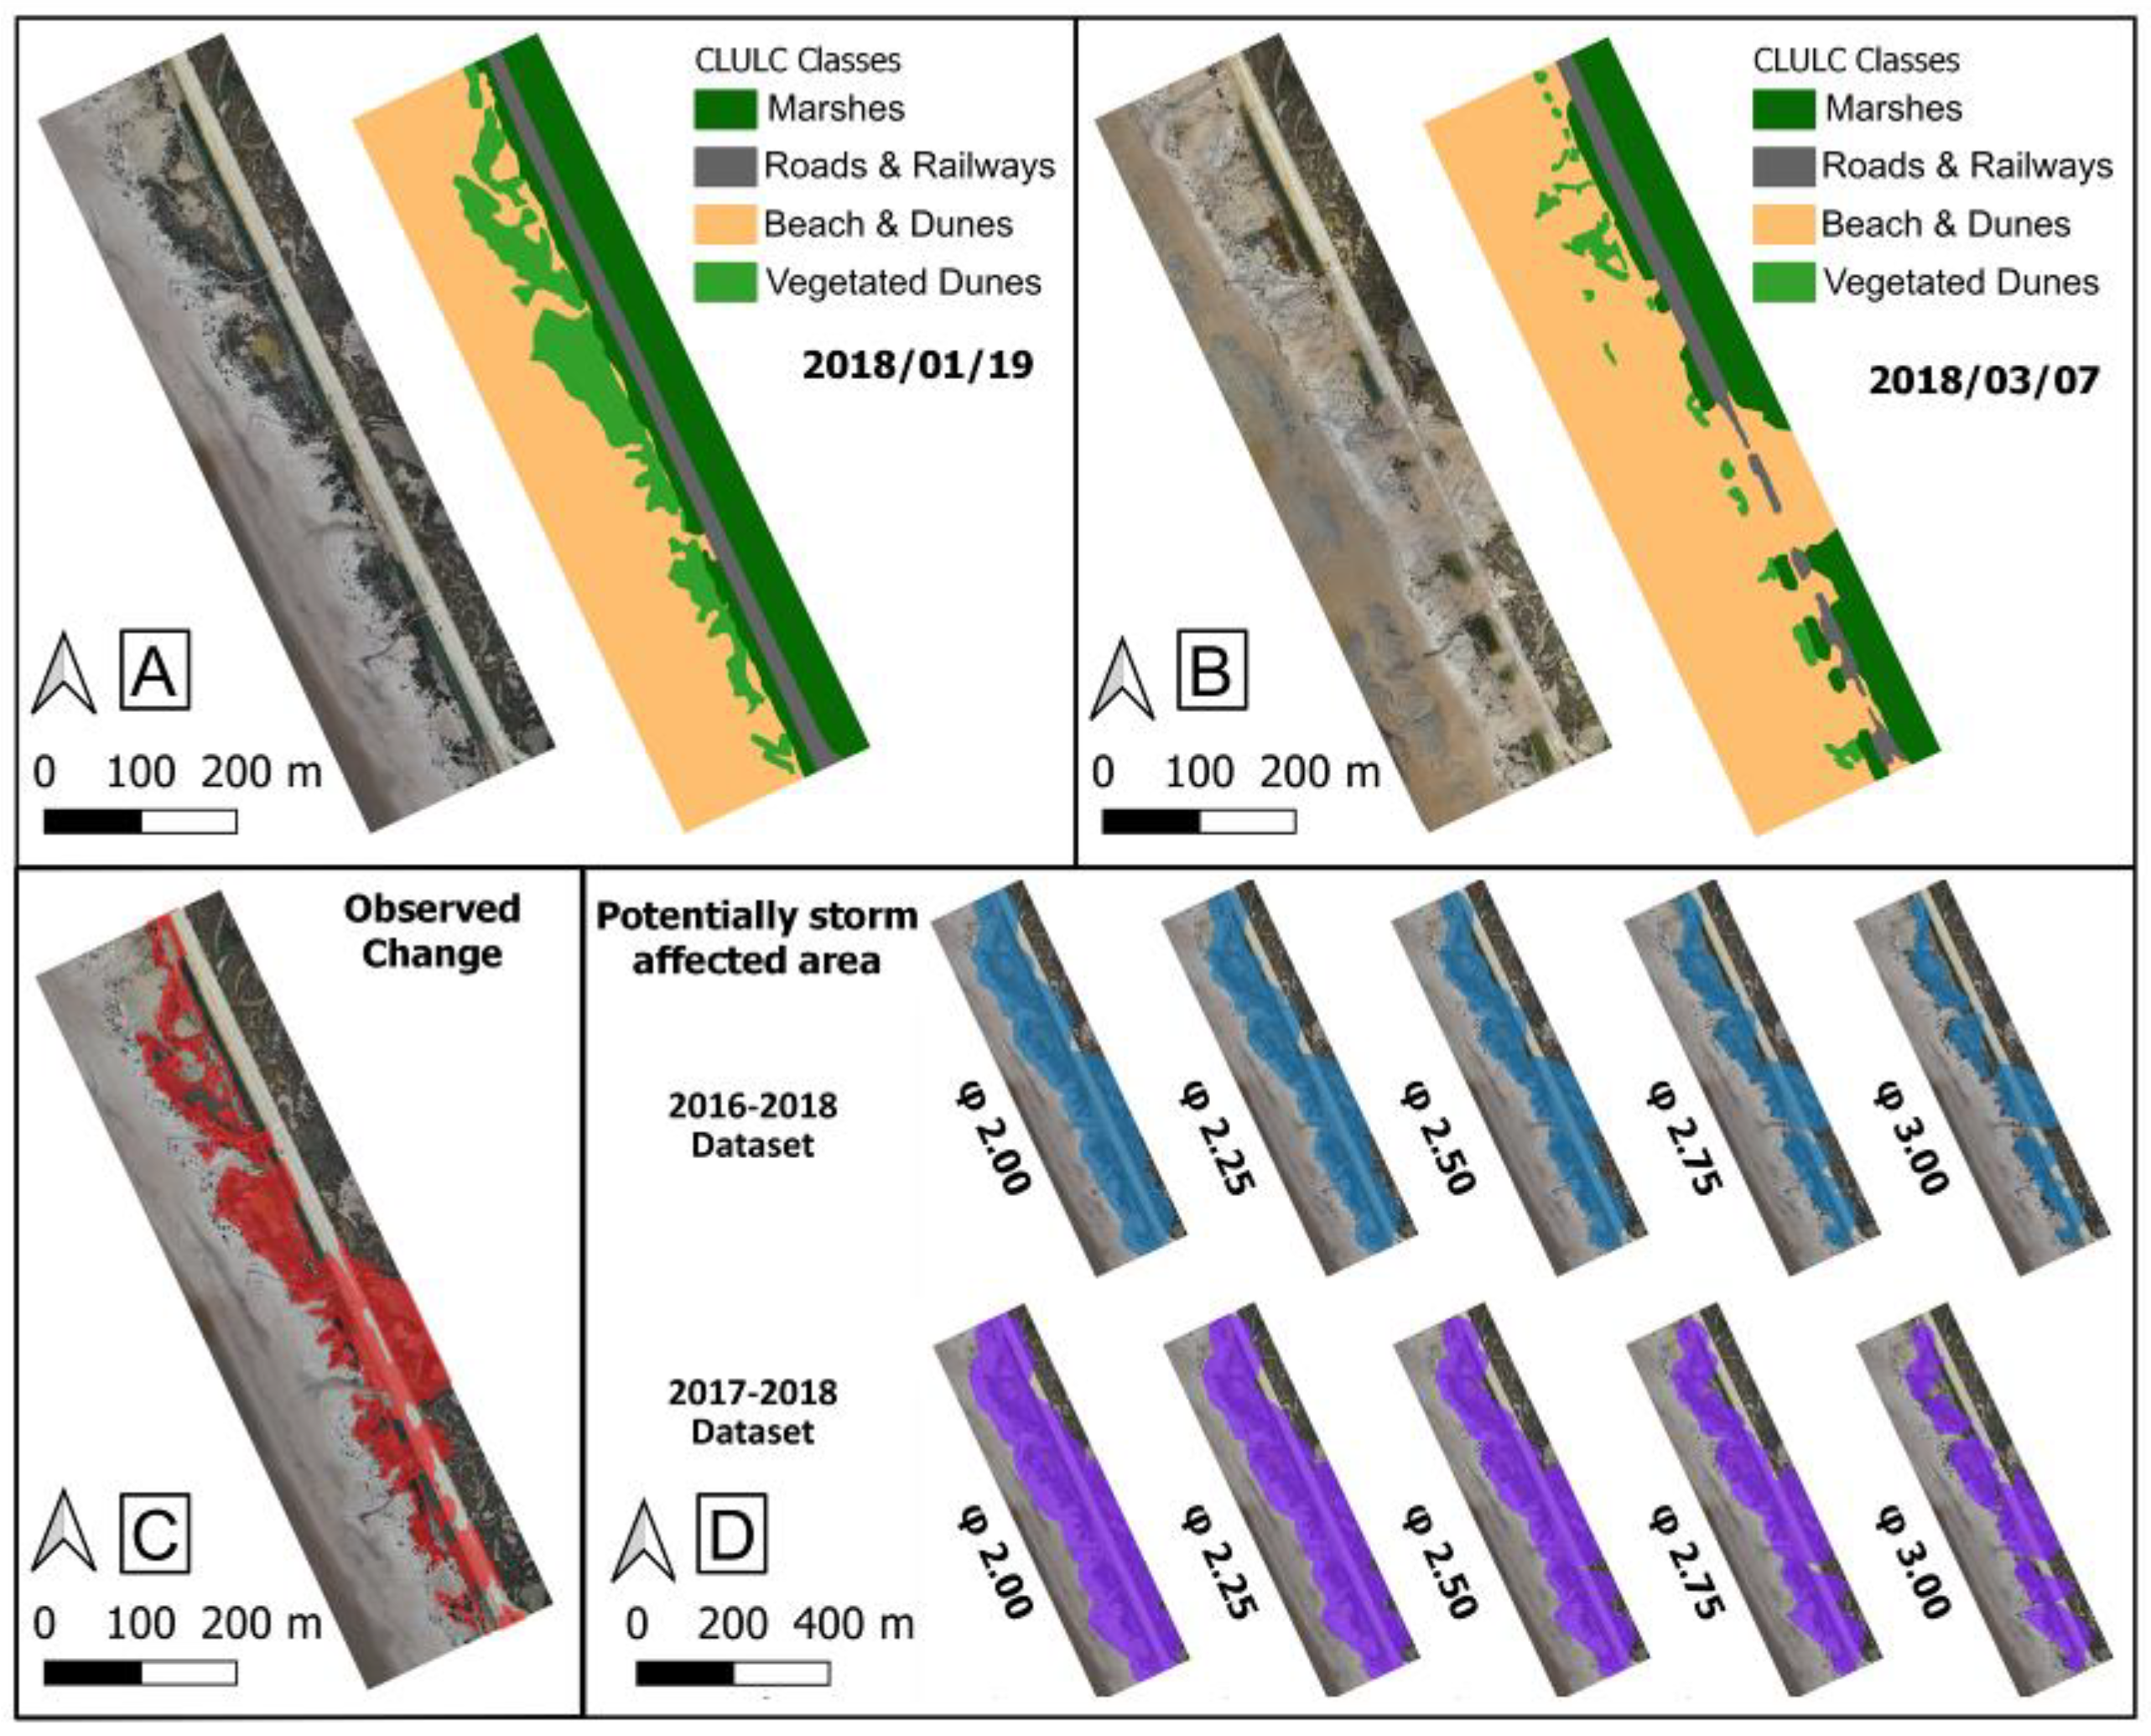
The CLULC classification for Camposoto test site was carried out taking into account the pre- and post-storm UAV images (Figure 7). The total storm-affected area based on UAV images was estimated as 7.54 ha, represented by marshes to non-vegetated dunes (2.36 ha), roads and railways to non-vegetated dunes (1.22 ha), and vegetated dunes to non-vegetated dunes (3.96 ha). These changes were associated to dune overturn and sand wash-over fans processes, as described in [80]. The coherence difference thresholds were applied in order to identify those pixels potentially affected by the Emma Storm over the test site. Once the storm difference maps were filtered by the Andalusian DEM, the ascending and descending orbit images were merged. In this way, 10 maps of the potential storm-affected area were obtained according to the different φ values. Potentially storm-affected area for the 2016–2018 dataset ranging from 8.14 ha (φ = 3) to 33.21 (φ = 2); for the 2017–2018 dataset, it was calculated between 9.76 (φ = 3) and 35.58 (φ = 2).
The performance assessed by using a constant threshold showed an H% index ranging from ~65% to ~83% for the 2016–2018 dataset. The C% index diminished due to the overprediction of potentially affected areas fluctuating between ~27% and ~53%. The C% indexes were at maximum when the overprediction was reduced by using the maximum threshold limit (φ = 3). For the 2017–2018 period, a constant threshold of φ = 3 provided slightly worse estimations than for the larger period.
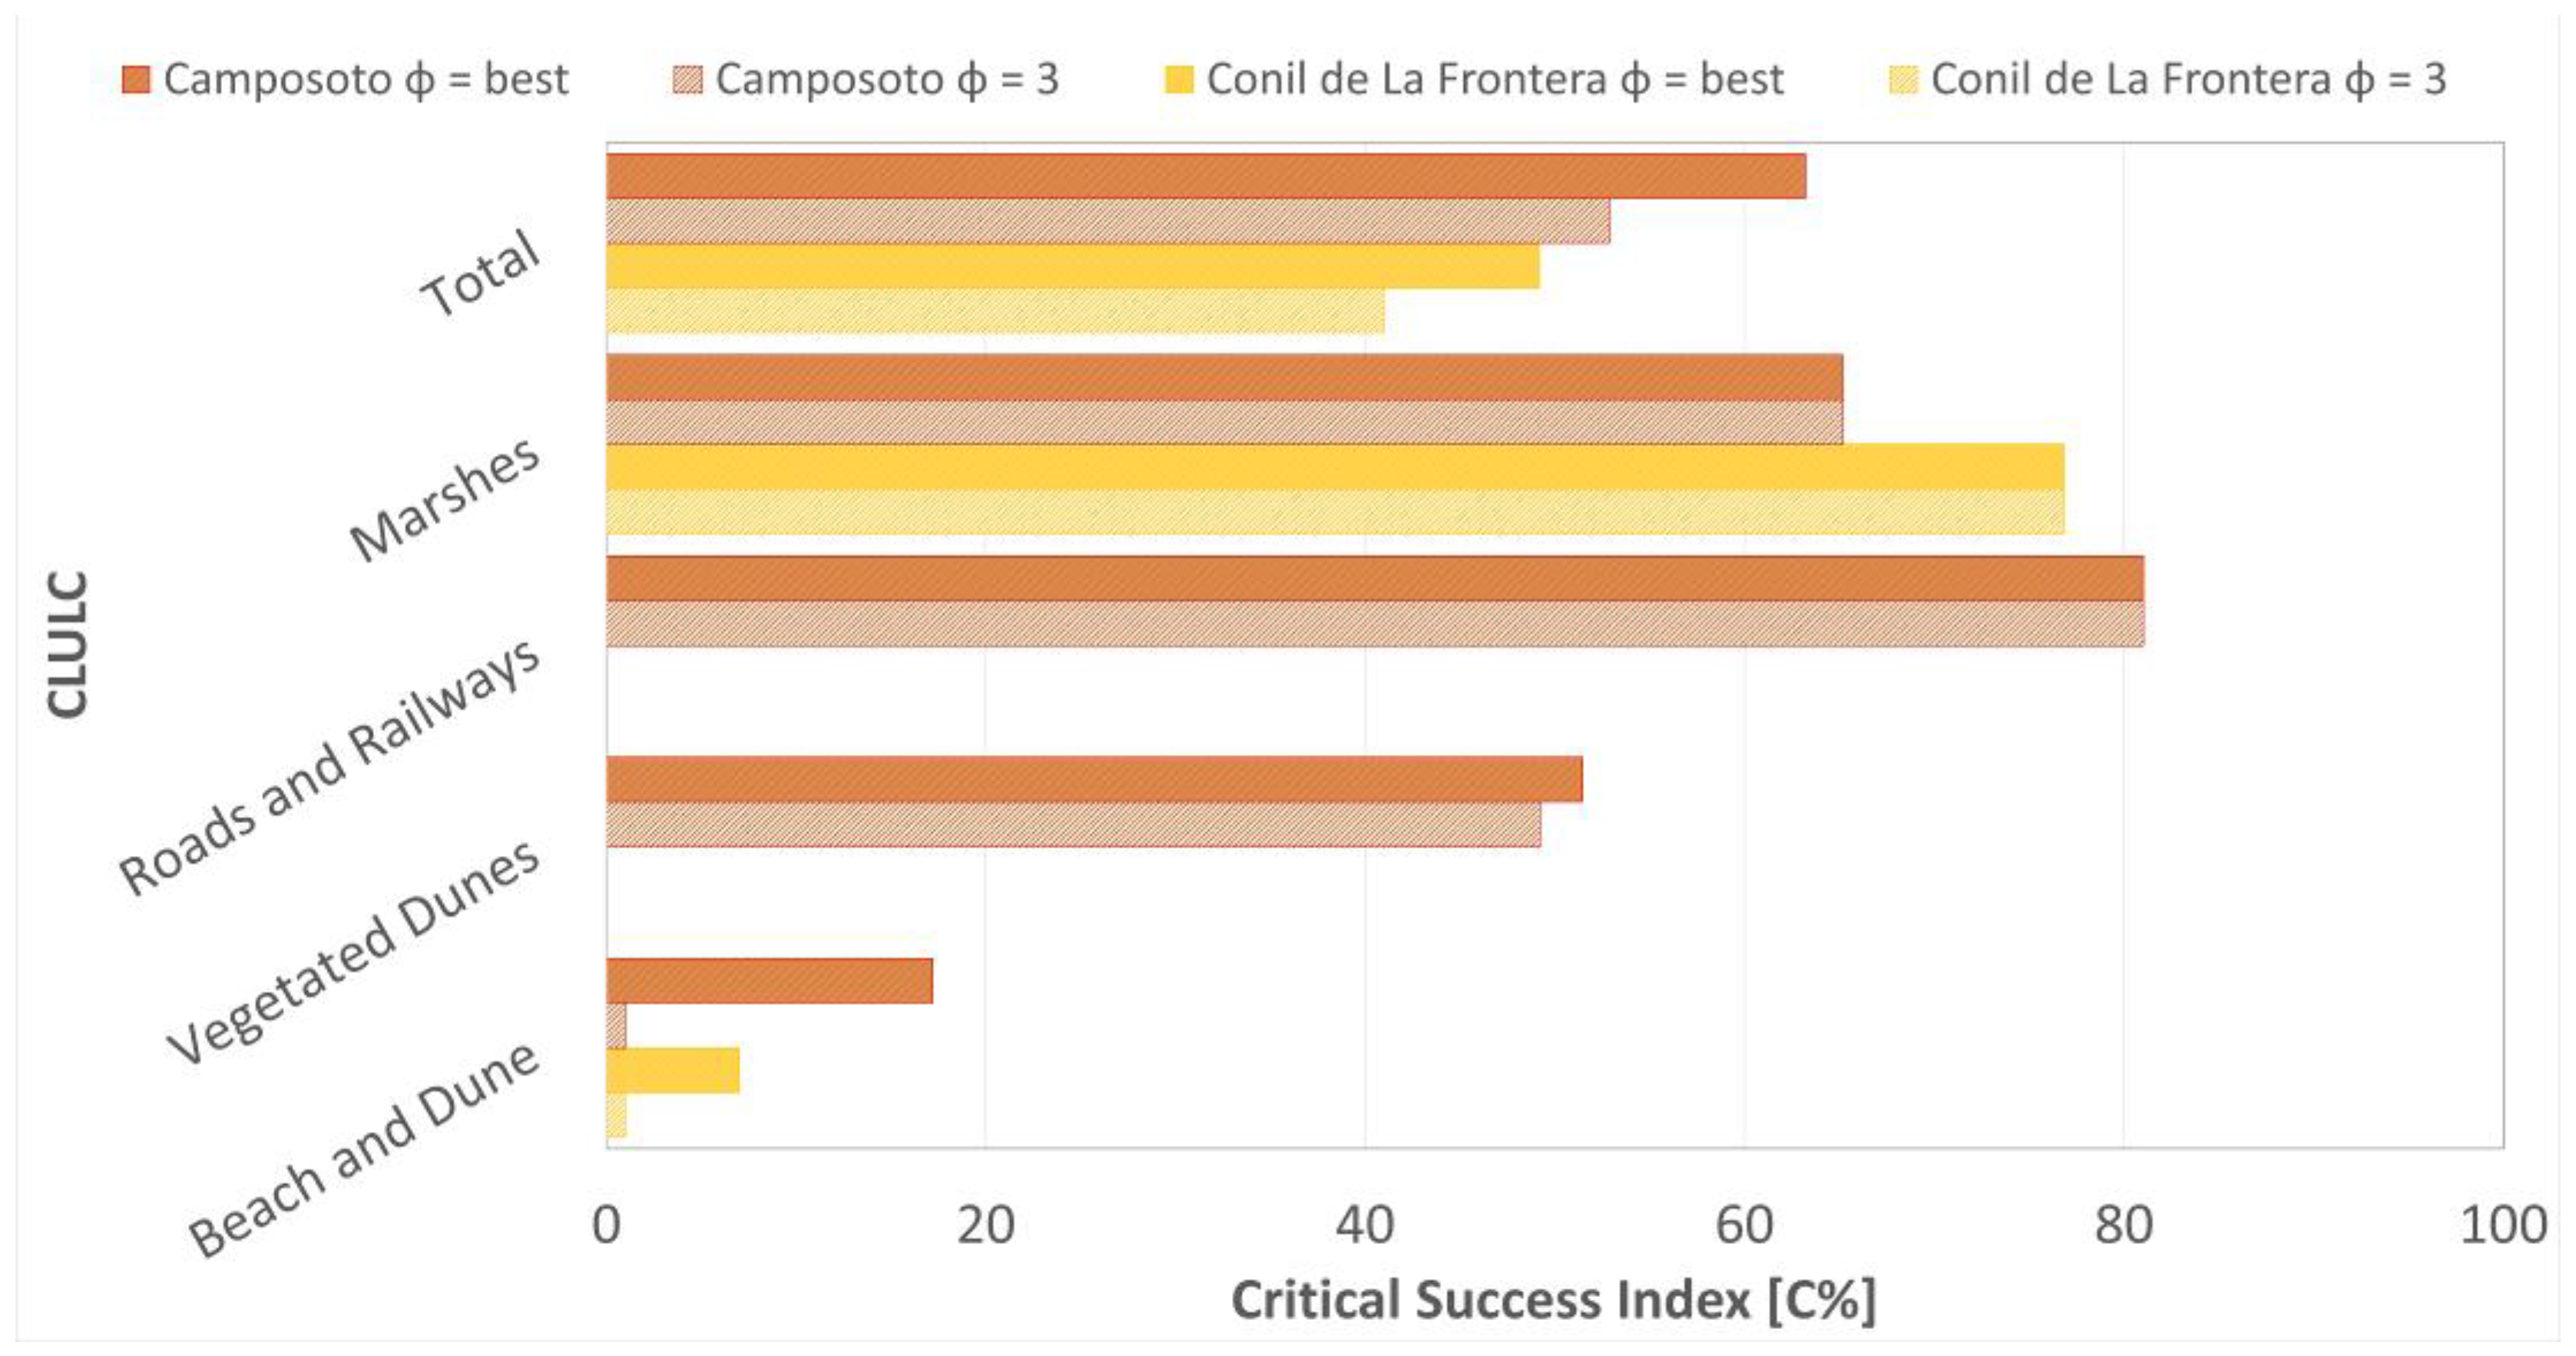
In order to optimize the threshold estimation by considering the different CLULC classes, skill indexes were estimated for each CLULC by taking into account the pixel classification at the pre-storm image (Table 1). Thus, beach and non-vegetated dunes, and marshes best-fitting indexes were estimated with the threshold φ = 2 (C% = ~17%) and φ = 3 (C% = ~65%), respectively. The vegetated dune class showed a best-fitting threshold at φ = 2.5 with a C% index of ~51%, while the roads and railways class showed a C% value of ~81% at the φ = 3 threshold.
These different results were used for selecting a best-fit-φ value for each CLULC class. The assessment of storm changes detection using space-varying threshold indicated a hit ratio of ~79% and a relative ~33% diminish in false alarms, resulting in a critical success index of ~63% being estimated for the Camposoto test site (Table 2). These results suggest a better fit compared with those overall results obtained by applying a constant φ value for the entire test site.

3.3. Validation of Coastal Disaster-Affected Area Detection Method

In order to validate the CLULC optimization method, it was evaluated in a different test site (Conil de la Frontera). The CLULC classification for the Conil de la Frontera test site was derived from pre- (21 February 2018) and post-storm (28 March 2018) S2 images (Figure 8). A total storm-affected area of 37.36 ha was estimated. The observed changes were represented by beach and non-vegetated dune to water (17.93 ha), marshes to water (3.59 ha), and marshes to beach and dunes (15.84 ha) classes. These changes were associated to erosion and dune overturn/sand wash-over fans processes as described in [73]. Based on coherence difference thresholds, the potentially storm-affected area was estimated to range from 36.27 ha (φ = 3) to 108.01 ha (φ = 2) for the 2016–2018 dataset; meanwhile, for the 2017–2018 thresholds it was calculated between 52.88 ha (φ = 3) and 109.38 ha (φ = 2).
The performance assessment showed H% values between ∼50% and ∼67% for the 2016–2018 dataset according to different φ values. However, C% values were estimated ranging from ∼41% to ∼31% due to the overprediction of potentially affected areas. Once again, those storm-affected area maps obtained by a φ = 3 had the better fitting, according to the observed changes, and the 2017–2018 showed worse estimations than the aforementioned period.
Taking into account the individual estimation for each CLULC class, the beach and non-vegetated dune best-fit measure was associated to a φ = 2 with a 7% value; for those changes observed over marsh areas, the critical success index ranged from ∼36% to ∼77% with a maximum fitting for φ = 3 (Table 1). Assuming these threshold values, the skill indexes were also estimated, obtaining an H% value of ∼65% and a relative ∼17% diminish in false alarms, resulting in a C% value of ∼49% (Table 2). These results suggest a successful validation of the previously presented estimations at the Camposoto test site.

3.4. Regional Assessment

The best-fit thresholds obtained from the test sites calibration and validation steps were applied into the seven classes obtained by the ECLULC re-categorization. Emerging from previous results, φ = 2 was considered for beach and dune areas, φ = 2.5 for vegetated dunes, and φ = 3 for urban covers and marsh areas. For those classes not represented at the test sites, their φ values were considered, taking into account the surface characteristics. Based on coherence temporal decay of vegetation covers [57], for rural areas and inland vegetation, φ = 2.5 was considered; for water surfaces, φ = 2 was considered because they are naturally incoherent areas due to their great temporal decorrelation [87].
Thus, a total storm-affected area of 7142 ha was identified, representing ∼30% of the total studied area (Figure 9). Marshes and vegetated dunes showed ∼50% of their total surface under storm-affected conditions; beach and dunes (∼42%), inland vegetation (∼30%), and rural (∼20%) covers followed in importance; urban covers and water surfaces showed <8% of their total surface affected.

4. Discussion

This paper presents a novel coherence difference analysis method for monitoring disasters in coastal areas using repeat-pass interferometric S1 data. Remote sensing data have been widely recognized as a valuable tool for supporting disaster response, as they can help assess environments that are inaccessible or dangerous to survey in the aftermath of a disaster [22]. Based on estimating coherence differences as an indicator of decorrelation processes caused by an extreme weather event, the proposed method enables the detection of coastal storm-driven changes against the Emma Storm that occurred in late February/early March 2018 for a study area located on the Atlantic coast of Cadiz in southwestern Spain.
The coherence difference analysis involved comparing pre- and post-storm SAR coherence images. It was based on the assumption that coastal hazards such as floods and erosion caused by extreme waves and total water levels can lead to a loss in coherence (decorrelation) due to changes in the surface backscattering between SAR images. Noise and geometric decorrelation parameters were considered non-significant. The noise decorrelation was considered to be negligible as all the SAR data used belonged to the same sensor (S1). Geometric decorrelation was also excluded as the perpendicular baseline of the InSAR systems (refer to Table S2 at Supplementary Materials) ranged from 9.07 m to 182.49 m, which was significantly smaller than the critical baseline of S1 estimated at approximately 5000 m [90].
Therefore, the loss of coherence detected by the proposed method was exclusively attributed to temporal decorrelation. As stated in [74], this process occurs randomly during disaster events, which allowed us to identify pixels potentially affected by the Emma Storm. Temporal decorrelation resulting from changes in the structure and dielectric properties of surface scatterers has been documented in various studies across different applications [91]. In this study, these changes were mainly observed through three significant alterations in the geomorphological and landscape features of the test sites: shoreline retreat, dune overturn, the generation of wash-over fans, and flooding in marsh areas. These storm impacts on coastal areas have been previously documented by several authors [92,93,94], including the province of Cádiz in Andalusia [79,95,96].
The short revisit time of the S1 satellite, ranging from 6 to 12 days, resulted in lower temporal decorrelation between image pairs, leading to the generation of more consistent coherence maps. It avoids the increase in temporal decorrelation due to higher temporal baselines documented in InSAR studies [97]. Generally, higher coherence values in the pre-disaster dataset lead to a better assessment of disaster-affected areas due to larger differences with the post-disaster coherence estimates. In this study, the pre-storm coherence maps had significantly higher values than the storm maps, as shown in Figure 6, improving the quality of the disaster assessment.
The SAR approach presented in this study has advantages over optical remote sensing methods in terms of its capability for all-day and all-weather operability, making it essential for rapid mapping of storm-affected areas, a key information needed in the response and recovery phases of coastal risk disasters. For instance, the high cloud coverage in the post-storm S2 images until March 28 made it unaffordable to detect rapid storm changes based on optical imagery (Figure 10). In contrast, the coherence difference analysis presented in this study allowed for storm impact detection using SAR data with a shorter temporal delay after the event.
On the other hand, due to the long elapsed time between pre- and post-storm optical images, the assessment of land cover/use changes could only be carried out with a temporal delay of about one month after the Emma Storm, which may have limited the detection of early storm impacts in the Conil de la Frontera test site for method validation. As a result, the estimated coherence difference values for both test sites may have varied due to differences in elapsed time between pre- and post-storm optical and UAV images.
A major time gap between the disaster event and the image acquisition could lead to a higher number of false alarm estimations as the method may have identified an area that has already undergone natural recovery processes of a coastal environment. This could result in false alarm estimations for areas that were actually affected by the storm, as indicated by the method. In addition, variations in surface response to radar signals, caused by changes in surface coverage or dielectric properties, may have occurred and not been identified in the comparison with optical data. All these aspects must be considered in order to develop robust and fast damage detection systems for the assessment of post-disaster impacts and the identification of affected areas.
The proposed method ultimately enabled the identification of storm-affected areas at a regional scale. This approach, when combined with high-resolution and large-scale CLULC classification, proved to be extremely useful for assessing compound disaster events, such as marine, fluvial, runoff, and flash floods [98]. Furthermore, the results of this study demonstrated that the coherence difference analysis conducted using an average pixel size of approximately 14 m produced reliable estimates for regional-scale assessments.
The assumption that the coherence difference at each pixel of a time series dataset obeys a normal distribution by random surface cover changes was verified for this work. Based on this and considering coastal areas as highly dynamic environments, thresholds were estimated for φ values ranging from 2 to 3. These weighting factors represented those pixels exceeding the 97.7% and the 99.9% of the variability of the time series dataset analysis, respectively. This approach is novel compared to previous studies, which only used a unique weighting factor (φ = 3) for threshold estimation [57,67]. Applying the same threshold for the entire test site showed critical success indexes ranging from ∼27% to ∼53% for both test sites. However, estimating an individual threshold-weighting factor for each coastal land/use land cover improved the overall method accuracy by at least 19%. This optimization in threshold estimation is another novel aspect of this paper, contrasting with previous studies that only considered an individual threshold value for the entire assessed area [57,67].

4.1. Regional Assessment

The calibration and validation steps ensured that the same best-fit thresholds were identified for both test sites, indicating the robustness of the proposed method. However, the results for Camposoto were generally better than for Conil de La Frontera, which could be attributed to the difference in time span between the UAV and S2 image acquisitions. Overall, the CLULC optimization method improves the critical success index (Figure 11). For all the land use/cover classes, the C% values estimated using the best-fit threshold were equal to or better than those obtained by considering a single threshold value of φ = 3 for the entire test site. Non-vegetated dunes and beaches, as well as vegetated dunes, represented the greatest improvement. In addition, although the method was not evaluated for urban areas, it was highly accurate for temporarily stable surfaces, such as the road areas observed in Camposoto.
The temporal coverage of the dataset also introduces variations in the results. The dataset covering the period from 2016 to 2018 reported a 16% improvement in the final C% value compared to the dataset covering 2017 to 2018. This phenomenon can be explained by the fact that a longer time period of SAR image coverage produces a dataset with greater variability. Therefore, in order to exceed the detection limit set by the threshold method, the decorrelation triggered by the storm must be more significant. This assumption is supported by the fact that the improvement between the 2016–2018 dataset and the 2017–2018 dataset was mainly focused on reducing false alarms (Table 3). Thus, in highly dynamic environments, coherence map datasets with greater variability tend to generate more accurate significant coherence threshold estimations. Furthermore, both test sites showed better estimates for the 2016–2018 period, which is another indicator of the robustness of the proposed method.

4.2. Method Limitations and Advantages

In contrast to the higher accuracy of coherence analysis obtained by other authors [57,62,67], the assessment of storm change detection method reveals a lower accuracy. The following paragraphs will discuss important issues related to the accuracy assessment of the results presented in this paper.
Coastal areas are unique environments that are highly dynamic and fragile [99]. They undergo changes on daily and even hourly timescales due to tidal fluctuations. This temporal variability leads to a limitation of the coherence analysis assessment. In highly dynamic environments, such as coastal areas, low correlation values are expected in time series datasets. Previous studies have suggested that low InSAR coherence values are anticipated in active dune systems [100]. Therefore, it becomes challenging to differentiate decorrelation caused by storms from that caused by natural variability.
The reason for our method’s miss-estimation of the observed shoreline retreat as a storm-affected area could be attributed to the constant decorrelation of the beach areas even in images not affected by storm conditions. This is supported by the low skill indexes obtained for the beach and dune classes. Additionally, the significantly better accuracy obtained for the marshes and urban covers, which are more stable, further reinforces this hypothesis. It is important to note that some urban areas identified as storm-affected in the regional analysis may have exhibited coherence changes due to precipitation and not necessarily related to coastal hazards. This is a potential weakness of the regional assessment of disaster-affected areas.
Despite the decrease in accuracy, the coherence analysis method proposed in this study using S1 data has several advantages for monitoring disaster-driven impacts on coastal areas. As mentioned previously, radar sensors can operate under all-day and all-weather conditions, providing a greater operational capability compared to optical sensors or monitoring techniques based on field surveys or UAV flights which may be limited by weather conditions [101].
Additionally, the S1 mission offers the benefit of providing free-access and high-resolution data. Its most significant advantage is its great temporal coverage, with a short revisit time of 6 days. This enables almost immediate SAR acquisitions for pre- and post-disaster scenarios, as well as subsequent days, whereas the time span for optical assessment is considerably longer.
An additional advantage of this approach is its ability to generate an automated assessment for rapid post-disaster emergency relief. Once a temporal dataset has been processed and threshold values have been adjusted for each present CLULC, any study area can be monitored through automated procedures supported by the 6-day availability of S1 data. The advantages of automatic approaches for disaster monitoring have been studied in various environments and for different hazards [102].
Although this technique has been extensively used for monitoring diverse natural hazards, there is very limited evidence for its use in coastal areas, particularly in beach/dune systems. Most InSAR coherence assessments related to dune systems are focused on desert regions [59,60,100]. Similarly, the few studies that have applied coherence analysis to coastal areas are related to coastal wetlands. For example, [103] classified the water coverage of the Liaohe Delta marshes in China, and [41] assessed changes in wetland environments of the Yellow River Delta, China. The novelty of this paper lies in proposing a method that can be widely used in a non-exploited environment such as coastal areas.
The advantages mentioned above demonstrate that the proposed method is a rapid disaster change detection system with a high level of automation and low operational cost. The main advantage of this method is its ability to assess the impacts over extended and/or remote areas where natural and cultural assets could be affected by geo-hazards [104,105] as well as for critical urban coastal areas.

5. Conclusions

This paper presents a novel approach for monitoring disasters in coastal areas using interferometric SAR data. The proposed CLULC-optimized method was based on the coherence decorrelation processes triggered by an extreme coastal storm event. For this purpose, the Emma Storm, a severe coastal storm that affected southern Spain in 2018, was chosen as case study.
The short revisit time (6 days) of S1 platform resulted in the generation of consistent coherence maps. Moreover, its all-day/all-weather operability provided a significant improvement compared to the capabilities of optical data and even UAV data when assessing the Emma Storm impacts. The method enabled the assessment of disaster changes with a time lag of 2 days after the storm occurrence, in contrast to the 25-day delay of optical data and addressing the limitations of operability faced by UAV field surveys in post-disaster landscapes.
The CLULC optimization improved the overall performance of the method by reducing the overprediction of potentially affected areas without affecting the hit ratio index. Thus, the false alarm ratio diminished by 33% and 17% for Camposoto and Conil de La Frontera test sites, respectively. At this point, calibration and validation steps ensured the robustness of the method. Moreover, considering a larger coherence dataset (2016–2018) improved the method accuracy by 16% by including a greater temporal variability and also reducing the overprediction scenarios.
Finally, the proposed method showed a good performance in Camposoto, with skill scores of hit and false alarm ratios of approximately 80% and 20%, respectively, for the 2016–2018 dataset. In Conil de La Frontera, these values were and 65% and 45%, respectively. The proposed method allowed the identification of approximately 7100 ha of the study area being affected by the Emma Storm. Marshes and vegetated dunes were the most significantly impacted covers, with more than a half of their surface estimated as being affected. In contrast, urban covers experienced the least degree of impact. This assessment was conducted for a 90 km coastline sector and with a spatial resolution of approximately 14 m.
Although the CDA approach has been widely used for disaster mapping, this study introduces three novel aspects. Firstly, it applies the coherence difference method to yet non-exploited environments such as coastal areas, particularly in beach/dune systems. Secondly, it considers at least five weighting factors for the threshold-based coherence difference analysis, enhancing the accuracy of the results. Lastly, it proposes a land use/land cover-based threshold optimization which ensures the best-fit adjustment for different coastal environments, improving the overall method accuracy by at least 19%.
Regardless of the limitations that need to be considered, the proposed method stands out as a valuable tool for regional-scale coastal disaster monitoring. After adjusting the threshold values for different land use/land cover classes in specific areas, it can be automated and operated at a low cost. Furthermore, it enables the assessment of natural and cultural assets in extended and/or remote areas as well as urban coastal areas. It is expected that this method can be applied to a wide range of coastal environments to support the response phase of disaster management programs, making it a valuable tool for decision-making support.

Supplementary Materials

The following supporting information can be downloaded at: https://www.mdpi.com/article/10.3390/rs15133233/s1, Table S1: Detail of the S1 SAR acquisitions considered for this study; Table S2: title Detail of the 40 S1 SAR interferometric pairs; Figure S1: Coherence difference threshold workflow for ascending orbit images; Figure S2: Coherence difference threshold workflow for descending orbit images.

Author Contributions

Conceptualization, P.A.G. and T.F.-M.; Data curation, P.A.G. and T.F.-M.; Formal analysis, P.A.G. and T.F.-M.; Funding acquisition, T.F.-M.; Investigation, P.A.G. and T.F.-M.; Methodology, P.A.G. and T.F.-M.; Project administration, T.F.-M.; Resources, P.A.G. and T.F.-M.; Software, P.A.G.; Supervision, T.F.-M.; Validation, P.A.G. and T.F.-M.; Visualization, P.A.G. and T.F.-M.; Writing—original draft, P.A.G. and T.F.-M.; Writing—review & editing, P.A.G. and T.F.-M. All authors have read and agreed to the published version of the manuscript.

Funding

This study was funded by the Ministry of Science and Innovation through the project “Vulnerability of littoral cultural heritage to environmental agents: impact of climate change (VOLICHE)” (PID2020-117812RB-I00/AEI/10.13039/501100011033). In addition, authors would like to thank to AUIP (Asociación Universitaria Iberoamericana de Postgrado) for supporting the research fellowship of P.A. Garzo carried out at the Department of Earth Sciences, International Campus of Excellence of the Sea (CEI-MAR), University of Cádiz, during 2022.

Data Availability Statement

The SAR data used for this study is available from the European Space Agency (ESA) and retrieved from Alaska Satelite Facility Distributed Active Archive Center (ASF DAAC) (https://asf.alaska.edu/; accessed on 10 March 2023) (see Table S1 at Supplementary Materials for more details). Optical data was also available from the ESA and retrieved from the Copernicus Open Access Hub (https://scihub.copernicus.eu/; accessed on 10 March 2023). Both datasets are open and free-of-charge access for scientific research purposes. Interferometric coherence processing was carried out by the ESA SNAP software (SNAP, ESA Sentinel Application Platform v9.0, available at http://step.esa.int; accessed on 15 April 2023 ). Geospatial processing was performed by the graphical interface of QGIS v3.24 software [82] which represent an open-source software.

Acknowledgments

Authors would like to thank to the ADACOSTA project (CGL2014-53153-R) for the UAV in situ data and Lara Talavera Reina for survey and processing the UAV in situ data.

Conflicts of Interest

The authors of this paper declare not to have any conflict of interest. The funders of this study had no role in its design; in the acquisition, collection, processing, analysis and interpretation of data; in the writing and design of the manuscript; or in the publishing decision over the results and conclusions.

Abbreviations

The following abbreviations were used in this paper:
ASCAscending Orbit Image
ASF DAACAlaska Satellite Facility Distributed Active Archive Center
CDACoherence Difference Analysis
CLULCCoastal Land Use/Land Cover
DEMDigital Elevation Model
DESCDescending Orbit Image
ECLULCEuroepan Coastal Land Use/Land Cover
ESAEuropean Space Agency
InSARSAR Interferometry
IWInterferometric Wide Swath
RADARRadio Detecting and Ranging
RSRemote Sensing
S1Sentinel-1
S2Sentinel-2
SARSynthetic Aperture Radar
SLCSingle Look Complex
SRTMShuttle Radar Topography Mission
UAVUnmanned Aerial Vehicle
VHVertical-Horizontal Polarization
VVVertical-Vertical Polarization

References

  1. Gogoberidze, G. Tools for comprehensive estimate of coastal region marine economy potential and its use for coastal planning. J. Coast. Conserv. 2012, 16, 251–260. [Google Scholar] [CrossRef]
  2. Busayo, E.T.; Kalumba, A.M. Recommendations for linking climate change adaptation and disaster risk reduction in urban coastal zones: Lessons from East London, South Africa. Ocean Coast. Manag. 2021, 203, 105454. [Google Scholar] [CrossRef]
  3. Zhao, Q.; Pan, J.; Devlin, A.T.; Tang, M.; Yao, C.; Zamparelli, V.; Falabella, F.; Pepe, A. On the Exploitation of Remote Sensing Technologies for the Monitoring of Coastal and River Delta Regions. Remote Sens. 2022, 14, 2384. [Google Scholar] [CrossRef]
  4. Enriquez-Acevedo, T.; Botero, C.M.; Cantero-Rodelo, R.; Pertuz, A.; Suarez, A. Willingness to pay for Beach Ecosystem Services: The case study of three Colombian beaches. Ocean Coast. Manag. 2018, 161, 96–104. [Google Scholar] [CrossRef]
  5. Neumann, B.; Vafeidis, A.T.; Zimmermann, J.; Nicholls, R.J. Future coastal population growth and exposure to sea-level rise and coastal flooding-a global assessment. PLoS ONE 2015, 10, e0118571. [Google Scholar] [CrossRef] [PubMed] [Green Version]
  6. Vitousek, S.; Barnard, P.L.; Fletcher, C.H.; Frazer, N.; Erikson, L.; Storlazzi, C.D. Doubling of coastal flooding frequency within decades due to sea-level rise. Sci. Rep. 2017, 7, 1399. [Google Scholar] [CrossRef] [Green Version]
  7. Edmonds, D.A.; Caldwell, R.L.; Brondizio, E.S.; Siani, S.M. Coastal flooding will disproportionately impact people on river deltas. Nat. Commun. 2020, 11, 4741. [Google Scholar] [CrossRef]
  8. Dasgupta, S.; Laplante, B.; Meisner, C.; Wheeler, D.; Yan, J. The impact of sea level rise on developing countries: A comparative analysis. Clim. Chang. 2009, 93, 379–388. [Google Scholar] [CrossRef]
  9. Quesada-Román, A.; Pérez-Briceño, P.M. Geomorphology of the Caribbean coast of Costa Rica. J. Maps 2019, 15, 363–371. [Google Scholar] [CrossRef]
  10. Nicholls, R.J.; Cazenave, A. Sea-Level Rise and Its Impact on Coastal Zones. Science 2010, 328, 1517–1520. [Google Scholar] [CrossRef]
  11. Dolan, R.; Davis, R.E. Coastal storm hazards. J. Coast. Res. 1994, Special Issue No. 12, 103–114. [Google Scholar]
  12. Woodruff, J.D.; Irish, J.L.; Camargo, S.J. Coastal flooding by tropical cyclones and sea-level rise. Nature 2013, 504, 44–52. [Google Scholar] [CrossRef] [PubMed] [Green Version]
  13. Kantamaneni, K. Coastal infrastructure vulnerability: An integrated assessment model. Nat. Hazards 2016, 84, 139–154. [Google Scholar] [CrossRef] [Green Version]
  14. Kelley, S.W.; Ramsey, J.S.; Byrnes, M.R. Evaluating Shoreline Response to Offshore Sand Mining for Beach Nourishment. J. Coast. Res. 2004, 201, 89–100. [Google Scholar] [CrossRef]
  15. Van Rijn, L.C. Coastal erosion and control. Ocean Coast. Manag. 2011, 54, 867–887. [Google Scholar] [CrossRef]
  16. Kvočka, D.; Falconer, R.A.; Bray, M. Flood hazard assessment for extreme flood events. Nat. Hazards 2016, 84, 1569–1599. [Google Scholar] [CrossRef] [Green Version]
  17. United Nations Office for Disaster Risk Reduction UNDRR. Sendai Framework for Disaster Risk Reduction 2015–2030; United Nations Office: Geneva, Switzerland, 2015; 37p. [Google Scholar]
  18. Coppola, D.P. Introduction to International Disaster Management; Elsevier: Amsterdam, The Netherlands, 2006. [Google Scholar]
  19. O’Brien, G.; O’Keefe, P.; Rose, J.; Wisner, B. Climate change and disaster management. Disasters 2006, 30, 64–80. [Google Scholar] [CrossRef]
  20. Yue, P.; Baumann, P.; Bugbee, K.; Jiang, L. Towards intelligent GIServices. Earth Sci. Inform. 2015, 8, 463–481. [Google Scholar] [CrossRef]
  21. Hu, L.; Fang, Z.; Zhang, M.; Jiang, L.; Yue, P. Facilitating Typhoon-Triggered Flood Disaster-Ready Information Delivery Using SDI Services Approach—A Case Study in Hainan. Remote Sens. 2022, 14, 1832. [Google Scholar] [CrossRef]
  22. Lu, D.; Mausel, P.; Brondizio, E.; Moran, E. Change detection techniques. Int. J. Remote Sens. 2004, 25, 2365–2401. [Google Scholar] [CrossRef]
  23. Garzo, P.A.; Dadon, J.R.; Castro, L.N. Modelling environmental vulnerability of the Biosphere Reserve Parque Atlántico Mar Chiquito, Argentina, under agricultural and urban impacts. Ocean Coast. Manag. 2019, 170, 72–79. [Google Scholar] [CrossRef]
  24. Pereira, J.M.C. Remote sensing of burned areas in tropical savannas. Int. J. Wildland Fire 2003, 12, 259–270. [Google Scholar] [CrossRef] [Green Version]
  25. Virdis, S.G.; Oggiano, G.; Disperati, L. A Geomatics Approach to Multitemporal Shoreline Analysis in Western Mediterranean: The Case of Platamona-Maritza Beach (Northwest Sardinia, Italy). J. Coast. Res. 2012, 28, 624. [Google Scholar] [CrossRef]
  26. Yang, Y.; Wong, L.N.Y.; Chen, C.; Chen, T. Using multitemporal Landsat imagery to monitor and model the influences of landscape pattern on urban expansion in a metropolitan region. J. Appl. Remote Sens. 2014, 8, 083639. [Google Scholar] [CrossRef]
  27. Dong, C. Remote sensing, hydrological modeling and in situ observations in snow cover research: A review. J. Hydrol. 2018, 561, 573–583. [Google Scholar] [CrossRef]
  28. Pavlidou, E.; Van Der Meijde, M.; Van Der Werff, H.; Hecker, C. Time series analysis of land surface temperatures in 20 earthquake cases worldwide. Remote Sens. 2018, 11, 61. [Google Scholar] [CrossRef] [Green Version]
  29. Lechner, A.M.; Foody, G.M.; Boyd, D.S. Applications in Remote Sensing to Forest Ecology and Management. One Earth 2020, 2, 405–412. [Google Scholar] [CrossRef]
  30. Spinosa, A.; Ziemba, A.; Saponieri, A.; Damiani, L.; El Serafy, G. Remote Sensing-Based Automatic Detection of Shoreline Position: A Case Study in Apulia Region. J. Mar. Sci. Eng. 2021, 9, 575. [Google Scholar] [CrossRef]
  31. Feyisa, G.L.; Meilby, H.; Fensholt, R.; Proud, S.R. Automated Water Extraction Index: A new technique for surface water mapping using Landsat imagery. Remote Sens. Environ. 2014, 140, 23–35. [Google Scholar] [CrossRef]
  32. Cabezas-Rabadán, C.; Pardo-Pascual, J.; Almonacid-Caballer, J.; Rodilla, M. Detecting problematic beach widths for the recreational function along the Gulf of Valencia (Spain) from Landsat 8 subpixel shorelines. Appl. Geogr. 2019, 110, 102047. [Google Scholar] [CrossRef]
  33. Pardo-Pascual, J.E.; Almonacid-Caballer, J.; Ruiz, L.A.; Palomar-Vázquez, J. Automatic extraction of shorelines from Landsat TM and ETM+ multi-temporal images with subpixel precision. Remote Sens. Environ. 2012, 123, 1–11. [Google Scholar] [CrossRef] [Green Version]
  34. Viaña-Borja, S.P.; Ortega-Sánchez, M. Automatic Methodology to Detect the Coastline from Landsat Images with a New Water Index Assessed on Three Different Spanish Mediterranean Deltas. Remote Sens. 2019, 11, 2186. [Google Scholar] [CrossRef] [Green Version]
  35. Lee, J.S.; Jurkevich, L.; Dewaele, P.; Wambacq, P.; Oosterlinck, A. Speckle filtering of synthetic aperture radar images: A review. Remote Sens. Rev. 1994, 8, 313–340. [Google Scholar] [CrossRef]
  36. Orusa, T.; Cammareri, D.; Mondino, E.B. A Possible Land Cover EAGLE Approach to Overcome Remote Sensing Limitations in the Alps Based on Sentinel-1 and Sentinel-2: The Case of Aosta Valley (NW Italy). Remote Sens. 2022, 15, 178. [Google Scholar] [CrossRef]
  37. Orusa, T.; Cammareri, D.; Mondino, E.B. A Scalable Earth Observation Service to Map Land Cover in Geomorphological Complex Areas beyond the Dynamic World: An Application in Aosta Valley (NW Italy). Appl. Sci. 2022, 13, 390. [Google Scholar] [CrossRef]
  38. Samuele, D.P.; Filippo, S.; Orusa, T.; Enrico, B.-M. Mapping SAR geometric distortions and their stability along time: A new tool in Google Earth Engine based on Sentinel-1 image time series. Int. J. Remote Sens. 2021, 42, 9135–9154. [Google Scholar] [CrossRef]
  39. Millard, K.; Richardson, M. Wetland mapping with LiDAR derivatives, SAR polarimetric decompositions, and LiDAR–SAR fusion using a random forest classifier. Can. J. Remote Sens. 2013, 39, 290–307. [Google Scholar] [CrossRef]
  40. Bamler, R. Principles of Synthetic Aperture Radar. Surv. Geophys. 2000, 21, 147–157. [Google Scholar] [CrossRef]
  41. Pepe, A.; Calò, F. A review of interferometric synthetic aperture RADAR (InSAR) multi-track approaches for the retrieval of Earth’s surface displacements. Appl. Sci. 2017, 7, 1264. [Google Scholar] [CrossRef] [Green Version]
  42. Shu, Y.; Li, J.; Gomes, G. Shoreline Extraction from RADARSAT-2 Intensity Imagery Using a Narrow Band Level Set Segmentation Approach. Mar. Geod. 2010, 33, 187–203. [Google Scholar] [CrossRef]
  43. Pradhan, B.; Rizeei, H.M.; Abdulle, A. Quantitative Assessment for Detection and Monitoring of Coastline Dynamics with Temporal RADARSAT Images. Remote Sens. 2018, 10, 1705. [Google Scholar] [CrossRef] [Green Version]
  44. Liu, J.; Li, P.; Tu, C.; Wang, H.; Zhou, Z.; Feng, Z.; Shen, F.; Li, Z. Spatiotemporal Change Detection of Coastal Wetlands Using Multi-Band SAR Coherence and Synergetic Classification. Remote Sens. 2022, 14, 2610. [Google Scholar] [CrossRef]
  45. Zhang, L.; Lu, Z. Advances in InSAR Imaging and Data Processing. Remote Sens. 2022, 14, 4307. [Google Scholar] [CrossRef]
  46. Lu, Z.; Kwoun, O.; Rykhus, R. Interferometric synthetic aperture radar (InSAR): Its past, present and future. Photogramm. Eng. Remote Sens. 2007, 73, 217. [Google Scholar]
  47. ElGharbawi, T.; Tamura, M. Coseismic and postseismic deformation estimation of the 2011 Tohoku earthquake in Kanto Region, Japan, using InSAR time series analysis and GPS. Remote Sens. Environ. 2015, 168, 374–387. [Google Scholar] [CrossRef] [Green Version]
  48. Teshebaeva, K.; Roessner, S.; Echtler, H.; Motagh, M.; Wetzel, H.-U.; Molodbekov, B. ALOS/PALSAR InSAR Time-Series Analysis for Detecting Very Slow-Moving Landslides in Southern Kyrgyzstan. Remote Sens. 2015, 7, 8973–8994. [Google Scholar] [CrossRef] [Green Version]
  49. Zhou, C.; Lan, H.; Bürgmann, R.; Warner, T.A.; Clague, J.J.; Li, L.; Wu, Y.; Zhao, X.; Zhang, Y.; Yao, J. Application of an improved multi-temporal InSAR method and forward geophysical model to document subsidence and rebound of the Chinese Loess Plateau following land reclamation in the Yan’an New District. Remote Sens. Environ. 2022, 279, 113102. [Google Scholar] [CrossRef]
  50. Scardino, G.; Anzidei, M.; Petio, P.; Serpelloni, E.; De Santis, V.; Rizzo, A.; Liso, S.I.; Zingaro, M.; Capolongo, D.; Vecchio, A.; et al. The Impact of Future Sea-Level Rise on Low-Lying Subsiding Coasts: A Case Study of Tavoliere Delle Puglie (Southern Italy). Remote Sens. 2022, 14, 4936. [Google Scholar] [CrossRef]
  51. Seppi, S.A.; López-Martinez, C.; Joseau, M.J. Assessment of L-Band SAOCOM InSAR Coherence and Its Comparison with C-Band: A Case Study over Managed Forests in Argentina. Remote Sens. 2022, 14, 5652. [Google Scholar] [CrossRef]
  52. de Wit, K.; Lexmond, B.R.; Stouthamer, E.; Neussner, O.; Dörr, N.; Schenk, A.; Minderhoud, P.S.J. Identifying Causes of Urban Differential Subsidence in the Vietnamese Mekong Delta by Combining InSAR and Field Observations. Remote Sens. 2021, 13, 189. [Google Scholar] [CrossRef]
  53. Manavalan, R. SAR image analysis techniques for flood area mapping—Literature survey. Earth Sci. Inform. 2017, 10, 1–14. [Google Scholar] [CrossRef]
  54. Rodriguez, E.; Morris, C.S.; Belz, J.E. A global assessment of the SRTM performance. Photogramm. Eng. Remote Sens. 2006, 72, 249–260. [Google Scholar] [CrossRef] [Green Version]
  55. Rosen, P.A.; Hensley, S.; Zebker, H.A.; Webb, F.H.; Fielding, E.J. Surface deformation and coherence measurements of Kilauea Volcano, Hawaii, from SIR-C radar interferometry. J. Geophys. Res. Atmos. 1996, 101, 23109–23125. [Google Scholar] [CrossRef]
  56. Fielding, E.J.; Talebian, M.; Rosen, P.A.; Nazari, H.; Jackson, J.A.; Ghorashi, M.; Walker, R. Surface ruptures and building damage of the 2003 Bam, Iran, earthquake mapped by satellite synthetic aperture radar interferometric correlation. J. Geophys. Res. Atmos. 2005, 110, B03302. [Google Scholar] [CrossRef] [Green Version]
  57. Lu, C.-H.; Ni, C.-F.; Chang, C.-P.; Yen, J.-Y.; Chuang, R.Y. Coherence Difference Analysis of Sentinel-1 SAR Interferogram to Identify Earthquake-Induced Disasters in Urban Areas. Remote Sens. 2018, 10, 1318. [Google Scholar] [CrossRef] [Green Version]
  58. Zebker, H.A.; Villasenor, J. Decorrelation in interferometric radar echoes. IEEE Trans. Geosci. Remote Sens. 1992, 30, 950–959. [Google Scholar] [CrossRef] [Green Version]
  59. Kim, J.-R.; Lin, C.-W.; Lin, S.-Y. The Use of InSAR Phase Coherence Analyses for the Monitoring of Aeolian Erosion. Remote Sens. 2021, 13, 2240. [Google Scholar] [CrossRef]
  60. Manzoni, M.; Molinari, M.E.; Monti-Guarnieri, A. Multitemporal InSAR Coherence Analysis and Methods for Sand Mitigation. Remote Sens. 2021, 13, 1362. [Google Scholar] [CrossRef]
  61. Gaber, A.; Abdelkareem, M.; Abdelsadek, I.S.; Koch, M.; El-Baz, F. Using InSAR Coherence for Investigating the Interplay of Fluvial and Aeolian Features in Arid Lands: Implications for Groundwater Potential in Egypt. Remote Sens. 2018, 10, 832. [Google Scholar] [CrossRef] [Green Version]
  62. Wang, L.; Yang, L.; Wang, W.; Chen, B.; Sun, X. Monitoring Mining Activities Using Sentinel-1A InSAR Coherence in Open-Pit Coal Mines. Remote Sens. 2021, 13, 4485. [Google Scholar] [CrossRef]
  63. Moon, J.; Lee, H. Analysis of Activity in an Open-Pit Mine by Using InSAR Coherence-Based Normalized Difference Activity Index. Remote Sens. 2021, 13, 1861. [Google Scholar] [CrossRef]
  64. Chini, M.; Pelich, R.; Pulvirenti, L.; Pierdicca, N.; Hostache, R.; Matgen, P. Sentinel-1 InSAR Coherence to Detect Floodwater in Urban Areas: Houston and Hurricane Harvey as a Test Case. Remote Sens. 2019, 11, 107. [Google Scholar] [CrossRef] [Green Version]
  65. Chaabani, C.; Chini, M.; Abdelfattah, R.; Hostache, R.; Chokmani, K. Flood mapping in a complex environment using bistatic TanDEM-X/TerraSAR-X InSAR coherence. Remote Sens. 2018, 10, 1873. [Google Scholar] [CrossRef] [Green Version]
  66. Borlaf-Mena, I.; Badea, O.; Tanase, M.A. Assessing the Utility of Sentinel-1 Coherence Time Series for Temperate and Tropical Forest Mapping. Remote Sens. 2021, 13, 4814. [Google Scholar] [CrossRef]
  67. Ishitsuka, K.; Tsuji, T.; Matsuoka, T. Detection and mapping of soil liquefaction in the 2011 Tohoku earthquake using SAR interferometry. Earth Planets Space 2012, 64, 1267–1276. [Google Scholar] [CrossRef] [Green Version]
  68. Barra, A.; Solari, L.; Béjar-Pizarro, M.; Monserrat, O.; Bianchini, S.; Herrera, G.; Crosetto, M.; Sarro, R.; González-Alonso, E.; Mateos, R.M.; et al. A Methodology to Detect and Update Active Deformation Areas Based on Sentinel-1 SAR Images. Remote Sens. 2017, 9, 1002. [Google Scholar] [CrossRef] [Green Version]
  69. Tzouvaras, M.; Danezis, C.; Hadjimitsis, D.G. Small Scale Landslide Detection Using Sentinel-1 Interferometric SAR Coherence. Remote Sens. 2020, 12, 1560. [Google Scholar] [CrossRef]
  70. Franceschetti, G.; Lanari, R. Synthetic Aperture Radar Processing; CRC Press: Boca Ratón, FL, USA, 2018. [Google Scholar]
  71. Goldstein, R. Atmospheric limitations to repeat-track radar interferometry. Geophys. Res. Lett. 1995, 22, 2517–2520. [Google Scholar] [CrossRef] [Green Version]
  72. Foucher, S.; Lopez-Martinez, C. Analysis, Evaluation, and Comparison of Polarimetric SAR Speckle Filtering Techniques. IEEE Trans. Image Process. 2014, 23, 1751–1764. [Google Scholar] [CrossRef]
  73. Bamler, R.; Hartl, P. Synthetic aperture radar interferometry. Inverse Probl. 1998, 14, 1–54. [Google Scholar] [CrossRef]
  74. Jung, J.; Kim, D.J.; Yun, S.H.; Lavalle, M. Damage mapping based on coherence model using multi-temporal polarimetric-interferometric UAVSAR data. In Proceedings of the 2017 IEEE International Geoscience and Remote Sensing Symposium (IGARSS), Fort Worth, TX, USA, 23–28 July 2017; pp. 189–192. [Google Scholar]
  75. Mastro, P.; Masiello, G.; Serio, C.; Pepe, A. Change Detection Techniques with Synthetic Aperture Radar Images: Experiments with Random Forests and Sentinel-1 Observations. Remote Sens. 2022, 14, 3323. [Google Scholar] [CrossRef]
  76. Del Río-Rodríguez, L.; Gracia, F.J.; Benavente, J. Shoreline change patterns in sandy coasts. A case study in SW Spain. Geomorphology 2013, 196, 252–266. [Google Scholar] [CrossRef] [Green Version]
  77. Instituto Hidrográfico De La Marina. Anuario de Mareas; Ministry of Defense: Madrid, Spain, 2009; 367p.
  78. Fernández-Montblanc, T.; Bethencourt, M.; Izquierdo, A. Underwater Cultural heritage risk assessment methodology for wave-induced hazards: The showcase of the Bay of Cadiz. Front. Mar. Sci. 2022, 9, 1005514. [Google Scholar] [CrossRef]
  79. Fernandez-Montblanc, T.; Benavente, J.; Plomaritis, T. Flood hazard characterization in the Guadalete Estuary: Combined effect of the tide and the river flow. Cuatern. Y Geomorfol. 2014, 28, 27–50. [Google Scholar]
  80. Talavera, L.; Del Río, L.; Benavente, J. UAS-based High-resolution Record of the Response of a Seminatural Sandy Spit to a Severe Storm. J. Coast. Res. 2020, 95, 679–683. [Google Scholar] [CrossRef]
  81. Gracia, J.; Río, L.D.; Alonso, C.; Benavente, J.; Anfuso, G. Historical evolution and present state of the coastal dune systems in the Atlantic coast of Cádiz (SW Spain): Palaeoclimatic and environmental implications. J. Coast. Res. 2006, 48, 55–63. [Google Scholar]
  82. Malvarez, G.; Ferreira, O.; Navas, F.; Cooper, J.; Gracia-Prieto, F.; Talavera, L. Storm impacts on a coupled human-natural coastal system: Resilience of developed coasts. Sci. Total Environ. 2021, 768, 144987. [Google Scholar] [CrossRef] [PubMed]
  83. Talavera, L.; del Río, L.; Benavente, J.; Barbero, L.; López-Ramírez, J.A. UAS as tools for rapid detection of storm-induced morphodynamic changes at Camposoto beach, SW Spain. Int. J. Remote Sens. 2018, 39, 5550–5567. [Google Scholar] [CrossRef]
  84. Innerbichler, F.; Kreisel, A.; Gruber, C. Coastal Zones Nomenclature Guideline. Technical Report. 2021. Available online: https://land.copernicus.eu/user-corner/technical-library/coastal-zones-nomenclature-and-mapping-guideline.pdf (accessed on 10 March 2023).
  85. Braun, A.; Veci, L. ESA SNAP Sentinel-1 Toolbox: S1 TOPS InSAR Tutorial; Skywatch Space Applications Inc., European Space Agency: New York, NY, USA, 2021; 25p. [Google Scholar]
  86. Lee, J.-S. Speckle analysis and smoothing of synthetic aperture radar images. Comput. Graph. Image Process. 1981, 17, 24–32. [Google Scholar] [CrossRef]
  87. QGIS Development Team. QGIS Geographic Information System. Open Source Geospatial Foundation Project. 2022. Available online: http://qgis.osgeo.org (accessed on 15 April 2023).
  88. Andalusian Government. Modelo Digital del Terreno de Andalucía. Relieve y Orografía; Junta de Andalucía: Sevilla, Spain, 2005.
  89. Alfieri, L.; Salamon, P.; Bianchi, A.; Neal, J.; Bates, P.; Feyen, L. Advances in pan-European flood hazard mapping. Hydrol. Process. 2014, 28, 4067–4077. [Google Scholar] [CrossRef]
  90. Braun, A. Retrieval of digital elevation models from Sentinel-1 radar data–open applications, techniques, and limitations. Open Geosci. 2021, 13, 532–569. [Google Scholar] [CrossRef]
  91. Gebremichael, E.; Molthan, A.L.; Bell, J.R.; Schultz, L.A.; Hain, C. Flood Hazard and Risk Assessment of Extreme Weather Events Using Synthetic Aperture Radar and Auxiliary Data: A Case Study. Remote Sens. 2020, 12, 3588. [Google Scholar] [CrossRef]
  92. Rangel-Buitrago, N.; Anfuso, G. Coastal storm characterization and morphological impacts on sandy coasts. Earth Surf. Process. Landf. 2011, 36, 1997–2010. [Google Scholar] [CrossRef]
  93. Silva, R.; Martínez, M.; Odériz, I.; Mendoza, E.; Feagin, R. Response of vegetated dune–beach systems to storm conditions. Coast. Eng. 2016, 109, 53–62. [Google Scholar] [CrossRef]
  94. De Sanjosé Blasco, J.J.; Gómez-Lende, M.; Sánchez-Fernández, M.; Serrano-Cañadas, E. Monitoring Retreat of Coastal Sandy Systems Using Geomatics Techniques: Somo Beach (Cantabrian Coast, Spain, 1875–2017). Remote Sens. 2018, 10, 1500. [Google Scholar] [CrossRef] [Green Version]
  95. Del Río Rodríguez, L.; González, J.B.; Prieto, F.J.G.; Ruiz, J.A.C. Riesgos de erosión en la costa de Cádiz: Gestión actual y perspectivas futuras. Geotemas 2015, 15, 149–152. [Google Scholar]
  96. Benavente, J.; Borja, F.; Gracia, F.J.; Rodríguez, A. Introduction to the Gulf of Cadiz coast. In Geomorphology of the South-Atlantic Spanish Coast, Proceedings of the Guide for Fieldtrip A4, 6th International Conference on Geomorphology, Zaragoza, Spain, 7–11 September 2005; Gracia, F.J., Ed.; Spanish Society of Geomorphology: Zaragoza, Spain, 2005; pp. 1–11. [Google Scholar]
  97. Dehghani, M.; Zoej, M.J.V.; Entezam, I.; Mansourian, A.; Saatchi, S. InSAR monitoring of progressive land subsidence in Neyshabour, northeast Iran. Geophys. J. Int. 2009, 178, 47–56. [Google Scholar] [CrossRef] [Green Version]
  98. Rahimi, R.; Tavakol-Davani, H.; Graves, C.; Gomez, A.; Valipour, M.F. Compound Inundation Impacts of Coastal Climate Change: Sea-Level Rise, Groundwater Rise, and Coastal Watershed Precipitation. Water 2020, 12, 2776. [Google Scholar] [CrossRef]
  99. Clark, J.R. Coastal zone management for the new century. Ocean Coast. Manag. 1997, 37, 191–216. [Google Scholar] [CrossRef]
  100. Liu, J.G.; Black, A.; Lee, H.; Hanaizumi, H.; Moore, J.M. Land surface change detection in a desert area in Algeria using multi-temporal ERS SAR coherence images. Int. J. Remote Sens. 2001, 22, 2463–2477. [Google Scholar] [CrossRef]
  101. Turner, I.L.; Harley, M.D.; Drummond, C.D. UAVs for coastal surveying. Coast. Eng. 2016, 114, 19–24. [Google Scholar] [CrossRef]
  102. Hu, L.; Yue, P.; Zhang, M.; Gong, J.; Jiang, L.; Zhang, X. Task-oriented Sensor Web data processing for environmental monitoring. Earth Sci. Inform. 2015, 8, 511–525. [Google Scholar] [CrossRef]
  103. Zhang, M.; Li, Z.; Tian, B.; Zhou, J.; Zeng, J. A method for monitoring hydrological conditions beneath herbaceous wetlands using multi-temporal ALOS PALSAR coherence data. Remote Sens. Lett. 2015, 6, 618–627. [Google Scholar] [CrossRef]
  104. Spizzichino, D.; Margottini, C. Satellite monitoring of geo-hazards affecting cultural heritage. In A Research Agenda for Heritage Planning: Perspectives from Europe; Edward Elgar Publishing: Cheltenham, UK, 2021; p. 133. [Google Scholar]
  105. Elfadaly, A.; Abutaleb, K.; Naguib, D.M.; Lasaponara, R. Detecting the environmental risk on the archaeological sites using satellite imagery in Basilicata Region, Italy. Egypt. J. Remote Sens. Space Sci. 2022, 25, 181–193. [Google Scholar] [CrossRef]
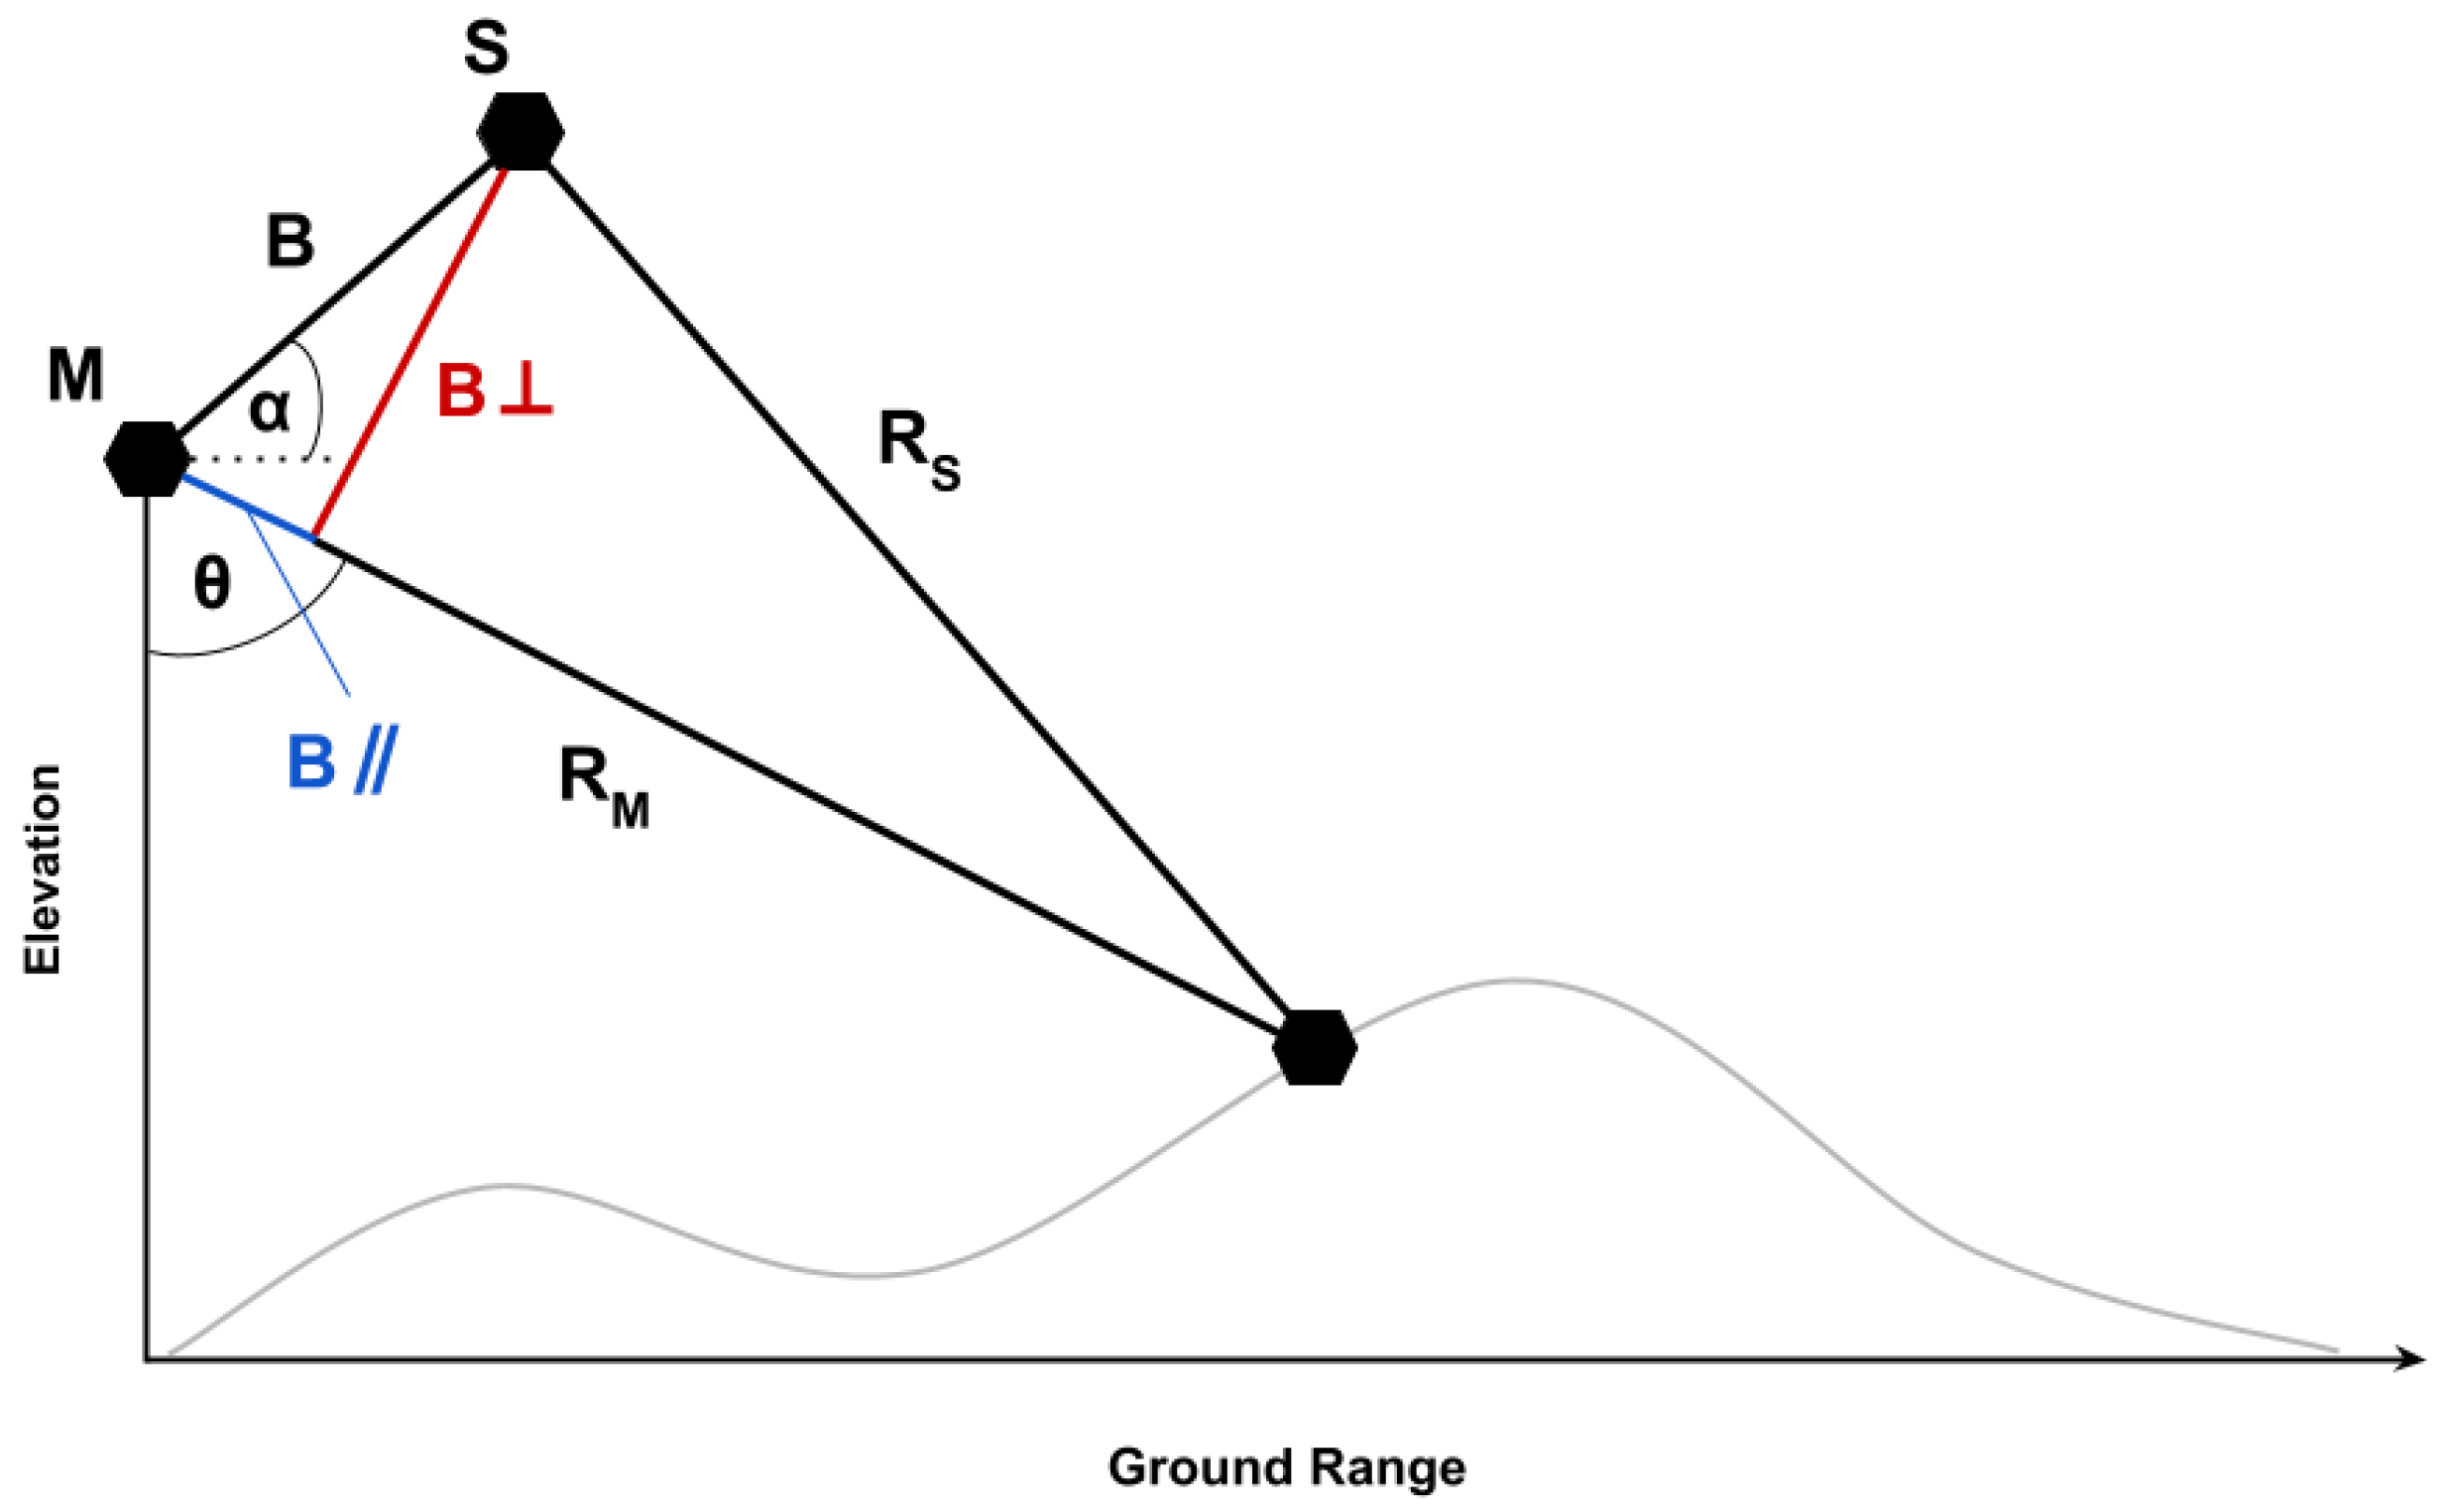
Figure 1. Geometric configuration of an InSAR system. M and S represent the orbital position related to the acquisition of the master and slave SAR images, respectively (Source: [41,51]).
Remotesensing 15 03233 g001
Figure 2. Location of the study area in the Atlantic Coast of Cadiz, Andalusia, Spain (A,B) [WGS 84; EPSG: 4326]. It is delimited by the overlap of ascending (red frame) and descending (purple frame) SAR images (C). White dots (C) represent the main coastal settlements throughout the study area.
Remotesensing 15 03233 g002
Figure 3. Schematic workflow considering the five main steps for this work: datasets (A); interferometric coherence processing and post-processing (B); coherence difference analysis (C); coastal land use/land cover calibration and validation (D); and regional storm-affected areas assessment (E).
Remotesensing 15 03233 g003
Figure 4. Timeline of the processed coherence maps. Yellow star indicates the Emma Storm occurrence.
Remotesensing 15 03233 g004
Figure 5. Coherence difference analysis workflow. φ represents the weighting factor for standard deviation pixel values. All the described steps were carried out at a pixel scale and for both ascending and descending coherence maps.
Remotesensing 15 03233 g005
Figure 6. Pre-storm, storm, and difference coherence maps for ascending ((AC), respectively) and descending ((DF), respectively) orbit images [WGS 84; EPSG: 4326].
Remotesensing 15 03233 g006
Figure 7. Comparison between 19 January 2018 and 7 March 2018 images and CLULC classification (A,B); total observed CLULC change area (C); and potentially storm-affected area for the considered thresholds and datasets (D) in the Camposoto test site.
Remotesensing 15 03233 g007
Figure 8. Comparison between 21 February 2018 and 28 March 2018 images and CLULC classification (A,B); total observed CLULC change area (C); and potentially storm-affected area for the considered thresholds and datasets (D) in the Conil de la Frontera test site.
Remotesensing 15 03233 g008
Figure 9. Storm-affected area at a regional scale, taking into account the best-fit threshold for each CLULC class [WGS 84; EPSG: 4326].
Remotesensing 15 03233 g009
Figure 10. Total cloud coverage of the 8 S2-MSI images (ligh-blue box). Camposoto (green frame) and Conil de La Frontera (yellow frame) test sites and their cloud coverage are also represented [WGS 84; EPSG: 4326]. The yellow star indicates the image corresponding to the Emma Storm.
Remotesensing 15 03233 g010
Figure 11. Comparison between C% estimations for both test sites, taking into account the best-fit threshold for each CLULC class and the φ = 3.
Remotesensing 15 03233 g011
Table 1. Critical success index (C%) estimated with the 2016–2018 dataset for the two considered test sites and for each CLULC class. Bold values correspond to the best-fit threshold for.
1 June 2016–9 February 2018
Test SiteφBeach
and Dunes
Vegetated
Dunes
Roads and
Railways
Marshes
Camposoto30498165
Camposoto2.750507964
Camposoto2.58517860
Camposoto2.2513497556
Camposoto217467252
Conil de la Frontera30--77
Conil de la Frontera2.750--60
Conil de la Frontera2.51--44
Conil de la Frontera2.254--36
Conil de la Frontera27--36
Table 2. Skill indexes estimated for the 2016–2018 dataset, taking into account the best-fit threshold for each CLULC class.
1 June 2016–9 February 2018
Test SiteH [%]F [%]C [%]
Camposoto792263
Conil de la Frontera644349
Table 3. Skill indexes estimated for both the 2016–2018 and 2017–2018 datasets, taking into account the best-fit threshold for each CLULC class.
1 June 2016–9 February 20184 March 2017–9 February 2018
Test SiteH [%]F [%]C [%]H [%]F [%]C [%]
Camposoto792263853555
Conil de la Frontera644349648338
Disclaimer/Publisher’s Note: The statements, opinions and data contained in all publications are solely those of the individual author(s) and contributor(s) and not of MDPI and/or the editor(s). MDPI and/or the editor(s) disclaim responsibility for any injury to people or property resulting from any ideas, methods, instructions or products referred to in the content.