Abstract
Since the end of the Little Ice Age (LIA, ~1830), the accelerated glaciers’ shrinkage along mid-latitude high mountain areas promoted a quick readjustment of geomorphological processes with the onset of the paraglacial dynamic, making proglacial areas among the most sensitive Earth’s landscapes to ongoing climate change. A potentially useful remote-sensing method for investigating such dynamic areas is the DEM (Digital Elevation Model) of Difference (DoD) technique, which quantifies volumetric changes in a territory between successive topographic surveys. After a detailed geomorphological analysis and comparison with historical maps of the Martello Valley (central Italian Alps), we applied the DoD for reconstructing post-LIA deglaciation dynamics and reported on the surface effects of freshly-onset paraglacial processes. The head of the valley is still glacierized, with three main ice bodies resulting from the huge reduction of a single glacier present at the apogee of the LIA. Aftermath: the glaciers lose 60% of their initial surface area, largely modifying local landforms and expanding the surface of the proglacial areas. The DoD analysis of the 2006–2015 timeframe (based on registered DEM derived from LiDAR—Light Detection and Ranging—data) highlights deep surface elevation changes ranging from +38 ± 4.01 m along the foot of rock walls, where gravitative processes increased their intensity, to −47 ± 4.01 m where the melting of buried ice caused collapses of the proglacial surface. This approach permits estimating the volume of sediments mobilized and reworked by paraglacial processes. Here, in less than 10 years, −23,675 ± 1165 m3 of sediment were removed along the proglacial area and transported down valley, highlighting the dynamicity of proglacial areas.
1. Introduction
After the end of the Little Ice Age (LIA, ~1830 [1], the accelerated glacier shrinkage along mid-latitude high mountain areas promoted the rapid readjustment of geomorphological, hydrological, and soil-forming processes. Along freshly deglaciated environments [2] and proglacial systems, new landforms formed or appeared following the glacier front retreat, allowing biological colonization [3,4]. Topographic and geomorphological changes also involved glacier forelands [5], glacial landforms [6], ecological services [7], geodiversity [8], and high mountain geoheritage [9].
Today, proglacial systems are among the most rapidly changing landscapes on Earth’s surface [10]. For instance, de-buttressing of glacially steepened rock walls results in slope failure and enhanced rockfall activity; unvegetated drift-mantled slopes are vulnerable to rapid reworking by debris flows, snow avalanches, and slopewash; glacier forelands are exposed to wind erosion and frost action; streams entrain and redistribute large amounts of unconsolidated glaciogenic sediments that are subsequently redeposited in a variety of sinks [11]. Ryder [12] defined such accelerated geomorphic activity and shift towards different geomorphic processes along deglaciated areas as ‘paraglacial’ dynamic, meaning Earth-surface processes, sediments, landforms, land ecosystems, and landscapes that are directly conditioned by former glaciation and ongoing deglaciation. For such reasons, proglacial areas are unique open-air laboratories for hydrology, as these areas provide potential sources of sediment for downstream transport [13,14], and ecology, given the setting of primary successions of biotic communities along these new exposed surfaces and proto-soils [4,15]. Recently, Bollati et al. [8] acknowledged the high geodiversity of proglacial areas and argued the need to consider them as crucial features of global geoheritage to be preserved and promoted.
From a geomorphological point of view, the reconstruction of the timing of the evolution of post-LIA deglaciated areas in the Alps is often difficult due to the lack of multi-temporal data, namely, the long series of aerial and satellite imagery, whose availability is further hampered by the common occurrence of snow and cloud cover. In some cases, even historical documents, for instance, old paintings and maps, were also used, predominantly as a relative dating method for reconstructing the glacier retreat patterns [16,17], but their accuracy is low. In recent years, this issue has been effectively fixed with Unmanned Aerial Vehicle (UAV) surveys that permit the acquisition of recurrent images. However, the spatial coverage of UAV data at high elevations is limited.
A potentially valuable remote-sensing method for investigating geomorphically dynamic areas is the Digital Elevation Model (DEM) of Difference techniques (DoD), which quantifies the volumetric change between successive topographic surveys [18]. At first, applications of this method were attempted on fluvial landforms to quantify geomorphological change triggered on the alluvial plain by modifications in rivers’ discharge. Rapidly, DoD’s application expanded into several sectors of geomorphological research, including coastal systems, slope mass movements, volcanology, seismology, and glaciology [19]. In such environments, short-timed topographic changes are huge and can be detected on medium-resolution DEMs [20].
Despite their dynamicity, few investigations focused on the complex geomorphic processes acting along the glaciers’ forefield and their effects. DoD analyses are often related to a single landform evolution or process and are mainly used to define the output component of sediment budget estimation. Among the studies that investigate the proglacial evolution, considering the complexity of the whole geomorphic process, Irvine-Fynn et al. [21] analyzed the 2003–2005 proglacial plain evolution of Midtre Lovénbreen Glacier (Svalbard) with dedicated Light Detection and Ranging (LIDAR) surveys. Gawrysiak and Kociuba [22] investigated changes in the morphology of a proglacial valley in the SW of Svalbard, applying DoD and geomorphons techniques. In the Swiss Alps, Delaney et al. [23] investigated the erosion of the proglacial plain in the 1986–2014 timeframe for evaluating the catchment sediment budget. To the best of our knowledge, no investigations have been reported on the southern side of the Alps, where, due to the prevalent aspect of glaciation, the geomorphic changes promoted by climate change are more intense. To fill this knowledge gap, we have focused on the post-LIA deglaciation dynamic and paraglacial processes onset along the Martello Valley, a representative glacial valley in the central Italian Alps. Therein, we applied the DoD method, coupled with a detailed geomorphological analysis and historical research from old cartography and artistic paintings of the area, highlighting the large modification in the proglacial environment.
Study Area
The Martello Valley (Val Martell or Martelltal; for the sake of clarity, we reported all toponyms in Italian and German) is a 20 km long, SW-NE-oriented tributary of the Venosta Valley (Val Venosta or Vinschgau) situated in the Italian sector of the Central Eastern Alps in the Autonomous Province of Bolzano/Bozen and dominated by Mt. Cevedale (3769 m a.s.l.) (Figure 1). The glacier runoff feeds the Plima River, which is a tributary of the Adige or Etsch River. This area has a dry climate with a mean annual precipitation that ranges from ~500 mm to ~900 mm [24] and, from a geological point of view, is characterized by metamorphic rocks (mica schists, quartzites, and paragneiss) [25]. The Martello Valley head has all the characteristics of being representative of Alpine glaciation and glacier retreat dynamics. The abundance of glacial landforms and deposits and the presence of glacial lakes allow the reconstruction of glacier evolution and the paraglacial dynamics of this area.
Today, the head of the valley is widely glacierized with three main ice bodies (Forcola/Furkele, 1.77 km2, Cevedale/Zufall, 3.47 km2, and Vedretta Lunga/Langenferner, 1.69 km2), separated by two shallow ridges, and other small glaciers that have influenced the geomorphology of the upper valley (Vedretta Lunga I/Langenferner I, 0.07 km2, Vedretta Alta/Hohenferner, 1.26 km2, and Vedretta Alta I/Hohenferner I, 0.02 km2) (data from the Italian Glacier Inventory [26]).
Carturan et al. [24] recently investigated the evolution of these glaciers. They have identified a fast-retreating rate since the end of the LIA, with phases of temporary re-advance in the 1890s, 1910–20s, and 1970–1980s. The Vedretta Lunga/Langenferner was among the fastest retreating glaciers in Italy [27]: since its Little Ice Age maximum extent around 1822, the tongue has retreated by more than 3 km in two centuries.
The post-LIA behavior of proglacial areas has been widely described in regions surrounding our case study area, along the Ortles-Cevedale Group, especially in the Lombardy [6,16,28,29,30] and Alto Adige [31] sectors. Close to the study area, Carturan et al. ii [22] compiled the post-LIA record of the terminus change of La Mare Glacier through field observations, old terrestrial and aerial photographs, and detailed geomorphological mapping, highlighting that this glacier reached its LIA maximal position around 1600 AD. Baroni et al. ii [32] reconstructed the evolution of the ice bodies of the Upper Pejo Valley (La Mare, Careser, Venezia, and Vedretta Rossa glaciers), highlighting the different behavior and evolution of each ice body during this long time.
More recently, Krampe et al. ii (2022) [33] applied a climate model to the Forcola/Furkele Glacier, demonstrating that during the Little Ice Age it was 2.8 times larger than today, implying a 2.5 °C colder climate. The model also predicts sustained mass loss of 83% of the 2013–2017 area if the temperature increases by 2 °C.

Figure 1.
Location map of the Martello Valley in the eastern-central Italian Alps and its glacierized basin highlighted in red. The 2016 glacier limits of the whole Ortles-Cevedale area are represented in light blue (data from Paul et al. [34]).
2. Data Source and Methods
To locate the position of the glacier snout in the last 150 years as well as the tempo and mode of geomorphic processes occurrence since the termination of the LIA, aerial images, cartographic resources, and artistic paintings were collected (Table 1). Several data points are found, but a sample of these images is presented in this work. Many aerial images are unsuitable for geomorphic analysis because the presence of clouds or snow covers hampers the identification of landforms.

Table 1.
Type, sources, and year of data used in the reconstruction of the post-LIA deglaciation of Martello Valley.
In detail, 1997, 2000, 2003, 2006, 2008, 2011, 2014, and 2020 aerial orthophotos were collected from the archive of the Autonomous Province of Bolzano Geoportal, with different spatial resolutions reported in Table 1. High-resolution digital elevation models are useful for geomorphic analysis [18]; for this reason, we collected 2005 and 2016 DEMs of the area with a spatial resolution of 2.5 m and 0.5 m, respectively, produced by LiDAR data from the Autonomous Province of Bolzano (Figure S1).
To lengthen the data series on the evolution of the proglacial area, topographic maps were used. We used the official Italian cartography of 1963 and 1976 (scale 1:25,000) produced by the Italian Military Geographic Institute and a few older Austrian maps, such as the Franziszeische Landesaufnahme of 1820 (1:28,800), the Originalkarte des Marteller Alpencomplexes drawn by Julius Payer in 1872 (1:56,000 survey date: 1868), and the Special-Karte der Ortler-Gruppe, surveyed in 1870–1871. For investigating the position of moraine ridges, we used the map in the inventory of Ortles-Cevedale glaciers by Desio [35] that reports the position of glacier termini as field measured in 1865–1868, 1908–1912, 1925–1926, and 1960–1961. Furthermore, we also take advantage of artistic painting, such as the representation of the area by Simon in 1855 and Google EarthTM satellite images.
Aerial images and georeferenced maps permit the detection and manual delineation of glacier limits and other landforms at a scale of 1:5000; for the latter, the identification was also possible due to a detailed geomorphological survey performed in September 2021. All orthophotos and DEMs were imported and analyzed in ArcMap 10.8.2, ArcGIS Pro 3.1, and QGIS 3.28. Google satellite images were visualized through the “Quick Map Services” plugin; in detail, we visualized and analyzed 2017 Pleiades images (spatial resolution: 50 cm) and 2021 Maxar Technology imagery (spatial resolution: 30 cm). All maps (IGM, Austrian sources, and [35]) were first georeferenced in the WGS84 coordinate system using at least ten Ground Control Points (GCP) in the Thin Plate Spline (TPS) algorithm of the georeferencing tool of QGIS and then analyzed.
DoD, DEMs Co-Registration, and Error Assessment
High-resolution DEMs for this area allow the DoD technique [36] to be applied effectively. This method, which consists of a subtraction operation between the elevation values of each pixel of two DEMs, has been applied in the ArcMap 10.8 environment. The 2016 DEM was resampled at 2.5 m, the same resolution as the 2005 one, to improve the accuracy of the method.
Before we calculated the surface elevation changes of glaciers and proglacial areas based on DEM differencing, a 3D co-registration was applied to minimize the biases caused by the horizontal and vertical offsets between the considered DEMs.
Co-registration processes between 2005 and 2016 DEMs were performed in ArcGIS Pro 3.1 software through the Register Raster tool. For improving the accuracy of the analysis, we applied the method described by Nuth and Kääb [37] and reported in [38] using some presumably ground control points for co-registration as anthropic structures or sheepback rock surfaces, obtaining a root-mean-square error (RMSE) of 4.01 m (Table 2). The volume errors are calculated considering Brasington et al., 2003 [39].
Table 2.
Shift vector between two DEMs applying the method reported in [37], Δx, Δy, and Δz are the three components of the full co-registration adjustment vector between the datasets in meters.
For assessing the accuracy of manual digitizing of glacier outline, we applied the method developed by Vogtle and Schilling [40] and largely adopted on Alpine glaciers [41,42]. The potential error affecting the mapping of glacier boundaries given by the presence of clouds, seasonal snow, supraglacial debris, and shadow is less than 5% [37], also considering the error in georeferencing processes of the 1820 topographic map.
3. Results
3.1. Local Glacier Extent
The large availability of georeferenced maps and orthophotos permits the reconstruction of the glacier surface for 150 years, from 1872 to 2020. In 1872 (Figure 2 and Table 3), a single glacier lied at the head of Martello Valley (estimated surface: 14.33 km2) instead of the five extant ice bodies. In 1908, the glacier fragmented into two ice bodies, and the ice tongues of Vedretta Lunga and Cevedale separated. The retreat of glaciers continued unabated except for a short phase of advancing during the 1980s. Such glacier advances were generalized along the Alps [43], but were suddenly followed by the intensification of the deglaciation rate in the last 40 years, when the widening rate of the proglacial area was double that observed in the second half of the 19th century. According to the manual mapping of glacier limits (2020 data), we estimate that today the Upper Martello Valley glaciers cover 5.67 km2; since 1872, they have suffered a reduction of 60% of their initial surface.
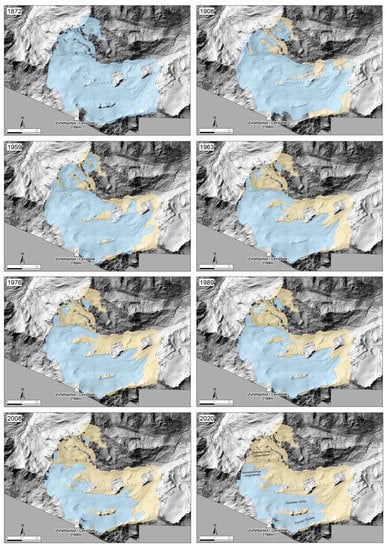
Figure 2.
Evolution of the glacierized area (light blue) and proglacial area (yellow) at the head of Martello Valley. Glacier limits reconstructed after manual digitalization of available topographic maps and orthophotos. Toponyms in the last box refer to the New Italian Glacier Inventory [26].
Table 3.
Glacier surface changes and proglacial area widening of Martello Valley in the 1872–2020 timeframe.
3.2. Geomorphology of the Area
The geomorphological evolution of the area was primarily tuned by the presence of glaciers that, in the past decades, have covered the whole area; more recently, the geomorphological evolution of the region has been controlled by the onset of paraglacial processes. Local surface processes and related landforms are represented in the geomorphological sketch of Figure 3 and in Figure 4, where the legend has been developed based on the guidelines proposed by the Italian Institute for Environmental Protection and Research [44]. Glacial deposits and landforms are widespread along the proglacial area; in some cases, they are intensively reworked by water-related processes. Moraine ridges are well preserved, including the oldest ones dating to the maximum glacier advance of the LIA. Moraines generally show widespread rill erosion processes and interact with slope dynamics, as reported in other similar contexts [45]. The best-preserved moraine ridges are the lateral ones, whereas end moraines are obliterated and almost all dismantled by geomorphic processes that have followed glaciers retreat. Only the most recent frontal ridges, deposed presumably by the last small glacier advance in the 1980s, are well preserved despite their small size. Glacial deposits are easily identifiable in this most recently deglaciated area as unsorted and unstratified formations; locally, we identified a well-preserved fluted moraine.
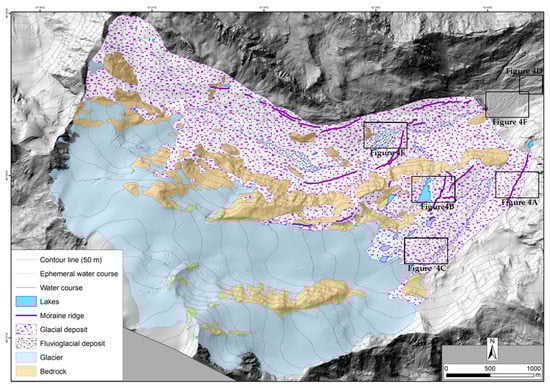
Figure 3.
Simplified geomorphological sketch of glacial landforms and deposits of the Upper Martello Valley; see the text for discussion on landform distribution. The positions of some examples of landforms presented in Figure 4 are reported in black boxes.
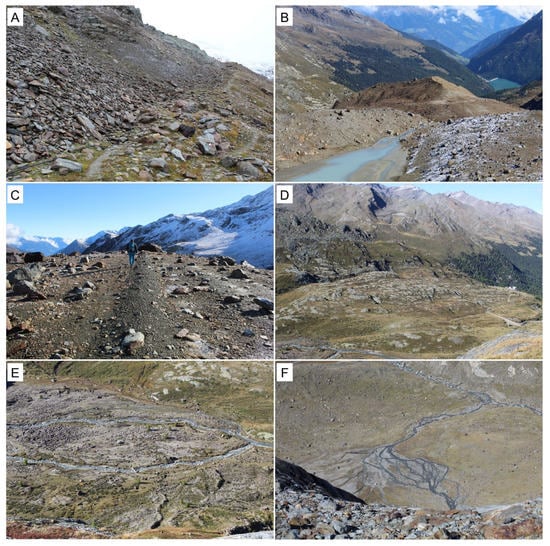
Figure 4.
Some examples of landforms observed along the upper Martello Valley: (A) lateral moraine of the Forcola/Furkele Glacier that leans against the slope; (B) lateral moraine of the Cevedale/Zufall Glacier; (C) fluted moraine in the proglacial plain of the Forcola/Furkele; (D) sheepback rocks at the valley floor; (E) anastomosed pattern along the Plima stream; (F) braided pattern along the Plima stream.
The geomorphic effect of glacier expansion is also evident on rock outcrops that are diffusely marked by glacial striae and abraded surfaces; they are present in proximal sectors of the proglacial plain as well as farther from the glacier terminus.
The proglacial plain is crossed by a pervasive hydrographic network characterized by numerous low-order glacial streams; some of them are ephemeral and discontinuous, and their behavior is tuned by the intensity and seasonality of ice melting. Water courses have a predominantly straight pattern near the ice bodies, shifting to slightly braided patterns moving away from the glacier snout. In the lower part of the study area, where the proglacial plain is more stable and flatter, the hydrographic network is organized according to an anastomosed pattern.
Several lakes or small ponds dot the study area; multitemporal satellite imagery suggests their fast evolution rate, which in most cases is triggered by the glacier retreat. In such a dynamic context, ice-contact ponds formed in depressions or were dammed by moraine ridges, whereas ice-contact lakes vanished or changed their dimensions and shapes after the ice body shrinkage and the consequent recession.
3.3. DEM of Difference
The DoD investigation of the Val Martello/Martelltal glaciers highlights a dramatic thickness loss of the ice body from 2005–2016 (Figure 5). Maximum elevation changes are observed in the frontal area of the three main ice bodies of the valley, where an ice thickness reduction of about 50 m is observed. Considering the time span analyzed, this area shows a decrease of about 5 m/year. The more stable portions along the frontal part, represented in Figure 5 with a blue color, are connected to the presence of thick supraglacial debris that hampers the ice melting. The ice surface is more stable at higher elevations, which coincides with the accumulation basin of glaciers.
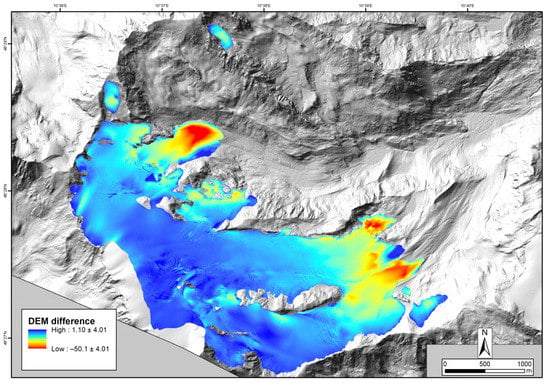
Figure 5.
Glacier elevation changes in the timeframe 2005–2016.
Fast glacier retreat and thickness loss exposed large patches of land that had suffered wide changes in geomorphic processes, causing sensible variation in the local topography. Such variations can be evaluated by comparing two high-resolution digital elevation models dating to 2005 and 2016 through the DoD technique [42]. Due to the abundant supraglacial debris cover on the glacier tongue, a buffer of 5 m from the glacier boundary was excluded from the DoD analysis to avoid misleading interpretations. The resulting topographic reconstruction highlights that a large surface of the recently deglaciated area suffered huge modifications across the considered decade. The extant glacierized area is not represented in this analysis due to the large thickness reduction of glaciers. This variation, diffusely higher than 50 m, would compromise the visualization of topographical changes in the proglacial area. Figure 6 suggests that the proglacial area has suffered deep surface elevation changes that range from + 38 m, in correspondence with the foot of rock walls, to −47 m, where the melting of buried ice caused collapses of the proglacial surface. The high values of positive elevation changes observed on the steepest slopes are an artifact of the DEM production process [46].

Figure 6.
The 2016–2005 DEM of the difference of the proglacial area of Martello Valley with the main moraine ridges highlighted. The elevation profiles of four transects are reported, with their localization indicated on the map. The y-axis range of AA′ and BB′ is different from the CC′ and DD′ elevation profiles for better readability of the data.
A noteworthy topographic variation is evident on the post-LIA lateral moraines that have been highlighted by the AA′ and BB′ transects of Figure 6. Here, slopes with different aspects suffered distinct evolutions: the southern ones showed significant topographic lowering, whereas the northern slopes were more stable. The other two transects (CC′ and DD′ in Figure 7) represent the topographical evolution of the proglacial plain. In this case, ongoing processes such as the melting of buried ice blocks or the reworking of glacial deposits by watercourses have only marginally modified the pristine topography of the area as left by the glacier retreat. Moreover, transect DD′ highlights the sediment trapping action of the frontal moraine, where a volumetric increase upstream of the ridge is neat.
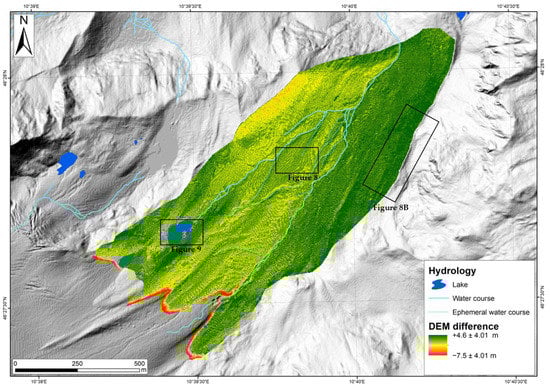
The detailed analysis of the DoD of the more recent proglacial area of the Cevedale/Zufall Glacier allows a better definition of recent surface processes and their geomorphic effects (Figure 7). The lowest DEM difference values (up to 7.5 m) are evident along the buffer area between the proglacial plain and the ice bodies, where the melting of buried ice blocks and the mobilization of debris have a wide impact on the topography. The DoD technique permits estimating the volume of sediments eroded, reworked, and removed by paraglacial processes. Considering the timeframe 2006–2015, 23,675 ± 1165 m3 of sediment was removed along the proglacial area of the Cevedale/Zufall Glacier and transported down the valley. The area where these sediments are deposited is not easily identifiable, neither at the base of the steep rock walls between the Cevedale/Zufall Glacier proglacial plain and the lower valley floor. Presumably, this material is largely reworked and transported even further downstream of the study area.
4. Discussion
Ongoing climate changes are triggering an intense retreat of local glaciers, and in the Martello Valley, this has pushed the widening of the proglacial plain to ~8.66 km2 over the last 150 years. This process happened in different patterns and magnitudes throughout the study area. Glacial bodies are tiny in the northern part of the glacierized area, and their accumulation basin is limited. Moreover, their relatively low elevation, high slope, and orientation toward the south further contributed to the rapid fragmentation of the main glacier—still active at the end of the LIA—into several ice patches. In recent decades, these small glaciers have undergone rapid burial by debris produced by frost action on the rock walls. This process prevented a fast stabilization of the proglacial area because of the abundant availability of debris. The difference in aspect, slope elevation, and size of accumulation basins led to a diverse evolution in the southern sector of the glacierized area of the upper Martello Valley, with a significant retreat (~2 km) of the Cevedale/Zufall and Forcola/Furkule glaciers’ tongues and the opening of several deglaciated windows within both glacier perimeters. This sector is less dynamic than the one in the northern area due to its gentle topography; consequently, the ice-related landforms are preserved.
All the deglaciated areas suffered wide topographic changes, highlighted by DoD analysis. We can observe significant surface lowering in the proximal zone near the glacier front and along talus slopes at higher elevations.
Near glaciers, observed topographic lowering can be interpreted because of the melting of buried ice blocks detached from the main ice body. Here, the abundant supraglacial debris completely covers ice remnants, allowing them to survive for several years without accumulating new ice [47]. Moreover, the same topographical variation could also be attributed to the unconsolidated glacial debris, which is widely available near the glacier and easily mobilized and transported down the valley by the activity of glacier-fed rivers.
Conversely, the topographic lowering along several parts of the talus slope can be attributed to gravitative processes that act on the mountain slope after the glacier retreat. As suggested by Cossart et al. [48], deglaciation in a high mountain environment and ongoing climate change promote the intensification of slope processes. Moreover, we can also speculate on the effects of permafrost melting as a factor in debris mobilization along the slopes of the study area.
In several parts of the deglaciated area, we observed a rise in the topographic surface. This is noteworthy in correspondence with some portions of the slope characterized by a large production of debris and the progressive increase in the talus slope volume. This mechanism is also consistent with the orientation of such portions of mountain sides, which are prevalently oriented northward, where freeze and thaw cycles are more intense [49].
Moraine ridges have a particular distribution of topographic anomalies, showing a slight increase in the topographic surface on their outer side, whereas a reduction is evident on their inner side. The asymmetrical slope is characteristic of the presence of a glacier [50]. The inner side of the moraine is more recently exposed and steeper than the outer one, and degradation processes are still active [48]. Instead, the outer slope is more stable.
The dynamicity of the topographic surface is evident considering some of the evolution patterns discussed in the previous paragraph. Furthermore, the different behavior between the two sides of the proglacial areas is manifest: moraine slopes suffer a broad decrease in topography on the hydrographic left side; conversely, on the other side, an increase in the slope is evident. This is consistent with the location of the two moraines: the more dismantled one is a single and insulated ridge; conversely, the other one is leaning against a steep rocky slope with intense degradation processes and higher debris availability.
Also, fluvial processes are responsible for significant changes in proglacial areas by coupling erosion and sedimentation processes in a small area (Figure 7). In particular, the erosion of the till is evident in the correspondence with the higher slope gradient where fluvial terraces are present.
The availability of multitemporal images of the proglacial plain permits us to shed light on the possible succession of different geomorphic processes that have modified the landscape of the proglacial plain after the glacier retreat. Considering the time frame 1997–2020 for which high-resolution aerial images are available, no significant succession in geomorphic processes is evident, except in selected specific areas (Figure 8), where the magnitude of these processes has changed over the years.
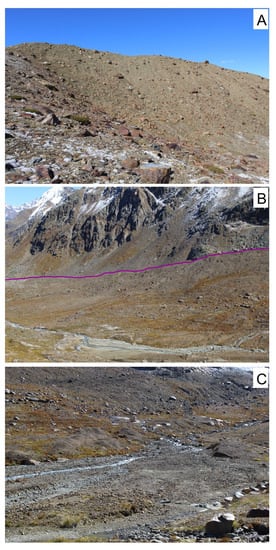
Figure 8.
Main geomorphic processes that occur in the proglacial plain of Zufall/Cevedale Glacier, promoting wide topographic variation: (A) moraine degradation, (B) slope processes (the line indicates the moraine edge), and (C) fluvial reworking of glacial deposits.
The most dynamic sectors of the proglacial area, where different geomorphic processes begin, are the moraines and the valley bottom. The topographic evolution of moraines is consistent with their location: degradation processes (rill erosion and surface gravitative processes) are more efficient where these landforms are isolated and not characterized by a rocky core. Moraines that lean against an active slope (Figure 8B) suffered an extremely different evolution. The widespread slope processes that onset on the mountain side lead to a great availability of sediments that modify the shape of the moraine ridges, whose counter-slope is no longer identifiable due to the presence of debris. Finally, debris mobilization is effective in the bottom valley (Figure 8C), where the fluvial processes rework the glacial deposit more intensely in the proximity of the ice body, where the sediment is more unstable.
The dynamic of hydrography drives the main geomorphic changes along the floor of the proglacial plain. In particular, the multitemporal images (Figure 9) highlight the formation and evolution of water-related landforms, including a proglacial lake that covered 4500 m2 and appeared between the years 2000 and 2008. The short-timed glacier advances of the 1980s, followed by its rapid rethreatening after the year 2000, built a thin moraine system that promoted the development of this moraine-embaked lake, which underwent snap surface stabilization, preserving its shape and size. The formation of proglacial lakes, as the one reported in Figure 8, is crucial for the development of the glacier foreland: the occurrence of (semi)permanent water ponds significantly reduced sediment output from glacierized watersheds and the energy and velocity of meltwater, as reported by Tweed and Carrivick [51], with a possible impact on the evolution of proglacial plains [52,53].
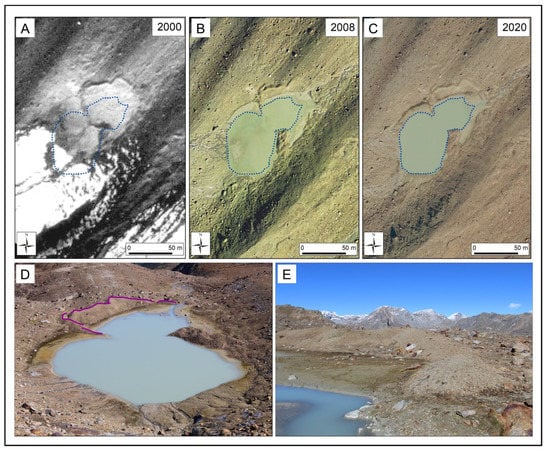
Figure 9.
(A–C) Formation and evolution of a proglacial lake in the deglaciated area of Cevedale/Zufall Glacier in the 2000–2020 timeframe from aerial orthophotos (the dashed blue line indicates the 2020 lake limit). (D,E) field images of the proglacial lakes enclosed by an Eighties moraine ridge marked with the purple line.
All geomorphic processes considered here eroded, reworked, and removed the sediments originally deposited during the glacier advance. In 2006–2015, 23,675 ± 1165 m3 of sediment, mostly moved during the short melting season, were mobilized and transferred down the valley. This impressive mass of debris has wide-ranging effects not only on the geomorphology of the proglacial area but even on the whole landscape of the Martello Valley.
The effects of these processes also have economic implications. The artificial lake used for hydropower production (Lago di Gioveretto/Zufrittsee) a few kilometers down the glacier valley acts as a sink for this debris, causing several problems in the dam operation. This problem of sedimentation in the lake is partially solved with the realization of dedicated infrastructure for preventing the sediment filling that affects the geomorphic evolution of Lower Martello Valley.
5. Conclusions
The application of the DoD method in the Martello Valley for investigating post-LIA topographic variations and the effects of paraglacial processes is effective. Our approach highlights deep surface elevation changes ranging from +38 ± 4.01 m along the foot of rock walls, where gravitative processes increased their intensity, to −47 ± 4.01 m where the melting of buried ice caused the collapse of the surface of the proglacial plain. This approach permits estimating the volume of sediments mobilized and reworked by all paraglacial processes. In less than ten years, 23,675 ± 1165 m3 of sediment were removed along the proglacial area and transported down the valley, highlighting the dynamicity of proglacial areas.
From our approach, it is evident that the DoD technique is valuable for investigating changes along the planet’s surface, including the proglacial zones. Here, the comparison between different high-resolution DEMs permits us to describe the evolution of the geomorphic processes acting and the topographic variation of landforms, thus suggesting a high spatial variability in the effects of paraglacial processes over relatively small areas. Furthermore, the quantification of volume changes and consequently the estimation of the sediment budget of the area permit us to give important information about the sedimentation rate to the artificial basin managers. Besides the interpretation of natural surface processes, the ability of this technique to investigate recent dynamics and ongoing processes might represent a valuable tool in the detection of the consequences of human agency in these high-altitude environments [54]. An opportunity to increase the frequency of the analysis, which is essential to achieving this goal, can be given by SAR data analysis. These data are frequently available and are not affected by cloud cover issues [19].
In conclusion, water management, skiing and mountaineering activities, and infrastructural development led to major changes in local topography and geomorphic processes along such environments, shaping new anthropogenic landforms in a short period whose evolution can be quantified based on the results of a DoD.
Supplementary Materials
The following supporting information can be downloaded at: https://www.mdpi.com/article/10.3390/rs15123190/s1, Figure S1: Digital elevation models (2005 and 2016) of the Martello valley used in the proglacial analysis. The 2016 data was produced for the Autonomous Province of Bolzano only for the glacierized areas, and for this reason, in the north-eastern part of the valley, the DEM is missing.
Author Contributions
Conceptualization, R.S.A., M.P. and A.Z.; methodology and field activity, R.S.A.; writing—review and editing, R.S.A., M.P. and A.Z. All authors have read and agreed to the published version of the manuscript.
Funding
This research was funded by the Italian Ministry of Education, University, and Research (MIUR) through the project “Dipartimenti di Eccellenza 2018–2022” and “Dipartimenti di Eccellenza 2023–2027” awarded to the Dipartimento di Scienze della Terra “A. Desio” of the Università degli Studi di Milano and by the projects PSR2020_IBOLLATI, and PSR2022_RAZZONI.
Data Availability Statement
Data sharing is not applicable to this article.
Acknowledgments
We thank Andrea Pezzotta for his support during the field survey.
Conflicts of Interest
The authors declare no conflict of interest.
References
- Vincent, C.; Le Meur, E.; Six, D.; Funk, M. Solving the paradox of the end of the Little Ice Age in the Alps. Geophys. Res. Lett. 2005, 32, L09706. [Google Scholar] [CrossRef]
- Serrano, E.; Oliva, M.; González-García, M.; López-Moreno, J.I.; González-Trueba, J.; Martín-Moreno, R.; Palma, P. Post-little ice age paraglacial processes and landforms in the high Iberian mountains: A review. Land Degrad. Dev. 2018, 29, 4186–4208. [Google Scholar] [CrossRef]
- Franzetti, A.; Pittino, F.; Gandolfi, I.; Azzoni, R.S.; Diolaiuti, G.; Smiraglia, C.; Pelfini, M.; Compostella, C.; Turchetti, B.; Buzzini, P.; et al. Early ecological succession patterns of bacterial, fungal and plant communities along a chronosequence in a recently deglaciated area of the Italian Alps. FEMS Microbiol. Ecol. 2020, 96, fiaa165. [Google Scholar] [CrossRef]
- Ficetola, G.F.; Marta, S.; Guerrieri, A.; Gobbi, M.; Ambrosini, R.; Fontaneto, D.; Zerboni, A.; Poulenard, J.; Caccianiga, M.; Thuiller, W. Dynamics of ecological communities following current retreat of glaciers. Annu. Rev. Ecol. Evol. Syst. 2021, 52, 405–426. [Google Scholar] [CrossRef]
- D’Agata, C.; Diolaiuti, G.; Maragno, D.; Smiraglia, C.; Pelfini, M. Climate change effects on landscape and environment in glacierized Alpine areas: Retreating glaciers and enlarging forelands in the Bernina group (Italy) in the period 1954–2007. Geol. Ecol. Landsc. 2020, 4, 71–86. [Google Scholar] [CrossRef]
- Pelfini, M.; Bollati, I. Landforms and geomorphosites ongoing changes: Concepts and implications for geoheritage promotion. Quaest. Geogr. 2014, 33, 131–143. [Google Scholar] [CrossRef]
- Guerrieri, A.; Carteron, A.; Bonin, A.; Marta, S.; Ambrosini, R.; Caccianiga, M.; Cantera, I.; Compostella, C.; Diolaiuti, G.; Fontaneto, D.; et al. Metabarcoding data reveal vertical multi-taxa variation in topsoil communities during the colonization of deglaciated forelands. Mol. Ecol. 2022; in press. [Google Scholar] [CrossRef]
- Bollati, I.M.; Viani, C.; Masseroli, A.; Mortara, G.; Testa, B.; Tronti, G.; Pelfini, M.; Reynard, E. Geodiversity of proglacial areas and implications for geosystem services: A review. Geomorphology 2023, 421, 108517. [Google Scholar] [CrossRef]
- Garavaglia, V.; Pelfini, M.; Bollati, I. The influence of climate change on glacier geomorphosites: The case of two Italian glaciers (Miage Glacier, Forni Glacier) investigated through dendrochronology. Geomorphologie 2010, 16, 153–164. [Google Scholar] [CrossRef]
- Heckmann, T.; Morche, D. Geomorphology of proglacial systems. In Landform and Sediment Dynamics in Recently Deglaciated Alpine Landscapes; Springer International Publishing: Cham, Switzerland, 2019. [Google Scholar]
- Ballantyne, C.K. Paraglacial geomorphology. Quat. Sci. Rev. 2002, 21, 1935–2017. [Google Scholar] [CrossRef]
- Ryder, J.M. Some aspects of the morphometry of paraglacial alluvial fans in south-central British Columbia. Can. J. Earth Sci. 1971, 8, 1252–1264. [Google Scholar] [CrossRef]
- Garavaglia, V.; Pelfini, M.; Motta, E. Glacier stream activity in the proglacial area of debris covered glacier in Aosta Valley, Italy: An application of dendroglaciology. Geogr. Fis. Din. Quat. 2010, 33, 15–24. [Google Scholar]
- Knight, J.; Harrison, S. Mountain glacial and paraglacial environments under global climate change: Lessons from the past, future directions and policy implications. Geogr. Ann. Ser. A 2014, 96, 245–264. [Google Scholar] [CrossRef]
- Burga, C.A.; Krüsi, B.; Egli, M.; Wernli, M.; Elsener, S.; Ziefle, M.; Fischer, T.; Mavris, C. Plant succession and soil development on the foreland of the Morteratsch glacier (Pontresina, Switzerland): Straight forward or chaotic? Flora 2010, 205, 561–576. [Google Scholar] [CrossRef]
- Pelfini, M. Contributo alla conoscenza delle fluttuazioni oloceniche del Ghiacciaio dei Forni. Nat. Brescia. 1988, 24, 237–257. [Google Scholar]
- Jomelli, V.; Favier, V.; Rabatel, A.; Brunstein, D.; Hoffmann, G.; Francou, B. Fluctuations of glaciers in the tropical Andes over the last millennium and palaeoclimatic implications: A review. Palaeogeogr. Palaeoeocl. 2009, 281, 269–282. [Google Scholar] [CrossRef]
- Wheaton, J.M.; Brasington, J.; Darby, S.E.; Sear, D.A. Accounting for uncertainty in DEMs from repeat topographic surveys: Improved sediment budgets. Earth Surf. Proc. Land 2010, 35, 136–156. [Google Scholar] [CrossRef]
- Carrivick, J.L.; Heckmann, T. Short-term geomorphological evolution of proglacial systems. Geomorphology 2017, 287, 3–28. [Google Scholar] [CrossRef]
- Williams, R. DEMs of difference. Geomorphol. Tech. 2002, 2, 1–17. [Google Scholar]
- Irvine-Fynn, T.D.L.; Barrand, N.E.; Porter, P.R.; Hodson, A.J.; Murray, T. Recent High-Arctic glacial sediment redistribution: A process perspective using airborne lidar. Geomorphology 2011, 125, 27–39. [Google Scholar] [CrossRef]
- Gawrysiak, L.; Kociuba, W. Application of geomorphons for analysing changes in the morphology of a proglacial valley (case study: The Scott River, SW Svalbard). Geomorphology 2020, 371, 107449. [Google Scholar] [CrossRef]
- Delaney, I.; Bauder, A.; Huss, M.; Weidmann, Y. Proglacial erosion rates and processes in a glacierized catchment in the Swiss Alps. Earth Surf. Process. Landf. 2018, 43, 765–778. [Google Scholar] [CrossRef]
- Carturan, L.; Baroni, C.; Carton, A.; Cazorzi, F.; Fontana, G.D.; Delpero, C.; Salvatore, M.C.; Seppi, R.; Zanoner, T. Reconstructing fluctuations of La Mare Glacier (Eastern Italian Alps) in the late Holocene: New evidence for a Little Ice Age maximum around 1600 AD. Geogr. Ann. Ser. A 2014, 96, 287–306. [Google Scholar] [CrossRef]
- Montrasio, A.; Berra, F.; Cariboni, M.; Ceriani, M.; Deichmann, N.; Ferliga, C.; Gregnanin, A.; Guerra, S.; Guglielmin, M.; Jadoul, F.; et al. Note Illustrative della Carta Geologica d’Italia: Foglio 024, Bormio; ISPRA, Servizio Geologico d’Italia: Roma, Italy, 2008. [Google Scholar]
- Smiraglia, C.; Azzoni, R.S.; D’Agata, C.; Maragno, D.; Fugazza, D.; Diolaiuti, G. The evolution of the Italian glaciers from the previous data base to the New Italian Inventory. Preliminary considerations and results. Geogr. Fis. Din. Quat. 2015, 38, 79–87. [Google Scholar]
- Galos, S.P.; Klug, C.; Maussion, F.; Covi, F.; Nicholson, L.; Rieg, L.; Gurgiser, W.; Molg, T.; Kaser, G. Reanalysis of a 10-year record (2004–2013) of seasonal mass balances at Langenferner/Vedretta Lunga, Ortler Alps, Italy. Cryosphere 2017, 11, 1417–1439. [Google Scholar] [CrossRef]
- Pelfini, M. Le Fluttuazioni Glaciali Oloceniche nel Gruppo Ortles-Cevedale (Settore Lombardo). Ph.D. Thesis, Università degli Studi di Milano, Milano, Italy, 1992; pp. 1–211. [Google Scholar]
- Pelfini, M.; Gobbi, M. Enhancement of the ecological value of Forni Glacier as a possible new eomorphosites: New data from arthropods communities. Geogr. Fis. Din. Quat. 2005, 28, 211–217. [Google Scholar]
- Longhi, A.; Guglielmin, M. The glacial history since the Last Glacial Maximum in the Forni Valley (Italian Central Alps). Reconstruction based on Schmidt’s Hammer R-values and crystallinity ratio indices of soils. Geomorphology 2021, 387, 107765. [Google Scholar] [CrossRef]
- Savi, S.; Dinale, R.; Comiti, F. The Sulden/Solda Glacier (Eastern Italian Alps): Fluctuations, dynamics, and topographic control over the last 200 years. Geogr. Fis. Din. Quat. 2021, 44, 15–30. [Google Scholar]
- Baroni, C.; Casale, S.; Salvatore, M.C.; Ivy-Ochs, S.; Christl, M.; Carturan, L.; Seppi, R.; Carton, A. Double response of glaciers in the Upper Peio Valley (Rhaetian Alps, Italy) to the Younger Dryas climatic deterioration. Boreas 2017, 46, 783–798. [Google Scholar] [CrossRef]
- Krampe, D.; Arndt, A.; Schneider, C. Energy and glacier mass balance of Fürkeleferner, Italy: Past, present, and future. Front. Earth Sci. 2022, 10, 814027. [Google Scholar] [CrossRef]
- Paul, F.; Rastner, P.; Azzoni, R.S.; Diolaiuti, G.; Fugazza, D.; Le Bris, R.; Nemec, J.; Rabatel, A.; Ramusovic, M.; Schwaizer, G.; et al. Glacier shrinkage in the Alps continues unabated as revealed by a new glacier inventory from Sentinel-2. Earth Syst. Sci. Data 2020, 12, 1805–1821. [Google Scholar] [CrossRef]
- Desio, A. I Ghiacciai del Gruppo Ortles-Cevedale; Consiglio Nazionale delle Ricerche, Comitato Glaciologico Italiano: Milano, Italy, 1967. [Google Scholar]
- James, L.A.; Hodgson, M.E.; Ghoshal, S.; Latiolais, M.M. Geomorphic change detection using historic maps and DEM differencing: The temporal dimension of geospatial analysis. Geomorphology 2012, 137, 181–198. [Google Scholar] [CrossRef]
- Nuth, C.; Kääb, A. Co-registration and bias corrections of satellite elevation data sets for quantifying glacier thickness change. Cryosphere 2011, 5, 271–290. [Google Scholar] [CrossRef]
- Paul, F.; Bolch, T.; Briggs, K.; Kääb, A.; McMillan, M.; McNabb, R.; Wuite, J. Error sources and guidelines for quality assessment of glacier area, elevation change, and velocity products derived from satellite data in the Glaciers_cci project. Remote Sens. Environ. 2017, 203, 256–275. [Google Scholar] [CrossRef]
- Brasington, J.; Langham, J.; Rumsby, B. Methodological sensitivity of morphometric estimates of coarse fluvial sediment transport. Geomorphology 2003, 53, 299–316. [Google Scholar] [CrossRef]
- Vogtle, T.; Schilling, K.-J. Digitizing maps. In GIS for Environmental Monitoring; Schweizerbart: Stuttgart, Germany, 1999; pp. 201–216. [Google Scholar]
- Smiraglia, C.; Azzoni, R.S.; D’Agata, C.; Maragno, D.; Fugazza, D.; Diolaiuti, G.A. The New Italian Glacier Inventory: A didactic tool for a better knowledge of the natural Alpine environment. J. Res. Didact. Geogr. 2015, 1, 81–94. [Google Scholar]
- Azzoni, R.S.; Fugazza, D.; Zerboni, A.; Senese, A.; D’Agata, C.; Maragno, D.; Carzaniga, A.; Cernuschi, M.; Diolaiuti, G.A. Evaluating high-resolution remote sensing data for reconstructing the recent evolution of supra glacial debris: A study in the Central Alps (Stelvio Park, Italy). Progress Phys. Geogr. Earth Environ. 2018, 42, 3–23. [Google Scholar] [CrossRef]
- Zemp, M.; Paul, F.; Hoelzle, M.; Haeberli, W. Glacier fluctuations in the European Alps, 1850–2000. In Darkening Peaks Glacier Retreat; University of California Press: Berkeley, CA, USA, 2008. [Google Scholar]
- Campobasso, C.; Carton, A.; Chelli, A.; D’Orefice, M.; Dramis, F.; Graciotti, R. Aggiornamento ed Integrazioni delle Linee Guida della Carta Geomorfologica d’Italia Alla Scala 1: 50.000; Quaderni Serie III; ISPRA: Rome, Italy, 2018. [Google Scholar]
- Bollati, I.; Pellegrini, M.; Reynard, E.; Pelfini, M. Water driven processes and landforms evolution rates in mountain geomorphosites: Examples from Swiss Alps. Catena 2017, 158, 321–339. [Google Scholar] [CrossRef]
- Hirt, C. Artefact detection in global digital elevation models (DEMs): The maximum slope approach and its application for complete screening of the SRTM v4.1 and MERIT DEMs. Remote Sens. Environ. 2018, 207, 27–41. [Google Scholar] [CrossRef]
- Everest, J.; Bradwell, T. Buried glacier ice in southern Iceland and its wider significance. Geomorphology 2003, 52, 347–358. [Google Scholar] [CrossRef]
- Cossart, E.R.; Braucher, M.; Fort, D.; Bourlès, L.; Carcaillet, J. Slope instability in relation to glacial debuttressing in alpine areas (Upper Durance catchment, southeastern France): Evidence from field data and 10Be cosmic ray exposure ages. Geomorphology 2008, 95, 3–26. [Google Scholar] [CrossRef]
- Magnin, F.; Josnin, J.Y.; Ravanel, L.; Pergaud, J.; Pohl, B.; Deline, P. Modelling rock wall permafrost degradation in the Mont Blanc massif from the LIA to the end of the 21st century. Cryosphere 2017, 11, 1813–1834. [Google Scholar] [CrossRef]
- Sharp, M. Annual moraine ridges at Skálafellsjökull, south-east Iceland. J. Glaciol. 1984, 30, 82–93. [Google Scholar] [CrossRef]
- Tweed, F.S.; Carrivick, J.L. Deglaciation and proglacial lakes. Geol. Today 2015, 31, 96–102. [Google Scholar] [CrossRef]
- Viani, C.; Machguth, H.; Huggel, C.; Godio, A.; Franco, D.; Perotti, L.; Giardino, M. Potential future lakes from continued glacier shrinkage in the Aosta Valley Region (Western Alps, Italy). Geomorphology 2020, 355, 107068. [Google Scholar] [CrossRef]
- Azzoni, R.S.; Bollati, I.; Pelfini, M.; Sarıkaya, M.A.; Zerboni, A. Geomorphology of a recently deglaciated high mountain area in Eastern Anatolia (Turkey). J. Maps 2022, 18, 258–267. [Google Scholar] [CrossRef]
- Goudie, A. The human impact in geomorphology–50 years of change. Geomorphology 2020, 366, 106601. [Google Scholar] [CrossRef]
Disclaimer/Publisher’s Note: The statements, opinions and data contained in all publications are solely those of the individual author(s) and contributor(s) and not of MDPI and/or the editor(s). MDPI and/or the editor(s) disclaim responsibility for any injury to people or property resulting from any ideas, methods, instructions or products referred to in the content. |
© 2023 by the authors. Licensee MDPI, Basel, Switzerland. This article is an open access article distributed under the terms and conditions of the Creative Commons Attribution (CC BY) license (https://creativecommons.org/licenses/by/4.0/).