Abstract
Understanding the failure mechanisms of rocks that are exposed to different water contents is important for rock stability in rock engineering applications, and the quantitative analysis of rock behavior is necessary for predicting and preventing the occurrence of rock failure due to water effects. Mechanical tests using real-time acoustic emission (AE) technology were carried out to reveal the damage evolution in sandstone rocks in a dried state, natural state, and saturated state, which includes a quantitative analysis of AE characteristics and cracking properties. The testing results indicate that with the growth of water content, sandstone rocks show a decreasing trend in strength and tend to experience gentle damage with relatively fewer fractures. The crack morphology of the main fracture surfaces is quantitatively described, including a fractal dimension calculation and cracking length measurements. As the water content rises, when rock failure occurs, a higher AE b-value can be obtained, revealing an increasing proportion of large-scale cracks. The fractal dimension of the acoustic emission hit rate shows that the evolution of rock damage and deformation has self-similarity, that is, the transformation from order to disorder to order, and it is affected by different water contents. The AE waveforms of the sandstone have two dominant frequency bands (0~75 kHz and 75~150 kHz) no matter which water-bearing state they are in. The increase in rock water content has resulted in the decline of AE waveforms located in the range of 200–300 kHz, whereas the rise of AE waveforms is located in the range of 0–50 kHz. The findings of this study deepen our understanding of the mechanism behind rock failure and provide a meaningful reference for disaster assessment and control.
1. Introduction
Water has a weakening effect on the mechanical properties and stability of rocks, resulting in changes in a rock’s unstable failure mechanism, which is the main reason for many hazards and rock slope stability, for example [1,2,3,4,5,6,7]. Therefore, it is very important to explore the water–rock interaction for rock stability. To further study the effect of water on rocks, a lot of laboratory experiments have been carried out on rocks with different water contents by researchers. The results of these experiments fully demonstrate that the existence of water has inferior impacts on the overall strength of rocks [8,9,10,11,12,13,14]. However, there are relatively few quantitative analyses of the precursory information of rock failure, considering the water content.
The macroscopic failure characteristics of rocks are very important to assist with investigations of rocks’ damage mechanisms [15,16,17]. Many researchers have used lots of monitoring tools, testing techniques, and calculation algorithms to quantitatively analyze fracture cracking attributes and parameters. For example, Zhang and Zhao [18] quantitatively measured the fracture surface of SCB marble specimens under dynamic mode I loading by the joint application of the SEM technique and a 3D laser profilometer with a resolution of 7 μm. Zhang et al. [19] quantitatively analyzed the frequency spectrum distribution characteristics of jointed marble under uniaxial compression failure and explored the underlying physical mechanisms of the marble failure mode. Li et al. [20] made a failure mode quantitative analysis of rock failure under a complex stress state based on the acoustic emission parameters of the RA-AF distribution.
The box-counting method is one of the most effective and simple quantitative methods to describe the self-similarity and complexity of fracture cracking and the morphology of rocks using the fractal dimension concept. Huang et al. [21] used the box-counting dimension to quantitatively calculate the fractal dimension of sandstone under different confining pressures. Zhao et al. [22] made better quantitative comparisons for Type A and Type B (CSNSCB) specimens using the box-counting dimension method and found that Type A specimens have an average fractal dimension value of 1.2209 for cracking, which is 4.79% larger than that of 1.1651 for Type B specimens. He et al. [23] used the box-counting dimension method to characterize the development proportion and complexity of cracks and found that the fractal dimension of the sample decreased from 1.25 to 1.05 with an increasing pressure and temperature. Zhu et al. [24] also used the box-counting method to study the mixed mode I/II fracture behavior and surface morphology of hard rock under dynamic loading. The fracture cracking and morphology of rock exhibited fractal characteristics, which can quantitatively describe rock damage. Therefore, quantitative research into fracture cracking and the morphology of rock using the box-counting method is required for our present study.
Acoustic emission (AE) is an effective, non-destructive technology that can detect the acoustic properties of materials and can be used in many research fields [25,26]. The rock will have different degrees of deformation and micro-cracks nucleation under external load action. Over time, the cracks in the rock gradually expand until the rock breaks. During this process, partial strain will be released in the form of an elastic wave, resulting in the generation of acoustic emission [27,28,29,30,31,32]. AE analysis includes parameter analysis and waveform spectrum analysis, which can reflect the internal failure evolution information of rocks. Among them, AE parameters include the rise time (RT), duration, ringing count, amplitude (A), AE energy, AE absolute energy, peak frequency, average frequency (AF), ratio of rise time to amplitude (RA = RT/A), etc., which can directly reflect the damage inside the rock and the process of initiation and development of micro-cracks [33,34,35]. Deng et al. [36] conducted three-point bending tests on granite rocks in dried and saturated states, and pointed out that the saturated rock specimens had lower stiffness and lower strength, which were more prone to instability. During the whole test, the AE ringing count rates of water-saturated rock specimens were much lower than those of dried rock specimens, and the total numbers of AE events were much larger than those of dried rock specimens. Zhao et al. [37] studied the mechanical properties of sandstone with different water contents under the actions of uniaxial and cyclic loads and revealed that the existence of water causes the deterioration of sandstone rocks’ properties. Saturated sandstone rocks had a peak strength reduction of 37–58% and an elastic modulus reduction of 15.7–21%, respectively, and the AE energy release rate of dried specimens was higher than that of saturated specimens. Zhou et al. [38] conducted notch semicircular bending tests on sandstone specimens at different water states. It was found that the higher the water content of the rock, the lower the fracture toughness and crack growth rate of the rock, and the cumulative AE count of hydrated specimens was much lower than that of dried specimens.
It can be seen from the above research that it is meaningful to carry out AE measurements to explore how water affects rocks’ mechanical properties. However, previous studies have mainly focused on the analysis of single AE parameters, and research on the spectral characteristics of AE waveforms is relatively lacking. In contrast, the AE waveform spectrum is more sensitive than AE parameters and can well reflect the micro-fracture of rock [39]. Su et al. conducted a rockburst test on sandstone rocks under true triaxial loading conditions, and found that the dominant frequency of the AE signal showed a downward trend on the eve of rockburst; the spectral distribution was characterized by low amplitude, a wide frequency band, and a multimodal shape [40]. He et al. [41] studied the AE characteristics of limestone under true triaxial dynamic unloading and found that the rock specimens had two main frequency ranges, 60~100 kHz and 170~190 kHz, respectively. With the increase in stress, the AE signal shifted from high frequency and low amplitude to low frequency and high amplitude. Especially when the rock specimens reached the fracture stage, the amplitude increased and the frequency decreased significantly. Zhang et al. [42] conducted a uniaxial loading test on water-saturated sandstone and indicated that the AE signal frequency range of water-saturated sandstone was mainly distributed in 35~60 kHz, which was more concentrated than that of sandstone in a natural state. During the loading process, the peak frequency of the AE signal of sandstone in a water-saturated state decreased from 60 kHz to 40 kHz, and the average dominant frequency was 1 kHz smaller than that of sandstone in a natural state. Therefore, studying the AE information collected from a whole test and quantifying the AE spectrum features can help us analyze and compare the damage evolution process of rocks more deeply. As a commonly used method for processing AE signals, the Fast Fourier transform (FFT) can convert AE waveform information into spectrum information and more intuitively reflect the influence of external factors on the waveform dominant frequency information generated at different stages in the rock [43,44].
As a typical non-destructive monitoring method, AE can not only record parameters or waveform information, but they can also monitor and identify the internal damage law of rock. Many researchers have focused on water’s influence on rock damage based on quantitative analyses of single AE parameters such as the hit, amplitude, energy, and energy rate, etc. However, comprehensive investigations of water’s influence on a rock’s internal damage characteristics, including failure pattern, micro-crack evolution process, and precursory information of critical failure based on a quantitative analysis of AE, are lacking.
Therefore, this paper conducts uniaxial compression tests on sandstone rocks with different water-bearing states and uses a nondestructive acoustic emission monitoring system to analyze the parameters and waveforms of AE signals in a test, including a combination of the AE amplitude, AE hit rate, AE b-value, AE fractal dimension, and AE waveform spectrum. This study also discusses the mechanical failure characteristics of rocks under different water-bearing states, provides a quantitative description of the fracture morphology of the main fracture surface, and obtains effective rock failure precursory information, thereby providing a theoretical basis for early warnings of rock instability.
2. Experimental Methodology
2.1. Specimen Preparation
The sandstone sample was collected from the outcrops of sandstone gas-rich area, Dongpu Depression, located in northeast of Henan province. The designed sandstone specimens were cylindrical specimens with diameter of 50 mm and height of 100 mm, which met the recommendations of ISRM. The sandstone specimens were divided into three groups, namely dried group, natural group, and saturated group. Each group was designed to have three specimens. The specimen surface was precisely ground to minimize end effect, and its two ends non-parallelism was less than 0.05 mm. Meanwhile, specimen surface flatness was within 0.02 mm and diameter deviation along the axis was within 0.3 mm.
The mineral composition and micro-structure can also affect rock uniformity. To obtain petrographic characteristics of the sandstone, Scanning Electron Microscopy (SEM) analysis was made. The results show that the three groups of sandstones have similar mineral compositions, mainly containing 70% quartz, 15% potassium feldspar, 8% plagioclase, and 7% mica.
Figure 1 shows the SEM scanning images, and when the image is magnified by 100 times, there are randomly distributed cracks and holes in the thin slice of rock. Comparing the microscopic characteristics of thin sections of dried group, natural group, and saturated group, it can be found that sandstone specimens have similar pore number and size, indicating that the sandstone specimens have similar structural characteristics and similar primary micro-crack damage as a whole. Except for microstructure observation, rocks’ physical properties, including density, P-wave velocity, and porosity aspects, were measured to better describe the initial damage degree of rock quantitatively. The average density of rock before water treatment was 2.47 g/cm3 for dried group, 2.43 g/cm3 for natural group, and 2.44 g/cm3 for saturated group. The average P-wave velocities of the specimens before treatment were very close: 4794 km/s for dried group, 4745 km/s for natural group, and 4742 km/s for saturated group. Moreover, the effective porosity of sandstone was measured using the saturation method. Using the saturated weight, dry mass, and dimensions of the specimen, the effective porosity can be calculated, which were 3.85%, 3.91%, and 3.88%, respectively. It can be seen that the prepared specimens before test had similar physical properties no matter the density, P-wave velocity, or porosity aspects, which demonstrates that their initial fracture or pores states are close to each other.
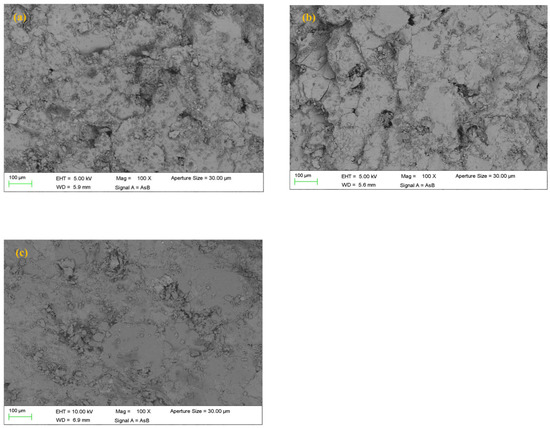
Figure 1.
SEM fragment scanning results: (a) specimen D-1; (b) specimen N-1; (c) specimen S-1.
2.2. Drying and Water Absorption Test
The preparation methods for specimens in different water-bearing states are as follows: (1) record the size and mass of each specimen; (2) test their P-wave velocities, and then select nine specimens with similar velocities; (3) select three specimens from dried group, which are denoted as D-1, D-2, and D-3, respectively, and then store them in 105 °C thermostat for about 48 h until their mass remains unchanged. Then, the specimens can be taken out and cooled to normal temperature. Weigh their lost water mass and measure their P-wave velocities again. It is urgent to perform test on dried rock, which is wrapped in clingfilm to avoid the influence of external moisture; (4) pick out three specimens without any treatment from natural group, which are denoted as N-1, N-2, and N-3, respectively; (5) select the last three specimens from the saturated group, which are denoted as S-1, S-2, and S-3, respectively, and treat them with hot air drying as outlined in step (3). Then, immerse these rocks in a container for 6 h, and meanwhile, exhaust air using a vacuum pump continuously from the tank until the weight of specimens remains unchanged. Finally, weigh the weights of wet specimens and their P-wave velocities again.
In the test, the water absorption capacity of rock specimens in three groups can be compared through water saturation parameters, which satisfies the following:
where Wa (%) is water content, Mw (g) and Md (g) are wet weight and dry weight of specimens. For natural group specimens, their moisture contents can be calculated by putting the weight values of specimens before drying (Mw) and after drying (Md) from the dried group into Formula (1). The calculation results are summarized in Table 1.

Table 1.
Statistics results of sandstone specimens in drying and water absorption test.
2.3. Experimental Setup and Equipment
The uniaxial compressive equipment used in this study mainly consists of loading system, stress–strain monitoring system, and AE acquisition system, as shown in Figure 2. The loading system has a loading capacity of 2000 kN and the PCI-II AE system was adopted to monitor AE signals during loading process in real time. The load was applied by displacement control and set with the rate of 0.06 mm·s−1. Compared to displacement rate, strain rate, which measures the rate at which the material is being stretched or compressed, is a better measure for studying the behavior of materials under deformation, because strain rate considers both the amount of deformation and the rate at which it occurs [45,46,47,48,49,50]. According to the provided displacement rate for the compression test and the rock dimension, the strain rate can be calculated, which is 6 × 10⁻⁴ s−1.
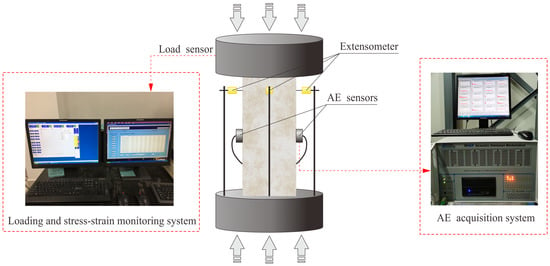
Figure 2.
Schematic diagram of the uniaxial compression test system.
Two AE sensors were fixed on the two sides of rock using a rubber band, which is a common fixed method in rock mechanical tests [20,51,52,53,54,55]. In order to ensure coupling effect between sensor and rock specimen, Vaseline was used to reduce the friction between the specimen and sensors. To eliminate background noise, both AE trigger threshold and pre-gain were set to 40 dB. That is to say, we utilized the elastic force of a rubber band to stably couple the AE sensors, which are coated with thick layer of butter on the cylindrical specimen surface. Moreover, the sampling frequency was 2 MSPS.
3. Experimental Results
3.1. Fracture Surface Morphology
Rock is a natural material that has so much variety. Various geological changes and weathering processes occur after the rock has formed, resulting in complex rock mechanic properties [56]. Since defects such as pores and cracks exist inside the rock, its strength shows scattering. Meanwhile, rock’s strength, deformation, and failure mode are influenced by many factors, such as the very important end friction effect [57]. The reason why this is important is because the type of contact between the specimen surface and loading surface plays an important role in the stress distribution within the sample, its behavior under loading, and ultimately, the compressive strength. Using ice as a model for rock, Carl E. Renshaw [58,59] experimentally tested the prediction of percolation theory for a sufficiently large sample. To minimize lateral confinement near the loading platens, thin polyethylene sheets were placed between the sample and the loading platens. Based on the experimental results of dolomite under a confining pressure of 0–33 MPa and granite under a confining pressure of 0–108 MPa, K. Mogi [60] found that the effect of the end friction on strength decreases with increasing confining pressure. The results prove that the main mechanism is that the confining stress causes lateral compression of the rock, resulting in a decrease in its failure angle (relative elongation of the specimen) and an increase in rock ductility. In this paper, cylindrical rock specimens are prepared according to the methods recommended by the International Rock Mechanics Society for uniaxial compression experiments [61,62]. On this basis, in order to reduce the lateral constraint of the loading plate on the rock sample, we applied a very thin layer of Vaseline on the two end faces of the specimen, which not only ensured the effective transmission of the axial load but also weakened the influence of the loading plate friction on the experimental results.
When the internal stress reaches or exceeds the limit value, the rock will fail under the action of the external load. Figure 3 shows the failure modes of sandstone specimens under different water-bearing conditions. When the rock was dry, the uniaxial compression test lasted a long time, and the dried specimen experienced brittle failure with a loud noise. The main cracks initiated from the end extended downwards on the rock’s surface, eventually penetrating the entire rock and disintegrating the rock into many blocks, leading to the formation of many shear surfaces, as shown in Figure 3a–c. When the rock was in its natural state, it experienced a brittle failure and emitted loud, brittle sounds with fragments ejecting out. The main cracks penetrated from the upper to lower ends of the specimen. The natural rock had a composite failure mode of tensile and shear failure, as shown in Figure 3d–f. The small-scale cracks with irregular shapes can be observed from the natural rock surface. Saturated rock, however, mainly experienced a gentler failure process accompanied by dull sounds and fewer fragment ejections. The main rupture surface can be observed along the axial direction, due to the fact that saturated rock mainly caused tension destruction and generated few, large, and wide fractures, as shown in Figure 3g–i. From the failure phenomenon and fracture morphology of sandstone after the uniaxial compression experiment, it can be seen that most of the newly generated cracks in the specimen propagated through the end of the specimen, resulting in not only oblique shear cracks with 45°, but also splitting cracks along the loading direction. Therefore, we can conclude that the uniaxial compression mechanical experiment of sandstone in this study was weakly affected by the end friction effect, and the fracture mode of the specimen was mainly controlled by different water contents in the specimen. Both the dried rock and natural rock had more severe fracturing processes, leading to the generation of large pieces of rock fragments. The test results show that water had a significant effect on the rock failure mode. The surface failure pattern was dominated by the shear mode for dried sandstone, whereas it was dominated by the splitting tensile mode for saturated sandstone. When sandstone was in its natural state, it experienced tensile–shear mixed failure. Therefore, it can be inferred that a higher water content makes rock more likely to generate tensile cracks.
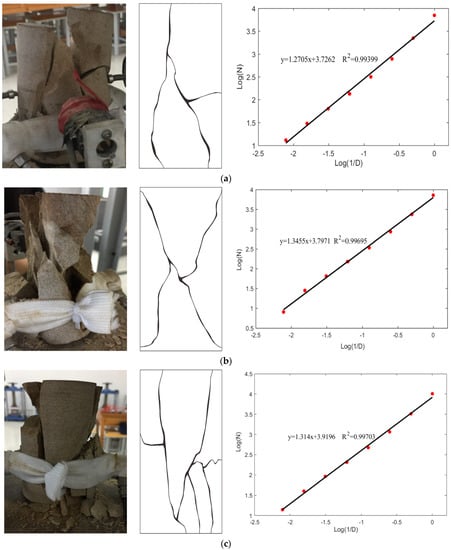
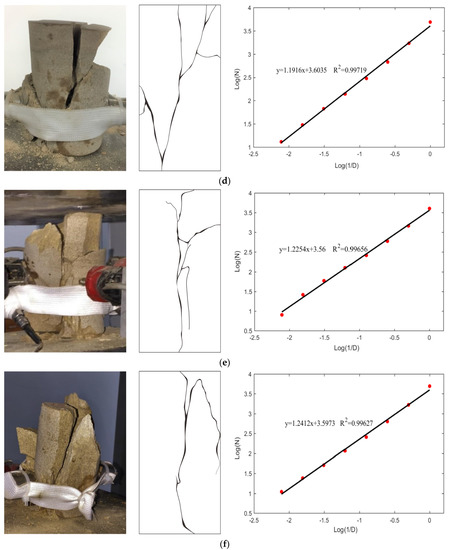
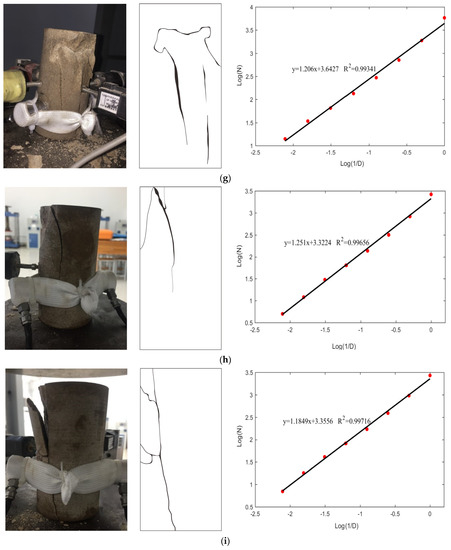
Figure 3.
Failure modes and fractal dimension results of rock specimens under different water-bearing states: (a) D−1; (b) D−2; (c) D−3; (d) N−1; (e) N−2; (f) N−3; (g) S−1; (h) S−2; (i) S−3. Note that the red data dots represent the number of boxes required to cover the cracks corresponding to different box edge lengths.
In order to make the quantitative comparison of failure characteristics for these three types of specimens, the crack morphology image of the main fracture surface is converted into binary black-and-white images to reveal an effective profile of the cracks (see Figure 3). The traditional definition of dimension is expanded by fractal dimension, which indicates that the more complex a curve is, the larger its fractal dimension [63]. In this paper, the fractal dimension of cracks is measured by the box dimension method, which can produce a self-similarity analysis of complex lineaments, such as fracture networks. The calculation process can be summarized as follows: Firstly, divide the image set F into a grid with side length δk and calculate the number of grids (Nδk) covering the region of the image. Then, if F has fractal characteristics, it can be determined and expressed as follows:
The box dimension calculation program can be written using the Matlab platform combined with a curve fitting algorithm, and the obtained fitting linear diagram is plotted in Figure 3. The magnitude of the fractal dimension reflects the self-similarity of crack geometry. It can be seen from Figure 3 that the fractal dimension distributions of dried specimens, natural specimens, and saturated specimens are in the ranges of 1.27~1.35, 1.19~1.25, and 1.18~1.26. The fractal dimension of the dried group is the largest, indicating that it generated more complex micro-cracks with much more energy release.
Image-Pro Plus 6.0 (IPP 6.0) software has powerful image processing and analysis functions that can directly extract image data from pictures obtained by microscopes, cameras, or scanners. After the binarized black-and-white image is imported into the IPP software, the IPP software can realize automatic identification, numbering and statistics of cracks, and record the center position and measure the length of each crack. The crack procession flowing chart using IPP is drawn in Figure 4. The data results are exported to Excel for processing, and the final statistical results are shown in Table 2. The results for the total generated crack lengths for rock specimens in three groups are as follows: (1) for specimens in the dried state: D-1 (207.329 mm), D-2 (246.289 mm), and D-3 (334.264 mm); (2) for specimens in the natural state: N-1 (244.082 mm), N-2 (231.115 mm), and N-3 (206.335 mm); and (3) for specimens in the saturated state: S-1 (204.101 mm), S-2 (123.511 mm), and S-3 (147.884 mm). Overall, it can be seen that with the increase in water content, the total lengths of the cracks generated from rock specimens have decreasing trends.
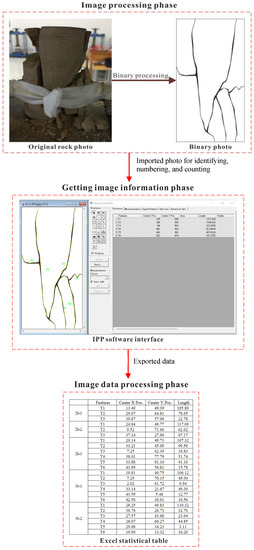
Figure 4.
Basic statistical flowing chart for crack processing.

Table 2.
Statistical results of crack lengths of rock specimens under different water-bearing states.
3.2. Stress and AE Parameters Evolution
Figure 5 shows the evolution process of AE parameters including AE hits, the hit rate, AE amplitude, and axial stress versus the time of sandstone specimens under three different water states, respectively. In order to provide a criterion for the stage division, the signs of σ and σmax are used to denote the applied axial stress and the axial peak stress, respectively. According to the evolution trend of the uniaxial compressive stress and detected AE hits, the four stages are divided as follows: Stage I (0 < σ¼1/4σmax), Stage II (1/4σmax < σ½1/2σmax), Stage III (1/2σmax < σ¾3/4σmax), and Stage IV (3/4σmax < σ < σmax). As shown in Figure 5, the purple curve represents the variation of the AE hit rate with time; the black curve represents the variation of uniaxial compressive stress with time; the blue curve represents the variation of the AE hit number with time; and the red dot represents the AE amplitude distribution.
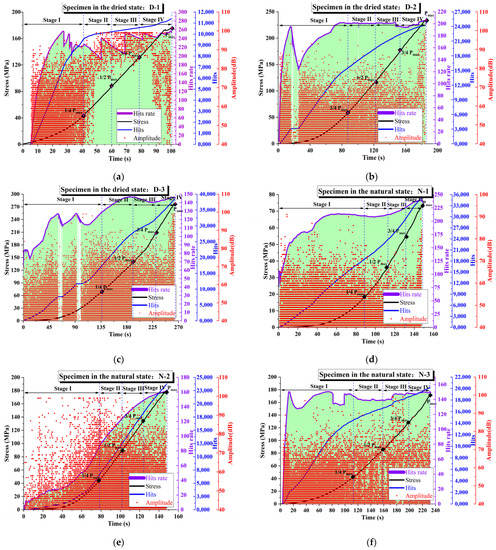
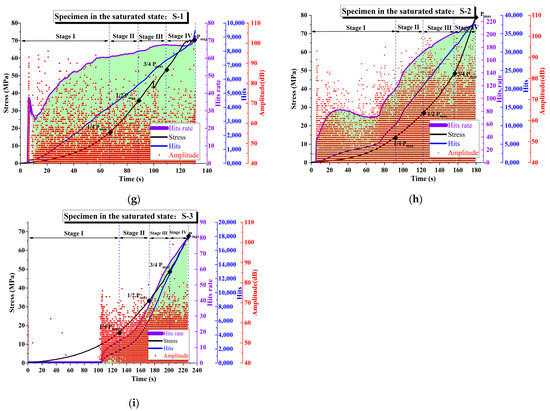
Figure 5.
AE hit, hit rate, and amplitude distribution diagram of failure stages for rock specimens under different water-bearing states: (a) D-1; (b) D-2; (c) D-3; (d) N-1; (e) N-2; (f) N-3; (g) S-1; (h) S-2; (i) S-3.
Figure 5a–c present the variations in AE parameters of sandstone under dried conditions. It can be seen from the diagram that the AE hit number increases with the increasing load. The total AE hit numbers of the three dried specimens are 11,741, 24,253, and 38,298, respectively. The AE hit rate fluctuates greatly during Stage I and II, with a larger growth rate. There is a significant downward trend in the later period, indicating that during Stage III, a large number of micro-cracks are initiated in the rock, and the brittleness of dried sandstone is at a high level. The AE hit rates of three sandstones under dry conditions are 194.2, 162.4, and 133.4, respectively, with an average of 163.3. The AE amplitude reaches its maximum values during Stage IV; that is, the sandstone fracture has a high AE amplitude, which can be used as precursor information for rock fractures.
Figure 5d–f presents the variation of AE parameters of sandstones under natural conditions. It can be seen from the diagram that the AE hit number also increases with the increasing load. The total AE hit numbers of the three natural specimens are 34,992, 23,669, and 20,217, respectively. Different from dried specimens, the fluctuation of the AE hit rate is not obvious, and the increase in the hit rate is mainly reflected in Stages II and III, indicating that the rock is loaded into the elastic–plastic stage. The AE hit rates of three sandstones under dry conditions are 204.4, 108.9, and 125.2, respectively, with an average of 146.2. The AE amplitude is larger during Stages III and IV, which means that the main fracture surface of sandstone is formed during this period.
Figure 5g–i presents the variation law of AE parameters of sandstone in a saturated state. The total AE hit numbers of the three natural specimens are 9477, 38,160, and 17,919, respectively. It can be seen from the diagram that the fluctuation of the AE hit rate is not obvious either, and the increase in the hit rate is mainly reflected in Stages III and IV, indicating that when the load is close to the peak value, a large number of micro-cracks are generated inside the rock. The AE hit rates of three sandstones in saturated states are 61.0, 151.2, and 101.3, respectively, with an average of 104.5. The AE amplitude is relatively uniform in the four stages, indicating that the new main fracture surface is not obvious when the saturated sandstone is loaded, or due to the saturated and softened effect, the rock fracture process releases lower energy and is much gentler.
As shown in Figure 5, the water content has a great influence on the rock’s strength. The increase in water content will soften the rock, weaken the rock’s internal microstructure, and then reduce the cohesion degree between internal particles, resulting in a decrease in rock’s strength. When the rock is in a dried state, the failure strength is larger than 200 MPa. When the rock is in its natural state, the failure strength varies from 150 to 200 MPa. However, when the rock is in a saturated state, the failure strength is smaller than 100 MPa. Thus, with the increase in water content, the rock tends to obtain poorer mechanical properties and a smaller failure strength. As can be seen, the water content has a significant influence on the AE hit rate. The average number of AE hit rates of dried rocks is larger than that of rocks in both natural and saturated conditions, which is due to the fact that more AE signals are generated per unit time during the loading process. The higher the AE hit rate, the more numerous and complex the internal cracks in the rock under the loading action. This also indicates that there is a greater accumulation of energy in rocks, which causes more severe damage and failure. That is to say, since the existence of water, which has lubrication effects, hinders AE signal propagation, the AE signals are less active within a rock in a saturated condition. When the rock is immersed in water, its structure softens, which makes brittle fractures and micro-cracks hard to occur and initiate in large amounts inside the rock. Meanwhile, when the water content of the specimen is higher, the amplitude intensity of the AE signal emitted from the specimen during the test process is at a lower level. The larger the AE hit, the amplitude and hit rate in the dry rock indicate more macroscopic fractures, which is consistent with the observation of the final failure modes of the specimen.
3.3. Quantitative Evaluation of AE b-Value
In seismological research, Gutenberg and Richard established a criterion (Gutenberg–Richter Law) to explain the relationship between an earthquake’s magnitude and the number of earthquakes larger than this magnitude in the form of the following formula:
where M is the earthquake’s magnitude and N is the number of events larger than M. The parameters a and b are constants, which represent the seismic level of the region and the intensity of micro-fracture activity within the rock, respectively.
Similar to the earthquake mechanism, when rocks are damaged under external force, micro-cracks and macro-cracks develop, and elastic waves are released in a manner that is similar to earthquakes. Therefore, the b-value can be used as the ratio of micro-cracks to macro-cracks to speculate on the expansion of a crack in the rock’s mass. When the rock’s mass mainly produces micro-cracks, AE signals with smaller amplitudes are generated, which indicates a small-scale failure occurrence with lower energy release and, therefore, a larger b-value can be obtained. When the rock’s mass mainly produces macro-cracks, AE signals with larger amplitudes are generated, which indicates a large-scale failure occurrence with higher energy release and, therefore, a smaller b-value. Hence, it is an effective indicator to reflect the internal cracking state of the rock’s mass [64,65,66,67]. During the test, the AE system is used to monitor and obtain characteristic values of AE parameters, which can be used to calculate the b-value. The magnitude in the G–R relationship can be replaced by the amplitude, and Formula (3) can be written as follows:
where AdB (dB) means the peak amplitude of the acoustic emission event, and N is the incremental frequency, indicating the number of acoustic emission hits with an amplitude larger than AdB [68,69].
The b-value evolution law is revealed for each sandstone from the perspective of crack development. The AE data obtained from specimen N-1 are used as an example to describe calculation process. The total duration of the experiment is 149.9 s, and the time series is divided into 15 groups: 0–10 s, 0–20 s, 0–30 s, 0–40 s, 0–50 s, 0–60 s, 0–70 s, 0–80 s, 0–90 s, 0–100 s, 0–110 s, 0–120 s, 0–130 s, 0–140 s, and 0–149.9 s. Then, the b-value of the AE signals in each group can be calculated using the linear least-square fitting method. In Figure 6, the first red column indicates that the number of AE events with an amplitude greater than 40 dB is 21,267. However, the last red column means that only 12 AE events with amplitudes larger than 95dB are generated. Figure 7 presents the fitting results of AE b-value for rock specimen N−1. As shown in Figure 7, a plane coordinate system with AdB/20 as the x-axis and log10 (N) as the y-axis is established, and a series of data points from Figure 6 are plotted. To depict the scatters, linear fitting is performed and the fitting results indicate that the b-value, which is actually the slope of the fitting line, is 1.455. Moreover, R2 is the fitting coefficient and it reaches about 0.9992. Since the value of R2 is nearer to 1.0, the accuracy of the fitting results can be proven.
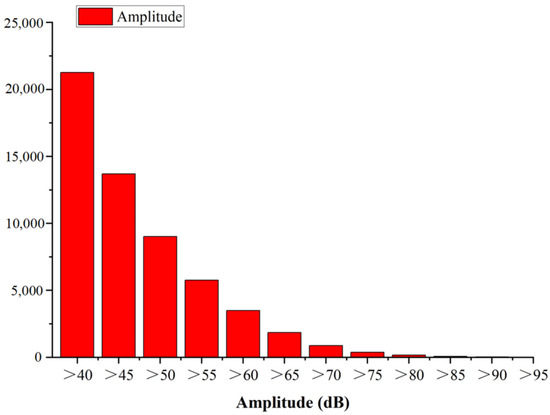
Figure 6.
The relationship between AE amplitude and N value of rock specimen N−1.
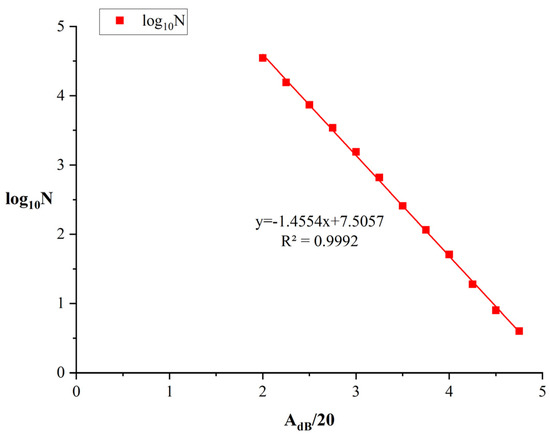
Figure 7.
Fitting results of AE b-value for rock specimen N−1.
The same calculation process is performed on other specimens, and the variations in the b-value for all of the specimens versus four loading stages are given in Figure 8. The b-value curves of all the specimens are not smooth with obvious fluctuations, which are caused by rock non-homogeneity and crack development complexity. During Stage I, the b-values fell in the range of 0.9–1.4 for dried rocks, 0.7–1.6 for natural rocks, and 0.5–1.6 for saturated rocks, respectively. For saturated rocks, a few AE hits were generated, resulting in more discrete b-values.
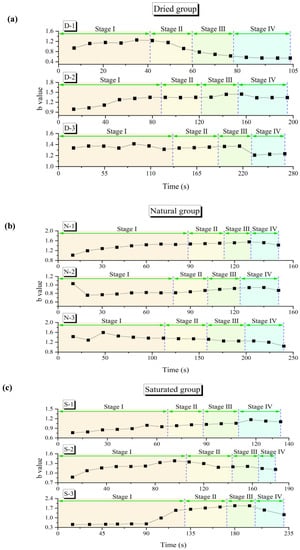
Figure 8.
b-value evolution at different stages of rock specimens under different water-bearing states: (a) dried group; (b) natural group; (c) saturated group.
Since the b-value is strongly related to the energy release during the loading process, lower b-values can be observed at higher energy rates. When the rocks were at Stages II and III, the b-value fluctuated slightly, which indicated that micro-fractures develop slowly in the rock, corresponding to the elastic deformation and micro-cracks stable expansion. During Stage IV, more and more micro-cracks and macro-cracks were generated in rocks with different scales of energy release, resulting in the b-value decreasing as the energy rate increased. Thereafter, the b-value decreased obviously and reached its minimum value. The lowest recorded b-values were 0.544, 1.341, and 1.207 for dried rocks; 1.425, 0.870, and 1.042 for natural rocks; and 1.076, 1.113, and 1.227 for saturated rocks, respectively. Lots of large-magnitude cracks in rocks, which corresponded to unstable crack expansion, were generated at this stage. Along with the increasing load and AE event accumulation, the b-value showed a significant decline, indicating an increasing proportion of large-scale cracks.
In order to better compare b-value evolution properties, Figure 9 presents the average b-value at four stages for sandstones in three groups. The b-value first decreases during Stage I and then increases during Stages II and III with the increasing water content. The lower b-value is obtained during Stage IV, indicating a larger proportion of macro-cracks. Moreover, the mean value of the average b-value has an obvious increasing trend with the decreasing water content, which was 1.066 for the dried group, 1.180 for the natural group, and 1.250 for the saturated group, indicating that the proportion of macro-cracks generated in dried sandstone significantly increases with large amounts of energy release and an increasingly violent failure intensity.
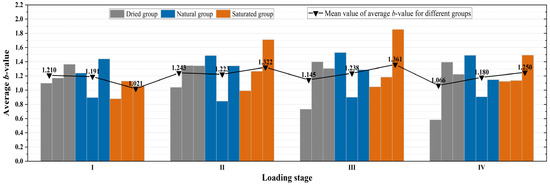
Figure 9.
b-value evolution process of rock specimens at different stages under the same water-bearing states.
3.4. Quantitative Analysis of AE Fractal Dimensions
Fractal refers to the fact that a part of a thing is similar to the whole in some way, with self-similarity and scale invariance. The fractal dimension is often used to quantitatively describe the degree of self-similarity [70]. A larger fractal dimension implies a larger self-similarity, and a smaller fractal dimension implies a smaller self-similarity [71]. AE parameters, such as the hit rate, have obvious correlation characteristics with a rock’s internal damage evolution, and the AE fractal dimension is an effective indicator for evaluating rock failure [72]. Previous studies have shown that not only do the acoustic emission parameters have fractal characteristics, but also the evolution of micro-cracks has fractal characteristics in the process of rock failure [73,74]. In this paper, the fractal dimensions of the AE hit rate in the failure process of sandstones with different water contents are calculated. For a sample size of n, the time series of the AE hit rate is written as follows:
where N = n – m + 1 and m-dimensional vectors can be constructed as follows:
Then, set the scale r(k), which is as follows:
where k is the proportional constant, usually taken as 10–20. The correlation function W[r(k)] corresponding to each vector can be expressed as follows:
The slope is obtained by linear fitting of the data points (lgW[r(k)], lgr(k)):
D(m) is the fractal characteristic of the AE hit rate in the measurement scale range. The fractal dimension Di is often calculated using a fixed sample capacity of m, and the time Ti corresponding to the first or last parameter of the sample is actually the scale of the fractal dimension Di. As m increases, the straight line slope Di should gradually converge to a stable value; otherwise, the sequence set is a random sequence. In this paper, the G-P algorithm is used to calculate the fractal dimension Di of the AE hit rate. Taking the AE test data as a sample that has the fixed time window of U, the fractal dimension Di of a single AE hit rate can be calculated, and the time ti corresponding to the end of the time window is used as the scale of Di [75,76,77]. On this basis, the fractal dimension of the AE hit rate in the whole rock failure process is calculated with a fixed step distance I. Moreover, the fixed time window U is set to 30 s, and the sliding window I is set to 10 s. The calculation method of the AE fractal dimension is illustrated in Figure 10.
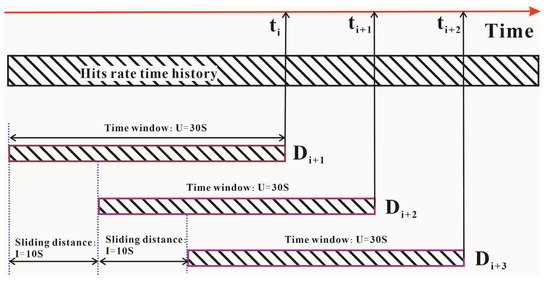
Figure 10.
Illustration of AE fractal dimension calculation.
The change in the AE correlation dimension of rock reflects the internal damage evolution of rock, and the decrease in the fractal dimension indicates the occurrence of a main fracture or failure [78]. Some research has shown that the fractal dimension increases with the increasing levels of applied stress, and when the stress reaches about 40% of the peak stress, the fractal dimension begins to decrease [79]. According to the stress ratio, the fractal dimensions of the AE hit rate of sandstones with different water contents are calculated using the G-P algorithm, as shown in Figure 11. As the stress ratio increases, the AE hit rate fractal dimension experiences a process of decreasing, increasing, and then decreasing again until achieving final stability. When the stress is 0–15% of the peak stress, the average fractal dimension of the three groups’ sandstone begins to gradually reduce. The largest fractal dimension is 1.17 for the natural group, and the smallest fractal dimension is 0.55 for the saturated group. When the stress is 15–50% of the peak stress, the average fractal dimension of the three groups’ sandstone increases first and then decreases with obvious fluctuations. The fractal variation range is large, between 0.33 and 0.95, indicating that internal cracks in the rock are generated and disorderly expanded at any time after the sandstone is loaded. When the stress exceeds 50% of the peak stress, the AE signal increases significantly, and the average fractal dimension of the three groups’ sandstone is no longer significantly reduced, indicating that the damage to the rock is accumulating gradually at the failure site of the specimen to form macroscopic cracks. When the load reaches peak stress, the internal micro-cracks of the specimen gradually evolve into macroscopic cracks, accompanied by a sharp release of energy. Through the calculation of the AE hit rate fractal dimension, the similarity of AE activity inside a rock specimen during its deformation and failure processes is revealed, and the internal AE hit rate undergoes a change, from order to chaos and then back to order. When the micro-cracks in sandstone gradually transform into macroscopic cracks, the fractal dimension is no longer significantly reduced. Comparing the fractal dimensions of three groups’ sandstone, it is found that sandstone has the largest stable dimension of 0.52 in the dry group, and the smallest stable dimension of 0.41 in the saturated group. The stable dimension of sandstone in the natural group is in between, which is 0.46. The calculation results show that the fractal dimension of the AE hit rate of sandstone under different water content conditions has certain differences, which also reflect the influence of water content on the fracture deformation of sandstone. When the sandstone is dry or the water content is low, the fractal dimension of the hit rate is large, which means that the micro-cracks generated in rocks are more complex, and the rupture degree is deeper, with a larger amount of energy released. When the sandstone is saturated, the fractal dimension of the hit rate is small, which means that the micro-crack agglomeration is not obvious, and the rock is not fully broken.
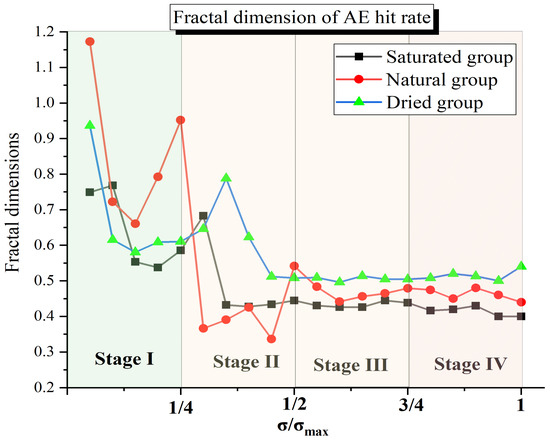
Figure 11.
AE hit rate fractal dimensions of sandstones in different groups.
3.5. Quantitative Analysis of AE Frequency–Amplitude Distribution
The acoustic emission signal contains a lot of information on the evolution of internal damage sources in the process of rock deformation and failure. The AE signal is often composed of multiple frequency components, which can reflect the size, type, and scale of the collected cracks. Therefore, the spectrum information obtained by processing the AE signal can reflect the fracture’s evolution process in rocks [80,81]. Fast Fourier transform (FFT) is adopted to convert a signal from the time domain to the frequency domain and extract its spectrum to obtain the frequency structure of the signal.
Matlab (R2020a) software is used to perform the FFT transformation on each acoustic emission waveform signal (see Figure 12a) collected in the complete compression test to obtain a two-dimensional spectrogram. After denoising, the main frequency with cusp peak properties is extracted and defined as the main frequency (see Figure 12b). The dominant frequency is an important frequency domain feature of the acoustic emission signal, which can better reflect the essential properties of rocks than its parameter characteristics. Figure 13, Figure 14 and Figure 15 present the distributions of the major frequency domain for typical specimens in three different states. Moreover, the color of the data point changes from blue to red, indicating the transition from smaller amplitudes to larger amplitudes. To clarify the spectrum characteristics, the frequency distribution interval is divided into four frequency bands, including a low frequency band, a medium frequency band, a medium and high frequency band, and a high frequency band, and the corresponding frequency interval ranges are 0~75 kHz, 75~150 kHz, 150~250 kHz, and 250~350 kHz.

Figure 12.
Determination of dominant frequency of one AE waveform.
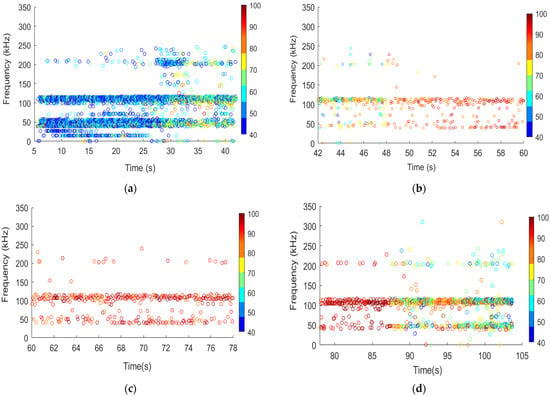
Figure 13.
Distribution of dominant frequency domain for dried specimen D−1: (a) Stage I; (b) Stage II; (c) Stage III; (d) Stage IV.
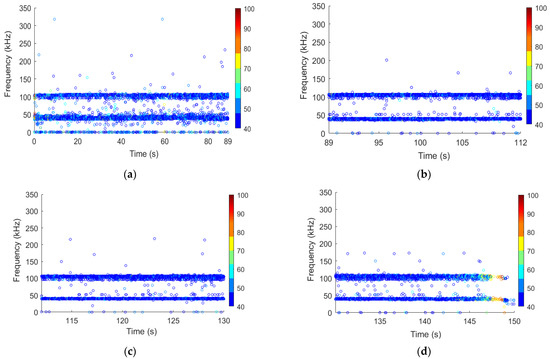
Figure 14.
Distribution of major frequency domain for natural specimen N-1: (a) Stage I; (b) Stage II; (c) Stage III; (d) Stage IV.
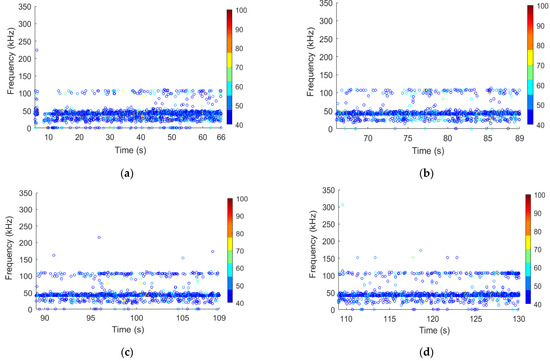
Figure 15.
Distribution of major frequency domain for saturated specimen S-1: (a) Stage I; (b) Stage II; (c) Stage III; (d) Stage IV.
As shown in Figure 13, the dominant frequency bands are mainly concentrated around 110 kHz and 50 kHz. In Stage I, AE signals of low amplitude (i.e., 40–60 dB) are emitted, and several clusters exist within the middle–high frequency band (i.e., 200–230 kHz). Entering Stage II, high-amplitude AE signals begin to emit while high-frequency AE signals are significantly reduced. At Stage III, a large number of AE signals with high amplitudes exceeding 80 dB are detected. Finally, during the increase in axial stress P from 3/4Pmax to Pmax, a continuous series of AE signals with various amplitude levels from low to high are emitted in large amounts, indicating the occurrence of ruptures at different scales within the rock.
In Figure 14 and Figure 15, the dominant frequency bands are still mainly concentrated around 110 kHz and 50 kHz. Compared to the dried specimens, natural specimens and saturated specimens with higher water contents often generated fewer AE signals, which have lower amplitudes and distribute in a narrower frequency range. Thus, 110 kHz and 50 kHz are the two dominant frequencies of the tested sandstone specimens, no matter in which state they are, and water content mainly affects the generation of high frequency components. As the water content increases, the number of waveforms located in the range of 200–300 kHz decreases, while the number of waveforms located in the range of 0–50 kHz significantly increases. This variation may be closely related to the change in the microscopic structures in sandstone specimens during drying or water absorption treatment. Generally speaking, AE signals with higher amplitudes and lower frequencies indicate large-scale fracture generation with large amounts of energy release. It can be clearly observed that the amplitudes of AE signals for dried specimens are significantly higher than those of natural and saturated specimens, which illustrates the generation of more large-scale fractures in tested dried rock.
Meanwhile, Table 3 summarizes the statistical distribution of the dominant frequency for sandstone specimens at different stages. Note that the LF band, MF band, MHF band, and HF band indicate a low frequency band, a middle frequency band, a middle and high frequency band, and a high frequency band, respectively, which correspond to the frequency ranges of (0~75 kHz), (75~150 kHz), (150~250 kHz), and (250~350 kHz). Overall, there is a reduction in the proportion of AE signals in the low frequency band and an increase in the proportion of AE signals in the middle and middle–high frequency bands from Stages I to IV. When the stress level is less than 25% Pmax (Stage I), the average proportions of AE signals in the LF band and MF band are 71.78% and 27.27% for dried specimens; 83.69% and 16.28% for natural specimens; and 88.03% and 11.93% for saturated specimens. Almost no AE signals exist in the MHF and HF bands. When the stress level is more than 25% Pmax and less than 50% Pmax (Stage II), the average proportions of AE signals in the LF and MF bands are 37.65% and 60.48% for dried specimens; 56.16% and 43.80% for natural specimens; and 75.97% and 23.96% for saturated specimens. The average proportion of AE signals generated from dried specimens in the MHF band grows from 0.95% to 1.87%. Yet, the proportions of AE signals generated from natural and saturated specimens in the MHF and HF bands remain small. When the stress level is more than 50% Pmax and less than 75% Pmax (Stage III), the average proportions of AE signals in the LF and MF bands are 22.54% and 75.57% for dried specimens; 53.29% and 46.45% for natural specimens; and 76.38% and 23.51% for saturated specimens. The average proportion of AE signals generated from natural and saturated specimens in the MHF band slightly increased. When the stress level exceeds 75% Pmax (Stage IV), the average proportions of AE signals in the LF and MF bands are 21.95% and 75.83% for dried specimens; 56.84% and 42.66% for natural specimens; and 69.25% and 30.58% for saturated specimens. About 2.18%, 0.46%, and 0.15% of the total AE signals generated from dried, natural, and saturated specimens are located in the MHF band, respectively. Similarly, AE events with frequency components in the HF band are hardly observed. The analysis shows that acoustic signals with higher frequencies (above 150 kHz) and amplitudes (above 80 dB) can serve as an approach to indicate the unstable activities of sandstone rock with lower water content under uniaxial compression.

Table 3.
Proportions of different frequency bands.
4. Conclusions
In this paper, quantitative analyses of rock acoustic emission characteristics and cracking properties were conducted, including aspects of fracture surface morphology, AE b-value, fractal dimensions, and frequency–amplitude distribution. The following conclusions can be drawn from this study:
- (1)
- The presence of water in sandstone had a significant weakening effect on the rock’s strength and failure intensity. As the water content increased, the cracks’ fractal dimensions and total length gradually decreased, which implied that saturated rocks consumed less energy to generate simpler cracks. Observing the rock failure surface showed a trend of saturated sandstone with more obvious tensile fractures and dried sandstone with more obvious shear fractures.
- (2)
- The variation characteristics of the AE b-value can be viewed as an index for evaluating the damage evolution of sandstones exposed to different water contents. The lowest b-value appears at the final destruction stage, and the mean value of the average b-value has an obvious increasing trend with the decreasing water content, which was 1.066 for the dried group, 1.180 for the natural group, and 1.250 for the saturated group, indicating that the proportion of macro-cracks generated in dried sandstone increases significantly with large amounts of energy release and its failure intensity becomes more violent.
- (3)
- The fractal dimension results of the AE hit rate show the self-similarity in the process of the rock’s mass deformation and failure, that is, the transformation from order to disorder to order. When sandstone is dry, its average fractal dimension is 0.52, and the micro-cracks in the rock’s mass are complex with the largest energy release. The average fractal dimension of the natural group is about 0.46, and the rock’s mass is more fully fractured. When sandstone is saturated, the fractal dimension is the smallest at 0.41. The micro-crack agglomeration is not obvious, and the rock’s mass is not fully broken.
- (4)
- The AE waveforms associated with the major frequencies of 110 kHz and 50 kHz make up the largest proportion of observed AE events, which might be due to the mineral composition of the tested sandstone. Moreover, as the water content increases, the amounts of waveforms at 200–300 kHz decrease, while at 0–50 kHz, they significantly increase. Acoustic signals with higher frequencies (above 150 kHz) and amplitudes (above 80 dB) can serve as an approach to indicate the unstable activities of sandstone rocks with lower water contents under uniaxial compression.
All of the primary findings of this research could lead to safety improvements in engineering projects involving sandstones with different water contents.
Author Contributions
Conceptualization, H.W.; methodology, Z.C.; software, C.X.; validation, C.X.; formal analysis, R.Y.; investigation, S.C. and F.Z.; resources, H.W.; writing—original draft preparation, H.W.; writing—review and editing, Z.C.; visualization, C.X.; supervision, C.X. All authors have read and agreed to the published version of the manuscript.
Funding
This research was funded by the National Natural Science Foundation of China (41972296, 41807254, and 42177117), the China Postdoctoral Science Foundation (2020M682372), the Young Talent Support Project of Henan Province (2021HYTP013), and the Key Research and Development and promotion projects of Henan Province (212102310374 and 222102320265).
Conflicts of Interest
The authors declare no conflict of interest.
References
- Cai, X.; Zhou, Z.L.; Tan, L.H.; Zang, H.Z.; Song, Z.Y. Water saturation effects on thermal infrared radiation features of rock materials during deformation and fracturing. Rock Mech. Rock Eng. 2020, 53, 4839–4856. [Google Scholar] [CrossRef]
- Cai, X.; Zhou, Z.Z.; Zang, H.Z.; Song, Z.Y. Water saturation effects on dynamic behavior and microstructure damage of sandstone: Phenomena and mechanisms. Eng. Geol. 2020, 276, 105760. [Google Scholar] [CrossRef]
- Chen, G.Q.; Li, T.B.; Guo, F.; Wang, Y.K. Brittle mechanical characteristics of hard rock exposed to moisture. Bull. Eng. Geol. Environ. 2017, 76, 219–230. [Google Scholar] [CrossRef]
- Grgic, D.; Amitrano, D. Creep of a porous rock and associated acoustic emission under different hydrous conditions. J. Geophys. Res. Solid Earth 2009, 114, 1–19. [Google Scholar] [CrossRef]
- Codeglia, D.; Dixon, N.; Fowmes, G.J.; Marcato, G. Analysis of acoustic emission patterns for monitoring of rock slope deformation mechanisms. Eng. Geol. 2017, 219, 21–31. [Google Scholar] [CrossRef]
- Wang, H.; Li, J.; Guo, Q.; Shi, R.; Zhao, Z.; Zhang, Y.; Zhao, F. Experimental study on the influence of water on the failure properties of sandstone. Bull. Eng. Geol. Environ. 2021, 80, 7747–7771. [Google Scholar] [CrossRef]
- Du, S.G.; Saroglou, C.; Chen, Y.F.; Lin, H.; Yong, R. A new approach for evaluation of slope stability in large open-pit mines: A case study at the Dexing Copper Mine, China. Environ. Earth Sci. 2022, 81, 102. [Google Scholar] [CrossRef]
- Zhou, Z.L.; Cai, X.; Cao, W.Z.; Li, X.B.; Xiong, C. Influence of water content on mechanical properties of rock in both saturation and drying processes. Rock Mech. Rock Eng. 2016, 49, 3009–3025. [Google Scholar] [CrossRef]
- Lai, X.P.; Zhang, S.; Dai, J.J.; Wang, Z.Y.; Xu, H.C. Multi-scale damage evolution characteristics of coal and rock under hydraulic coupling. Chin. J. Rock Mech. Eng. 2020, 39, 3217–3228. [Google Scholar] [CrossRef]
- Erguler, Z.A.; Ulusay, R. Water-induced variations in mechanical properties of clay-bearing rocks. Int. J. Rock Mech. Min. Sci. 2009, 46, 355–370. [Google Scholar] [CrossRef]
- Pham, Q.T.; Vales, F.; Malinsky, L.; Minh, D.N.; Gharbi, H. Effects of desaturation-resaturation on mudstone. Phys. Chem. Earth Parts A/B/C 2007, 32, 646–655. [Google Scholar] [CrossRef]
- Bagde, M.N.; Petroš, V. Fatigue properties of intact sandstone samples subjected to dynamic uniaxial cyclical loading. Int. J. Rock Mech. Min. Sci. 2004, 42, 237–250. [Google Scholar] [CrossRef]
- Lyu, Q.; Ranjith, P.G.; Long, X.P.; Ji, B. Experimental investigation of mechanical properties of black shales after CO2-water-rock interaction. Materials 2016, 9, 663. [Google Scholar] [CrossRef] [PubMed]
- Wong, L.N.Y.; Jong, M.C. Water saturation effects on the Brazilian tensile strength of gypsum and assessment of cracking processes using high-speed video. Rock Mech. Rock Eng. 2014, 47, 1103–1115. [Google Scholar] [CrossRef]
- Chang, S.H.; Lee, C.I. Estimation of cracking and damage mechanisms in rock under triaxial compression by moment tensor analysis of acoustic emission. Int. J. Rock Mech. Min. Sci. 2004, 41, 1069–1086. [Google Scholar] [CrossRef]
- Li, G.; Liang, Z.Z.; Tang, C.A. Morphologic interpretation of rock failure mechanisms under uniaxial compression based on 3D multiscale high-resolution numerical modeling. Rock Mech. Rock Eng. 2015, 48, 2235–2262. [Google Scholar] [CrossRef]
- Yang, T.; Liu, H.Y.; Tang, C.A. Scale effect in macroscopic permeability of jointed rock mass using a coupled stress–damage–flow method. Eng. Geol. 2017, 228, 121–136. [Google Scholar] [CrossRef]
- Zhang, Q.B.; Zhao, J. Effect of loading rate on fracture toughness and failure micromechanisms in marble. Eng. Fract. Mech. 2013, 102, 288–309. [Google Scholar] [CrossRef]
- Zhang, Z.H.; Deng, J.H.; Zhu, J.B.; Liu, L.R. An Experimental investigation of the failure mechanisms of jointed and intact marble under compression based on quantitative analysis of Acoustic Emission waveforms. Rock Mech. Rock Eng. 2018, 51, 2299–2307. [Google Scholar] [CrossRef]
- Li, S.J.; Yang, D.X.; Huang, Z.; Gu, Q.X.; Zhao, K. Acoustic emission characteristics and failure mode analysis of rock failure under complex stress state. Theor. Appl. Fract. Mech. 2022, 122, 103666. [Google Scholar] [CrossRef]
- Huang, Z.; Gu, Q.X.; Wu, Y.F.; Wu, Y.; Li, S.J.; Zhao, K.; Zhang, R. Effects of confining pressure on acoustic emission and failure characteristics of sandstone. Int. J. Min. Sci. Technol. 2021, 31, 963–974. [Google Scholar] [CrossRef]
- Zhao, Z.J.; Wang, H.J.; Cui, Z.D.; Zhao, F.; Tang, T.W.; Han, W.G.; Wang, X.D. Experimental study on Mode-I fracture toughness using Chevron Straight-notched Semi-circular Bend (CSNSCB) method. Theor. Appl. Fract. Mech. 2021, 116, 103093. [Google Scholar] [CrossRef]
- He, J.H.; Yong, L.; Deng, H.C.; Tang, J.M.; Wang, Y.Y. Quantitative evaluation and influencing factors analysis of the brittleness of deep shale reservoir based on multiple rock mechanics experiments. Nat. Gas. Geosci. 2022, 33, 1102–1116. [Google Scholar] [CrossRef]
- Zhu, Q.Q.; Li, D.Y.; Ma, J.Y.; Han, Z.Y.; Li, X.B. Mixed mode I/II fracture behavior and surface morphology of hard rock under dynamic loading. Theor. Appl. Fract. Mech. 2023, 125, 103860. [Google Scholar] [CrossRef]
- Zhao, G.F.; Luo, D.N.; Su, G.S.; Chen, B.R.; Huang, J.H. Experimental research on the evolutionary characteristics of acoustic signals for concrete cracking under uniaxial compression. Appl. Acoust. 2022, 191, 108671. [Google Scholar] [CrossRef]
- Kharghani, M.; Goshtasbi, K.; Nikkah, M.; Ahangari, K. Investigation of the Kaiser effect in anisotropic rocks with different angles by acoustic emission method. Appl. Acoust. 2021, 175, 107831. [Google Scholar] [CrossRef]
- Tang, C.A. Numerical simulation of AE in rock failure. Chin. J. Rock Mech. Eng. 1997, 16, 368–374. [Google Scholar]
- Jiang, R.C.; Dai, F.; Liu, Y.; Li, A.; Feng, P. Frequency characteristics of acoustic emissions induced by crack propagation in rock tensile fracture. Rock Mech. Rock Eng. 2021, 54, 2053–2065. [Google Scholar] [CrossRef]
- Cai, M.; Kaise, P.K.; Tasaka, Y.; Maejima, T.; Morioka, H.; Minami, M. Generalized crack initiation and crack damage stress thresholds of brittle rock masses near underground excavations. Int. J. Rock Mech. Min. Sci. 2004, 41, 833–847. [Google Scholar] [CrossRef]
- Wang, H.J.; Zhao, F.; Huang, Z.Q.; Yao, Y.M.; Yuan, G.X. Experimental study of mode-I fracture toughness for layered shale based on two ISRM-suggested methods. Rock Mech. Rock Eng. 2017, 50, 1933–1939. [Google Scholar] [CrossRef]
- Wang, H.; Liu, D.; Cui, Z.; Cheng, C.; Zhou, J. Investigation of the fracture modes of red sandstone using XFEM and acoustic emissions. Theor. Appl. Fract. Mech. 2016, 85, 283–293. [Google Scholar] [CrossRef]
- Du, S.G.; Lin, H.; Yong, R.; Liu, G.J. Characterization of Joint Roughness Heterogeneity and Its Application in Representative Sample Investigations. Rock Mech. Rock Eng. 2022, 55, 3253–3277. [Google Scholar] [CrossRef]
- Zhu, J.; Deng, J.H.; Chen, F.; Ma, Y.J.; Yao, Y.F. Water-weakening effects on the strength of hard rocks at different loading rates: An experimental study. Rock Mech. Rock Eng. 2021, 54, 4347–4353. [Google Scholar] [CrossRef]
- Dong, L.J.; Sun, D.Y.; Shu, W.W.; Li, X.B.; Zhang, L.Y. Statistical precursor of induced seismicity using seismic sequence in mines. In Proceedings of the World Conference on Acoustic Emission, Xi’an, China, 10–13 October 2017; Springer International Publishing: Cham, Switzerland, 2017. [Google Scholar] [CrossRef]
- Zhao, X.G.; Wang, J.; Cai, M.; Cheng, C.; Ma, L.K.; Su, R.; Zhao, F.; Li, D.J. Influence of unloading rate on the strainburst characteristics of Beishan granite under true-triaxial unloading conditions. Rock Mech. Rock Eng. 2014, 47, 467–483. [Google Scholar] [CrossRef]
- Deng, C.F.; Liu, J.F.; Chen, L.; Li, Y.; Xiang, G. Mechanical behaviors and acoustic emission characteristics of fracture of granite under different moisture conditions. Chin. J. Geotech Eng. 2017, 39, 1538–1544. [Google Scholar]
- Zhao, Y.C.; Yang, T.H.; Xu, T.; Zhang, P.H.; Shi, W.H. Mechanical and energy release characteristics of different water-bearing sandstones under uniaxial compression. Int. J. Damage Mech. 2018, 27, 640–656. [Google Scholar] [CrossRef]
- Zhou, Z.L.; Cai, X.; Ma, D.; Cao, W.Z.; Chen, L.; Zhou, J. Effects of water content on fracture and mechanical behavior of sandstone with a low clay mineral content. Eng. Fract. Mech. 2018, 193, 47–65. [Google Scholar] [CrossRef]
- Zhu, Z.F.; Chen, G.Q.; Xiao, H.Y.; Liu, H.; Zhao, C. Study on crack propagation of rock bridge based on multi parameters analysis of acoustic emission. Chin. J. Rock Mech. Eng. 2018, 37, 909–918. [Google Scholar] [CrossRef]
- Su, G.S.; Shi, Y.J.; Feng, X.T.; Jiang, J.Q.; Zhang, J.; Jiang, Q. True-triaxial experimental study of the evolutionary features of the acoustic emissions and sounds of rockburst processes. Rock Mech. Rock Eng. 2018, 51, 375–389. [Google Scholar] [CrossRef]
- He, M.C.; Miao, J.L.; Feng, J.L. Rock burst process of limestone and its acoustic emission characteristics under true-triaxial unloading conditions. Int. J. Rock Mech. Min. Sci. 2010, 47, 286–298. [Google Scholar] [CrossRef]
- Zhang, Y.B.; Huang, X.H.; Li, S.S.; Liu, X.X. Spectral character analysis of sandstone under saturation condition in rupture procedure. Rock Soil Mech. 2013, 34, 1574–1578. [Google Scholar] [CrossRef]
- Wang, C.Y.; Du, X.Y. Experimental study on the effect of water on the main frequency characteristics of acoustic emission of granite. Min. Res. Dev. 2018, 38, 32–37. [Google Scholar] [CrossRef]
- Huang, X.H.; Li, S.S.; Zhang, Y.B.; Liu, X.X. Impact of water on the spectrum characteristics of acoustic emission in rock rupture process. Min. Res. Dev. 2013, 33, 38–41. [Google Scholar] [CrossRef]
- Schechinger, B.; Vogel, T. Acoustic emission for monitoring a reinforced concrete beam subject to four -point -bending. Constr. Build. Mater. 2007, 21, 483–490. [Google Scholar] [CrossRef]
- Wang, Y.; Wu, S.X.; Zhou, J.K. Experiment on acoustic emission characteristics of dam concrete under dynamic bending tension. Nondestruct. Test. 2009, 31, 115–119. [Google Scholar]
- Jiang, Y.D.; Li, H.T.; Zhao, Y.X.; Zhou, K. Effect of loading rate on energy accumulation and dissipation in rocks. J. China Univ. Min. Technol. 2014, 43, 369–373. [Google Scholar]
- Bieniawski, Z.T. Time-dependent behaviour of fractured rock. Rock Mech. 1970, 2, 123–137. [Google Scholar] [CrossRef]
- Peng, S.S.; Podnieks, E.R. Relaxation and the behavior of failed rock. Int. J. Rock Mech. Min. Sci. 1972, 6, 699–712. [Google Scholar] [CrossRef]
- Chong, K.P.; Hoyt, P.M.; Smith, J.W.; Paulsen, B.Y. Effects of strain rate on oil shale fracturing. Int. J. Rock Mech. Min. Sci. Geomech. Abstr. 1980, 17, 35–43. [Google Scholar] [CrossRef]
- Liu, G.; Xiao, F.U.; Qin, T. Rock mechanics characteristics and acoustic emission rule under small-size effect. Chin. J. Rock Mech. Eng. 2018, 37, 3905–3917. [Google Scholar]
- Sheng, M.; Tian, S.C.; Zhang, B.; Ge, H.K. Frequency analysis of multi-sources acoustic emission from high-velocity waterjet rock drilling and its indicator to drilling efficiency. Int. J. Rock Mech. Min. Sci. 2019, 115, 137–144. [Google Scholar] [CrossRef]
- Qiu, J.S.; Zhou, Y.X.; Vatin, N.I.; Guan, X.; Shukhrat, S.; Khon, K. Damage constitutive model of coal gangue concrete under freeze-thaw cycles. Constr. Build. Mater. 2020, 264, 120720. [Google Scholar] [CrossRef]
- Li, S.L.; Liu, X.; Ma, Y.F.; Zhang, L.G.; Feng, H. Influence of grouted sleeve and concrete strength of fabricated shear wall on acoustic emission detection method for sleeve compactness. J. Build. Eng. 2021, 43, 102541. [Google Scholar] [CrossRef]
- Chen, J.; Ye, Y.B.; Pu, Y.Y.; Xu, W.; Li, D.M. Experimental study on uniaxial compression failure modes and acoustic emission characteristics of fissured sandstone under water saturation. Theor. Appl. Fract. Mech. 2022, 119, 103359. [Google Scholar] [CrossRef]
- Jaeger, J.C.; Cook, N.G.W.; Zimmerman, R. Fundamentals of Rock Mechanics; Wiley-Blackwell: New York, NJ, USA, 2007; pp. 90–95. [Google Scholar]
- You, M.Q. True-triaxial strength criteria for rock. Int. J. Rock Mech. Min. Sci. 2009, 46, 115–127. [Google Scholar] [CrossRef]
- Renshaw, C.E.; Schulson, E.M.; Iliescu, D.; Murzda, A. Increased Fractured Rock Permeability After Percolation Despite Limited Crack Growth. J. Geophys. Res. Solid Earth 2020, 125, 2169–9313. [Google Scholar] [CrossRef]
- Renshaw, C.E.; Murdza, A.; Schulson, E.M. Experimental verification of the isotropic onset of percolation in 3D crack networks in polycrystalline materials with implications for the applicability of percolation theory to crustal rocks. J. Geophys. Res. Solid Earth 2021, 126, 023092. [Google Scholar] [CrossRef]
- Mogi, K. Experimental Rock Mechanics; Taylor and Francis: London, UK, 2007; pp. 12–14. [Google Scholar]
- Fairhurst, C.E.; Hudson, J.A. Draft ISRM suggested method for the complete stress-strain curve for the intact rock in uniaxial compression. Int. J. Rock Mech. Min. Sci. 1999, 36, 279–289. [Google Scholar]
- Bieniawski, Z.T.; Bernede, J.M. Suggested methods for determining the uniaxial compressive strength and deformability of rock materials: Part 1. Suggested method for determination of the uniaxial compressive strength of rock materials. Int. J. Rock Mech. Min. Sci. Geomech. Abstr. 1979, 16, 138–140. [Google Scholar] [CrossRef]
- He, M.C.; Zhao, F.; Cai, M.; Du, S. A novel experimental technique to simulate pillar burst in laboratory. Rock Mech. Rock Eng. 2015, 48, 1833–1848. [Google Scholar] [CrossRef]
- Zhao, K.; Yang, D.X.; Zeng, P.; Huang, Z.; Wu, W.K.; Li, B.; Teng, T.Y. Effect of water content on the failure pattern and acoustic emission characteristics of red sandstone. Int. J. Rock Mech. Min. Sci. 2021, 142, 104709. [Google Scholar] [CrossRef]
- Wang, H.J.; Zhao, F.; Huang, Z.Q.; Yu, H.C.; Niu, J.R.; Zhang, P. Study on acoustic emission characteristics of sandstone under different fracture modes. Arab. J. Geosci. 2018, 11, 772. [Google Scholar] [CrossRef]
- Meng, F.Z.; Zhou, H.; Wang, Z.Q.; Zhang, L.M.; Kong, L.; Li, S.J. Experimental study on the prediction of rockburst hazards induced by dynamic structural plane shearing in deeply buried hard rock tunnels. Int. J. Rock Mech. Min. Sci. 2016, 86, 210–223. [Google Scholar] [CrossRef]
- Dong, L.J.; Zhang, Y.H.; Sun, D.Y.; Chen, Y.C.; Tang, Z. Stage characteristics of acoustic emission and identification of unstable crack state for granite fracture. Chin. J. Rock Mech. Eng. 2022, 41, 120–131. [Google Scholar] [CrossRef]
- Colombo, I.S.; Main, I.G.; Forde, M.C. Assessing damage of reinforced concrete beam using “b-value” analysis of acoustic emission signals. J. Mater. Civ. Eng. 2003, 15, 280–286. [Google Scholar] [CrossRef]
- Nejati, H.R.; Ghazvinian, A. Brittleness effect on rock fatigue damage evolution. Rock Mech. Rock Eng. 2014, 47, 1839–1848. [Google Scholar] [CrossRef]
- Li, D.X.; Wang, E.Y.; Kong, X.G.; Muhammad, A.; Wang, D.M. Mechanical behaviors and acoustic emission fractal characteristics of coal specimens with a pre-existing flaw of various inclinations under uniaxial compression. Int. J. Rock Mech. Min. Sci. 2019, 116, 38–51. [Google Scholar] [CrossRef]
- Xie, H.P.; Liu, J.F.; Ju, Y. Fractal property of spatial distribution of acoustic emissions during the failure process of bedded rock salt. Int. J. Rock Mech. Min. Sci. 2011, 48, 1344–1351. [Google Scholar] [CrossRef]
- Zhang, R.; Dai, F.; Gao, M.Z.; Xu, N.W.; Zhang, C.P. Fractal analysis of acoustic emission during uniaxial and triaxial loading of rock. Int. J. Rock Mech. Min. Sci. 2015, 79, 241–249. [Google Scholar] [CrossRef]
- Feng, X.T.; Seto, M. Fractal structure of the time distribution of microfracturing in rocks. Geophys. J. Int. 1999, 136, 275–285. [Google Scholar] [CrossRef]
- Zhao, Y.; Wang, C.; Ning, L.; Zhao, H.; Bi, J. Pore and fracture development in coal under stress conditions based on nuclear magnetic resonance and fractal theory. Fuel 2022, 309, 122112. [Google Scholar] [CrossRef]
- Takens, F. Detecting strange attractors in turbulence. Lect. Notes Math. 1981, 898, 361–381. [Google Scholar] [CrossRef]
- Casdagli, M. Chaos and deterministic versus stochastic nonlinear modelling. J. R. Stat. Soc. Ser. B (Methodol.) 1992, 54, 303–328. [Google Scholar] [CrossRef]
- Grassberger, P.; Procaccia, I. Characterization of strange attractors. Phys. Rev. Lett. 1983, 50, 346–349. [Google Scholar] [CrossRef]
- Hirata, T.; Satoh, T.; Ito, K. Fractal structure of spatial distribution of micro fracturing in rock. Geophys. J. Int. 1987, 90, 369–374. [Google Scholar] [CrossRef]
- Kulatilake PH, S.W.; Fiedler, R.; Panda, B.B. Box fractal dimension as a measure of statistical homogeneity of jointed rock masses. Eng. Geol. 1997, 48, 217–229. [Google Scholar] [CrossRef]
- Sondergeld, C.H.; Estey, L.H. Source mechanisms and micro fracturing during uniaxial cycling of rock. Pure Appl. Geophys. 1982, 120, 151–166. [Google Scholar] [CrossRef]
- Wang, Y.; Feng, W.K.; Wang, H.J.; Han, J.Q.; Li, C.H. Geomechanical and acoustic properties of intact granite subjected to freeze-thaw cycles during water-ice phase transformation in Beizhan’s open pit mine slope, Xinjiang, China. Water 2019, 11, 2309. [Google Scholar] [CrossRef]
Disclaimer/Publisher’s Note: The statements, opinions and data contained in all publications are solely those of the individual author(s) and contributor(s) and not of MDPI and/or the editor(s). MDPI and/or the editor(s) disclaim responsibility for any injury to people or property resulting from any ideas, methods, instructions or products referred to in the content. |
© 2023 by the authors. Licensee MDPI, Basel, Switzerland. This article is an open access article distributed under the terms and conditions of the Creative Commons Attribution (CC BY) license (https://creativecommons.org/licenses/by/4.0/).