Article

High-Accuracy Positioning in GNSS-Blocked Areas by Using the MSCKF-Based SF-RTK/IMU/Camera Tight Integration

School of Land Science and Technology, China University of Geosciences Beijing, No. 29 Xueyuan Road, Beijing 100083, China
*
Author to whom correspondence should be addressed.
Remote Sens. 2023, 15(12), 3005; https://doi.org/10.3390/rs15123005
Submission received: 26 April 2023 / Revised: 23 May 2023 / Accepted: 6 June 2023 / Published: 8 June 2023
(This article belongs to the Special Issue Remote Sensing in Urban Positioning and Navigation)

Abstract

:
The integration of global navigation satellite system (GNSS) single-frequency (SF) real-time kinematics (RTKs) and inertial navigation system (INS) has the advantages of low-cost and low-power consumption compared to the multiple-frequency GNSS RTK/INS integration system. However, due to the vulnerability of GNSS signal reception, the application of the GNSS SF-RTK/INS integration is limited in complex environments. To improve the positioning accuracy of SF-RTK/INS integration in GNSS-blocked environments, we present a low-cost tight integration system based on BDS/GPS SF-RTK, a low-cost inertial measurement unit (IMU), and a monocular camera. In such a system, a multi-state constraint Kalman filter (MSCKF) is adopted to integrate the single-frequency pseudo-range, phase-carrier, inertial measurements, and visual data tightly. A wheel robot dataset collected under satellite signal-blocked conditions is used to evaluate its performance in terms of position, attitude, and run time, respectively. Results illustrated that the presented model can provide higher position accuracy compared to those provided by the RTK/INS tight integration system and visual-inertial tight integration system. Moreover, the average running time presents the potential of the presented method in real-time applications.

Graphical Abstract

1. Introduction

The precision position is essential to fields like autonomous driving and mobile mapping [1]. Among existing positioning methods, single-frequency (SF) real-time kinematic (RTK) based on global navigation satellite system (GNSS) observations is a positioning technique with relatively low cost. Theoretically, users can obtain positioning results with centimeter-level accuracy by using the GNSS SF-RTK method [2,3,4]. However, such a high-accuracy character would be significantly degraded or even lost under weak GNSS signal areas (i.e., urban, canyon, and forest) [5,6,7].
Fortunately, the inertial navigation system (INS), an active navigation technology, can sustain short-term high accuracy under GNSS-denied environments. To overcome the drawbacks of satellite positioning technology, the integration scheme of GNSS and INS has been explored by many researchers. In [8], an extended Kalman filter (EKF) was used to integrate GNSS and INS loosely. Results showed that such a system can provide continuous and reliable centimeter-level positioning results in open-sky environments. In [9], the maximum likelihood principle, unscented Kalman filter (UKF), and the process noise covariance estimation model were adopted in a GNSS/INS loose integration system. Results showed that the proposed model can effectively limit the impact of uncertainty of process noise and further improve positioning accuracy. However, the precondition of the GNSS/INS loose integration system is to obtain the GNSS solutions. It needs enough observed satellites. To fully utilize the GNSS observations, some researchers have built a tight integration system based on GNSS observations and IMU measurements. The work in [10] showed that the positioning performance of GPS RTK/INS tight integration is higher than that of loose integration after simulating GPS satellite outages. In [11], a single-frequency multi-GNSS RTK/INS tight integration model was presented. Results showed that the model can provide centimeter-level positioning results in complex urban environments. An RTK/INS tight integration system with adaptability and robustness was designed in [12], and experiment results showed the impacts of state system error and observational error can be constrained.
These studies present the feasibility of using GNSS/INS integration to upgrade positioning accuracy and continuity. However, the GNSS/INS integration will degenerate into an INS-only while the GNSS observations are lost. Under such a condition, the positioning performance will rapidly decrease due to IMU hardware errors. With the development of low-cost cameras, the integration of a camera and IMU is considered to be able to obtain high-precision positions. In [13], a visual-inertial tight integration system using nonlinear optimization based on a keyframes strategy and a sliding window was provided. An indoor experiment showed that the loop-closure error is 0.6 m while using the proposed method. Ref. [14] presented a reliable monocular visual-inertial state estimator based on nonlinear optimization by tightly integrating the IMU pre-integration values and feature observations. The functions of online relocation and robust initialization are also integrated. Results showed that the solutions of position and attitude are more accurate and stable than those from OKVINS [13] while using the presented method. Different from the methods using the pre-integrated IMU observations, the work in [15] integrated loop-closing constraints and nonlinear factors extracted by VIO to perform global nonlinear optimization. Results based on the public datasets demonstrated that the proposed method made the roll and pitch angles observable and the pose accuracy was higher than those in VINS mono [14], ORB-SLAM [16], and other methods with lower optimization scale. Although the nonlinear optimization-based approaches present the advantage of handling the system’s nonlinearity, multiple iterations of the optimization system would cost more for computation. Therefore, some researchers have focused on methods based on EKF. In [17], a visual-inertial odometry system based on multi-state constraint Kalman filter (MSCKF) was proposed. This innovative system introduces the camera pose into the state vector instead of the feature points position, which solves the dimensional explosion problem. Results showed that the system can obtain a high-accuracy pose with low computational complexity in a large-scale environment. However, since the Jacobi matrix is calculated using state values at different epochs, the heading angle is erroneously observable which can degrade the accuracy of pose estimation [18]. To solve this problem, Ref. [19] modified the MSCKF algorithm from the perspective of system observability. Results showed that the improved algorithm significantly outperformed the original algorithm and the fixed-lag smoothing (FLS) algorithm [20] in terms of accuracy and consistency. In [21], the inconsistency problem was solved by using a robot-centric approach, and the direct intensity error is used to form the innovation in the filter update phase. Results illustrated that the presented system exhibits accurate tracking and strong robustness in the conditions of disturbances and fast motions. The results in [22] showed that the filter-based approach can obtain a similar estimation accuracy as the nonlinear optimization-based approach.
Although the visual-inertial odometer system can provide relative pose information with high accuracy, the global pose cannot be obtained. Moreover, the positioning performance would be impacted by light intensity and the quality of feature points. To solve this problem, a fusion of GNSS and VIO is suggested. Ref. [23] presented a loose integration of GNSS and VIO based on EKF and meter-lever global position, resulting in complex urban environments can be obtained. In [24], the factors of IMU, visual, and GNSS RTK are tightly integrated by using factor graph optimization. Results illustrate that it can provide continuous, real-time, and robust positioning results in various-degenerated and challenging scenes for a wheeled robot. Ref. [25] showed that an MSCKF-based GNSS/INS/Vision loose model can provide higher accuracy local pose compared to that of GNSS/INS loose integration. To fully utilize the observations, GNSS raw measurements are considered to introduce into the VIO. Ref. [26] integrated GNSS pseudo-range observations, IMU measurements, and visual information in a nonlinear-optimization-based tightly. Decimeter-level position accuracy in open environments and meter-level position accuracy in complex environments can be respectively obtained by using the proposed model. The GNSS pseudo-range rate was also introduced into the VIO system based on an extended Kalman filter in [27]. The proposed model can effectively improve the drift error of VIO and can improve the usability and accuracy of GNSS in urban areas. A PPP-RTK/MEMS/Vision integration model is presented in [28], in which the GNSS phase measurements, MEMS IMU measurements, and visual data are integrated based on MSCKF. The performance of the method is comparable with that of the PPP-RTK/Tactical IMU tight integration system.
In this paper, an MSCKF-based GNSS SF-RTK/INS/Vision (RIV) tight integration model is presented. In such a system, SF GNSS observations including pseudo-range and carrier-phase, IMU measurements, and visual information are tightly integrated. Compared to previous studies, the main contributions of this paper are (1) the GNSS observations including pseudo-range and phase-carrier are directly introduced to construct a robust GNSS RTK/INS/Vision system, which can provide higher-accuracy positioning results in complex scenes; (2) The advantages of applying single-frequency GNSS data in complex environments are elaborated by comparing the performance differences of incorporating single-frequency data and dual-frequency data in the RIV system, respectively. The subsequent structures of this paper are organized as follows: The state model and the measurement model of the presented system are presented in detail in the Methods section. Then, a set of wheel robot data are processed to evaluate the performance of the presented model in Section 3 and Section 4. Finally, the conclusion follows.

2. Methods

In this subsection, the state model and measurement model of GNSS RTK/INS/vision tight integration and the algorithm summary are described in detail.

2.1. State Model

As described in [25], the state model of MSCKF can be illustrated as
x k = Φ k , k 1 x k 1 + μ k 1
where Φ k , k 1 denotes the transition matrix of error state from epoch k − 1 to k; μ k 1 is the parameter state noise vector; x k stands for the state vector. Compared to the traditional EKF method, MSCKF introduces the camera pose into the state vector instead of the feature points position, which solves the dimensional explosion problem. Therefore, the state vector can be expressed as
x k = [ x I N S φ 1 δ p 1 e φ m δ p m e ] T
x I N S = [ δ p e δ v e φ δ b a δ b g ] T
where δ p e , δ v e , and φ stand for the position, velocity, and attitude error in the earth-centered earth-fixed (E) frame; φ j and δ p j e ( 1 j m ) denote the IMU pose at image j; δ b a and δ b g are the bias errors of the accelerometer and gyroscope. Since the IMU pose related to each image does not change with time, the corresponding error states have
{ φ ˙ j = 0 δ p ˙ j = 0
According to [29], the error state function of INS in the e-frame can be expressed by
{ δ p ˙ e = δ v e δ v ˙ e = ( C b e f b ) × φ + C b e δ f b 2 ω i e e × δ v e + δ g e   φ ˙ = ( ω i e e × ) φ C b e δ ω ib b
where C b e denotes the rotation matrix from body-frame (b) to e-frame; f b and ω i b b are accelerometer outputs and gyroscope outputs. ω i e e is the angle rate of the e-frame with respect to the inertial-frame (i); g e denotes the gravity vector in the e-frame.
To limit the INS drifts over time, IMU sensor errors are estimated online. Generally, the IMU sensor errors are modeled as a first-order Gauss–Markov process.
( δ b ˙ a δ b ˙ g ) = ( 1 τ b a δ b a 1 τ b g δ b g ) + w
where τ is the correlation time of the process; w is the driving white noise; other symbols are the same as those mentioned above.
Based on Equations (4)–(6), the following error-state functions can be obtained:
[ x ˙ I N S   φ ˙ j δ p ˙ j e ] = [ F 0 0 ] [ x I N S φ j δ p j e ] + [ μ 0 0 ]
where F is the system dynamic matrix, which is derived from Equations (5) and (6). Considering the high frequency of IMU data collection, the following numerical approximation can be applied to calculate the transition matrix [30]:
Φ k , k 1 I + F Δ t k , k 1
where I denotes the identity matrix; Δ t k , k 1 is the time difference from epoch k − 1 to k.
Once a new image arrives, the current IMU pose can be augmented into the state vector. The corresponding covariance matrix should be also augmented.
P k , k - 1 = [ I 15 + 6 m J ] P k , k - 1 [ I 15 + 6 m J ] T = [ P k , k - 1 P k , k - 1 J T J P k , k - 1 J P k , k - 1 J T ]
with
J = [ I 3 × 3 0 3 × 3 0 3 × 3 0 3 × 3 0 3 × 3 0 3 × 6 m 0 3 × 3 0 3 × 3 I 3 × 3 0 3 × 3 0 3 × 3 0 3 × 6 m ]
where P k and P k denote the error state covariance matrices before and after augmentation, respectively; J stands for the Jacobi matrix.

2.2. GNSS Measurement Model

According to [31], the measurement function of EKF can be written as
z k , G N S S = H k , G N S S x k + v k , G N S S
where z k , G N S S denotes the innovation vector; H k , G N S S is the design coefficient matrix; v k , G N S S represents the observation noise vector; x k is the same vector in Equation (1).
For RTK/INS tight integration model, the term of z k has the following formula
z k , G N S S = [ p I N S Δ P G N S S p I N S λ ( Δ ϕ G N S S + Δ N G N S S ) ] + [ C n e [ ( C b n l G N S S b ) × ] φ C n e [ ( C b n l G N S S b ) × ] φ ]
where p I N S stands for the INS-predicted visual observations; Δ ( ) is the double-differenced (DD) operator; P G N S S and ϕ G N S S denotes the GNSS pseudo-range and carrier-phase observations; λ and N G N S S are the wavelength and ambiguity vector; C b n represents the rotation matrix from b-frame to n-frame. The IMU center and GNSS receiver center are not matched; therefore, the lever-arm offset l G N S S b is introduced for data fusion [32].
The design matrix H k , G N S S can be described as
H k , G N S S = [ A 0 p × 3 A ( C b e l G N S S b × ) 0 p × 6 0 p × 6 m ]
where A denotes the design matrix related to the receiver-satellite geometry; the subscript p stands for the number of GNSS observations.
In harsh urban environments, the GNSS signal is frequently blocked and the ambiguity needs to be frequently augmented to the state vector. In this paper, the ambiguity is pre-obtained by integrating the GNSS observations with the position of INS prediction, which can be illustrated by
[ ε P ε ϕ ε I N S ] = [ A 0 q × q A λ I 3 × 3 0 3 × q ] [ δ p r Δ N ] [ Δ P G N S S P I N S λ Δ ϕ G N S S P I N S 0 3 × 1 ]
where δ p r stands for receiver position error vector. By fusing the high-accuracy INS positions, the accuracy of float ambiguities can be significantly improved [33]. Once the integer ambiguity vector passes the ratio test and bootstrapping success rate [2], the higher-precision carrier phase measurements can be utilized directly in Equation (11).

2.3. Visual Measurement Model

Assuming that there is a static feature point f j observed by camera pose C i , the vision measurement z ^ i ( j ) can be written as
z ^ i ( j ) = [ f x 0 0 f y ] [   X ^ j c i / Z ^ j c i Y ^ j c i / Z ^ j c i ] + [ o x o y ]
where ( o x o y ) T denotes the measurement noise vector; f x and f y are the camera focal length; (   X ^ j c i   Y ^ j c i   Z ^ j c i ) stands for the feature position vector in the camera frame, which can be written as
p ^ f j M i = [ X ^ j c i Y ^ j c i Z ^ j c i ] = C e c i ( p ^ f j e p ^ c i e )
where C e c i represents the rotation matrix from e-frame to camera-frame; p ^ f j e denotes the feature position vector in the e-frame, which can be obtained by applying the triangulation method [17]; p ^ c i e is the position vector of the camera pose C i . The residual vector can be represented as
r i ( j ) = z i ( j ) z ^ i ( j )
where z i ( j ) is the coordinate of the pixels measured in the image, which can be found in Figure 1. As shown in Figure 1, O C i X C i Y C i Z C i is the camera frame at i epoch; The Z C i -, X C i -, and Y C i -axes of camera frame point to the front, right, and downward directions; π denotes the image plane, which is perpendicular to the principal optical Z C i and intersects it at the image principal point ( C x , C y ) .
By applying the Taylor expansion, the residual vector can be expressed as
r i ( j ) = H X i ( j ) x k + H f i ( j ) δ p f j e + n i ( j )
where H X i ( j ) and H f i ( j ) represent Jacobian matrices of the error state and feature error, which can be expressed as
H X i ( j ) = [ 0 2 × 15 0 2 × 6 J i ( j ) C e c i [ ( p ^ f j e p ^ c i e ) × ] J i ( j ) C e c i ]
H f i ( j ) = J i ( j ) C e c i
with
J i ( j ) = ( 1 /   Z ^ j C i ) [ f x 0 f x   X ^ j C i /   Z ^ j C i 0 f y f y   Y ^ j C i /   Z ^ j C i ]
where ( f x f y ) is the focal length of the camera.
Generally, the static feature point f j can be continuously observed by multiple images. Therefore, the residual vector can be rewritten as
[ r 1 ( j ) r m ( j ) ] r ( j ) [ H 1 ( j ) H m ( j ) ] H x ( j ) x k + [ H f ,   1 ( j ) H m ( j ) ] H f ( j ) δ p f j e + n i ( j )
where m denotes the m-th camera state. Obviously, the feature point error δ p f j e is not in the state error, which doesn’t satisfy the form of the Kalman update process ( r = H x k + n ). Fortunately, the left null space residual matrix H f i ( j ) can be used to solve this problem [28]. Then, it has
r 0 ( j ) = M T r ( j ) = M T H X ( j ) δ x k + M T n 0 ( j ) = H 0 ( j ) δ x k + n 0 ( j )
where M stands for the left null space residual matrix of H f i ( j ) .
To separate inliers from outliers, the Mahalanobis gating test is applied, which can be expressed as
r j = ( r 0 ( j ) ) T ( H 0 ( j ) P k ( H 0 ( j ) ) T + σ 2 I ) 1 r 0 ( j )
where P k is the filter covariance matrix and σ 2 denotes the variance of the visual measurement. The residuals r 0 ( j ) will be excluded when the terms of r j exceed the threshold calculated by the 95% of the chi-square distribution.

2.4. Robust MSCKF

Based on the above models, the measurement update proceeding the MSCKF can be written as
{ x k = Φ k , k 1 x k 1 + K k ( z k H k Φ k , k 1 x k 1 ) P k = ( I K k H k ) ( Φ k , k 1 P k 1 Φ k , k 1 T + Q k 1 ) ( I K k H k ) T + K k R k K k T K k = ( Φ k , k 1 P k 1 Φ k , k 1 T + Q k 1 ) H k T ( H k ( Φ k , k 1 P k 1 Φ k , k 1 T ) H k T + R k ) 1
where P k denotes the variance-covariance (VC) matrix of the error state; K k and I are the gain matrix and unit matrix; R k represents the priori VC matrix of the measurement noise; H k is the design matrix, which can be expressed as H k = [ H k , G N S S H 0 ( j ) ] T ; Φ k , k 1 denotes the transition matrix of error state, which can be found in Equation (8); Q k 1 is the covariance matrix associated with state noise vector μ k 1 at epoch k, it is initialized by the priori parameter values of IMU, including the velocity random walks (VRW), angle random walks (ARW), in-run instability of gyroscope, and the correlation time of the in-run bias.
To eliminate the effect of the measurement outliers, the IGG-III model [34] is utilized, which can be expressed as
R ˜ k = β R k
with
β u u = { 1 , | v ˜ k , u | k 0 v ˜ k , u k 0 × ( k 1 k 0 k 1 v ˜ k , u ) , | v ˜ k , u | k 1 , k 0 | v ˜ k , u | k 1
where R ˜ k denotes the VC matrix of the measurement noise after applying the robust factor β ; k 0 and k 1 denote the thresholds, with k 0 being set to 2.0~3.0 and k 1 being set to 4.5~8.5; The u-th standardized residual v ˜ k , u at epoch k is calculated by the following formula:
v ˜ k , u = ( z k H k x k ) u u ( H k P k , k 1 H k T + R k ) u u
where P k , k 1 is the predicted VC matrix of the state parameters.
Finally, the new form of measurement update can be obtained by substituting Equations (24)~(26) into Equation (23)
{ x k = Φ k , k 1 x k 1 + K k ( z k H k Φ k , k 1 x k 1 ) P k = ( I K k H k ) ( Φ k , k 1 P k 1 Φ k , k 1 T + Q k 1 ) ( I K k H k ) T + K k R ˜ k K k T K k = ( Φ k , k 1 P k 1 Φ k , k 1 T + Q k 1 ) H k T ( H k ( Φ k , k 1 P k 1 Φ k , k 1 T ) H k T + R ˜ k ) 1

2.5. Sensors-Aided Cycle Slip Detection

Besides, small cycle-slip detection is also essential for the performance improvement of the GNSS SF-RTK/INS/Vision (RIV) tight integration model. To avoid the impact of the small cycle slip, the sensors-predicted carrier phase increment method is utilized in this contribution. The main idea of this method is to compare the sensors-predicted carrier phase increment with the double-differenced (DD) carrier phase increment. According to [35], the sensors-predicted carrier phase increment can be written as
δ φ I N S t , t 1 = 1 λ ( Δ ρ I N S t Δ ρ I N S t 1 )
where Δ ρ I N S t and Δ ρ I N S t 1 denote the sensors-predicted DD range at t and t − 1 epochs, respectively. Similarly, the DD carrier phase increment from receivers can be calculated by
δ φ G N S S t , t 1 = 1 λ ( Δ φ G N S S t Δ φ G N S S t 1 )
where Δ φ G N S S t and Δ φ G N S S t 1 denote the DD carrier phase observations from receivers at t and t − 1 epochs, respectively. By differencing Equations (23) and (24), the detection factor can be obtained by
D T = δ φ G N S S t , t 1 δ φ I N S t , t 1
The threshold of the detection factor can be chosen empirically. In this paper, the threshold is set to 0.4 according to the results in [35].

2.6. Algorithm Summary

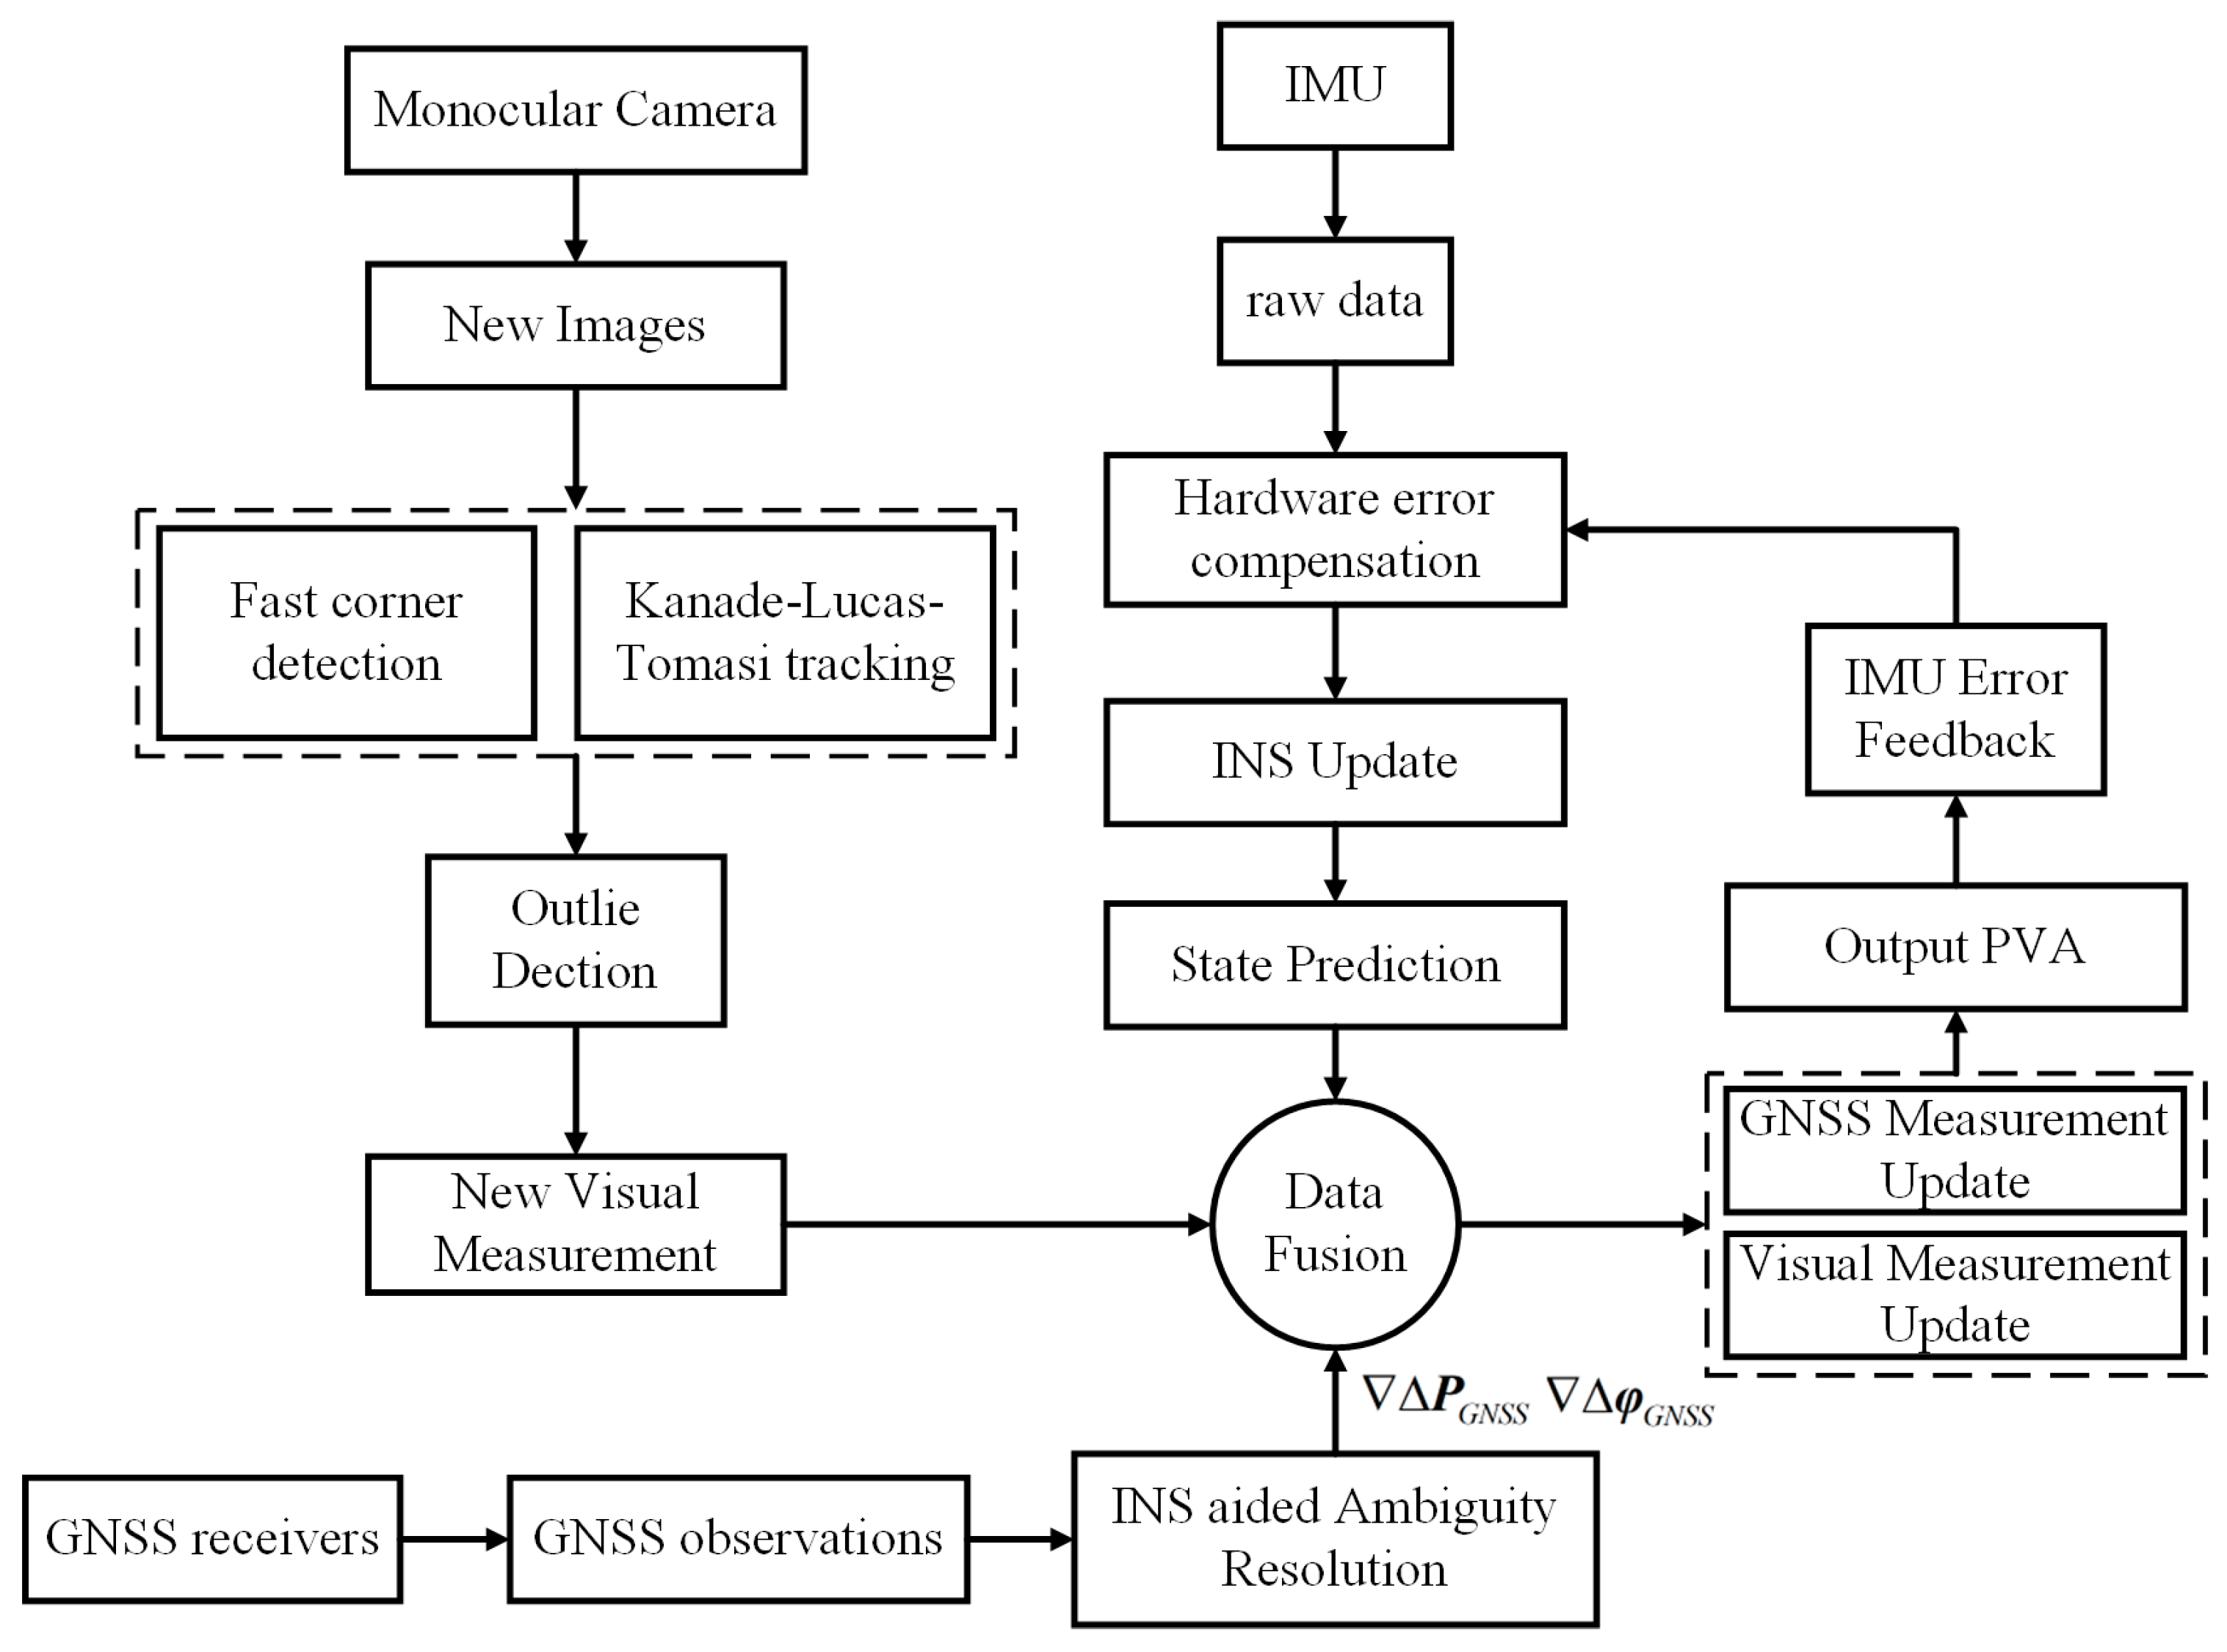
The algorithm implementation of the presented RTK/INS/Vision integration model is presented in Figure 2. In such a system, the visual data, single-frequency GNSS observations, and IMU measurements are fused in MSCKF. The position and attitude calculated by RTK solutions are used to initialize the system [36]. After that, the raw angular rate and specific force are processed by the INS mechanization algorithm to provide state information. Once the GNSS time is synchronized with IMU, the DD pseudo-range and DD phase-carrier will be integrated with the INS-predicted range to update the system state. To avoid the impact of outliers, the IGG-III model [34] and sensors-aided cycle-slip detection method [35] are used in this stage. Then, the LAMBDA algorithm [37,38] is performed to re-update the state by using high-accuracy phase-carrier information. For the visual part, the feature points are extracted by the fast corner detector and tracked by Kanade–Lucas (KL) method [39,40]. In the front-end, the random sample consensus (RANSAC) method [41] is performed to resist feature outliers. Once the new image arrives, the current IMU pose and the corresponding covariance matrix can be augmented. If the feature points disappear or the number of state parameters in the sliding window reaches the maximum, the visual measurement after passing the chi-square test [42] will be applied to update the state parameters. Finally, the estimated IMU sensor errors will be fed back to compensate the IMU raw measurements in the next epoch.

3. Experiments and Data Processing Schemes

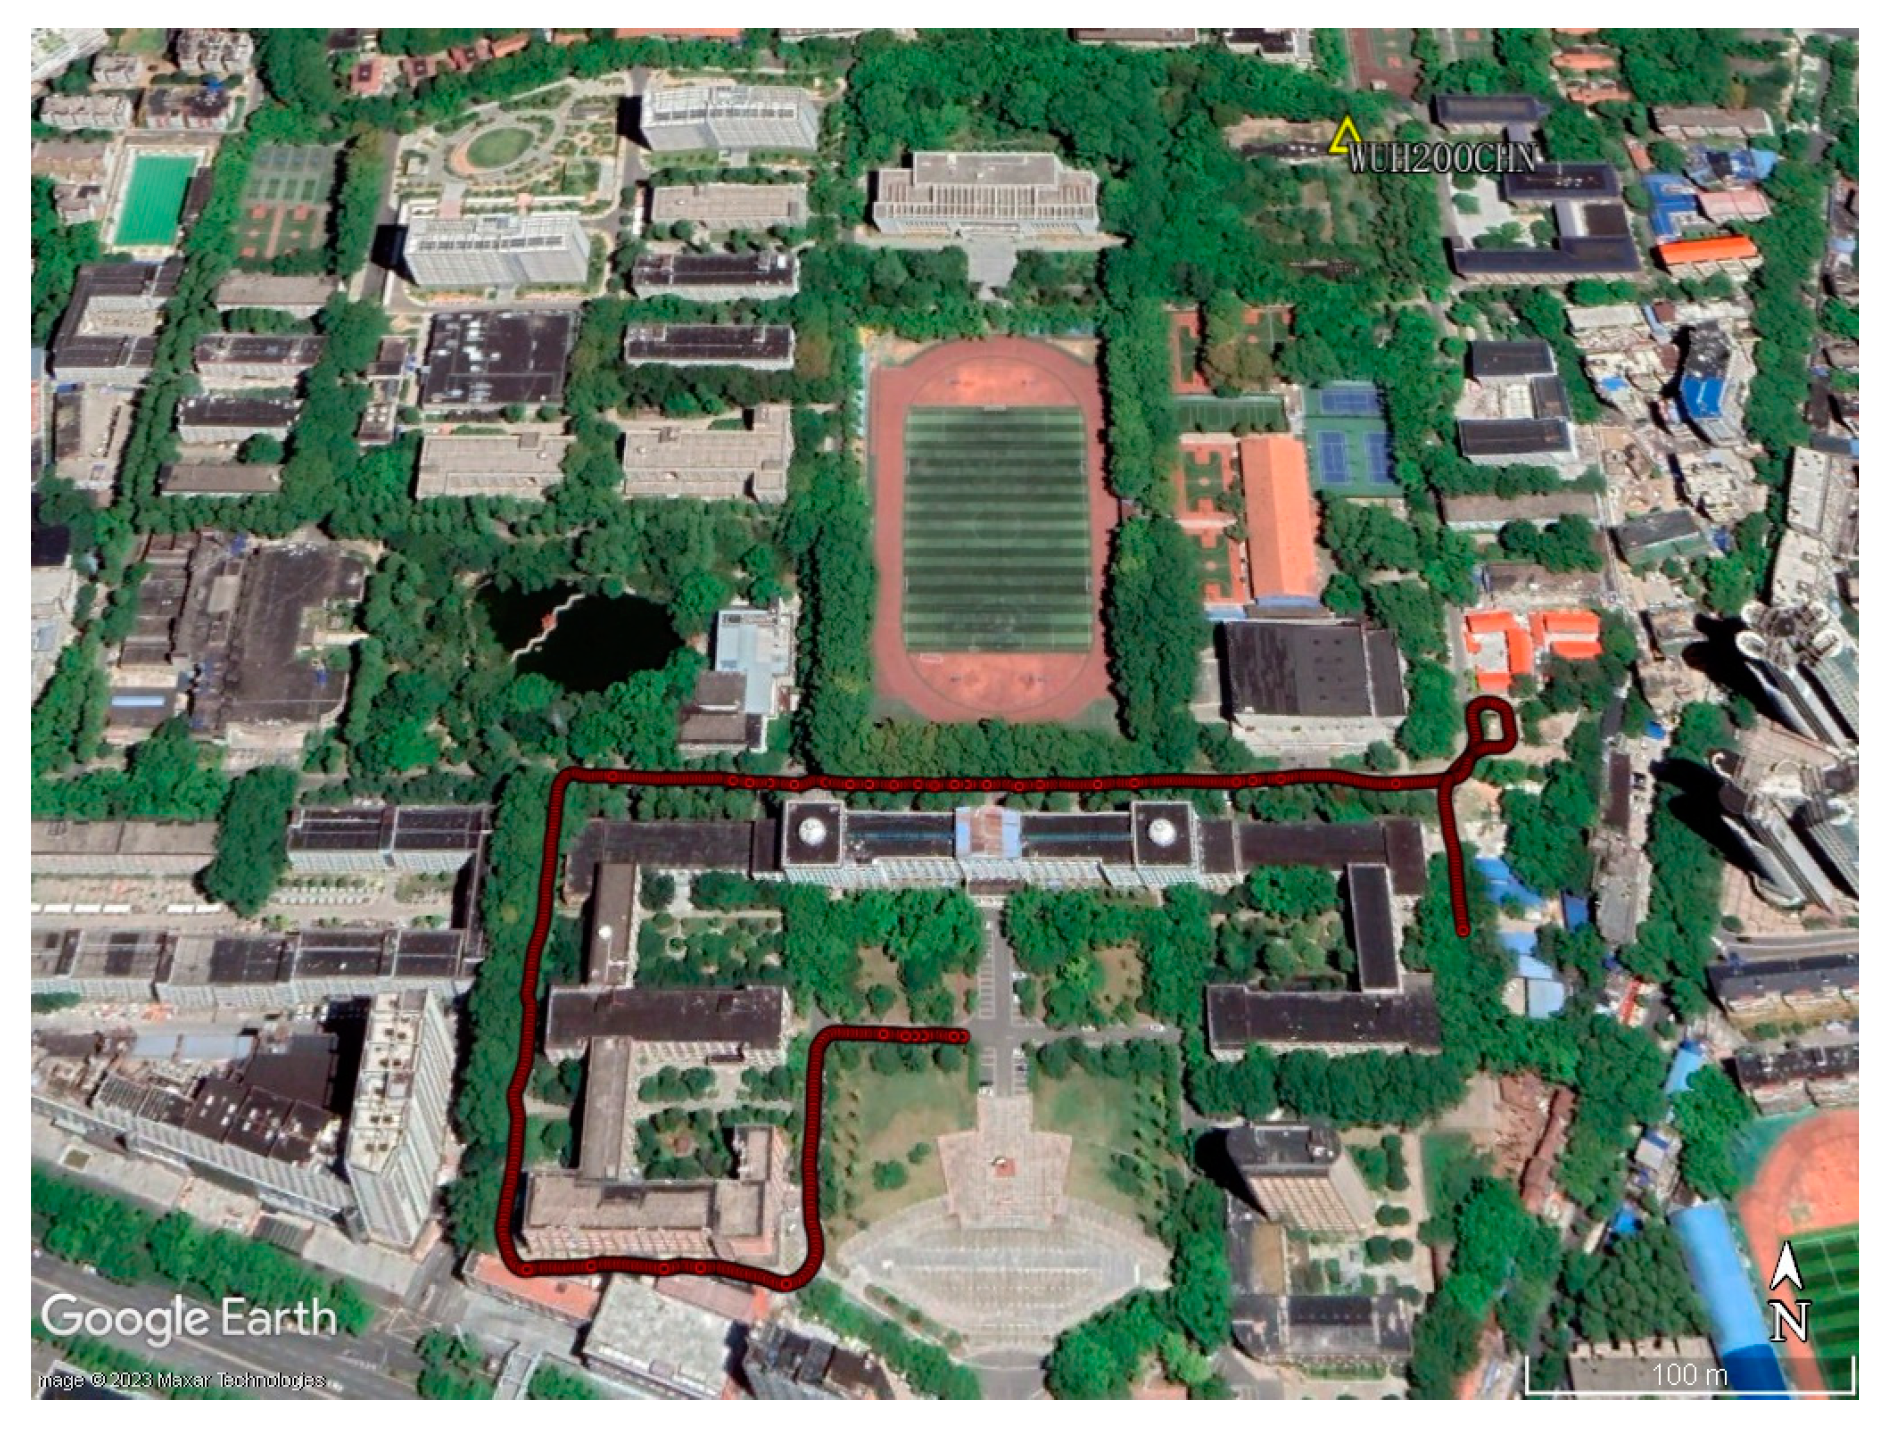
To validate the presented algorithm, a wheeled robot test with an average velocity of 1.5 m/s was carried out at Wuhan University on 12 December 2022. The test trajectory and typical scenarios are shown in Figure 3 and Figure 4, respectively. During the test, two different grades of IMU are used to collect IMU data. The MEMS-grade IMU (ADIS16465) is processed and analyzed to evaluate the performance of the presented system. The specifications of the MEMS-IMU can be found in Table 1. The employed ground truth system is a high-accuracy position and orientation system (POS), using the GNSS RTK and a navigation-grade IMU. The ground truth (0.02 m for position and 0.01 deg for attitude) was generated by a post-processing GNSS/INS integration software [24]. A global shutter camera (Mako-G131) and a GNSS receiver (OEM-718D) are used to collect the image data and GNSS observations. In this test, the timestamps of the three sensors are united to GPS time, which is realized by hardware triggering. The lever-arm offsets and intrinsic-extrinsic parameters are accurately synchronized before the test.
The test data (GitHub-i2Nav-WHU/IC-GVINS: A robust, real-time, INS-centric GNSS-visual-inertial navigation system) are processed by (1) Vision/IMU tight integration mode based on MSCKF (MSCKF VIO), (2) GPS + BDS single-frequency RTK/INS tight integration mode based on EKF (SF-RI), (3) GPS + BDS single-frequency RTK/INS/vision tight integration mode based on MSCKF (SF-RIV), and (4) GPS + BDS dual-frequency RTK/INS/vision tight integration mode based on MSCKF (DF-RIV), respectively. The specific differences of these schemes are listed in Table 2. In the GNSS data processing, the atmospheric delay can be neglected due to the baseline length being less than 2 km [43]. The ratio test and prior success rate are set to 3.0 and 0.99 [33]. To avoid the influences of GNSS and image observation outliers, the IGG-III model, random sample consensus (RANSAC), and chi-square test were performed.
To assess the deviations between the estimated values and reference values and error distribution, the root mean square error (RMSE) and cumulative distribution function (CDF) defined in Equation (33) is used,
{ R M S E = 1 t i = 1 t ( y i y ^ i ) 2 C D F ( F ) = P ( F f )
where y i denotes the estimated value; y ^ i is the reference value; P ( ) denotes the probability value; F and f represent the random variable and independent variable, respectively.
Satellite availability is essential to positioning solutions. As shown in Figure 4, there are buildings and dense trees during the test, which would significantly impact the GNSS signal quality [44,45]. Figure 5 shows the tracked satellites. It can be seen that only the GPS and BDS satellites are tracked during the test. Due to the tall buildings and dense tree lines, the satellite geometry condition is poor, which will be detrimental to position dilution of precision (PDOP) and positioning accuracy [2,6,35].
Figure 6 describes the number of tracked satellites with a cut-off elevation angle of 10°. It can be seen that the satellite signals are interrupted frequently under obstructing roads. The number of satellites on average is 2.90, and only 34.48% of epochs observe more than four satellites. Such poor observability is also reflected in the PDOP value (as shown in Figure 6b). According to the statistics, the average PDOP is 10.08 and reaches 69.60 in extreme conditions. All the factors mean the availability of GNSS is limited, which is a challenge to the RTK positioning.

4. Discussions

The performance of the proposed system in terms of sensors-aided cycle slip detection, position, attitude, and run-time are presented in detail in this section.

4.1. Sensors-Aided Cycle Slip Detection

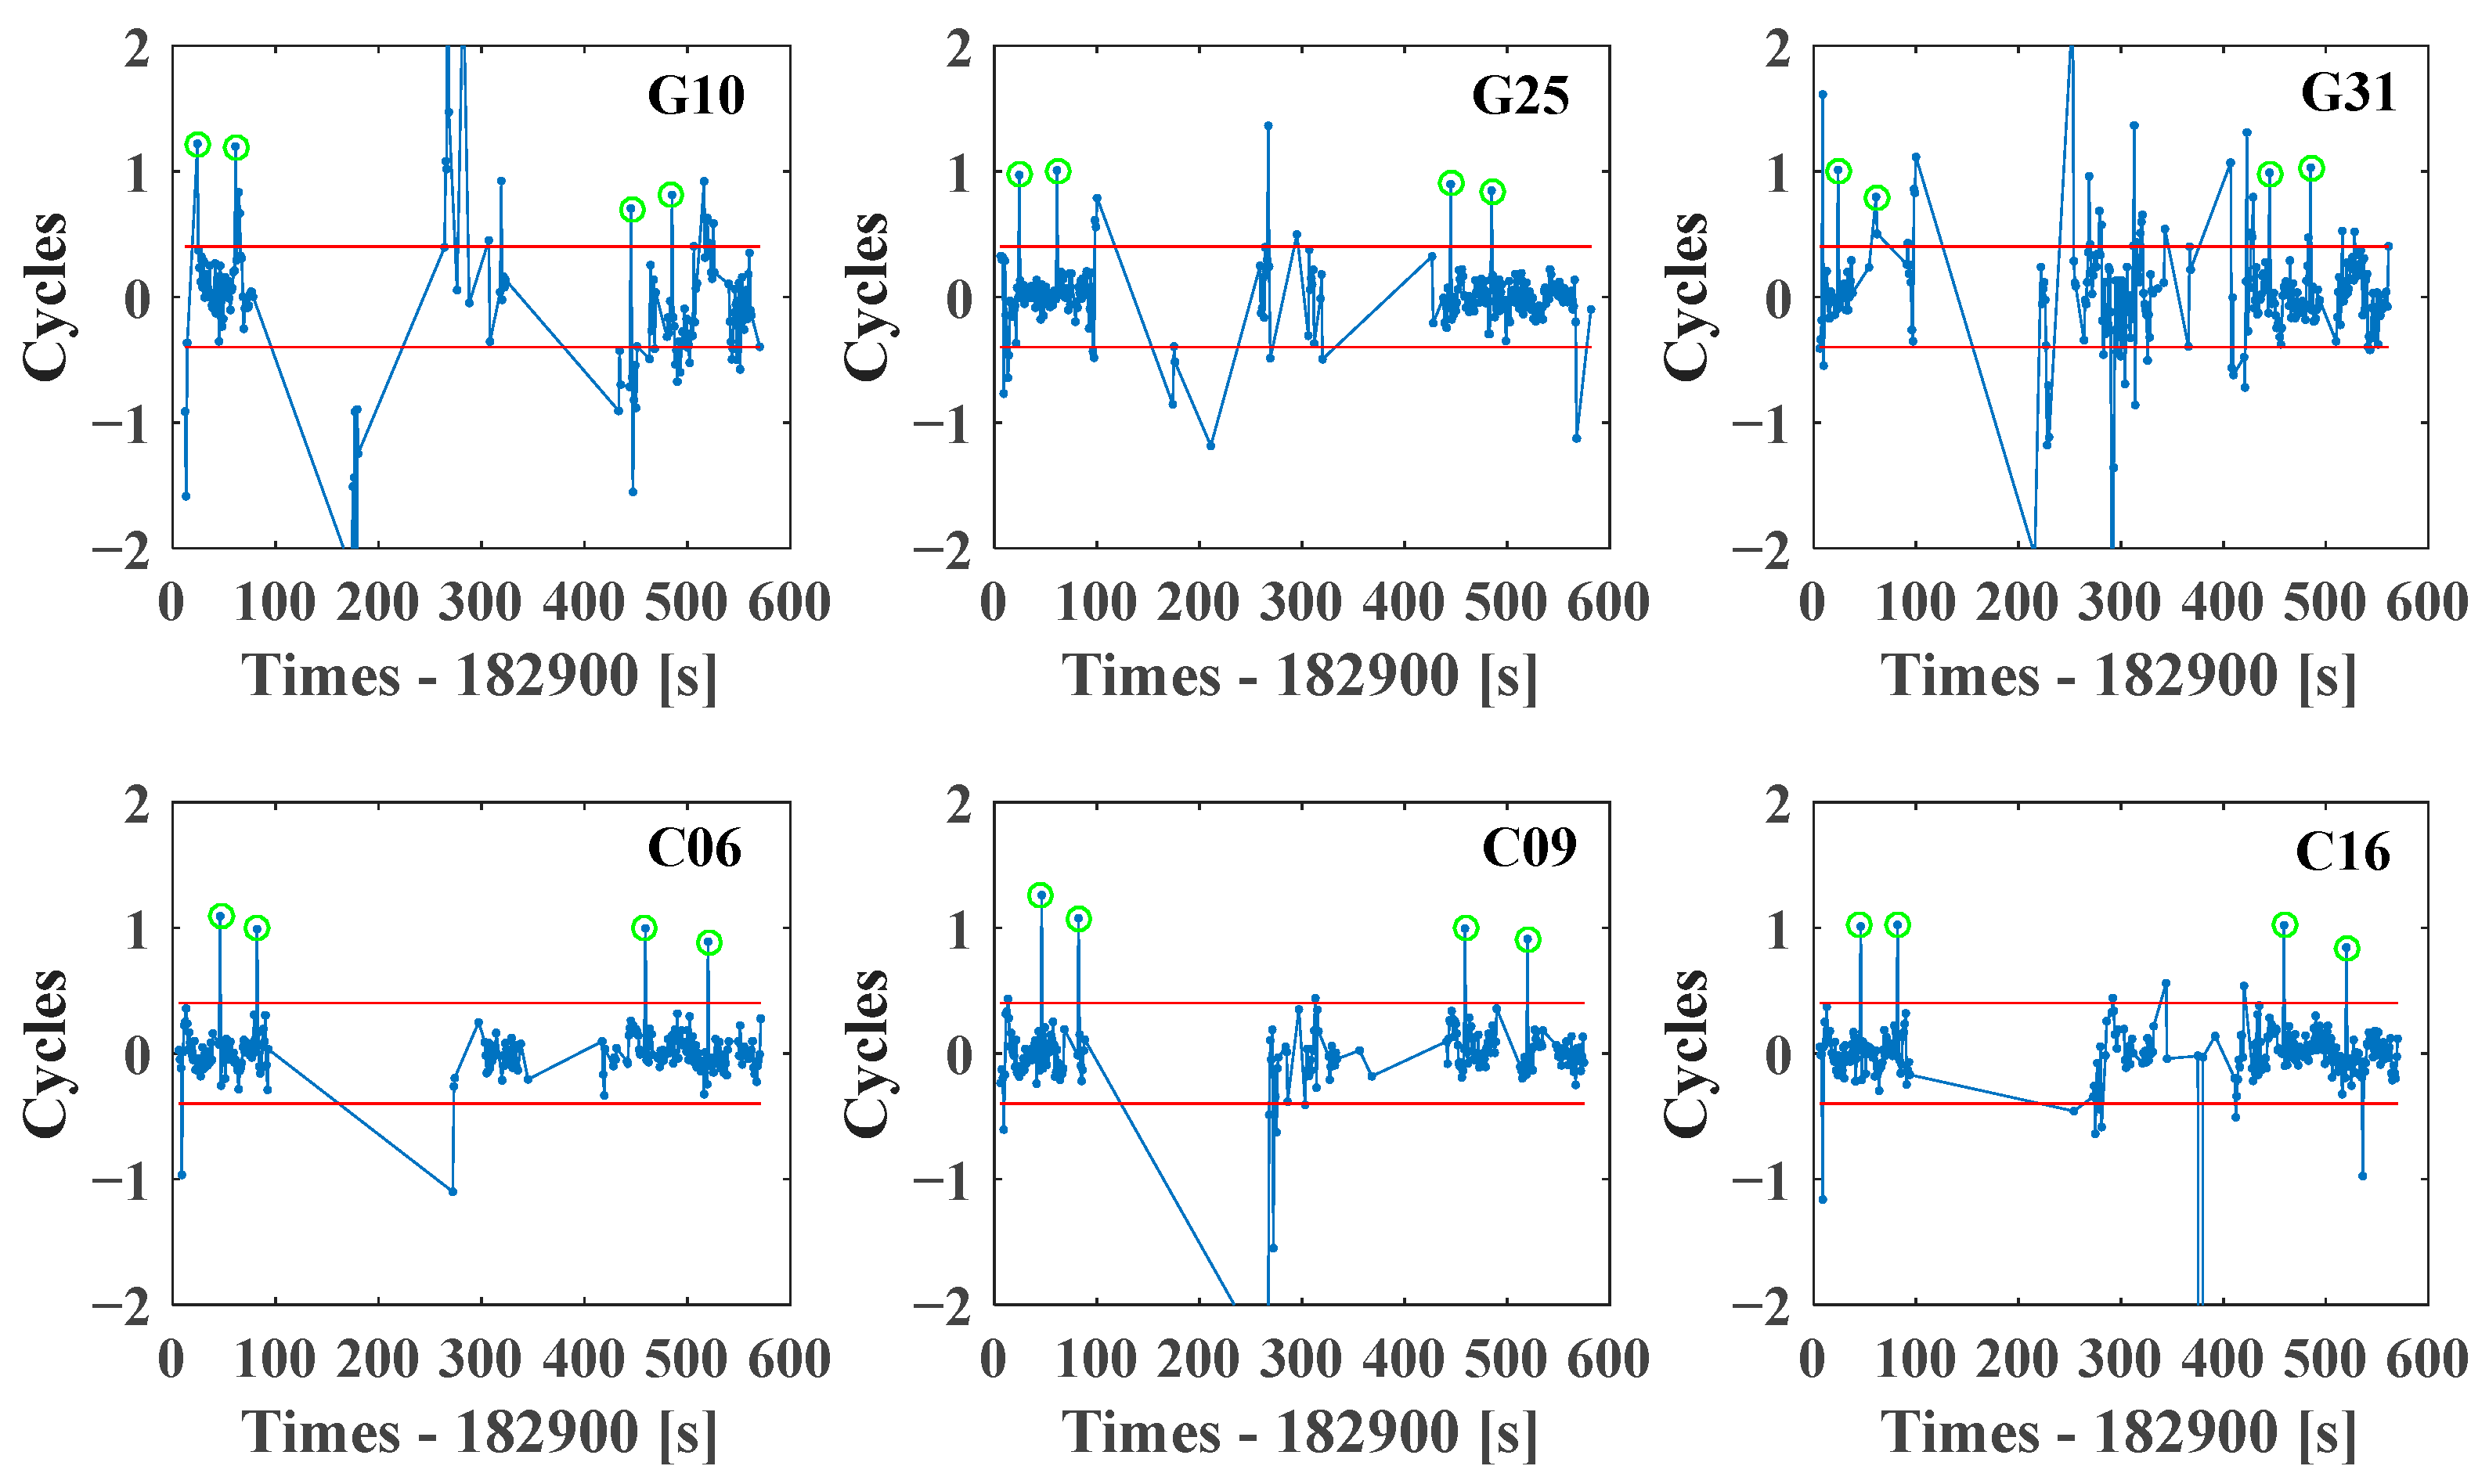
To verify the capability of cycle slip detection with sensors aids, one cycle slip on different satellites is simulated. Figure 7 shows the sensors-aided cycle-slip detection results of different satellites. We can see that all the simulated cycle slips can be detected correctly, and the corresponding detection terms are close to one. This indicates that the sensors-aided cycle-slip detection method has the advantage of detecting small cycle-slip, which would bring benefits for positioning while using the single-frequency observations. Figure 8 describes the time series of the detected cycle-slips value during the measured test. It can be seen that most of the detection terms are below the threshold. However, frequent cycle slips still happen, which reflects the complexity of test environments.

4.2. Enhancements in Positioning Accuracy

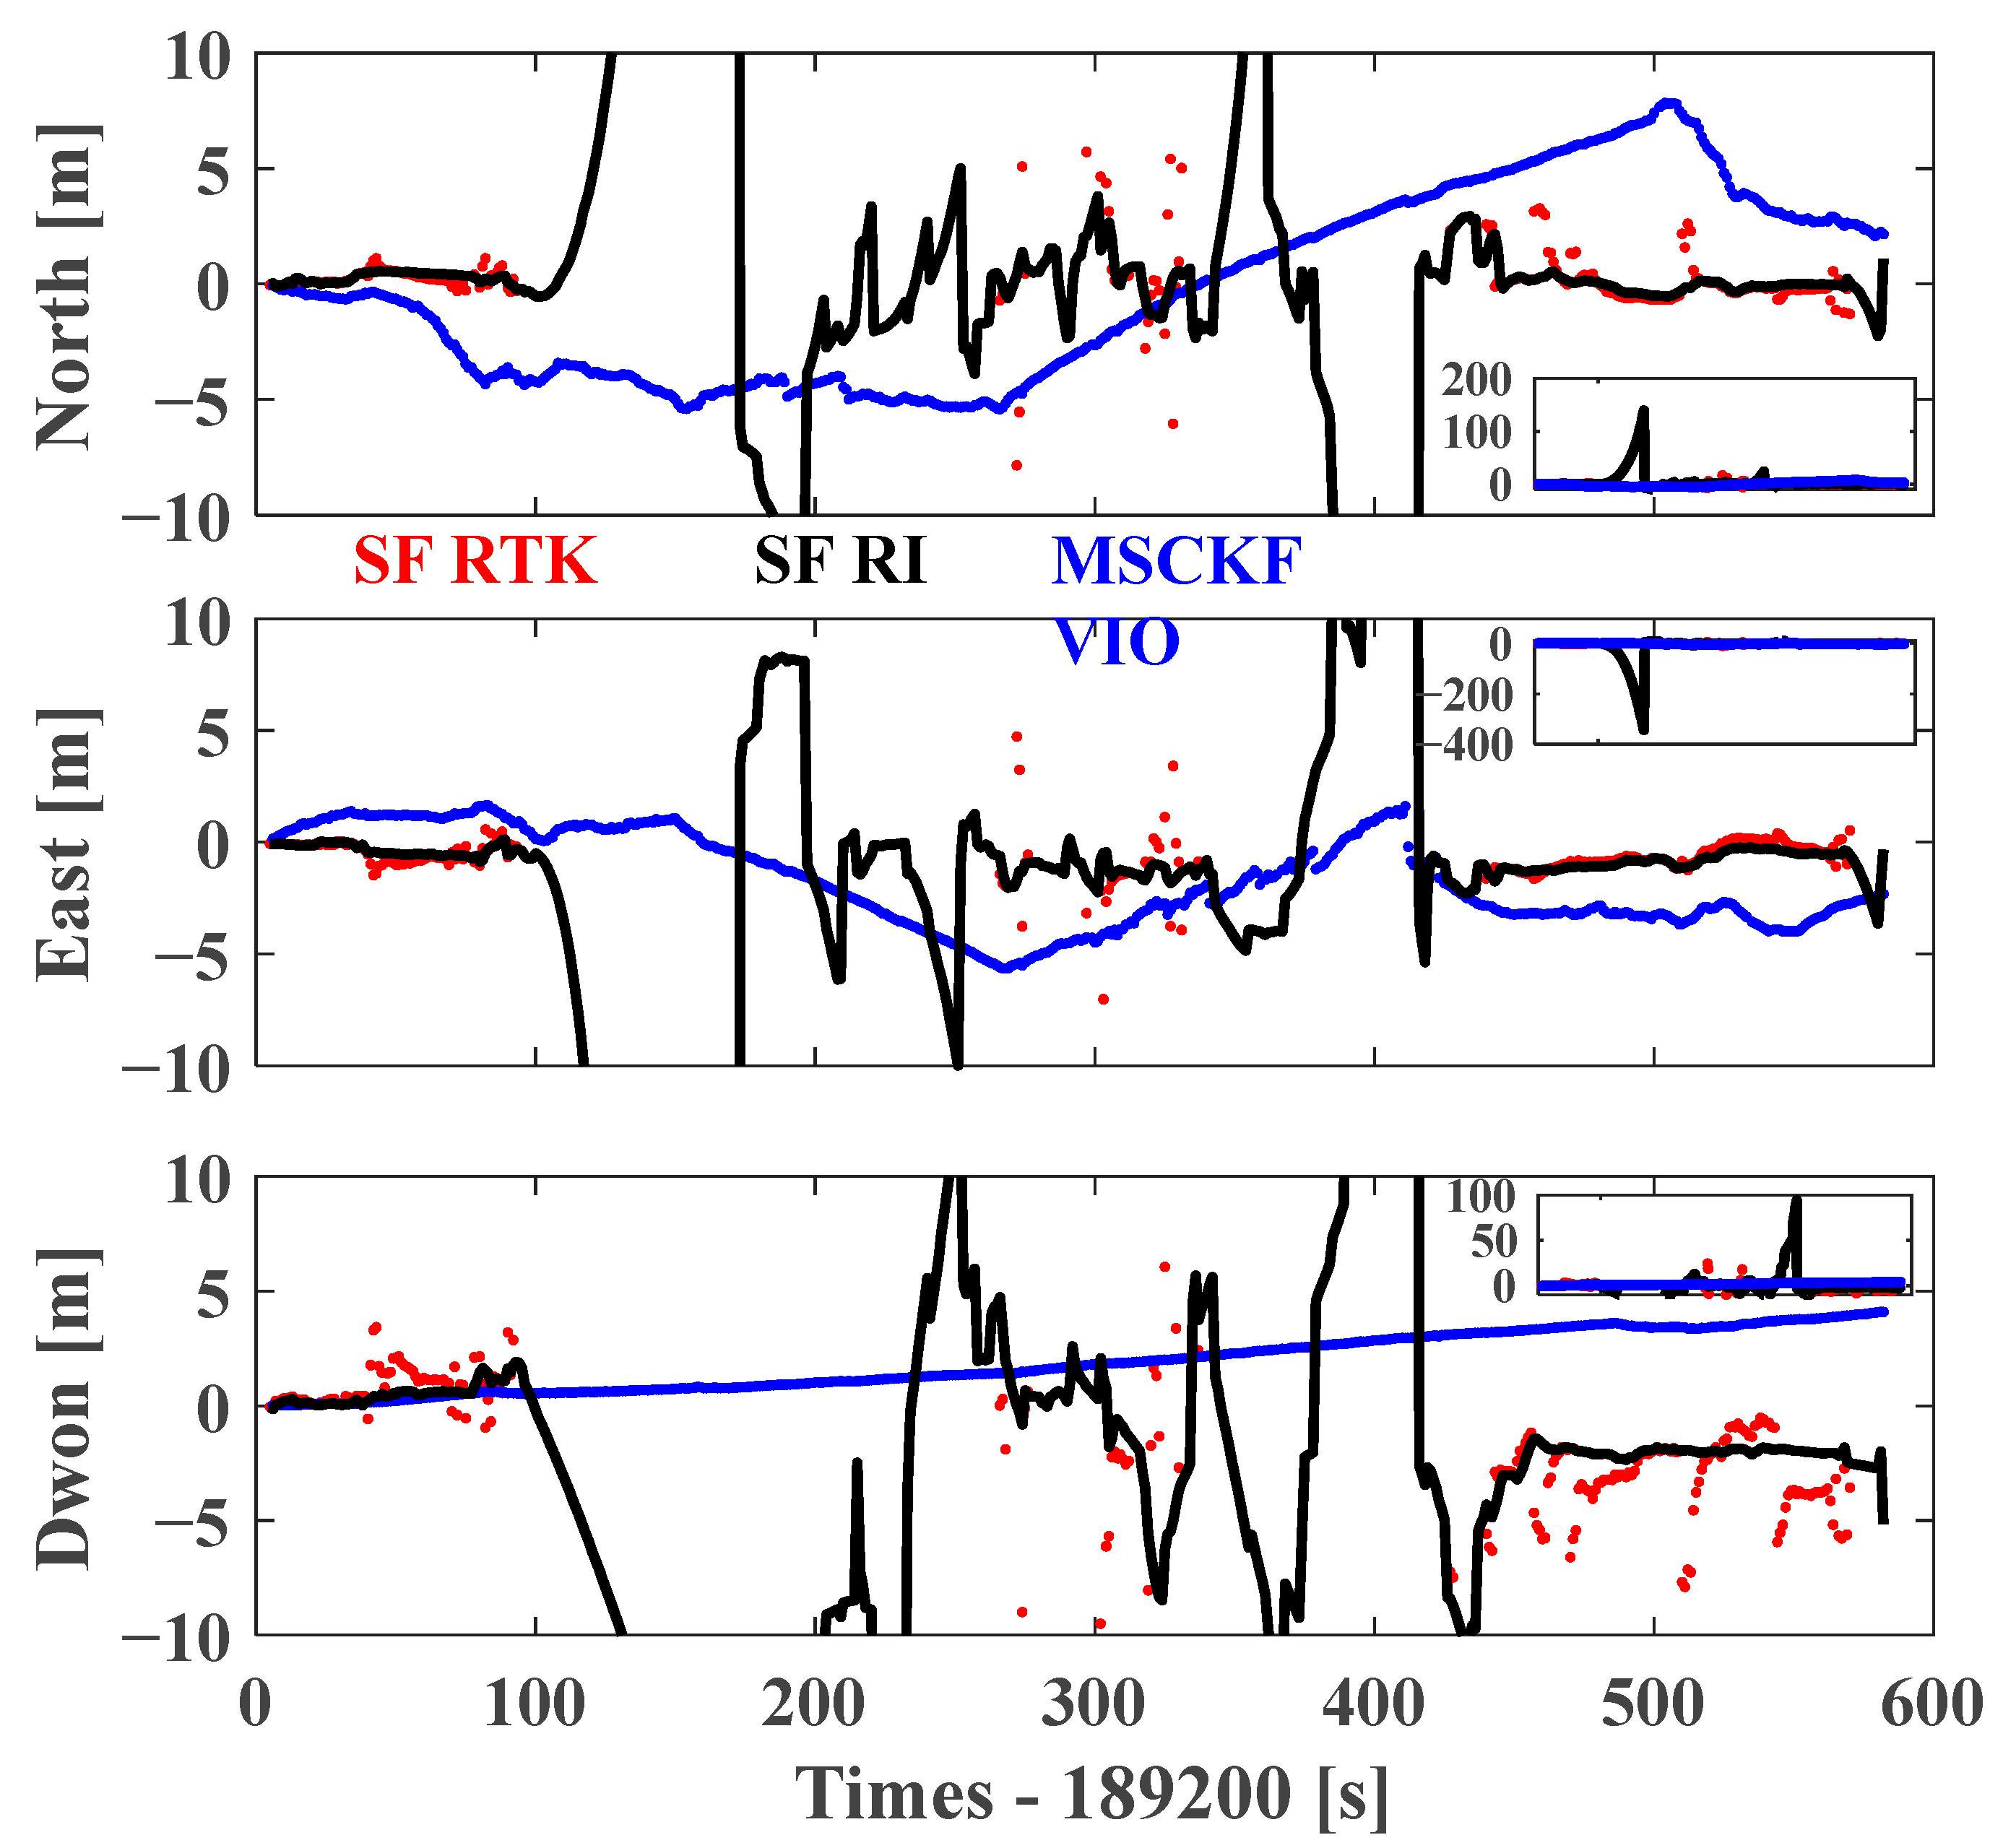
To illustrate the positioning accuracy benefits from the provided integration model, the position differences between the solutions calculated by the four schemes and the reference values are analyzed. Figure 9 shows the time series of these positioning errors. It can be found that the positioning accuracy of SF RTK has a strong correlation with signal reception. The statistics results illustrate that the availability of SF RTK is only 43.79% during this test. Table 3 lists the position RMSE of the different modes. Accordingly, the root mean square error (RMSE) of SF RTK are 1.84 m, 1.33 m, and 5.09 m in the north, east, and vertical components, respectively. Obviously, it’s difficult to adopt RTK solutions to provide continuous and high-accuracy positioning results in such complex environments. While SF RTK is integrated tightly with INS, the continuity and accuracy are further improved visibly. Accordingly, the position RMSE of SF RTK/INS tight integration mode during these SF RTK available periods are 0.61 m, 0.86 m, and 2.31 m in the three directions, with improvement percentages of 66.85%, 35.34%, and 54.62%, compared to the SF RTK-only mode. This indicates that the SF RTK/INS integrated model can provide higher position results. However, due to the frequent GNSS outages, the SF RTK/INS tight integration mode degenerates to the INS-only mode. During these GNSS-outage periods, the maximum position drifts increase rapidly to 138.83 m, 342.92 m, and 24.27 m in the three directions. Different from the vulnerable GNSS signals, the visual information is continuous and abundant [28]. The time series of the position errors of the MSCKF VIO mode presents a significant upgrade in position accuracy. The corresponding RMSE in the three directions is 4.01 m, 2.67 m, and 2.26 m, respectively. Visibly, the position drifts of INS are constrained. Accordingly, the maximum drifts of VIO mode are 7.88 m, 3.46 m, and 3.44 m in north, east, and vertical components, with position drift reductions of 94.32%, 98.99%, and 85.83%, respectively. It proves that vision information can significantly limit the impact of the accumulation of IMU errors on position, especially in GNSS-denied areas.
Although the VIO system has shown that it can limit the position drifts, the time-varying IMU sensor errors are still accumulated due to the lack of global measurements. With the fusion of single-frequency GNSS data, a global constraint on IMU errors will be formed. To illustrate the benefits of single-frequency GNSS data, the time series of position differences of dual-frequency and single-frequency GNSS data augmented VIO are provided in Figure 10. Accordingly, the position RMSE of DF RIV mode in the north, east, and vertical components are 1.33 m, 0.99 m, and 1.60 m, with the enhancements of 66.75%, 56.02%, and 29.06% compared to that of VIO mode. The maximum position errors in the three directions are 1.86 m, 0.80 m, and 2.98 m, with reductions of 76.40%, 76.88%, and 13.37% compared to that of VIO. For the SF RIV mode, such improvements are more obvious. The position RMSE values are reduced to 0.88 m, 0.88 m, and 0.65 m in the three directions, with improvement percentages of 77.95%, 66.96%, and 71.07% compared to that of VIO. The maximum position errors are 2.56 m, 1.35 m, and 0.40 m, with about 67.51%, 60.98%, and 88.37% extra reductions in the three components, by comparing with that of the VIO. The results indicate that the accuracy and continuity of VIO can be improved by the RTK/INS/Vision integrated system noticeably by either dual-frequency or single-frequency GNSS data. This is because GNSS observations can provide global constraints to the VIO system. It can significantly reduce the impact of IMU drifts in position estimation. It should be noted that the enhancements based on single-frequency data are higher than those based on dual-frequency data because more available satellites can be available while adopting the single-frequency GNSS data, which leads to stronger global constraints. According to the statistics, the average number of satellites for single-frequency observations is 2.90, which presents about 31.72% improvements compared to that when applying dual-frequency data (1.98).
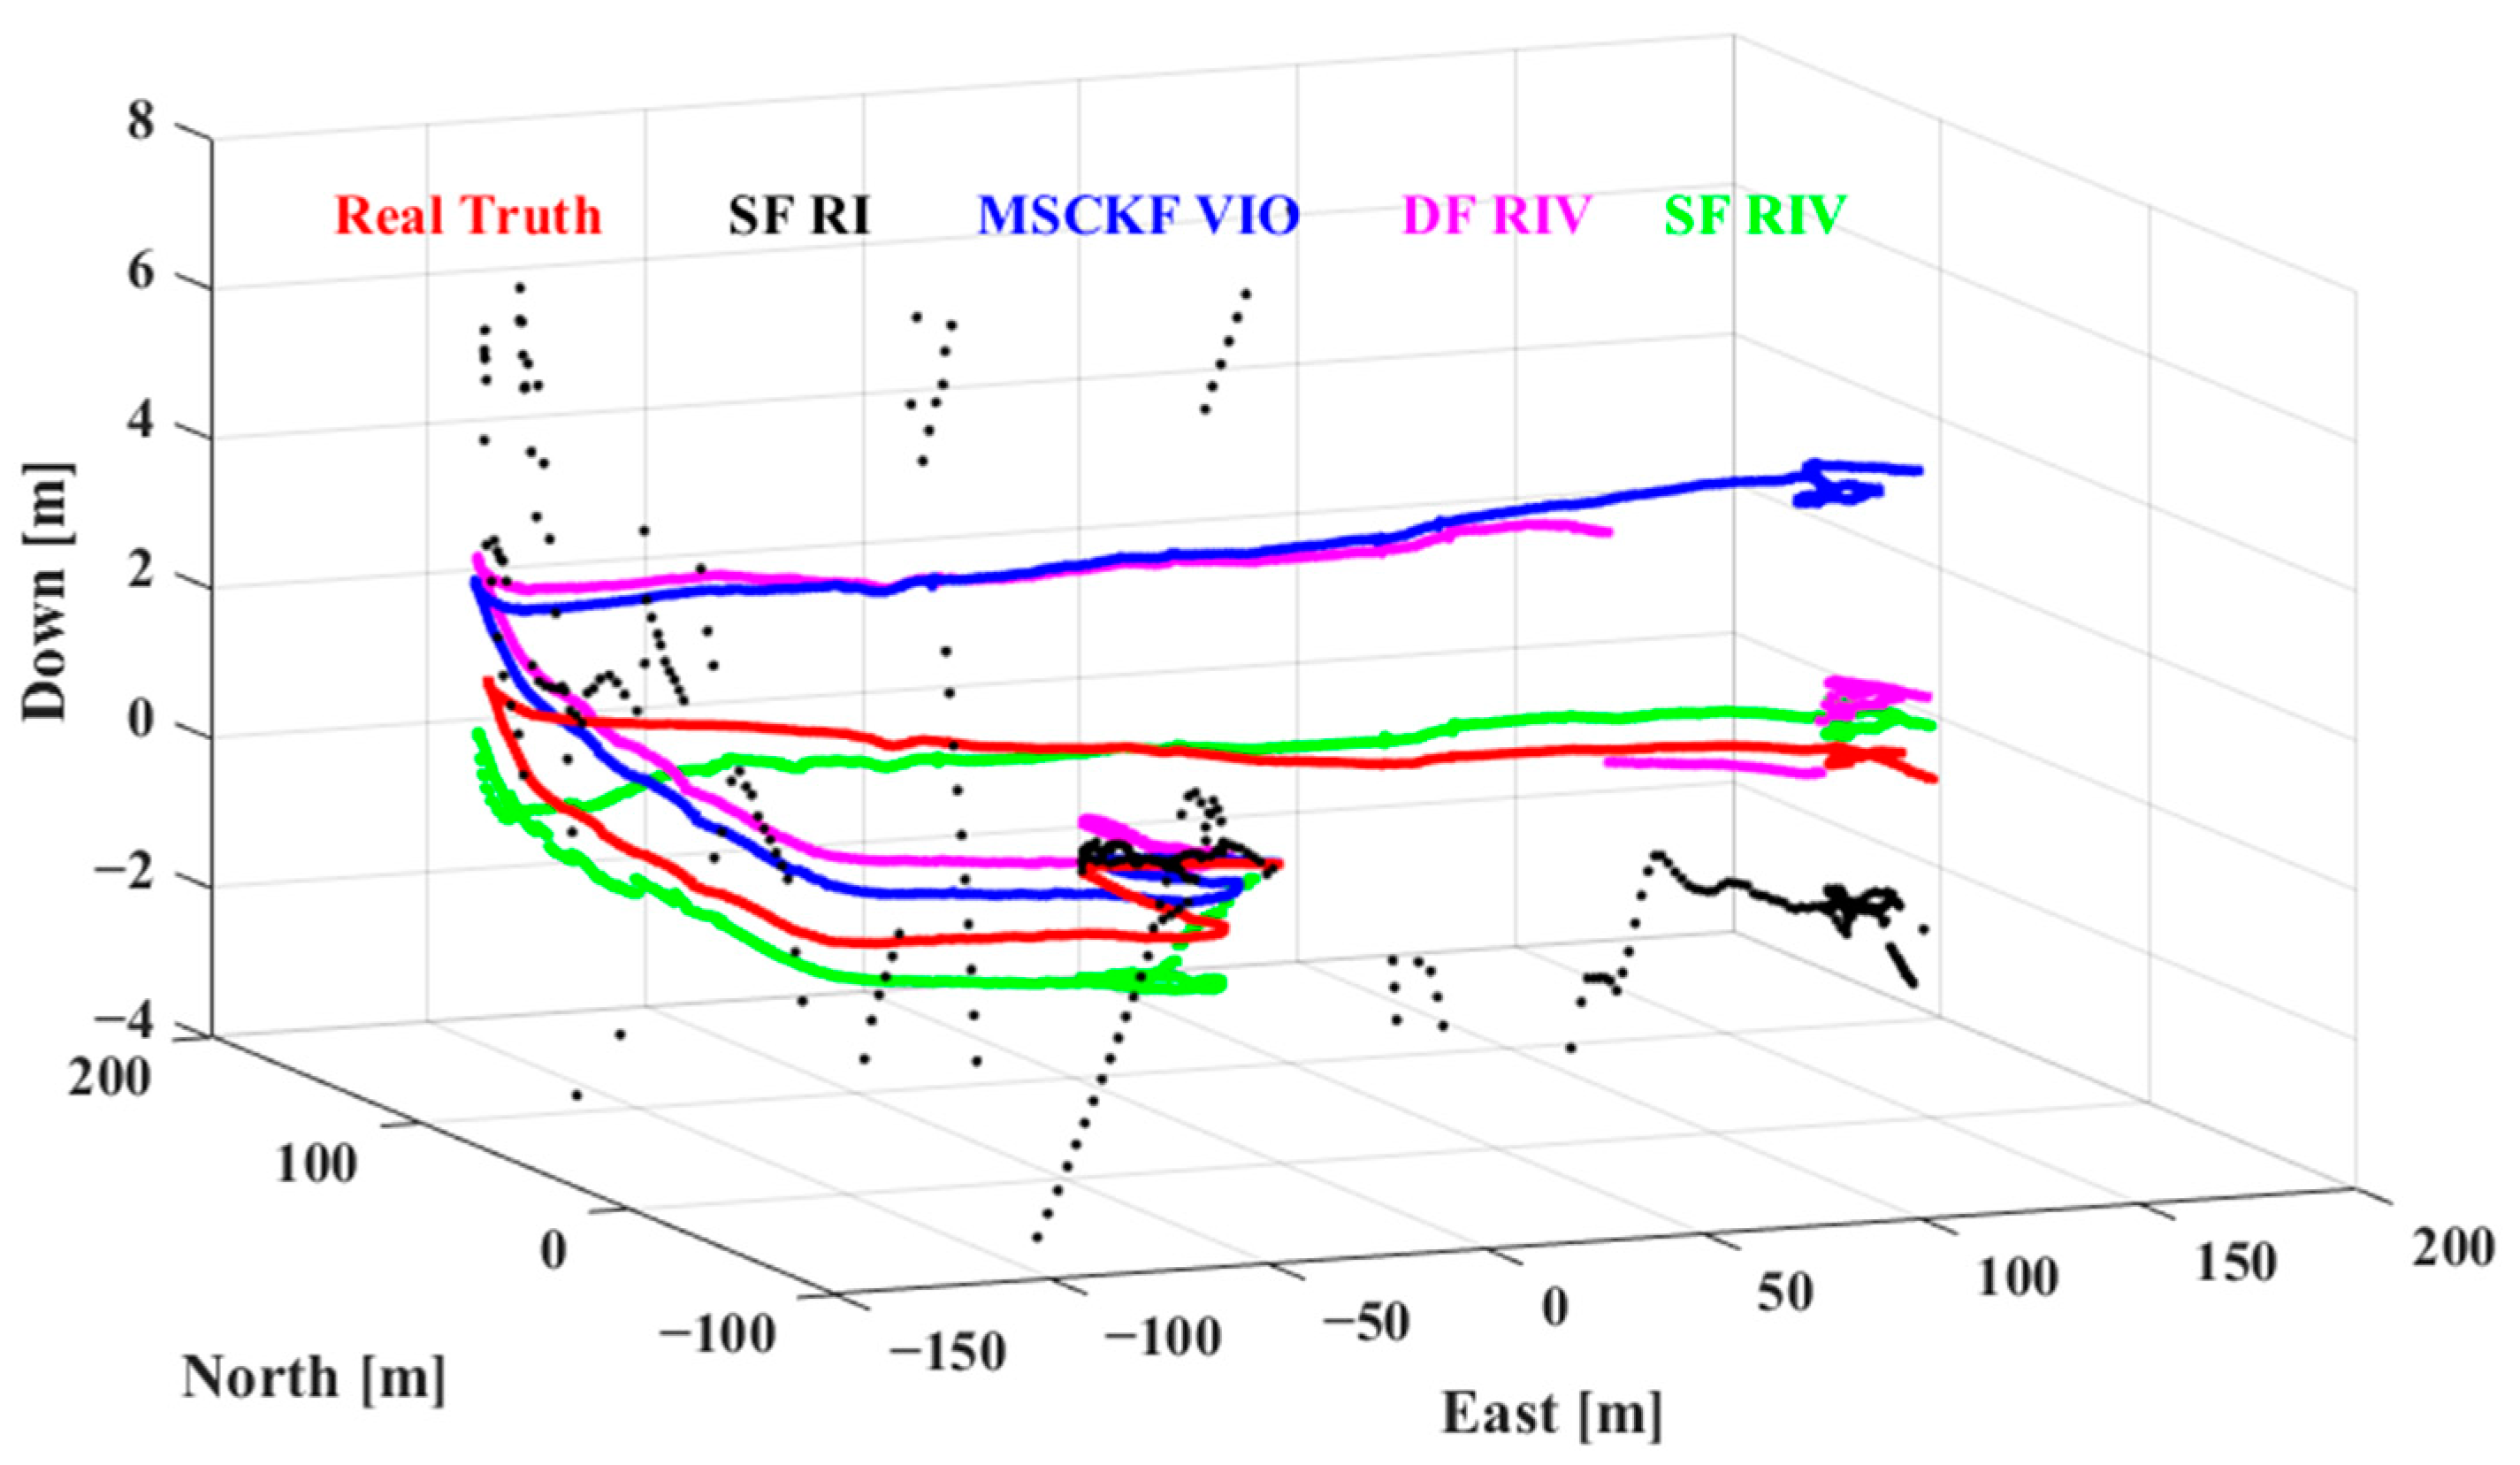
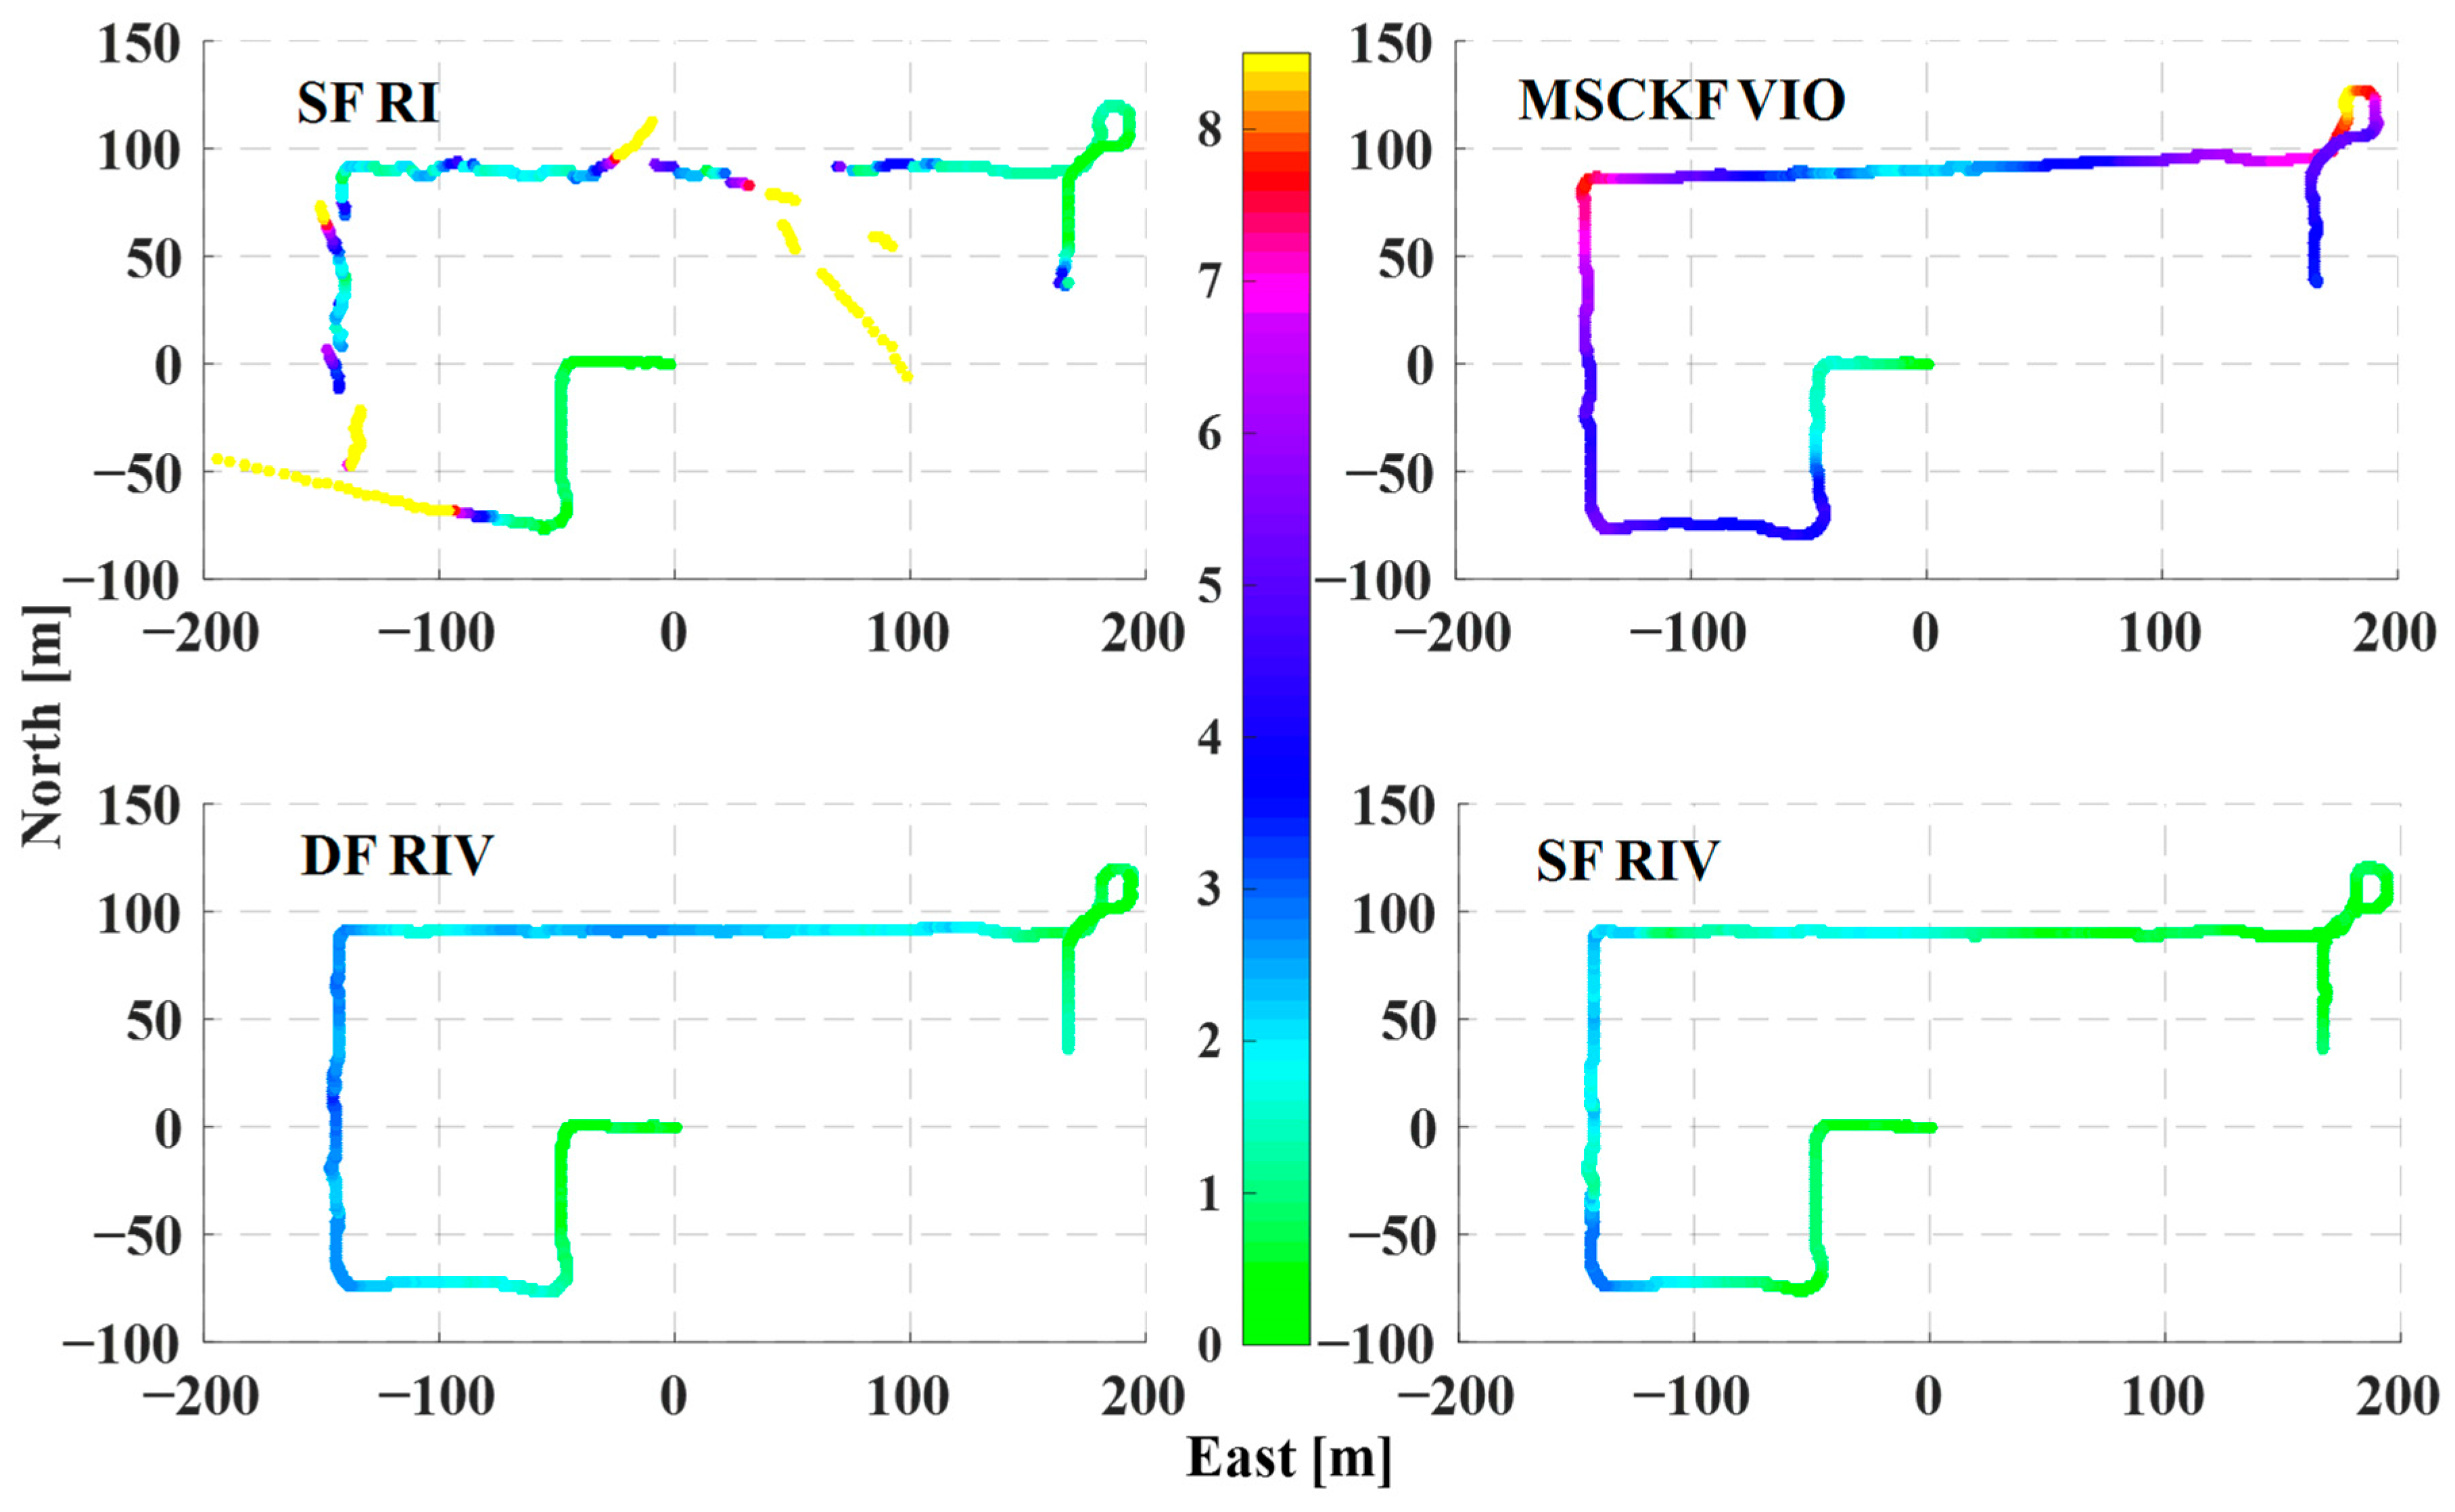
The 3D trajectories of different positioning modes are shown in Figure 11. Due to the frequent GNSS outages, the trajectory calculated by SF RTK/INS tight integration mode is a serious deviation from the truth trajectory in GNSS gaps. While applying the Visual/INS tight integration mode, the result is closer to the truth trajectory compared to that of SF RTK/INS tight integration mode. This is because the pose and IMU errors can be consistently estimated by integrating external continuous visual information (as shown in Equation (22)). After fusing the dual-frequency GNSS observations, the DF RTK/INS/vision tight integration system can provide more accurate position results, especially in the vertical direction. Such improvements are more obvious while using the GNSS SF data due to more observations. To further illustrate the positioning performance of the four positioning modes, the position errors of different modes in the horizontal direction are projected into the trajectories (Figure 12). We set the color of the trajectory to change from green to yellow when the position errors increased from 0.0 m to 8.5 m. The specific cumulative distribution function (CDF) results of position differences of different modes are shown in Figure 13. Visibly, the trajectory calculated by SF RIV mode depicts deeper green colors, which means a higher-accuracy position. According to the statistics, the horizontal errors at 68% of the CDF are 3.45 m, 5.20 m, 2.12 m, and 1.57 m for the modes of SF RI, VIO, DF RIV, and SF RIV, respectively.

4.3. Contributions to Attitude Determination

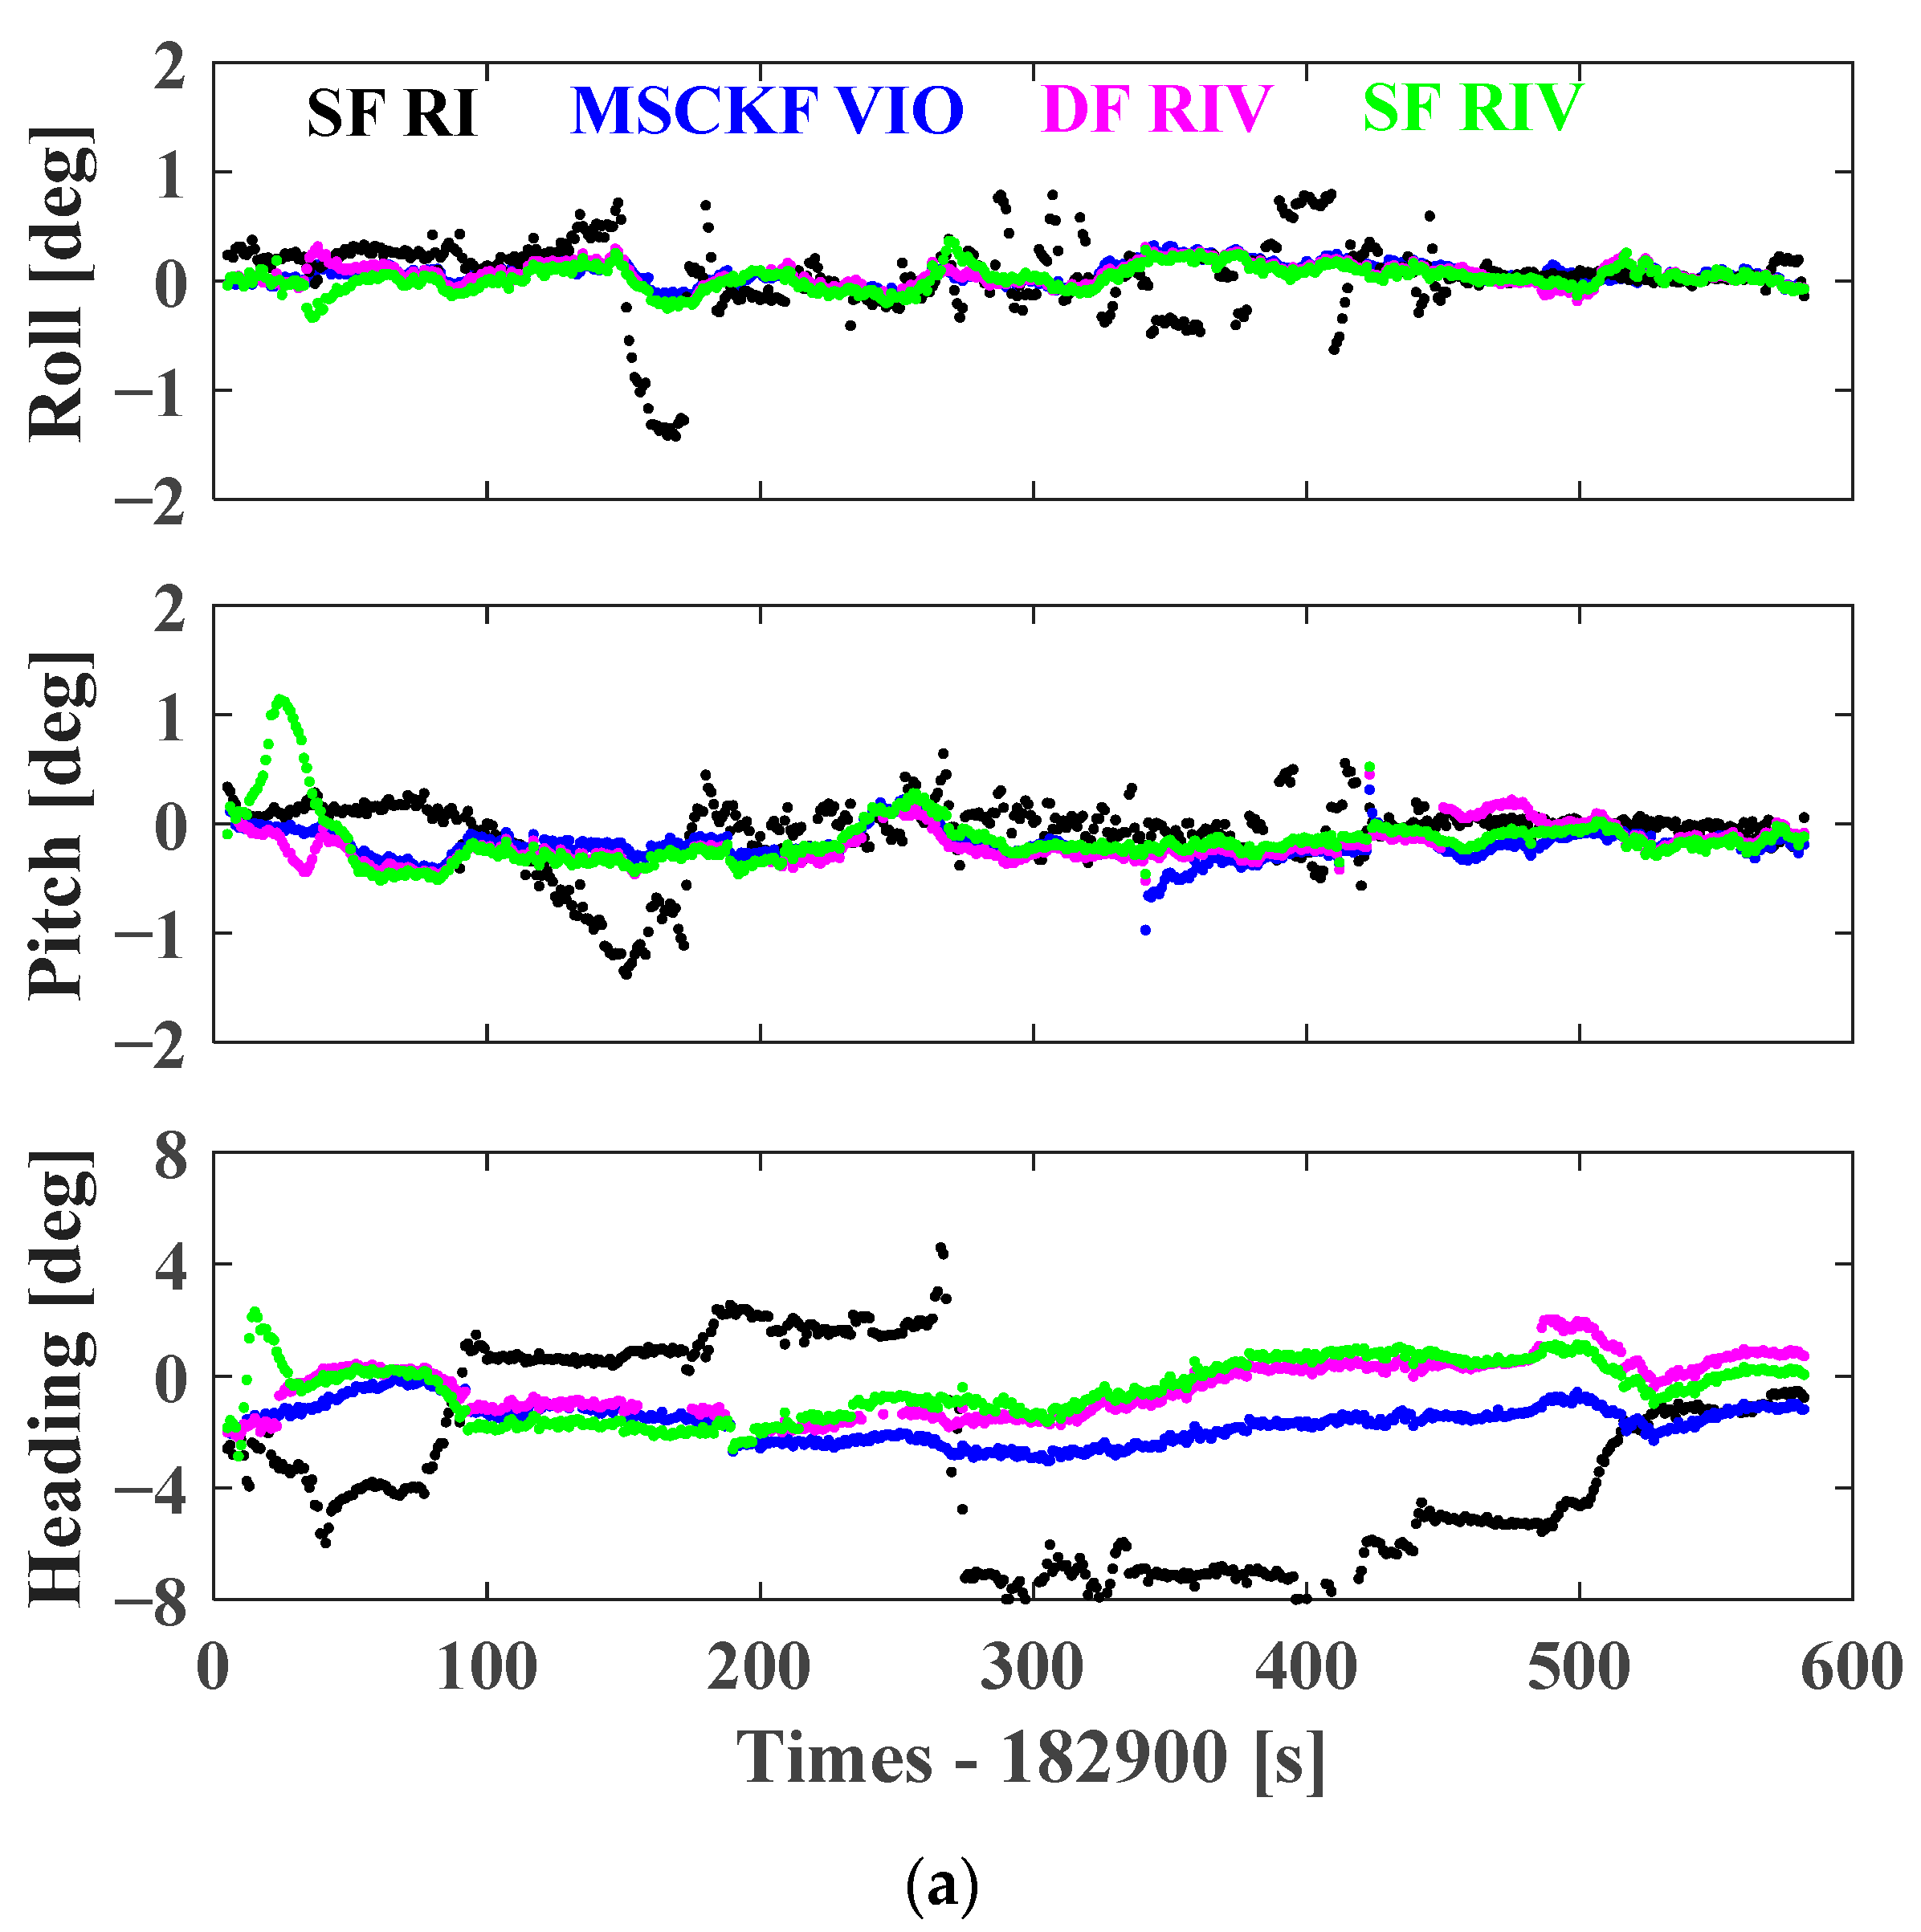
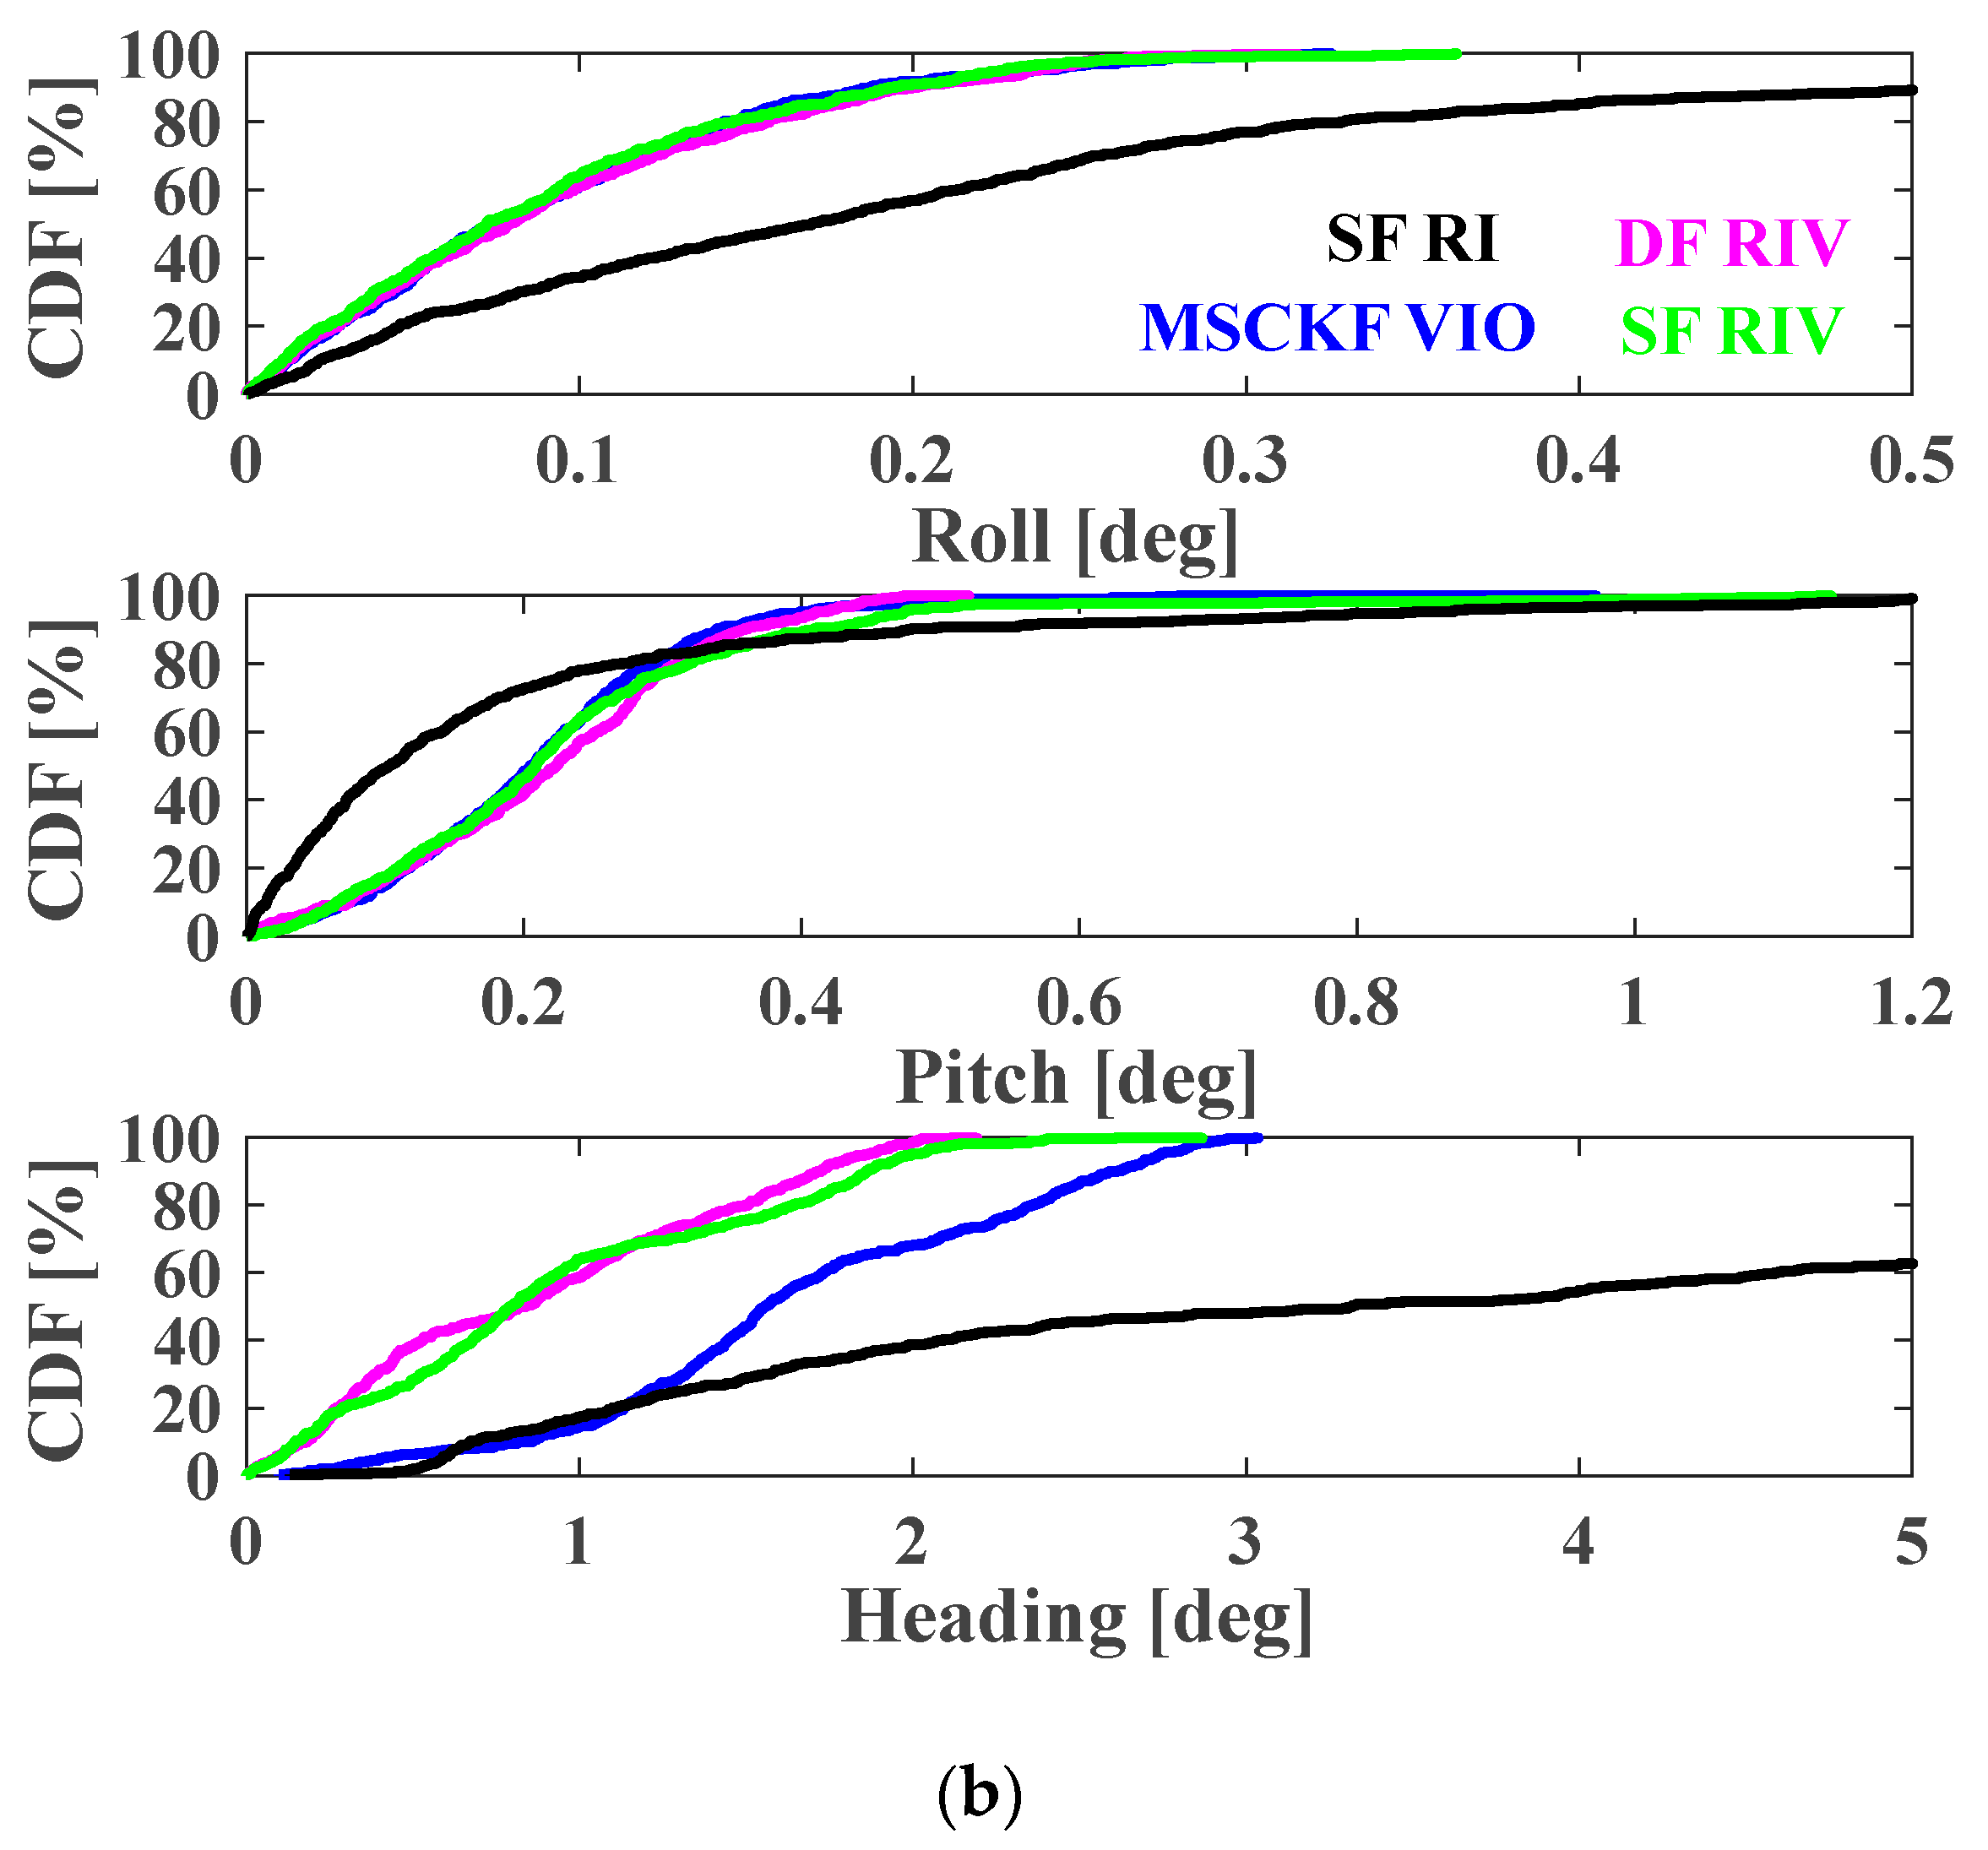
For land vehicles, the accuracy of attitude is even more crucial. Therefore, the impact of the proposed model on attitude determination has also been investigated. Figure 14 shows the time series and CDF of attitude differences for the modes of MSCKF VIO, SF RI, DF RIV, and SF RIV, respectively. Due to the frequent partial and complete GNSS outages, the attitudes of SF RI mode are rapidly drifting. It can be noted that the maximum heading error is up to 8°, which is worse than roll and pitch directions. This is because of the weak observability of the gyroscope in the vertical component under the GNSS-denied area [33]. While applying the VIO mode, the phenomenon of attitude drifts disappears significantly. Table 4 lists the attitude RMSE of different data processing modes. For VIO mode, the attitude RMSE in three directions are 0.11°, 0.24°, and 1.79°, which presents about 68.57%, 33.33%, and 60.83% enhancements compared to that of SF RI mode. It proves that the visual information can enhance the observability of attitudes and IMU sensor errors (as shown in Equation (18)). After integrating the GNSS DF/SF observations, the attitudes of RMSE improve to 0.12°/0.11°, 0.24°/0.28°, and 1.04°/1.04°. The improvements are mainly reflected in the heading direction (41.90%), which is due to the enhancement of the heading observability. As shown in Figure 14b, the roll attitude errors at 68% of the CDF are 0.248°, 0.114°, 0.118°, and 0.108° for the schemes of SF RI, VIO, DF RIV, and SF RIV, and the pitch attitude error at 68% of the CDF are 0.174°, 0.250°, 0.275°, and 0.255°. The heading attitude errors at such a percentage of the CDF are 5.268°, 1.985°, 1.156°, and 1.142° for the schemes of SF RI, VIO, DF RIV, and SF RIV. The above statistics indicate that the accuracy of attitude estimation, especially in the heading direction, can be further improved while fusing the original GNSS observations and camera images.

4.4. Analysis of Running Time

The data are processed on the desktop with an 11th Gen Intel Core i7-11700K CPU and 32 GB RAM. Table 5 lists the average running time of the major time-consuming parts in the presented model, which can be summarized as (1) feature detecting and tracking: fast corner detection and KLT tracking proceedings; (2) visual measurement update: the selection of the feature points in measurement update, the calculation of the selected feature point position, and the state update process of integrating the visual measurements; (3) GNSS measurement processing: the construction of DD observations, the float/integer ambiguity pre-obtained by applying INS-aided ambiguity resolution methods, and the state update of fusing the GNSS measurements. According to the statistics, the total running time on average is 87.02 ms. Such factors prove that the presented model can be effectively used in real-time applications [24,46].

5. Conclusions

In this contribution, we present a low-cost GNSS RTK/INS/vision tight integration model based on the MSCKF method to achieve high-accuracy and real-time positioning results. A set of wheeled robot data under satellite signal-blocked conditions are utilized to validate the performance in terms of sensors-aided cycle slip detection, position, attitude, and run time. Results illustrate that the sensors-aided cycle-slip detection method has the advantage of detecting small cycle-slip while adopting single-frequency GNSS observations. The position accuracy in the north, east, and vertical directions are upgraded to 0.88 m, 0.88 m, and 0.64 m, with improvements of 77.95%/33.83%, 66.96%/11.11%, and 71.07%/59.38% compared to that of the MSCKF VIO and dual-frequency RTK/INS/vision modes, while applying the single-frequency GNSS/INS/vision tight integration model. For the attitudes, improvement is mainly reflected in the heading component due to the observability enhancements on the heading angle and gyroscope in the vertical direction. The average running time significantly proves that the presented model has the potential for real-time applications.

Author Contributions

Conceptualization, Q.X. and Z.G.; Data curation, Q.X. and C.Y.; Funding acquisition, Z.G.; Investigation, Q.X. and Z.G.; Methodology, Z.G. and C.Y.; Software, Q.X. and J.L.; Validation, J.L.; Visualization, Z.G. and C.Y.; Writing—original draft, Q.X.; Writing—review & editing, Z.G., C.Y. and J.L. All authors have read and agreed to the published version of the manuscript.

Funding

This work was partially funded by the National Natural Science Foundation of China (NSFC) (Grants No. 42274022 and 42274052).

Data Availability Statement

The datasets adopted in this paper are managed by the School of Land Science and Technology, China University of Geosciences Beijing, and can be available on request from the corresponding author.

Acknowledgments

Many thanks to Wuhan University for providing GNSS/IMU/Camera data.

Conflicts of Interest

The authors declare no conflict of interest.

References

  1. Zhuang, Y.; Sun, X.; Li, Y.; Huai, J.; Hua, L.; Yang, X.; Cao, X.; Zhang, P.; Cao, Y.; Qi, L.; et al. Multi-sensor integrated navigation/positioning systems using data fusion: From analytics-based to learning-based approaches. Inf. Fusion 2023, 95, 62–90. [Google Scholar] [CrossRef]
  2. Liu, Y.; Gao, Z.; Xu, Q.; Li, Y.; Chen, L. Assessing partial ambiguity resolution and WZTD-constraint multi-frequency RTK in an urban environment using new BDS signals. GPS Solut. 2022, 8, 88. [Google Scholar] [CrossRef]
  3. Yuan, Y.; Mi, X.; Zhang, B. Initial assessment of single-and dual-frequency BDS-3 RTK positioning. Satell. Navig. 2020, 1, 31. [Google Scholar] [CrossRef]
  4. Yang, Y.; Li, J.; Wang, A.; Xu, J.; He, H.; Guo, H.; Shen, J.; Dai, X. Preliminary assessment of the navigation and positioning performance of BeiDou regional navigation satellite system. Sci. China-Earth Sci. 2014, 57, 144–152. [Google Scholar] [CrossRef]
  5. Yuan, H.; Zhang, Z.; He, X.; Wen, Y.; Zeng, J. An Extended robust estimation method considering the multipath effects in GNSS real-time kinematic positioning. IEEE Trans. Instrum. Meas. 2022, 71, 1–9. [Google Scholar] [CrossRef]
  6. Li, Z.; Xu, G.; Guo, J.; Zhao, Q. A sequential ambiguity selection strategy for partial ambiguity resolution during RTK positioning in urban areas. GPS Solut. 2022, 26, 92. [Google Scholar] [CrossRef]
  7. Li, B.; Liu, T.; Nie, L.; Qin, Y. Single-frequency GNSS cycle slip estimation with positional polynomial constraint. J. Geod. 2019, 93, 1781–1803. [Google Scholar] [CrossRef]
  8. Niu, X.; Zhang, Q.; Gong, L.; Liu, C.; Zhang, H.; Shi, C. Development and evaluation of GNSS/INS data processing software for position and orientation systems. Surv. Rev. 2015, 47, 87–98. [Google Scholar] [CrossRef]
  9. Hu, G.; Gao, B.; Zhong, Y.; Gu, C. Unscented Kalman Filter with Process Noise Covariance Estimation for Vehicular INS/GPS Integration System. Inf. Fusion 2020, 64, 194–204. [Google Scholar] [CrossRef]
  10. Petovello, M.G.; Cannon, M.E.; Lachapelle, G. Benefits of Using a Tactical-Grade IMU for High-Accuracy Positioning. Navigation 2004, 51, 1–12. [Google Scholar] [CrossRef]
  11. Li, T.; Zhang, H.; Gao, Z.; Chen, Q.; Niu, X. High-Accuracy Positioning in Urban Environments Using Single-Frequency Multi-GNSS RTK/MEMS-IMU Integration. Remote Sens. 2018, 10, 205. [Google Scholar] [CrossRef] [Green Version]
  12. Gao, B.; Hu, G.; Zhong, Y.; Zhu, X. Cubature Kalman Filter With Both Adaptability and Robustness for Tightly-Coupled GNSS/INS Integration. Inf. Fusion 2021, 21, 14997–15011. [Google Scholar] [CrossRef]
  13. Leutenegger, S.; Lynen, S.; Bosse, M.; Siegwart, R.; Furgale, P. Keyframe-based visual-inertial odometry using nonlinear optimization. Int. J. Robot. Res. 2015, 34, 314–334. [Google Scholar] [CrossRef] [Green Version]
  14. Qin, T.; Li, P.; Shen, S. VINS-Mono: A Robust and Versatile Monocular Visual-Inertial State Estimator. IEEE Trans. Robot. 2018, 34, 1004–1020. [Google Scholar]
  15. Usenko, V.; Demmel, N.; Schubert, D.; Stückler, J.; Cremers, D. Visual-Inertial Mapping with Non-Linear Factor Recovery. IEEE Robot. Autom. Lett. 2019, 5, 422–429. [Google Scholar] [CrossRef] [Green Version]
  16. Mur-Artal, R.; Tard´os, J.D. Visual-inertial monocular SLAM with map reuse. IEEE Robot. Autom. Lett. 2017, 2, 796–803. [Google Scholar] [CrossRef] [Green Version]
  17. Mourikis, A.I.; Roumeliotis, S.I. A multi-state constraint Kalman fifilter for vision-aided inertial navigation. In Proceedings of the IEEE International Conference on Robotics and Automation, Roma, Italy, 10–14 April 2007; pp. 3565–3572. [Google Scholar]
  18. Huang, G.P.; Mourikis, A.I.; Roumeliotis, S.I. Analysis and improvement of the consistency of extended Kalman filter based SLAM. In Proceedings of the IEEE International Conference on Robotics and Automation, Pasadena, CA, USA, 19–23 May 2008; pp. 473–479. [Google Scholar]
  19. Li, M.; Mourikis, A.I. Improving the Accuracy of EKF-Based Visual-Inertial Odometry. In Proceedings of the IEEE International Conference on Robotics and Automation, Saint Paul, MN, USA, 14–18 May 2012; pp. 828–835. [Google Scholar]
  20. Sibley, G.; Matthies, L.; Sukhatme, G. Sliding window filter with application to planetary landing. J. Field Robot. 2010, 27, 587–608. [Google Scholar] [CrossRef]
  21. Bloesch, M.; Omari, S.; Hutter, M.; Siegwart, R. Robust visual inertial odometry using a direct EKF-based approach. In Proceedings of the IEEE/RSJ International Conference on Intelligent Robots and Systems, Hamburg, Germany, 28 September–2 October 2015; pp. 298–304. [Google Scholar]
  22. Li, M.; Mourikis, A.I. High-precision, consistent EKF-based visual-inertial odometry. Int. J. Robot. Res. 2013, 32, 690–711. [Google Scholar] [CrossRef]
  23. Lynen, S.; Achtelik, M.W.; Weiss, S.; Chli, M.; Siegwart, R. A robust and modular multi-sensor fusion approach applied to mav navigation. In Proceedings of the IEEE/RSJ International Conference on Intelligent Robots and Systems, Tokyo, Japan, 3–7 November 2013; pp. 3923–3929. [Google Scholar]
  24. Niu, X.; Tang, H.; Zhang, T.; Fan, J.; Liu, J. IC-GVINS: A Robust, Real-time, INS-Centric GNSS-Visual-Inertial Navigation System for Wheeled Robot. IEEE Robot. Autom. Lett. 2022, 5, 216–223. [Google Scholar] [CrossRef]
  25. Liao, J.; Li, X.; Wang, X.; Li, S.; Wang, H. Enhancing navigation performance through visual-inertial odometry in GNSS-degraded environment. GPS Solut. 2021, 25, 50. [Google Scholar] [CrossRef]
  26. Cao, S.; Lu, X.; Shen, S. GVINS: Tightly Coupled GNSS-Visual-Inertial for Smooth and Consistent State Estimation. IEEE Trans. Robot. 2022, 38, 2004–2021. [Google Scholar] [CrossRef]
  27. Won, D.H.; Lee, E.; Heo, M.; Sung, S.; Lee, J.; Lee, Y. GNSS integration with vision-based navigation for low GNSS visibility conditions. GPS Solut. 2014, 18, 177–187. [Google Scholar] [CrossRef]
  28. Li, X.; Li, X.; Li, S.; Zhou, Y.; Sun, M.; Xu, Q.; Xu, Z. Centimeter-accurate vehicle navigation in urban environments with a tightly integrated PPP-RTK/MEMS/vision system. GPS Solut. 2022, 26, 124. [Google Scholar] [CrossRef]
  29. Li, T.; Zhang, H.; Gao, Z.; Niu, X.; EI-sheimy, N. Tight Fusion of a Monocular Camera, MEMS-IMU, and Single-Frequency Multi-GNSS RTK for Precise Navigation in GNSS-Challenged Environments. Remote Sens. 2019, 11, 610. [Google Scholar] [CrossRef] [Green Version]
  30. Shin, E.H. Estimation Techniques for Low-Cost Inertial Navigation. Ph.D. Dissertation, University of Calgary, Calgary, AB, Canada, 2005. [Google Scholar]
  31. Gao, Z.; Ge, M.; Shen, W.; Zhang, H.; Niu, X. Ionospheric and receiver DCB-constrained multi-GNSS single-frequency PPP integrated with MEMS inertial measurements. J. Geod. 2017, 91, 1351–1366. [Google Scholar] [CrossRef]
  32. Gao, Z.; Ge, M.; Shen, W.; You, L.; Chen, Q.; Zhang, H.; Niu, X. Evaluation on the impact of IMU grades on BDS+GPS PPP/INS tightly coupled integration. Adv. Space Res. 2017, 60, 1283–1299. [Google Scholar] [CrossRef] [Green Version]
  33. Xu, Q.; Gao, Z.; Lv, J.; Yang, C. Tightly Coupled Integration of BDS-3 B2b RTK, IMU, Odometer, and Dual-Antenna Attitude. IEEE Internet Things J. 2022, 10, 6415–6427. [Google Scholar] [CrossRef]
  34. Yang, Y.; Song, L.; Xu, T. Robust estimator for correlated observations based on bifactor equivalent weights. J. Geod. 2002, 76, 353–358. [Google Scholar] [CrossRef]
  35. Li, T. Research on the Tightly Coupled Single-Frequency Multi-GNSS/INS/Vision Integration for Precise Position and Orientation Estimation. Ph.D. Dissertation, University of Wuhan, Wuhan, China, 2019. [Google Scholar]
  36. Jin, R.; Liu, J.; Zhang, H.; Niu, X. Fast and accurate initialization for monocular vision/INS/GNSS integrated system on land vehicle. IEEE Sens. J. 2021, 21, 26074–26085. [Google Scholar] [CrossRef]
  37. Teunnissen, P.J.G. The least-square ambiguity decorrelation adjustment: A method for fast GPS integer ambiguity estimation. J. Geod. 1995, 70, 65–82. [Google Scholar] [CrossRef]
  38. Du, Z.; Chai, H.; Xiao, G.; Yin, X.; Wang, M.; Xiang, M. Analyzing the contributions of multi-GNSS and INS to the PPP-AR outage re-fixing. GPS Solut. 2021, 25, 81. [Google Scholar] [CrossRef]
  39. Trajkovic, M.; Hedley, M. Fast corner detection. Image Vis. Comput. 1998, 16, 75–87. [Google Scholar] [CrossRef]
  40. Lucas, B.; Kanade, T. An Iterative Image Registration Technique with an Application to Stereo Vision. In Proceedings of the International Joint Conference on Artifcial Intelligence, Vancouver, BC, Canada, 24–28 August 1981; pp. 24–28. [Google Scholar]
  41. Sun, K.; Mohta, K.; Pfrommer, B.; Watterson, M.; Liu, S.; Mulgaonkar, Y.; Taylor, C.J.; Kumar, V. Robust stereo visual inertial odometry for fast autonomous fight. IEEE Robot. Autom. Lett. 2018, 3, 965–972. [Google Scholar] [CrossRef] [Green Version]
  42. Zuo, X.; Geneva, P.; Lee, W.; Liu, Y.; Huang, G. LIC-fusion: Lidar-inertial-camera odometry. In Proceedings of the IEEE/RSJ IROS 2019, Macau, China, 4–8 November 2019; pp. 5848–5854. [Google Scholar]
  43. Chen, G.; Li, B.; Zhang, Z.; Liu, T. Integer ambiguity resolution and precise positioning for tight integration of BDS-3, GPS, GALILEO, and QZSS overlapping frequencies signals. GPS Solut. 2022, 26, 26. [Google Scholar]
  44. Ge, Y.; Cao, X.; Lyu, D.; He, Z.; Ye, F.; Xiao, G.; Shen, F. An investigation of PPP time transfer via BDS-3 PPP-B2b service. GPS Solut. 2023, 27, 61. [Google Scholar] [CrossRef]
  45. Yang, Y.; Ding, Q.; Gao, W.; Li, J.; Xu, Y.; Sun, B. Principle and performance of BDSBAS and PPP-B2b of BDS-3. Satell. Navig. 2022, 3, 5. [Google Scholar] [CrossRef]
  46. Nezhadshahbodaghi, M.; Mosavi, M.R.; Hajialinajar, M.T. Fusing denoised stereo visual odometry, INS and GPS measurements for autonomous navigation in a tightly coupled approach. GPS Solut. 2021, 25, 47. [Google Scholar] [CrossRef]
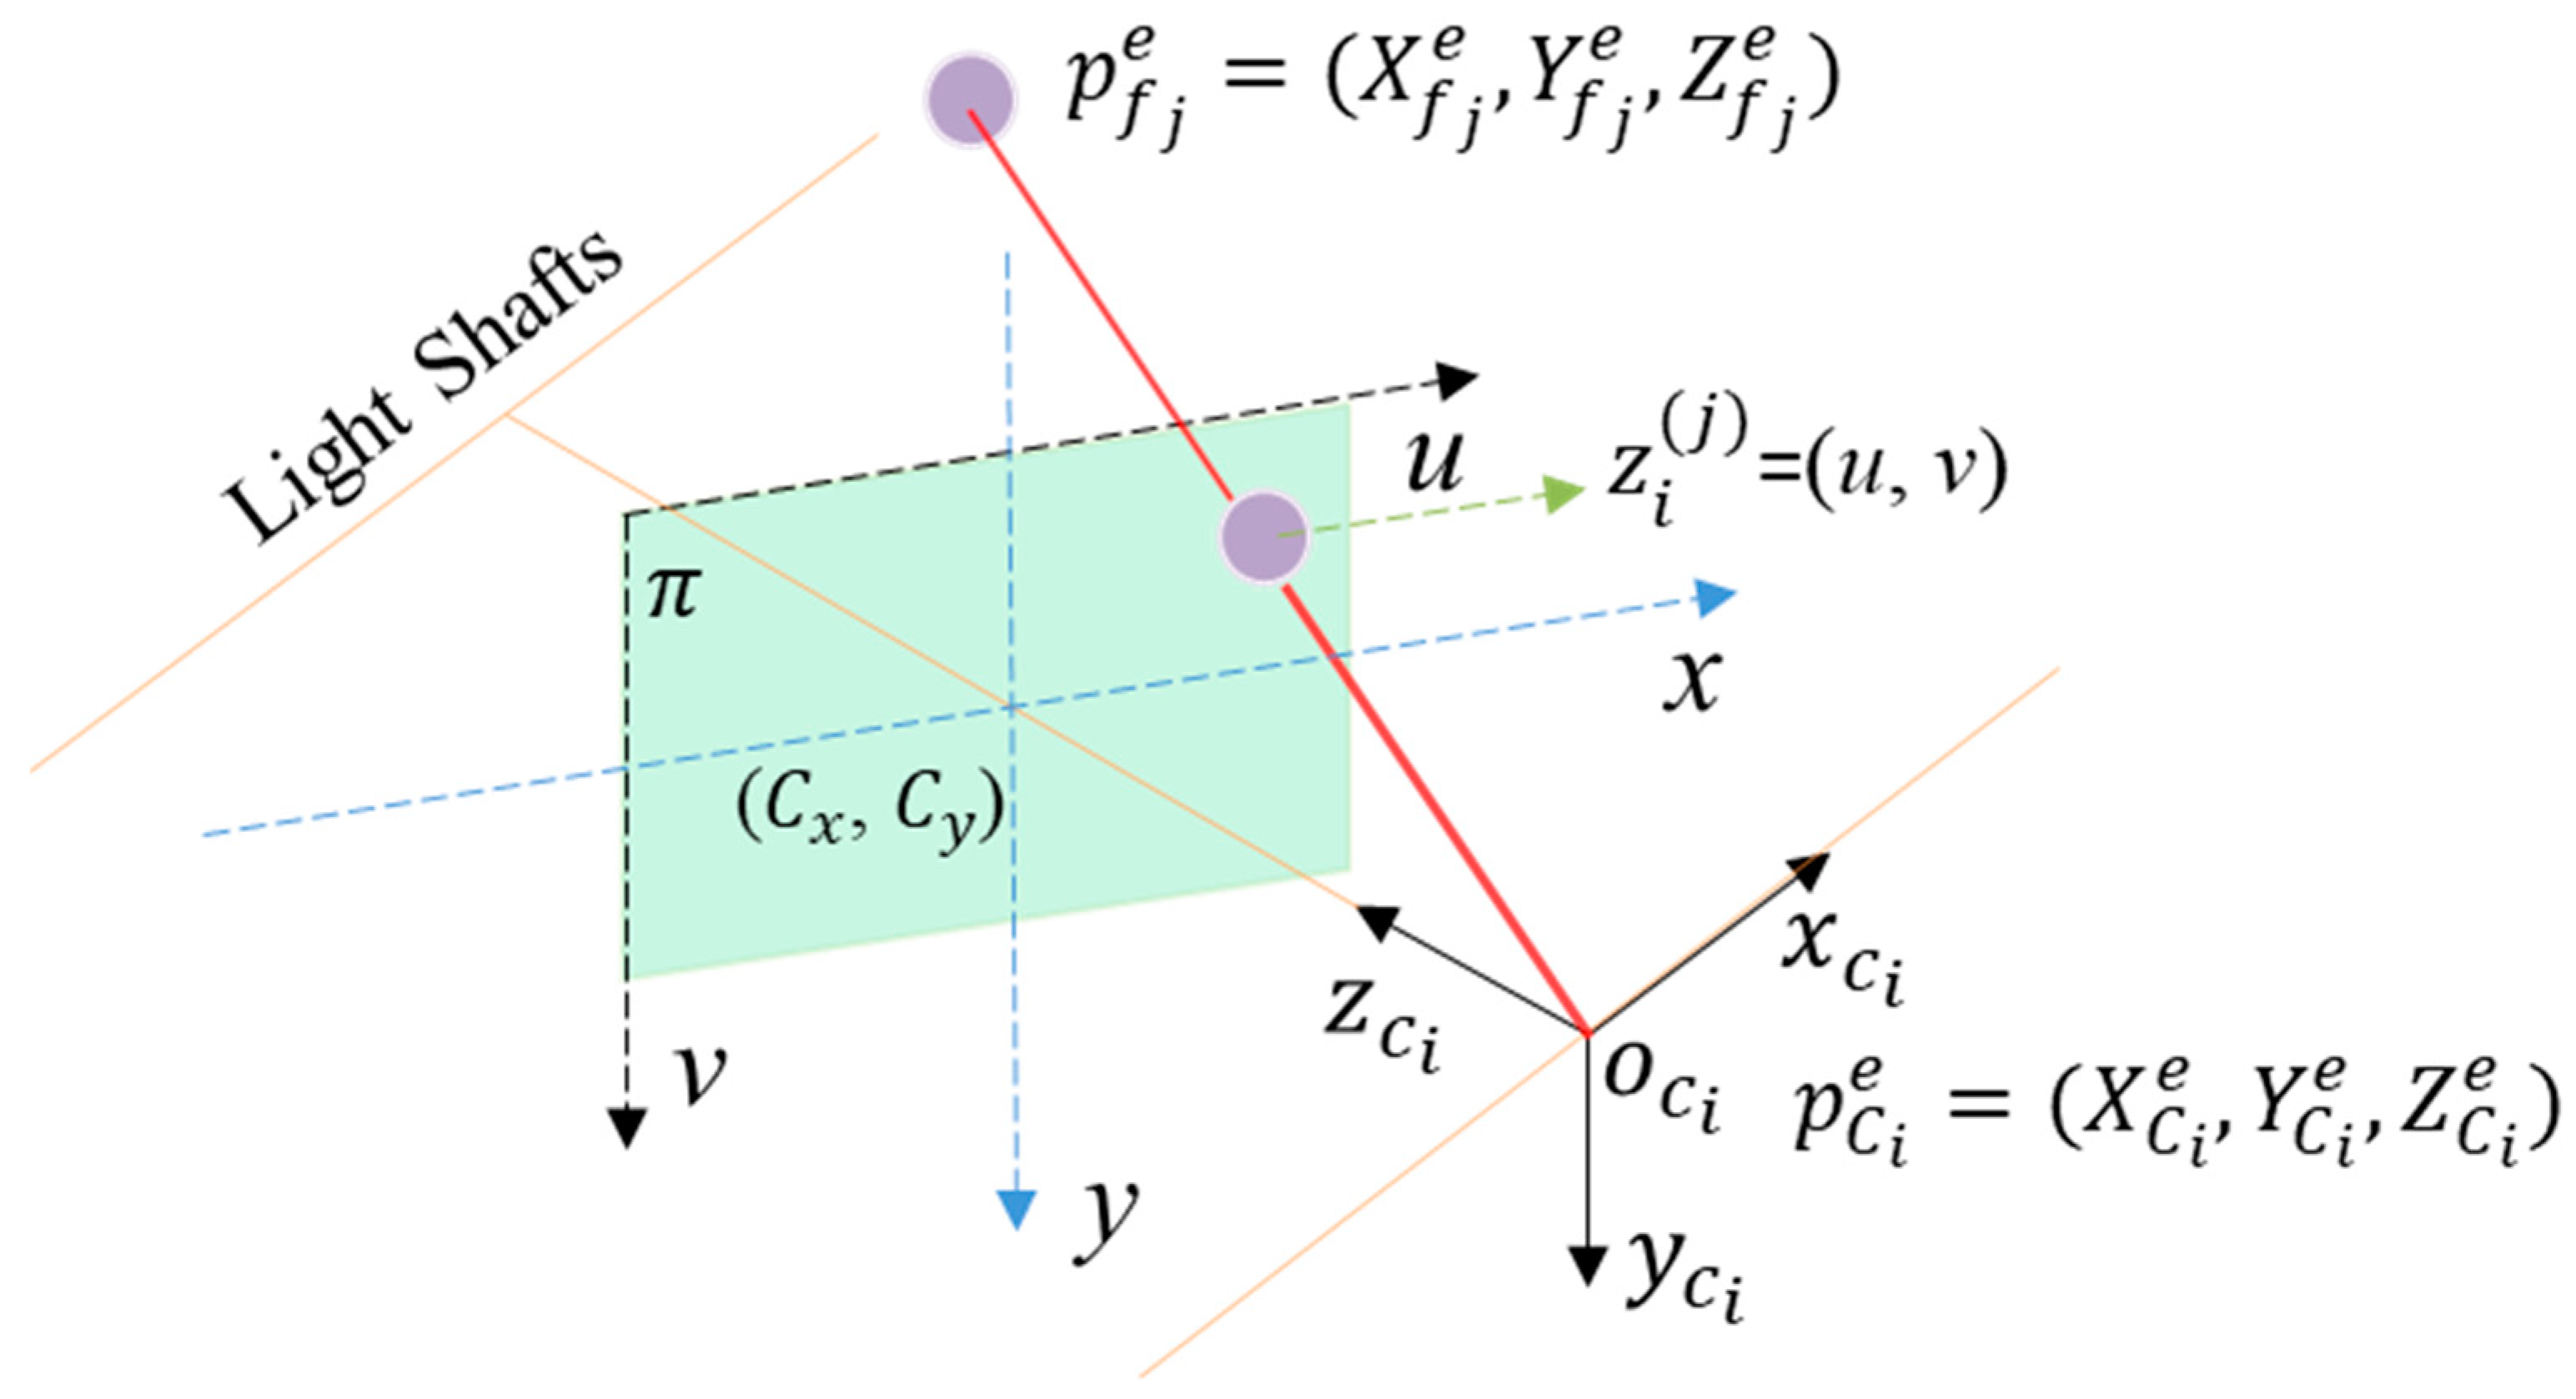
Figure 1. Overview of the camera projection model.
Remotesensing 15 03005 g001
Figure 2. Implementation of the presented GNSS/INS/vision-tight integration.
Remotesensing 15 03005 g002
Figure 3. Filed trajectory of the wheel robot test.
Remotesensing 15 03005 g003
Figure 4. Typical scenarios in the test.
Remotesensing 15 03005 g004
Figure 5. Sky-plot of tracked satellites during the test.
Remotesensing 15 03005 g005
Figure 6. Satellite numbers (a) and the corresponding PDOP (b) during the test.
Remotesensing 15 03005 g006aRemotesensing 15 03005 g006b
Figure 7. Sensors-aided cycle-slip detection results in the simulation test. The red line denotes the detection threshold, the blue line represents the detection term, and the green cycle denotes the detected cycle-slips value.
Remotesensing 15 03005 g007
Figure 8. Time series of the detected cycle-slips value during the measured test. The red line denotes the detection threshold and the blue dot represents the detection term.
Remotesensing 15 03005 g008
Figure 9. Time series of position differences of the single-frequency GNSS RTK mode (SF RTK), single -frequency GNSS RTK/INS tight integration mode, (SF RI), and visual-inertial tight integration mode (MSCKF VIO).
Remotesensing 15 03005 g009
Figure 10. Time series of position differences of the dual-frequency GNSS RTK/INS/vision tight integration mode (DF RIV) and single-frequency GNSS RTK/INS/vision tight integration mode (SF RIV).
Remotesensing 15 03005 g010
Figure 11. 3D trajectories of different modes.
Remotesensing 15 03005 g011
Figure 12. Horizontal position error density of different modes.
Remotesensing 15 03005 g012
Figure 13. Cumulative distribution function (CDF) of horizontal position differences of different modes.
Remotesensing 15 03005 g013
Figure 14. (a) Time series and (b) cumulative distribution function (CDF) of attitude differences for the modes of SF RI, MSCKF VIO, DF RIV, and SF RIV.
Remotesensing 15 03005 g014aRemotesensing 15 03005 g014b
Table 1. Specifications of the MEMS-IMU.
BiasRandom Walk
Gyro .   ( ° / h ) Acce. (mGal) Angular   ( ° / h ) Velocity   ( m / s / h )
3630003.172.7
Table 2. The specific differences of the schemes.
ModeVisual DataIMU DataDual Frequency GNSS DataSingle Frequency GNSS Data
MSCKF VIOΔΔ
SF-RI Δ Δ
DF-RIVΔΔΔ
SF-RIVΔΔ Δ
Table 3. Position RMSE of different modes.
ModesSF RTKSF RIMSCKF VIODF RIVSF RIV
North (m)1.8422.724.011.330.88
East (m)1.3349.912.670.990.88
Down (m)5.0915.082.261.600.65
Table 4. Attitude RMSE of different modes.
ModesSF RIMSCKF VIODF RIVSF RIV
Roll (°)0.350.110.120.11
Pitch (°)0.360.240.240.28
Heading (°)4.571.791.041.04
Table 5. The average running time of the presented model.
TypesTime (ms)
Feature detecting and tracking26.42
Visual measurement update59.24
GNSS measurement processing1.36
Total87.02
Disclaimer/Publisher’s Note: The statements, opinions and data contained in all publications are solely those of the individual author(s) and contributor(s) and not of MDPI and/or the editor(s). MDPI and/or the editor(s) disclaim responsibility for any injury to people or property resulting from any ideas, methods, instructions or products referred to in the content.