Article

Retrieving Soil Moisture at the Field Scale from Sentinel-1 Data over a Semi-Arid Mediterranean Agricultural Area

Department of Civil, Environmental and Mechanical Engineering, University of Trento, 38123 Trento, Italy
*
Author to whom correspondence should be addressed.
Remote Sens. 2023, 15(12), 2997; https://doi.org/10.3390/rs15122997
Submission received: 2 May 2023 / Revised: 27 May 2023 / Accepted: 1 June 2023 / Published: 8 June 2023
(This article belongs to the Special Issue Remote Sensing of Soil Moisture for Agricultural Purposes)

Abstract

:
In this work, superficial soil moisture is estimated from SAR data at the field scale on agricultural fields over which the relationship between the co-polarized backscattering coefficient ( γ 0 V V ) and the measured soil moisture ( S S M v ) is both direct and inverse. An inversion algorithm is adapted to the charateristics of the single field and applied to SAR signal differences. The differences of SAR signal are obtained from a change detection (CD) method applied on the VV band of the Sentinel-1 SAR mission. In the CD method, the variations of the total backscattered signal due to sharp changes in vegetation and soil roughness are excluded from the dataset by using a machine learning algorithm. The retrieval method is applied on a low vegetated agricultural area in Spain, characterized by a semi-arid mediterranean climate and where in situ soil moisture data are available. Good results are obtained not only over fields characterized by direct γ 0 V V / S S M v relationship, reaching values of correlation coefficient and RMSE up to r = 0.89 and R M S E = 0.042 m 3 /m 3 , but also over fields with inverse relationship, obtaining in this case values up to r = 0.84 ad R M S E = 0.026 m 3 /m 3 . Although the inverse relationship between the backscattering coefficient and the measured soil moisture is not yet well understood in the field of soil moisture estimation from radar data, for the present case, checking the nature of this relationship was fundamental in order to accordingly adapt the soil moisture retrieval algorithm to the dataset characteristics.

1. Introduction

Soil moisture is a key climate and hydrological variable since it is strongly connected with the water cycle and the surface energy budget. The amount of soil moisture is indeed the main driver of water and heat fluxes between land and atmosphere, and impacts other climatic variables as well, such as air temperature and precipitation [1]. Given the role of soil moisture, a precise knowledgle of its spatial distribution and temporal evolution is crucial for various environmental applications, such as watershed management and flood prediction, weather forecast and prediction of impacts from climate change, agricultural practises, monitoring of drought and ecosystems, environmental response to climate change [2,3]. From 2010, the soil water content is indeed one of the Essential Climate Variables (ECVs) according to the Global Climate Observing System [4].
The retrieval of information on spatial and temporal variability of soil moisture can be performed with different approaches, including field measurements, weather-hydrological modelling, and processing of remote sensed data. Direct and proximal in situ measurements can be considered as a reliable source of information for soil water content [2]. Even though they allow determining a “ground truth”, they only provide pointwise information poorly representative of the strong spatial variability of soil moisture. The resulting information are in fact limited to restricted areas and likely time intervals. Moreover, monitoring soil moisture content with in situ measurements over large areas and time periods is demanding, due to the large effort required for installing, mantaining and operating the sensors. Hydrological and weather forecasting models could instead provide soil moisture information at a wider space and time scale. Nevertheless, soil moisture from models is affected by uncertainties, such as the analitical framework of the model and input data [5], which may be considered and taken into account. Information on soil moisture can be retrieved at wide spatial and time scale also by processing remote sensed images, exploiting the interaction between the acquired signal and the characteristics of the Earth surface. In particular, satellite images from either active or passive microwave sensors have been largely exploited for estimating superficial soil moisture during the last 20 years [6,7], due to the sensitivity of the signal to the dielectric constant of the land surface, and thus to the soil moisture content. Among the remote sensing techniques for estimating superficial soil moisture, the GNSS-R (Global Navigation Satellite Systems—Reflectometry) [8] exploits the GNSS signal reflected on the Earth Surface received by spaceborne GNSS-R receivers. With this technique, the retrieved soil moisture is referred to the area around the reflection point on the Earth surface within a radius of thousands of meters.
Many efforts have been made for estimating the quantities of interest from microwave images at global scale, by realizing various satellite missions whose soil moisture products are characterized by coarse resolution and frequent (up to daily) revisit time. Among the missions providing these kind of products, there are Soil Moisture and Ocean Salinity (SMOS) [9], Soil Moisture Active Passive (SMAP) [10], Windsat [11] and Advanced Scatterometer (ASCAT) [12]. One of the most suitable radar technologies for estimating soil moisture at a finer resolution is the Synthetic Aperture Radar (SAR) [13]. Open missions carrying this technology allow characterizing parameters of interest at a resolutions up to 20 m, with a revisit time of 6 days, as is the case of the Sentinel-1 C-band SAR mission of the European Space Agency (ESA) [14], and in the next future missions such as NISAR (NASA-ISRO SAR) will provide L-band and S-band images at even higher resolutions of 5 m and 20 m. In the meantime, the high acquisition frequency of sensors such as the one of Sentinel-1, produce dense time series of SAR images, increasing the potentialities of applying methods such as those based on Change Detection (CD) analysis.
In the context of soil moisture estimation at kilometric scale over sparsely vegetated areas, a CD method can be used by assuming that the main drivers of the variations of the backscattered signal are superficial soil moisture and the development of the vegetation (e.g., [15,16]). At the field scale instead, the SAR signal is also influeced by surface roughness. For considering this, Balenzano et al. [17] proposed a CD method in which vegetation and roughness variations could be assumed to be constant between two epochs close in time, where homogeneous crop type are present. On areas characterized by heterogeneous crops instead, Gao et al. [18] coupled a CD method and a semi-empirical model to parametrize vegetation contribution to SAR signal with an optical vegetation index, using a 100 m resolution for mitigating roughness and noise influences. Unfortunately, optical data are not always available with a fixed frequency over a study area, as their usability depends on cloud cover conditions. In order to have more frequent information on the vegetation contribution, Veloso et al. [19] studied the sensitivity of SAR bands in distinguishing crop types and monitoring crops changes during the growing season. They demonstrated the suitability of the cross-polarized VH band of Sentinel-1 for classifying the state of the vegetation. Moreover, the effects of changes in roughness conditions at the field scale have to be taken into account, because agricultural operations such as tillage and harvesting can cause sharp changes in the roughness conditions of the field, and thus not negligible variations on the total backscattering coefficients.
In the present work, the influence of vegetation and soil roughness variations on the total backscattered signal are taken into account with a preliminary analysis on co-polarized and cross-polarized Sentinel-1 bands, similarly to what proposed by Zhu et al. [20]. Sharp changes linked to vegetation evolution and variations in soil roughness conditions are identifyed at the field scale in a 3D space of SAR fetures by using a DBSCAN algorithm. Once outliers are excluded from the data sample, it is assumed that soil moisture is the main driver of SAR signal changes at the field scale. At this point, a change detection method is applied on Sentinel-1 VV band for estimating the soil moisture content with an inversion algorithm. The analyses are conducted at the field scale on an agricultural area for which soil moisture measurements are avaliable. The inversion algorithm is thus applied over 24 fields characterized by a quite strong correlation between co-polarized backscattering coefficient and in situ measurements. The quality of results will be influenced by the extent to which the assumptions of the retrieval method are fullfilled over the single field, and by the effectiveness of the DBSCAN algorithm in detecting the outliers.
The article is organized in the following sections: in Section 2 the study area is described, as well as the in situ and satellite datasets; Section 3 illustrates the preliminary analysis and the retrieval method used for the calculation of the superficial soil moisture; in Section 4 the results are reported and discussed; finally, in Section 5 the conclusions are drawn along with perspectives and future works.

2. Materials

2.1. Study Case

The study area is in central Spain, between the cities of Zamora, Valladolid and Salamanca (Figure 1). Here, a soil moisture monitoring network called REMEDHUS is operated by the Centro Hispano Luso de Investigaciones Agrarias (CIALE) of the University of Salamanca [21]. The REMEDHUS network is included in the International Soil Moisture Network (ISMN) [22], which is mainly focused on the distribution of harmonized and standardized data for the validation of remote sensing soil moisture products. Figure 1 shows the stations of the network providing data used for the present work. The extention of the area is 1285 km 2 and the main land use is agriculture. In particular, more than 80% of the area is covered by rainfed crops such as wheat and barley [21], and the remaining part by irrigated crops (corn), vineyards, forest and pastures [23]. The area is flat with maximum altitude differences of 200 m, and the soil is mainly composed of sand with a low content of organic matter. The climate of the region is continental semi-arid mediterranean, with an average annual temperature of 12 °C and a mean annual precipitation of 385 mm [24]. The study period covers the irrigation season from April to October of the years 2018–2021.

2.2. In Situ Data

2.2.1. Soil Moisture Measurements

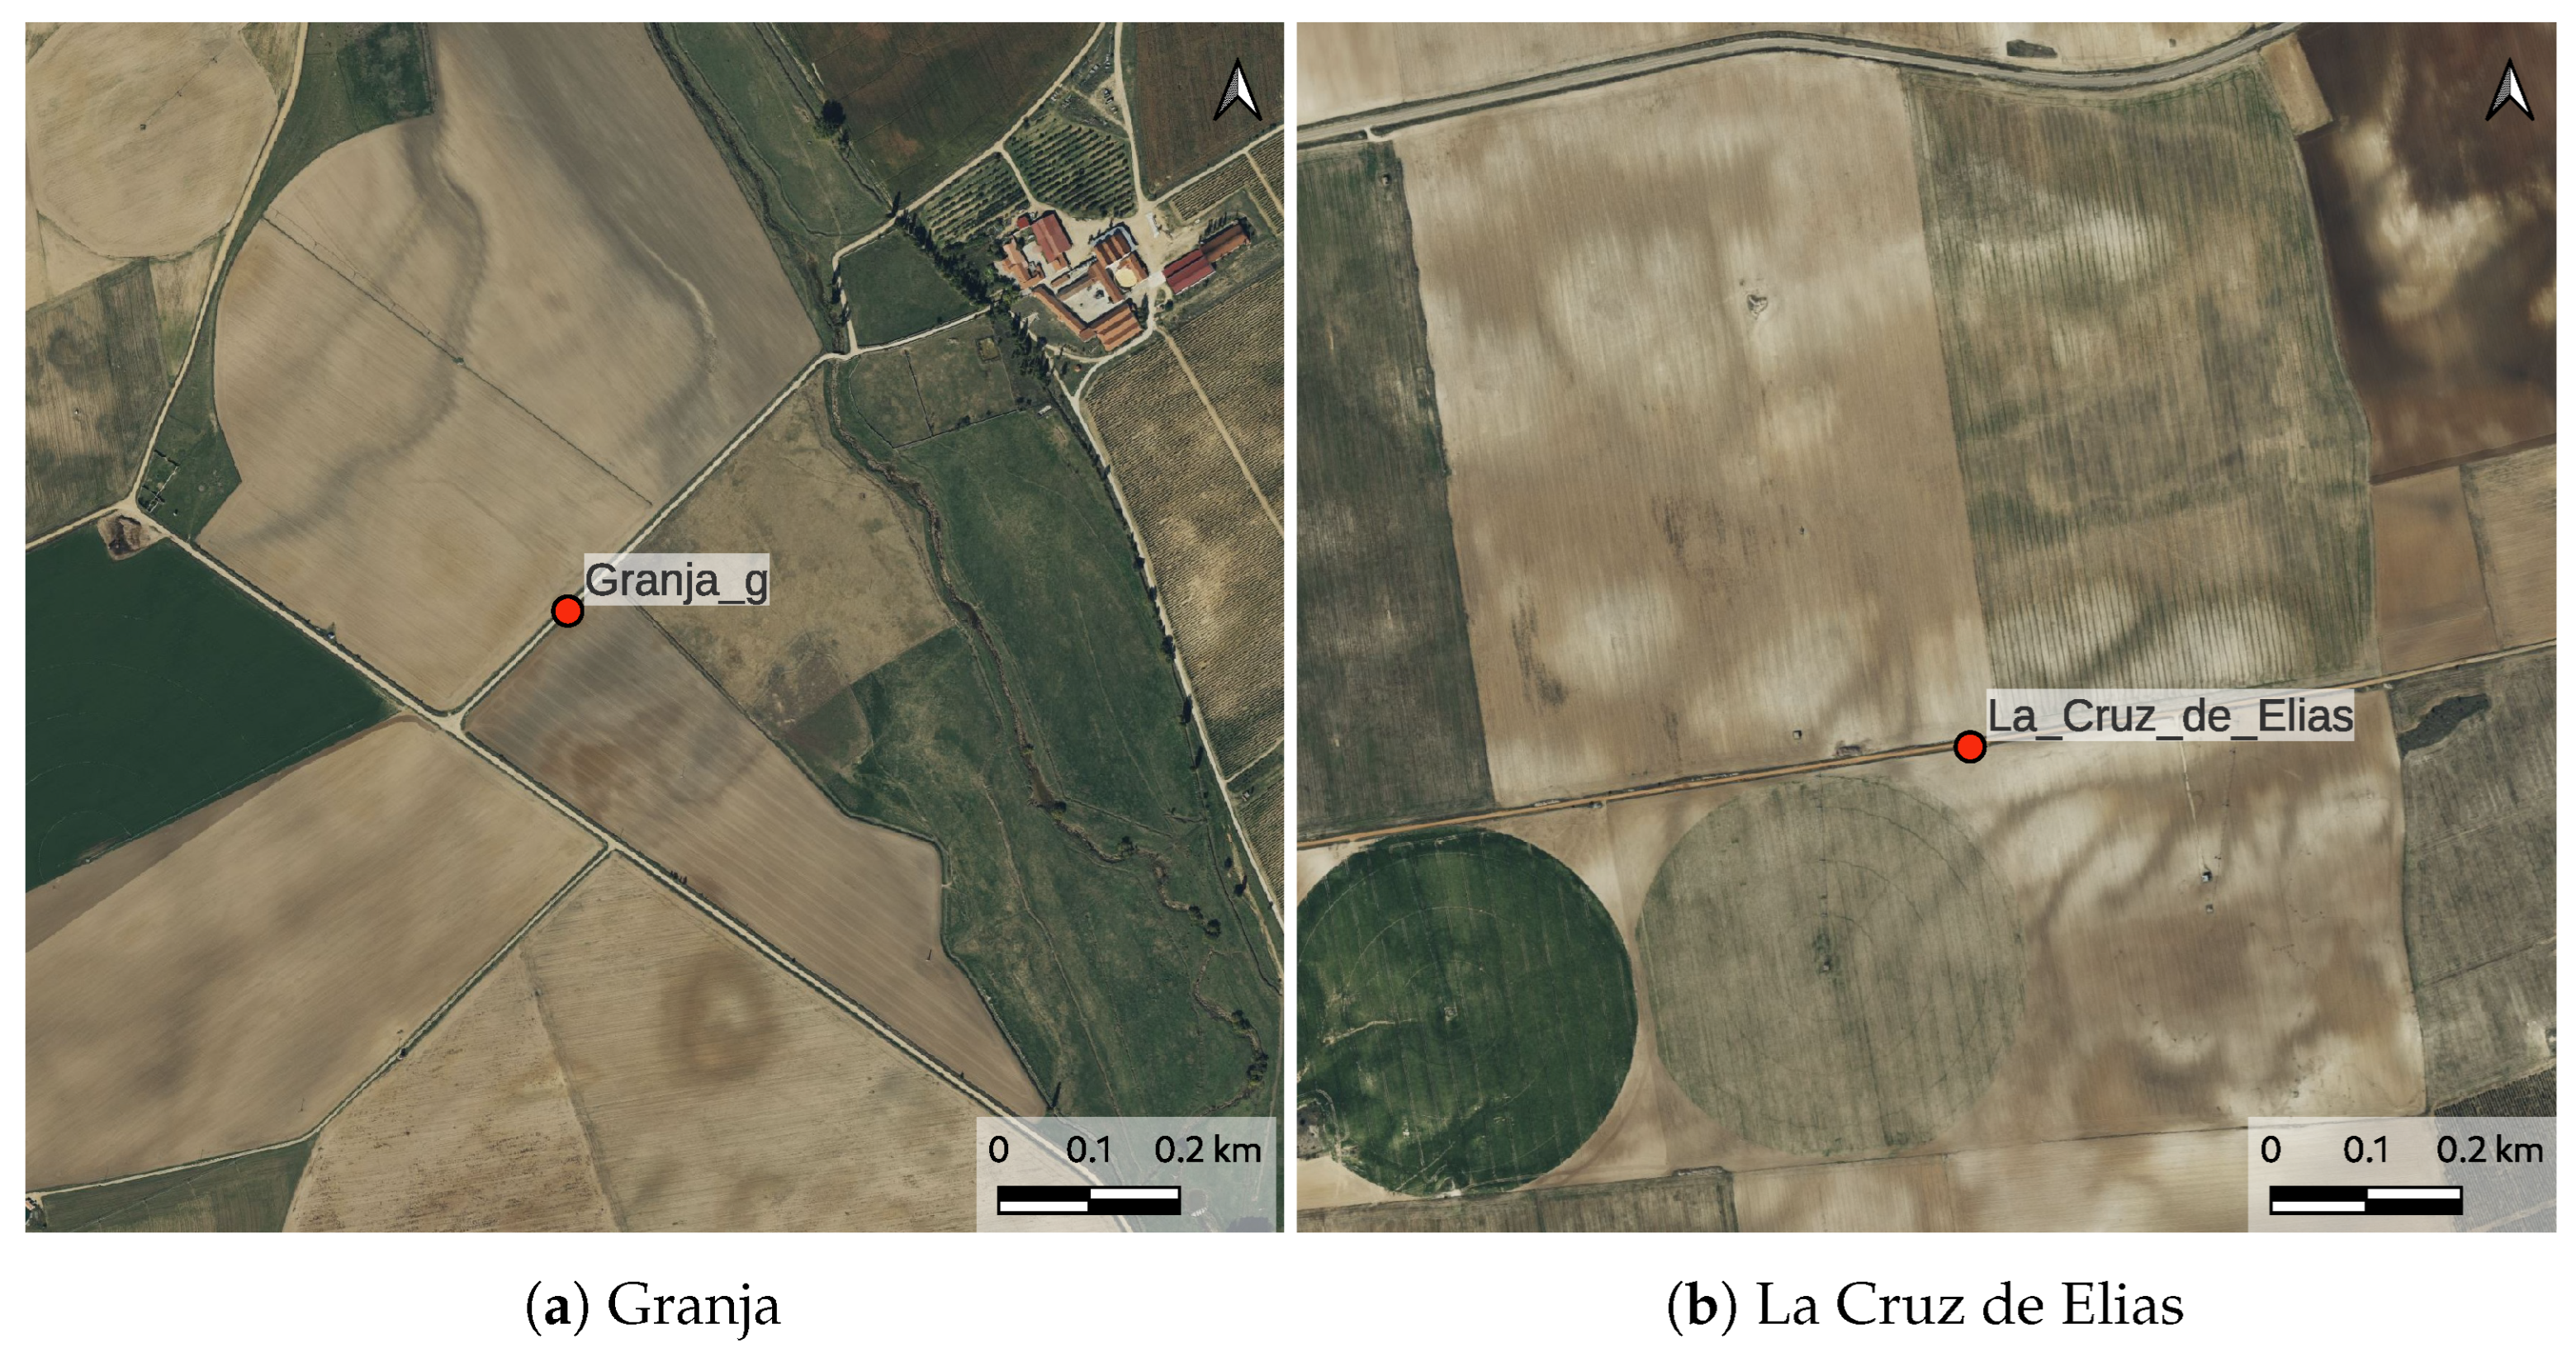
The REMEDHUS network provides hourly soil moisture measurements in m 3 /m 3 and it is operating since 2005 through the services of the ISMN. The network includes a total number of 24 stations, but only for 19 of them were data available for the study period covering the four irrigation seasons of 2018–2021. The distribution of the 19 stations within the study area is shown in Figure 1. The stations are not inside agricultural fields, but mostly at the boundaries of one or more fields, as can be seen for the stations of Granja and La Cruz de Elias in Figure 2. The superficial soil moisture ( S S M v ) is measured with capacitive sensors (Hydra Probes, Stevens Water Monitoring System, Inc., Portland, OR, USA) at a depth of 5 cm below the surface. Only the station of Ca nizal is classified as irrigated, and hence there measured soil moisture depends both on meteorological events and on irrigation [22]. Soil moisture data from every station are compared with the mean value of SAR satellite data over one or more fields around the measurement station.

2.2.2. Meteorological Data

Precipitation data from five meteorological stations within the study area were used to analize soil moisture time series. Four stations are included in the REMEDHUS network while the fifth is operated by the Spanish National Meteorological Agency (AEMET) [25].

2.3. Satellite Data

2.3.1. Sentinel-1 SAR Data

Sentinel-1 is a radar mission for Earth Observation developed by ESA within the Copernicus programme [14]. It is composed of two spacecrafts, Sentinel-1A (S1A) and Sentinel-1B (S1B), both equipped with a SAR system operating in C-band (3.75–7.5 cm). The two satellites were launched respectively in April 2014 (S1A) and April 2016 (S1B), and share the same orbit at a distance of 180°. The acquisition frequency of a single satellite on a scene with the same configuration is 12 days at the equator, resulting in a revisit time of 6 days. Unfortunately, since December 2021 Sentinel-1B is not operating anymore due to an anomaly.
In this work, images acquired in the Interferometric Wide-Swath (IW) mode were used. This operational mode is the mostly used over land and it is characterized by a swath width of 250 km. The dual polarization acquisitions (VV, VH) of the Level 1 Ground Range Detected High Resolution (GRD HR) product were used. The GRD products were preprocessed with Sentinel Application Toolbox (SNAP) [26] for obtaining maps of the backscattering coefficient γ 0 for both VV and VH bands at 20 m resolution. The sequence of preprocessing operations performed on the images was similar to the one suggested by Filipponi [27]. In particluar, the speckle noise removal was performed with the Refined Lee filter [28] and the radiometric and geometric correction were computed using the Digital Terrain Model at 5 m resolution provided by the spanish Autonomous National Centre of Geographic Information [29]. Since the analyses were performed at field scale, the mean values of γ 0 in both polarizations were computed for all the fields of interest. A series of 139 Sentinel-1 images of the irrigation seasons from 2018 to 2021 was downloaded from the Copernicus Open Access Hub website [30]. The main features of these products are summarized in Table 1.

2.3.2. Sentinel-2 Optical Data

Sentinel-2 is a mission developed by ESA within the Copernicus programme [31] providing optical observations of the Earth. The mission is composed of two identical satellites Sentinel-2A (S2A) launched in June 2015, and Sentinel-2B (S2B) launched in March 2017. The spacecrafts are equipped with a Multi Spectral Instrument (MSI) acquiring 13 bands in the subranges of visible, near infrared (NIR) and short wave infrared (SWIR) at different resolutions (10 m, 20 m, 60 m) over a swath of 290 km. S2A and S2B share the same orbit with a delay of 180° and provide a revisit time of 6 days at the equator.
Level 2A Bottom Of Atmosphere (BOA) products were used, in particular the True Color Image (TCI) at 10 m of resolution. The images were downloaded from the Copernicus Open Access Hub website and preprocessed using the Geographical Resources Analysis Support System (GRASS) GIS Software 8.2.1 [32]. Since the TCI were used as a reference for digitalizing the fields, only 4 images for every irrigation season were used, for a total of 16 images.

3. Method

3.1. Preliminary Analysis for Field Selection

As shown in the previous Section, the measurement stations of the REMEDHUS network are not inside agricultural fields but at their boundaries (Figure 2). Moreover, the data provider does not supply information on associated reference field along with the coordinates of the measurement stations. Hence, as in the present work the analyses are conducted at field scale, it was necessary to properly couple single agricultural fields with the respective measurement stations. To this purpose the agricultural fields on whose boundaries the measurement stations lie were digitalized. Sentinel-2 images for all the four years under analysis were used as reference for identifying the shape of the fields. In order to select the most appropriate fields for estimating superficial soil moisture, the co-polarized band of Sentinel-1 was analyzed, on the ground of its sensitivity to soil water content. Specifically, the relationship between the mean value of the co-polarized backscattering coefficient γ 0 V V over the field and the measured soil moisture of the reference station was studied, by plotting γ 0 V V as a function of the measured soil moisture. In order to take into account and recognize the influence of precipitation on the SAR signal, data in correspondence of precipitation events were highlighted in the graphs. The relationship was studied for every digitalized field and separately for every year of the study period, in order to not mix the influence of different crops cultivated on the same field during different irrigation seasons.
Only fields characterized by a clear relationship between co-polarized data and measured soil moisture (absolute value of correlation coefficient | r | > 0.5 ) were selected, as illustrated in details in Section 4. Among the selected fields, two main trends emerged from the data distributions in the S S M v γ 0 V V plane. These two distributions are clearly characterized by either a positive or a negative slope, as will be shown in Section 4. According to the scientific literature about soil moisture estimation from radar data, positive relationship is the expected one. Ulaby [33] stated indeed that the superficial radar response increases with soil moisture, since in wet soil conditions the reflection coefficient is higher than in dry conditions, thus causing an increase in the intensity of the backscattering coefficient. On the other hand, inverse relationships between SAR signal and soil moisture were also found in literature, in particular on areas characterized by arid enviroments [34] such as in the study area of the present work. The causes of this behavior are still under study: Baghdadi et al. [35] first suggested that it could be casued by variations in soil roughness contribution on the total backscatter. More recently it was explained as a volumetric contribution [36] attributable to subsurface backscattering [37]. Given the high values of correlation between SAR co-polarized signal and measured soil moisture on the selected agricultural fields showing both positive and negative correlation, here soil moisture is estimated on fields showing both behaviors.

3.2. Superficial Soil Moisture Estimation

On the selected fields, the mean superficial soil moisture is retrieved using an inversion algorithm. Co-polarized SAR signal differences are inverted assuming that the temporal differences of γ 0 V V and real soil moisture are linked by the relationship shown in Equation (1). Specifically, the differences in the numerators of Equation (1) are between the current epoch t and the driest epoch of the study period, while the differences appearing in the denumerators represent the maximum variation within the study period.
Δ S S M v ( t ) Δ S S M v ( m a x ) = Δ γ 0 V V ( t ) Δ γ 0 V V ( m a x )
The differences of SAR signal (right hand side of Equation (1)) are calculated with a Change Detection method, illustrated in the next subsection.

3.2.1. Change Dectection Method

The total backscattering coefficient of a scene with vegetation canopies can be modelled as the incoherent sum of three components [38], as below reported:
γ 0 , t o t a l V V = γ 0 , v e g + L 2 γ 0 , s o i l + γ 0 , v e g + s o i l
Here, γ 0 , v e g , γ 0 , s o i l and γ 0 , v e g + s o i l represent respectively the volumetric scattering of the vegetation, the attenuated scattering contribution of the superficial layer of the soil (in which L 2 is the attenuation coefficient) and the contribution of the interaction between the vegetation and the soil surface. The latter contribution is significant only in the cross-polarized band (i.e., the VH band for Sentinel-1) [39,40], and since here the soil moisture is estimated from the co-polarized VV band, for the present purposes this contribution can be neglected. The soil component γ 0 , s o i l of Equation (2) is influenced by both soil roughness and moisture, while the vegetation component γ 0 , v e g depends on moisture content of the canopy and on canopy geometry. Given the multiple dependencies of the total backscattered signal from various features of the Earth Surface, the identification of the soil moisture contribution is challenging because all the other components need to be properly addressed.
In this study, no in situ data were available for modelling the contributions of vegetation and surface roughness on the total backscattering coefficient. For this reason, it was assumed that over a field it is possible to neglect the effects of smooth changes in vegetation condition and soil roughness on the total backscattered signal with respect to the variations caused by changes in the soil moisture content. However, vegetation and soil roughess can suddenly change over an agricultural field due to agricultural practises such as harvesting and tillaging. Those activities can cause abrupt variations of the total SAR signal, which values can be considered as outliers in the time series of the backscattering coefficient in both polarizations. Given that, sharp changes in vegetation and soil roughness are here considered as anomalies that can be detected in a 3D space of differences of SAR features, as suggested by Zhu et al. [20]. For dual-pol C-band SAR images, they proposed using the three following features, namely γ V V , γ V H , γ V V / γ V H , which were selected by optimizing the feature space for detecting both vegetation and roughness changes due to agricultural practises. SAR data acquired during rainy days up to the day after precipitation events were excluded from this analysis, because the increase of intensity of the SAR signal due to precipitation would have influenced the anomaly detection. This procedure was applied over every single field using averaged values and separately for every year, for not eventually mixing the contributions of different crops cultivated on the same field over the four irrigation seasons of the study period.
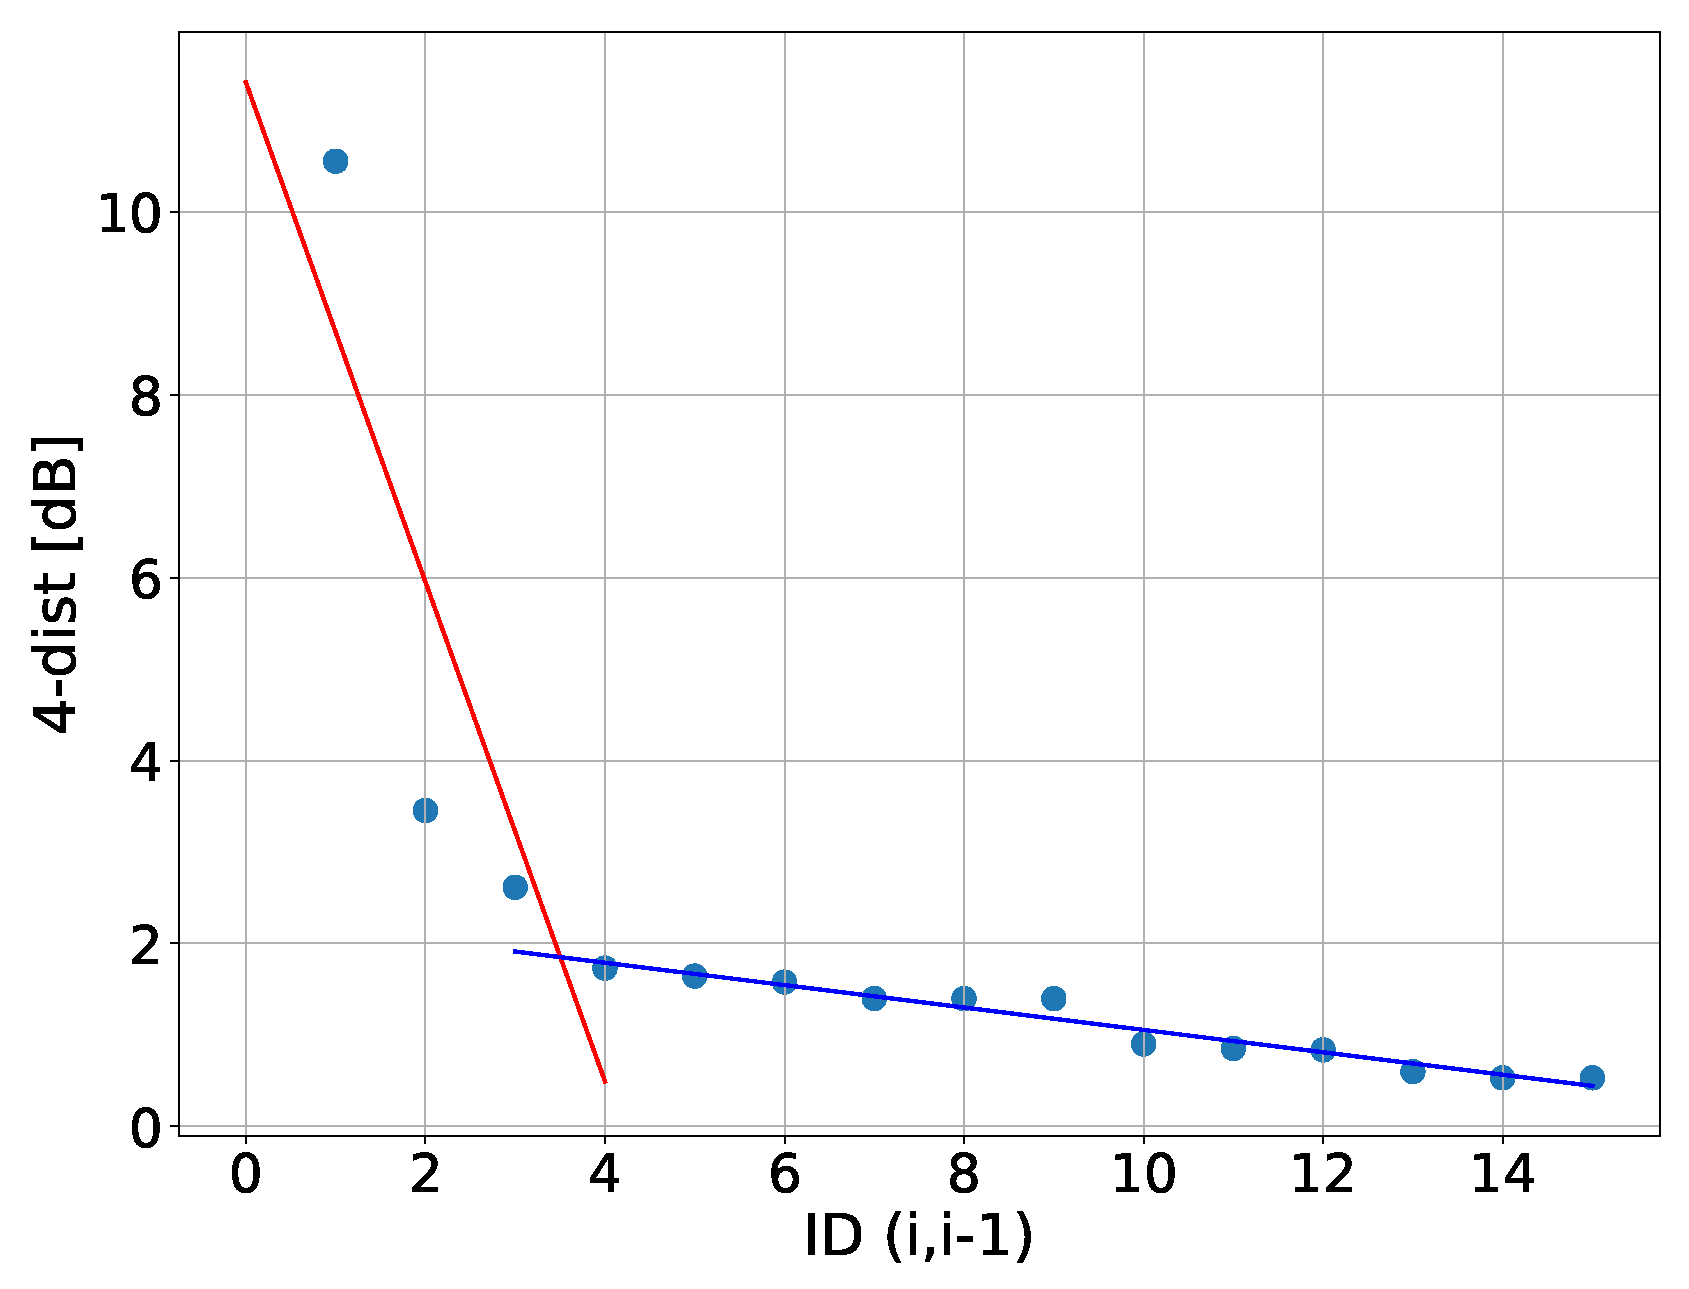
At first, the differences of the features between dates with interepoch equal to one and two were extracted, and are indicated respectively with d f ( i , i 1 ) and d f ( i , i 2 ) . Then, the DBSCAN (Density-Based Spatial Clustering of Applications with Noise) [41] algorithm was applied to both the multi-temporal differences of the features with interepoch one and two. This algorithm identifies clusters of data on the basis of the spatial density of the points in a multi-dimension space. Specifically, for every point p of a cluster C, there is a point q contained in the same cluster ( q C ) for which p is inside a given radius E p s in the multi-dimension space. This condition could be written as p N E p s ( q ) , where N E p s ( q ) = { p C | d i s t ( q , p ) E p s } are the points in the neighborhood of q spaced less than E p s . At the same time, the following state | N E p s ( q ) | M i n P t s should be valid, meaning that the neighbohorood of q should contain at least M i n P t s points. If there are some points which do not belong to any cluster, the algorithm classifies them as noise. In this work, we are interested only in detecting the points of the 3D space (in which each point represents an interepoch) classified as noise by the algorithm: the values assumed by the differences of the features classified as “noise” are indeed isolated from to the values assumed by all the other differences of features in the 3D space. The parameters of the algorithm were selected according to Ester et al. [41]. Specifically, the minimum number of points MinPts of which a cluster must be composed was set equal to 4, as well as the parameter k, as suggested by Ester et al. [41] for 2D datasets. Since the dataset used in this work is 3D, some tests with MinPts > 4 were carried out, but it emerged that the results were not significantly different from the ones obtained with MinPts = 4. It was also necessary to set the k-dist parameter which defines the radius E p s inside which the MinPts are counted for defining a cluster. Its value was extracted by using the sorted k-dist graph, of which an example is reported for field 6 during 2020 in Figure 3. On the y-axis of the graph, the distances of each point in the 3D space from the fourth (k = 4) nearest point are reported, while on the x-axis the ID of the feature differencies with interepoch one are shown. For every field under analysis, the value of k-dist was obtained at the instersection between the two straight lines modelling the two trends of the data distribution on the plane ID/k-dist. As can be seen in Figure 3, which is representative of the entire sample of analyzed data, the blue line interpolates the points characterized by low values of k-dist, while the red line interpolates the points which are more distant between each other in the feature space. The latter points will be classified as noise, i.e., not belonging to any cluster. The k-dist parameter was selected by using only feature differences with interepoch one, while the algorithm was applied also to differences of interepoch equal to two days, as hereafter illustrated.
The output of interest produced from the application of the DBSCAN algorithm is the classification of the interepochs ( i , i 1 ), ( i , i 2 ) as noise. Once that the epoch ( i 1 ) is classified as noise, it is excluded from the dataset only when the interepoch ( i , i 2 ) is not, to ensure that the detected anomaly represents a sudden variation of the SAR response. After all these operations, it can be said that the time series of the co-polarized data fulfills the assumptions of smooth changes in vegetation and roughness conditions, and a CD method can be applied.
The variation of the total backscattered signal Δ γ 0 V V ( t ) of Equation (1) is calculated as the difference between the backscattering coefficient at the epoch t and the backscattering coefficient at the driest epoch, as reported in Equation (3).
Δ γ 0 ( t ) = γ 0 ( t ) γ 0 ( t d r y )
The maximum differences of backscattering coefficient are instead estimated as the difference between the wettest and driest signal, as reported in Equation (4).
Δ γ 0 ( m a x ) = γ 0 ( t w e t ) γ 0 ( t d r y )
Depending on the relationship between the VV backscattering coefficient and the measured soil moisture at the field scale, the driest SAR signal appearing in Equations (3) and (4) assumes the value of the minimum and the maximum values of the time series, respectively over fields characterized by direct and inverse relationship. Namely, when the correlation is direct the driest signal is supposed to be the minimum value of γ 0 , t o t a l V V , while when an inverse correlation is detected the driest value is assumed to be the maximum SAR signal within the study period.

3.2.2. Inversion Algorithm

By isolating the value of the soil moisture at the epoch t from Equation (1), the soil moisture at field scale can be estimated by means of the following Equation:
S S M v ( t ) = Δ γ 0 ( t ) Δ γ 0 ( m a x ) Δ S S M v m a x + S S M v m i n
Since the analyses were performed on every field on a single irrigation season, only 35 images for every year were available. Given this low number of data, in the present work it was decided to present a calibration study, whose results are reported in the next Section. Moreover, a sensitivity analysis on the in situ parameters of the retrieval algorithm was performed. Specifically, for every field and year for which satisfactory results were obtained, the retrieval method was re-applied by varying the in situ parameters S S M v m i n and S S M v m a x of ±10%.
Elaboration and analysis of spatial data were performed with the GRASS GIS software 8.2.1, while the change detection method, DBSCAN algorihtm, inversion algorithm and sensitivity analysis were performed by means of python libraries.

4. Results and Discussion

4.1. Field Selection

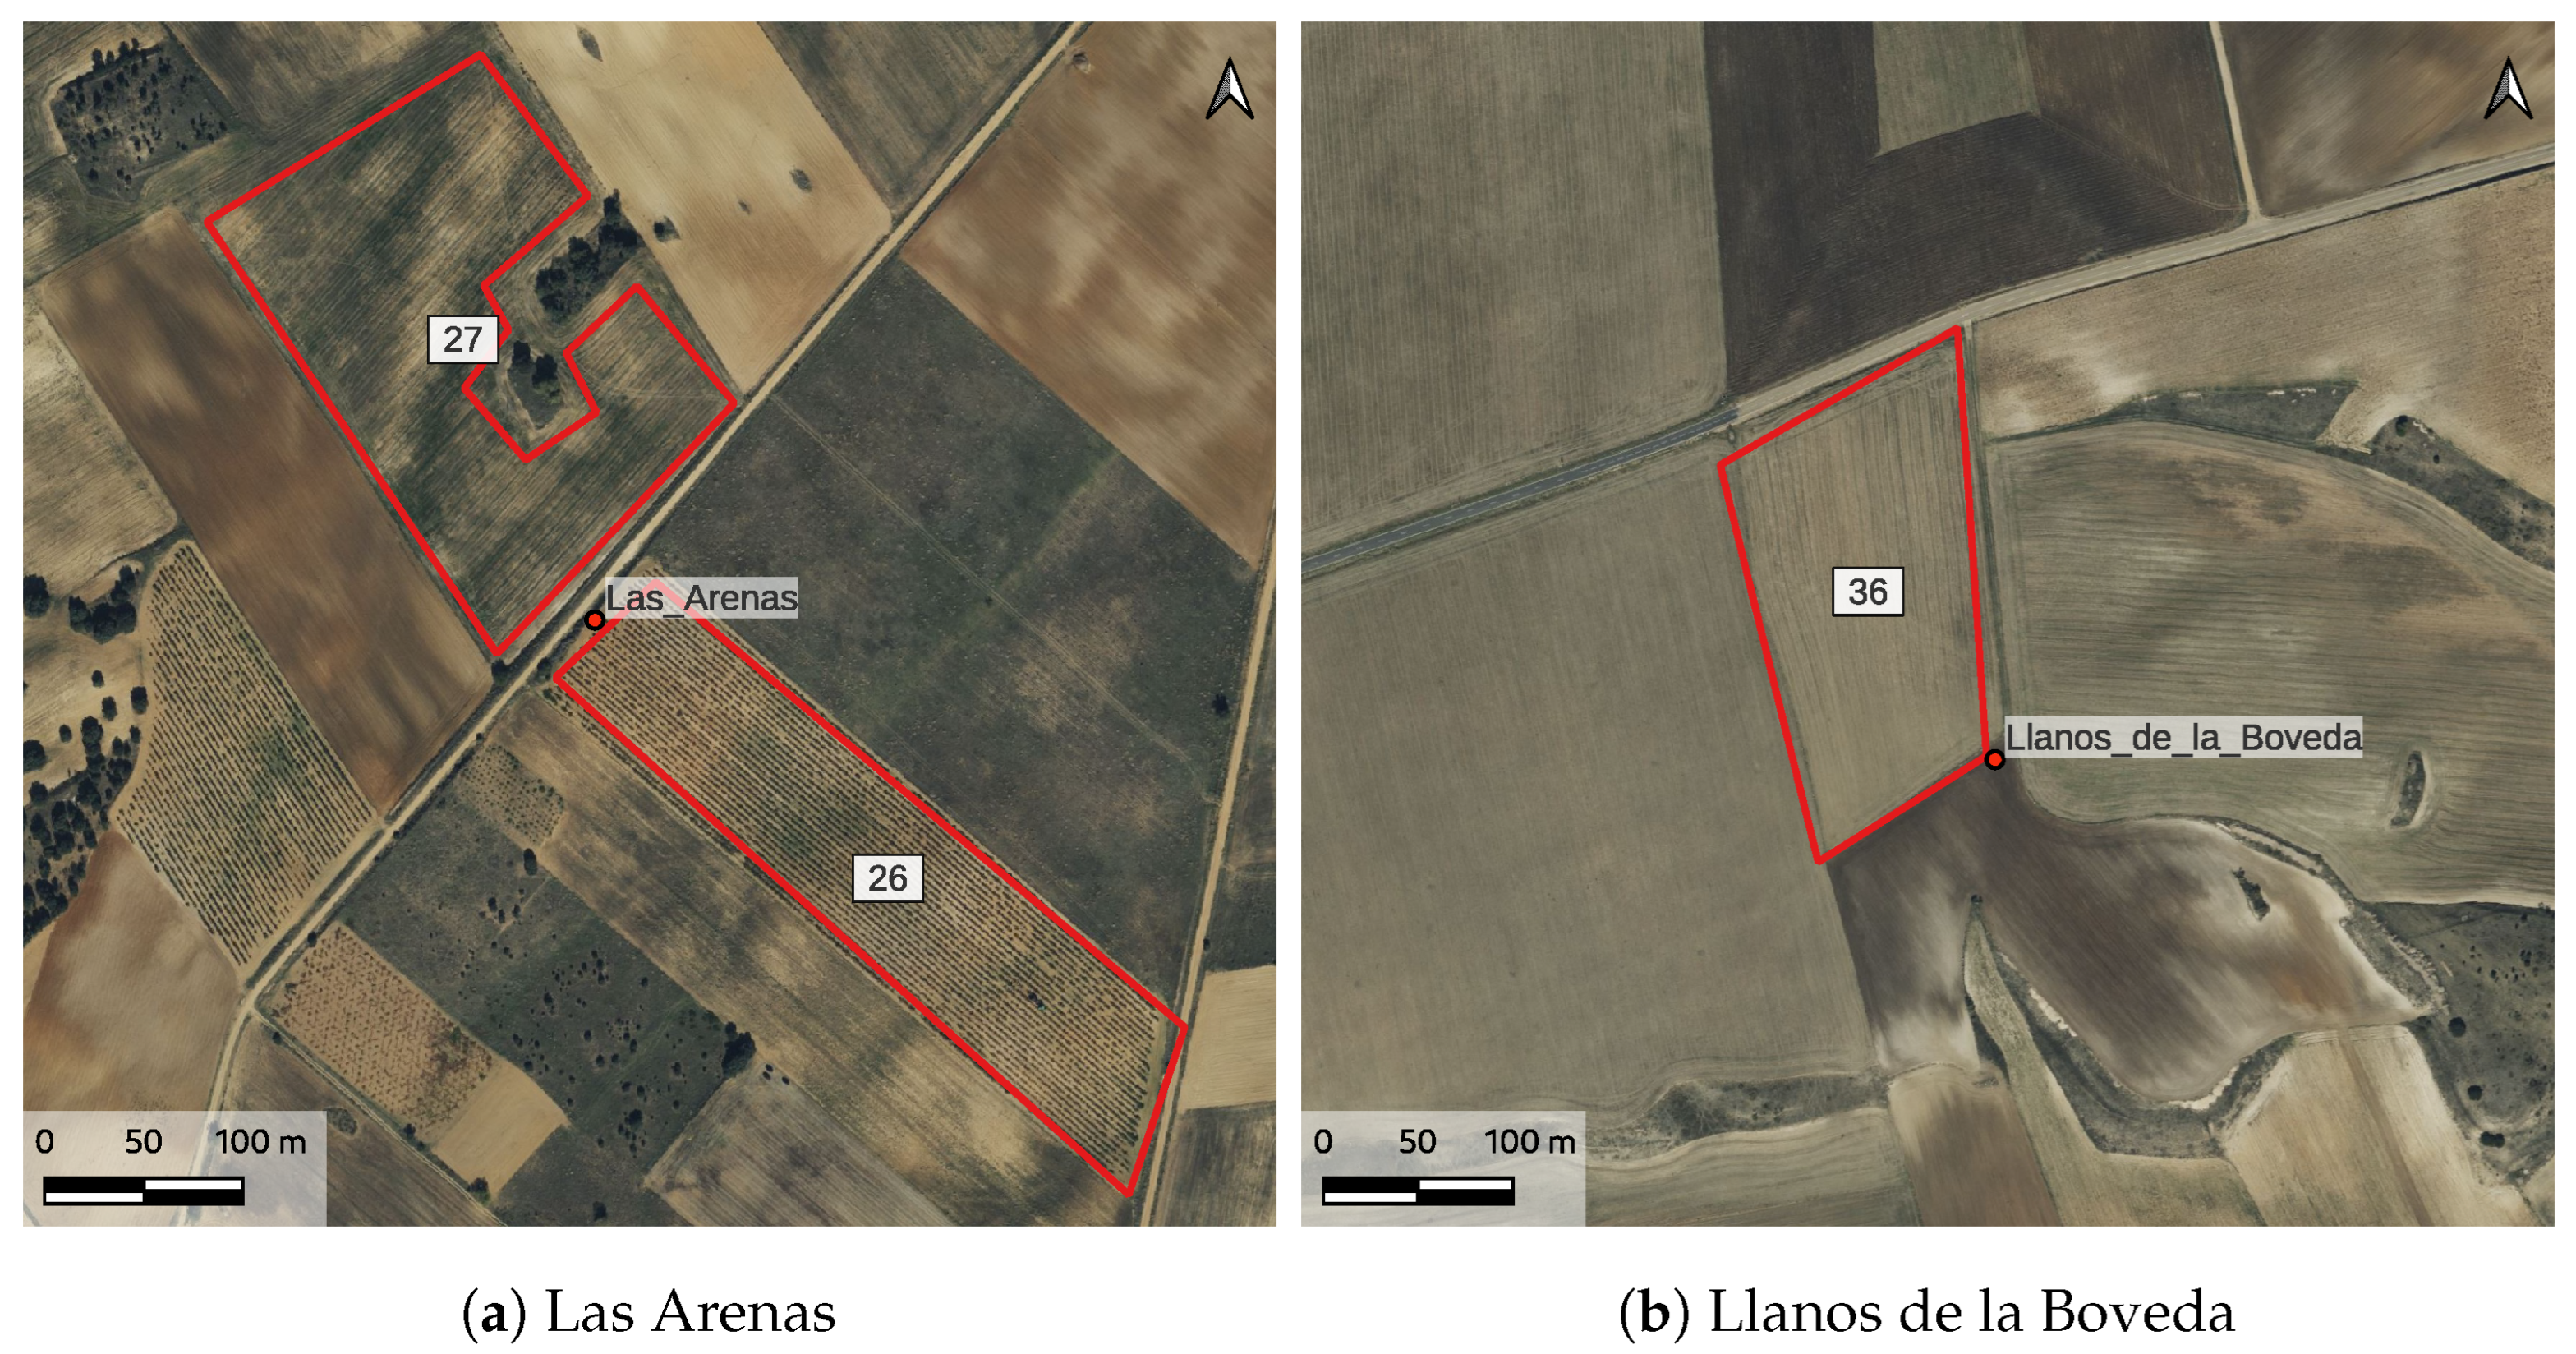
For every measurement station, one or more fields were digitalized by using optical images of all the 4 irrigation seasons under study. While doing that, it was noted that the shape of some fields changed during the study period upon agricultural season. For this reason, only the fields more stable in time were analyzed. Moreover, since the measurement stations are often at the border of the agricultural fields (see Figure 2), and the precision of their coordinates is not known, for almost every station more than one field was digitalized and analyzed. Figure 4 shows two examples of digitalized fields for two stations, namely Las Arenas (Figure 4a), where two fields were digitalized, and Llanos de la Boveda (Figure 4b) where only one field was digitalized.
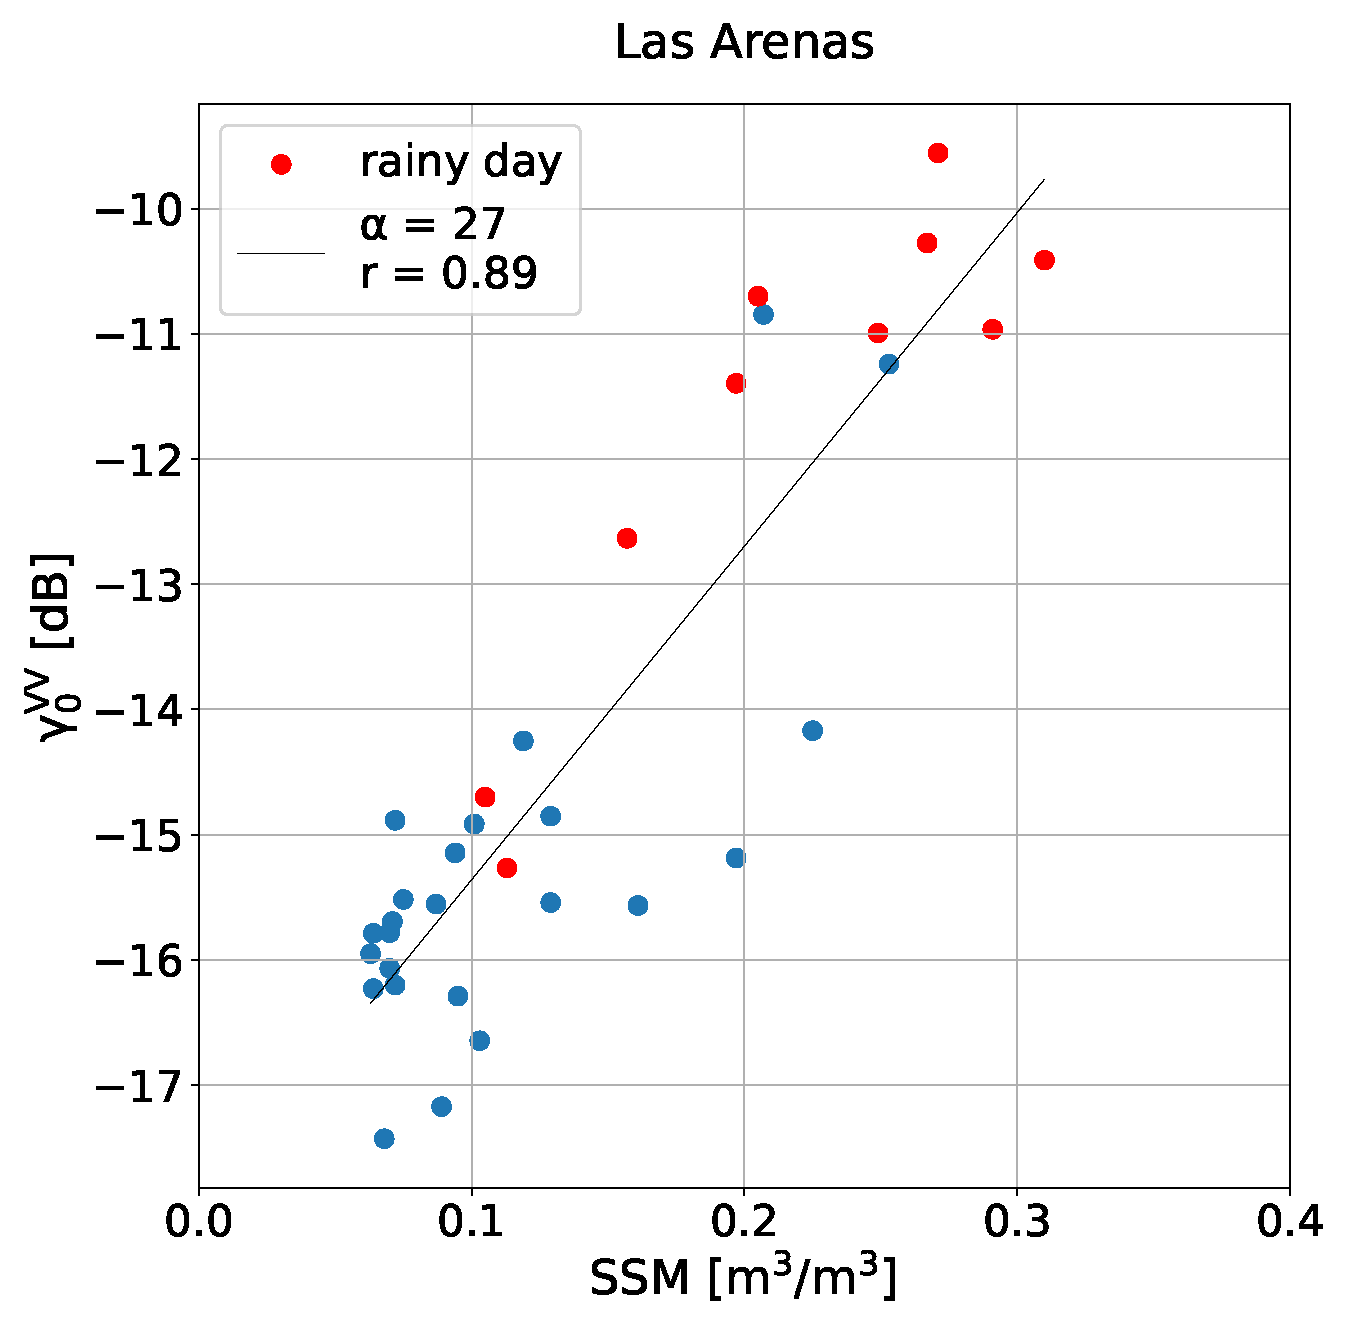
From the preliminary analysis, 24 pairs of fields and years were selected out of a total number of 118 analyzed pairs. The selected fields are listed in Table 2, along with their reference station, crop classification according to the ISMN data and selected year of analysis. Those fields are characterized by a correlation coefficient between the co-polarized backscattering coefficient and the measured soil moisture whose absolute value is equal to or bigger than 0.5, and whose sign is reported in the γ 0 V V / S S M v column of Table 2. Indeed, as previously described in Section 3, not only strong direct relations between γ 0 V V and S S M v were found in the selected fields, but also strong inverse ones, as previously detected on arid climate areas also by other authors [34,37]. Figure 5 and Figure 6 show representative examples of these data distributions. In the graphs, each point corresponds to a date: the red points indicate precipitation events in the current day or in the previous one. Highlighting the precipitation events in those graphs was fundamental for detecting the inverse relationships, as will be shown hereafter.
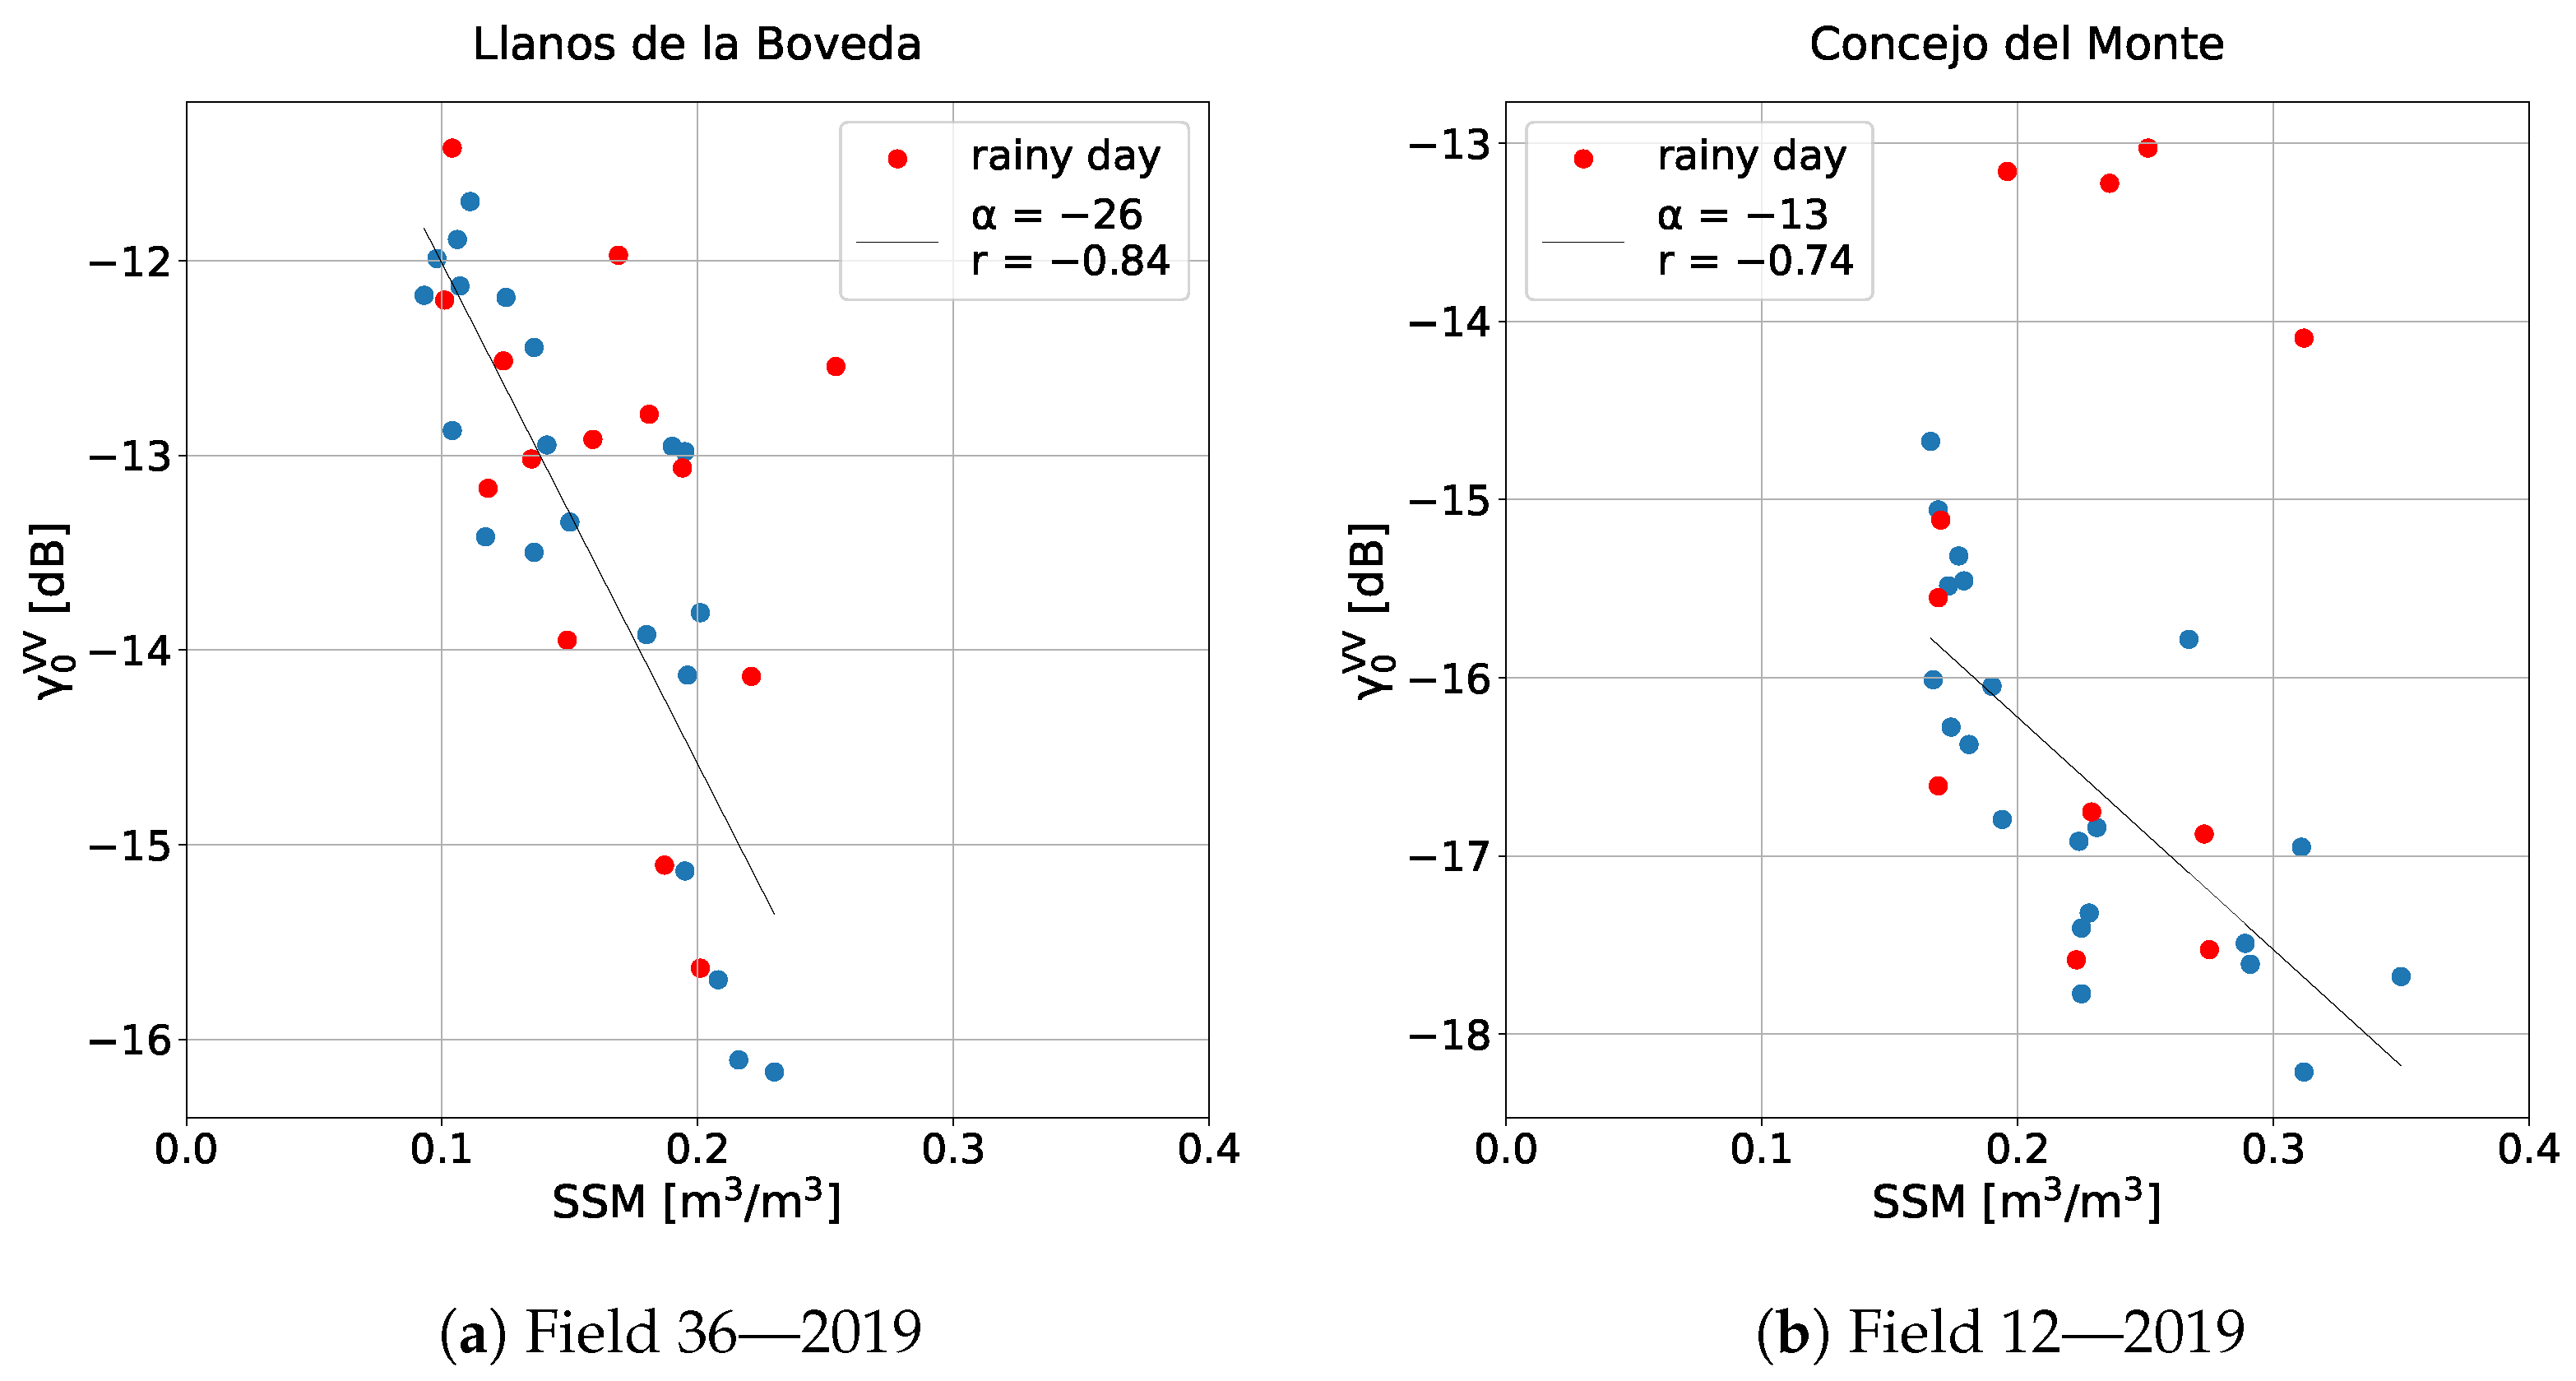
Figure 5 shows the direct relationship over the field 27 associated to the station of Las Arenas for 2018. As it can be observed in the plot, the precipitation events are especially associated with higher values of both γ 0 V V and S S M v , but they are distributed also on lower values of soil moisture in the sample. A similar distribution of the rainy days can be observed in the graph referred to field 36 during 2019 (station of Llanos de la Boveda), reported in Figure 6a. Over this field, the relationship between the backscattering coefficient and the measured soil moisture is inverse. In Figure 6b it is reported another example of inverse distribution for the field 12 associated to the station of Concejo del Monte in 2019. Differently from the other fields, over field 12 it is possible to note that some of the dates associated with the precipitation events and high values of γ 0 V V are isolated compared to most of the points. These points can thus be considered as outliers. Since other “inverse” fields of the analyzed dataset presented outliers associated with precipitation events, similarly to field 12, consistently it was decided to exclude from the analyses the data associated with precipitation events over fields with inverse relationship.
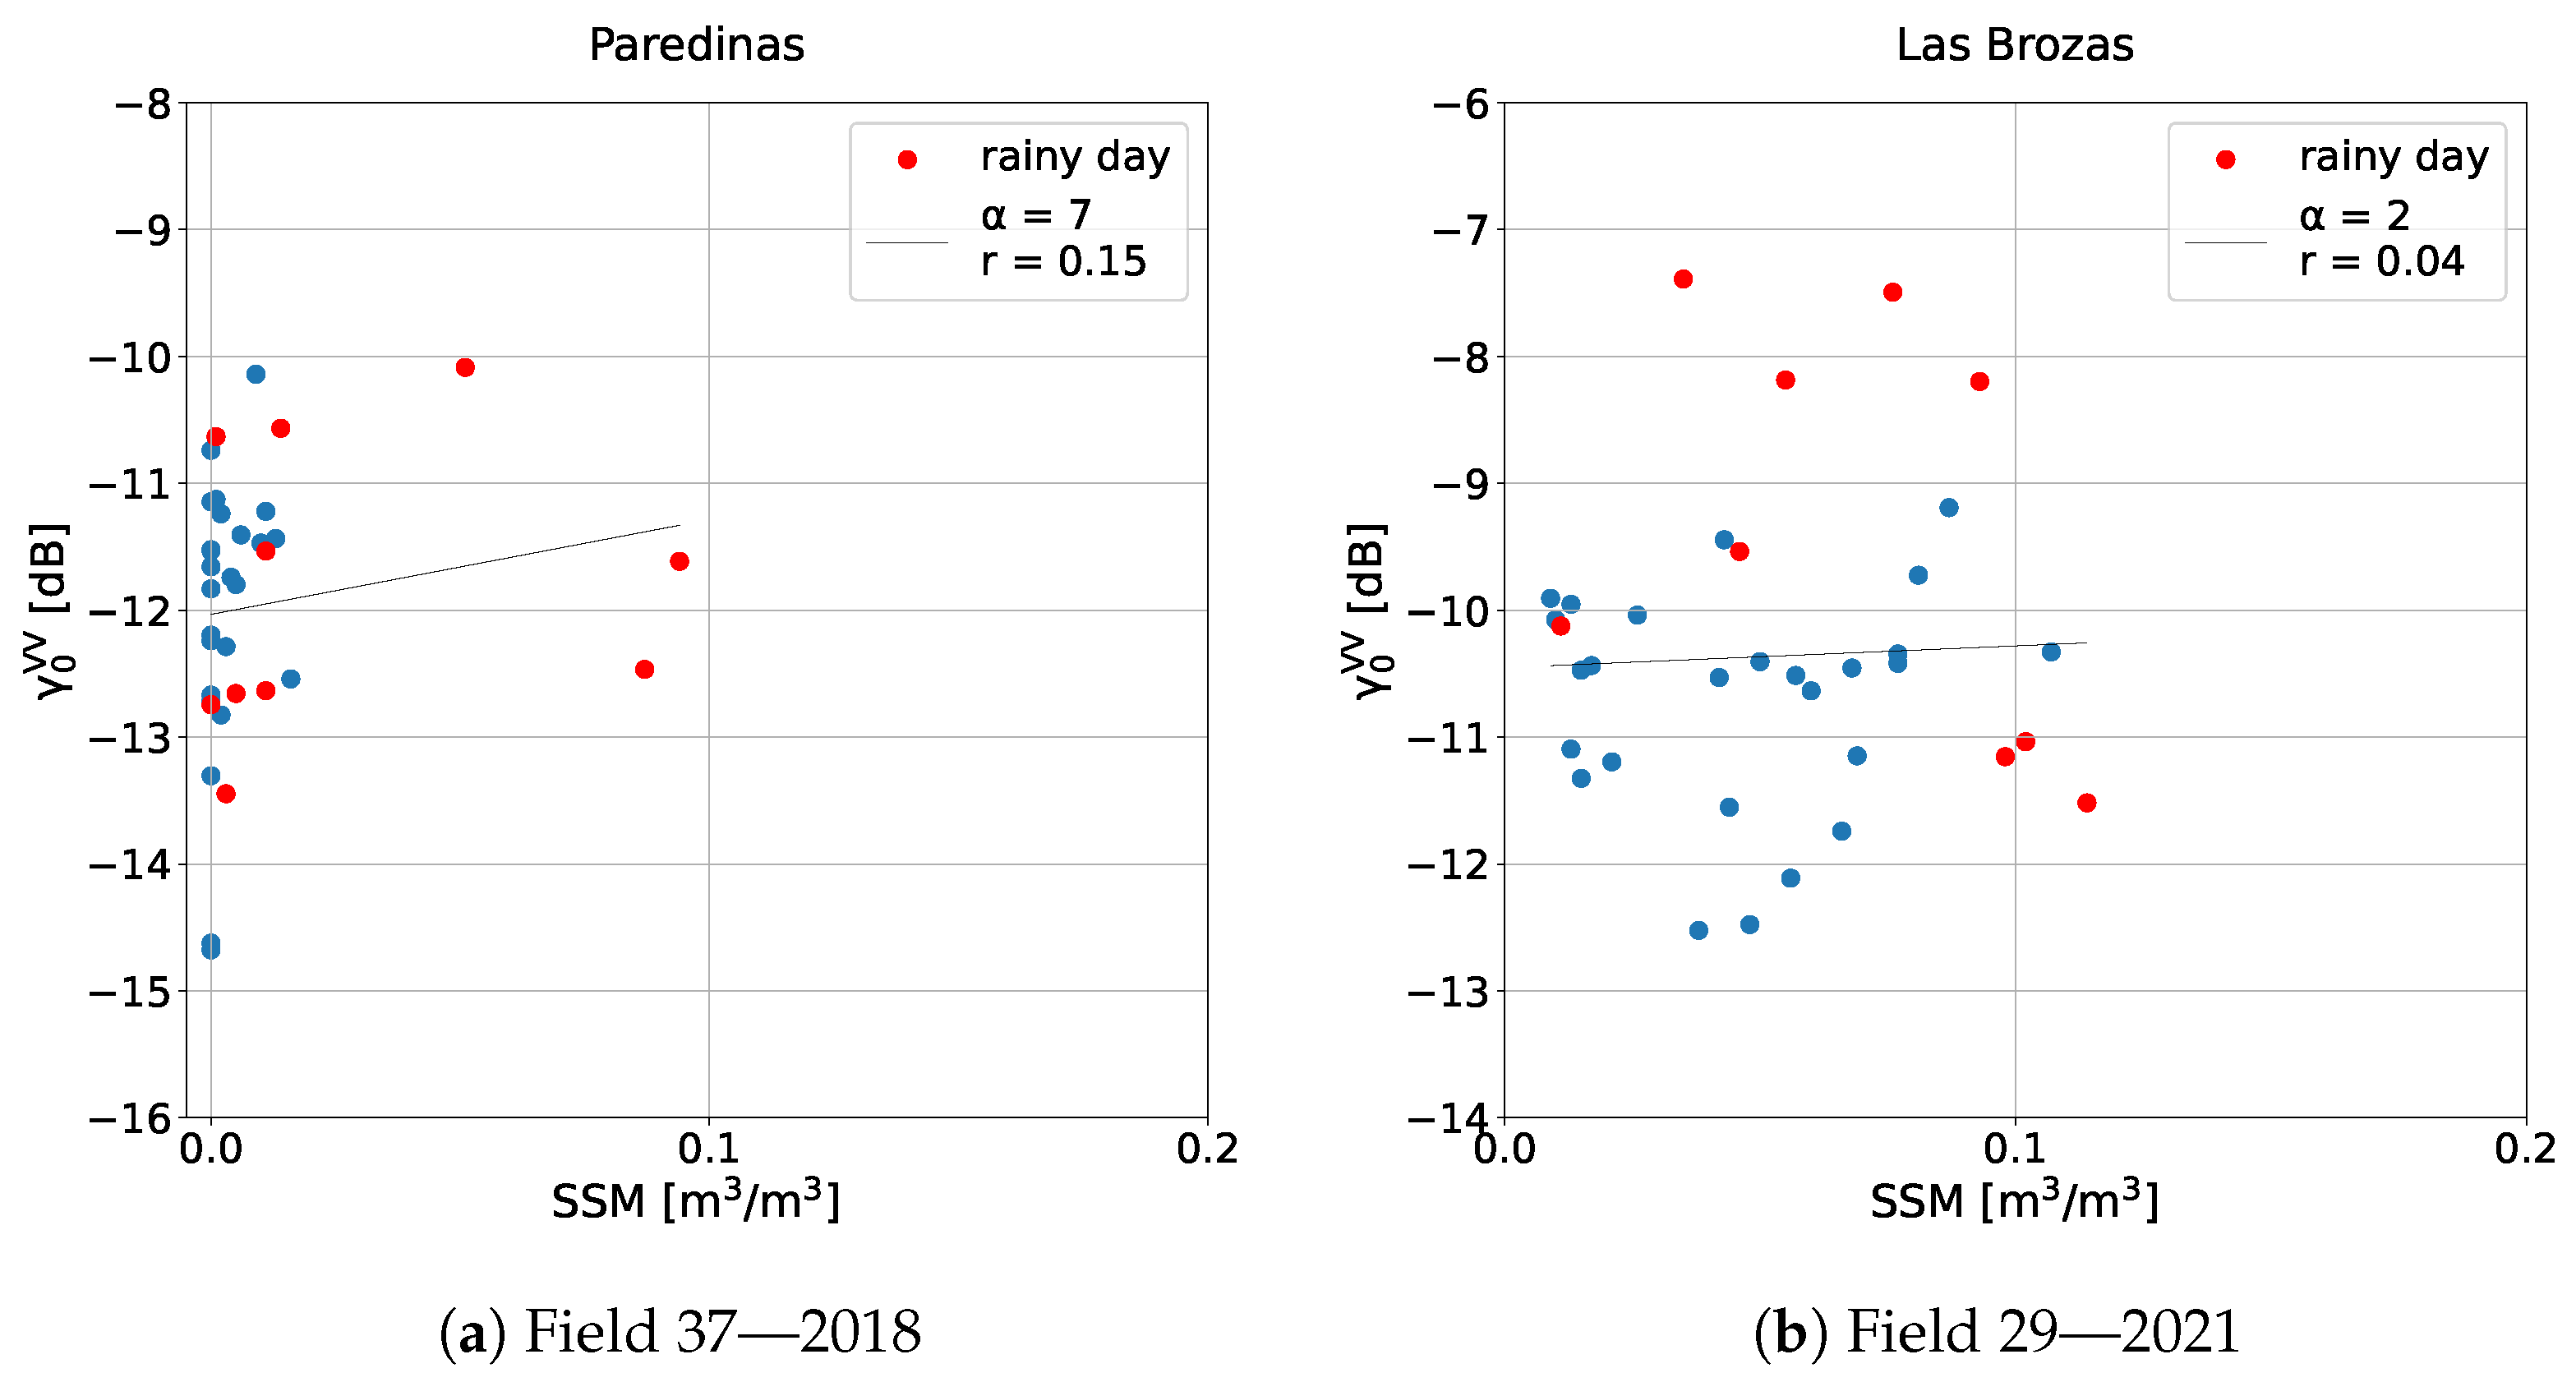
Among the data distribution of the discarded pairs of fields and years, the one reported in Figure 7a referring to the field 37 of the station of Paredinas for the year 2018 emerged. Here, values assumed by the co-polarized backscattering coefficient have a wider variation in respect to the real soil moisture, remaining instead almost constant between very low values ranging from 0 to 0.02 m 3 /m 3 . This behaviour was detected also by other authors in arid environments [34], and it may be related to superficial scattering due to soil roughness or to volumetric subsurface scattering. Among the analyzed distributions, also apparently random distributions were found, such as the one reported in Figure 7b referring to the field 29 of the station of Las Brozas for the year 2021. The fields presenting distributions such as the ones showed in Figure 7 were not considered for further analyses.

4.2. Superficial Soil Moisture

This subsection shows at first an example of the application of the DBSCAN algorithm for detecting dates associated with sudden changes in SAR signal. Then, the results of the field specific estimation of soil moisture are reported and discussed for both fields characterized by direct and inverse relationship between co-polarized backscattering coefficient and in situ soil moisture. Finally, the results of the sensitivity analysis on the in situ parameters of the inversion algorithm are presented.
Figure 8 shows an example of application of the DBSCAN analysis on the differences of the SAR features over field 6 (station of Carretoro) for the year 2020. For visualization purposes, results are shown in a 2D plane of the features Δ γ 0 V V and Δ γ 0 V H , but the algorithm was applied in a 3D features space as illustrated in Section 3. Violet dots represent data classified as belonging to a cluster, while green dots, which are farther from the main cloud of points, are classified by the algorithm as noise.
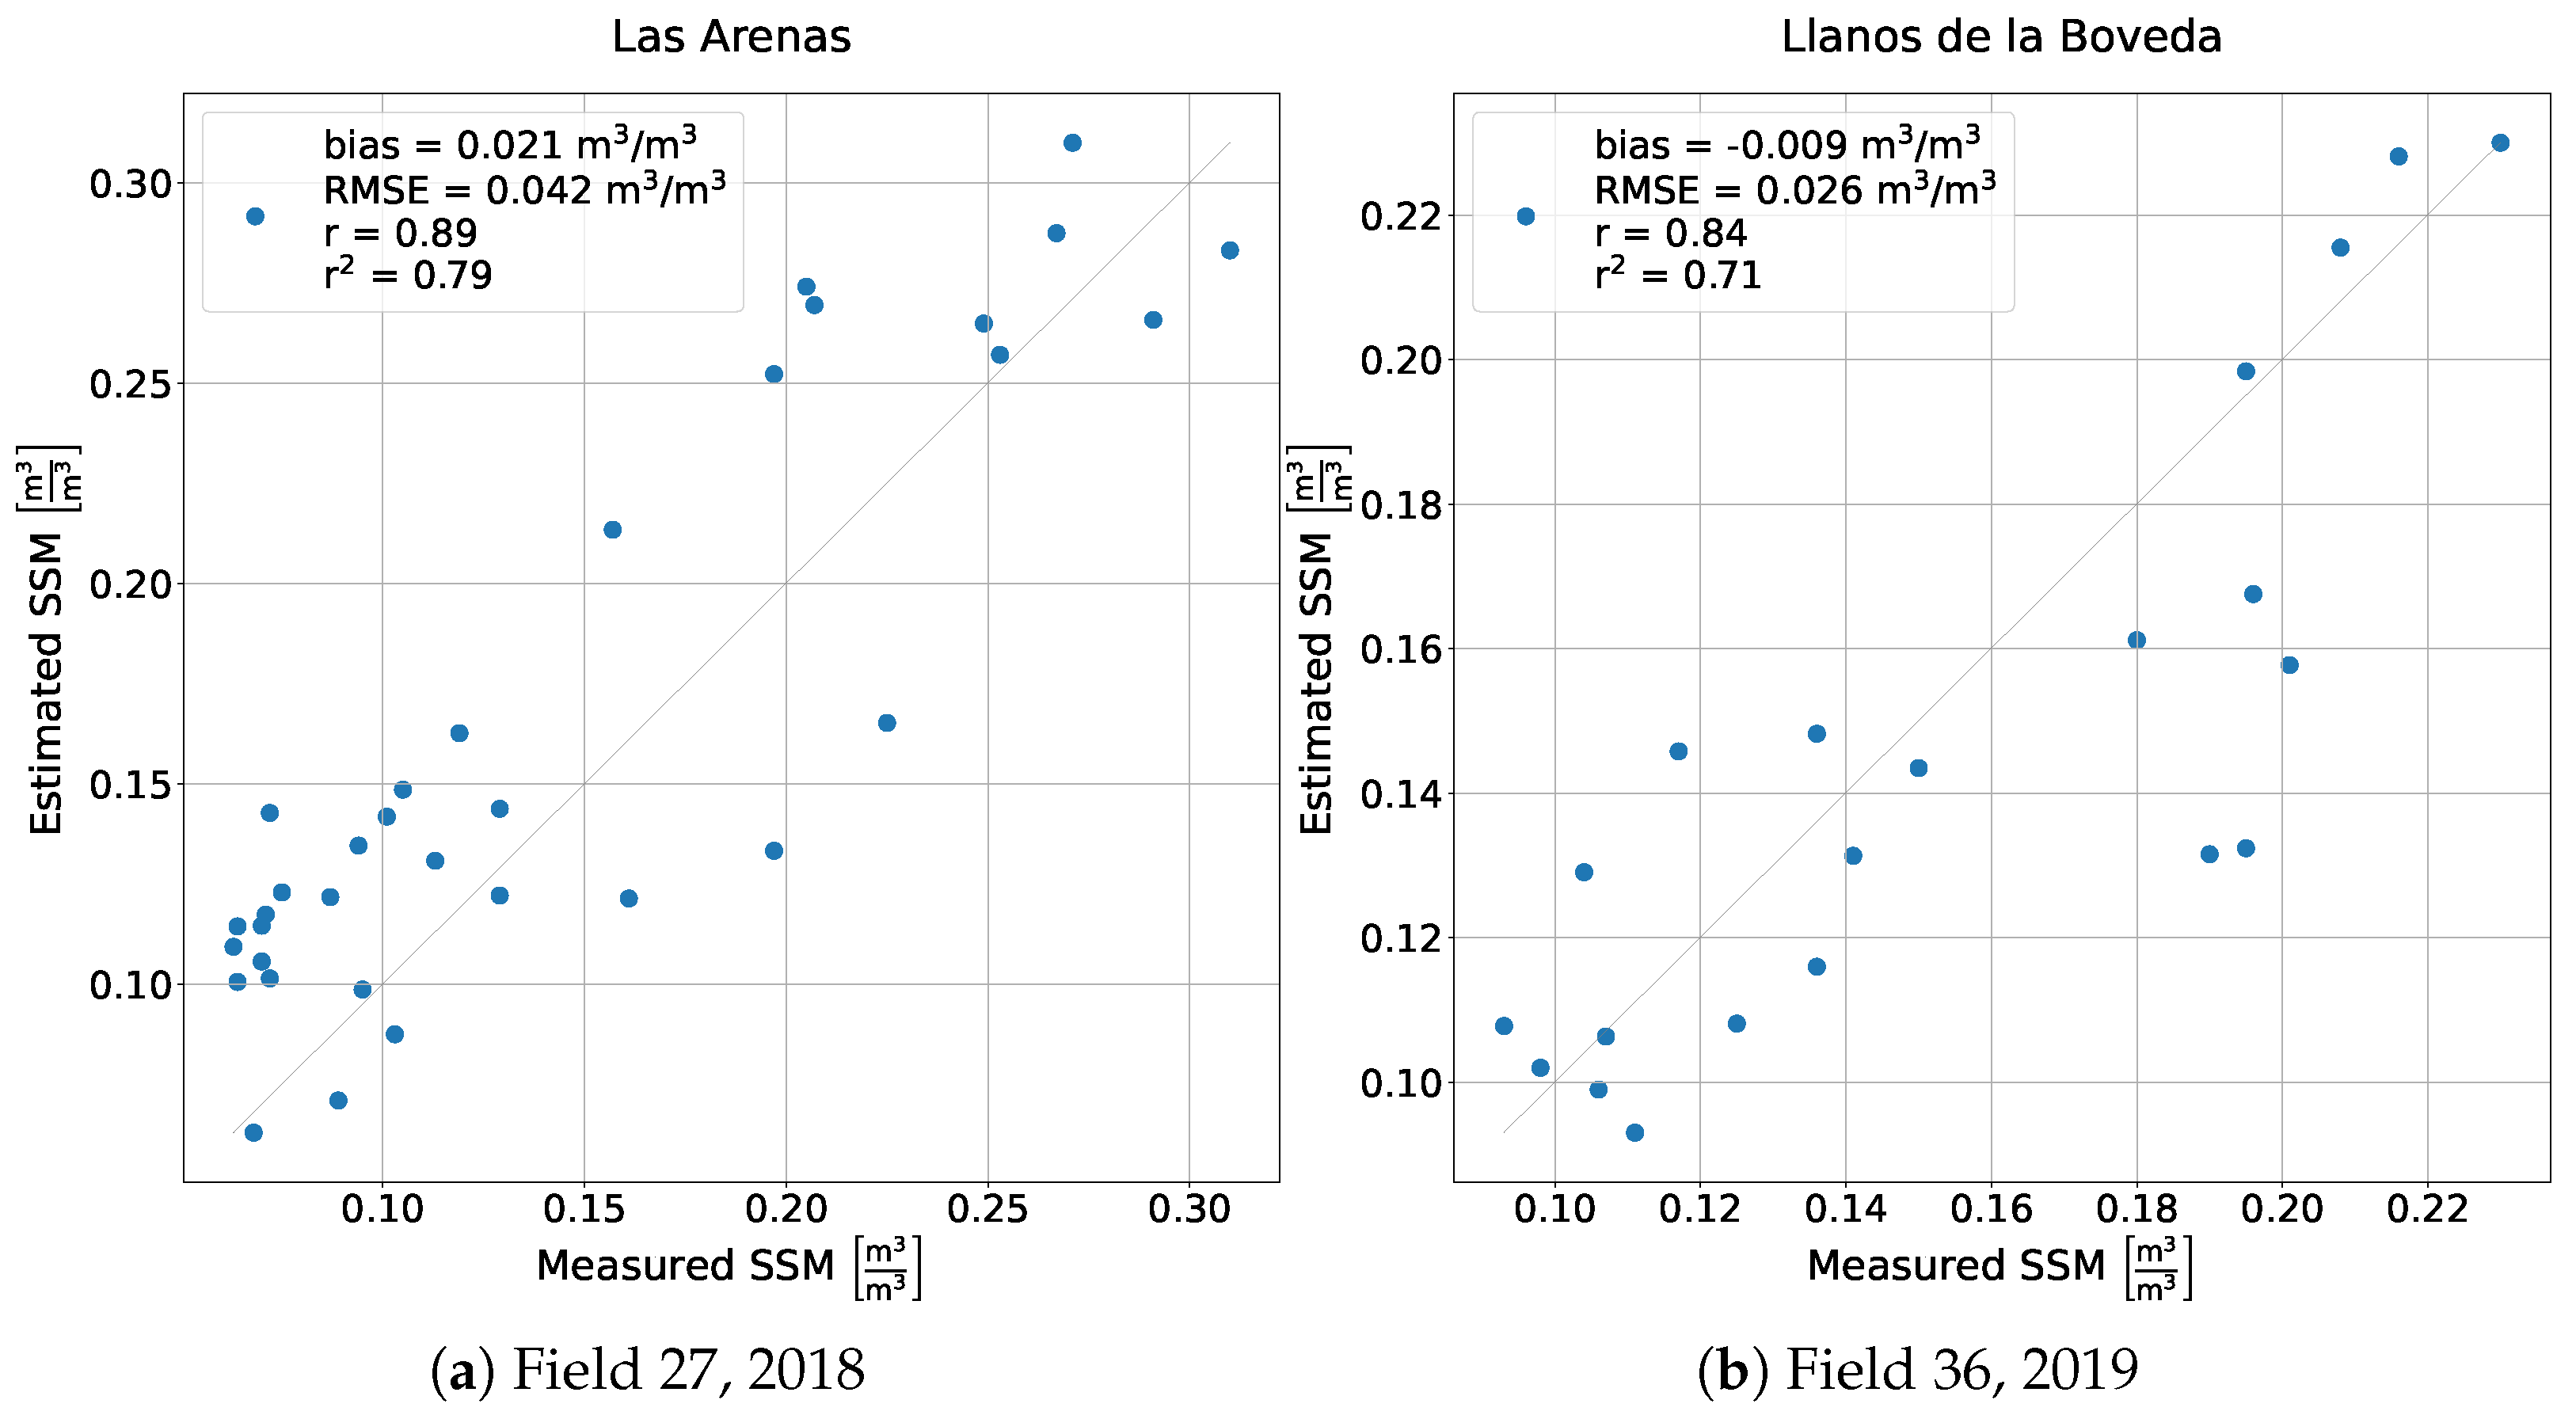
Table 2 reports the results of the estimated soil moisture in terms of statistical metrics for every paired field and year selected in the preliminary analysis. The metrics reported are: bias, root mean square error (RMSE), correlation coefficient (r) and coefficient of determination ( r 2 ). The values of the correlation coefficient are always equal or greater than 0.5, hence the retrieval method performs quite good. In general, the bias ranges from 0 m 3 /m 3 for the field 41 in 2018 to 0.060 m 3 /m 3 for the same field in 2020, the RMSE from 0.007 m 3 /m 3 for the field 6 in 2020 to 0.082 m 3 /m 3 for the field 41 in 2019. r and r 2 vary instead respectively from 0.50 and 0.25 over the field 6 in 2018 to 0.89 and 0.79 over the field 27 in 2018. These results are in line with what presented by other authors working on agricultural areas at the field scale over arid environments, such as Ouaadi et al. [42] and Hachani et al. [43]. Moreover, particularly good results were obtained over 8 pairs of field and year highlighted in bold in Table 2: their coefficient of determination assumes indeed values equal to or greater than 0.5. Notice that the relationship between γ 0 V V and S S M v over these 8 fields is both direct and inverse, as can be checked in the column γ 0 V V / S S M v of the Table. Moreover, good results are achieved on fields which are characterized either by low (0–0.1 m 3 /m 3 ) and high (0.1–0.4 m 3 /m 3 ) soil moisture values.
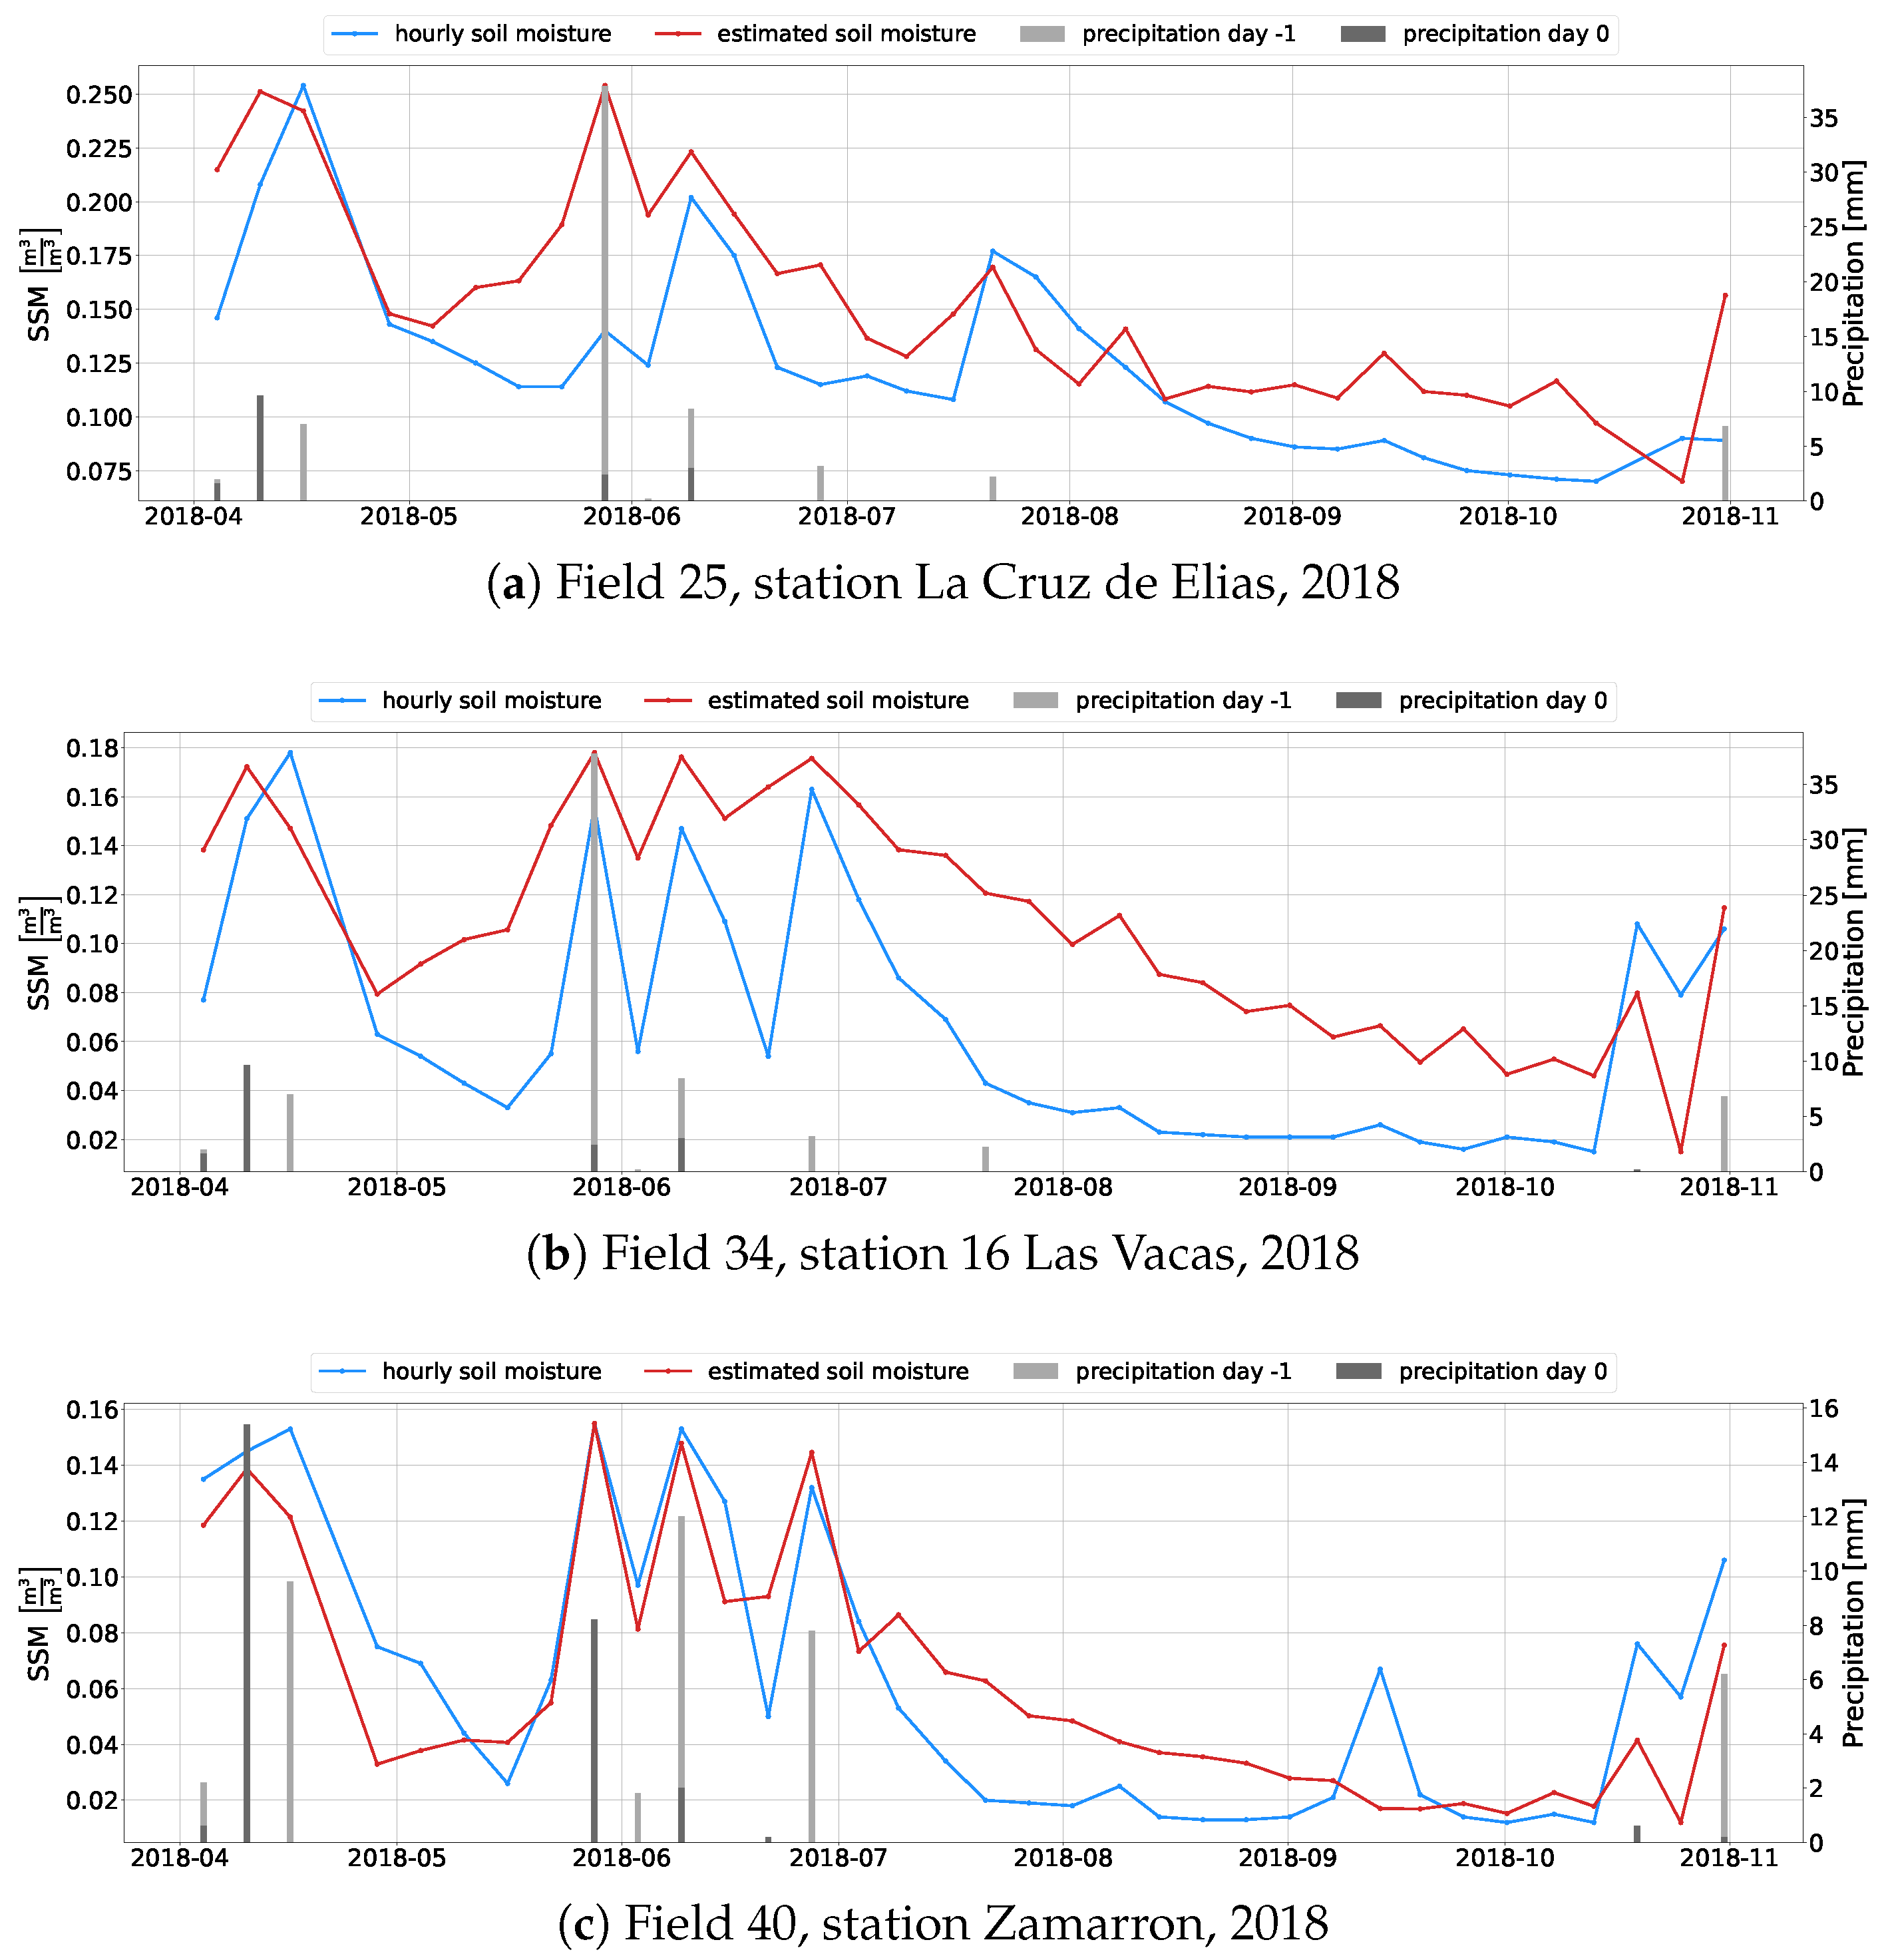
Time series of real and estimated soil moisture are reported in Figure 9 for the two fields characterized by the highest coefficients of determination. These two fields also representative of the two main behaviours of the dataset in terms of direct and inverse relationship between co-polarized backscattering coefficient and measured soil moisture. In the graphs the measured soil moisture is in light blue and the estimated soil moisture is red. Grey and light grey bars represent instead the precipitation, of the current and of the previous day respectively.
Figure 9a shows the time series referred to the field 27 of Las Arenas station for the year 2018, which is characterized by positive γ 0 V V / S S M v slope. In this case, the precipitation were included in the dataset for the soil moisture estimation, and the estimated solution, reported in red in the graph, exhibits peaks in correspondence of precipitation events, also when no real soil moisture peak is present, such as for the last precipitation event of May 2018. The soil moisture estimated with the proposed method is therefore able to fit the trend of the measured soil moisture, particularly in the first part of the agricultural season until August 2018, where different peaks are present, as well as from the second half of October on. From August to October, the solution is not as smooth as the in situ soil moisture.
Over the field 36 instead, in correspondence of the station of Llanos de la Boveda for 2019, the precipitation days were excluded from the dataset as explained above. This field is indeed characterized by inverse relationship between co-polarized SAR data and measured soil moisture, and its time series are reported in Figure 9b. Also for this field, there is a very good agreement between the estimated and the measured superficial soil moisture. The estimated solution presents two peaks that are not present in the real soil moisture between June and July 2019, and this can may be due to some not modelled factor influencing the SAR signal. These variations may be caused by some agricultural practises or to the evolution of the canopy, since over this field wheat or barley is cultivated.
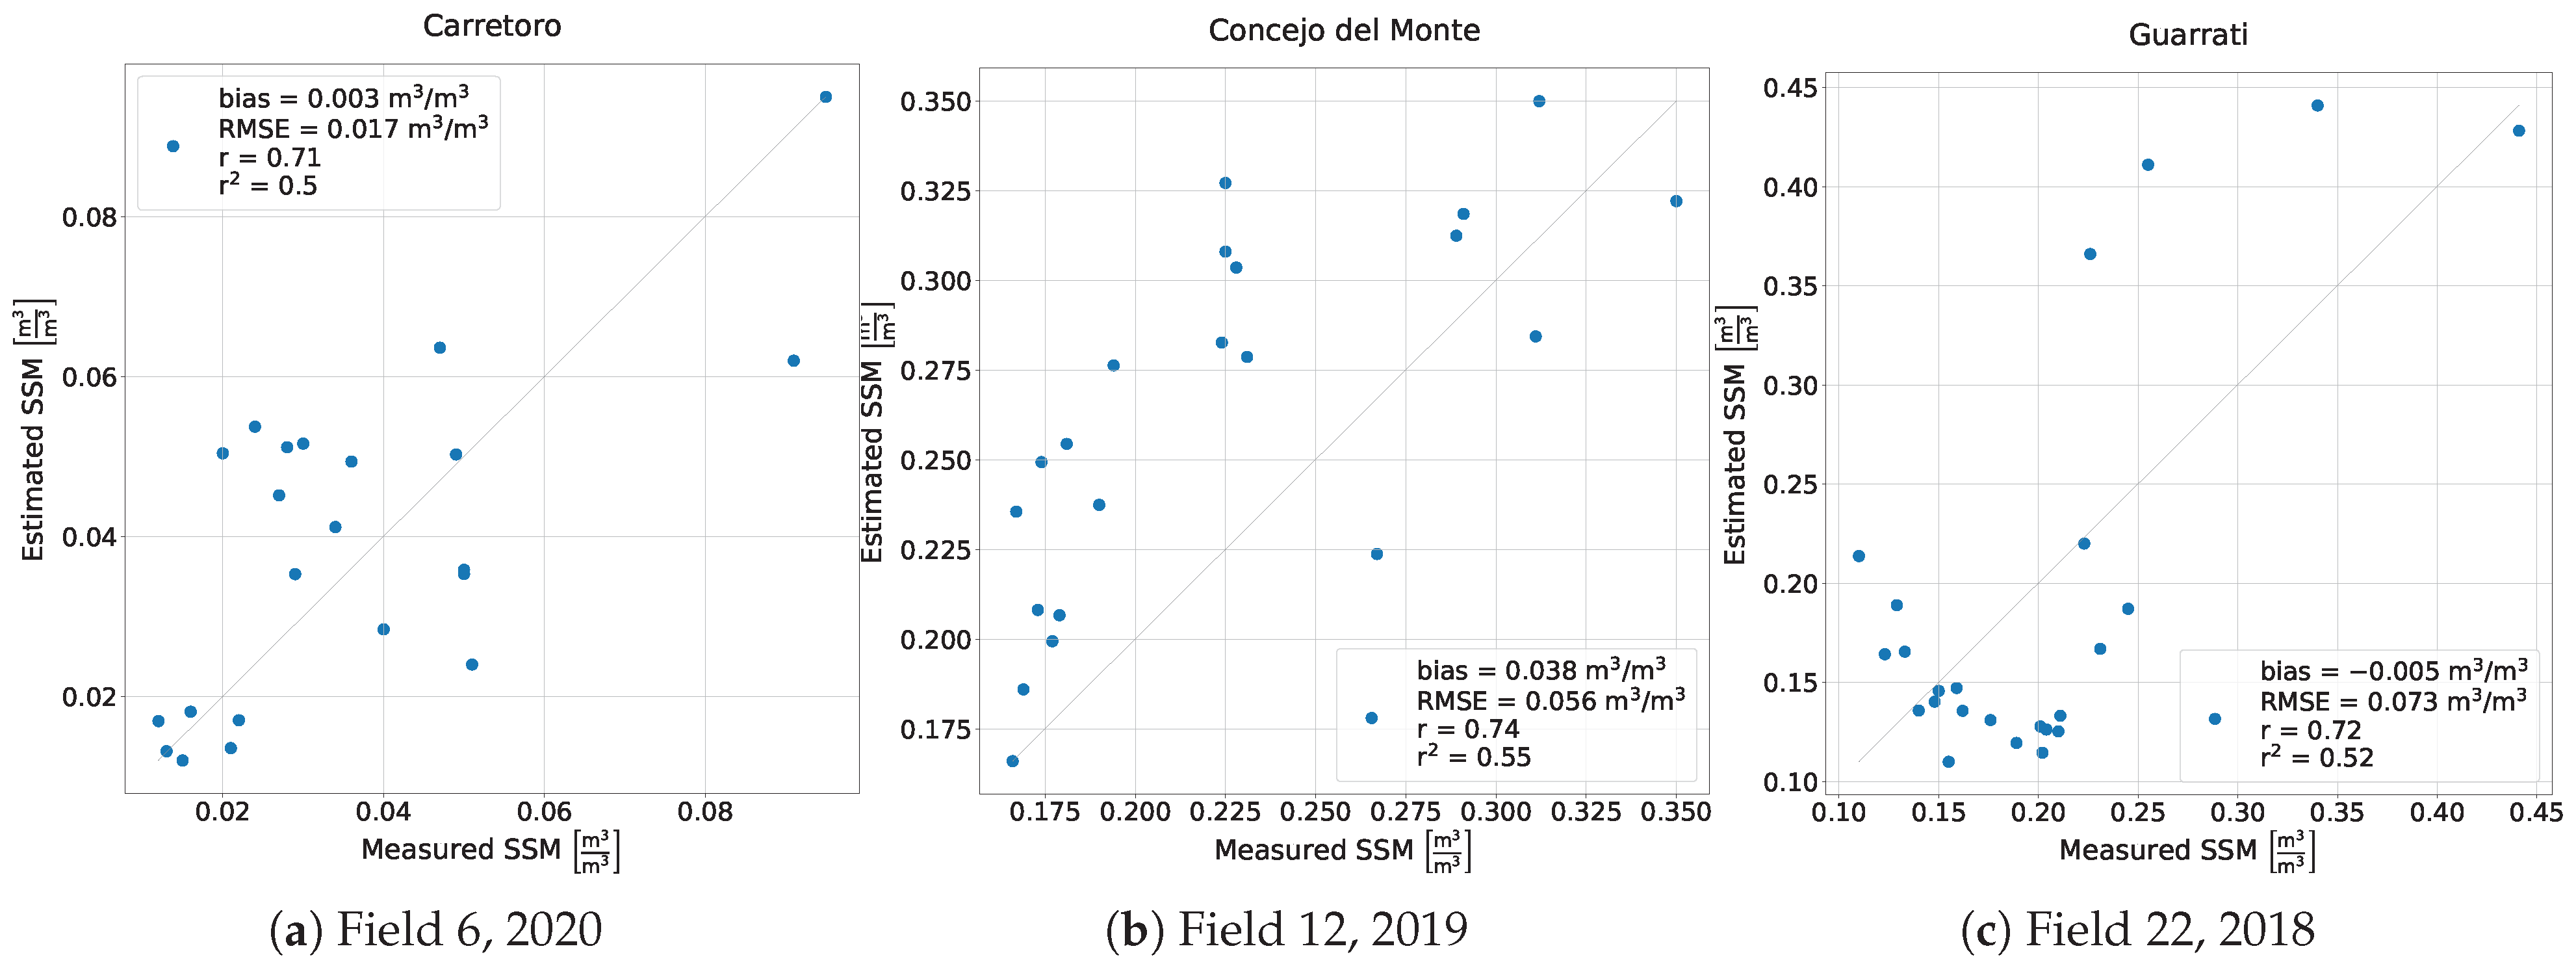
Figure 10a,b show the relationship between measured and estimated soil moisture for the two reference fields 27 and 36 respectively. In the image it is also reported in black the line where measured and estimated soil moisture have equal values: as can be observed, for both the fields the points are well distributed around this line.
Appendix A includes the time series and the graphs showing the relations between estimated and measured soil moisture for the other 6 fields highlithed in bold in Table 2, over which good results of estimated soil moisture were obtained.
Since most of the measurement stations are on the borders of agricultural fields, on some of the analyzed fields the inversion algorithm has been calibrated by using in situ data of the same measurment station, such as for the fields 26 and 27 with the data of the station of Las Arenas. The results obtained over these two fields are comparable in terms of bias and RMSE, while the values of the correlation and determination coefficient are better for the field 27. The crop type associated with the measurment station of Las Arenas by the ISMN is vineyard, and from the RGB image in Figure 4a it is possible to observe that the field 26 is indeed covered by vineyard, while the field 27 it is not. Even though the field where more likely the measurment station is installed is the field 26, better results were obtained over the field 27. This is probably due to the fact that on field 27, the assumptions of smooth changes in vegetation and soil roughness conditions, which are at the basis of the retrieval algorithm, are valid. On the other hand, this result is important because it suggests that in situ data of one measurement station could be used for calibrating the retrieval algorithm over more than one field. However, for deepening the causes of these results, further investigations should be carried on with in situ information on the yearly crop type.
By assuming that also field 27 can be classified as raifed cereal, which is very likely given the main agricultural cover of the study area, it can be said that the best results were obtained from fields whose vegetation cover, according to the data provided from ISMN, is wheat or barley. Yearly specific in situ data on vegetation cover should be available for checking this hypothesis.
It is also interesting to note that different fields associated with the same measurement station in different years are characterized by different γ 0 V V / S S M v slopes, as can be read from Table 2 for the stations of Las Arenas, Las Vacas and Zamarron. On field 40, associated with Zamarron, different trends were detected also on the same fields for different years. Unfortunately, these different behaviours cannot be addressed in the present study due to the lack of in situ data, but some assumptions on their causes can be made. For example, the presence of two different crop types over the two fields may have influenced the penetration capacity of the SAR signal, allowing the detection of the subsurface scattering when bare soil or low vegetation was present for dry soil conditions. The two fields could also have been characterized by different composition and texture of the soil, or maybe some agricultural practises such as tillage could have changed the structure of the first layer or soil during study period.

Sensitivity Analysis

A sensitivity analysis was performed on the two in situ parameters of the retrieval algorithm, namely the maximum and minimum value of measured soil moisture ( S S M v m a x , S S M v m i n in Equation (5)). The analysis was performed only on the 8 fields on which the proposed estimation method obtained good results. Table 3 shows the bias and RMSE of the soil moisture estimated by varying of ±10% the parameters of interest. The correlation and determination coefficient are not reported in the table, since they were found not to change with the parameters of significant orders of magnitude. The table highlights in bold results equal or better than the orginal ones, which are half of all the cases. Moreover, it has to be noted that the remaining part of the metrics are very close to the original values and of the same order of magnitude. This means that the solution does not spread excessively around the original results with a reasonable variation of the in situ parameters.
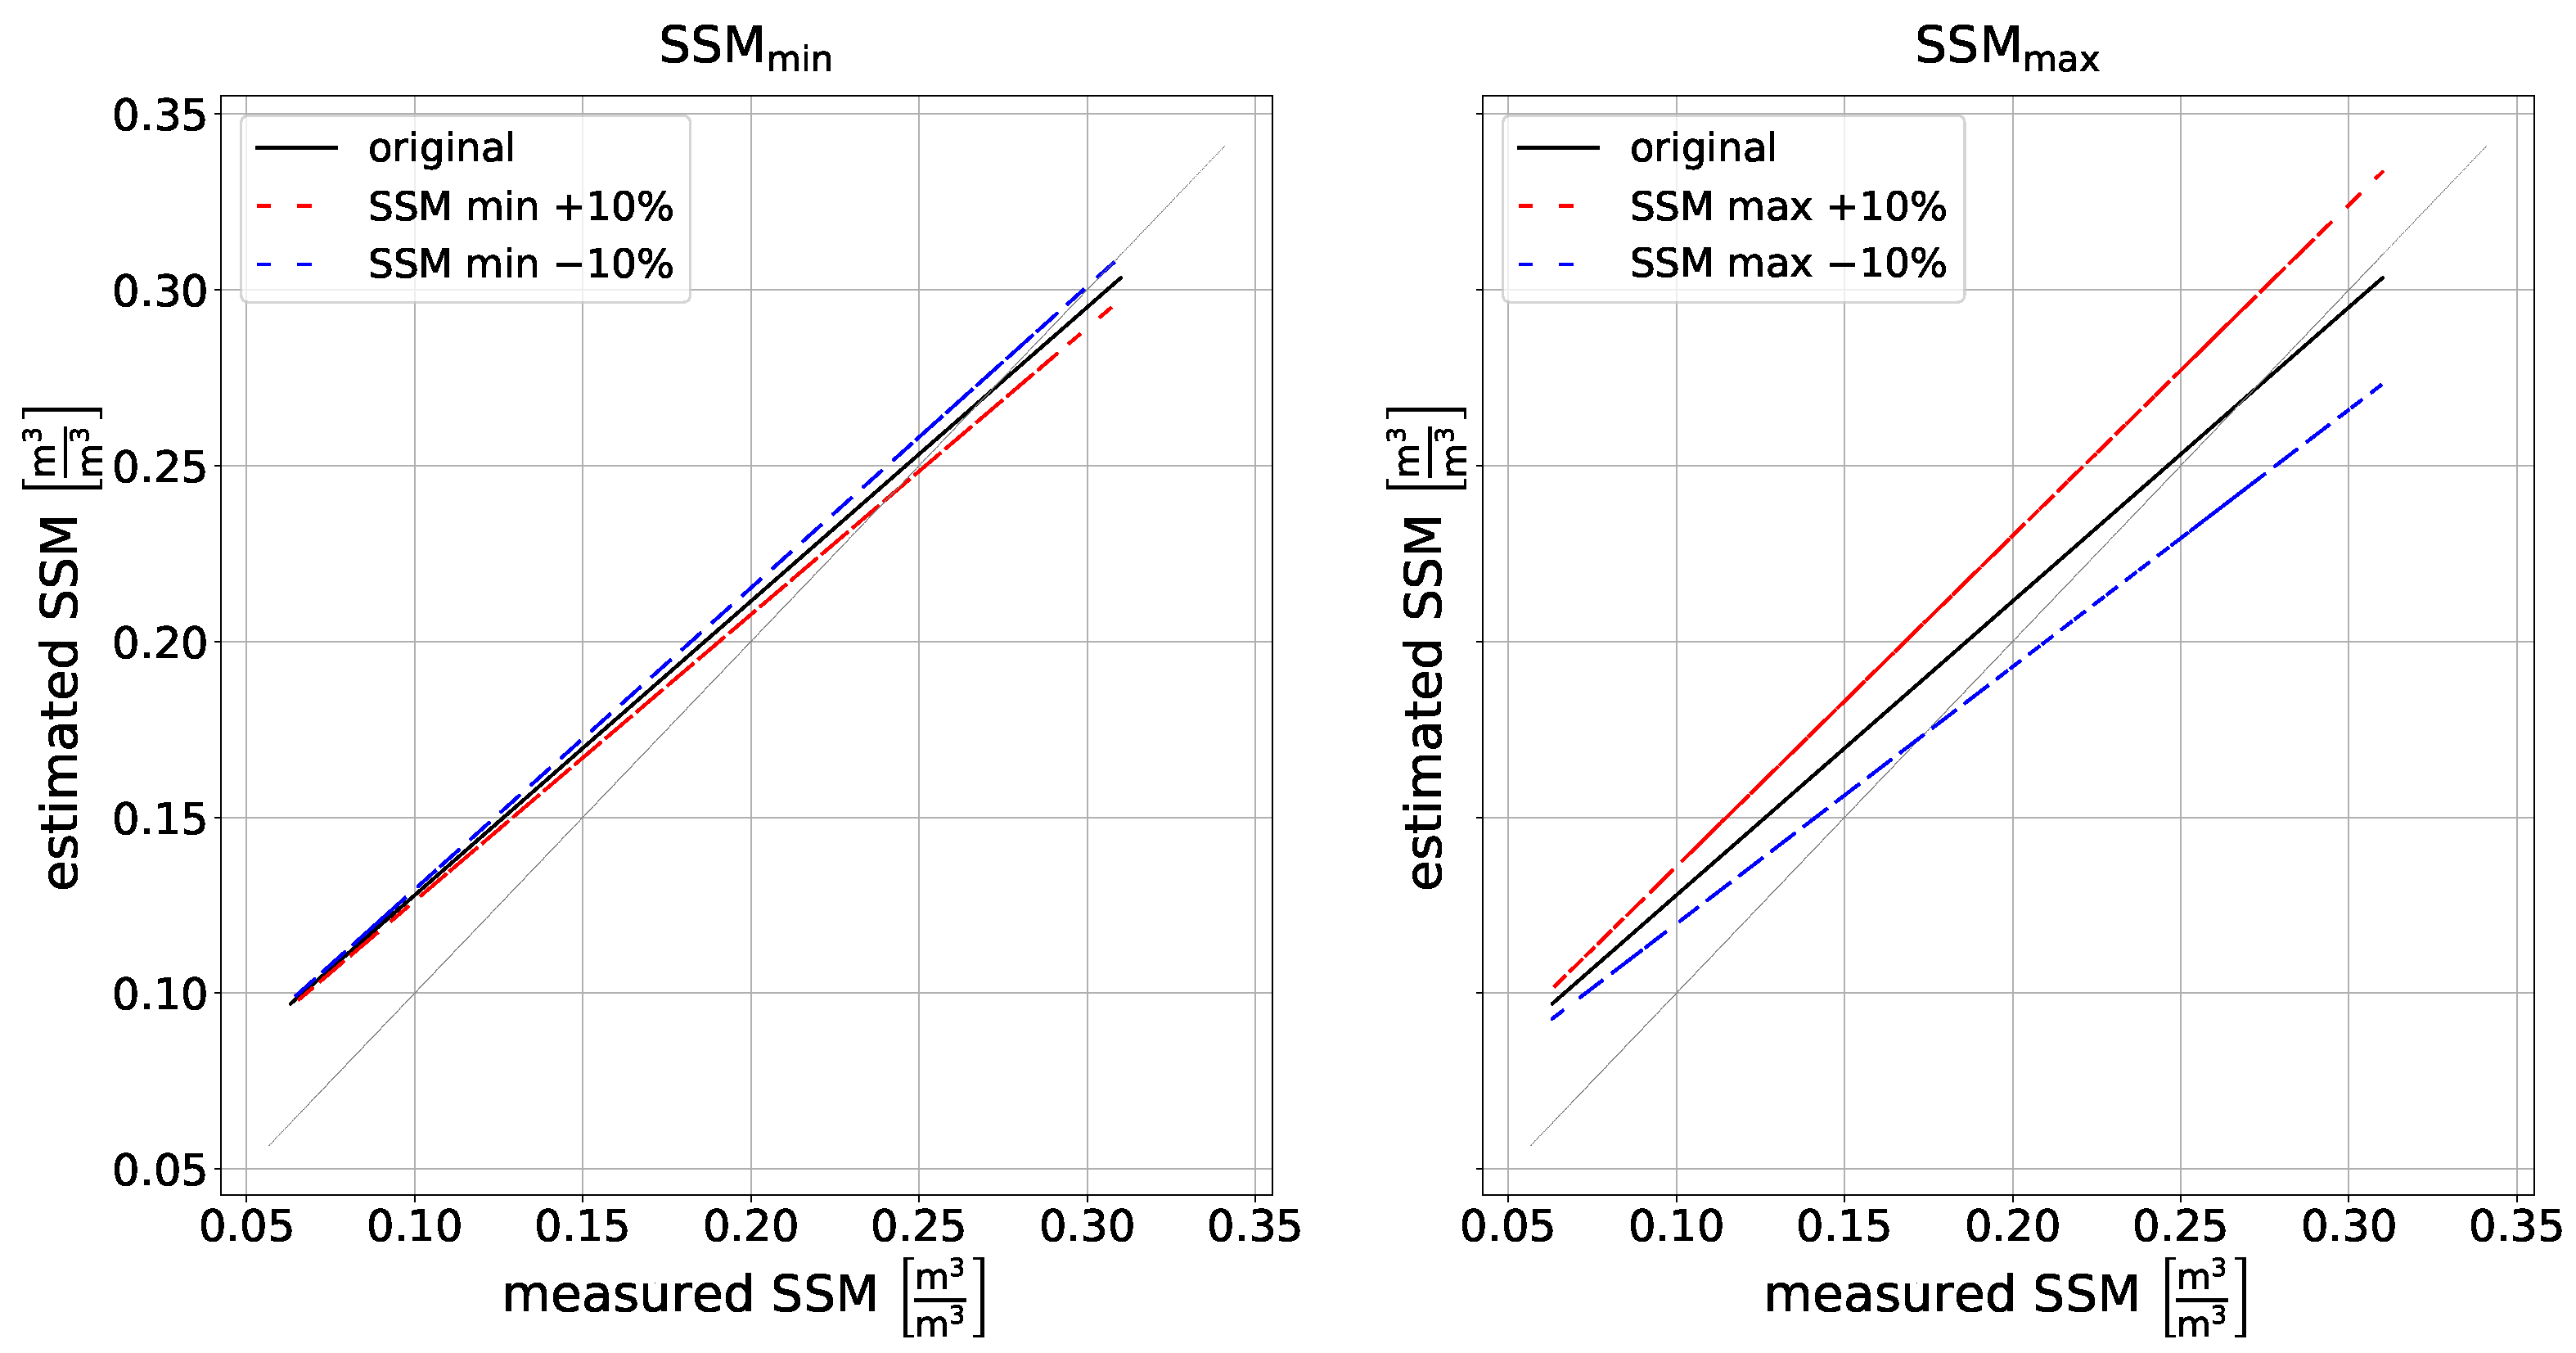
Finally, Figure 11 shows the lines fitting the distributions of the estimated soil moisture as a function of the measured soil moisture, obtained by varying the in situ parameters in the retrieval algorithm. In the graphs, the black line represents the line fitting the original solution, while the red and the blue dashed lines depict the solution obtained by changing the parameters respectively of +10% and −10%. The image on the left shows the variation of the parameter S S M m i n , while the image on the right illustrate the variation of S S M m a x for the field 27 during 2018. In order to understand the influence of the variation of the parameters on the soil moisture estimation, the lines of the ±10% S S M m a x are briefly analyzed. The slope of the solution obtained by using S S M m a x + 10% (dashed red line) is almost parallel to the grey line, which slope is equal to 1. The associated value of bias is higher in respect to the orginal one, and indeed the red dashed line is shifted up in comparison to the black line. At the contrary, the dashed blue line obtained by using S S M m a x 10 % is less sloping in respect to the not changed solution, but since it intercepts the grey line characterized by slope 1, the values of RMSE are lower. This is a very good result in view of an expansion of the proposed estimation method to a validation study, when enough data will be available.

5. Conclusions and Future Works

An inversion algorithm was applied on Sentinel-1 co-polarized data for retrieving soil moisture over some agricultural fields. From a preliminary analysis on the relationship between the co-polarized backscattering coefficient and the measured soil moisture at the field scale, it emerged that some fields showed a strong direct relation, while some others were characterized by a strong inverse relationship. This second behaviour was found also by other authors [34,37] on arid climate areas, such the one considered in this study. The inversion algorithm was adapted accordingly to these two trends of the dataset, and it was applied to the differences of SAR signal over carefully selected fields. The signal differences were calculated with a Change Detection method by excluding from the dataset the dates associated with steep variations of vegetation and soil roughness conditions. The detection of the outliers was perfomed with the DBSCAN algorithm in a 3D space composed by the differences of the features Δ γ 0 V V , Δ γ 0 V H , Δ ( γ 0 V H / γ 0 V V ) . Good results of estimated soil moisture were obtained, with coefficients of correlation and RMSE up to r = 0.89 and R M S E = 0.042   m 3 / m 3 for fields characterized by direct γ 0 V V S S M v relationship, and up to r = 0.84 and R M S E = 0.026   m 3 / m 3 over fields characterized by inverse relationship. Given the succesfull application of the proposed retrieval method not only over fields characterized by a direct relationship between γ 0 V V and S S M v , but also over fields with strong inverse relationships, it can be concluded that it is fundamental to check the nature of the γ 0 V V S S M v relationship when estimating the superficial soil moisture at the field scale from SAR data, especially over agricultural areas characterized by arid climate.
The proposed retrieval method obtained good results over some selected fields where wheat and barley are cultivated according to the ISMN classification. It can be thus said that over those selected fields the assumptions of smooth changes in vegetation and soil roughness conditions were respected. In order to expand the soil moisture estimation to fields not selected for soil moisture retrieval in the present study, future works should concentrate in relaxing the just mentioned hypothesis. Given the potential of SAR data in mapping both vegetation dynamics and soil roughness changes at various wavelenghts, such as the X-band [44,45], multi bands SAR data should be used for modelling the different components affecting the total backscattering coefficient.
The causes of the inverse relationship are not yet completely addressed in literature and in the present work the authors were not able to investigate them due to a lack of in situ data. Some authors supposed that the inverse behaviour is due to soil roughness variations [35], while some others claimed that it could be due to a volumetric scattering caused by subsurface scatterers [37]. Future studies should investigate the causes of this inverse relationship. From the results of the present work it cannot be excluded that also the vegetation cover could have played a role. It was indeed found for few stations that fields characterized by differente crops and associated with the same measurement station showed different behaviors.
Finally, in the present work a calibration study of the proposed retrieval method was presented, followed by a sensitivity analysis, since not enough data were available for a validation study. In view of a future validation of the proposed method and of its applications over other study areas, a comprehensive dataset composed by the following information should be created and studied: mean SAR response of both co-polarized and cross-polarized bands over the field under study for some agricultural seasons; yearly cultivalted crop type with information on associated agricultural practises performed; in situ soil moisture data; soil composition information.

Author Contributions

Conceptualization, A.V. and G.G.; Methodology, A.V. and G.G.; Software, G.G.; Formal analysis, G.G. and A.V.; Data curation, G.G.; Writing—original draft, G.G.; Writing—review & editing, A.V., G.G. and D.Z.; Supervision, A.V. and D.Z. All authors have read and agreed to the published version of the manuscript.

Funding

This research was partially funded with a Law 6 from the Autonomous Province of Trento, Italy, within the project “Bluetentacles Irrigation System—acronym: BlueT”.

Acknowledgments

For this research it was used Copernicus Service information 2018 and modified Copernicus Sentinel data 2018, 2019, 2020, 2021. The authors would also thank the Research Group of Water Resources of the University of Salamanca (Spain) for providing data to support this study.

Conflicts of Interest

The authors declare no conflict of interest.

Appendix A. Superficial Soil Moisture
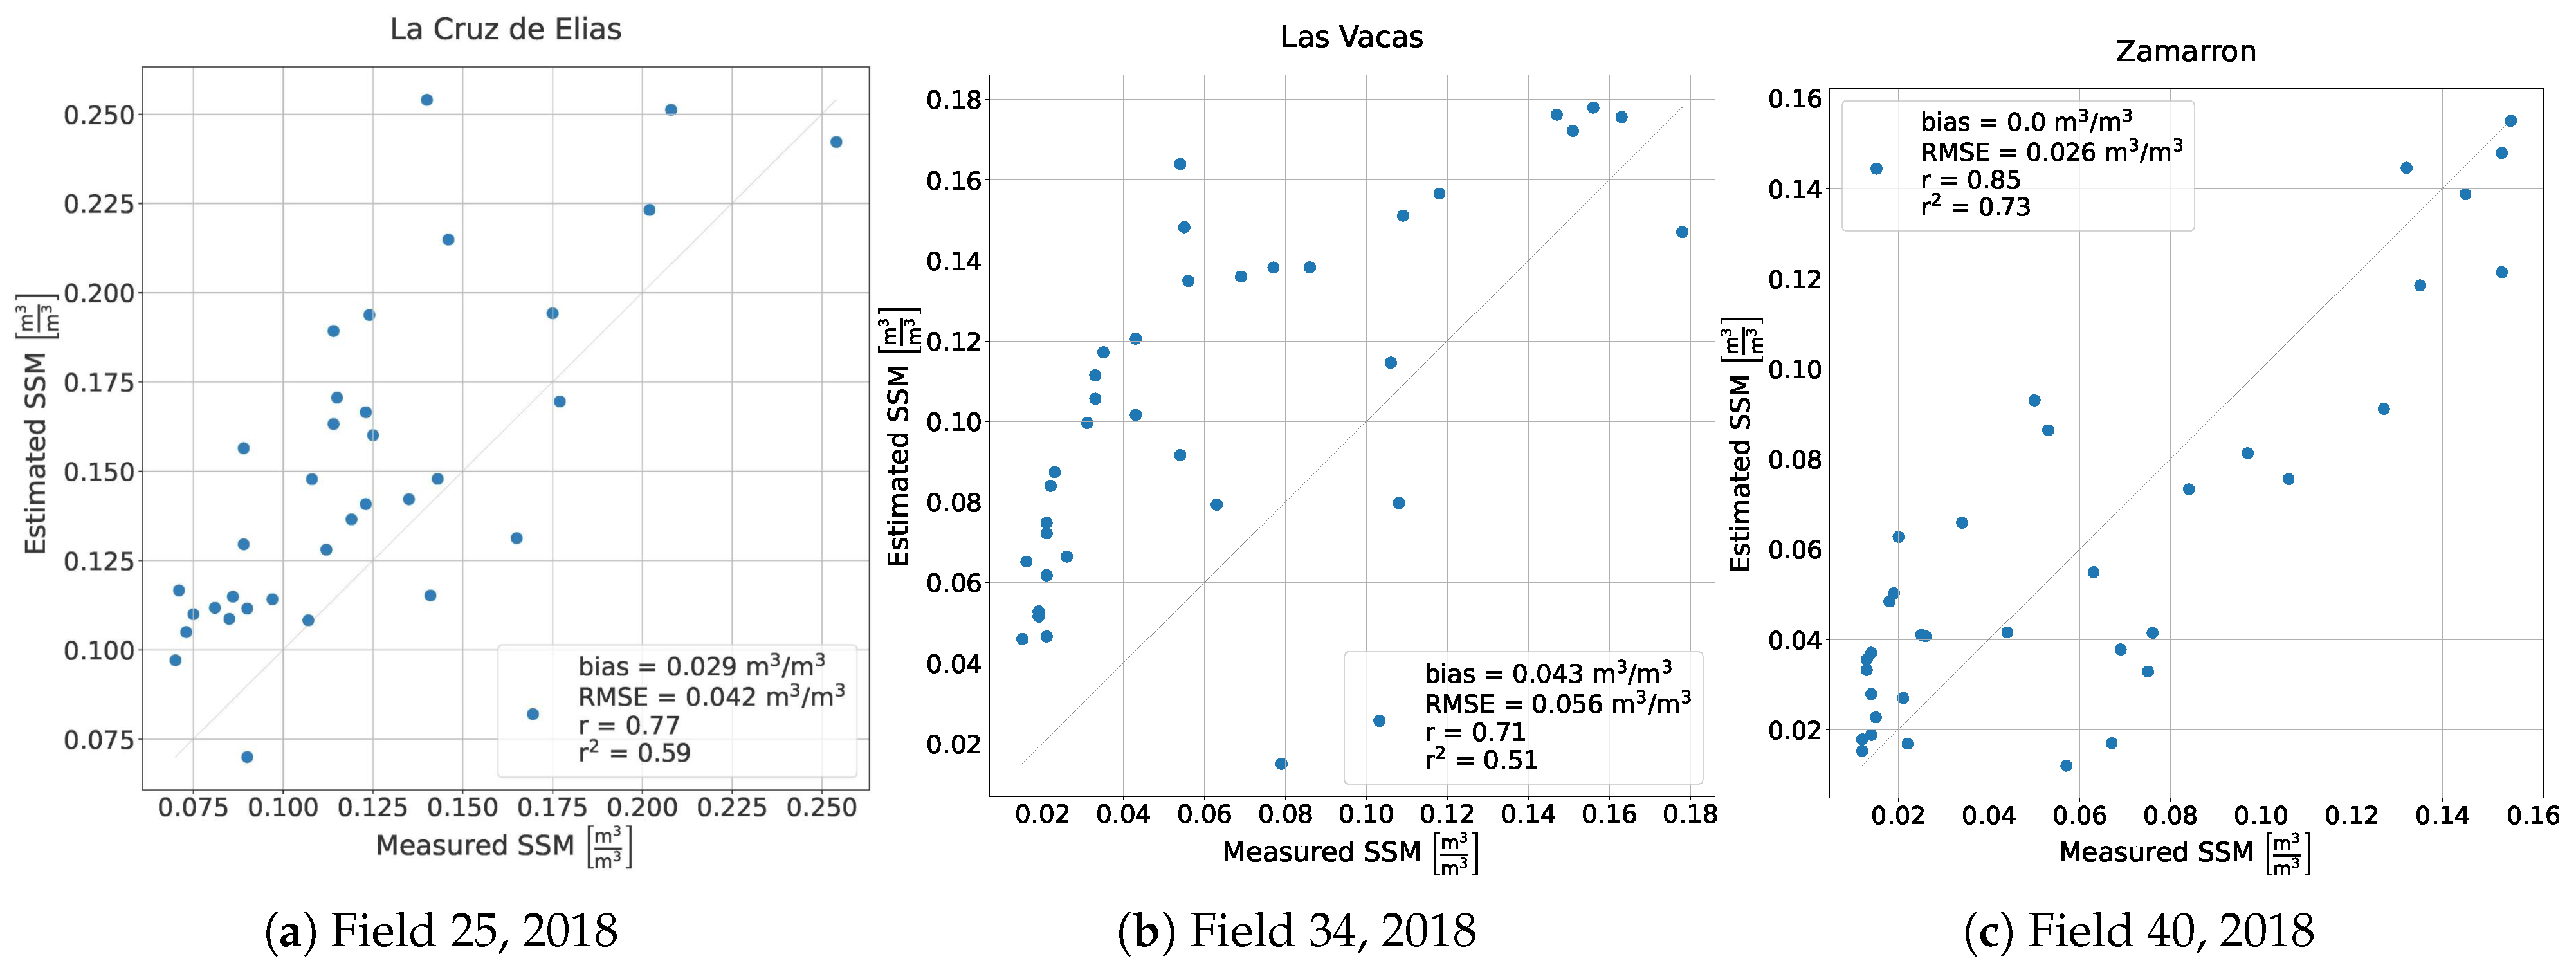
Figure A1. Time series of measured and estimated soil moisture reported respectively in light blue and red for three fields characterized by direct relationship between γ 0 V V and S S M v . Precipitation are also depicted with grey bars.
Remotesensing 15 02997 g0a1
Figure A2. Relationship between measured and estimated soil moisture for three fields characterized by direct relationship between γ 0 V V and S S M v . In black it is depicted the line where measured and estimated soil moisture are equal.
Remotesensing 15 02997 g0a2
Figure A3. Time series of measured and estimated soil moisture reported respectively in light blue and red for three fields characterized by inverse relationship between γ 0 V V and S S M v . Precipitation are also depicted with grey bars.
Remotesensing 15 02997 g0a3
Figure A4. Relationship between measured and estimated soil moisture for three fields characterized by inverse relationship between γ 0 V V and S S M v . In black it is depicted the line where measured and estimated soil moisture are equal.
Remotesensing 15 02997 g0a4

References

  1. Seneviratne, S.I.; Corti, T.; Davin, E.L.; Hirschi, M.; Jaeger, E.B.; Lehner, I.; Orlowsky, B.; Teuling, A.J. Investigating soil moisture–climate interactions in a changing climate: A review. Earth-Sci. Rev. 2010, 99, 125–161. [Google Scholar] [CrossRef]
  2. Babaeian, E.; Sadeghi, M.; Jones, S.B.; Montzka, C.; Vereecken, H.; Tuller, M. Ground, Proximal, and Satellite Remote Sensing of Soil Moisture. Rev. Geophys. 2019, 57, 530–616. [Google Scholar] [CrossRef] [Green Version]
  3. Pasolli, L.; Notarnicola, C.; Bertoldi, G.; Bruzzone, L.; Remelgado, R.; Greifeneder, F.; Niedrist, G.; Chiesa, S.D.; Tappeiner, U.; Zebisch, M. Estimation of Soil Moisture in Mountain Areas Using SVR Technique Applied to Multiscale Active Radar Images at C-Band. IEEE J. Sel. Top. Appl. Earth Obs. Remote Sens. 2015, 8, 262–283. [Google Scholar] [CrossRef]
  4. Implementation Plan for the Global Observing System for Climate in Support of the UNFCCC; Technical Report WMO/TD No. 1244; Global Climate Observing System: Geneva, Switzerland, 2010; 23p.
  5. Brocca, L.; Crow, W.T.; Ciabatta, L.; Massari, C.; de Rosnay, P.; Enenkel, M.; Hahn, S.; Amarnath, G.; Camici, S.; Tarpanelli, A.; et al. A Review of the Applications of ASCAT Soil Moisture Products. IEEE J. Sel. Top. Appl. Earth Obs. Remote Sens. 2017, 10, 2285–2306. [Google Scholar] [CrossRef]
  6. Petropoulos, G.P.; Ireland, G.; Barrett, B. Surface soil moisture retrievals from remote sensing: Current status, products & future trends. Phys. Chem. Earth Parts A/B/C 2015, 83–84, 36–56. [Google Scholar] [CrossRef]
  7. Srivastava, P.K. Satellite Soil Moisture: Review of Theory and Applications in Water Resources. Water Resour. Manag. 2017, 31, 3161–3176. [Google Scholar] [CrossRef]
  8. Yu, K.; Han, S.; Bu, J.; An, Y.; Zhou, Z.; Wang, C.; Tabibi, S.; Cheong, J.W. Spaceborne GNSS Reflectometry. Remote Sens. 2022, 14, 1605. [Google Scholar] [CrossRef]
  9. Kerr, Y.H.; Waldteufel, P.; Richaume, P.; Wigneron, J.P.; Ferrazzoli, P.; Mahmoodi, A.; Bitar, A.A.; Cabot, F.; Gruhier, C.; Juglea, S.E.; et al. The SMOS Soil Moisture Retrieval Algorithm. IEEE Trans. Geosci. Remote Sens. 2012, 50, 1384–1403. [Google Scholar] [CrossRef]
  10. Chan, S.K.; Bindlish, R.; O’Neill, P.E.; Njoku, E.; Jackson, T.; Colliander, A.; Chen, F.; Burgin, M.; Dunbar, S.; Piepmeier, J.; et al. Assessment of the SMAP Passive Soil Moisture Product. IEEE Trans. Geosci. Remote Sens. 2016, 54, 4994–5007. [Google Scholar] [CrossRef]
  11. Li, L.; Gaiser, P.W.; Gao, B.C.; Bevilacqua, R.M.; Jackson, T.J.; Njoku, E.G.; Rudiger, C.; Calvet, J.C.; Bindlish, R. WindSat Global Soil Moisture Retrieval and Validation. IEEE Trans. Geosci. Remote Sens. 2010, 48, 2224–2241. [Google Scholar] [CrossRef]
  12. Wagner, W.; Hahn, S.; Kidd, R.; Melzer, T.; Bartalis, Z.; Hasenauer, S.; Figa-Salda na, J.; de Rosnay, P.; Jann, A.; Schneider, S.; et al. The ASCAT Soil Moisture Product: A Review of its Specifications, Validation Results, and Emerging Applications. Meteorol. Z. 2013, 22, 5–33. [Google Scholar] [CrossRef] [Green Version]
  13. Kornelsen, K.C.; Coulibaly, P. Advances in soil moisture retrieval from synthetic aperture radar and hydrological applications. J. Hydrol. 2013, 476, 460–489. [Google Scholar] [CrossRef]
  14. Torres, R.; Snoeij, P.; Geudtner, D.; Bibby, D.; Davidson, M.; Attema, E.; Potin, P.; Rommen, B.; Floury, N.; Brown, M.; et al. GMES Sentinel-1 mission. Remote Sens. Environ. 2012, 120, 9–24. [Google Scholar] [CrossRef]
  15. Balenzano, A.; Mattia, F.; Satalino, G.; Lovergine, F.P.; Palmisano, D.; Peng, J.; Marzahn, P.; Wegmüller, U.; Cartus, O.; Dąbrowska-Zielińska, K.; et al. Sentinel-1 soil moisture at 1 km resolution: A validation study. Remote Sens. Environ. 2021, 263, 112554. [Google Scholar] [CrossRef]
  16. Bauer-Marschallinger, B.; Freeman, V.; Cao, S.; Paulik, C.; Schaufler, S.; Stachl, T.; Modanesi, S.; Massari, C.; Ciabatta, L.; Brocca, L.; et al. Toward Global Soil Moisture Monitoring With Sentinel-1: Harnessing Assets and Overcoming Obstacles. IEEE Trans. Geosci. Remote Sens. 2019, 57, 520–539. [Google Scholar] [CrossRef]
  17. Balenzano, A.; Mattia, F.; Satalino, G.; Davidson, M.W.J. Dense Temporal Series of C- and L-band SAR Data for Soil Moisture Retrieval Over Agricultural Crops. IEEE J. Sel. Top. Appl. Earth Obs. Remote Sens. 2011, 4, 439–450. [Google Scholar] [CrossRef]
  18. Gao, Q.; Zribi, M.; Escorihuela, M.; Baghdadi, N. Synergetic Use of Sentinel-1 and Sentinel-2 Data for Soil Moisture Mapping at 100 m Resolution. Sensors 2017, 17, 1966. [Google Scholar] [CrossRef] [Green Version]
  19. Veloso, A.; Mermoz, S.; Bouvet, A.; Toan, T.L.; Planells, M.; Dejoux, J.F.; Ceschia, E. Understanding the temporal behavior of crops using Sentinel-1 and Sentinel-2-like data for agricultural applications. Remote Sens. Environ. 2017, 199, 415–426. [Google Scholar] [CrossRef]
  20. Zhu, L.; Walker, J.P.; Ye, N.; Rüdiger, C. Roughness and vegetation change detection: A pre-processing for soil moisture retrieval from multi-temporal SAR imagery. Remote Sens. Environ. 2019, 225, 93–106. [Google Scholar] [CrossRef]
  21. Martínez-Fernández, J.; Ceballos, A. Mean soil moisture estimation using temporal stability analysis. J. Hydrol. 2005, 312, 28–38. [Google Scholar] [CrossRef]
  22. Dorigo, W.A.; Wagner, W.; Hohensinn, R.; Hahn, S.; Paulik, C.; Xaver, A.; Gruber, A.; Drusch, M.; Mecklenburg, S.; van Oevelen, P.; et al. The International Soil Moisture Network: A data hosting facility for global in situ soil moisture measurements. Hydrol. Earth Syst. Sci. 2011, 15, 1675–1698. [Google Scholar] [CrossRef] [Green Version]
  23. González-Zamora, Á.; Sánchez, N.; Pablos, M.; Martínez-Fernández, J. CCI soil moisture assessment with SMOS soil moisture and in situ data under different environmental conditions and spatial scales in Spain. Remote Sens. Environ. 2019, 225, 469–482. [Google Scholar] [CrossRef]
  24. González-Zamora, Á.; Sánchez, N.; Martínez-Fernández, J.; Gumuzzio, Á.; Piles, M.; Olmedo, E. Long-term SMOS soil moisture products: A comprehensive evaluation across scales and methods in the Duero Basin (Spain). Phys. Chem. Earth Parts A/B/C 2015, 83-84, 123–136. [Google Scholar] [CrossRef]
  25. Estaciones Climatológicas de la Agencia Estatal de Meteorología (AEMET). 2016. Available online: https://www.miteco.gob.es/en/cartografia-y-sig/ide/descargas/otros/default.aspx (accessed on 30 January 2021).
  26. European Space Agency (ESA). SNAP—ESA Sentinel Application Platform v7.0. Available online: http://step.esa.int/main/ (accessed on 30 January 2021).
  27. Filipponi, F. Sentinel-1 GRD Preprocessing Workflow. Proceedings 2019, 18, 11. [Google Scholar] [CrossRef] [Green Version]
  28. Lee, J.S.; Jurkevich, L.; Dewaele, P.; Wambacq, P.; Oosterlinck, A. Speckle filtering of synthetic aperture radar images: A review. Remote Sens. Rev. 1994, 8, 313–340. [Google Scholar] [CrossRef]
  29. Organismo Autónomo Centro Nacional de Información Geográfica (CNIG). Centro de Descargas. Available online: http://centrodedescargas.cnig.es/CentroDescargas/index.jsp (accessed on 30 March 2021).
  30. European Space Agency (ESA). Copernicus Open Access Hub. 2020. Available online: https://scihub.copernicus.eu/ (accessed on 30 March 2021).
  31. Drusch, M.; Bello, U.D.; Carlier, S.; Colin, O.; Fernandez, V.; Gascon, F.; Hoersch, B.; Isola, C.; Laberinti, P.; Martimort, P.; et al. Sentinel-2: ESA’s Optical High-Resolution Mission for GMES Operational Services. Remote Sens. Environ. 2012, 120, 25–36. [Google Scholar] [CrossRef]
  32. Neteler, M.; Bowman, M.H.; Landa, M.; Metz, M. GRASS GIS: A multi-purpose open source GIS. Environ. Model. Softw. 2012, 31, 124–130. [Google Scholar] [CrossRef] [Green Version]
  33. Ulaby, F. Radar measurement of soil moisture content. IEEE Trans. Antennas Propag. 1974, 22, 257–265. [Google Scholar] [CrossRef] [Green Version]
  34. Ullmann, T.; Jagdhuber, T.; Hoffmeister, D.; May, S.M.; Baumhauer, R.; Bubenzer, O. Exploring Sentinel-1 backscatter time series over the Atacama Desert (Chile) for seasonal dynamics of surface soil moisture. Remote Sens. Environ. 2023, 285, 113413. [Google Scholar] [CrossRef]
  35. Baghdadi, N.; ZribiI, M.; Loumagne, C.; Ansart, P.; Anguela, T. Analysis of TerraSAR-X data and their sensitivity to soil surface parameters over bare agricultural fields. Remote Sens. Environ. 2008, 112, 4370–4379. [Google Scholar] [CrossRef] [Green Version]
  36. Liu, P.W.; Judge, J.; DeRoo, R.D.; England, A.W.; Bongiovanni, T.; Luke, A. Dominant backscattering mechanisms at L-band during dynamic soil moisture conditions for sandy soils. Remote Sens. Environ. 2016, 178, 104–112. [Google Scholar] [CrossRef]
  37. Wagner, W.; Lindorfer, R.; Melzer, T.; Hahn, S.; Bauer-Marschallinger, B.; Morrison, K.; Calvet, J.C.; Hobbs, S.; Quast, R.; Greimeister-Pfeil, I.; et al. Widespread occurrence of anomalous C-band backscatter signals in arid environments caused by subsurface scattering. Remote Sens. Environ. 2022, 276, 113025. [Google Scholar] [CrossRef]
  38. Attema, E.P.W.; Ulaby, F.T. Vegetation modeled as a water cloud. Radio Sci. 1978, 13, 357–364. [Google Scholar] [CrossRef]
  39. Kumar, K.; Rao, H.P.S.; Arora, M.K. Study of water cloud model vegetation descriptors in estimating soil moisture in Solani catchment. Hydrol. Process. 2014, 29, 2137–2148. [Google Scholar] [CrossRef]
  40. Prevot, L.; Dechambre, M.; Taconet, O.; Vidal-Madjar, D.; Normand, M.; Gallej, S. Estimating the characteristics of vegetation canopies with airborne radar measurements. Int. J. Remote Sens. 1993, 14, 2803–2818. [Google Scholar] [CrossRef]
  41. Ester, M.; Kriegel, H.P.; Sander, J.; Xu, X. A density-based algorithm for discovering clusters in large spatial databases with noise. In Proceedings of the Second International Conference on Knowledge Discovery and Data Mining, Portland, OR, USA, 2–4 August 1996; pp. 226–321. [Google Scholar]
  42. Ouaadi, N.; Jarlan, L.; Ezzahar, J.; Zribi, M.; Khabba, S.; Bouras, E.; Bousbih, S.; Frison, P.L. Monitoring of wheat crops using the backscattering coefficient and the interferometric coherence derived from Sentinel-1 in semi-arid areas. Remote Sens. Environ. 2020, 251, 112050. [Google Scholar] [CrossRef]
  43. Hachani, A.; Ouessar, M.; Paloscia, S.; Santi, E.; Pettinato, S. Soil moisture retrieval from Sentinel-1 acquisitions in an arid environment in Tunisia: Application of Artificial Neural Networks techniques. Int. J. Remote Sens. 2019, 40, 9159–9180. [Google Scholar] [CrossRef]
  44. Paloscia, S.; Santi, E.; Fontanelli, G.; Montomoli, F.; Brogioni, M.; Macelloni, G.; Pampaloni, P.; Pettinato, S. The Sensitivity of Cosmo-SkyMed Backscatter to Agricultural Crop Type and Vegetation Parameters. IEEE J. Sel. Top. Appl. Earth Obs. Remote Sens. 2014, 7, 2856–2868. [Google Scholar] [CrossRef]
  45. Anguela, T.; Zribi, M.; Baghdadi, N.; Loumagne, C. Analysis of Local Variation of Soil Surface Parameters With TerraSAR-X Radar Data Over Bare Agricultural Fields. IEEE Trans. Geosci. Remote Sens. 2010, 48, 874–881. [Google Scholar] [CrossRef]
Figure 1. Location of the study area in Spain and spatial distribution of the measurement stations of the REMEDHUS network considered in the study.
Remotesensing 15 02997 g001
Figure 2. Layout of the measurment stations of REMEDHUS at the boundary of cultivated fields.
Remotesensing 15 02997 g002
Figure 3. k-dist sorted graph with k = 4 for the 3D space of the differences of the features γ 0 V V , γ 0 V H , γ 0 V H γ 0 V V for the field 6 referred to the station of Carretoro for 2020. The blue line fits the points whose distance from the fourth nearest point is low, while the red line fits the points which are more distant from their fourth nearest point in the feature space, which the DBSCAN algorithm would classify as noise. The k-dist parameter is set equal to y coordinate of the intersection point between the blue and the red line.
Remotesensing 15 02997 g003
Figure 4. Examples of digitalization of the fields around the measurment stations of Las Arenas and Llanos de la Boveda.
Remotesensing 15 02997 g004
Figure 5. Relationship between the mean co-polarized backscattering coefficient and the measured soil moisture for the field 27 during 2018, which is characterized by direct relationship. Every dot represents a date, specifically the red dots highlight days characterized by precipitation events, while the blue dots depict dates in which no precipitation events occurred. The black line shows instead a linear fit to the data.
Remotesensing 15 02997 g005
Figure 6. Relationship between the mean co-polarized backscattering coefficient and the measured soil moisture for two fields characterized by inverse relationship. Every dot represents a date, specifically the red dots highlight days characterized by precipitation events, while the blue dots depict dates in which no precipitation events occurred. The black line shows instead a linear fit to the data.
Remotesensing 15 02997 g006
Figure 7. Relationship between the mean co-polarized backscattering coefficient and the measured soil moisture for two discared fields representing two reccurent distributions of the dataset. (a) is characterized by wide variation of γ 0 V V and almost constant values of S S M v , while (b) shows a random distribution. Every dot represents a date, specifically the red dots highlight days characterized by precipitation events, while the blue dots depict dates in which no precipitation events occurred. The black line shows instead a linear fit to the data.
Remotesensing 15 02997 g007
Figure 8. 2D visualization of the results of the application of the DBSCAN algorithm on the mean SAR features over the field 6 (station of Carretoro) for 2020. The 2D space is defined by the differences of the feature Δ γ 0 V V and Δ γ 0 V H . Violet points were classified as belonging to one cluster, while green points were classified as noise.
Remotesensing 15 02997 g008
Figure 9. Time series of measured and estimated soil moisture reported respectively in light blue and red for two fields characterized by direct (a) and inverse (b) relationship between γ 0 V V and S S M v . Precipitation is also depicted with grey bars.
Remotesensing 15 02997 g009
Figure 10. Relationship between measured and estimated soil moisture for two fields characterized by direct (a) and inverse (b) relationship between γ 0 V V and S S M v . In black it is depicted the line where measured and estimated soil moisture are equal.
Remotesensing 15 02997 g010
Figure 11. Effect of the variation of the in situ parameters on the lines interpolating the distribution of points on the plane measured—estimated soil moisture. The black line fits the distribution of the original solution, while the red and the blue dashed lines depict the line fitting the solution obtained by changing the parameters respectively of +10% and −10%. The grey line is characterized by slope equal to one. The tested parameters are the minimum and maximum value of in situ data for every field. This graph is referred to the field 27 of the Las Arenas station for the year 2018.
Remotesensing 15 02997 g011
Table 1. Characteristics of the Sentinel-1 dataset.
Study PeriodN° of ImagesLevel ProductPolarizationRelative Orbit n°Incidence AngleRelative Orbit
2018–2021139GRD HRVV, VH154, 7430.6 –46.5 Desc., Asc.
Table 2. Statistical metrics of superficial soil moisture estimated over the fields selected from the preliminary analysis. Bias, root mean square error (RMSE), Pearson correlation coefficient (r) and coefficient of determination ( r 2 ) are shown. Some additional information on the reference measurement station, crop type, year of analysis and sign of the relationship γ 0 V V / S S M v are also indicated for every field analyzed over different years.
Station NameCropField IDYear γ 0 VV SSM v bias [ m 3 m 3 ]rsme [ m 3 m 3 ]r r 2
CanizalIrrigated12018+0.0320.0670.500.25
2021+−0.0210.0540.590.35
CarretoroRainfed cereal620190.0040.0070.500.25
20200.0030.0170.710.50
Casa PerilesRainfed cereal112018+0.0220.0490.530.28
Concejo del MonteRainfed cereal1220190.0380.0560.740.55
20200.0150.0590.630.39
El TomillarVineyard1620210.0090.0180.690.48
GranjaRainfed cereal412018+0.0580.0820.590.34
2020+0.0600.0810.620.38
GuarratiForest/Pastures222018−0.0050.0730.720.52
La Cruz de EliasRainfed cereal252018+0.0290.0420.770.59
Las ArenasVineyard2620190.0300.0520.670.45
20200.0200.0450.540.29
272018+0.0210.0420.890.79
Las VacasRainfed cereal3320180.0170.0330.560.31
342018+0.0430.0560.710.51
Las VictoriasRainfed cereal352020+0.0050.0230.680.46
Llanos de la BovedaRainfed cereal362019−0.0090.0260.840.71
ZamarronRainfed cereal3920180.0180.0300.660.43
20200.0070.0250.670.44
402018+0.0000.0260.850.73
2019−0.0100.0250.660.43
20200.0100.0280.590.35
Table 3. Variation of bias and RMSE of the estimated soil moisture by changing of ±10% the in situ parameters of the retrieval algorithm for the 8 fields on which better performance is obtained. The parameters are the minimum and maximum values of measured soil moisture S S M m i n and S S M m a x .
Station NameField IDYearbias [ m 3 m 3 ]RMSE [ m 3 m 3 ]
SSM min SSM max SSM min SSM max
+10%−10%+10%−10%+10%−10%+10%−10%
Carretoro620200.0020.0030.0060.0000.0170.0170.0180.016
Concejo del Monte1220190.0300.0470.0570.0200.0490.0640.0730.043
Guarrati222018−0.008−0.0020.006−0.0160.0700.0750.0830.065
La Cruz de Elias2520180.0250.0320.0400.0170.0400.0450.0530.033
Las Arenas2720180.0180.0230.0340.0080.0400.0430.0510.037
Las Vacas3420180.0420.0430.0530.0330.0550.0570.0650.048
Llanos de la Boveda362019−0.012−0.0050.000−0.0170.0270.0260.0270.030
Zamarron392018−0.0010.0000.005−0.0050.0260.0260.0270.027
Disclaimer/Publisher’s Note: The statements, opinions and data contained in all publications are solely those of the individual author(s) and contributor(s) and not of MDPI and/or the editor(s). MDPI and/or the editor(s) disclaim responsibility for any injury to people or property resulting from any ideas, methods, instructions or products referred to in the content.