Abstract
In the context of global climate change, many studies have focused on the interannual vegetation variation trends and their response to precipitation and temperature, but ignored the effects of seasonal variability. This study explored the relationship between normalized difference vegetation index (NDVI) and seasonal climate elements in the Wuliangsu Lake Basin area from 1990 to 2020, and quantified the impacts of human activities on vegetation dynamics. We used Landsat series data to analyze the spatial and temporal variation of the NDVI using the trend analysis method, the Theil–Sen median, the Mann–Kendall test, and the Hurst index. Then, we used meteorological data and land use data to quantify the effects of human activities using residual analysis, and correlation methods to determine the driving forces of NDVI variations. The results showed that the NDVI changes presented obvious regional characteristics, with a decreasing trend from southeast to northwest in Wuliangsu Lake Basin. Due to global warming, the start of the growing season (SOS) is 4.3 days (2001 to 2010) and 6.8 days (2011 to 2020) earlier compared with 1990 to 2000. The end of the season (EOS) is advanced by 3.6 days (2001 to 2010), and delayed by 8.9 days (2011 to 2020). Seasonal (spring, summer, autumn, and winter) NDVIs with precipitation and temperature show spatial heterogeneity. Further, changes in grasslands and woodlands were vulnerable to climate change and human activities. Since the beginning of the 21st century, human activity was the driving force for vegetation improvement in the Dengkou, west-central, north and southwest regions, where ecological instability is weak. This finding can provide a theoretical basis for the implementation of the same type of ecological restoration projects and the construction of ecological civilization, and contribute to the regional green and sustainable development.
1. Introduction
Vegetation is an important part of arid and semi-arid areas and plays an important role in preventing desertification and soil and water conservation [1,2]. The regeneration of vegetation is an effective method to reduce land sanding and improve the ecological environment. However, there are many factors affecting vegetation regeneration, such as land cover, climate change, and human activities. Climate change is having a major impact on vegetation cover in arid and semi-arid regions around the world. Hu et al. confirmed that the NDVI in the southern Punjab province of Pakistan is influenced by natural factors (precipitation, temperature, altitude, soil, etc.) [3]. Ghaderpour et al. showed that precipitation and temperature are important factors affecting the “greening” of vegetation in Italian regions [4]. Al-Kindi also demonstrated the relationship between climate and the NDVI in the Dhofar Southern Oman region [5]. At the same time, the problem of soil erosion and land degradation caused by the unreasonable use of vegetation by humans cannot be ignored [6,7]. The combination of climate change and human activities has caused massive soil erosion and land degradation, resulting in a more fragile ecological environment [8]. China is among the countries with the widest distribution of ecologically fragile areas, the largest number of fragile ecological types and the most obvious ecological vulnerability in the world [9]. Current studies focus on ecological changes in plants in the environmentally vulnerable Loess Plateau and the Qinghai–Tibet Plateau in China [10,11,12]. These studies revealed the characteristics of vegetation variation and its drivers at the regional scale, which are significant for regional ecological conservation. However, the stability of vegetation ecosystems in northwest China is strongly influenced by climate change. Ecological problems such as frequent natural disasters, increasing desertification and soil erosion have severely restricted regional development and agricultural production. The differentiated characteristics of vegetation sustainability and fluctuating variation processes in the northern region of China with underdeveloped economy and more vulnerable ecology still need further research [13,14].
Climate warming has led to significant changes in vegetation coverage in the middle and high latitudes of the northern hemisphere, with the phenomenon of early or delayed vegetation growing seasons [15,16,17]. Different vegetation types are influenced by seasonal climatic factors, with variability in phenological changes. Most studies tend to focus on identifying vegetation changes in response to changes in precipitation and temperature, while the patterns of vegetation change in response to seasonal climate variations are often ignored [18,19,20,21]. The impact of human activities on vegetation growth cannot be ignored, and the dynamic changes in vegetation reflect the process of human activities. During the mid-20th century, with the accelerated industrialization and urbanization, the vegetation area decreased. A large amount of land cover was converted into agricultural land and artificial construction land, which resulted in a series of ecological problems [22]. At the beginning of the 21st century, the implementation of national regional development and ecological protection projects improved the overall vegetation cover [23,24], but policy regulation and economic drivers still remain important in influencing changes in vegetation dynamics. The impact of human activity patterns on the growth of vegetation is manifested in the degradation of vegetation caused by urban expansion and industrial construction [25]. The government-led implementation of ecological protection projects such as desert management in Alxa has effectively promoted vegetation restoration [26,27,28]. In response to the above background, a deeper study is needed on seasonal vegetation dynamics monitoring for long time series and the driving force analysis.
Traditional vegetation dynamics monitoring based on field sampling survey data has the disadvantages of difficult and complicated data acquisition, which brings certain challenges to the vegetation changes analysis of long time series [29]. Satellite-borne remote sensing data has the advantage of being able to record various types of spatiotemporal data on the land surface at large spatial scales, and it has proven to be effective for rapidly identifying spatial-temporal changes in regional ecological environments. Long-term monitoring of the ecological environment changes is helpful for the protection of the vulnerable ecological environment. However, climate change can have more severe impacts on already fragile ecosystems, such as droughts. Loukas et al. used the standardized precipitation index (SPI) to assess the impact of climate change on the Thessaly region of Greece and showed that climate change is making the drought in the region more pronounced [30,31]. The research results of Meresa et al. showed that the standardized precipitation evapotranspiration index (SPEI) better characterizes the degree of drought than the SPI [32]. Currently, Hafzullah Aksoy et al. developed a critical intensity–duration–frequency curve based on the SPEI, which enabled more accurate monitoring of the extent of drought variability [33].
The above indices are mainly calculated based on meteorological data, ignoring important indicators that characterize vegetation greening. The normalized difference vegetation index (NDVI) has been an important indicator of vegetation growth due to its unique advantages of simple calculation, rapid acquisition and close correlation with vegetation growth [34,35,36]. At present, there have been many achievements in investigating the correlation between vegetation and climate and human activities using NDVI data [37]. Zhao et al., based on the AVHRR NDVI, suggested that the vegetation greening rate had increased in China from 1982 to 1999 [38]. Climatic parameters such as temperature, precipitation, and soil moisture have a significant impact on vegetation growth and the NDVI. It has been shown that there is a strong correlation between the NDVI and these parameters, as they influence the amount of water and nutrients available for plant growth [39,40]. Year node studies typically focus on changes in vegetation during specific time periods, while long time series studies examine trends and changes over a much longer time period [41]. One potential advantage of year node studies is that they can provide more detailed information about changes in vegetation during specific periods of interest. This may be particularly useful for understanding the impacts of specific events, such as droughts or land use changes, on vegetation. Long time series studies can provide a broader perspective on vegetation changes and the factors that influence them. Ghaderpour et al. analyzed the variation of climate and the NDVI in long time series and short time series using the least-squares wavelet software. By considering the effects of interannual and seasonal variability, it was concluded that there are more positive than negative monthly NDVI values in the Italian regional ecoregion. Monthly precipitation and temperature show a negligible decreasing trend, while the annual precipitation cycle is earlier than the NDVI, and the annual temperature is consistent with the NDVI annual cycle [4]. This indicates that analyzing trends over several decades or more can identify long-term change patterns and relationships with the factors that may not be apparent in shorter-term studies [42]. Ultimately, the choice between using year nodes or long time series will depend on the availability of data. Both approaches can provide valuable insights into the relationship between vegetation and climate, but they may be better suited for different types of questions and analyses.
Wuliangsu Lake is a river track lake formed by the diversion of the Yellow River and among the large grassland lakes in the global desert and semi-desert areas. Wuliangsu Lake Basin is also a biodiversity reserve in Asia and a globally renowned migratory and breeding site for birds. The Wuliangsu Lake Basin assumes the function of safeguarding the biodiversity and water ecological security of the Yellow River [43,44]. As a special gateway of the Sand-prevention belt in the strategic pattern of ecological security in the northern China, it plays an important role in protecting the Yellow River and the river-loop irrigation area and maintaining the regional ecological balance. Due to the ecological problems such as accelerated desertification and soil erosion in the Wuliangsu Lake Basin area in 2008, the socio-economic development and agricultural production in the area are seriously restricted. With the vigorous promotion of ecological civilization construction in China, the ecological environment has received high attention since 2012. At present, balancing socio-economic development and environmental protection has become a key issue in the northwest region [45,46,47]. It is significant to understand the dynamic changes in vegetation in the Wuliangsu Lake Basin and its influence mechanism, in order to adjust ecological protection measures and promote the harmonious development of natural ecosystem and social economy. To better understand seasonal NDVI changes in arid and semi-arid regions, it is necessary to conduct a long-term analysis of time series data and explore their relationship with seasonal climate parameters and human activities in the Wuliangsu Lake Basin area.
Therefore, this study analyzes the spatially varying characteristics of spatiotemporal processes of the seasonal NDVI in the Wuliangsu Lake Basin area from 1990 to 2020 at a regional scale. The main contributions of this study are to:
- (1)
- Describe the spatial and temporal trends of the NDVI in the Wuliangsu Lake Basin area.
- (2)
- Show the characteristics of the NDVI phenological variation and sustainability changes.
- (3)
- Identify the influence of climatic factors (seasonal precipitation and temperature) and human activities on the seasonal NDVI.
It aims to reveal the relationships between the seasonal NDVI and seasonal climate elements (precipitation and temperature) as well as human activity factors, and to identify the impacts of climate change and human activities on the changes in the seasonal NDVI. The goal is to provide a theoretical basis for future ecological restoration projects and the construction of ecological civilization.
2. Materials and Methods
2.1. Study Area
Wuliangsu Lake Basin (106°30′–109°30′E, 40°10′–41°20′N) is located in the Bayannur City, northwest of Inner Mongolia, China (Figure 1). The study area has an average elevation of 1643 m, and the terrain dips slightly from southwest to northeast. The region is generally flat and open, with some localized hills and depressions. It has a semi-arid and humid climate with long winters and short summers, and there are often large temperature differences between day and night. Severe weather conditions are frequent in the region, which has exacerbated the ecological fragility of the Wuliangsu Lake Basin. The main land covers include cropland, forest, grassland, shrubbery, wetland and building. As the third batch of ecological restoration areas in China, the local government implemented key projects on forestry, desert, mining, and soil and water conservation from 2018 to 2020, and the total investment in the Wuliangsu Lake Basin area reached USD 755 million.
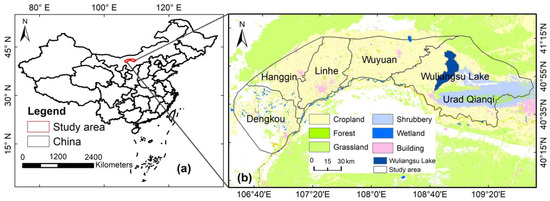
Figure 1.
The location of the Wuliangsu Lake Basin area. (a) Geographical location of China. (b) Study area.
2.2. Materials
2.2.1. Remote Sensing Data
Google Earth Engine (GEE) is a cloud-based platform for analyzing and visualizing geospatial data, including Landsat data. GEE provides access to Landsat 5, Landsat 7, and Landsat 8 data, which are available through the USGS Earth Explorer website (https://earthengine.google.com/, accessed on 18 May 2022). The spatial and temporal resolution of dataset are 30 m and 16 d, respectively. The data for 1990 to 2012 was from Landsat 5 which was retired on 5 June 2013. To ensure data integrity and continuity, the remote sensing data were replaced by Landsat 7 in 2013 and by Landsat 8 from 2014 to 2020. We eliminate the interference of cloudiness to remote sensing data by cloud preprocessing (Table 1).

Table 1.
The basic information of remote sensing data.
We can see from Table 1 that some of the Landsat 5 data are missing. We provide a detailed description of the missing data in Section 2.3.1.
2.2.2. Meteorological Data
Precipitation is derived from datasets published by the Copernicus Climate Change Service (C3S), operated by the European Centre for Medium-Range Weather Forecasts (ECMWF) (https://cds.climate.copernicus.eu/cdsapp#!/search/, accessed on 14 May 2022). Precipitation is the reanalysis dataset produced by the ECMWF ERA5 reanalysis model with a spatial resolution of 0.1°. The temperature data are from monthly average temperature datasets generated by interpolating the meteorological station data using the Gaussian Process Regression (GPR) method [48]. The dataset was obtained from the Data Sharing Platform (https://zenodo.org/, accessed on 10 May 2022) with a spatial resolution of 1 km. The precipitation dataset (mm) and the temperature dataset are from January 1990 to December 2020 in the Geo TIFF format and the WGS84 coordinate system.
We resampled the climate datasets with ArcGIS 10.5 software to maintain the spatial consistency between meteorological data and remote sensing data.
2.2.3. Additional Data
Land use data were obtained from ESA Climate Network (http://maps.elie.ucl.ac.be/CCI/viewer/index/, accessed on 25 May 2022) with a spatial resolution of 300 m (Figure 1), which was used to represent the land use type changes in the Wuliangsu Lake Basin.
2.3. Mathods
Figure 2 shows the general technical flow chart of this study. The three main components were: (1) data collection and pre-processing, (2) spatial variation and correlation analysis, and (3) analysis of spatial variation of the NDVI and drivers.
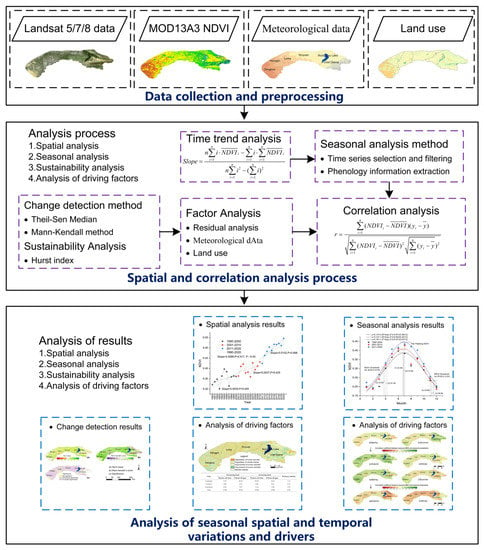
Figure 2.
The technical flow chart of this study.
2.3.1. Calculation and Processing of the NDVI
The NDVI is an important indicator to directly characterize the vegetation change, which is calculated by Equation (1).
where and is the surface reflectance in the near-infrared and red spectral range, respectively.
Because the missing Landsat 5 data (Table 1) resulted in missing monthly NDVI values, we used the MOD13A3 NDVI dataset instead. The MOD13A3 NDVI dataset is derived from the NASA EOS DATA Gateway (https://wist.echo.nasa.gov/, accessed on 18 May 2022) with a spatial resolution of 250 m, the GEO TIFF format and WGS84 coordinate system. We used ArcGIS 10.5 software to resample this dataset to 30 m in order to avoid the problem of inconsistent spatial resolution of the data.
We obtained the complete NDVI dataset for January to December from 1990 to 2020 by the maximum value composite method. Dividing the year into seasons is a common practice in climate and ecological studies to better understand the temporal patterns and changes in various environmental variables. In the case of the NDVI, which is a widely used index to quantify the greenness or vegetation density of an area, seasonal analysis can provide valuable insights into the vegetation dynamics in a particular region. The Wuliangsu Lake Basin can be divided into four seasons as follows:
Spring (March to May): During this season, the snow starts to melt, and the weather gradually becomes warmer. The vegetation starts to wake up from its dormant state and begins to grow, resulting in an increase in NDVI values.
Summer (June to August): This is the peak growing season when the weather is warm, and there is plenty of sunlight and water available for plants. As a result, NDVI values tend to be highest during this season.
Autumn (September to November): During this season, the temperature starts to drop, and the amount of sunlight decreases. The vegetation begins to slow down its growth and prepare for the winter, resulting in a decrease in NDVI values.
Winter (December to February of the following year): This is the coldest season when the temperature drops below freezing, and the ground is covered in snow. Most of the vegetation becomes dormant during this season, resulting in the lowest NDVI values of the year.
2.3.2. Time Series Selection and Filtering
We unified the time interval of the NDVI in the Wuliangsu Lake Basin area from 1990 to 2020 and weakened the atmospheric influence. Further, we used the maximum synthesis method to construct an 8 d time series. Then, the NDVI time series curves were smoothed using S-G filtering to eliminate the outliers in the curves [49]. We complete the filtering process by setting two parameters, the window length and the polynomial fitting order. To achieve the optimal smoothing effect, the parameters of S-G filtering need to be searched for the best results. We evaluated the filtering effect by both fidelity and noise reduction capability. The fidelity is assessed using the root mean square error, which indicates the degree of difference between the time series before and after smoothing, the smaller the difference, the better the fidelity. The noise reduction capability is evaluated by the most-valued statistics, and if the maximum and minimum values are removed after filtering, the purpose of noise removal is achieved.
2.3.3. Phenology Information Extraction
We selected the two most important periods of the start of the growing season (SOS) and the end of the season (EOS) for quantifying the phenological characters. We determined the seasonality using the monthly mean NDVI change ratio. The calculation formula is shown in (2)–(4).
The t represents the month of the year. We obtained NDVI time series curves for 1990 to 2020 followed by fitting them using Gaussian functions. We determined the SOS and EOS of these three periods by collating NDVI thresholds and fitted NDVI curves and analyzed the differences in phenology between these three periods.
2.3.4. The Trend Analysis Method
The slope of the linear change in the annual trend of the NDVI in the Wuliangsu Lake Basin area was calculated by an image-by-image time series for the four periods 1990–2000, 2001–2010, 2011–2020, and 1990–2020, respectively. The calculation formula is shown in (5).
where represents the mean NDVI in year i; n is the total number of years.
2.3.5. The Theil–Sen Median
We analyzed the spatial and temporal trends of the NDVI in the Wuliangsu Lake Basin area from 1990 to 2020 using the Theil–Sen median method. The Theil–Sen median slope is a trend analysis method based on non-parametric statistics. The calculation formula is shown in (6) and (7).
where the and are the mean NDVI of the jth and ith year of each image element. When the > 0, this indicates that the NDVI shows an improving trend, and on the contrary, a degrading trend.
2.3.6. Mann–Kendall Abrupt Change Detection
We used the Mann–Kendall non-parametric measurement method to detect the spatial and temporal significant changes in the NDVI from 1990 to 2020. The Mann–Kendall non-parametric assay is characterized by a wide range of detection and a high degree of quantification and is suitable for the examination of long time series changes. We used a confidence interval at the 0.05 level and divided the results into non-significant change (−1.96 < Z < 1.96) and significant change (Z ≥ 1.96 or Z ≤ −1.96). The formula is as follows (8)–(11):
where the and are the mean NDVI of the jth and ith year of each image element. n represents the length of time to detect vegetation change, f is the function symbol. The range of values of the statistic Z is . At the significant level α, when , it represents a significant trend. We used the α = 0.05, = 1.96 to determine the significance of the trend.
2.3.7. The Hurst Index
The Hurst index can quantitatively describe the persistence of variables over time [50,51,52]. This method is now used in the fields of hydrology, climatology and ecology, mainly to monitor the persistence of long-term trends. We used MATLAB R2017b software to calculate the Hurst index of the NDVI from 1990 to 2020. We divided the long-time sequence into subsequences . The formula is as follows (12)–(17):
where represents the long-time series NDVI data from 1990 to 2020. c is the relationship constant, H is the Hurst index, and ɑ is the intercept moment.
The sustainability of NDVI change was determined by the spatially overlaying the NDVI change trend, the Theil–Sen median, the Mann–Kendall test, and the Hurst index, as shown in Table 2.

Table 2.
Definition of sustainability of the NDVI change trend.
2.3.8. Residual Analysis
The residual analysis method, as proposed by Evans and Geerken [53], enables exploration of climate change and human activities effects on NDVI changes. We use the regression model between the NDVI and climate factors to calculate the element residuals, and the NDVI predicted by climate factors can be obtained by the regression model calculation [54]. The formula is as follows (18) and (19):
where the , and NDVI represent the NDVI predictions, residuals and the NDVI true values, respectively. We obtained the residual by subtracting the NDVI simulated by meteorological factors from the real value of NDVI. This residual represents the anthropogenic influence factor. and represent precipitation(mm) and temperature (°C), respectively. The precipitation and temperature data were normalized to 0 to 1 to eliminate the effect of the dimension. , is the coefficient of the partial regression analysis in the model, and the is regression intercept. is the random error. The drivers of vegetation change were distinguished according to the significance of the change in residuals, and when the change in NDVI residuals was significant, it indicated that the vegetation change was caused by human activities. Conversely, it indicates that vegetation changes are driven by climatic factors.
2.3.9. Correlation Analysis
We conducted a correlation analysis using MATLAB R2017b software to explore the driving factors that influence seasonal NDVI changes in the Wuliangsu Lake Basin area. Specifically, we analyzed the correlation between seasonal meteorological factors (i.e., precipitation and temperature), human activities, and the NDVI from 1990 to 2020. The formula is as follows (20).
where r is the correlation coefficient, when r > 0 represents the positive correlation, when r < 0 represents negative correlation. The range of its value is [−1,1]. Where y is the climatic factor (precipitation and temperature) and human activity, and are the means of the variables during the research period, is the variables of i the month of the year.
3. Results
3.1. Analysis of NDVI Dynamic Change Characteristics
Figure 3 shows the characteristics of NDVI changes in the Wuliangsu Lake Basin from 1990 to 2020, with an overall trend of increasing and then decreasing. From January to March, the monthly NDVI values are above 0.03, peaking in July and August and gradually decreasing from September to December. From 1990 to 2010, the overall monthly NDVI values are slowly increasing, with monthly maximum values varying in the range of 0.35 to 0.40. Compared with 1990 to 2010, the monthly NDVI increases at a larger rate from 2011 to 2020, with the highest monthly value reaching 0.5, which to a certain extent also indicates that the vegetation is in the process of slow recovery and the ecological environment has been improved.
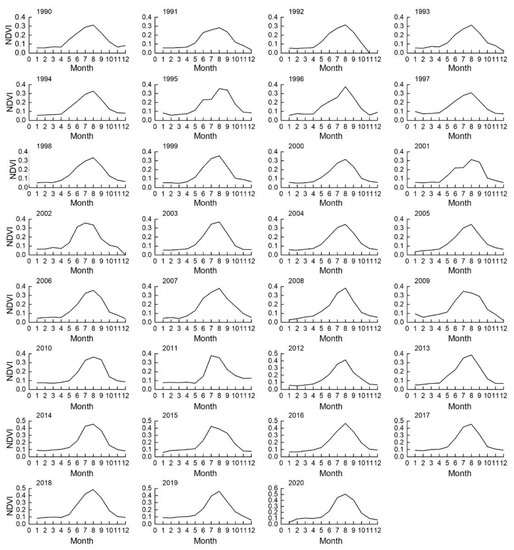
Figure 3.
Time series plot of the monthly NDVI from 1990 to 2020 in the Wuliangsu Lake Basin region.
Figure 4 shows the statistical plots of the minimum, mean and standard deviation values of the NDVI in the Wuliangsu Lake basin area from 1990 to 2020. The mean NDVI variation ranges from 0.301 to 0.546. The stdDev values of NDVI ranges from 0.172 to 0.346. However, the NDVI minimum does not follow a clear variation pattern although both the total NDVI mean and stdDev values show an increasing variation trend.
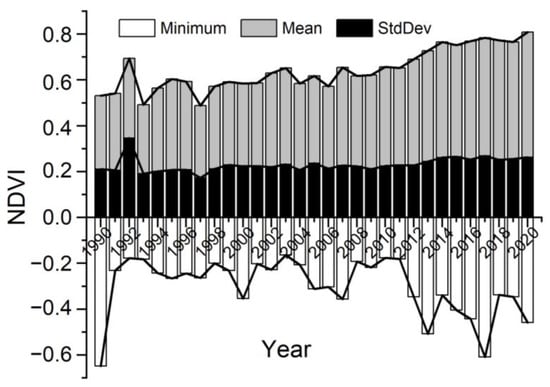
Figure 4.
The mean, minimum and stdDev values of the NDVI in the Wuliangsu Lake Basin area from 1990 to 2020.
The trend changes from 1990 to 2000, 2001 to 2010, 2011 to 2020, and 1990 to 2020 are shown in Figure 5. The trend rate for the Wuliangsu Lake Basin area from 1990 to 2020 was 0.0089 yr−1, indicating an improvement in vegetation over the past 30 years. The trend rates for the periods 1990–2000, 2001–2010, and 2011–2020 were 0.0035 yr−1, 0.0037 yr−1, and 0.0102 yr−1, respectively, with a gradual increase observed over the three stages. Notably, the trend rate in the period 2011–2020 showed a sharp increase compared to the previous two periods (1990–2000 and 2001–2010).
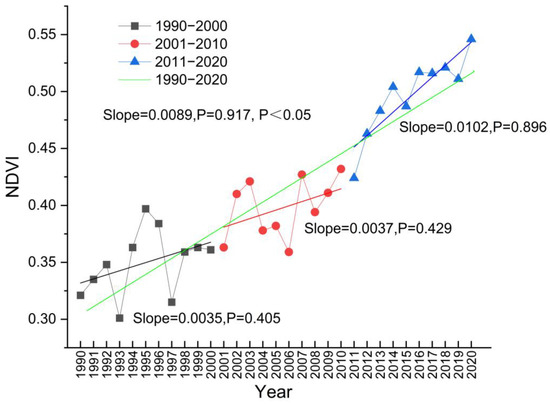
Figure 5.
Time series plot of NDVI trends in the Wuliangsu Lake Basin region for the four periods (1990–2000, 2001–2010, 2011–2020, and 1990–2020).
We used the MATLAB R2017b software to calculate the spatial trend of the NDVI in the Wuliangsu Lake Basin area from 1990 to 2020, and the results are shown in Figure 6. The result shows that the spatial distribution of the NDVI in the Wuliangsu Lake Basin area has exhibited an increasing trend from 1990 to 2020. NDVI trends in the Wuliangsu Lake Basin region showed spatial significance. The annual rate of change in the NDVI in the Wuliangsu Lake Basin is 0.0029 yr−1. Spatially, it exhibited a trend of high in the middle and low in the east and west, mainly in the Dengkou region and the mining region of Urad Qianqi. The areas showing a decrease are mainly distributed around the cities of Linhe and Wuyuan.
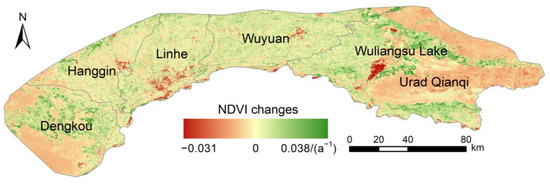
Figure 6.
Spatial distribution of NDVI changes in the Wuliangsu Lake Basin area from 1990 to 2020.
3.2. Characteristics of NDVI Phenological Variation
We used Matlab2017b software to construct and filter NDVI data from 1990 to 2000, 2001 to 2010 and 2011 to 2020 in the Wuliangsu Lake Basin area. Then, we calculated the information of physical changes in these three time periods in the Wuliangsu Lake Basin area according to Equations (2)–(4), and the results are shown in Figure 7.
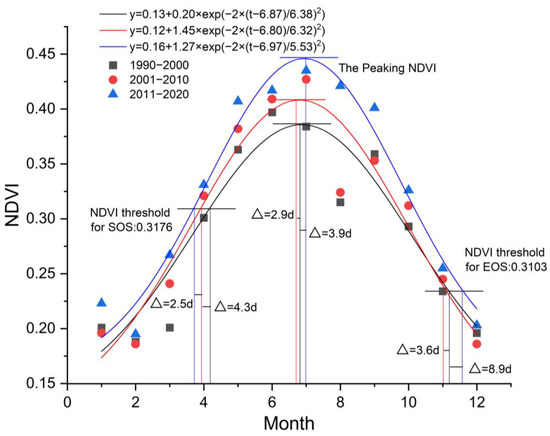
Figure 7.
Curves of SOS and EOS in the Wuliangsu Lake Basin area from 1990 to 2000, 2001 to 2010, and 2011 to 2020.
There are differences in the SOS and EOS changes between the three time periods 1990–2000, 2001–2010, and 2011–2020. We set the SOS threshold at 0.3176, and compared to the period 1990–2000, the SOS values in 2001 to 2010 and 2011 to 2020 advanced by 4.3 days and 6.8 days, respectively. Then, we set the EOS threshold at 0.3103, and compared to the period 1990–2000, the EOS values in 2001 to 2011 advanced by 3.6 days, while in 2011 to 2020 they were delayed by 8.9 days. Finally, we observed the peak NDVI values during these three periods, and compared to the period 1990–2000, the peak values in 2001 to 2010 and 2011 to 2020 were delayed by 2.9 days and 3.9 days, respectively.
3.3. Spatial Distribution Characteristics of the NDVI
We calculated the spatial trend changes in the NDVI in the Wuliangsu Lake Basin area from 1990 to 2020 by the Theil–Sen median, the Mann–Kendall Z value method, and finally passed the significance test of = 0.05, and the results are shown in Figure 8a–c. The NDVI in Hanggin, Linhe, and the northwest of Dengkou showed a significant increasing trend, accounting for 50.97% of the Wuliangsu Lake Basin area. Additionally, the NDVI in the eastern part of Urad Qianqi and the southwest of Dengkou showed a significant decreasing trend, accounting for 36.90% of the Wuliangsu Lake Basin area. The NDVI changes in the southern part of Linhe and a small part of the northern region are not significant, accounting for 12.12% of the Wuliangsu Lake Basin area.
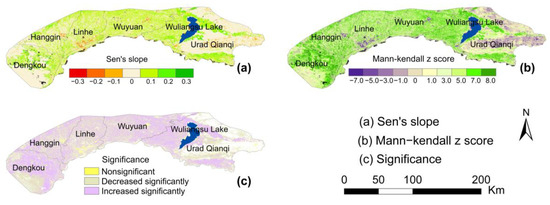
Figure 8.
The spatial distribution of Sen’s slope (a), the spatial distribution of the Mann–Kendall Z score (b), and the significance of NDVI changes through = 0.05 (c) for the Wuliangsu Lake Basin area from 1990 to 2020. (Non-significant 12.12%, decreased significantly 36.90%, and increased significantly 50.97%).
We used the formula of the Hurst index to obtain the spatial distribution map of sustainable changes in the Wuliangsu Lake Basin area from 1990 to 2020, and the results are shown in Figure 9. The annual Hurst index over the entire Wuliangsu Lake Basin increased at a rate of 0.432 yr−1. Spatially, it exhibited a trend of low in the middle and high in the east and west, especially high values mainly in the Dengkou region and the mining region of Urad Qianqi.
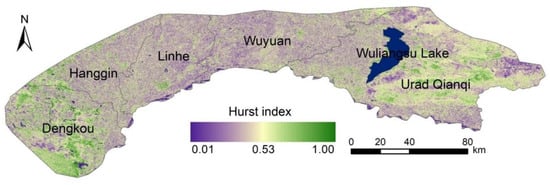
Figure 9.
The spatial distribution of the Hurst index in the Wuliangsu Lake Basin area from 1990 to 2020.
3.4. Spatial Distribution Characteristics of Sustainability of NDVI Changes
The sustainability of NDVI change in the Wuliangsu Lake Basin area was obtained by the spatial overlay of the NDVI change trend, the Theil–Sen median, the Mann–Kendall test, and the Hurst index, as shown in Figure 10, Table 3. The results show that the Wuliangsu Lake basin area is in a state of significant improvement, accounting for 49.10% of the total area. The area of vegetation maintaining a stable state accounts for 40.25%, and the area of continuous improvement is distributed throughout the region, while the area of continuous vegetation degradation is mainly distributed in the northwest and southwest regions. The percentage of regions with other types of changes is less than 5.00%.
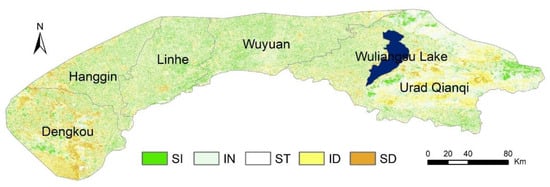
Figure 10.
Sustainability of NDVI trends in the Wuliangsu Lake Basin area from 1990 to 2020. Notes: Significant improvement (SI), insignificant improvement (IN), stable (ST), insignificant degradation (ID) and significant degradation (SD).

Table 3.
Proportions of sustainable area for interannual trends in vegetation from 1990 to 2020.
3.5. Correlation Analysis of the NDVI and Climate Change
We used MATLAB R2017 software to generate spatial distribution maps of precipitation and temperature data for the four seasons (spring, summer, autumn, and winter) from January to December 1990 to 2020 in the Wuliangsu Lake Basin area. The maximum synthesis method was used, and the resulting maps are presented in Figure 11 and Figure 12.
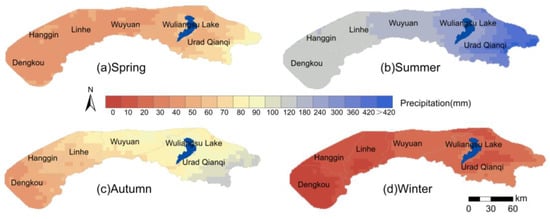
Figure 11.
The spatial distributions of precipitation in the Wuliangsu Lake Basin area from 1990 to 2020.
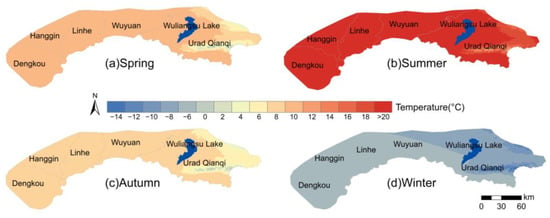
Figure 12.
The spatial distributions of temperature in the Wuliangsu Lake Basin area from 1990 to 2020.
The seasonal climate in the Wuliangsu Lake basin exhibited a high-to-low gradient from west to east (Figure 11). In the Urad Qianqi region, precipitation in spring showed an increase in the southwestern area. In summer, both the eastern and western parts of the Wuliangsu Lake Basin area exhibited a decreasing trend in precipitation, with variations ranging from 73 to 246 mm. Most regions experienced a decrease in precipitation during autumn, with a consistent trend observed in winter.
The seasonal temperature in most parts of the Wuliangsu Lake Basin area showed an increasing trend from 1990 to 2020 (Figure 12). On a seasonal scale, the overall trend is similar in spring and summer, with annual rates of change of 10.15 °C and 22.98 °C, respectively, with a decrease in the eastern mining region. The rates of change in temperature in autumn and winter were 8.07 °C and −7.69 °C, respectively, with a significant downward trend in temperature in the western region.
We calculated the correlation between the seasonal NDVI and climate factors in the Wuliangsu Lake Basin area from 1990 to 2020, respectively.
Figure 13 shows the correlation between the seasonal NDVI and seasonal precipitation in the Wuliangsu Lake Basin varied significantly between 1990 and 2020. On the seasonal scale, the vegetation and precipitation in the northern part of Wuyuan and Urad Qianqi showed positive correlation in spring, and the positive correlation coefficient between vegetation and precipitation near the Wuliangsu Lake Basin was as high as 0.56. significantly higher than the rest of the season. In Dengkou, Hanggin and the eastern part of Urad Qianqi, spring vegetation had a significant negative correlation with precipitation ( = 0.05). The summer was similar to the spring, but the positive correlation increased to 0.57 in the area east of the basin ( = 0.05). Vegetation and precipitation in autumn showed a positive correlation throughout the region that was different from that of other seasons. The Wuliangsu Lake Basin area has low precipitation and low temperature in winter, and most of the vegetation is positively correlated with precipitation ( = 0.05).
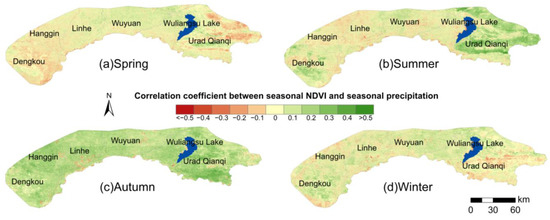
Figure 13.
The correlation coefficients between the seasonal NDVI and precipitation in the Wuliangsu Lake Basin area from 1990 to 2020.
Figure 14 shows the correlation between the seasonal NDVI and seasonal temperature in the Wuliangsu Lake Basin changed significantly from 1990 to 2020. The Wuliangsu Lake Basin generally showed a significant negative correlation. On the seasonal scale, there is some variability between spring and summer, but in areas such as Dengkou, the correlation in spring shows a significant negative correlation different from the other seasons. The autumn and winter seasons show significantly opposite correlations in the east, a significant negative correlation in the fall in the east, and a significant positive correlation in the winter. In areas such as the eastern part of the former Urad Qianqi, where agricultural activities are frequent, there is a more obvious positive correlation between vegetation and summer and winter temperatures. Within the same physiographic region, the relationship between NDVI change, and climate change is significantly different in areas with developed urbanization compared to localized areas. Therefore, activities such as human agricultural settlement and urban construction affect the response of vegetation to climate change.
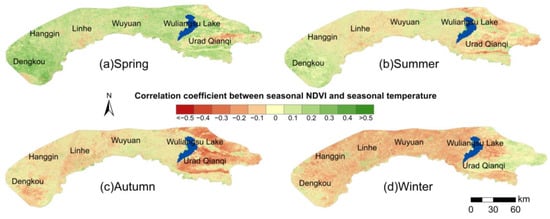
Figure 14.
The correlation coefficients between the seasonal NDVI and temperature in the Wuliangsu Lake Basin area from 1990 to 2020.
We calculated the correlation between the seasonal NDVI and seasonal precipitation and temperature in order to analyze the differences in spatially significant distributions in different regions, and the results also passed the significance test of = 0.05.
Figure 15 showed that all passed the significance test, with higher values indicating greater significance. Significance tests were significantly higher in spring and summer than in autumn and winter. It is mainly distributed in the northeast of Urad Qianqi in spring and in the central region in summer. The significant areas in spring and winter are mainly distributed in the Dengkou region.
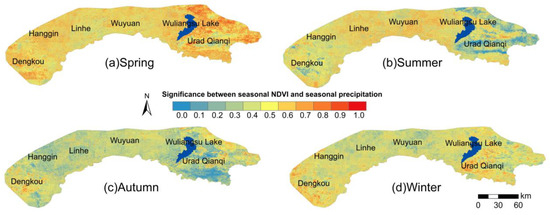
Figure 15.
The significance test between the seasonal NDVI and precipitation in the Wuliangsu Lake Basin area from 1990 to 2020.
Figure 16 showed that all passed the significance test, with higher values indicating greater significance. Significance tests were significantly higher in summer and autumn than in spring and winter. It is distributed in the northeast and scattered in the central part of Urad Qianqi in spring, and in the central part in summer and autumn. The significant areas in autumn and winter are mainly distributed in the Dengkou region.
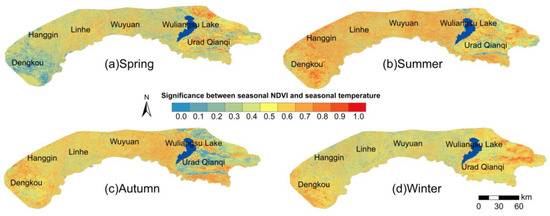
Figure 16.
The significance test between the seasonal NDVI and temperature in the Wuliangsu Lake Basin area from 1990 to 2020.
3.6. Correlation Analysis of the NDVI and Human Activities
Firstly, we used a regression model based on climate factors (i.e., precipitation and temperature) to obtain predicted values of meteorological factors characterizing the Wuliangsu Lake Basin area from 1990 to 2020. Then, by subtracting the 1990 to 2020 predicted values of meteorological factors from the 1990 to 2020 time series of the NDVI obtained from remote sensing, we obtained a dataset representing human activity impact factors in the Wuliangsu Lake Basin area from 1990 to 2020 (Figure 17). The Dengkou and Urad Qianqi region experienced a significant increase in vegetation growth between 1990 and 2020, with a change rate of 0.028/a. However, the central region showed a decreasing trend in vegetation growth, with NDVI residuals declining by as much as −0.025/a. These findings suggest that there is spatial variability in the trends of NDVI residuals across the study area.
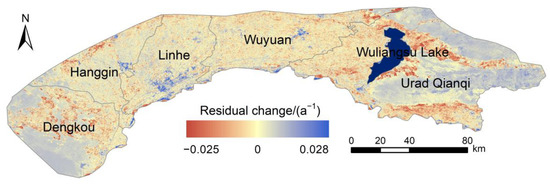
Figure 17.
Trends of NDVI residuals change in the Wuliangsu Lake Basin area from 1990 to 2020.
We obtained the spatial distribution data characterizing the changes in human activities from 1990 to 2020. Then, the correlation between the NDVI and human activities for 1990 to 2020 was calculated using the correlation analysis and eventually passed the significance test (Figure 18). Based on Figure 18a, there appears to be a strong correlation between the annual NDVI and human activities across most of the Wuliangsu Lake Basin area, with only a small part of Dengkou showing a weak correlation. After the significance test according to Figure 18b, the annual NDVI of the Wuliangsu Lake Basin area is significantly significant with human activities.

Figure 18.
Correlation (a) and significance (b) of the annual NDVI with human activities in the Wuliangsu Lake Basin area from 1990 to 2020.
3.7. Influence of Human Activities and Climate Factors
The statistics based on the significant change in NDVI residuals (p value) and the overlay of the average NDVI trend are shown in Figure 19. The results show that the areas affected by human activities are mainly located in the west and east. The areas showing degradation are located in the central part, which are Linhe and Wuyuan areas, respectively. The area of with positive contribution of human activities to NDVI changes in forest and grasslands accounted for 6.89% and 2.14%, respectively. Among the vegetation changes in the Wuliangsu Lake Basin, the proportion of the area affected by climate change and human activities in forest land accounted for 12.42% and 10.78%, respectively, indicating that forest land was affected by climate change more extensively (Table 4). In the Dengkou area, climate change is the main factor influencing vegetation degradation, while in the Urad Qianqi area, vegetation improves and vegetation degradation is mainly affected by human activities.
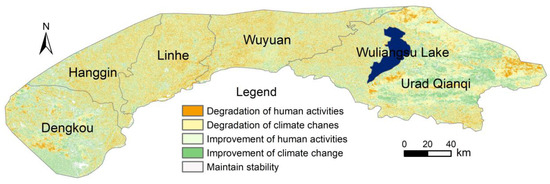
Figure 19.
Significant trend of NDVI residual changes in the Wuliangsu Lake Basin area from 1990 to 2020.

Table 4.
Effects of climate change and human activities on NDVI change in the Wuliangsu Lake Basin area from 1990 to 2020 (%).
4. Discussion
4.1. Response Relationship between NDVI Changes and Phenology
The results of the study on the phenological period of the Wuliangsu Lake Basin area showed that the SOS of the area was advanced, while the EOS was relatively lagged. Many studies have shown that SOS is advanced, or EOS is delayed when the weather gets warmer [55], and the SOS advance or EOS delay was faster in 2002 to 2012 than in 1982, which is consistent with our study [56]. Due to the low annual average temperature and prevalence of cold-resistant vegetation in the Wuliangsu Lake Basin area, it is necessary to take into account the varying effects of climatic factors on different vegetation types. As previously mentioned, there is a notable correlation between temperature and phenological changes during both spring and autumn [57,58]. The EOS delay in the Wuliangsu Lake Basin area from 2011 to 2020 has ended [59,60]. Other scholars’ research results have shown that the EOS is controlled by temperature, especially in late summer and autumn. The differences in crop rotation, sowing, harvesting, and other agricultural timings in the Wuliangsu Lake Basin area can also affect the phenological changes in some vegetation in different years. Since these agricultural timings can be controlled through human management, they should also be considered as a factor influencing the phenological changes in the Wuliangsu Lake Basin area. Other findings reveal that differences in phenology across study areas can be influenced by satellite records, data processing procedures, phenology extraction methods, or other aspects [61]. We also need to consider factors such as soil temperature and short-wave radiation in the future studies.
4.2. Spatial Variation of the NDVI and Seasonal Climate Response Patterns
In the context of global warming, the Wuliangsu Lake Basin region exhibits obvious spatial heterogeneity in NDVI change, which is primarily determined by large-scale hydrothermal conditions. The increase in temperature generally has a positive effect on vegetation growth in the Wuliangsu Lake Basin area, moisture can promote vegetation growth in arid areas [62,63]. Climate change is the primary factor affecting vegetation activity in the eastern regions. Conversely, in the western and central regions, scarce summer rainfall exacerbates land desertification to some extent. Here, a positive correlation coefficient of 0.57 exists between NDVI and precipitation, while the correlation with temperature is negative and as high as −0.49. Temperature is the main driver of vegetation improvement in eastern Urad Qainqi. These areas have sufficient precipitation and show a significant positive correlation between temperature and seasonal NDVI. The vegetation type in the central areas such as Wuyuan and Linhe and around the watershed is grassland, which is relatively sensitive to climate change [64]. The summer temperature increased in the western region, and the correlation coefficient with the NDVI reached 0.52, and the temperature was the main driver to promote the vegetation growth in this region. In addition, extreme weather can inhibit vegetation growth.
4.3. Patterns of Anthropogenic Effects on NDVI Changes
Human activities are among the main drivers of vegetation change in the Wuliangsu Lake basin area. During 1990 to 2020, the vegetation in most areas of Dengkou improved and only a few areas were degraded, and the vegetation changes in these areas were mainly influenced by human activities, including the project of returning farmland to forest, Alashan desert management, and the ecological restoration project. Forest area in the Wuliangsu Lake basin is growing slowly, desertification is increasing and then decreasing, and the rate of grassland degradation is decreasing [65]. In the mining areas of the ecological restoration projects led by the government, artificial planting, reforestation, natural protection and erosion control, and other ecological protection projects are the main drivers of the increase in vegetation cover. Since the 1990s, a multi-phase ecological restoration project (plantation) has been implemented in the Dengkou area, which has contributed to the restoration of the cave ecosystem [22,23]. In fact, the construction of ecological engineering is a long-term process that still requires long-term practice, and the government should consider the prospect of sustainable development of nature and economy and society when planning strategies.
The results of the study indicate that the NDVI in the Wuliangsu Lake basin area has obvious regional characteristics and is vulnerable to both climate and human activities due to the instability of the ecosystem. This is generally consistent with existing studies at the large scale, but there are some differences at the regional scale. From 1990 to 2020, the vegetation in the Wuliangsu Lake basin area has been effectively managed and restored, and the temperature has increased in favor of photosynthesis of mine vegetation, thus increasing net productivity [47,48,49,50]. In addition, human activities such as enclosure of nature reserves and implementation of ecological construction projects can contribute to the recovery of vegetation in local areas [63]. However, in the northern fragile zone areas, the greater temperature increase exacerbates water scarcity and reduces the efficiency of nutrient transport, which has a negative impact on vegetation growth. The inhibitory effects of human activities such as urban expansion and agricultural settlement on vegetation growth are obvious in large urban agglomerations [66], and the results of the above studies are generally consistent with the results of this paper.
In this paper, two climate factors, precipitation and temperature, were selected for multivariate residual analysis. In fact, vegetation change is a complex process. In addition to climate change, the NDVI is also influenced by topography, location, soil, and elevation [4,67,68]. The hysteresis effect of vegetation and climate change is still not studied in the paper. Additionally, there are differences in the response mechanisms and thresholds of vegetation growth to drivers in different regions, which still need to be further addressed. We will focus on probing the delayed response of vegetation to climate and identifying the significant human activity factors to provide an important theoretical basis for ecological restoration efforts.
5. Conclusions
This paper examines the spatial and temporal variations in the NDVI in the Wuliangsu Lake Basin area between 1990 to 2020. It distinguishes the relative impacts of climate factors and human activities on the seasonal NDVI changes and identifies areas where human activities have led to vegetation degradation. (1) The vegetation change in the Wuliangsu Lake basin area has obvious regional characteristics spatially. The overall vegetation greenness is an increasing trend, with an average change rate of 0.038/a, spatially showing an increasing trend from east to west. Due to global warming, the start of the growing season (SOS) is 4.3 days (2001 to 2010) and 6.8 days (2011 to 2020) earlier compared with 1990 to 2000. The end of the season (EOS) is advanced by 3.6 days (2001 to 2010), and delayed by 8.9 days (2011 to 2020). (2) The NDVI in most areas of the Wuliangsu Lake basin is in a state of continuous and steady rise. Continuous improvement of vegetation in the eastern region, while there is continuous vegetation degradation in the central region. Grassland and woodland tend in the Wuliangsu Lake Basin area are unstable and vulnerable to natural climate change and human activities, both of which have positive and negative effects. (3) Seasonal changes in the Wuliangsu Lake basin show variability, with the seasonal (spring, summer, autumn, and winter) NDVI showing different correlations for precipitation and temperature. (4) The gradual intensification of human activities since the 21st century has improved vegetation growth overall. Anthropogenic impacts include vegetation improvement in Dengkou, west central and northern Hangjin, and most of the southwest, and vegetation degradation in cultivated areas in the northeast. These human activities include soil and water conservation and reforestation projects, Alashan desert management, construction of urban clusters and industrial bases. This study can provide a reference for developing regional climatic, anthropogenic vegetation resource management and management programs in arid and semi-arid lake basin areas.
The variation of the NDVI in the Wuliangsu Lake Basin area is influenced by seasonality. With the intervention of human activities, it is likely that the ecological improvement will continue until the middle of this century. However, the lag and consistency of climate (seasonal) effects on the NDVI needs in-depth studies. Exploring deeper evolutionary patterns and mechanisms is still the focal point of future research.
Author Contributions
Conceptualization, C.L., X.J. and X.Z.; methodology, C.L. and X.Z.; software, C.L.; validation, C.L., X.J. and X.Z.; formal analysis, C.L., R.Z., X.M. and D.W.; investigation, C.L.; resources, X.Z.; data curation, C.L. and X.J.; writing—original draft preparation, C.L.; writing—review and editing, C.L.; visualization, C.L.; supervision, X.Z.; project administration, X.Z. and X.M.; funding acquisition, X.Z. All authors have read and agreed to the published version of the manuscript.
Funding
This research was funded by the Science and Technology R&D Program of the China State Construction Engineering Corporation (CSCEC), “Research and Application of Key Technologies for Restoration of Ecological Environmental Protection in Northwest China” (Grant number, CSCEC-2020-Z-5) and the National Key Research and Development Program of China “Cooper-ation project between China and Europe in Earth Observation on forest monitoring technology and demonstration applications” (2021YFE0117700) and Dragon 5 Cooperation (ID: 59257).
Acknowledgments
We would like to thank the Zhiyuan Li and Xiaoyan Xiong from the Yangtze University and Beijing Forestry University for their help in this paper.
Conflicts of Interest
The authors declare that they have no known competing financial interest or personal relationship that could have appeared to influence the work reported in this paper.
References
- Piao, S.; Fang, J.; Liu, H.; Zhu, B. NDVI-indicated decline in desertification in China in the past two decades. Geophys. Res. Lett. 2005, 32, 6. [Google Scholar] [CrossRef]
- Yang, X.; Zhang, K.; Jia, B.; Ci, L. Desertification assessment in China: An overview. J. Arid. Environ. 2005, 63, 517–531. [Google Scholar] [CrossRef]
- Hu, Y.; Raza, A.; Syed, N.R.; Acharki, S.; Ray, R.L.; Hussain, S.; Dehghanisanij, H.; Zubair, M.; Elbeltagi, A. Land Use/Land Cover Change Detection and NDVI Estimation in Pakistan’s Southern Punjab Province. Sustainability 2023, 15, 3572. [Google Scholar] [CrossRef]
- Ghaderpour, E.; Mazzanti, P.; Mugnozza, G.S.; Bozzano, F. Coherency and phase delay analyses between land cover and climate across Italy via the least-squares wavelet software. Int. J. Appl. Earth Obs. 2023, 118, 103241. [Google Scholar] [CrossRef]
- Al-Kindi, K.M.; Al Nadhairi, R.; Al Akhzami, S. Dynamic Change in Normalised Vegetation Index (NDVI) from 2015 to 2021 in Dhofar, Southern Oman in Response to the Climate Change. Agriculture 2023, 13, 592. [Google Scholar] [CrossRef]
- Maeda, E.E.; Pellikka, P.K.E.; Siljander, M.; Clark, B.J.F. Potential impacts of agricultural expansion and climate change on soil erosion in the Eastern Arc Mountains of Kenya. Geomorphology 2010, 123, 279–289. [Google Scholar] [CrossRef]
- Xin, Z.; Yu, X.; Lu, X. Factors controlling sediment yield in China’s Loess Plateau. Earth Surf. Process. Land. 2011, 36, 816–826. [Google Scholar] [CrossRef]
- Jagadish, S.V.; Way, D.A.; Sharkey, T.D. Scaling plant responses to high temperature from cell to ecosystem. Plant Cell Environ. 2021, 44, 1987–1991. [Google Scholar] [CrossRef] [PubMed]
- Duo, A.; Zhao, W.; Qu, X.; Jing, R.; Xiong, K. Spatio-temporal variation of vegetation coverage and its response to climate change in North China plain in the last 33 years. Int. J. Appl. Earth Obs. 2016, 53, 103–117. [Google Scholar] [CrossRef]
- Pang, G.; Wang, X.; Yang, M. Using the NDVI to identify variations in, and responses of, vegetation to climate change on the Tibetan Plateau from 1982 to 2012. Quatern. Int. 2017, 444, 87–96. [Google Scholar] [CrossRef]
- Zhou, X.; Yamaguchi, Y.; Arjasakusuma, S. Distinguishing the vegetation dynamics induced by anthropogenic factors using vegetation optical depth and AVHRR NDVI: A cross-border study on the Mongolian Plateau. Sci. Total Environ. 2018, 616–617, 730–743. [Google Scholar] [CrossRef]
- Zhang, L.; Ding, M.J.; Zhang, H.M.; Wen, C. Spatiotemporal variation of the vegetation coverage in Yangtze River basin during 1982–2015. J. Nat. Resour. 2018, 33, 2084–2097. [Google Scholar] [CrossRef]
- Garcia-Ruiz, J.M. The effects of land uses on soil erosion in Spain: A review. Catena 2010, 81, 1–11. [Google Scholar] [CrossRef]
- Mohammad, A.G.; Adam, M.A. The impact of vegetative cover type on runoff and soil erosion under different land uses. Catena 2010, 81, 97–103. [Google Scholar] [CrossRef]
- Xu, L.; Myneni, R.B.; Chapin Iii, F.S.; Callaghan, T.V.; Pinzon, J.E.; Tucker, C.J.; Zhu, Z.; Bi, J.; Ciais, P.; Tommervik, H.; et al. Temperature and vegetation seasonality diminishment over northern lands. Nat. Clim. Chang. 2013, 3, 581–586. [Google Scholar] [CrossRef]
- Piao, S.; Mohammat, A.; Fang, J.; Cai, Q.; Feng, J. NDVI-based increase in growth of temperate grasslands and its responses to climate changes in China. Glob. Environ. Chang. 2006, 16, 340–348. [Google Scholar] [CrossRef]
- Peng, S.; Chen, A.; Xu, L.; Cao, C.; Fang, J.; Myneni, R.B.; Pinzon, J.E.; Tucker, C.J.; Piao, S. Recent change of vegetation growth trend in China. Environ. Res. Lett. 2011, 6, 044027. [Google Scholar] [CrossRef]
- Jin, K.; Wang, F.; Han, J.Q.; Shi, S.; Ding, W. Contribution of climatic change and human activities to vegetation NDVI change over China during 1982–2015. Acta Geogr. Sin. 2020, 75, 961–974. [Google Scholar] [CrossRef]
- Shen, Q.; Cong, Z.; Lei, H. Evaluating the impact of climate and underlying surface change on runoff within the Budyko framework: A study across 224 catchments in China. J. Hydrol. 2017, 554, 251–262. [Google Scholar] [CrossRef]
- Hu, K.H.; Zhang, Z.; Gao, M.; Lu, Y. Variations in vegetation cover and natural factors of provinces in China along Silk Road Economic Belt during 2000–2018. Trans. CSAE 2020, 36, 149–157. [Google Scholar] [CrossRef]
- Liu, X.F.; Zhu, X.F.; Pan, Y.Z.; Li, Y.Z.; Zhao, A.Z. Spatiotemporal changes in vegetation coverage in China during 1982–2012. Acta Ecol. Sin. 2015, 35, 5331–5342. [Google Scholar] [CrossRef]
- Liu, J.Y.; Ning, J.; Kuang, W.; Xu, X.; Zhang, S.; Yan, C.Z.; Li, R.; Wu, S.; Hu, Y.; Du, G.; et al. Spatio-temporal patterns and characteristics of land-use change in China during 2010–2015. Acta Geogr. Sin. 2018, 73, 789–802. [Google Scholar] [CrossRef]
- You, N.H.; Dong, J.W.; Xiao, T.; Liu, J.; Xiao, X. The effects of the “Grain for Green” project on gross primary productivity in the Loess Plateau. Sci. Geogr. Sin. 2020, 40, 315–323. [Google Scholar] [CrossRef]
- Fan, J.Z.; Li, D.K.; Dong, J.F. Remote sensing analysis of vegetation restoration in key ecological construction areas of Shaanxi province. Trans. CSAE 2012, 28, 228–234. [Google Scholar]
- Zhao, A.Z.; Pei, T.; Cao, S.; Zhang, A.; Fan, Q.; Wang, J. Impacts of urbanization on vegetation growth and surface urban heat island intensity in the Beijing-Tianjin-Hebei. China Environ. Sci. 2020, 40, 1825–1833. Available online: http://www.zghjkx.com.cn/EN/Y2020/V40/I4/1825 (accessed on 10 May 2022).
- Bardgett, R.D.; Bullock, J.M.; Lavorel, S.; Manning, P.; Schaffner, U.; Ostle, N.; Chomel, M.; Durigan, G.; Fry, E.L.; Johnson, D.; et al. Combatting global grassland degradation. Nat. Rev. Earth Environ. 2021, 2, 720–735. [Google Scholar] [CrossRef]
- Chen, X.; Yu, L.; Du, Z.; Xu, Y.; Zhao, J.; Zhao, H.; Zhang, G.; Peng, D.; Gong, P. Distribution of ecological restoration projects associated with land use and land cover change in China and their ecological impacts. Sci Total Environ. 2022, 825, 153938. [Google Scholar] [CrossRef]
- Jia, X.; Jin, Z.; Mei, X.; Wang, D.; Zhu, R.; Zhang, X.; Huang, Z.; Li, C.; Zhang, X. Monitoring and Effect Evaluation of an Ecological Restoration Project Using Multi-Source Remote Sensing: A Case Study of Wuliangsuhai Watershed in China. Land 2023, 12, 349. [Google Scholar] [CrossRef]
- Albarakat, R.; Lakshmi, V. Comparison of Normalized Difference Vegetation Index Derived from Landsat, MODIS, and AVHRR for the Mesopotamian Marshes Between 2002 and 2018. Remote Sens. 2019, 11, 1245. [Google Scholar] [CrossRef]
- Loukas, A.; Vasiliades, L.; Tzabiras, J. Climate change effects on drought severity. Adv. Geosci. 2008, 17, 23–29. [Google Scholar] [CrossRef]
- Mehr, A.D.; Sorman, A.U.; Kahya, E. Climate change impacts on meteorological drought using SPI and SPEI: Case study of Ankara, Turkey. Hydrol. Sci. J. 2020, 65, 254–268. [Google Scholar] [CrossRef]
- Meresa, H.K.; Osuch, M.; Romanowicz, R. Hydro-meteorological drought projections into the 21-st century for selected Polish catchments. Water 2016, 8, 206. [Google Scholar] [CrossRef]
- Aksoy, H.; Cetin, M.; Eris, E.; Burgan, H.I.; Cavus, Y.; Yildirim, I.; Sivapalan, M. Critical drought intensity-duration-frequency curves based on total probability theorem-coupled frequency analysis. Hydrol. Sci. J. 2021, 66, 1337–1358. [Google Scholar] [CrossRef]
- Bannari, A.; Morin, D.; Bonn, F.; Huete, A. A review of vegetation indices. Remote Sens. Rev. 1995, 13, 95–120. [Google Scholar] [CrossRef]
- Houborg, R.; Soegaard, H.; Boegh, E. Combining vegetation index and model inversion methods for the extraction of key vegetation biophysical parameters using Terra and Aqua MODIS reflectance data. Remote Sens. Environ. 2007, 106, 39–58. [Google Scholar] [CrossRef]
- Huete, A.; Didan, K.; van Leeuwen, W.; Miura, T.; Glenn, E. MODIS vegetation indices. Land. Remote Sens. Glob. Environ. Chang. 2011, 11, 579–602. [Google Scholar]
- Pettorelli, N.; Vik, J.O.; Mysterud, A.; Gaillard, J.-M.; Tucker, C.J.; Stenseth, N.C. Using the satellite-derived NDVI to assess ecological responses to environmental change. Trends Ecol. Evol. 2005, 20, 503–510. [Google Scholar] [CrossRef]
- Zhao, H.; Gu, B.; Lindley, S.; Zhu, T.; Fan, J. Regulation factors driving vegetation changes in China during the past 20 years. J. Geogr. Sci. 2023, 33, 508–528. [Google Scholar] [CrossRef]
- Li, B.; Tao, S.; Dawson, R.W. Relations between AVHRR NDVI and eco-climatic parameters in China. Int. J. Remote Sens. 2002, 23, 989–999. [Google Scholar] [CrossRef]
- Wu, T.; Feng, F.; Lin, Q.; Bai, H. A spatio-temporal prediction of NDVI based on precipitation: An application for grazing management in the arid and semi-arid grasslands. Int. J. Remote Sens. 2020, 41, 2359–2373. [Google Scholar] [CrossRef]
- Chen, L.; Wei, W.; Fu, B.; Lü, Y. Soil and water conservation on the Loess Plateau in China: Review and perspective. Prog. Phys. Geogr. 2007, 31, 389–403. [Google Scholar] [CrossRef]
- Zhang, Y.; Ye, A. Spatial and temporal variations in vegetation coverage observed using AVHRR GIMMS and Terra MODIS data in the mainland of China. Int. J. Remote Sens. 2020, 41, 4238–4268. [Google Scholar] [CrossRef]
- Liu, J.Y.; Xu, X.L.; Shao, Q.Q. The spatial and temporal characteristics of grassland degradation in the Three-River Headwaters region in Qinghai Province. Acta Geogr. Sin. 2008, 63, 364–376. [Google Scholar] [CrossRef]
- Aneseyee, A.B.; Elias, E.; Soromessa, T.; Feyisa, G.L. Land use/land cover change effect on soil erosion and sediment delivery in the Winike watershed, Omo Gibe Basin, Ethiopia. Sci. Total Environ. 2020, 728, 138776. [Google Scholar] [CrossRef] [PubMed]
- Wang, Z.L.; Huang, Z.Q.; Li, J.; Ruida, Z.; Huang, W. Assessing impacts of meteorological drought on vegetation at catchment scale in China based on SPEI and NDVI. Trans. CSAE 2016, 32, 177–186. [Google Scholar] [CrossRef]
- Qin, D.H. Climate change science and sustainable development. Prog. Geogr. 2014, 33, 874–883. [Google Scholar] [CrossRef]
- Jiao, K.W.; Gao, J.B.; Wu, S.H.; Hou, W. Research progress on the response processes of vegetation activity to climate change. Acta Ecol. Sin. 2018, 38, 2229–2238. [Google Scholar] [CrossRef]
- Hutchinson, M.F. Interpolation of Rainfall Data with Thin Plate Smoothing Splines—Part I: Two-Dimensional Smoothing of Data with Short Range Correlation. J. Geogr. Inf. Decis. Anal. 1998, 2, 139–151. [Google Scholar]
- Savitzky, A.; Golay, M.J.E. Smoothing and differentiation of data by simplified least squares procedures. Anal. Chem. 1964, 36, 1627–1639. [Google Scholar] [CrossRef]
- Hurst, H.E. Long-term storage capacity of reservoirs. Trans. Am. Soc. Civ. Eng. 1951, 116, 770–799. [Google Scholar] [CrossRef]
- Mandelbrot, B.B.; Wallis, J.R. Robustness of the rescaled range R/S in the measurement of noncyclic long run statistical dependence. Water Resour. Res. 1969, 5, 967–988. [Google Scholar] [CrossRef]
- Jayaweera, G.R.; Mikkelsen, D.S. Assessment of ammonia volatilization from flooded soil systems. Adv. Agron. 1991, 45, 303–356. [Google Scholar] [CrossRef]
- Evans, J.; Geerken, R. Discrimination between climate and human-induced dryland degradation. J. Arid. Environ. 2004, 57, 535–554. [Google Scholar] [CrossRef]
- Stow, D.A.; Hope, A.; McGuire, D.; Verbyla, D.; Gamon, J.; Huemmrich, F.; Houston, S.; Racine, C.; Sturm, M.; Tape, K.; et al. Remote sensing of vegetation and land-cover change in Arctic Tundra ecosystems. Remote Sens. Environ. 2004, 89, 281–308. [Google Scholar] [CrossRef]
- Jochner, S.; Menzel, A. Does flower phenology mirror the slowdown of global warming? Ecol. Evol. 2015, 5, 2284–2295. [Google Scholar] [CrossRef] [PubMed]
- Li, Z.; Zhou, T.; Zhao, X.; Huang, K.; Gao, S.; Wu, H.; Luo, H. Assessments of Drought Impacts on Vegetation in China with the Optimal Time Scales of the Climatic Drought Index. Int. J. Environ. Res. Public Health 2015, 12, 7615–7634. [Google Scholar] [CrossRef]
- Vitasse, Y.; Delzon, S.; Dufrêne, E.; Pontailler, J.Y.; Louvet, J.M.; Kremer, A.; Michalet, R. Leaf phenology sensitivity to temperature in European trees: Do within-species populations exhibit similar responses? Agric. For. Meteorol. 2009, 149, 735–744. [Google Scholar] [CrossRef]
- Miller-Rushing, A.J.; Primack, R.B. Global warming and flowering times in Thoreau’s Concord: A community perspective. Ecology 2008, 89, 332–341. [Google Scholar] [CrossRef]
- Estrella, N.; Menzel, A. Responses of leaf colouring in four deciduous tree species to climate and weather in Germany. Clim. Res. 2006, 32, 253–267. [Google Scholar] [CrossRef]
- Delpierre, N.; Dufrêne, E.; Soudani, K.; Ulrich, E.; Cecchini, S.; Boé, J.; François, C. Modelling interannual and spatial variability of leaf senescence for three deciduous tree species in France. Agric. For. Meteorol. 2009, 149, 938–948. [Google Scholar] [CrossRef]
- Zeng, H.; Jia, G.; Epstein, H. Recent changes in phenology over the northern high latitudes detected from multi-satellite data. Environ. Res. Lett. 2011, 6, 045508. [Google Scholar] [CrossRef]
- Feng, X.; Fu, B.; Piao, S.; Wang, S.; Ciais, P.; Zeng, Z.; Lü, Y.; Zeng, Y.; Li, Y.; Jiang, X. Revegetation in China’s Loess Plateau is approaching sustainable water resource limits. Nat. Clim. Chang. 2016, 6, 1019–1022. [Google Scholar] [CrossRef]
- Sun, W.; Song, X.; Mu, X.; Gao, P.; Wang, F.; Zhao, G. Spatiotemporal vegetation cover variations associated with climate change and ecological restoration in the Loess Plateau. Agric. For. Meteorol. 2015, 209, 87–99. [Google Scholar] [CrossRef]
- Huang, T.; Wu, Z.; Xiao, P.; Sun, Z.; Liu, Y.; Wang, J.; Wang, Z. Possible Future Climate Change Impacts on the Meteorological and Hydrological Drought Characteristics in the Jinghe River Basin, China. Remote Sens. 2023, 15, 1297. [Google Scholar] [CrossRef]
- Fu, B.J.; Meng, Q.H.; Qiu, Y.; Zhao, W.W.; Zhang, Q.J.; Davidson, D.A. Effects of land use on soil erosion and nitrogen loss in the hilly area of the Loess Plateau, China. Land. Degrad. Dev. 2004, 15, 87–96. [Google Scholar] [CrossRef]
- Yu, L.; Wu, Z.T.; Du, Z.Q.; Zhang, H.; Liu, Y. Quantitative analysis of the effects of human activities on vegetation in the Beijing-Tianjin sandstorm source region under the climate change. Chin. J. Appl. Ecol. 2020, 31, 2007–2014. [Google Scholar] [CrossRef]
- Lü, Y.; Zhang, L.; Feng, X.; Zeng, Y.; Fu, B.; Yao, X.; Li, J.; Wu, B. Recent ecological transitions in China: Greening, browning and influential factors. Sci. Rep. 2015, 5, 8732. [Google Scholar] [CrossRef] [PubMed]
- Descals, A.; Verger, A.; Yin, G.F.; Peñuelas, J. A threshold method for robust and fast estimation of land-surface phenology using Google Earth Engine. IEEE J.-Stars 2021, 14, 601–606. [Google Scholar] [CrossRef]
Disclaimer/Publisher’s Note: The statements, opinions and data contained in all publications are solely those of the individual author(s) and contributor(s) and not of MDPI and/or the editor(s). MDPI and/or the editor(s) disclaim responsibility for any injury to people or property resulting from any ideas, methods, instructions or products referred to in the content. |
© 2023 by the authors. Licensee MDPI, Basel, Switzerland. This article is an open access article distributed under the terms and conditions of the Creative Commons Attribution (CC BY) license (https://creativecommons.org/licenses/by/4.0/).