Review

Industry- and Academic-Based Trends in Pavement Roughness Inspection Technologies over the Past Five Decades: A Critical Review

Department of Building and Real Estate, The Hong Kong Polytechnic University, Hong Kong
*
Author to whom correspondence should be addressed.
Remote Sens. 2023, 15(11), 2941; https://doi.org/10.3390/rs15112941
Submission received: 10 April 2023 / Revised: 19 May 2023 / Accepted: 1 June 2023 / Published: 5 June 2023
(This article belongs to the Special Issue Road Detection, Monitoring and Maintenance Using Remotely Sensed Data)

Abstract

:
Roughness is widely used as a primary measure of pavement condition. It is also the key indicator of the riding quality and serviceability of roads. The high demand for roughness data has bolstered the evolution of roughness measurement techniques. This study systematically investigated the various trends in pavement roughness measurement techniques within the industry and research community in the past five decades. In this study, the Scopus and TRID databases were utilized. In industry, it was revealed that laser inertial profilers prevailed over response-type methods that were popular until the 1990s. Three-dimensional triangulation is increasingly used in the automated systems developed and used by major vendors in the USA, Canada, and Australia. Among the research community, a boom of research focusing on roughness measurement has been evident in the past few years. The increasing interest in exploring new measurement methods has been fueled by crowdsourcing, the effort to develop cheaper techniques, and the growing demand for collecting roughness data by new industries. The use of crowdsourcing tools, unmanned aerial vehicles (UAVs), and synthetic aperture radar (SAR) images is expected to receive increasing attention from the research community. However, the use of 3D systems is likely to continue gaining momentum in the industry.

1. Introduction

For several decades, pavement condition surveys have been conducted by highway agencies to collect a variety of pavement condition data. However, roughness (sometimes identified as smoothness, rideability, or riding comfort) has been the most commonly measured, particularly at the network level [1,2]. Pierce and Stolte [2] found that virtually 100% of agencies in the United States (USA) collect roughness data at the network level. Roughness is used as one of the primary indicators of pavement conditions [3]. Additionally, it is utilized by many agencies to select the treatment type of pavement sections [4,5,6,7,8].
Pavement roughness is particularly crucial due to its direct linkage with riding comfort and user costs [9]. It also has a substantial impact on vehicle dynamics. Pavement roads of higher roughness increase users’ operational costs, fuel consumption, and tire wear, and reduce vehicle durability [9,10,11]. Lui and Al-Qadi [12] found that increasing pavement roughness corresponds to an increase in the impact of dynamic loading on fuel consumption. Robbins and Tran [13] reported that lowering the International Roughness Index (IRI) from 4 m/km to 3 m/km reduces vehicle maintenance costs by about 10%. Additionally, reducing 1 m/km in IRI can save USD 340 million in tire wear costs for passenger cars [13]. Moreover, the impact of roughness on accident rates was remarked by different studies [14,15,16]. Thus, it is usually used to capture commuters’ experience on roads.
Pavement roughness is typically categorized into three scales based on functional considerations, such as safety and riding quality. The three scales of pavement roughness are roughness, macrotexture, and microtextured. This paper focuses on the pavement roughness of the largest scale, which is defined as the deviation of pavement surface from the true planner surface. Roughness refers to surface irregularities with characteristics wavelength ranging between 0.1 and 100 m and amplitudes ranging from 1 to 100 mm [17,18]. It is typically measured in the wheel path area [9]. It primarily impacts vehicle dynamics, vehicle wear, road hold, and riding comfort [9,17,18]. In this study, the terms “pavement roughness” and “roughness” are used interchangeably to refer to the highest-scale pavement roughness.
Traditionally, ride quality was measured by a group of raters traveling the road and subjectively giving verbal or quantitative rates, such as in the Pavement Serviceability Rating (PSR) [19]. Over time, various measures were used to evaluate roughness, including IRI, Profile Index (PI), Ride Quality Index (RQI), and Half-car Roughness Index (HRI) [20]. Power spectral density (PSD) is also widely used for pavement roughness evaluation and constitutes the basis for ISO road profile classification [21]. In the 1980s, IRI and HRI were the most used measures of roughness in the USA [22]. However, the Federal Highway Agency’s (FHWA) efforts to standardize the roughness measurement brought IRI to be universally accepted in the USA and elsewhere [23]. IRI is a statistical method to report the roughness of pavement. It is mathematically computed from a single longitudinal profile by applying a reference quarter car simulation shown in Figure 1. IRI was initiated based on extensive research conducted by the World Bank. It is reported in units of inches per mile or meters per kilometer [23].
Roughness data collection techniques have experienced the fastest pace of automation and technology maturity [25,26,27]. However, developing new roughness measurement techniques continues to capture the attention of many researchers due to a variety of factors. One crucial driver was the need to create efficient, easy-to-integrate, and highly automated data collection means. Some researchers have focused on improving the accuracy and precision of the collected data. Additionally, several research efforts have prioritized the development of cost-effective and low-cost techniques.
Moreover, the growing demand for roughness measurement by new industries has brought forward unique needs. Highway agencies are no longer the sole party interested in collecting and using roughness data. Measuring and using roughness data are increasingly becoming an interest of the automotive industry and normal road users. Autonomous vehicles are expected to have the capacity to measure pavement roughness to ensure safety and improve riding comfort. Additionally, roughness data are increasingly becoming important for developing more efficient navigation systems. Thus, new techniques are required to fulfill the needs of more diverse industries.
Several publications have reviewed the research efforts related to various aspects of pavement roughness. Nguyen et al. [28] reviewed the use of response-type methods for evaluating pavement surface anomalies. The review covered 130 studies on the use of response-type methods for surveying pavement defects published between 2006 and 2019. The authors reported a significant focus on using smartphones, connected vehicles, and machine learning for pavement profile and roughness estimation. Robbins and Tran [10] and Zaabar and Chatti [11] reviewed the impact of pavement roughness on vehicles’ operating costs. Pavement roughness was concluded to have a measurable increase in fuel consumption and maintenance costs [10,11]. Hettiarachchi et al. [29] reviewed roughness indices used in different countries around the world and indicated the prevalence of using IRI. In a recent study, Yu et al. [30] examined the use of smartphones in measuring pavement roughness and other surface anomalies.
However, there is a lack of literature devoted to understanding the evolution of pavement measurement techniques in industry practice and research. Additionally, it is vital to recognize the current trends and needs for pavement roughness measurement to better direct future research. Thus, this study tracked the changes over the past five decades to analyze the evolution of pavement roughness measurement techniques in academia and industry practice. The evolution of pavement roughness technologies was reviewed primarily in North America, using the TRID library, as a resemblance to the industry advancements worldwide. The state of practice was also analyzed by reviewing dozens of pieces of equipment in eleven countries in North America, Europe, and Australia. Research trends were analyzed using the Scopus database.

2. Research Methodology

The methodology of the current study is outlined in Figure 2. The publications used for conducting the analysis were identified in two subsequent stages. In the first stage, Scopus and TRID Library databases were searched to identify relevant publications. The Scopus database is selected to retrieve relevant research articles. Scopus is recognized to be the largest and most comprehensive literature database [31,32]. The search in the TRID was restricted to the TRB (Transportation Research Board) Online Bookstore. The TRB Library was founded in 1946 as the primary archive of the Transportation Research Board, Highway Research Board, Strategic Highway Research Program, and the Marine Board. The library has a vast collection of research articles as well as technical reports and monographs [33]. The Scopus database was primarily used to retrieve relevant academic research articles, whereas the TRID library was used to retrieve syntheses describing industry practices.
As shown in Figure 2, the search query of “(pavement* OR asphalt OR road* OR street*) AND (roughness OR IRI OR profile OR profiler* OR profilometer*)” was utilized to retrieve the relevant literature in the Scopus database. The asterisk “*” was used to account for the different variants of the keywords (e.g., the plural form). The search fields were limited to article titles and keywords to obtain the most relevant publications. To obtain syntheses describing the industry practices, the search was conducted using the TRID [34]. The keyword “pavement” was used as a search query to retrieve relevant publications. All publications with “pavement” in their titles were retrieved. As a result, 3236 and 192 items were retrieved from Scopus and TRID, respectively.
In the second stage, the obtained research results were refined. In the Scopus database, the refining process included three steps. Firstly, search results were filtered to only include original journal articles focused on engineering and written in English. This refinement resulted in eliminating more than 60% of the original search results. Then, the articles were investigated in two steps to only include articles focused on developing, improving, or testing new techniques for pavement roughness measurement. A total of 126 articles were identified, and four more were included during the analysis, bringing the number of considered articles to 130.
In the TRID Library (TRB Online Bookstore), the search was limited to the Highway (NCHRP) category. The National Cooperative Highway Research Program (NCHRP) is an objective national highway research program launched in 1962 in the United States of America. It focuses on conducting research to help improve the way national highways are designed, built, operated, and maintained. Syntheses of Highway Practice are used to complement the original research efforts by documenting the state of practice regarding a given topic. Synthesis reports are often based on literature reviews and comprehensive surveys of activities and initiatives. NCHRP has published more than 400 synthesis reports covering various aspects of highways [35]. Limiting the search to the documents categorized as Highway (NCHRP) resulted in the elimination of over 60% of the original search output. After skimming the remaining publications’ content, only six items were selected to conduct the analysis.
In the final stage, the obtained results were analyzed to identify trends in both industry and academic research over the previous half-century. Temporal analysis revealed that retrieved publications covered a period of approximately fifty years. The trends were analyzed over four time periods spanning between 1971 and 2022. The periods were segmented based on the availability of syntheses of practice. A bibliometric analysis was first conducted for Scopus literature using the Shiny R package [36]. Then, both the Scopus and TRID Library-based publications were analyzed to identify the trends in pavement roughness measurement techniques over the last half-century. In this study, pavement roughness techniques were analyzed in terms of their directness of measuring pavement roughness, accuracy, cost-effectiveness and level of automation.

3. Scientometric Analysis

3.1. Syntheses of Practice

This study makes use of seven NCHRP syntheses of practice published between 1981 and 2022, as presented in Table 1. These provided valuable insights into the shifts in pavement roughness data collection over the previous five decades in North America. Information related to the collection of roughness data was extracted to provide a comprehensive picture of the evolution of pavement roughness measurement in the past few decades. The extracted information covers the popularity of pavement roughness data collection as well as the used techniques, as presented in Table 1.
The syntheses are based on extensive surveys designed to capture the practices in pavement data collection and management in the USA and Canada. The number of agencies surveyed in the seven utilized syntheses is shown in Figure 3.
Considering the available information regarding the industry practices, four study periods were segmented to analyze trends in the industry and academic research. The first study period extends to 1986, during which two syntheses were identified. The second study period extends from 1987 to 1994. Information regarding industry practice in this period is analyzed using the third synthesis. The third study period spans from 1995 to 2009. Two syntheses are available to provide insights regarding industry practices in this period, published in 2004 and 2009. The last study period also includes two syntheses and covers a span of 13 years, from 2010 to 2022.

3.2. Journal Articles

This study makes use of 130 original articles. The retrieved articles were published over a time period of about half a century (1971–2022). The annual growth is about 6.2%, whereas the documents’ average age is about 12 years. Figure 4 presents the number of articles published in the four segmented study periods. The vast majority (77%) of the articles were published in the fourth period (2010–2022), with a yearly production rate of about eight articles. The lowest number of articles was retrieved from the third period (2004–2009), with an annual research output of 0.4 articles.

3.2.1. Most Relevant Sources

The retrieved articles were analyzed using the Shiny R package [36] to identify the most relevant sources. The analysis revealed 67 different sources; most of them (76%) circulated a single article. The top nine sources of at least three articles are presented in Table 2. As presented in Table 2, the “Transportation Research Record” and “International Journal of Pavement Engineering” circulated the highest number of articles. In total, they circulated about a quarter of the retrieved articles.
The core collection of the most relevant journals according to the Science Citation Index Expanded (SCIE) is also presented in Table 2. Analysis of the core collection subject categories of the most relevant sources based on the SCIE revealed some diversity. Most of the relevant sources are specialized in civil and engineering, transportation science, and technology. However, the core collection of top sources contains other subject categories such as construction and building technology, sensing, instrumentation, computer science, and mechanical engineering.

3.2.2. Top Relevant Authors’ Affiliations

The authors’ affiliations are analyzed to evaluate the spread of relevant research. In total, 114 affiliations were identified for the 130 analyzed articles. Table 3 presents the eight top relevant authors’ affiliations. About 60% of the identified affiliations are associated with one article, whereas about 12% are associated with at least five articles. Top authors’ affiliations constitute universities in the USA, China, and Ireland. North Dakota State University and Tongji University are the most affiliated institutions among the relevant authors. Table 3 indicates that all of the articles affiliated with the Pennsylvania State University (USA) were published in the second period. In contrast, all the articles affiliated with Chinese universities have been published in the past few years.

3.2.3. Corresponding Author’s Countries

Figure 5 shows the corresponding author’s country. Additionally, it shows the number of single-country publications (SCP), which include only intra-country collaboration, and the multiple-country publications (MCP), which include inter-country collaboration. Figure 5 indicates that most of the articles corresponded to authors from the USA (37) and China (22). Moreover, it is remarkable that most of the articles are SCP, indicating limited inter-country collaboration. In fact, just about 16% of the articles involve intra-country collaboration. The collaborations were mainly found between researchers from the USA and China on the one hand, and other countries, including Poland, the United Kingdom, Iran, and Jordan, on the other.

3.2.4. Top Cited Papers

Table 4 presents details of the most cited articles among the retrieved documents. “The use of vehicle acceleration measurements to estimate road roughness” [39] is by far the most cited article, with 200 citations. The article explored using vehicles’ built-in sensors for pavement roughness estimation. This indicates the surge in research focusing on equipping vehicles, particularly highly automated and autonomous vehicles, with pavement roughness measurement capabilities. Other highly cited papers focused on using accelerometers, smartphones, and vehicles’ built-in sensors to build systems for pavement roughness estimation. It is worth noting that five of the seven most cited articles were published in journals with an SCIE core collection coverage of mechanics, electronics, sensing, automation, and technology rather than transportation and civil engineering. This indicates a growing interest in measuring pavement roughness by researchers from disciplines outside the classical axis of civil engineering and transportation.

3.2.5. Keywords Analysis

Table 5 presents the fifteen author keywords with the most occurrence and total link strength. Additionally, a word cloud is generated to visualize the occurrence of author keywords, as shown in Figure 6. To derive a better characterization of the retrieved articles, synonym keywords were combined. For example, “smartphone” and “smartphones” were grouped as one keyword. Similarly, “roughness”, “road roughness”, “street roughness”, and “pavement roughness” were also considered as a single keyword. A complete list of the synonym keywords is presented in the Appendix A. As presented in Table 5 and illustrated in Figure 6, “pavement roughness” and “international roughness index” are by far the most used keywords by authors. The first keyword makes a general indication of the research field. The second keyword indicates the popularity of using IRI to measure pavement roughness. The keywords “Smartphones”, “accelerometers”, “connected vehicles”, and “crowdsourcing” appear as the fourth, fifth, tenth, and eleventh most frequently occurring keywords. They represent a contemporary research trend in pavement roughness evaluation. Other keywords such as “Pavement management”, “ride quality”, “pavement profiles”, “pavement condition assessment”, and “Road Roughness Estimation” constitute the main objectives of measuring pavement roughness. “Power spectrum density” is widely used by researchers focused on studying pavement roughness in combination with car ride quality and vehicle suspension. The presence of “Machine Learning” and “Artificial Neural Network” (ANN) among the most frequently used keywords implies the importance of using machine learning for pavement roughness evaluation.

4. Trends of Pavement Roughness Measurement Equipment

The collection of roughness data has experienced different gradual shifts in the last few decades. Figure 7 attributes the data collection practices over the last five decades. Roughness has been widely evaluated qualitatively since at least the end of the 1970s. The collection of roughness data has been continuously popular among highway agencies. However, the collection of roughness data at the network level was less practiced during the 1980s. Due to the availability of equipment that enables the collection of roughness data at the traffic level, sampling was rarely practiced. Additionally, the frequency of roughness data collection increased over the years to peak on an annual and biannual basis. The use of IRI for reporting roughness has gradually been mainstreamed and became prevalent during the third and fourth periods.

4.1. Roughness Data Collection

The popularity of different types of roughness measurement equipment in North America over the last five decades is summarized in Figure 8. The use of subjective evaluation was rare even in the 1980s. Multiple agencies used profilographs and contact profilers in the first period. Some types of contact profilers continue throughout the second period before being phased out during the third period. Response-type methods were the primary equipment for measuring roughness during the first and second periods. However, they were gradually replaced by non-contact profilers. During the third study period, response-type methods were entirely replaced by the non-contact profilers. Non-contact profilers of infrared and ultrasonic sensors were quite popular during the second period. However, they were gradually replaced with equipment that comprises laser sensors. The use of 3D imagining systems started garnering attention about two decades ago. Today, many agencies utilize such systems for pavement roughness measurements.
  • Period I: Until 1986
Before the 1950s, roughness data were seldom collected at the network level [23]. However, the collection of roughness data has gradually become more common in recent decades. In the early 1980s, roughness was among the data collected as part of network-wide surveys conducted by some agencies in North America. Although the 1981 synthesis [19] was limited to surveying nine agencies, the findings give indications of the increasing trend of wide-scale collection of condition data, including roughness. In the 1981 synthesis [19], eight of the nine surveyed agencies (89%) reported collecting quantitative roughness data. Differently, one agency (Ontario) reported subjective ride quality measures. The majority of the surveyed agencies (67%) collected roughness data for 100% of the network every one or two years. Only USA Air Force did not adopt programmed roughness data collection campaigns [19].
The collection of pavement condition data experienced a remarkable boost in the first half of the 1980s, as reported in the 1986 synthesis [25]. The 1986 synthesis captured a significant surge in the number of agencies collecting condition data on a large scale [25]. Roughness data were among the most frequently gathered by agencies. Out of the 44 responses collected from highway agencies in the USA and Canada, 40 agencies confirmed the collection of roughness data [25]. However, only 27 agencies (61%) collected roughness data for pavement management purposes at the network level. Seven other agencies (16%) reported occasional use of such data for pavement management at the network level. Some agencies used the collected data for other multiple functions, including research, planning, and pavement management at the project level [25]. However, no information was provided on the frequency and coverage of the roughness data collection surveys.
  • Period II: 1987–1994
The collection of roughness data experienced a dramatic boost in the late 1980s and early 1990s. This remarkable surge can be largely attributed to the 1987 update of the HPMS (Highway Performance Monitoring System) field manual [46]. The 1987 update of the HPMS field manual required a collection of pavement roughness data at least every two years [46]. The effect of this landmark requirement was vivid in the survey results published in the 1994 synthesis [27]. Fifty-nine agencies (98%) reported collecting roughness data at the network level for at least part of their network. Tennessee in the USA was the only agency that did not report conducting roughness surveys. Thirty-eight (64%) agencies reported collecting roughness data on the entire network system. Anther ten agencies stated collecting roughness data on the part of their networks (e.g., interstate, primary roads, secondary roads).
Additionally, the use of sampling for collecting roughness data was minimal, with only one agency reporting adopting some sort of sampling. The frequency of collecting pavement roughness data was also notable. Twenty-two (37%) and thirteen (22%) agencies were collecting roughness data for the entire system every one or two years, respectively [27]. A more significant portion of surveyed agencies (68%) collect roughness data on the interstate network.
Furthermore, all agencies were required to report roughness using IRI for the HPMS [46]. The requirement of submitting the roughness data in the standardized form of IRI had a great benefit that allowed for the comparison of roughness data between different highway agencies. Forty-one (68%) agencies measured or converted the roughness measurement to IRI. Other units include ride number (RN), riding comfort index (RCI), root-mean-square vertical acceleration (RMSVA), and road roughness index (RRI) [22,47].
  • Period III: 1995–2009
The popularity of roughness data collection reached a new peak by the 2004 synthesis [23] when all surveyed agencies started collecting roughness data from at least part of their network system. Twenty-six (46%) agencies collected roughness data annually, whereas twenty-four (43%) agencies collected roughness data every two to three years. Some agencies reported higher collection frequency on interstate networks compared to other parts of the network. For example, Oregon, Ohio, and Alabama reported collecting roughness data on interstate networks annually, whereas the data was collected for other parts of the network every two years. No sampling was employed for collecting pavement roughness data. Instead, the total length of the surveyed evaluation road lane was surveyed. Fifty-two (93%) agencies reported using automated tools. Another remarkable finding was the adoption of IRI as a standardized form of the roughness data by all of the agencies that responded [23]. The HPMS necessitated reporting pavement roughness using IRI for the entire National Highway System road network every two years [23].
Similarly, the 2009 synthesis [37] reported that about 95% of the surveyed agencies in the USA and Canada collected roughness data at the network level. Thirty-two (58%) agencies were found to collect roughness data for the highway system every year. Another seventeen (31%) agencies reported collecting roughness data on the highway system every two to three years. Remarkably, the collected distress data including roughness, have increasingly utilized to calibrate mechanistic–empirical pavement design using pavement models based on the mechanics of material [48]. The frequency of collecting roughness data kept rising primarily due to the requirement of HPMS Reassessment 2010+ [49]. The HPMS Reassessment 2010+ required submitting roughness data for the National Highway System each year [37]. The synthesis reiterates the widespread use of IRI for measuring pavement roughness [37].
  • Period IV: 2010–2022
The 2019 and 2022 syntheses [2,26] reported that virtually all agencies were collecting roughness data for the entire network on a yearly basis. Furthermore, IRI continued to be used as a standardized measure of pavement roughness in North America [2,26]. The increase in the popularity of pavement roughness data collection has primarily been fueled by Federal regulations [23 CFR 490 National Performance Management Measures (PM2)] [38]. The PM2 requires state highway agencies in the USA to collect and report IRI, rutting, faulting, and crack percentage for the Interstate Highway System and the Non-Interstate National Highway System [38]. The PM2 requires reporting pavement condition data every one and two years for the interstate and non-interstate national highway system (NHS) systems, respectively.

4.2. Roughness Measurement Technologies

4.2.1. Popular Equipment

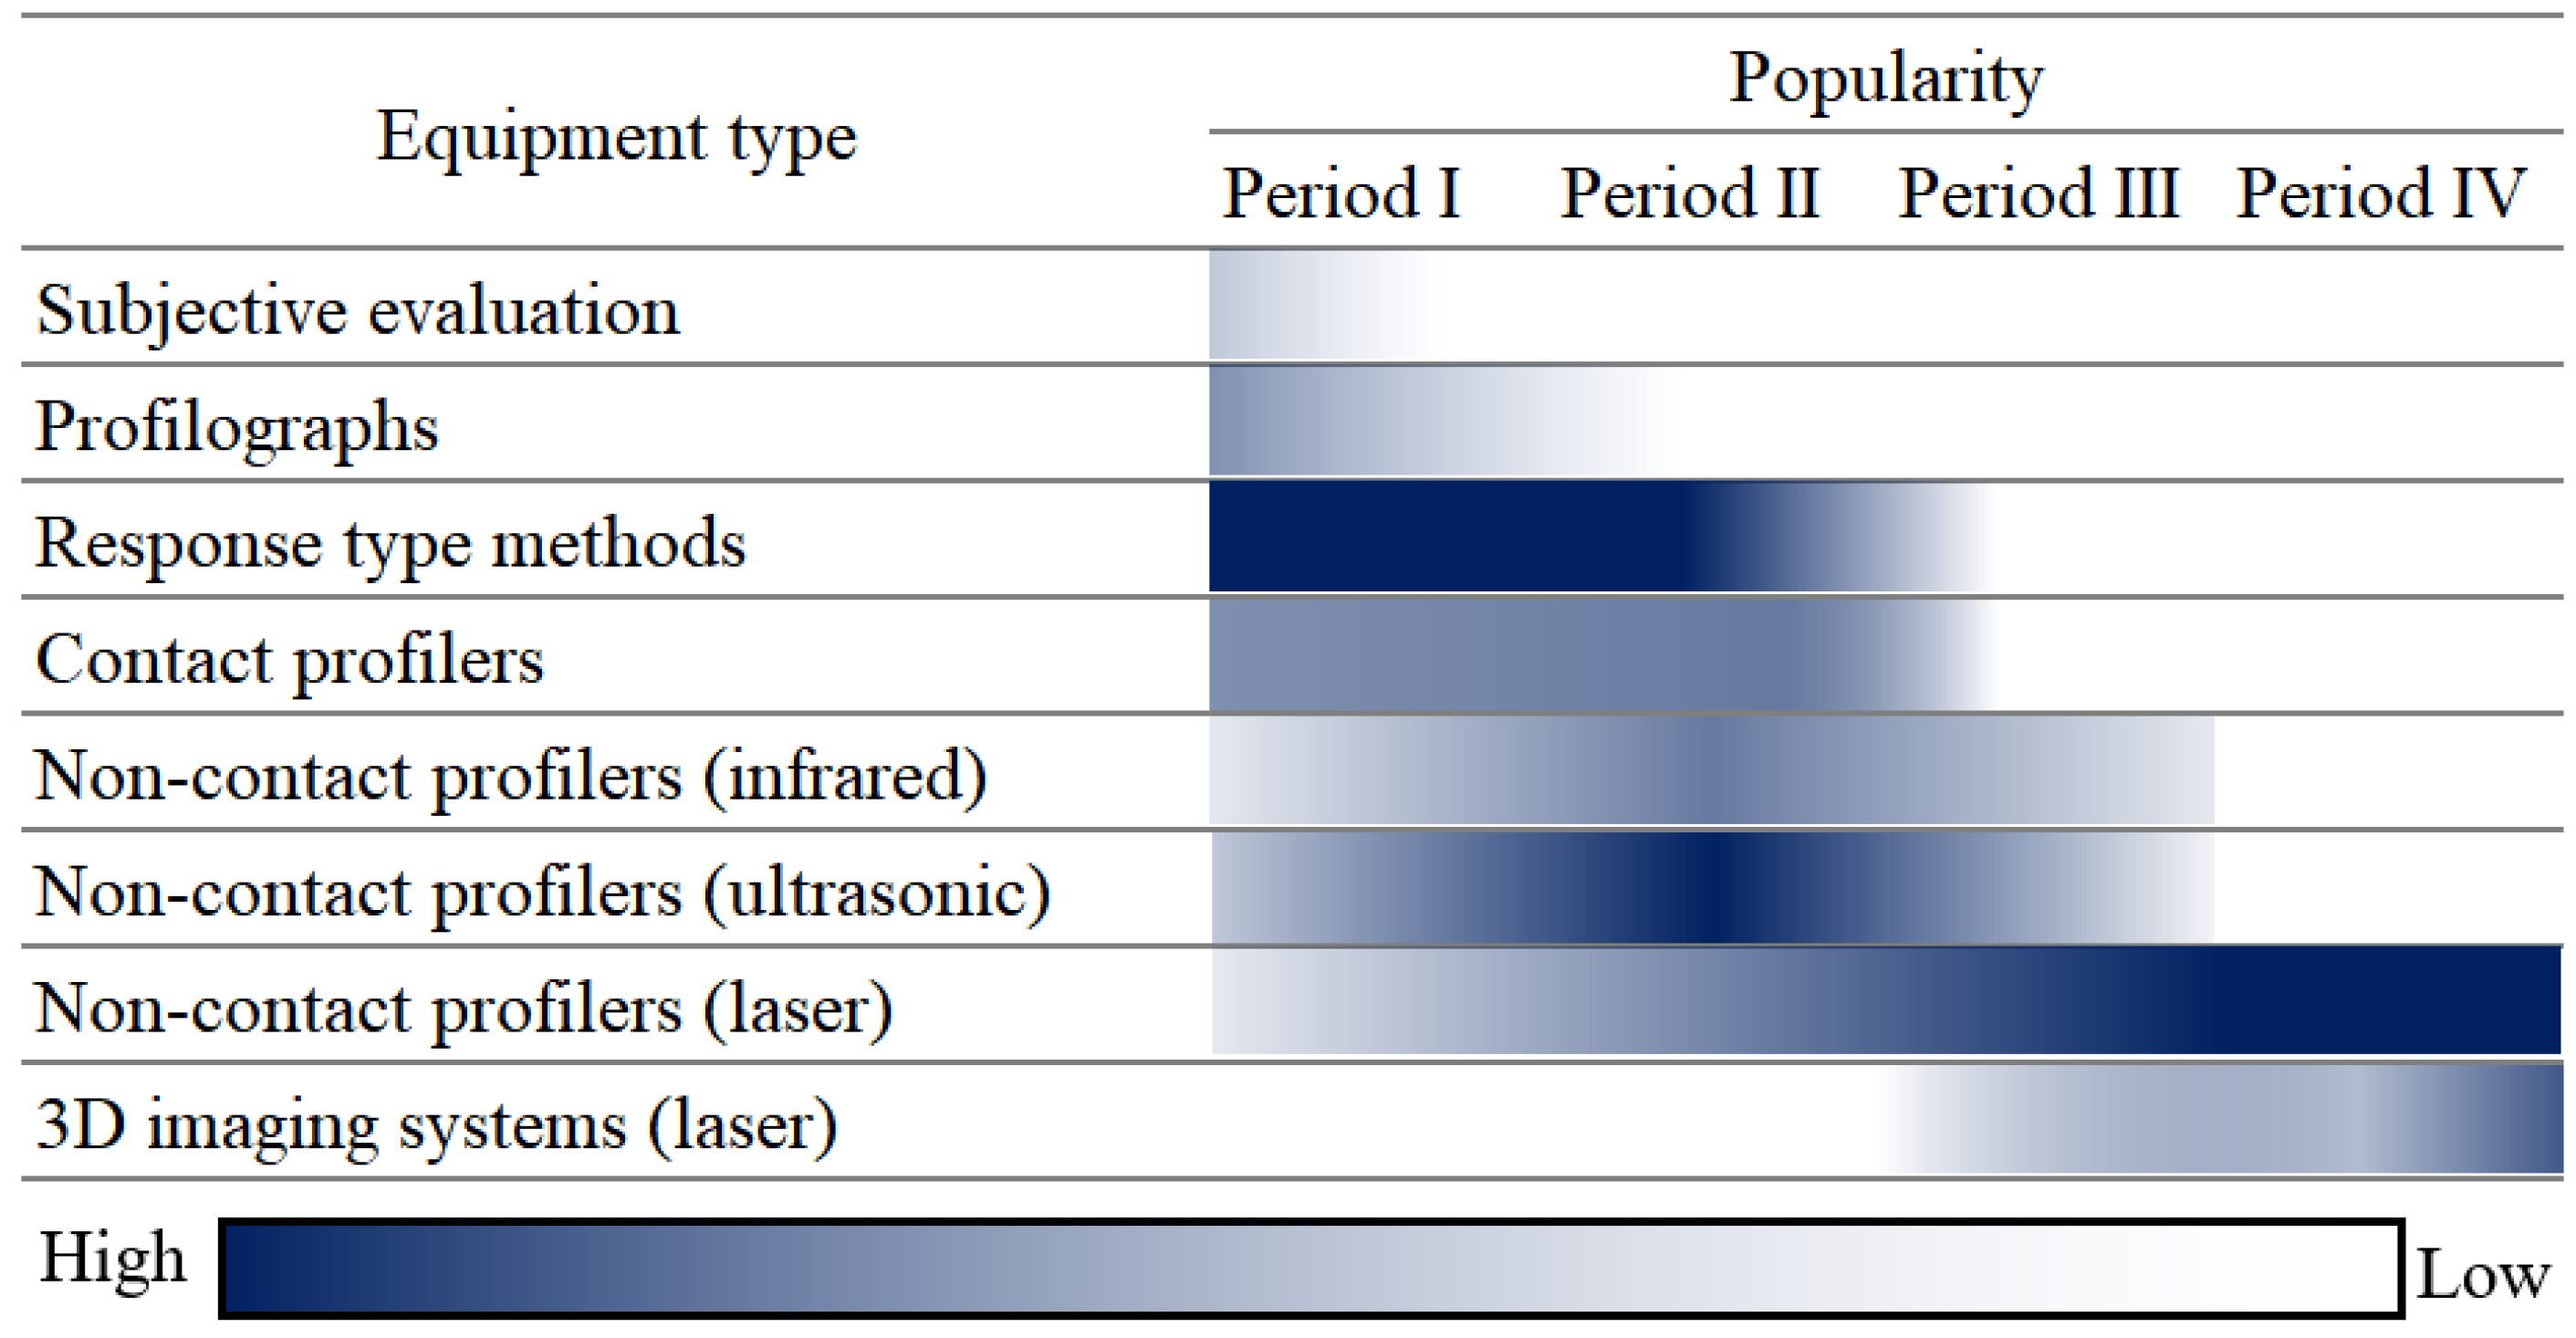
Various techniques have been used to evaluate pavement roughness over time. In the early days, simple straightedges were used as the sole means to evaluate pavement roughness. Over time, enormous efforts and extensive research were focused on developing more sophisticated equipment to measure roughness. In the first half of the twentieth century, different pieces of equipment with varying levels of sophistication were designed. Initially, the developed equipment was primarily mechanical with elaborated multi-wheel support systems, usually referred to as profilographs. With time, advanced technologies were employed to develop devices that incorporate mechanical systems, electrical circuits, electronics, accelerometers, infrared, ultrasonics, and lasers [50].
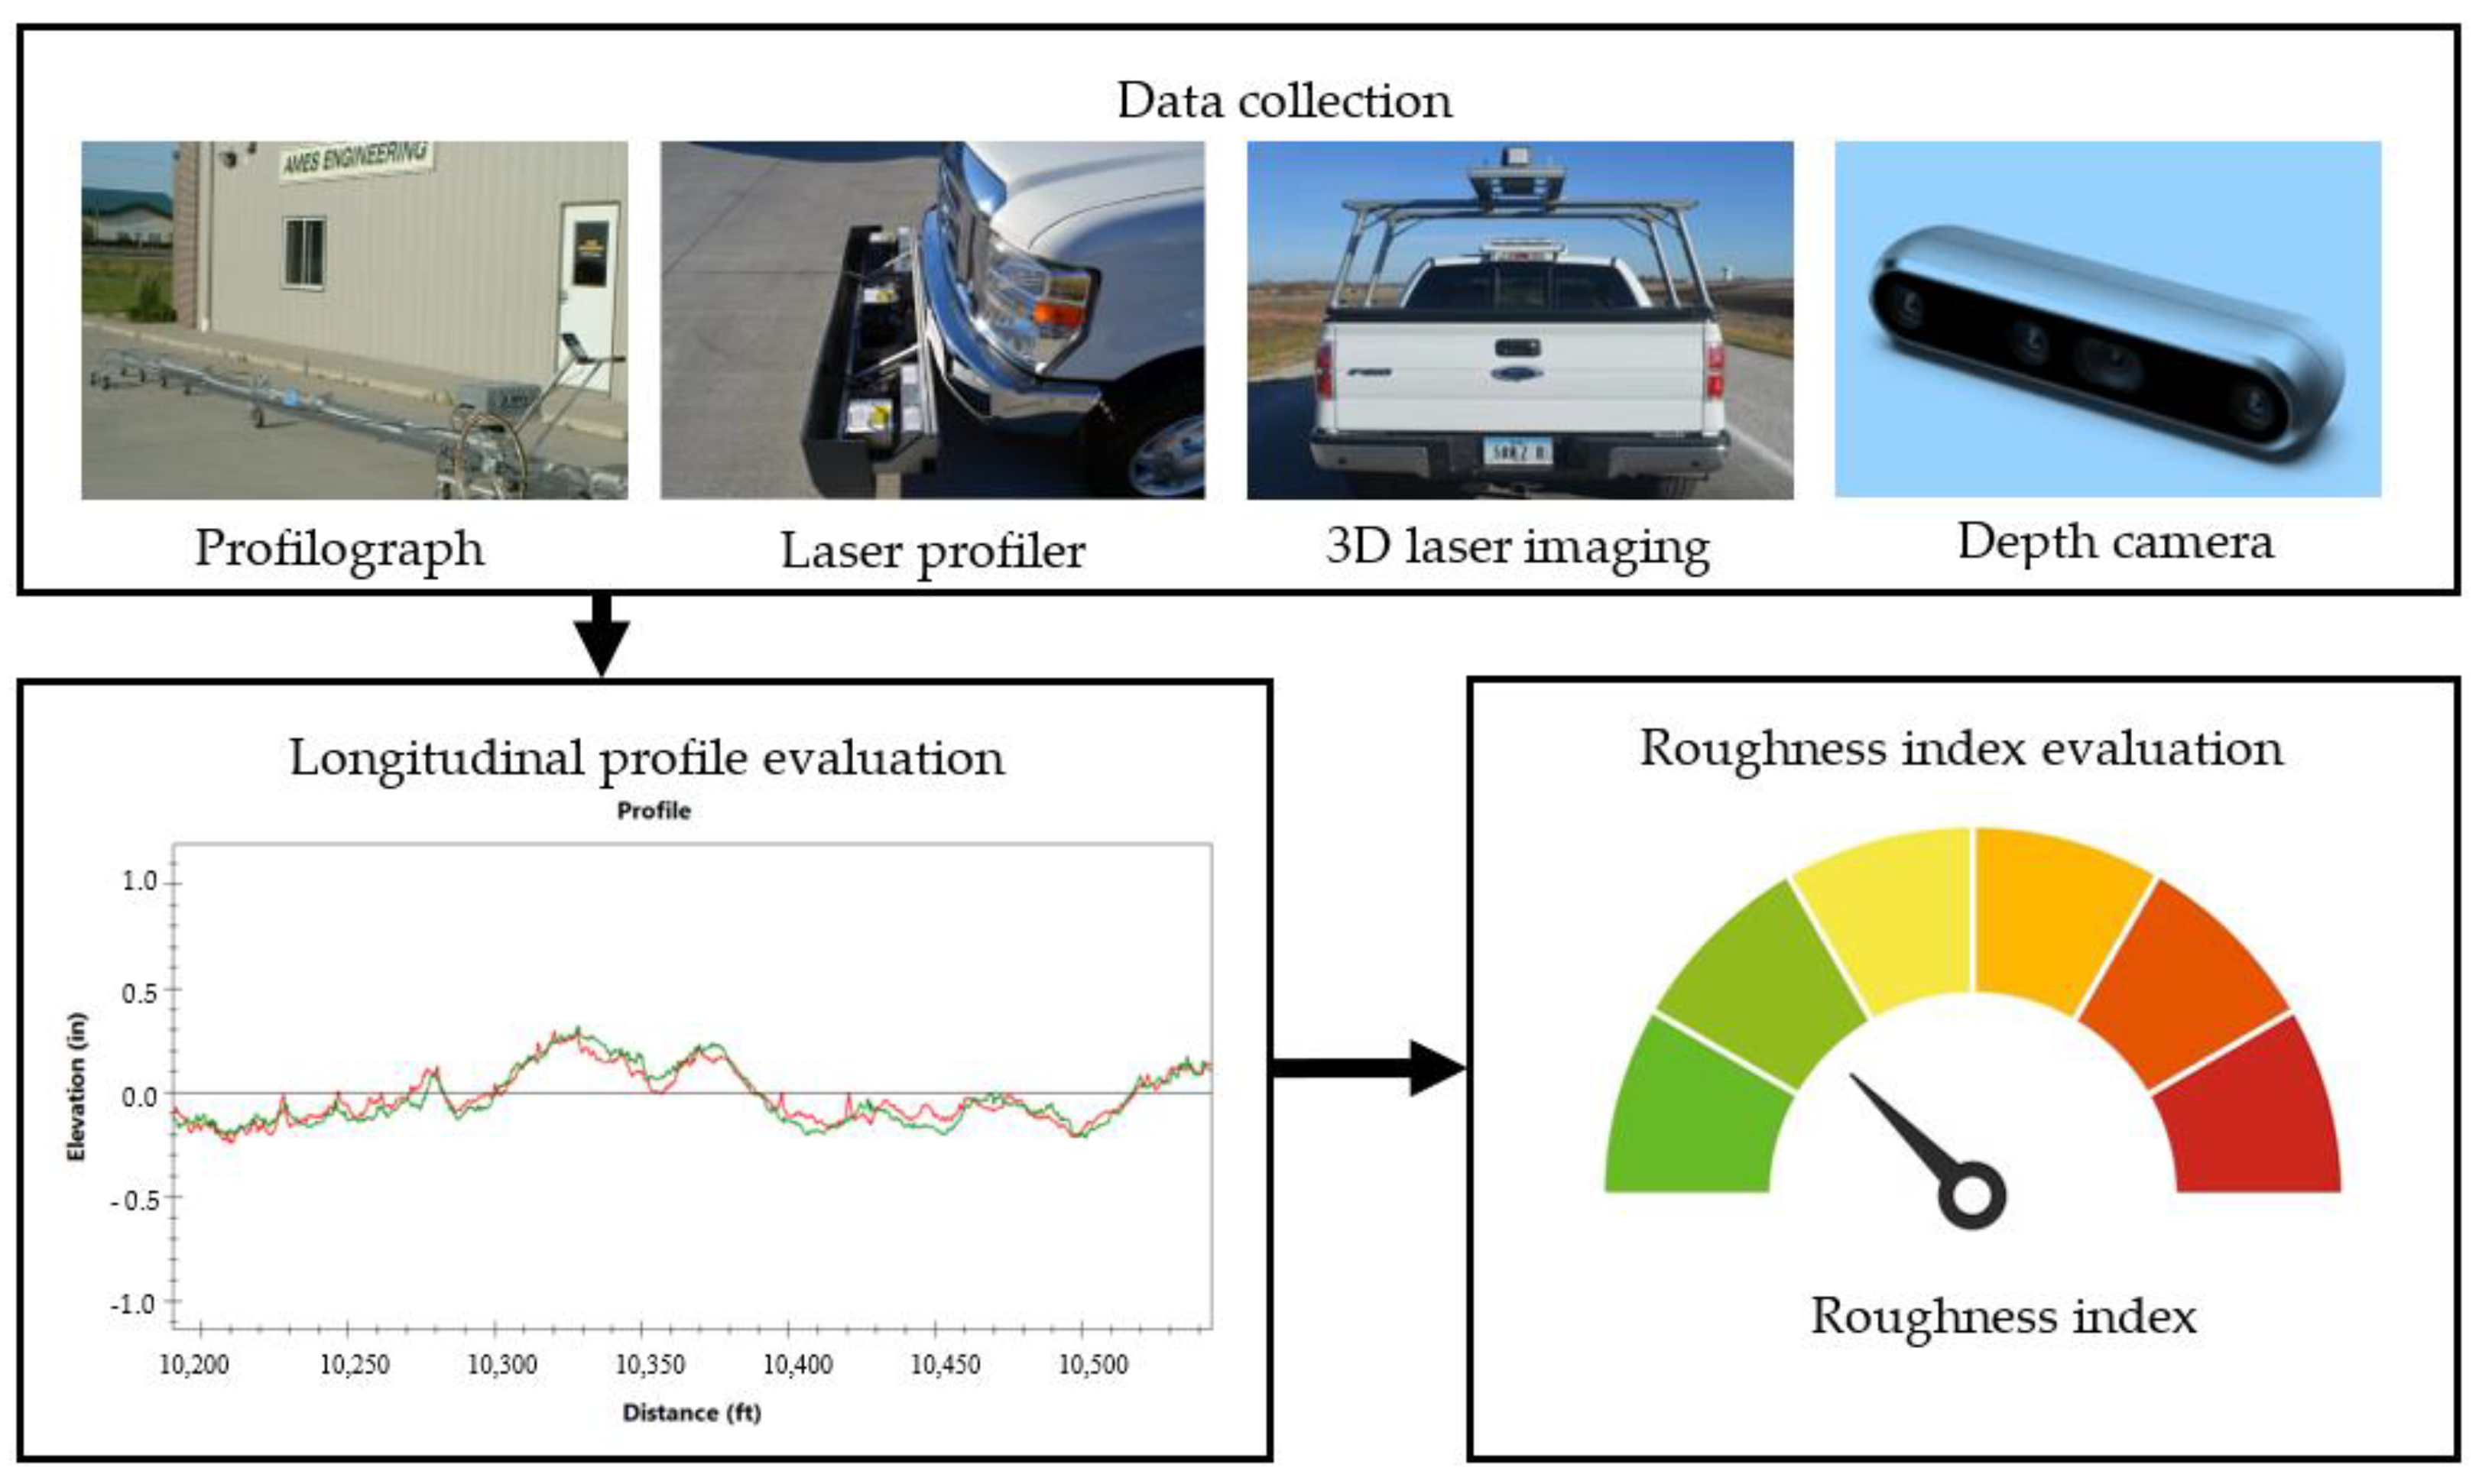
Pavement roughness equipment can be categorized based on different considerations. However, roughness measurement equipment can broadly be classified into two main groups based on their application principle. The first category constitutes equipment that is used for direct measurement of pavement profile. As shown in 
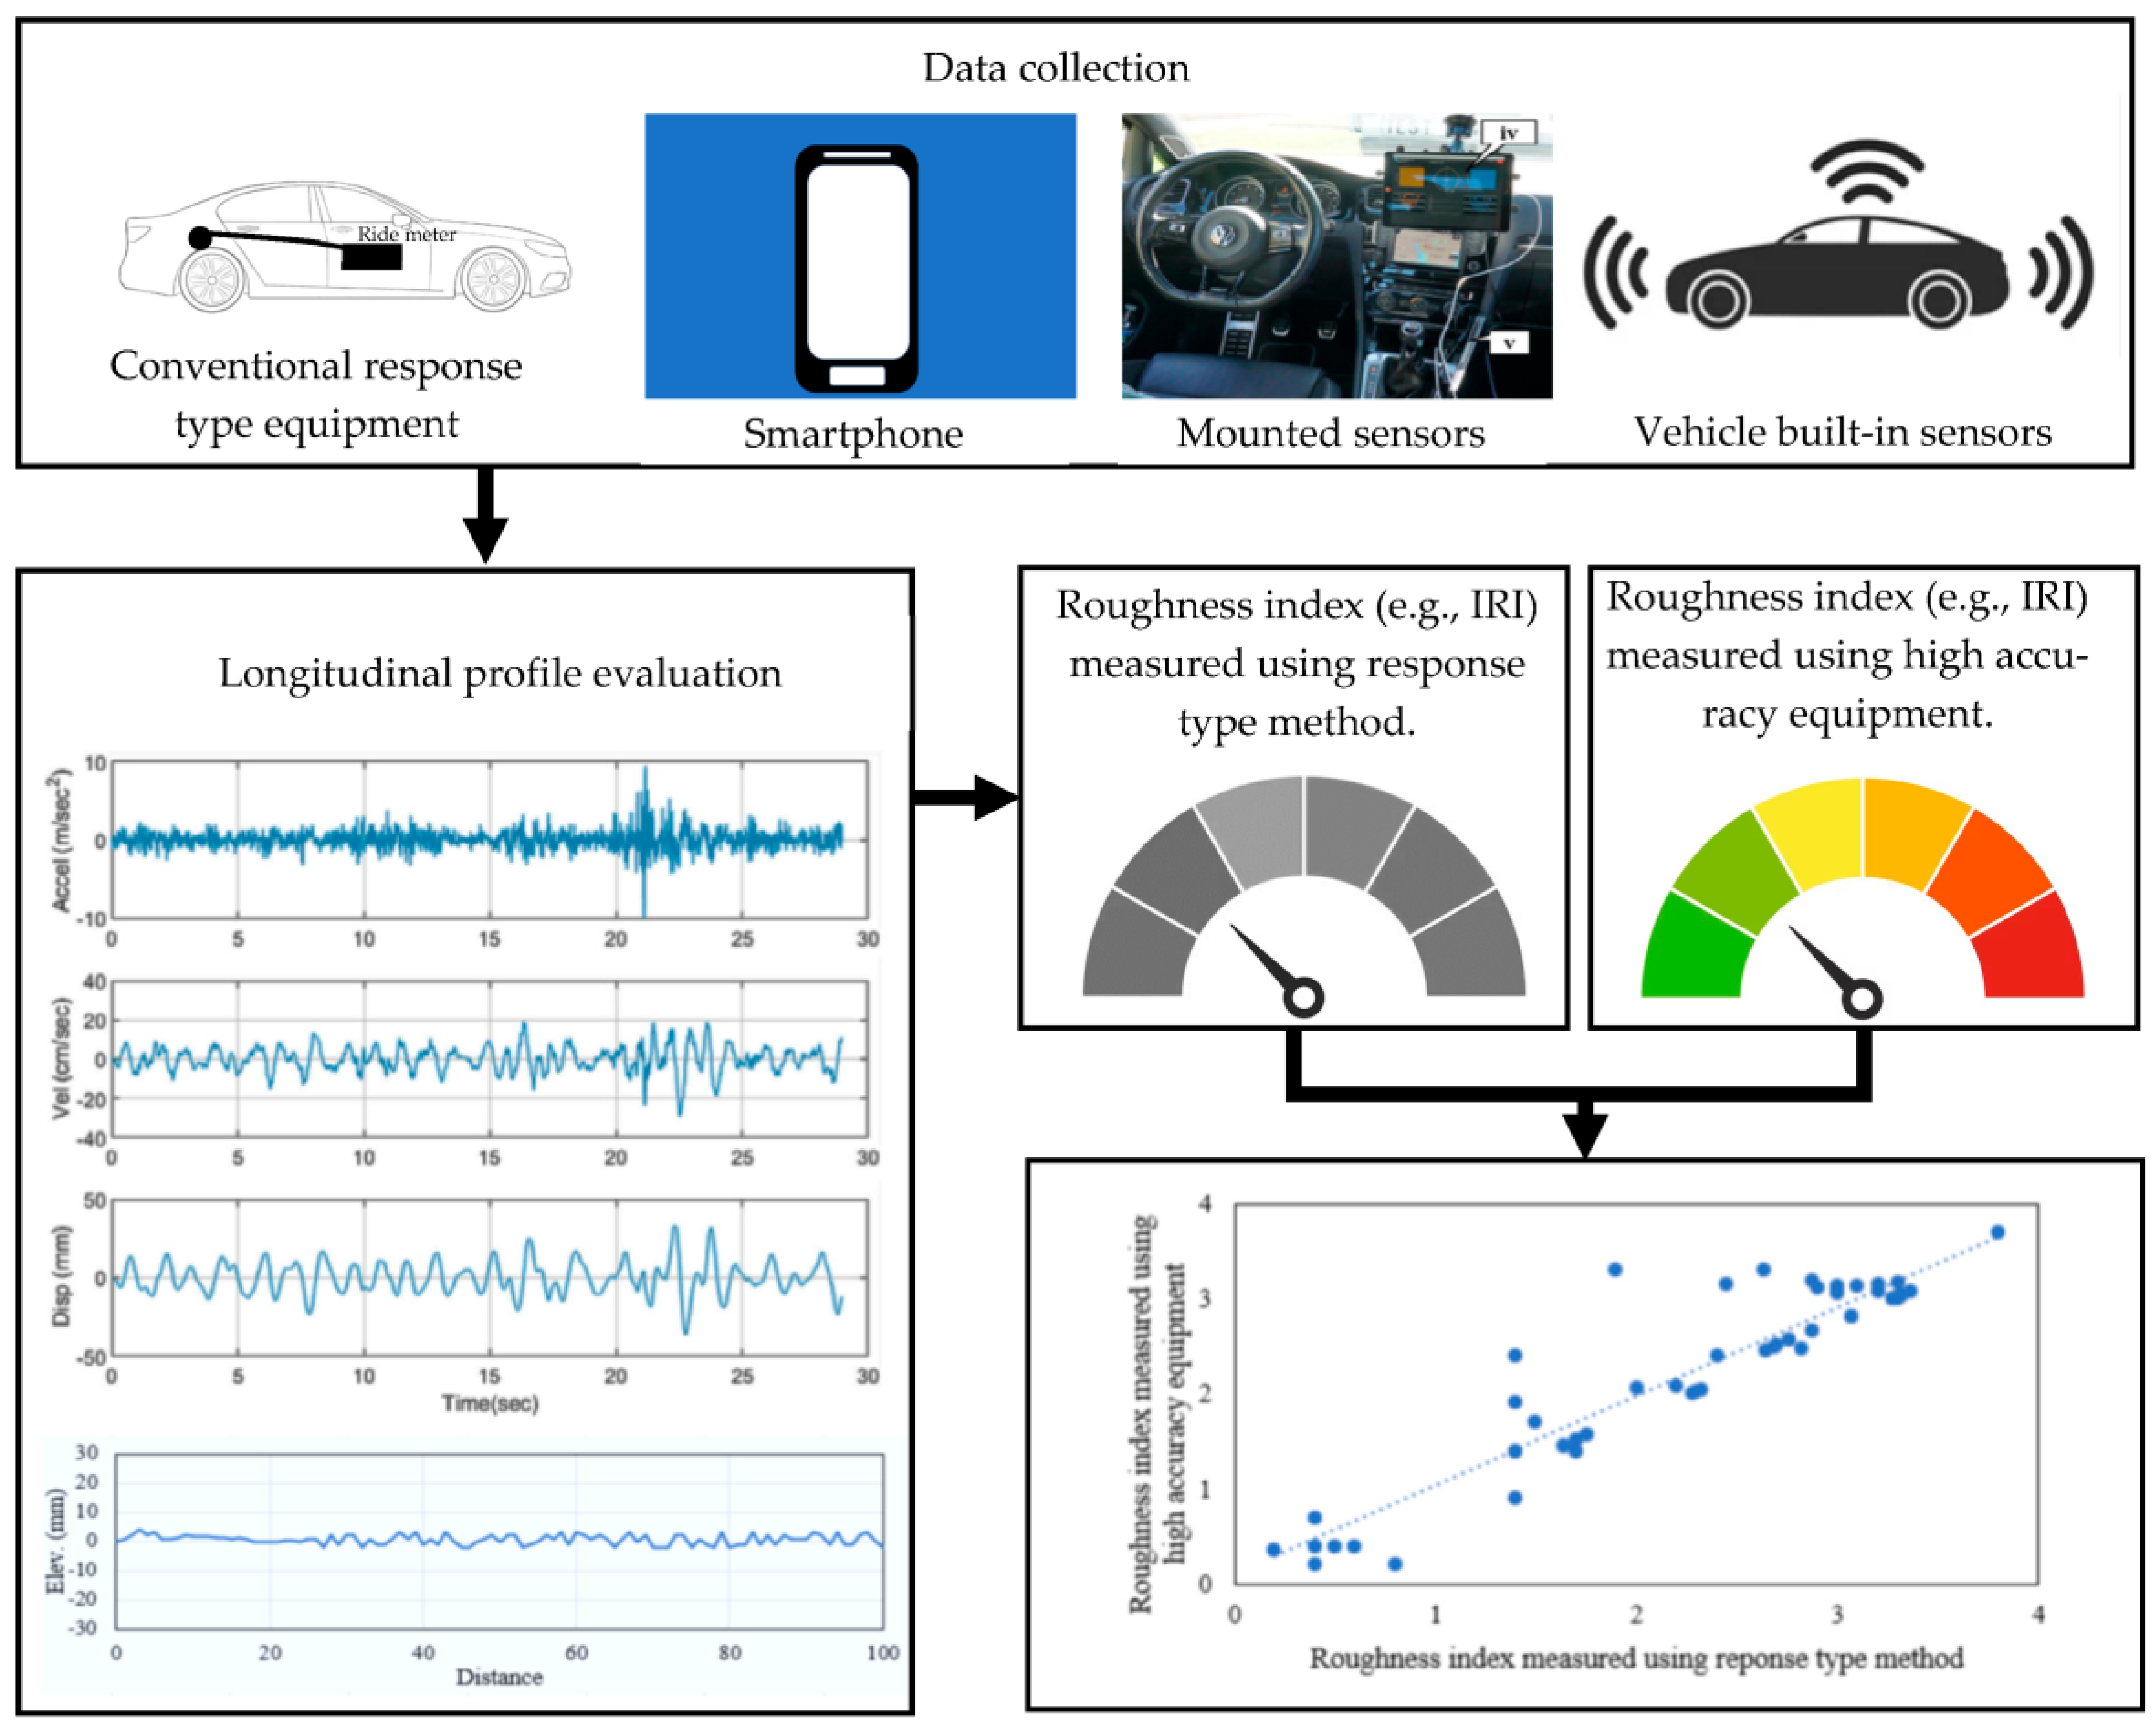
Figure 9, such equipment type includes profilographs, laser profilers, and 3D imaging systems (e.g., laser-based imaging systems and depth cameras). The longitudinal profile is evaluated using the collected data to ultimately calculate the roughness index, usually expressed as an IRI value. The second category includes equipment that indirectly measures the pavement profile. Alternatively, they measure vehicle response to pavement profile irregularities. Figure 10 presents some acceleration-based equipment: conventional response-type equipment (e.g., Mays meter), smartphones, mounted accelerometers, and vehicles’ built-in sensors. The collected acceleration signals are double-integrated to obtain the displacement that is used for evaluating the longitudinal profile [51]. The calculated roughness index is correlated with the corresponding values measured using high-accuracy equipment such as laser profilers [52]. In this study, the latter type of equipment is tagged as response-type equipment.
World Bank classification is another widely used categorization of pavement roughness measurement equipment [52]. The different types of equipment were classified considering their precision measurement of IRI. Class I constitutes precision profilers with the highest roughness measurement accuracy. However, Class II profilers are of a lower accuracy than those of Class I. Class III includes mechanical or electronic equipment to evaluate the pavement roughness indirectly. These devices are calibrated by correlating their measures with standardized roughness values. Class IV includes subjective evaluation of pavement roughness via visual inspection or by driving over the pavement section. Class IV represents a qualitative assessment based on guidance and personal experience. A brief description of some of the previously and currently popular roughness techniques in North America is presented.
  • Profilographs
Profilographs consist of a beam or frame carried by a system of wheels in addition to a profile wheel to measure pavement roughness. The supported wheels, which vary in number according to the profilograph type, carried the beam or the frame to establish a datum from which the vertical deviation of the pavement is measured. The pavement’s vertical deviation is measured using a profile wheel, usually located at the midpoint of the profilograph [50]. California and Reinhart profilographs are the most popular types in North America [50]. The use of profilographs to collect data at the network level is not popular [47,50].
  • Response-type equipment
Response-type equipment includes mechanical or electronic devices to evaluate pavement roughness indirectly. These equipment pieces are calibrated by correlating the measured values with standardized roughness measures. They quantify the vehicle response either mechanically (bump integrator) or using accelerometers [52]. Response-type equipment was the primary technology for evaluating pavement roughness in the 1970s and 1980s [18,19,25].
Instead of measuring the actual road profile, response-type equipment measures the vehicle response to the pavement roughness. Thus, this type of equipment is prone to various sources of bias and uncertainties, including changes in vehicle dynamics and equipment sensitivity. However, multiple benefits brought on by response-type equipment made them the most popular roughness measurement equipment for several decades. The advantages of the response-type equipment include low cost, ease of use, operation at high speed, ability to collect large amounts of data, and the ease of correlating their measures with PSI and standardized roughness values [19]. However, they are adversely criticized because reproducibility is challenging to achieve, as the measurements are susceptible to many factors, as mentioned before. Thus, frequent and rigorous calibration was required to achieve any consistency in the collected data [19]. Conventional response-type equipment such as Mays and Cox meters have been gradually phased out and replaced with more precise and accurate measurement technologies.
Recently, this type of technology has been revived by utilizing smartphones, vehicles with built-in sensors, and cheap accelerometers. Their application for measuring pavement roughness has been the focus of enormous research efforts [54,55,56,57,58,59,60,61].
  • Inertial profilers
Inertial profilers, or simply profilers, are used to measure the actual pavement profile and do not require a comparison with other equipment for calibrating the results. Instead, it is necessary to calibrate the equipment’s sensors and associated electronics and ensure the proper functioning of the computing hardware and software [50]. Inertial profilers are essentially composed of accelerometers, height sensors, distance sensors, and computing hardware and software [50]. Accelerometers are used to establish a reference plane from which the vertical deviation of the vehicle is measured [50]. In the early generation of pavement roughness measurement equipment with inertial referencing systems, the road profile was defined using a wheel in contact with the pavement surface [62]. However, in the latter generations, road profile has been established as the distance between the vehicle and the pavement surface using non-contact height sensors, which can be ultrasonic, infrared, or laser. The obtained road profile is adjusted by accounting for the vertical movement of the vehicle captured using accelerometers. The true relative profile is then used to calculate IRI by applying the quarter car simulation [10,63].
Inertial profilers with non-contact height sensors have become increasingly prevalent since the 1990s [23,27]. Among other types, laser sensors have become the primary choice in inertial profilers [23,26]. ASTM E950/E950M–09 [64] classified methods for measuring pavement roughness using inertial profilers into four classes based on resolution and precision. It is worth noting that the latest version of the ASTM E950/E950M–22 [65] did not discuss such a classification.
However, laser-based inertial profilers have some limitations, including high initial costs. Laser-based inertial profilers’ prices are much higher than response-type equipment and manually operated profilers [52]. Moreover, they are typically inefficient at low speeds [26,52]. Thus, highway agencies usually set a low-speed provision for operating inertial profilers. For example, the Saskatchewan Ministry of Highways and Infrastructure (MHI) requires a minimum collection speed of 25 km/h. Similarly, North Carolina and Virginia DOT require data collection speeds greater than 24 km/h [26].
  • Three-dimensional imaging systems
Technology advancements in imaging systems have led to the development of automated tools capable of collecting different types of pavement condition data. The use of 3D imaging techniques instead of 2D imaging constituted a colossal leap in the development of automated systems. Three-dimensional imaging systems enable the efficient and highly accurate collection of pavement condition data. Such technology can capture as-built physical data in digital format to construct highly accurate 3D profiles of pavement [66]. Its advantages include facilitating the evaluation of roughness at any track on the paved road. Additionally, it facilitates surveying for various pavement condition data, including roughness, rutting, cracking, and raveling [26]. In the early 2000s, several companies developed 3D imaging systems to evaluate pavement conditions, primarily roughness and rutting. The developed systems utilized scanning lasers and reflectors to measure the reflection times across the pavement surface to establish the 3D pavement profiles [23]. In the following years, 3D imaging systems have been integrated into automated systems developed by major vendors, including ARRB Systems (Rowville, Australia), Mandli Communications (Fitchburg, WI, USA), and Pathway Services Inc. (Broken Arrow, OK, USA).
Different 3D imaging systems were explored for a variety of motivations. Several studies [67,68,69] explored using low-cost depth cameras instead of the relatively expensive laser profilers to evaluate pavement roughness. The use of 3D systems to construct the road profile for evaluating road roughness is proposed to overcome the limitations of the laser profiler at evaluating roughness at low and varying speeds [70]. Additionally, 3D data can be used to assess other pavement condition aspects, including cracking, potholes, and patching [68]. Additionally, such systems can be mounted on unmanned aerial vehicles (UAVs) to reduce the time, costs, and efforts for roughness data collection [71].
Three-dimensional data can be obtained via different means, including stereography, time-of-flight measurement, and triangulation. Stereography uses 2D pictures from a moving camera or different cameras to construct 3D pavement profiles [72]. Stereography is used in the Intel depth camera (D435i) [69]. Time-of-flight is used in Lidars as well as Microsoft Kinect One depth camera [67]. Triangulation is widely used in commercial profiling systems [9].

4.2.2. Roughness Measurement Technologies in Industry Practice

  • Period I: Until 1986
The state of the practice of pavement roughness measurement technologies is concluded using two syntheses of Hicks and Mahoney [19] and Epps and Monismith [
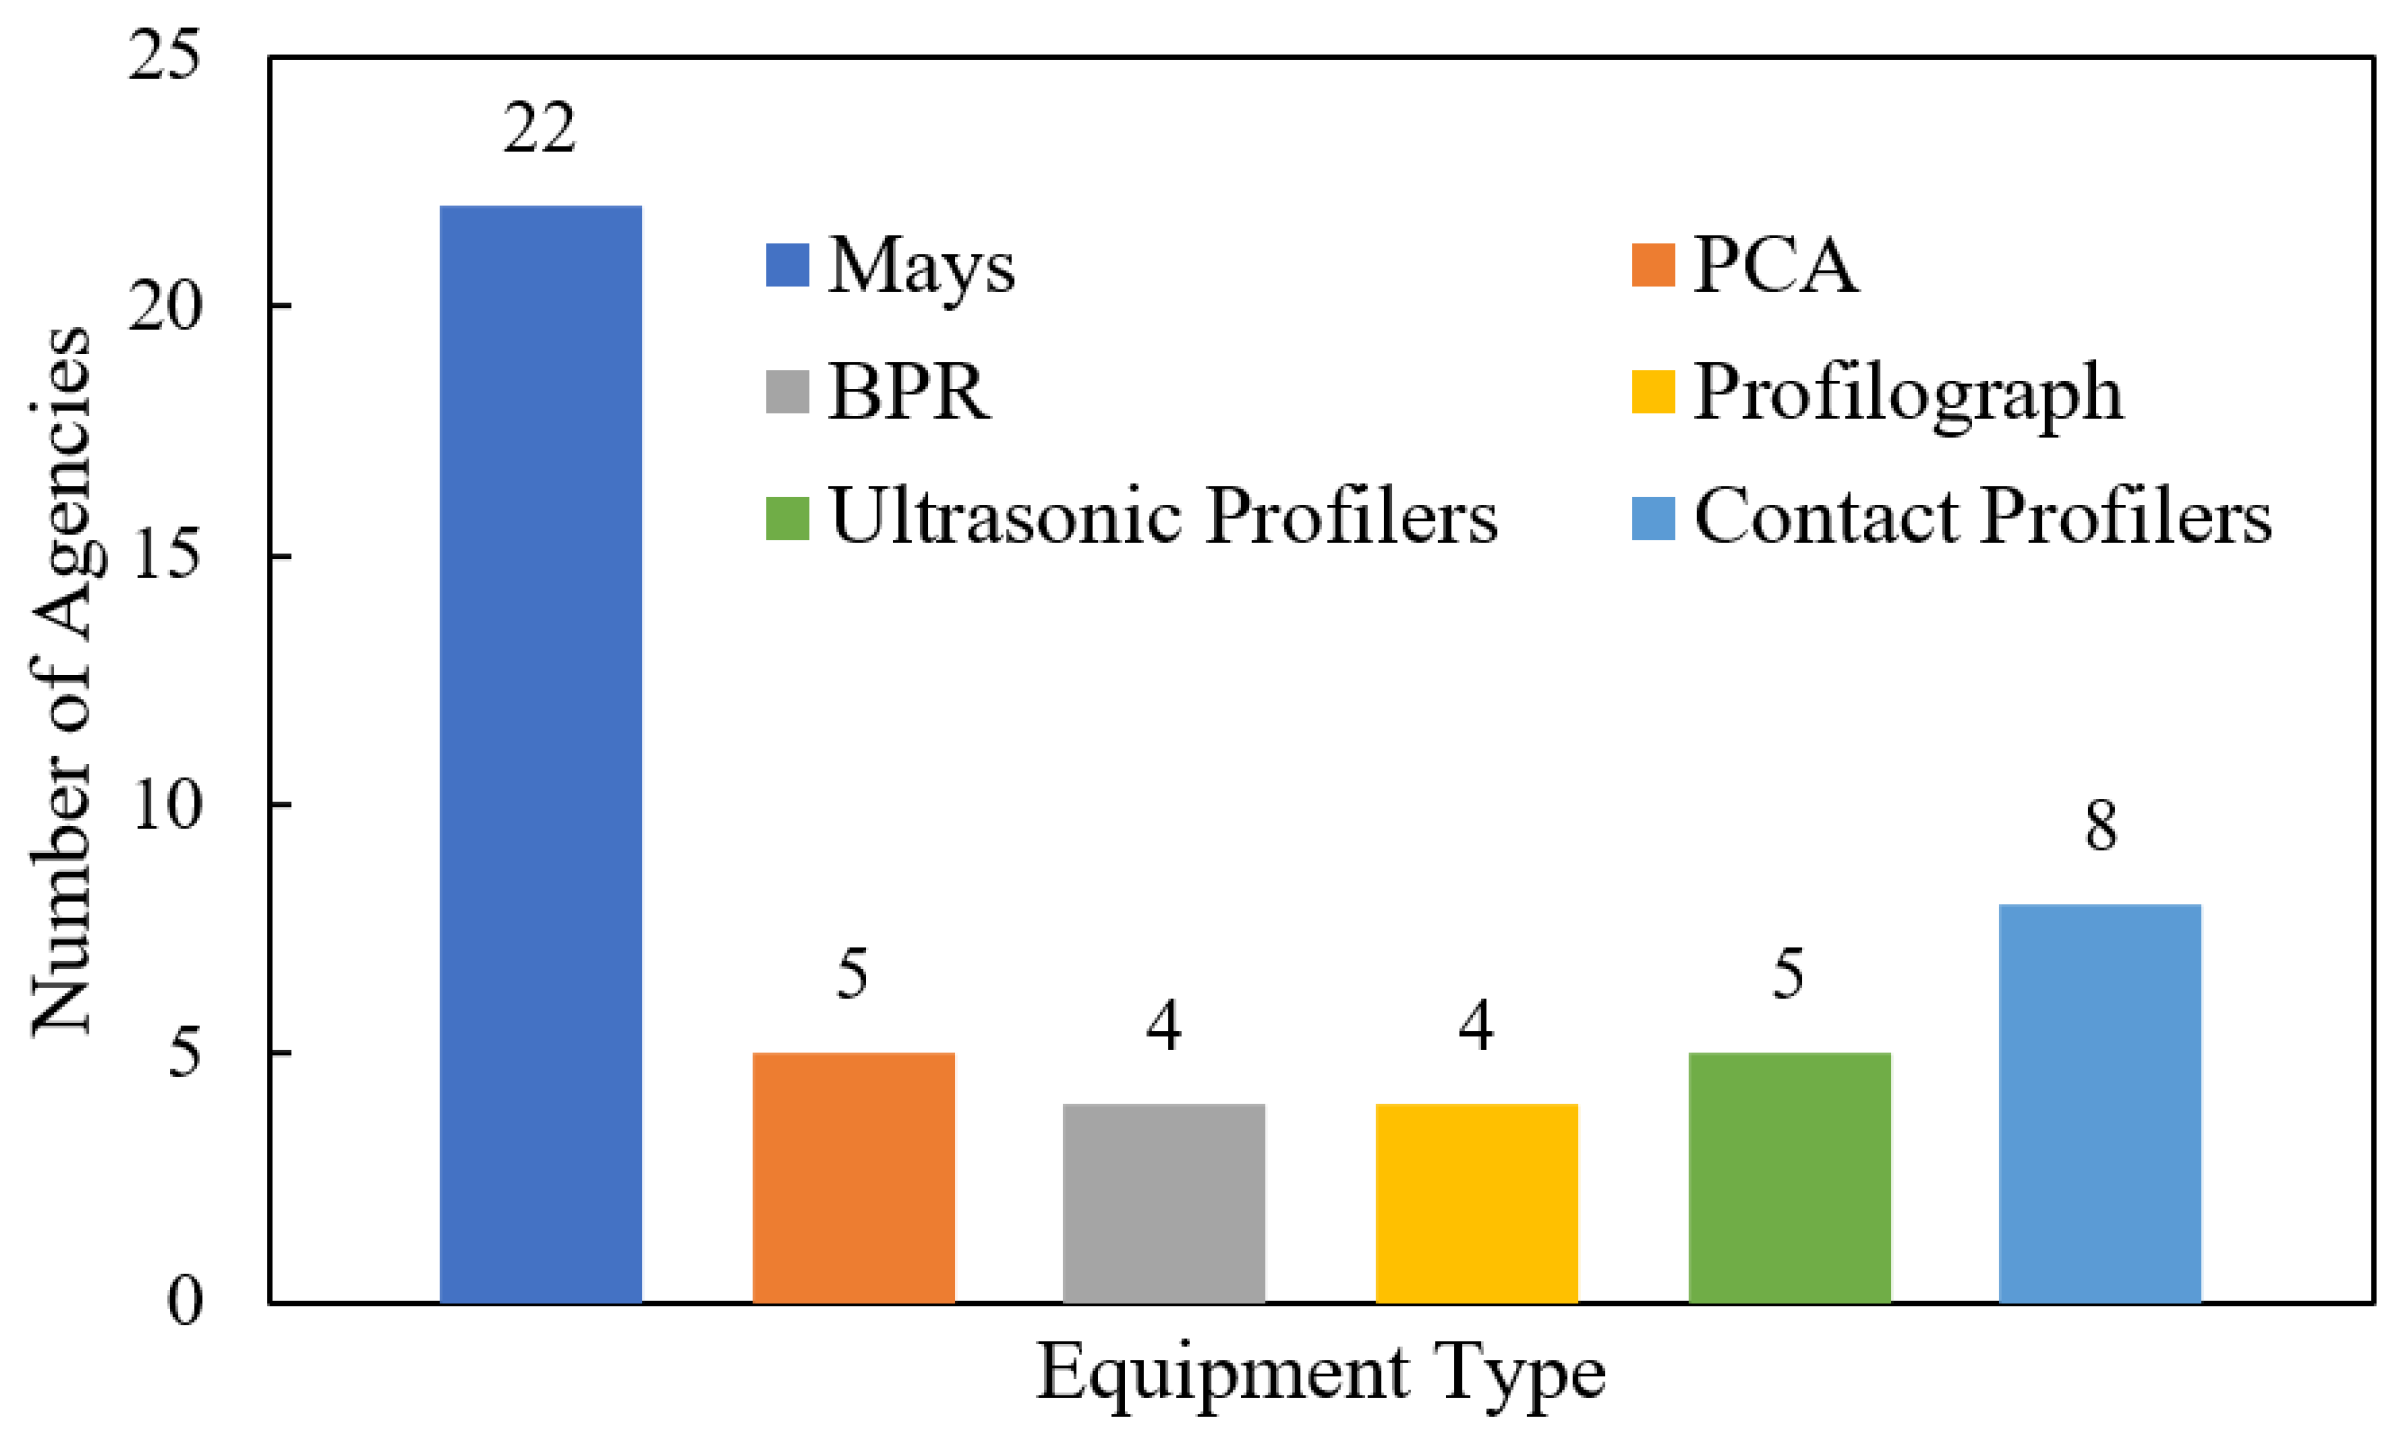
25]. The two syntheses reported the use of different pavement roughness equipment, including various response-type equipment, profilographs, contact profilers, and non-contact profilers. The number of pavement roughness measurement equipment pieces owned by surveyed agencies, as reported in the 1986 synthesis [25], is shown in Figure 11. However, response-type equipment was, by far, the most popular means for collecting roughness data in the mid-1980s. Equipment that performs direct profile measurement was less widespread. However, non-contact profilers were receiving considerable attention by the mid-1980s.
Hicks and Mahoney [19] reported that seven out of the nine surveyed agencies used response-type equipment. Five years later, Epps and Monismith [25] reported that such equipment was still the primary means of collecting pavement roughness data. As shown in Figure 11, the majority of the agencies (22) were using the Mays meter. Other response-based equipment, such as BPR and PCA-type meters, was used by at least nine agencies.
Figure 11 shows that using profilographs and contact profilers was limited for large-scale roughness data collection surveys [25]. The use of subjective evaluation of road roughness was seldom. Only Ontario was reported to evaluate road roughness by raters traveling over the pavement to give a subjective rating on a 0–10 scale [25].
Hicks and Mahoney [19] found that only the USA Army Construction Engineering Research Laboratory (CERL) used a laser profiler to evaluate the pavement roughness [19]. However, the range and resolution of the early laser profilers were very limited. The laser profiler used by CERL was operated at a slow speed of about 5 km/h [25]. Remarkably, Epps and Monismith [25] reported that some agencies were already using ultrasonic profilers (5), including Cox Ultrasonic and South Dakota Profiler (SDP). The study revealed an increased interest in developing sensor-based non-contact profilers.
The study revealed that several companies, including K. J. Law Engineers (Ypsilanti, MI, USA), Cox and Sons (Colfax, CA, USA), PASCO Corporation (Tokyo, Japan), and Dynatest Consulting (Ballerup, Denmark), have developed non-contact profilers. These profilers utilize accelerometers and microprocessors, as well as ultrasonic or laser sensors. One of the significant hurdles to the widespread use of profilometers was their high price compared to conventional response-type methods. The former was reported to cost about fifteen times more than the latter [23].
  • Period II: 1987–1994
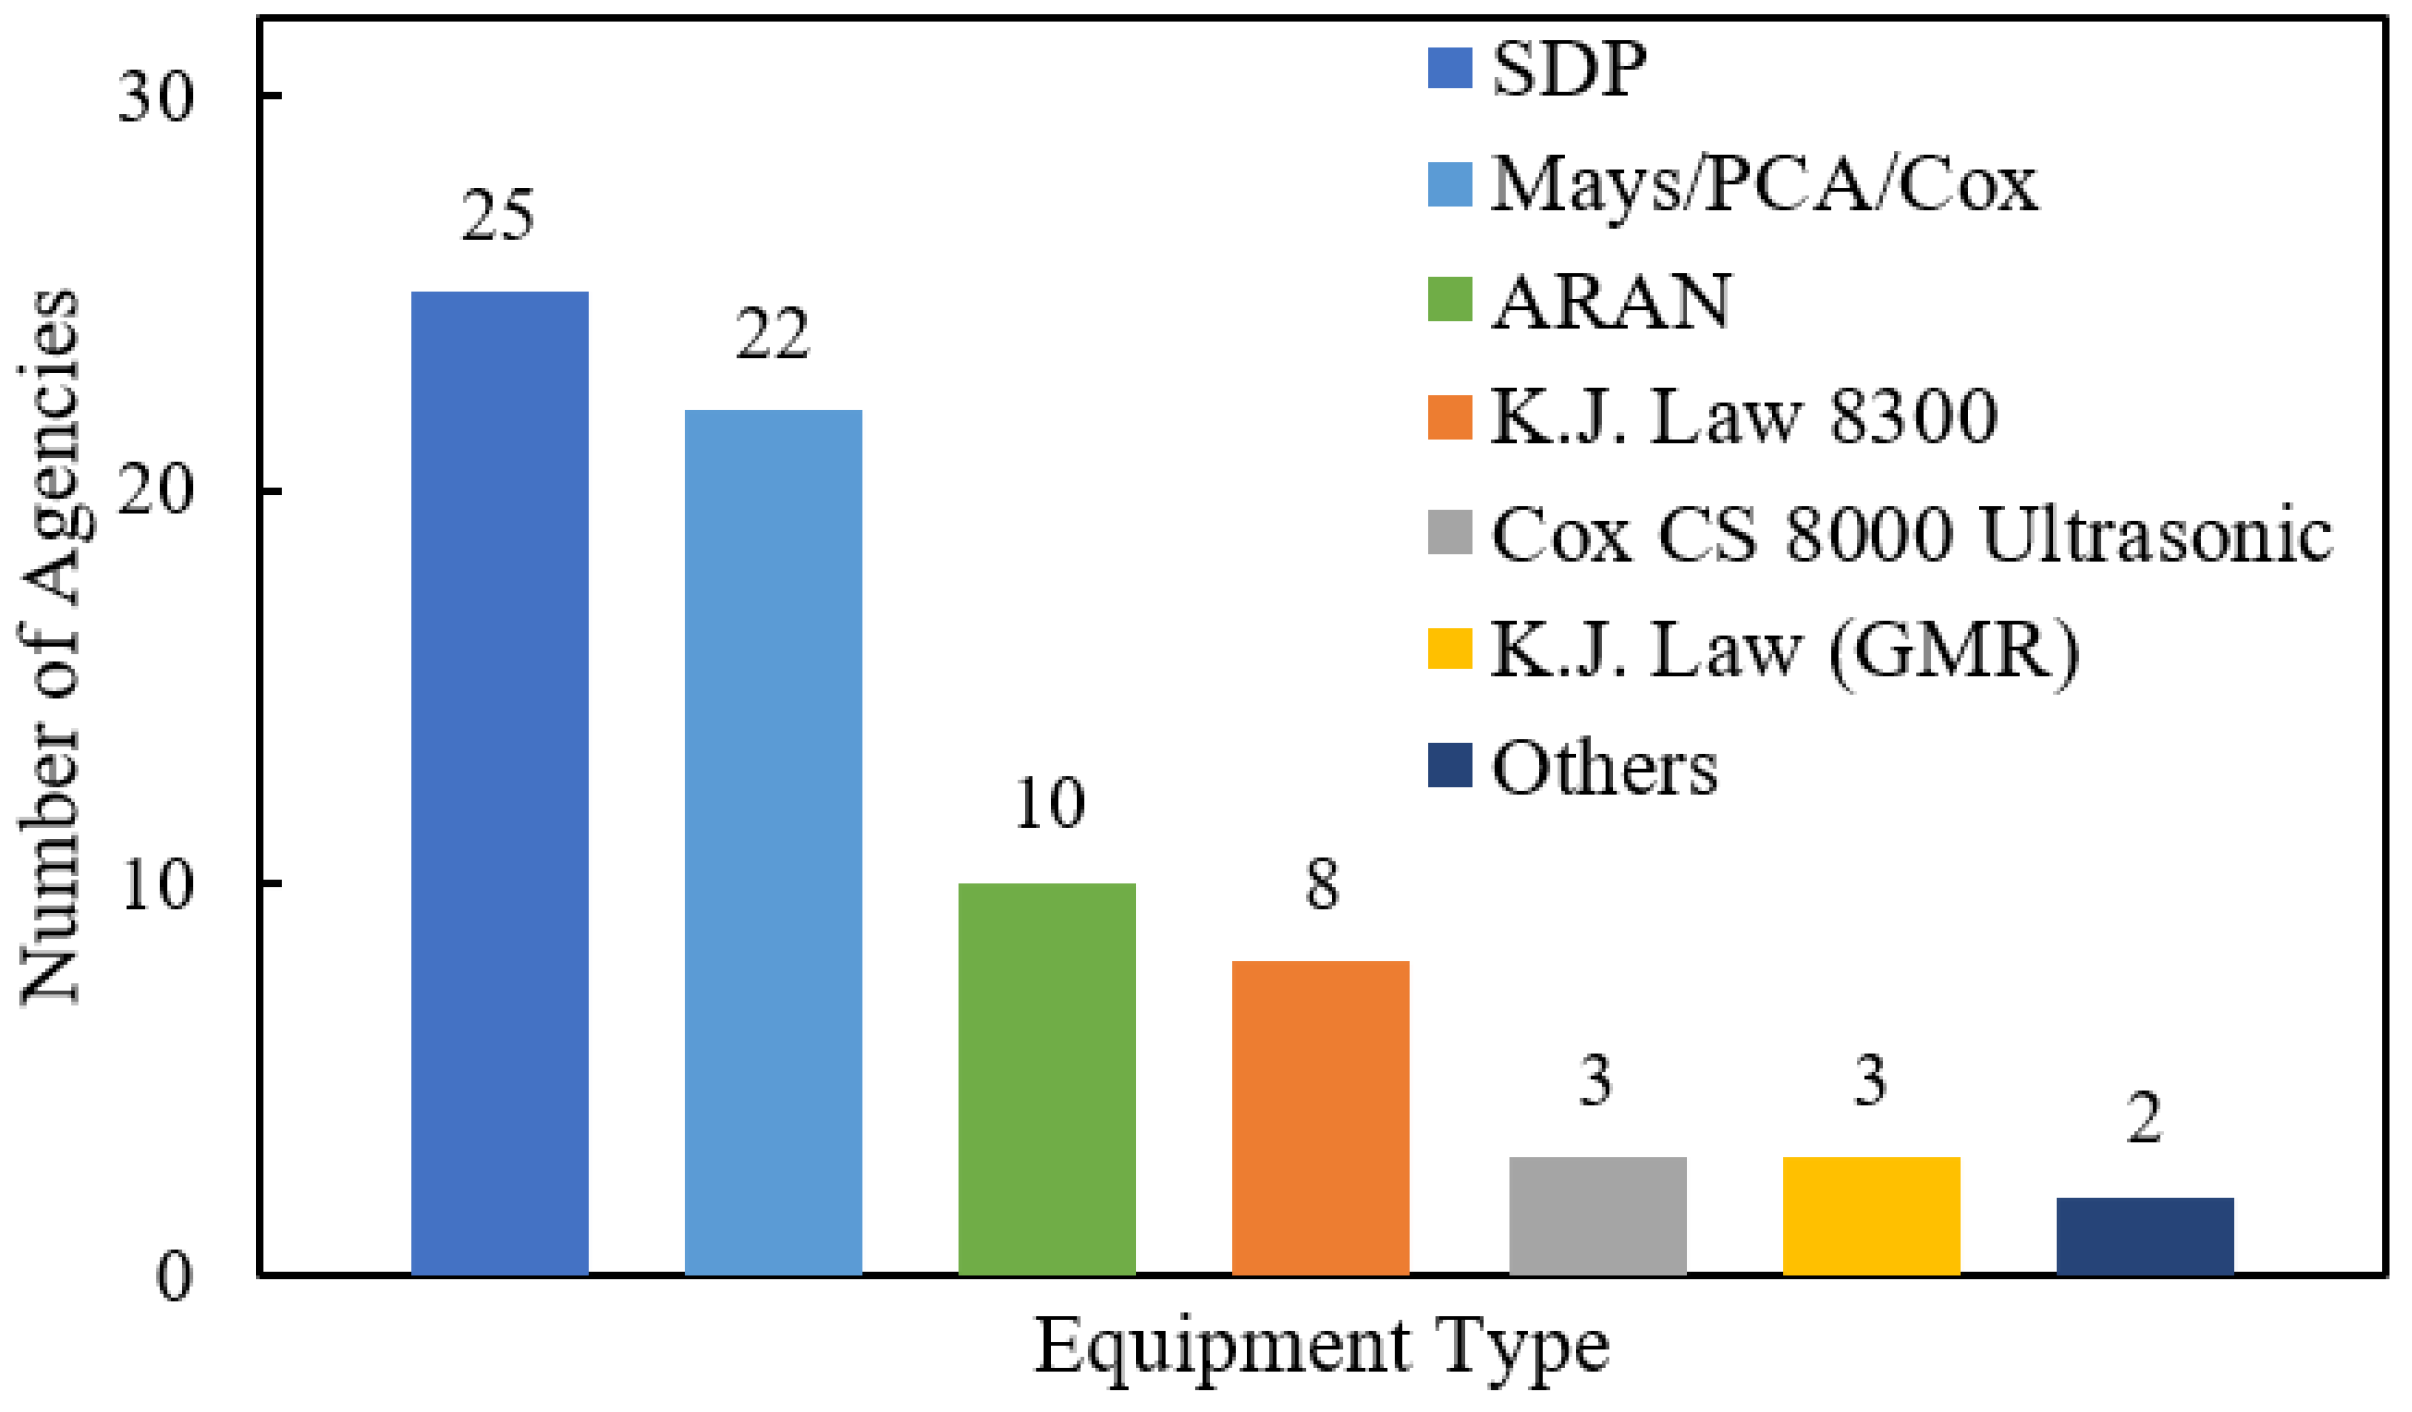
Figure 12 displays the number of pavement roughness measurement equipment pieces owned by surveyed agencies, as reported in the 1994 synthesis [27]. The response-type equipment was still quite popular. A remarkable finding of the 1994 synthesis [27] was the surge in using non-contact profilers.
As shown in Figure 12, Mays, PCA, and Cox ride meters were used by twenty-two agencies. Additionally, ten agencies were using ARAN response-type equipment. The use of contact profilers was limited. Only three agencies were found to use the early contact profiler of GMR. Although the synthesis did not indicate the use of profilographs for the large-scale collection of roughness data, it was noted that many agencies owned and used them for calibration and project-level data collection [27,50].
As shown in Figure 12, twenty-five agencies used SDP. SDP was developed in the early eighties by the South Dakota Department of Transportation. It consists of three subsystems to collect vehicle displacement using accelerometers, vehicle height using ultrasonic sensors, and vehicle distance [63]. Other non-contact profilers included K. J. Law 8300 and Cox CS 8000 Ultrasonic. Ultrasonic-based profilers were the most common in the eighties and early nineties. K. J. Law Model 8300 profiler was among the newer generation equipment where optical sensors replaced ultrasonic sensors.
The era of non-contact profilers was evident, with many agencies transitioning from response-type equipment to non-contact profilers. Up to ten agencies reported using more than one type of equipment. For example, Pennsylvania, Oklahoma, and South Carolina were using SDP in addition to the Mays ride meter. Similarly, West Virginia and Ohio were using the K.J. Law non-contact profilers alongside the Mays profiler [27].
  • Period III: 1995–2009
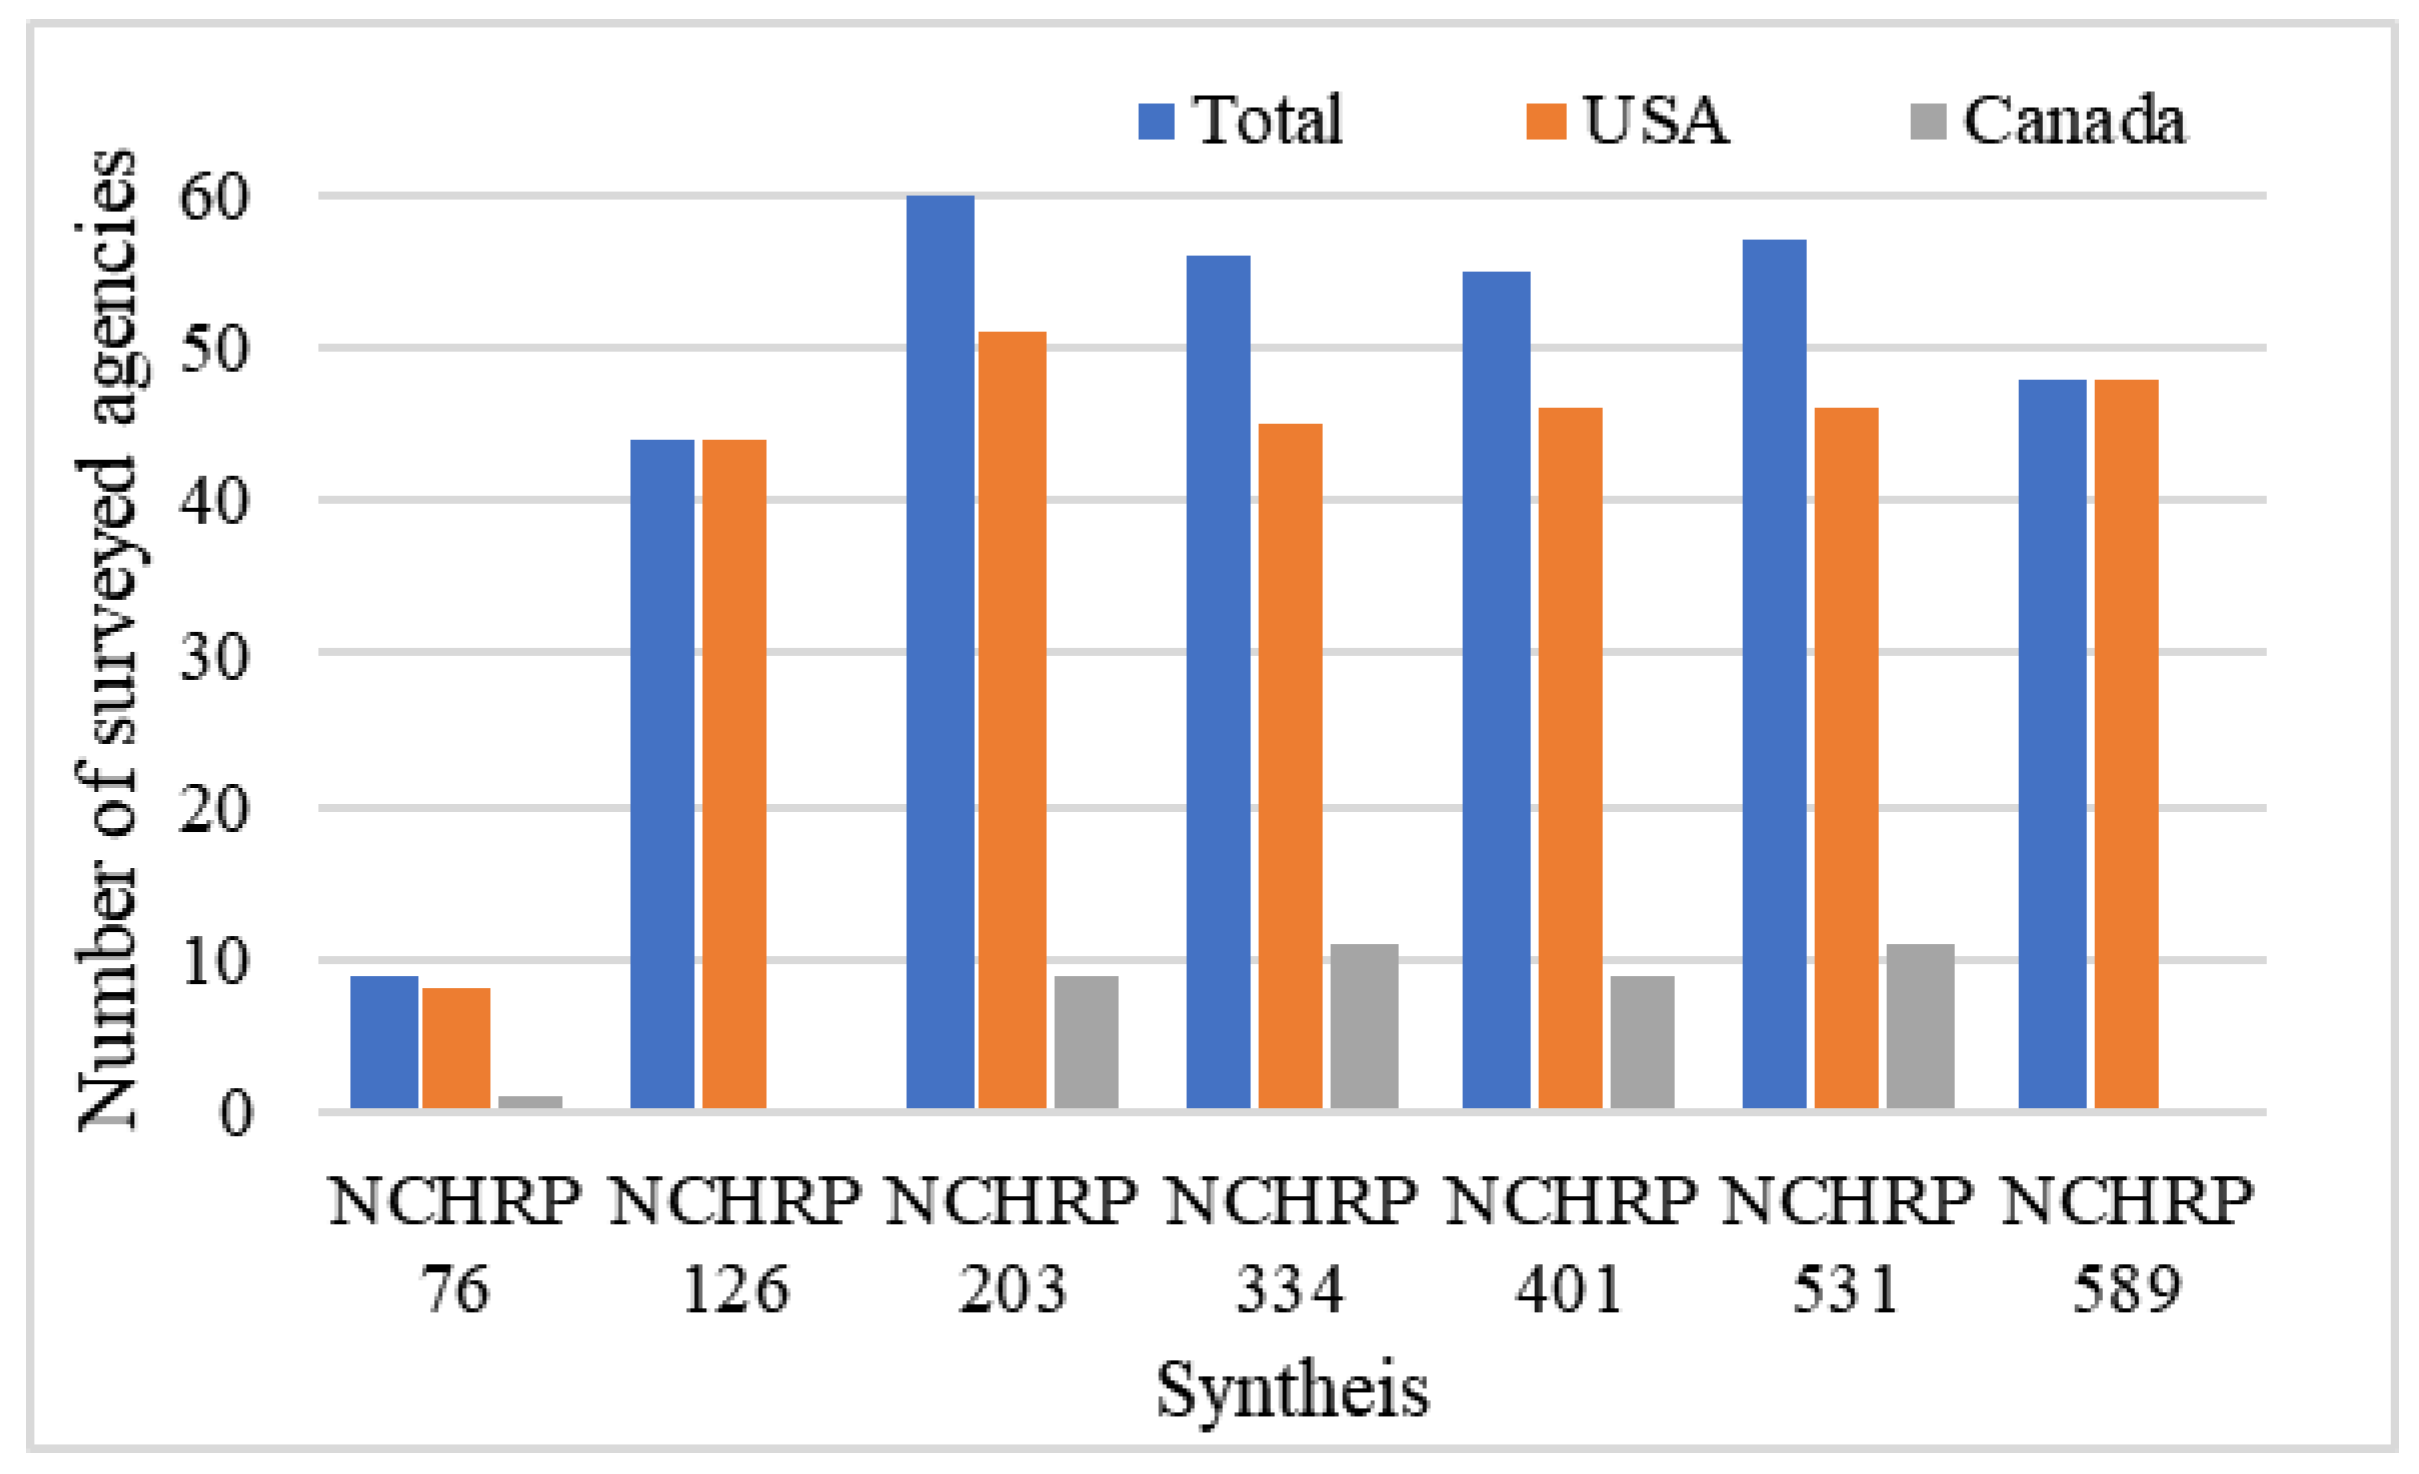
The 2004 synthesis indicated that all the surveyed agencies had transitioned to non-contact profiling equipment. The equipment utilized one of three types of height sensors: lasers, acoustics, or infrared. Of the 51 agencies that reported the type of technology used in their profilers, the majority (86%) used laser-based profilers. Laser sensors enable data collection at intervals of 25 mm or less, at speeds of approximately 96 km/h [23]. Other sensors of acoustics and infrared were less popular, with only three agencies reporting using acoustic sensors, and four reporting using infrared sensors. This shift in sensor technology is significant compared to the previous synthesis [27], conducted ten years earlier, where most non-contact profilers comprised acoustic sensors. Laser-based profilers continued to gain popularity, while the use of acoustics and infrared sensors was entirely marginalized by the 2009 synthesis [37].
The development of 3D imaging systems capable of measuring pavement roughness was noted in the 2004 synthesis [23]. At least two companies (Phoenix Scientific Inc. (San Marcos, CA, USA) and GIE Technologies Inc. (New York, NY, USA)) have reported the development of laser-based 3D imaging systems for collecting pavement roughness and rutting data [23]. The interest in 3D profiling systems experienced a continuous rise in the following years.
  • Period IV: 2010–2022
The use of laser-based systems to collect roughness data has been increasingly prevalent in North America and other parts of the world. Pierce and Weitzel [26] and Pierce and Stolte [2] indicated the popularity of laser-based systems for collecting roughness data. The systems used include point laser profilers and 3D profiling systems. The latter systems were hailed for collecting high-resolution continuous profiles to construct the pavement profile. They can obtain 2D data by capturing the intensity of reflected light and 3D data by capturing the range or depth [26]. The 3D profiling systems are increasingly used to develop fully automated pavement inspection systems. They facilitate surveying for multiple pavement condition data, including roughness, rutting, cracking, and faulting [2,26]. However, Pierce and Weitzel [26] concluded that additional research efforts are necessary to validate the accuracy and repeatability of the 3D profiling systems for measuring road roughness. The synthesis marked the need for a standardized method for calculating IRI using 3D profiling systems.

4.2.3. Roughness Measurement Technologies in Journal Articles

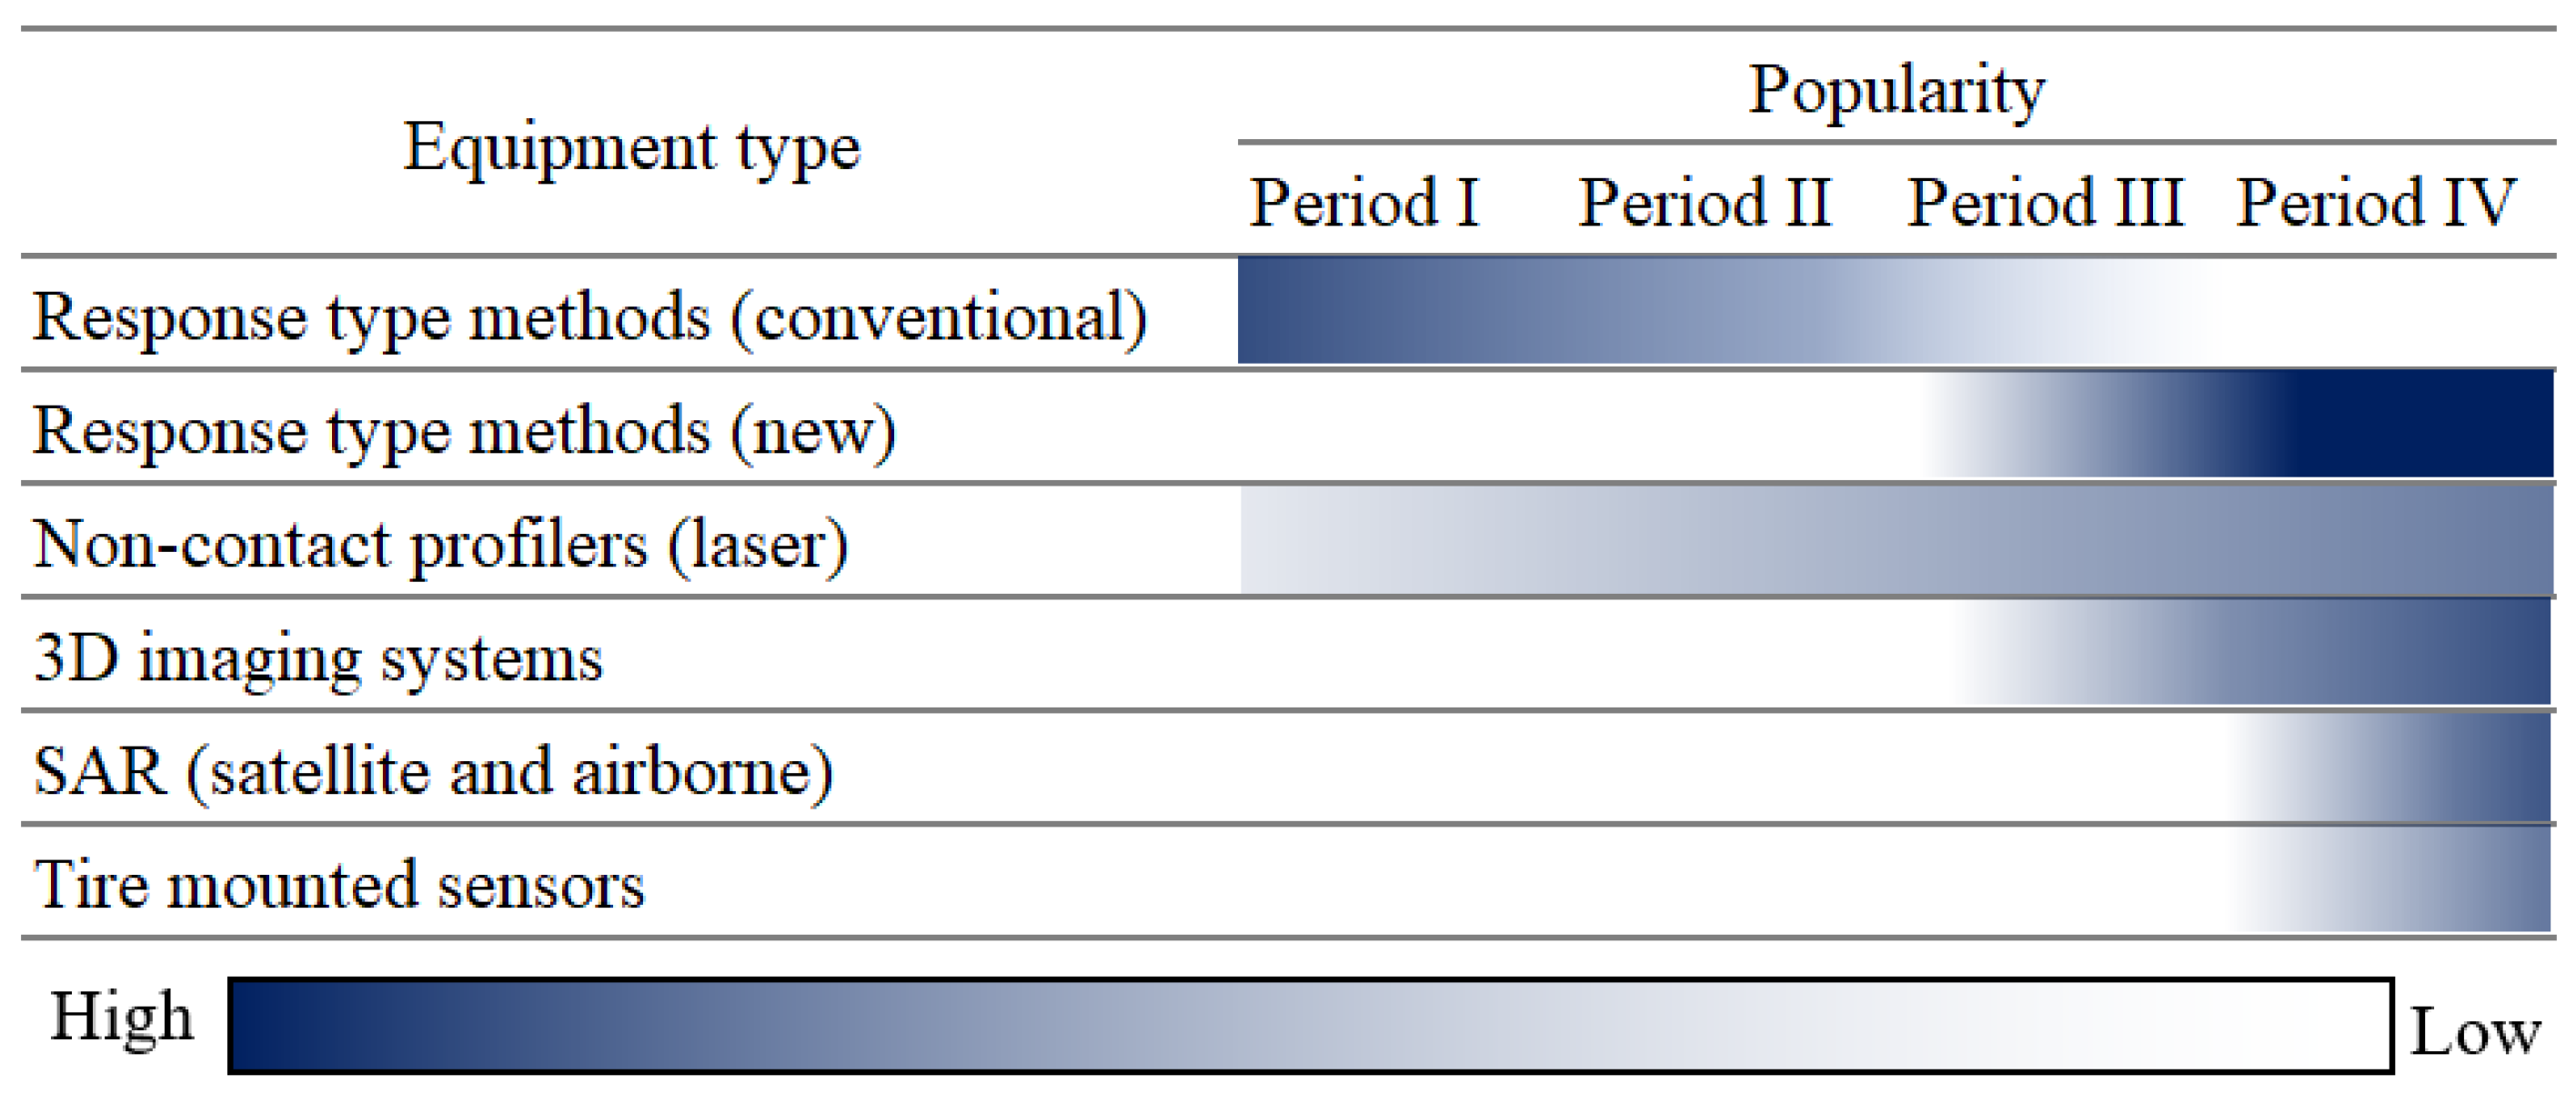
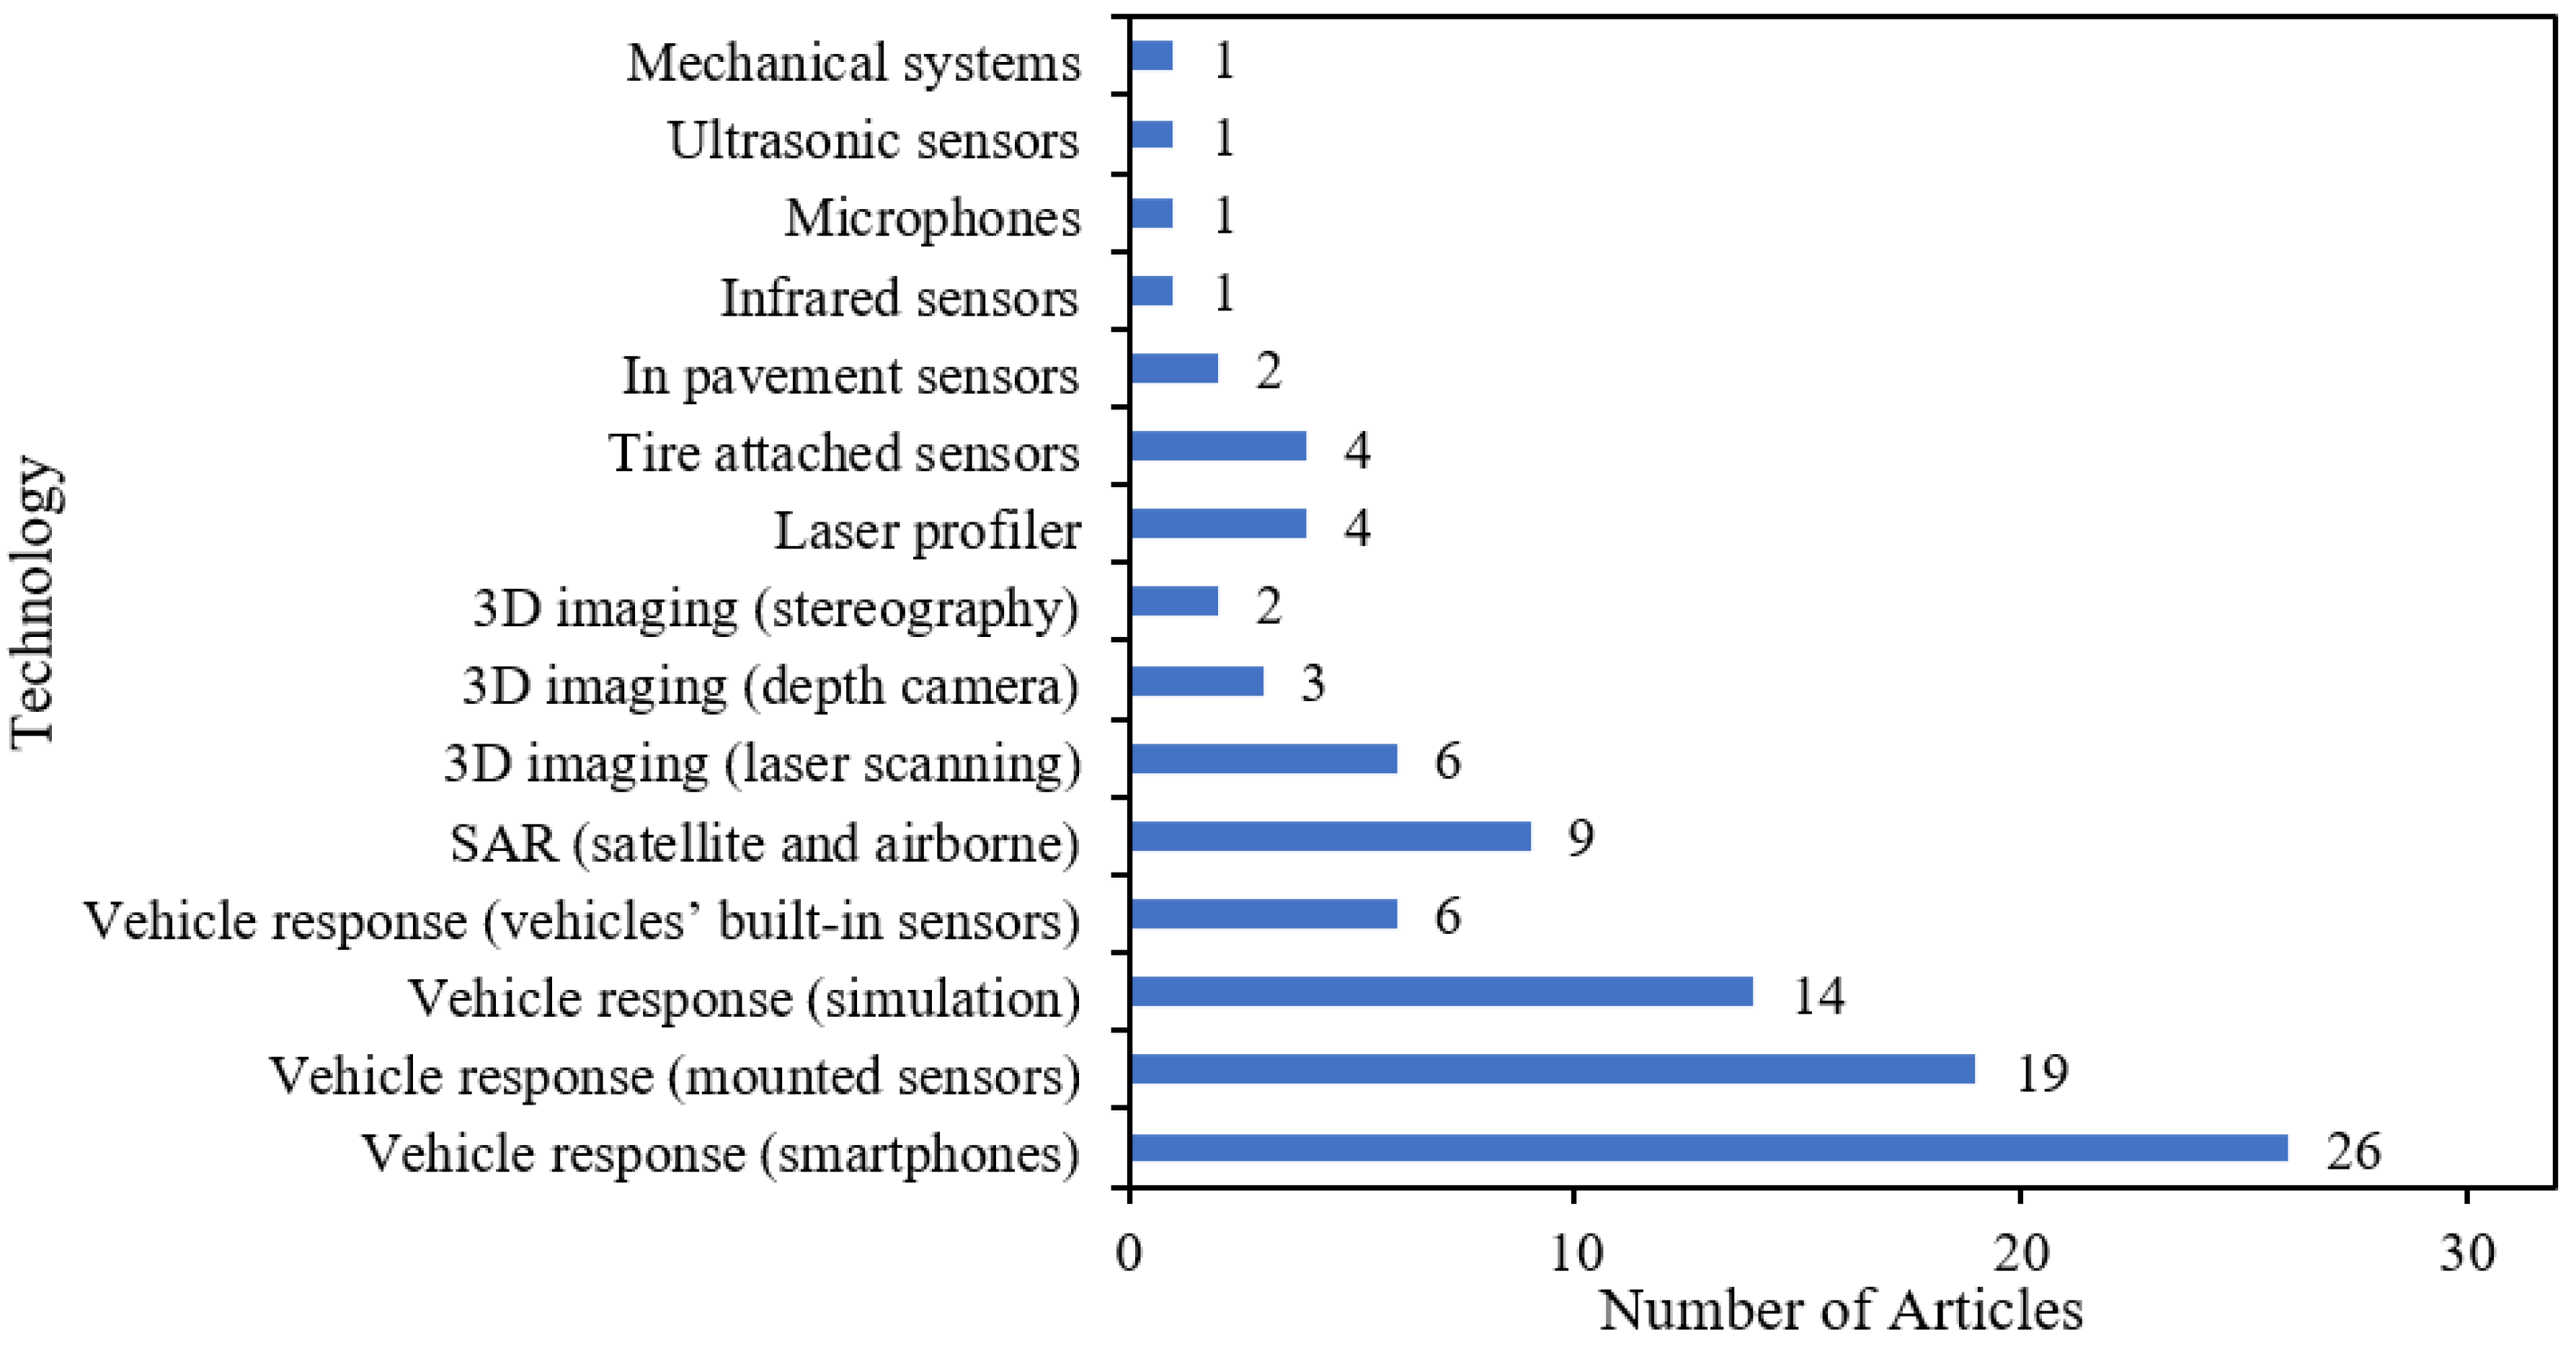
Different technologies have been explored for pavement roughness measurement in the last few decades. Figure 13 shows the popularity of different roughness measurement technologies among the research community throughout the four studied periods. During the 1980s and the early 1990s, most of the research efforts focused on conventional response-type methods. During the following decades, more diverse technologies were investigated. Research exploring response-type techniques was revived, but using new sensing tools, i.e., smartphones, vehicles’ built-in sensors, and cheap mounted sensors. Laser-based profiling equipment was continually explored, though not as a leading research direction. Three-dimensional imaging systems have been explored during the third period. However, they have only become a trending research topic in recent years. Recently, tire-mounted sensors as well as satellite and airborne synthetic aperture radar (SAR) images have been increasingly investigated.
  • Period I: Until 1986
A total of fourteen articles published between 1971 and 1986 focused on studying, developing, calibrating, and comparing different ride quality and roughness measurement methods were analyzed. Eleven of the fourteen retrieved articles were published between 1983 and 1986, indicating a noticeable interest in pavement roughness measurement by the research community in the mid-1980s. Table 6 presents the used roughness measurement methods. As explained in Table 6, most studies (10) focused on response-based equipment, particularly the Mays meter. The same trend of using response-type equipment (Mays meter and a fifth wheel bump integrator) was also vivid in the industry. Some studies experimented with non-contact profilers [73,74].
  • Period II: 1987–1994:
Ten research articles were retrieved in the period that extends between the two syntheses of [25,27]. Eight of the ten articles were published between 1987 and 1989. This indicates a relatively high interest in developing, calibrating, and correlating different equipment and approaches for measuring pavement roughness in the 1980s compared to the early 1990s. Table 7 summarizes the used roughness measurement approach in articles published in study period II.
Reflecting the industry’s state of the practice at the time, most articles (6) focused on response-type equipment. About a third of the articles addressed the calibration of response-type equipment. Two articles reviewed the non-contact profilers of SDP [63] and PRORUT [75]. The correlation of profilographs [76] and Mays meter [77] measurements with ride quality was also addressed. The use of non-contact profilers, including the K.J. Law profiler, to calibrate the Mays meter was also investigated [78]. Only one study suggested a new hardware development by developing a response-type equipment using a transducer only to simplify the device [79]. Noticeably, Huft et al. [63] reported a study of testing and improving the SDP in collaboration with the South Dakota Department of Transportation.
  • Period III: 1995–2009
Little research output (six articles) was retrieved on investigating, development, and correlation of pavement roughness equipment between 1995 and 2009. Table 8 presents the various roughness measurement approaches explored in the analyzed articles. Three articles were published between 1995 and 2004. Lenngren [80] reported the successful experience of The Royal Swedish Fortifications Administration in using a laser-based system called Laser Road Surface Tester (LRST) to measure the roughness of airfield pavement. Another study investigated a response-type system named DYNVIA [81]. Ahlin et al. [82] compared the pavement roughness measured using a laser-based profiler, which measured based on truck wheel vibration using accelerometers [82].
Between 2006 and 2008, three articles were also retrieved. Chang et al. [66] conducted their investigation using a 3D laser scanner for obtaining road profiles. The new approach was compared with an inertial profiler (Multiple Laser Profiler), as well as rod and level. Roughness measures obtained based on the 3D laser scanner and the multiple laser profiler were found to be highly correlated. Chen et al. [83] studied the harmonization of an inertial profiler and a three-meter straight edge. González et al. [39] attached an accelerometer to a vehicle to evaluate pavement roughness. The use of attached accelerometers or those available in vehicles and smartphones will significantly surge in the following years.
  • Period IV: 2010–2022
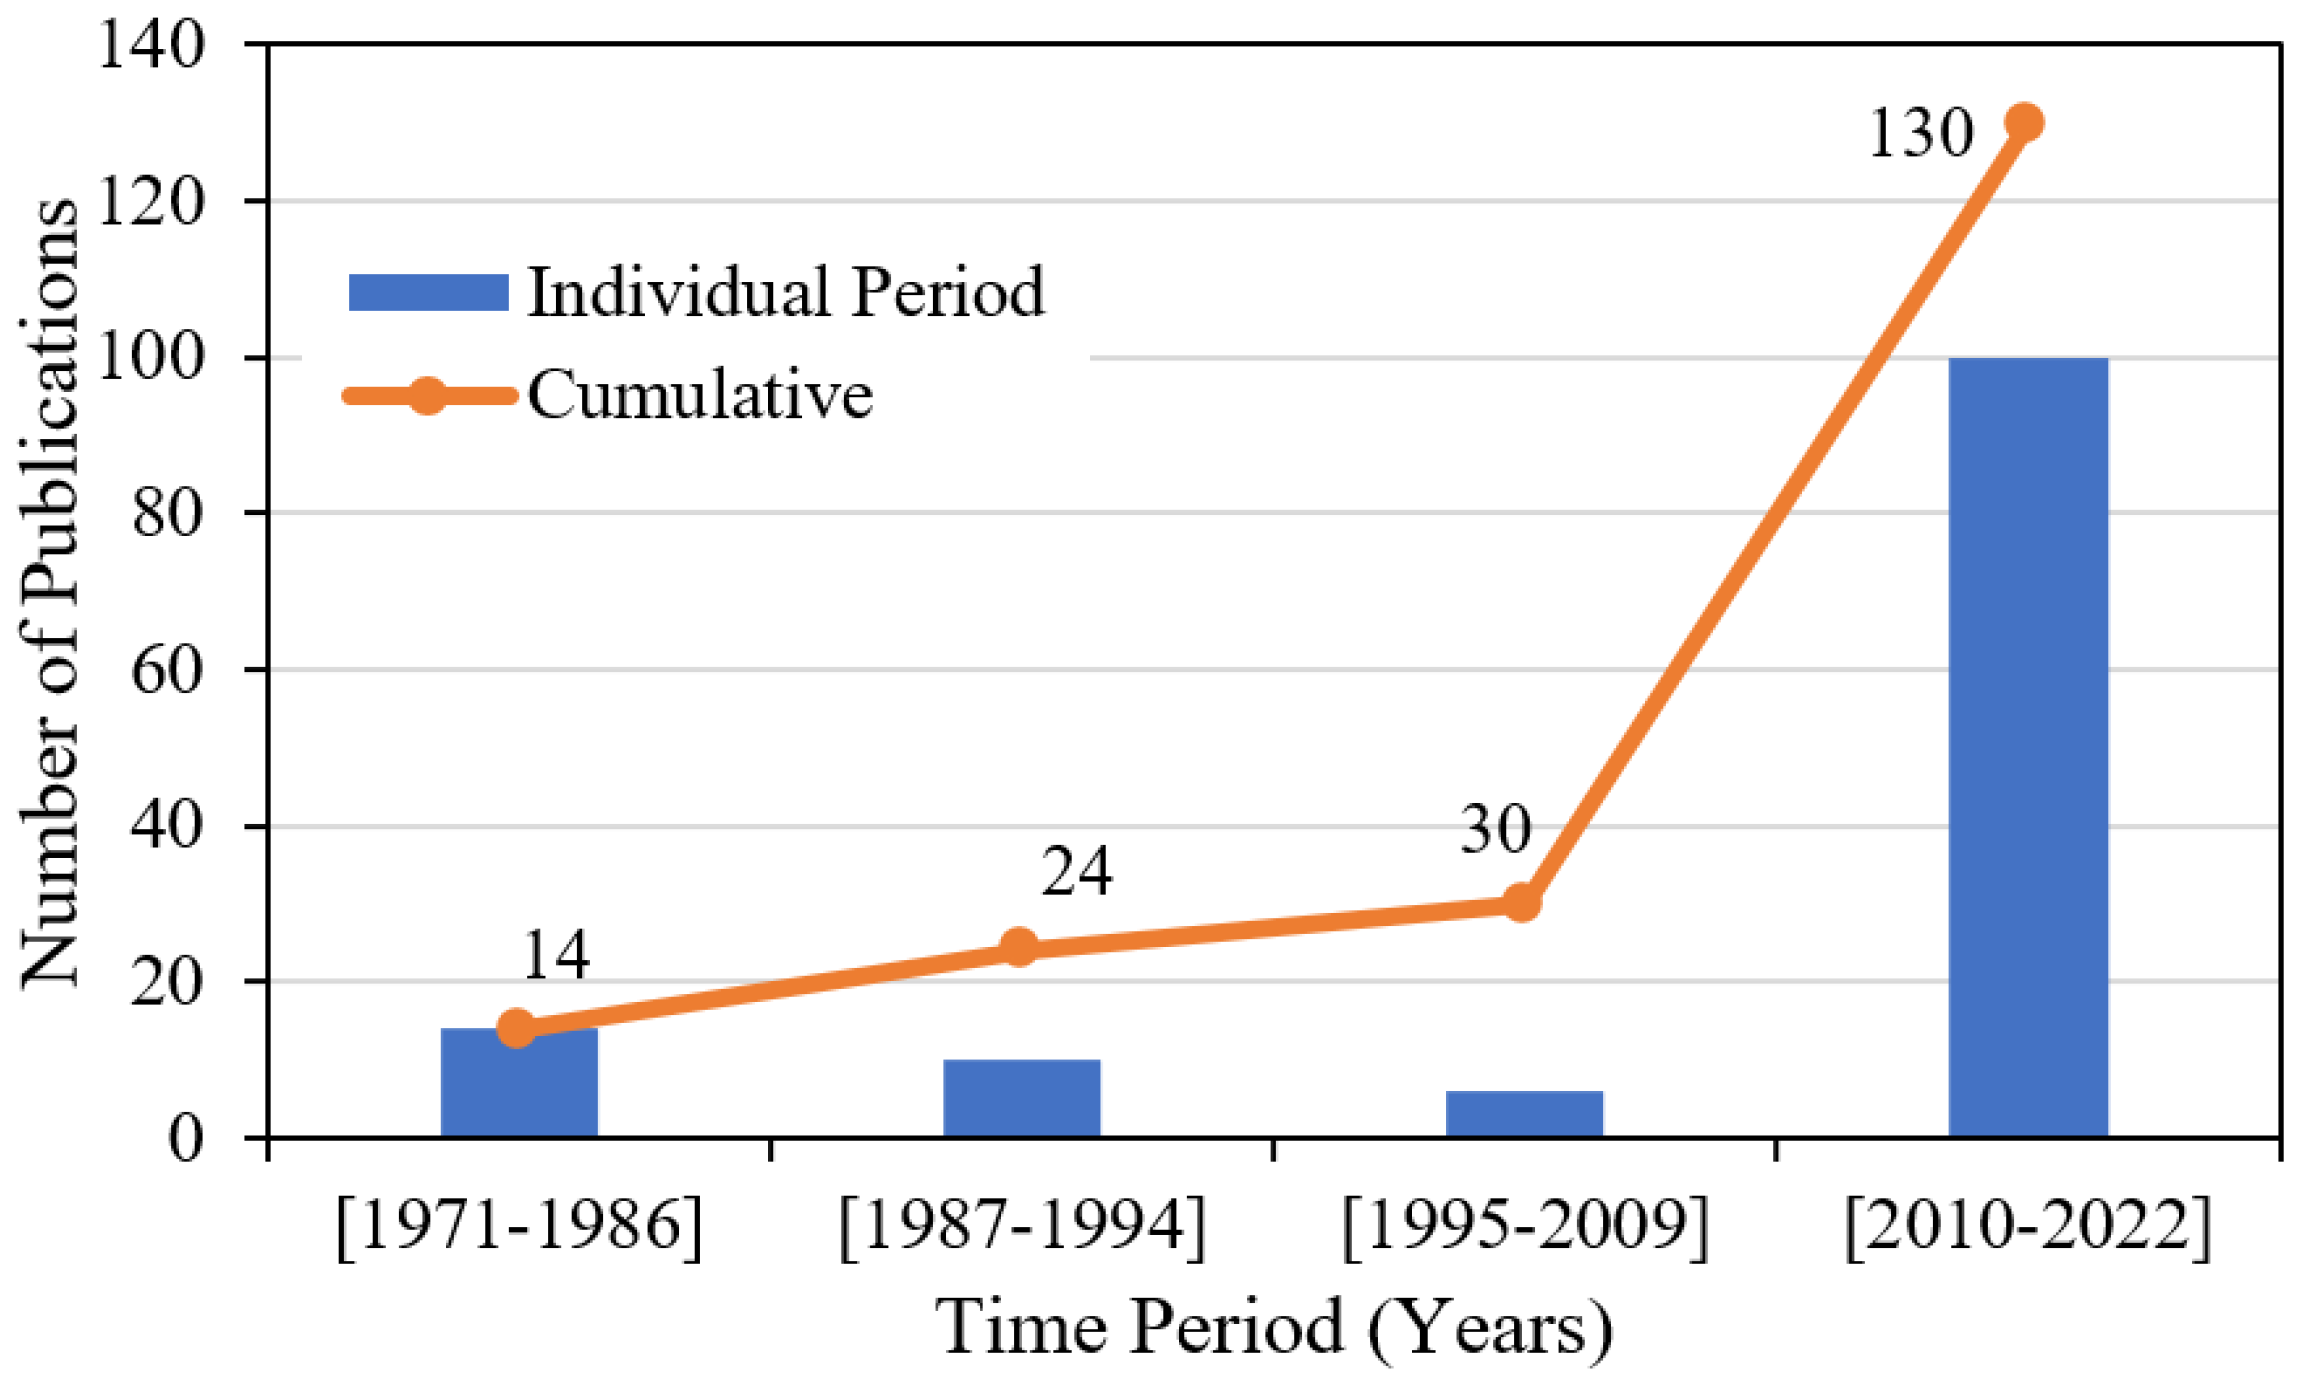
There has been a remarkable surge in research exploring alternative pavement roughness measurement approaches in the past few years. Of the 130 retrieved articles, 100 were published between 2010 and 2022. These articles mainly focused on developing new approaches to increase cost-effectiveness, meet the growing demand for collecting roughness data from new industries, and leverage technological advancements and trends, such as crowdsourcing. Figure 14 shows the various approaches explored for measuring pavement roughness. As depicted in the figure, researchers have explored a diverse range of technologies for this purpose. However, utilizing measured vehicle response through smartphones, vehicles’ built-in sensors, and mounted sensors has emerged as the most prominent trend. These techniques are comparable to the conventional World Bank Class III roughness measurement equipment [84].
  • Acceleration-Based Response-type Approaches
The central theme of research in this period is the use of accelerometers to measure vehicle response for pavement roughness evaluation. The acceleration signals are collected using smartphones, mounted sensors, and vehicles’ built-in sensors or simulated using special software. Most of the studies utilized four-wheeled vehicles to collect smartphone acceleration data. The most commonly used vehicles are passenger vehicles (PV), such as sedans, compact cars, sport utility vehicles, and pick-up trucks [56,84,85,86,87]. Some studies considered buses [88], whereas other studies used a combination of PV and buses [89] as well as PV and heavy-duty trucks (HDT) [90,91]. Only a few studies considered using two-wheeled vehicles of cycles [41] and motorcycles [57].
Smartphones have been increasingly explored as a cost-effective tool for evaluating pavement roughness. The capabilities of smartphones and their widespread use make them an attractive solution. Smartphones are equipped with a variety of sensors, including GPS and accelerometers. The smartphones’ built-in sensors can be leveraged to collect data required for pavement roughness evaluation. Additionally, smartphones support the transference of the collected data readily through Wi-Fi or mobile data. Furthermore, the use of smartphones for data collection is handy and does not require specialized personnel.
Smartphones measure roughness based on the vehicle response rather than the direct pavement profile. Thus, multiple variables can affect the collected data, including the smartphone type, vehicle model, driving velocity, mounting arrangement, and sampling frequency. Table 9 lists the studies that explored the effect of the main factors affecting pavement roughness evaluation using smartphones.
Smartphones measure acceleration using the embedded micro-electromechanical systems inertial motion unit (MEMS IMU). Thus, the measured acceleration is expected to vary depending on the embedded MEMS IMU. Different smartphones have MEMS IMU with distinct hardware, antenna size, and installation location. For example, variation in the embedded accelerometers can affect the reliability of the data and bias the measured roughness. Accelerometers with a resolution of 10 mm/s2 introduce double the inherent noise compared to that having a resolution of 1 mm/s2 [56]. The effects of smartphone type on pavement roughness measurement have been widely studied, with multiple studies reporting a significant impact [56,85,90,93,94,95]. For example, Zhang et al. [92] reported a relative error of up to 11%, which they considered tolerable.
Variations in the vehicles’ dynamic systems lead to differences in the filtering of vibration caused by road roughness [95]. Most studies reported a significant impact of vehicle model variation on the measured pavement roughness [85,89,90,94,95,96]. For example, Hanson et al. [94] reported that the difference between the measured IRI and the reference value varied from 5.4% to −11.9% when measured using a compact car (2001 Pontiac Sunfire) and a sport utility vehicle (2011 Nissan Rogue), respectively. However, Botshekan et al. [97] indicated that well-trained machine learning models could be used for different types of vehicles. Additionally, Jeong et al. [102] suggested that the use of gyration (i.e., angular velocity) can minimize the effect of vehicle model variation.
Vehicle speed was reported to have a remarkable effect in the majority of the studies [55,89,90,95,98,99]. It was remarked that higher speed results in an increased excitation in the vehicle suspension. Thus greater amplitude and acceleration are observed [95]. For example, Bisconsini et al. [95] experimented with speeds of 40, 60, and 80 km/h as well as a speed varying between 30 and 120 km/h. The study reported the lowest correlation between the smartphone-based and reference roughness measures (R2 = 0.65) at varying speeds. The highest correlation (R2 = 0.86) was found at a 60 km/h speed. However, it is crucial to indicate that effect of the speed variation depends on several factors, including the range of speed variation, the types of wavelengths present in the pavement profile, and the vehicle’s dynamic system [94,95]. However, Hanson et al. [94] reported a limited impact of speed change from 50 to 80 km/h in their study. Additionally, Botshekan et al. [97] reported a lower impact of speed variation for larger-scale surveys.
The ideal scenario is to collect the chassis response directly. However, this is not practical when using smartphones. Moreover, the mounting arrangement may differ significantly under normal usage conditions when using smartphones as a crowdsourcing tool. The mounting arrangement was found to have a considerable effect on the measured roughness [55,89,90,94]. For example, Hanson et al. [94] found that the vent mounting arrangement increased the relative error of the measured roughness to about 86% compared to 1% for the best performing arrangement of windshield mounting. However, Bisconsini et al. [95] concluded a limited impact of the mounting arrangement. In general, a rigid mounting arrangement is preferable to acquire the chassis vibration as accurately as possible [95,97].
The sampling frequency is another important factor that can affect the evaluation of pavement roughness. A higher sampling frequency is better for improving the signal quality as well as the consistency and reliability of the results [56,93,101]. Some studies used sampling rates as high as 400 Hz [56], whereas others explored sampling rates as low as 16 Hz [57]. Multiple studies used a sampling frequency of 100 Hz [41,99,102]. Alatoom and Obaidat [55] investigated four sampling rates of 25, 50, 100, and 200 Hz. The best performance was reported as the highest sampling rate of 200 Hz. Additionally, Zeng et al. [101] indicated that fewer runs are required to achieve results at a tolerance error rate of 10% at an acceptance confidence level of 95% at a higher sampling rate. Bridgelall [100] reported a similar trend after comparing eight sampling rates.
Results inconsistency in using smartphones is a major limitation [92]. To improve the accuracy and consistency of the results, Opara et al. [103] and Zhang [92] suggested averaging the IRI values calculated using different smartphones. Moreover, it was frequently reported that increasing the number of samples helps overcome this limitation. Bisconsini et al. [95] illustrated that increasing the number of traversals from five to ten reduced the coefficient of variation from 10–20% to 4–9%. Bridgelall [88] reported that using 30 traversals from 18 buses reduced the margin of error to less than 6%. Similarly, Ahmed et al. [93] suggested having 24 and 35 traversals for paved and unpaved roads, respectively. Medina et al. [90] indicated the need for 50 to 60 traversals. Improving consistency can be achieved by utilizing smartphones as a crowdsourcing tool. In fact, several articles promoted the use of smartphones as crowdsourcing tools and suggested analyzing a combination of data from different sources [57,90,91].
Two articles developed ML models to predict road roughness using signals obtained using smartphones. Jeong et al. [102] developed a CNN model to calculate IRI using images representing the raw time–history measurement of the vehicle response. Gamage [104] developed an extreme gradient boosting to calculate IRI using features describing the obtained signal: the mean, maximum, and standard deviation of acceleration signals, the number of spikes in x, y, and z directions, as well as the average speed of the vehicle.
Mounted accelerometers that constitute a more similar approach to the early response-type methods have been investigated in combination with different types of sensors. Many studies have explored using accelerometers mounted to vehicles to measure pavement roughness. Attached accelerometers can better acquire the vibrations of vehicles’ chassis by reducing the variability caused due to smartphone mounting. However, compared to smartphones, their use is more challenging due to the need for additional sensors such as GPS and special arrangements to collect, store and transfer the data.
Nineteen articles published during the fourth study period were analyzed. Most studies used field tests for data collection and validation, whereas only two used testbeds. Some studies used simulated data alongside real field testing [105,106,107]. Additionally, most of the studies explored the effect of vehicle speed, whereas only a few articles investigated the impact of vehicle type, mounting arrangement, and sampling rate on the measured roughness, as presented in Table 10.
Similar to the discussion made for smartphones, speed was reported to have a significant impact on the measured pavement roughness [44,61,106,107,108,109,110]. It was noted that the higher the speed, the greater the excitation of the vehicle’s suspension, resulting in signal amplification [61]. For example, Chen and Xue [107] developed a road roughness level identification model based on the BiGRU network. The model’s overall accuracy dropped drastically from about 95% to less than 30% when tested on data collected at speeds of 20 and 80 km/h, respectively. However, Li et al. [111] utilized the inverse pseudo-excitation method (IPEM) to calculate IRI by measuring vehicle suspension. Li et al. [111] reported limited variation of measured roughness due to speed variation (40–120 km/h) using his model. Moreover, some publications suggested corrections of the measured acceleration or roughness considering the variation in speed [51,112].
Li et al. [111] reported a significant impact of the vehicle type on measured roughness. Mounting arrangement and sampling rates were reported to impact the measured roughness as well. Li et al. [108] reported a significant increase when lowering the sampling frequency. The absolute error doubled when the sampling frequency was downgraded from 200 to 25 Hz. The use of sampling rates lower than 100 Hz was discouraged to avoid unreliable results [108]. Chou et al. [61] found that placing the sensor on the dashboard gave better results compared to the floor of the passenger seat and the floor of the central seat.
Table 10. Major studied attributes affecting pavement roughness evaluation using attached accelerometers.
AttributesArticles
Vehicle Type[111]
Mounting arrangement[61]
Speed[44,61,106,107,109,110,111,113]
Sampling rate[108]
Chen and Xue [107] developed an ML model using a bidirectional gated recurrent unit (BiGRU) network. The model used the acceleration of the vehicle as well as the wheel to classify the roughness level of the road. Liu et al. [105] developed an improved restricted Boltzmann machine deep neural network algorithm based on the Adaboost Backward Propagation algorithm. The input of the model was the vehicle acceleration and pitch acceleration, whereas the output was the road roughness class.
Built-in sensors available in connected cars are one of the promising approaches to evaluating pavement roughness [114]. It offers an alternative to using specially equipped vehicles and skilled technicians. Compared to smartphones, it minimizes the number of variables affecting the collected signal, particularly eliminating the variability of smartphone type and mounting arrangement. In addition, it allows for the utilization the known information of the vehicle type. Six studies explored the possibility of using vehicles’ built-in sensors for pavement roughness measurement [45,54,58,59,115,116]. Most studies used simulated data in addition to the data collected from vehicles’ built-in sensors [45,58,59,115]. Mahlberg et al. [54] explored the pertinence of using crowdsourced data from connected vehicles for pavement roughness evaluation. Moreover, Liu et al. [45] demonstrated the applicability of using crowdsourcing and semi-supervised learning to evaluate pavement roughness.
Nitsche et al. [115] developed three models using ANN, SVM, and random forests to predict road roughness. Thirty-five features derived utilizing the output of the vehicle response simulation were used to calculate the weighted longitudinal profile. The random forests model was reported to demonstrate the best performance. Interestingly, Liu et al. [45] developed a semi-supervised learning model to work with data coming from vehicles of known types. The model utilizes a set of data obtained for roads of known roughness and unknown vehicle type and a smaller set of data from known vehicles passing over roads of known roughness. The model can work to predict both the vehicle parameters for vehicles of unknown type and the roughness.
Simulated acceleration data representing vehicle vibration due to surface irregularities that has been investigated to assess pavement roughness. Thirteen studies used simulated acceleration data exclusively to develop and test road roughness evaluation. Multiple studies used specialized simulation software, including ADAMS software (2) and CarSim (1). They were used to simulate the interaction between pavement and vehicles. Most studies (9) implemented their models using MATLAB software. Studies developed simulation models of different degrees of freedom (DOF), including two (6), three, six, and nine (1), four (3), and seven (3).
Seven articles used ML algorithms in their studies. Types, input, and output of the used ML models are shown in Table 11. As presented in Table 11, different variations of the neural network were used in the seven studies. Wang et al. [117] found that the performance of ANN was comparable to the random forest and better than that of the decision regression tree. Most of the articles developed supervised ML regression models. Five articles developed ML models to predict quantitative values of pavement roughness. One article developed an ML model to classify pavement roughness, considering five roughness classes. Additionally, one study developed both classification and regression ML models. Inputs of the different ML include features describing vehicle suspension, including vertical acceleration. Wang et al. [117] demonstrated the importance of including additional features, including vehicle type and speed, to boost the models’ performance.
  • 3D Imaging Systems
Multiple studies have used 3D imaging systems for pavement roughness measurement. Different 3D imaging systems were explored considering one of the three main motives: cost reduction, operation at varying speeds, and development of integrated systems to collect various condition data in addition to roughness. Several studies [35,36,113] explored using low-cost depth cameras instead of the relatively expensive laser profilers to evaluate pavement roughness. The use of 3D systems to construct the road profile for evaluating road roughness is proposed to overcome the limitations of laser profiler at evaluating roughness at low and varying speeds [114]. Additionally, 3D data can be used to assess other pavement condition aspects, including cracking, potholes, and patching [113]. Additionally, such systems can be mounted on unmanned aerial vehicles (UAVs) to reduce the time, costs, and efforts required for roughness data collection [115].
Depth cameras were used in three studies published between 2015 and 2022 for assessing pavement roughness. Specifications of the used depth cameras are presented in Table 12. As presented in Table 12, the Intel depth camera (D435i) utilizes stereoscopic technology using imagers, whereas the Microsoft Kinect One utilizes time-of-flight technology using an infrared sensor and a camera. Aleadelat et al. [69] utilized a low-cost Intel depth camera (D435i (Intel RealSense, California, USA)) to evaluate pavement roughness. After scanning road pavement, a depth stream was extracted. Subsequently, the depth stream was filtered to generate the road profile to ultimately evaluate pavement roughness as IRI values. The proposed approach successfully classified 76% of the tested road segments into the correct road performance category as per the FHWA IRI threshold. Mahmoudzadeh et al. [68] and Khalifeh et al. [67] used RGB-D sensors (Microsoft Kinect One (Microsoft Corporation, Redmond, WA, USA)) to capture 3D images. The developed technology was reported cost-effectively with good precision and accuracy. However, the vertical measurement resolution of both camera cameras is larger than 0.01 mm [69,121]. Thus, both are comparable to class 4 profilers, according to ASTM E1950-2018 [64,69].
Laser-based 3D imaging systems were also used for pavement roughness measurement. Tran and Taweep [122] and Kumar et al. [123] used mobile laser scanner (MLS) systems to construct 3D point-cloud data along the road. The main components of the GT–4 and XP-1 systems used by Tran and Taweep [122] and Kumar et al. [123], respectively, are presented in Table 13. GT–4 MLS system was developed by Aero Asahi Corporation (Tokyo, Japan), whereas the XP-1 MLS system was produced at the National University of Ireland Maynooth (NUIM) [122,123]. Both systems include laser scanners, GPS units, and cameras. The systems can be mounted on vehicles and support data collection at different speeds. Tran and Taweep [122] reported collecting data at an average 50 km/h speed. The developed approaches were reported to be able to evaluate pavement roughness with high accuracy. It can also be used to calculate the roughness at any track on the road. However, this approach is more data-intensive compared to conventional point laser profilers.
Additionally, stationary laser scanners were used to obtain 3D point cloud to evaluate pavement roughness. Alhasan et al. [125] used a Trimble CX 3D STLS system to assess the pavement roughness of two pavement sections of only 105 m. Although both studies illustrated the ability of stationary laser scanners to accurately evaluate pavement roughness, their use is not practical for large-scale data collection programs.
Other studies used line laser sensors to develop 3D imaging of pavement surfaces for roughness evaluation. Lee et al. [126] and Guo et al. [70] developed line laser-based systems to obtain the 3D profile of pavement surface to measure road roughness. Both systems include two laser scanners. Other sensors and tools are used, including cameras and DMI units (for spatial referencing). The proposed systems were claimed to support roughness measurement at low and varying speeds with high accuracy. Lee et al. [126] reported that the system is reliable for unpaved roads.
Abohamer et al. [127] evaluated pavement roughness by employing ANN and multinomial logistic (MNL) regression models and classified pavement sections into different roughness categories based on 3D images. Additionally, a convolutional neural network (CNN) was used to predict IRI. The study used 3D images obtained from Louisiana Dot and Development (LaDOTD) pavement management system (PMS) inventory. Compared with IRI values from the inertial profiler, the CNN model predicted IRI with a coefficient of determination (R2) of 0.985 and an average error of 5.9%.
Stereography was used by multiple studies to generate 3D images of pavement profiles for roughness evaluation using 2D cameras. Botha and Schalk [128] used two low-cost cameras and an inexpensive inertial navigation system (SPAN-CPT) to construct road profiles for roughness evaluation. Prosser-Contreras et al. [71] developed a system that constitutes a camera and GPS unit mounted on a UAV to evaluate pavement roughness. The method was found to be cost and time efficient. However, it suffers from multiple limitations that necessitate further research. One limitation is the requirement to have the road be traffic-free. Another limitation is the vulnerability of the data quality to the weather and lighting quality.
  • Synthetic Aperture Radar
The use of SAR technology for evaluating pavement roughness has been the focus of multiple studies [24,129,130,131,132,133,134,135]. SAR data from X-band [132,133,134,135], L-band [24,131], and C-band [130] was investigated for pavement roughness estimation. The data were collected using various satellites such as Sentinel-1 [24,130], Sentinel-2 [132], Cosmo-SkyMed [129], and Advanced Land Observing Satellite (ALOS) [131]. Moreover, different ML algorithms were utilized to evaluate pavement roughness. Fiorentini [24] explored various ML models to evaluate roughness and concluded the superiority of SVM. Bashar and Torres-Machi [130] applied deep learning to estimate the IRI. The developed model predicted IRI values with a mean absolute error of about 0.23 m/km (14.6 in/mile). Karimzadeh and Matsuoka [134] used the SAR backscattering values to assess IRI. The study reported a loose correlation with the reference values obtained using BumpRecorder software (BumpRecorder Co., Ltd., Tokyo, Japan) and a smartphone. However, multiple studies developed models to classify the roads based on their roughness. Karimzadeh and Matsuoka [132] suggested a qualitative assessment instead of quantifying pavement roughness due to insufficient image resolution. Karimzadeh and Matsuoka [132], Suanpaga et al. [131], and Meyer et al. [129] classified roads into two classes; roads with good and bad roughness.
Satellite data offer wide-scale coverage, which can minimize the time and cost required for pavement roughness evaluation. However, the applicability of using satellite data for pavement roughness evaluation is still debatable at the current stage. Thus, more research is required before assuming the robustness of this technology with the low-resolution publicly available satellite images. Alternatively, Babu et al. [133] and Rischioni et al. [135] used high-resolution airborne polarimetric SAR images to evaluate pavement roughness. The two studies utilized DLR’s airborne radar sensor F-SAR to acquire fully polarimetric X-band datasets. The estimated roughness was highly correlated with reference values obtained using a handheld laser scanner. The proposed method sounds more robust compared to satellite SAR-based approaches.
  • Tire Pressure Sensors
Few studies explored attaching sensors to vehicle tires to measure pavement roughness. (Zeng et al. [136] estimated the IRI using a tire pressure sensor. The study employed a combination of ideal gas low and elastic contact models to derive a nonlinear relationship between tire pressure and contact force. The results indicate reliable IRI values, especially at low vehicle speeds, can be obtained. Zhao et al. [137] and Zhao and Wang [138] developed a new method based on dynamic pressure sensors and axle accelerometers to evaluate pavement roughness. The measured IRI values were comparable with those obtained using a laser profiler. Differently, Yang et al. [139] employed machine learning algorithms to classify road roughness levels based on data collected using an intelligent tire system with a piezoelectric cable. The layout of the piezoelectric cable was optimized using a finite element model.
  • Other Technologies
Other technologies have been explored for measuring pavement roughness, such as mechanical profilers [140] and directional microphones (acoustic-based method). Becker and Els [140] developed a mechanical profiler called Can-Can Profilometer that was suggested to be useful for obtaining 3D data for research purposes. Additionally, Zhao et al. [141] developed an acoustic-based method that utilizes five directional microphones mounted on a vehicle to evaluate road roughness. The study developed an algorithm to assess pavement roughness based on the principle that higher sound pressure is associated with higher pavement roughness. However, the robustness of the model is questionable as the used algorithm was built using roughness data less than 2 m/km.
In-pavement strain sensors (optical fiber sensors) have been explored on a limited scope through laboratory and limited field experiments for pavement monitoring [142], including roughness evaluation [42,143]. While the technology has shown considerable potential, its practicality remains questionable due to the need for optical fiber infrastructures. The implementation of such infrastructures can be costly, and it may not be practical for many pavement monitoring applications, especially in remote or hard-to-reach areas. Nonetheless, the technology remains a promising avenue for future research and development, and ongoing efforts are being made to improve its practicality and cost-effectiveness.
Infrared sensors and ultrasonic sensors are cost-effective methods that hold potential for small agencies with limited resources. These sensors have shown promise in various pavement monitoring applications, including roughness evaluation, and can offer an affordable alternative to more expensive measurement technologies. While they may not provide the same level of accuracy as higher-end sensors, they can still offer valuable insights into pavement condition and can be a useful tool for smaller agencies looking to prioritize maintenance and rehabilitation efforts.

5. Current Trends, Research Gaps, and Future Directions

5.1. Industry Practices

The techniques used in practice for pavement roughness measurement have been evolving over the years. The most apparent trend is the increasing popularity of laser-based technologies. Laser-based inertial profilers have gained significant momentum in the last three decades. Moreover, 3D imaging systems are increasingly used for pavement condition surveys to collect different types of data, including roughness.
Thirty-four pieces of equipment from over twenty vendors across various countries were reviewed to identify the state of the practice for pavement roughness measurement. Details of the reviewed pieces of equipment are presented in Table 14. As revealed in Table 14, half of the reviewed equipment (17) are profilers of one or more point laser sensors. Two-point laser sensors constitute the minimum requirement to measure roughness in both vehicle wheel tracks. However, a larger number of point laser sensors are commonly used to acquire additional data, including rutting and geometric measurements. Line laser scanning sensors are used in three pieces of equipment. Moreover, two vendors offer to provide line laser sensors in place of the point laser sensors. Such equipment can provide additional condition data, including rutting and geometrics.
The use of cost-effective technologies continues to secure a niche market, especially for low-volume and urban roads. Six pieces of equipment used accelerometers to evaluate the pavement roughness. Four of them are walking profilometers where the equipment is rolled along at walking speed. The other two can be mounted on vehicles to collect roughness data more efficiently, although with lower accuracy. Additionally, the use of smartphones for roughness measurement is facilitated by the commercial of BumpRecorder [144].
The use of laser triangulation technology to develop 3D imaging is used by the Canadian company of Pavemetrics to develop the Laser Crack Measurement System (LCMS®-2). LCMS-2 can be used to virtually collect all pavement surface condition data. The use of 3D imaging has been gaining significant momentum in the last few years [2]. LCMS-2 is integrated into multiple commercial systems, including Hawkeye 2000 [145], Mandli collection system [146], IrisGO Pave [147], and IrisPRO Pave [148]. Other 3D laser imaging systems include PaveVision3D Ultra [149] and ZOYON-RTM [150]. Three-dimensional imaging systems are expected to achieve multiple benefits, including accuracy enhancement. Additionally, such systems facilitate the collection of different condition data, including roughness, rutting, cracking, faulting, spalling, and potholes [2].
Table 14. Details of the commercially available systems for measuring pavement roughness.
EquipmentVendorCountry 2TypeTechnologyReference
BumpRecorderBumpRecorder Co., Ltd.JapanIIISmartphone[144]
Roadmaster Road Roughness MeterAL-Engineering OyFinlandIIIAccelerometer[151]
Roughometer 4ARRB GroupAustraliaIIIAccelerometer[152]
Walking Profiler G3ARRB GroupAustraliaIAccelerometer[153]
DAPPES-3 (Walking profiler)Zhuozhou Tianpeng Instrument Manufacturing Co., Ltd.ChinaIAccelerometer[154]
SurPROInternational CyberneticsUSAIAccelerometer[155]
CS8800 Walking ProfilerSurface Systems & InstrumentsUSAIAccelerometer[156]
Road Surface Profiler MK IIIDynatestDenmarkIPoint laser (up to 21)[157]
Road Surface Profiler IVDynatestDenmarkIPoint laser (1–2)[158]
Road Surface ProfilerNanjing T-Bota Scietech Instruments & Equipment Co., Ltd.ChinaIPoint laser (1–17)[159]
PaveProf V2.0PaveTesting Ltd.UKIPoint laser (up to 40)[160]
Digital Laser ProfilerARRB GroupAustraliaIPoint laser (3)[161]
LaserProfGreenwood EngineeringDenmarkIPoint laser (2)[162]
Greenwood ProfilerGreenwood EngineeringDenmarkIPoint laser (48)[163]
IrisGO Portable ProfilerInternational CyberneticsUSAIPoint laser (1–3)[164]
IrisPRO Inertial ProfilerInternational CyberneticsUSAIPoint laser (1–5)[165]
ARAN inertial profilerFugro RoadwareCanadaIPoint laser (2)[166]
CS9550 Portable Survey ProfilerSurface Systems & InstrumentsUSAII 1Point laser (2–6)[167]
CS8600 Ultra-Light ProfilerSurface Systems & InstrumentsUSAIPoint laser (1)[168]
ROMDAS Laser ProfilometerData Collection Ltd.New ZealandIPoint laser (1–2)[169]
APTech’s EDGEApplied Pavement Technology Inc.USAIPoint laser (2)[170]
RoadSTARAustrian Institute of TechnologyAustriaIPoint laser (21)[171]
8300 High-Speed Inertial Road ProfilerAmes EngineeringUSAILine/Point laser (1–2)[172]
6300 Lightweight ProfilerAmes EngineeringUSAILine/Point laser (1–2)[173]
Pathway inertial profilerPathway servicesUSAILine laser[174]
PPS-PlusFraunhofer IPMGermanyILine laser[175]
Gocator 2342LMI TechnologiesCanadaILine laser[176]
LCMS®-2PavemetricsCanadaI3D laser imaging system[177]
Hawkeye 2000ARRB GroupAustraliaI3D laser imaging system [LCMS®-2][145]
Mandli collection systemMandli CommunicationsUSA 3D laser imaging system [LCMS®-2][146]
IrisGO PaveInternational CyberneticsUSAI3D laser imaging system [LCMS®-2][147]
IrisPRO PaveInternational CyberneticsUSAI3D laser imaging system [LCMS®-2][148]
PaveVision3D UltraWayLink Systems Co.USAI3D laser imaging system[149]
ZOYON-RTMWuhan Optics Valley Zoyon Science and Technology Co., Ltd.ChinaI3D laser imaging system[150]
1 Vertical resolution < 0.01 in; 2 Headquarter location.
Figure 15 illustrates the anticipated drivers and future trends in the industry practice of pavement roughness measurement. As depicted in Figure 15, laser profilers and 3D laser imaging systems are expected to maintain their prevalence, especially for high-volume roads, due to their unmatched efficiency, accuracy, and precision. Additionally, they are highly automated techniques. In particular, 3D laser imaging systems provide additional advantages, including the ability to survey multiple pavement condition data at varying speeds. The commercialization of smartphones and vehicles’ built-in sensors for roughness measurement is also projected to increase. This trend is driven by their cost-effectiveness and applicability in various industries, as shown in Figure 15. Highway agencies are expected to increasingly adopt these techniques, particularly for urban and low-volume roads.
It is worth noting that the analysis of journal article sponsorships indicates a lack of industry support for the academic research community, with only one article sponsored by a commercial company. This highlights a low level of coordination between industry and academia, which can result in a waste of resources. Given the increasing interest in roughness measurement research, the industry can leverage exhausted efforts by collaborating with the research community. One way to achieve this is through establishing partnerships between industry and academia to work together on research projects. Such partnerships can involve joint funding, resource and expertise sharing, and co-authoring of publications. Furthermore, government funding agencies can provide incentives for industry-academia collaborations by offering funding opportunities for joint projects, encouraging partnerships, and prioritizing proposals that involve collaborations.

5.2. Research Community

The developed approaches for measuring pavement roughness differ in their work principle, costs, accuracy, practicality for large-scale data collection, and soundness as crowdsourcing tools, as presented in Table 15. Most of the investigated technologies are low-cost and applicable for data collection at the network level, as presented in Table 15.
Most investigated approaches utilize sensors mounted or available in standard passenger cars, where data can be collected at traffic speed. Remarkably, smartphones, mounted accelerometers, and vehicles’ built-in sensors are cost-effective techniques for roughness evaluation. However, their indirect approach to evaluating roughness and the high variability that can be introduced by multiple factors, including the type of vehicle, may lead the accuracy to be questionable. For example, Wang et al. [117] indicated that the accuracy of a smartphone-based approach could be comparable to a World Bank Class 3 device if the mounting is rigid and the speed is considered. Without consideration for the vehicle type and speed, the accuracy was reported to be similar to World Bank Class 4 approach (visual inspection). As an alternative to calibration, smartphones and vehicles’ built-in sensors are the obvious options for crowdsourcing.
Some of the technologies can be considered premature for widespread deployment, such as piezoelectric cable on a tire and tire pressure sensors. They hold potential for applications in highly autonomous vehicles. As technology continues to evolve, these emerging technologies could become increasingly relevant in the near future.
Laser profilers still generally offer a reasonable option for roughness measurement. However, their limitation in urban roads and considerable cost urge researchers to consider alternatives. Three-dimensional imaging systems hold more significant potential as a multipurpose approach for evaluating a variety of pavement defects, including roughness. Their versatility in terms of technology type, accuracy, and cost offers a range of options for different applications. For less important roads or smaller agencies with limited resources, the use of low-cost depth cameras or stereography with low-cost cameras may be appropriate and offer a viable option. Alternatively, 3D laser imaging systems provide the highest level of accuracy and efficiency and can be used in a range of different circumstances. However, their significant cost remains a hurdle for agencies with limited resources.
Remote sensing technologies, such as airborne and satellite synthetic aperture radar (SAR) images, offer significant potential for various pavement inspection applications, including roughness evaluation. While satellite imagery is generally more cost-effective, airborne SAR images can offer higher resolution and greater accuracy. However, challenges such as the presence of vehicles on the road, tree coverage, and processing difficulties, including segmentation challenges, can limit the effectiveness of this approach in specific scenarios, particularly on urban roads [134,135]. Additionally, it was reported by Fiorentini et al. [178] that roughness resulting from endogenous factors, such as traffic flow and pavement materials, may not be detectable using SAR technology. As a result, the use of remote sensing technologies for pavement inspection may need to be carefully evaluated on a case-by-case basis.
Figure 16 shows the current research gaps and the anticipated future research themes regarding the measurement of pavement roughness. Precision issues and calibration difficulties associated with using smartphones and connected vehicles are expected to intensify the use of crowdsourcing and machine learning. The growing demand for roughness measurement from new industries will boost the exploration of using smartphones and vehicles’ built-in sensors. Developing efficient and cost-effective approaches is also expected to continue gaining attention from researchers. Three-dimensional laser imaging systems are expected to draw more attention as a technology capable of acquiring different pavement condition data. The problem of lack of standardization in testing new methods in academia requires further focus. The next discussion lays out the anticipated future research directions and their associations with the identified research gaps and different technologies.

5.2.1. Crowdsourcing

The use of acceleration data, particularly from smartphones and vehicles’ built-in sensors, for roughness pavement inspection is performed following either the calibration or crowdsourcing schemes. The first scheme entails calibrating the measures with roughness values collected by a World Bank Class 1 profiler. However, as discussed before, this approach has a major limitation regarding the limited consistency of the acceleration data. Additionally, it requires data collection by driving the complete network using the same arrangement used for calibration, including vehicle type and speed. The other scheme offers a more practical alternative by involving road users to cheaply collect large volumes of data. Crowdsourcing in this regard is facilitated by the public for monitoring pavement conditions. Larger datasets were reported to marginalize the effect of the individual factors on the measured roughness, including vehicle type, smartphone model, mounting arrangement, and driving speed [91,104]. Roughness measured via crowdsourcing can help users choose the best route considering the ride quality and users’ expenses.
Table 16 presents details of some studies that used acceleration data collected using smartphones and connected vehicles as a crowdsourcing tool to evaluate road roughness. Table 16 shows that most studies used smartphones as a crowdsourcing tool [57,85,90,97,99,104]. This is predictable as road users widely use smartphones, and customized software can be easily installed to collect and analyze the data. Among the developed software are iRoads X [104] and RoadSR [41]. However, two studies explored using connected vehicles as crowdsourcing tools to evaluate roughness data [45,54]. Additionally, the use of crowdsourcing is usually coupled with ML [45,97,104]. The majority of the studies presented colored maps to indicate the roughness level of road sections [57]. As presented in Table 16, the scale of some studies was large enough to include data collected for hundreds of kilometers collected using tens of cars and smartphones. SmartRoadSense database covers about 24,000 km of roads collected using 432 different vehicles and 147 different types of smartphones.
Crowdsourcing is a promising alternative that is cheap and easy to deploy for pavement roughness measurement. A growing interest in this research theme is expected to persist and foster in the coming years. Moreover, anomaly detection techniques [179] and blockchain technology [180,181,182] can be explored to enhance the reliability of the collected data and address privacy issues.

5.2.2. Low-Cost Solutions

Many researchers have devoted their work to developing low-cost solutions for evaluating pavement roughness [51,67,69,94,109,183,184]. Table 17 presents some of the low-cost approaches investigated by multiple studies. As presented in Table 17, Aleadelat et al. [69] and Khalifeh et al. [67] used depth cameras as cheap as USD 200 to evaluate pavement roughness. Arbabpour Bidgoli et al. [109] developed an attached accelerometer-based system with an estimated cost of USD 50. A USD 47 system consisting of an infrared-based sensor and an accelerometer was developed by Kheirati and Golroo [184]. Some studies explored developing systems as cheap as USD 20 (Behera et al. [183]) and USD 29 (Mirtabar et al. [51]) using attached accelerometers and ultrasonic sensors, respectively. However, the majority of these approaches require rigorous calibration that necessitates Word Bank Class I profilers.
The use of drones and satellites can provide another opportunity to reduce the cost of pavement inspection [71,130]. Alternatively, multiple studies explored using available devices to calculate pavement roughness. Many studies used smartphones that are available to road users [56,99,104]. Other studies used vehicle telematic [185] and vehicles’ built-in sensors [54,116]. As an alternative to calibration, several studies explored using smartphones and vehicles’ built-in sensors as crowdsourcing tools [85,104].
In fact, the measurement of road roughness does not conceptually present an extremely challenging problem. On the other hand, measuring equipment costs are significant [79]. In a study published in 2007, Word Bank Class I laser-based profilers were reported to cost between USD 25,000 and USD 50,000 [52]. The authors asked several vendors to provide quotations to evaluate the current prices of laser profiler systems. The prices of such equipment are not lower nowadays based on four quotes collected by the authors from multiple companies in Asia, Australia, and North America. Small municipalities and highway agencies with limited resources may be unable to afford advanced laser profilers, especially in low-income countries. Thus, this research theme is expected to continue in the coming years.

5.2.3. Machine Learning

The use of machine learning for roughness measurement has experienced a remarkable increase in the last few years. Table 18 presents the used machine learning and the associated data collection technology. As shown in Table 18, many ML models were used to evaluate roughness using acceleration signals obtained using smartphones [102,104], vehicles’ built-in sensors [45,115], mounted sensors [105,107], and simulated data [114,117,118,119,120]. Additionally, Abohamer et al. [127] developed different ML models to evaluate pavement roughness using 3D data.
As presented in Table 18, ANN and deep learning and frequently used to evaluate roughness data. The use of models other than supervised learning may provide a tool to advance the use of crowdsourcing tools and overcome challenges such as incomplete data. The use of ML is expected to keep increasing in the coming years.
Machine learning momentum is expected to be fostered by the increasing use of crowdsourcing as an alternative to calibration for vehicle response methods. In this regard, machine learning can facilitate the development of cheap and more robust roughness evaluation methods. Additionally, the use of machine learning models coupled with computer vision algorithms is expected to rise with the growing interest in 3D laser imaging systems.

5.2.4. Growing Demand for Roughness Data Measurement by Different Industries

Information about pavement roughness is no longer the sole interest of highway agencies. Instead, road users are becoming increasingly interested in understanding the road’s condition. As discussed before, roughness is considered a major indicator of riding quality and significantly impacts users’ comfort and expenses. Recently, an increasing number of studies have been exploring tools to help users collect, visualize, and share information on road roughness. With the availability of cheap sensors, smartphones, and connected cars, many studies have started exploring crowdsourcing to derive and provide road users with the required knowledge about road roughness [57,85,104,186]. Many of these studies used maps to help users perceive road quality. Crowdsourcing tools can help users share the measured road roughness and their experienced ride quality and fuel consumption at different speeds. These pieces of information can help users compare their route choices, adjust their driving speed, and better plan their trips [112].
Another roughness-measurement-demanding industry is the automotive industry. Roughness has long been a matter of interest for the automotive industry due to its effects on vehicle suspension systems. However, two developments in the automotive industry have fueled the interest in road roughness measurement. The first significant development is the evolution of vehicle suspension systems from passive to semi-active and active control. This change makes the knowledge of road roughness of great importance to improve ride quality. The other development is the pursuit of increasing the level of driving automation to develop autonomous vehicles. Thus, enhancing vehicles’ ability to evaluate road profiles has recently been a focus of a tremendous amount of research [45,54,187,188,189]. Equipping vehicles with the ability to evaluate road roughness is essential to facilitate effective road-preview-based suspension control systems in future vehicles. In such systems, the dynamic characteristics of the vehicle suspension system are adjusted to improve the vehicle chassis performance and ride quality in real-time by utilizing roughness information of the road ahead [190,191]. Thus, the automotive industry aims to equip vehicles with pavement roughness technologies, which is essential to facilitate effective road-preview-based suspension control systems in future vehicles.
Therefore, cars are expected to collect and share condition data using built-in sensors and software. Several researchers have explored evaluating pavement roughness using vehicles’ built-in sensors [45,54,58,59,115,116]. This approach is relatively more reliable than smartphones due to eliminating the impact of some variables, namely the smartphone type and mounting arrangement. Additionally, data from similar vehicles can be used collectively to evaluate pavement roughness. Moreover, connected cars can be used as a crowdsourcing tool to collect large amounts of data cheaply and easily [45,54].

5.2.5. Integrated and Comprehensive Condition Assessment Tools

The use of laser-based 3D imaging systems has been gaining increasing popularity in recent years due to multiple factors, including high accuracy and precision, independence from natural light, and applicability to urban roads. Additionally, it facilitates surveying for various pavement condition data, including roughness, rutting, cracking, and raveling [26]. However, Pierce and Weitzel [26] implied that further research is required to fully validate the accuracy and the repeatability of the 3D profiling systems to measure pavement roughness. Additionally, it is necessary to develop a standardized method for calculating IRI with 3D profiling systems [26]. Thus, this technology is expected to gain more attention to achieve higher maturity.

5.2.6. Standardization of Equipment Testing

The reported accuracy of the different techniques may not help compare their performance due to the absence of standardization in the evaluation process. Many variables may render the obtained results unrepresentable or make the comparison unfair. First, the reference roughness measures were obtained differently using rod and level [67,68], laser profilers [60,61,130], World Bank Class 3 Roughmeter [98], and World Bank Class 3 bump integrator [84]. Second, there was variability in the roughness reporting measures. Although the majority of the studies reported roughness data using IRI [41,67,84,112,114,130,192], some studies reported roughness data using other measures, including PSD [119,126,193], and RIF [60,100,116]. Third, the scale of the validation case studies varied significantly. For example, Kumar et al. [57] used data collected from a case study of about 100 km, whereas Alhasan et al. [125] used two pavement sections of 105 m in total. Thus, it is essential to standardize the testing of new roughness measurement approaches.

6. Conclusions

Pavement roughness serves as a crucial metric to evaluate the condition of paved roads and is widely regarded as a primary measure of rideability and serviceability. As a result, roughness data is in high demand across different industries, including highway agencies and the automotive industry. Therefore, it is critical to develop techniques that fulfill the requirement of efficiency, accuracy, and cost-effectiveness that align with the various applications. Subsequently, the evolution of pavement roughness measurement techniques has undergone significant changes over the years. The current study utilized the Scopus database and the TRB library to investigate trends in roughness measurement techniques among both industry practice and research community over the past five decades. It also identified the state of the art and the state of the practice in roughness measurement techniques. Moreover, the study identified current research gaps and industry needs and anticipated future directions. The study primarily focused on the evolution of roughness measurement techniques in North America. However, the study supplemented the discussion by analyzing the worldwide state of the practice via surveying thirty-four pieces of equipment from eleven countries, including the USA, Canada, Denmark, Germany, China, Japan, and Australia.
In industry, the use of response-type methods gradually declined over time and was largely phased out in the 1990s. Non-contact profilers started gaining popularity in the 1980s and eventually prevailed in the 1990s and 2000s. While ultrasonic sensors were widely used in non-contact inertial profilers in the 1980s, their usage gradually decreased, and they were completely replaced by laser sensors from major vendors during the first decade of this century. Today, laser-based equipment, including laser point and 3D laser imaging systems, is the most commonly used technology for pavement roughness measurement. Three-dimensional laser imaging systems based on laser triangulation technology are increasingly used in commercial systems developed by major vendors due to their advantages in acquiring multi-use data with high accuracy and efficiency. However, the anticipated spread of highly autonomous cars and the need for cost-effective techniques for roughness measurement is expected to increase the potential of using smartphones and built-in sensors in connected cars, especially in combination with crowdsourcing and machine learning.
The research community has been increasingly putting significant efforts into investigating various roughness measurement techniques, particularly in the last few years. Most research efforts were devoted to evaluating, calibrating, and reviewing response-type equipment in the 1970s, 1980s and 1990s. However, an increasing number of technologies have been investigated in recent years. Most of the published studies explored the use of acceleration signals describing the suspension response of vehicles obtained via smartphones, mounted sensors, and vehicles’ built-in sensors. Other studies investigated a wide range of technologies, including satellite and airborne SAR images, infrared, acoustics, 3D imaging systems, pressure sensors, and pavement-embedded sensors. Developing low-cost techniques was the focus of multiple studies. Crowdsourcing was also explored as an alternative approach to using expensive equipment and experienced technicians for data collection and calibration. Additionally, the study indicates that more research has been directed toward benefiting parties other than highway agencies. Pavement roughness evaluation is becoming increasingly important to the automotive industry and navigation.
Although an increasing number of techniques have been investigated in academia, their robustness in real applications remains dubious due to the lack of standardization in the evaluation process. Therefore, it is necessary to standardize the evaluation of the developed technologies. This review indicated little collaboration between industry and academia in developing new techniques for measuring pavement roughness. Thus, it is critical to increase cooperation between industry and academia to maximize the benefit of research efforts in academia. Partnerships can include joint funding, resource sharing, and co-authoring publications. Government funding agencies can provide incentives for collaborations by offering funding opportunities and prioritizing joint proposals.

Author Contributions

A.F.: conceptualization, methodology, data collection, analysis, and writing; T.Z.: review, editing, and supervision. All authors have read and agreed to the published version of the manuscript.

Funding

This research received no external funding.

Data Availability Statement

Not applicable.

Acknowledgments

Ali Fares would like to express his acknowledgment and thanks to the Research Grants Council (RGC) of Hong Kong for supporting his Ph.D. study through the Hong Kong Ph.D. Fellowship Scheme (HKPFS).

Conflicts of Interest

The authors declare no conflict of interest.

Appendix A

Table A1. Keyword synonyms.
LabelReplace With
AccelerometerAccelerometers
Neural network, neural networksArtificial neural network
Bus laneBus lanes
Connected vehicleConnected vehicles
Crowdsourced dataCrowdsourcing
Dynamic tire pressure sensor (DTPS)Dynamic tire pressure
Frequency response function (FRF)Frequency response function
Global positioning system (GPS), GPSGlobal positioning system
Laser scanning profilometerInertial laser profiler
International Roughness Index (IRI), IRIInternational roughness index
Inverse problemInverse problems
Kalman filterKalman filtering
Laser sensorLaser sensors
Longitudinal profile of road, longitudinal road profileLongitudinal profile
Low-cost deviceLow cost
Kinect, Kinect V2, Microsoft Kinect One (V2)Microsoft Kinect
Pavement evaluation, road condition evaluation, road disturbance estimation, road anomaly detectionPavement condition assessment
Road health monitoring, road surface monitoringPavement monitoring
Pavement profiler, profiler, profilers, profile, road profilePavement profilers
Pavement smoothness, road roughness, road roughness identification, road surface, road surface roughness, roughness, smoothnessPavement roughness
Pothole detectionPotholes
Power spectrumPower spectral density
Probe vehicleProbe vehicles
Response-type road roughness measuring system (RTRRMS)Response-type device
Riding qualityRide quality
Keywords road profilerRoad profiler
Road profile measurement, Roughness assessment, Road Roughness DetectionRoad roughness estimation
SmartroadsenseSmart road sense
Smartphone sensorSmartphone sensors
SmartphoneSmartphones
Unmanned aerial vehicles (UAVs)Unmanned aerial vehicles
Vehicle responseVehicle responses
Youla-Kucera (YK) parametrizationYoula–Kucera parametrization

References

  1. Attoh-Okine, N.; Adarkwa, O. Pavement Condition Surveys-Overview of Current Practices, Delaware Cent; Delaware Center for Transportation, University of Delaware: Newark, DE, USA, 2013. [Google Scholar]
  2. Pierce, L.M.; Stolte, S.E. NCHRP Synthesis 589: Automated Data Collection and Quality Management for Pavement Condition Reporting; Transportation Research Board: Washington, DC, USA, 2022. [Google Scholar] [CrossRef]
  3. Mazari, M.; Rodriguez, D.D. Prediction of pavement roughness using a hybrid gene expression programming-neural network technique. J. Traffic Transp. Eng. Engl. Ed. 2016, 3, 448–455. [Google Scholar] [CrossRef] [Green Version]
  4. Byrne, M.; Albrecht, D.; Sanjayan, J. Identifying error and maintenance intervention of pavement roughness time series with minimum message length inference. Int. J. Pavement Eng. 2010, 11, 37–47. [Google Scholar] [CrossRef]
  5. New Hampshire Department of Transportation. Transportation Asset Management Plan. 2022. Available online: https://www.tam-portal.com/collections/tamps/ (accessed on 10 February 2023).
  6. Idaho Department of Transportation. Transportation Asset Management Plan. 2019. Available online: https://www.tam-portal.com/collections/tamps/ (accessed on 10 February 2023).
  7. Oklahoma Department of Transportation. Transportation Asset Management Plan. 2019. Available online: https://www.tam-portal.com/collections/tamps/ (accessed on 10 February 2023).
  8. Sakhaeifar, M.S.; Newcomb, D.; Nobakht, M.; Underwood, S.; Gudipudi, P.P.; Stempihar, J. Selection of Long Lasting Reha-Bilitation Treatment Using Life Cycle Cost Analysis and Present Serviceability Rating; Final Report: FHWA-Ok-15-06; Oklahoma Department of Transportation: Oklahoma City, OK, USA, 2015. [Google Scholar]
  9. Hood, R. Optimising the Use of Laser Profilometer Data to Report Rut Depth, Roughness and Surface Texture Review of WA Practice; 014509-1; Main Roads Western Australia: East Perth, Australia, 2019. [Google Scholar]
  10. Robbins, M.M.; Tran, N. Literature Review: The Impact of Pavement Roughness on Vehicel Operating Costs; NCAT Report 15-02; National Asphalt Pavement Association: Montgomery, AL, USA, 2015. [Google Scholar]
  11. Zaabar, I.; Chatti, K. Estimating Vehicle Operating Costs Caused by Pavement Surface Conditions. Transp. Res. Rec. J. Transp. Res. Board 2014, 2455, 63–76. [Google Scholar] [CrossRef]
  12. Liu, X.; Al-Qadi, I. Integrated Vehicle–Tire–Pavement Approach for Determining Pavement Structure-Induced Rolling Resistance under Dynamic Loading. Transp. Res. Rec. J. Transp. Res. Board 2022, 2676, 398–409. [Google Scholar] [CrossRef]
  13. Robbins, M.; Tran, N. Review of Initial Service Life Determination in Life (LCCA) Procedures and in Practice; NCAT Report 18-02; National Asphalt Pavement Association and State Asphalt Pavement Associations: Montgomery, AL, USA, 2018. [Google Scholar]
  14. Hikmah, N.; Tan, S.; Zahran, E.; Yap, Y.; Taib, H. Statistical Correlation between Road Surface Roughness and Traffic Accidents. In Proceedings of the 7th Brunei International Conference on Engineering and Technology (BICET 2018), Bandar Seri Begawan, Brunei, 12–14 November 2018; p. 66. [Google Scholar] [CrossRef]
  15. Elghriany, A.; Yi, P.; Liu, P.; Yu, Q. Investigation of the Effect of Pavement Roughness on Crash Rates for Rigid Pavement. J. Transp. Saf. Secur. 2015, 8, 164–176. [Google Scholar] [CrossRef]
  16. Lee, J.; Abdel-Aty, M.; Nyame-Baafi, E. Investigating the Effects of Pavement Roughness on Freeway Safety using Data from Five States. Transp. Res. Rec. J. Transp. Res. Board 2020, 2674, 127–134. [Google Scholar] [CrossRef]
  17. Hegmon, R.R. Definition and measurement of pavement surface roughness. Wear 1979, 57, 127–136. [Google Scholar] [CrossRef]
  18. Wambold, J.C. The measurement and data analysis used to evaluate highway roughness. Wear 1979, 57, 117–125. [Google Scholar] [CrossRef]
  19. Hicks, R.G.; Mahoney, J.P. NCHRP Synthesis of Highway Practice 76: Collection and Use of Pavement Condition Data; Transportation Research Board, National Research Council: Washington, DC, USA, 1981. [Google Scholar]
  20. Campillo, J.R. A Simplified Pavement Condition Assessment and Its Integration to a Pavement Management System. Ph.D. Dissertation, Arizona State University, Tempe, AZ, USA, 2018. [Google Scholar]
  21. ISO 8608:2016; Mechanical Vibration—Road Surface Profiles—Reporting of Measured Data. International Organization for Standardization: Genève, Switzerland, 2016. Available online: https://www.iso.org/standard/71202.html (accessed on 20 February 2023).
  22. Sayers, M.W. Two Quarter-Car Models for Defining Road Roughness: IRI and HRI. Transp. Res. Rec. 1989, 1215, 165–172. Available online: https://onlinepubs.trb.org/Onlinepubs/trr/1989/1215/1215-018.pdf (accessed on 20 January 2023).
  23. McGhee, K.H. CHRP Synthesis 334: Automated Pavement Distress Collection Techniques; Transportation Research Board: Washington, DC, USA, 2004. [Google Scholar] [CrossRef]
  24. Fiorentini, N.; Maboudi, M.; Leandri, P.; Losa, M. Can Machine Learning and PS-InSAR Reliably Stand in for Road Profilometric Surveys? Sensors 2021, 21, 3377. [Google Scholar] [CrossRef]
  25. Epps, J.A.; Monismith, C.L. NCHRP Synthesis of Highway Practice 126: Equipment for Obtaining Pavement Condition and Traffic Loading Data; Transportation Research Board, National Research Council: Washington, DC, USA, 1986. [Google Scholar]
  26. Pierce, L.M.; Weitzel, N.D. NCHRP Synthesis 531: Automated Pavement Condition Surveys; Transportation Research Board: Washington, DC, USA, 2019. [Google Scholar] [CrossRef]
  27. Gramling, W.L. NCHRP Synthesis of Highway Practice 203: Current Practices in Determining Pavement Condition, Transportation Research Board, Washington, DC, 1994. Available online: http://onlinepubs.trb.org/Onlinepubs/nchrp/nchrp_syn_203.pdf (accessed on 15 February 2023).
  28. Nguyen, T.; Lechner, B.; Wong, Y.D. Response-based methods to measure road surface irregularity: A state-of-the-art review. Eur. Transp. Res. Rev. 2019, 11, 43. [Google Scholar] [CrossRef] [Green Version]
  29. Hettiarachchi, C.; Yuan, J.; Amirkhanian, S.; Xiao, F. Measurement of pavement unevenness and evaluation through the IRI parameter—An overview. Measurement 2023, 206, 112284. [Google Scholar] [CrossRef]
  30. Yu, Q.; Fang, Y.; Wix, R. Pavement roughness index estimation and anomaly detection using smartphones. Autom. Constr. 2022, 141, 104409. [Google Scholar] [CrossRef]
  31. Echchakoui, S. Why and how to merge Scopus and Web of Science during bibliometric analysis: The case of sales force literature from 1912 to 2019. J. Mark. Anal. 2020, 8, 165–184. [Google Scholar] [CrossRef]
  32. Elsevier, Scopus, Scopus Content Coverage Guide, Elsevier, B.V., Amesterdam. 2020; Available online: https://www.elsevier.com/__data/assets/pdf_file/0007/69451/Scopus_ContentCoverage_Guide_WEB.pdf (accessed on 22 March 2021).
  33. The National Academies of Sciences, Engineering, and Medicine. The TRB Library. 2023. Available online: https://www.trb.org/InformationServices/TRBLibrary1.aspx (accessed on 20 February 2023).
  34. The National Academies of Sciences, Engineering, and Medicine. TRB Store. 2023. Available online: https://www.mytrb.org/MyTRB/Store/default.aspx (accessed on 20 March 2023).
  35. The National Academies of Sciences, Engineering, and Medicine. NCHRP at 50 Years; Transportation Research Board: Washington, DC, USA, 2012; Available online: https://onlinepubs.trb.org/onlinepubs/nchrp/docs/NCHRP_50thAnniversary.pdf (accessed on 5 March 2023).
  36. Chang, W.; Cheng, J.; Allaire, J.; Sievert, C.; Schloerke, B.; Xie, Y.; Allen, J.; McPherson, J.; Dipert, A.; Borges, B. Shiny: Web Application Framework for R. R Package Version 1.7.4.9002. 2023. Available online: https://shiny.rstudio.com/ (accessed on 20 March 2023).
  37. Flintsch, G.W.; McGhee, K.K. NCHRP Synthesis 401 Quality: Quality Management of Pavement Condition Data Collection; The National Academies Press: Washington, DC, USA, 2009. [Google Scholar] [CrossRef]
  38. Federal Highway Administration. National Performance Management Measures; Assessing Pavement Condition for the National Highway Performance Program and Bridge Condition for the National Highway Performance Program. Fed. Regist. 2017, 82, 5886–5970. [Google Scholar]
  39. González, A.; O’Brien, E.J.; Li, Y.-Y.; Cashell, K. The use of vehicle acceleration measurements to estimate road roughness. Veh. Syst. Dyn. 2008, 46, 483–499. [Google Scholar] [CrossRef]
  40. Du, Y.; Liu, C.; Wu, D.; Jiang, S. Measurement of International Roughness Index by Using Z-Axis Accelerometers and GPS. Math. Probl. Eng. 2014, 2014, 928980. [Google Scholar] [CrossRef] [Green Version]
  41. Zang, K.; Shen, J.; Huang, H.; Wan, M.; Shi, J. Assessing and Mapping of Road Surface Roughness based on GPS and Accelerometer Sensors on Bicycle-Mounted Smartphones. Sensors 2018, 18, 914. [Google Scholar] [CrossRef] [PubMed] [Green Version]
  42. Huang, M.-F.; Ji, P.N.; Wang, T.; Aono, Y.; Salemi, M.; Chen, Y.; Zhao, J.; Xia, T.J.; Wellbrock, G.A.; Huang, Y.-K.; et al. First Field Trial of Distributed Fiber Optical Sensing and High-Speed Communication Over an Operational Telecom Network. J. Light Technol. 2019, 38, 75–81. [Google Scholar] [CrossRef]
  43. Harris, N.; Gonzalez, A.; Obrien, E.; McGetrick, P. Characterisation of pavement profile heights using accelerometer readings and a combinatorial optimisation technique. J. Sound Vib. 2010, 329, 497–508. [Google Scholar] [CrossRef] [Green Version]
  44. Tudon-Martinez, J.C.; Fergani, S.; Sename, O.; Martinez, J.J.; Morales-Menendez, R.; Dugard, L. Adaptive Road Profile Estimation in Semiactive Car Suspensions. IEEE Trans. Control Syst. Technol. 2015, 23, 2293–2305. [Google Scholar] [CrossRef] [Green Version]
  45. Liu, C.; Wu, D.; Li, Y.; Du, Y. Large-scale pavement roughness measurements with vehicle crowdsourced data using semi-supervised learning. Transp. Res. Part C Emerg. Technol. 2021, 125, 103048. [Google Scholar] [CrossRef]
  46. Highway Performance Monitoring System Field Manual for the Continuing Analytical and Statistical Database, Appendix J. 1987.
  47. Choubane, B.; Scott, S.; Mraz, A.; Schiffermuller, J. Pavement Smoothness Acceptance Testing: Survey of Current State Practices; State of Florida Department of Transportation: Chipley, FL, USA, 2010. [Google Scholar]
  48. Flintsch, G.W. Mechanistic-Empirical Pavement Design and Performance Prediction, Opportunities and Challenges for PMS. In Proceedings of the 3rd European Pavement and Asset Management Conference, Coimbra, Portugal, 7–9 July 2008. [Google Scholar]
  49. Federal Highway Administration. HPMS Reassessment 2010+; Final Report; Federal Highway Administration: Washington, DC, USA, 2008. [Google Scholar]
  50. Woodstrom, J.H. NCHRP Synthesis 167: Measurements, Specifications, and Achievement of Smoothness for Pavement Construction; Transportation Research Board: Washington, DC, USA, 1990. [Google Scholar]
  51. Mirtabar, Z.; Golroo, A.; Mahmoudzadeh, A.; Barazandeh, F. Development of a crowdsourcing-based system for computing the international roughness index. Int. J. Pavement Eng. 2020, 23, 489–498. [Google Scholar] [CrossRef]
  52. Bennett, C.R.; De Solminihac, H.; Chamorro, A. Data Collection Technologies for Road Management; World Bank: Washington, DC, USA, 2007. [Google Scholar]
  53. Ames Engineering. Proven Measurement Products: Sensor Technology, Pavement Measurement. 2023. Available online: https://amesengineering.com/ (accessed on 25 February 2023).
  54. Mahlberg, J.A.; Li, H.; Zachrisson, B.; Leslie, D.K.; Bullock, D.M. Pavement Quality Evaluation Using Connected Vehicle Data. Sensors 2022, 22, 9109. [Google Scholar] [CrossRef]
  55. Alatoom, Y.I.; Obaidat, T.I. Measurement of Street Pavement Roughness in Urban Areas Using Smartphone. Int. J. Pavement Res. Technol. 2022, 15, 1003–1020. [Google Scholar] [CrossRef]
  56. Yang, X.; Hu, L.; Ahmed, H.U.; Bridgelall, R.; Huang, Y. Calibration of smartphone sensors to evaluate the ride quality of paved and unpaved roads. Int. J. Pavement Eng. 2020, 23, 1529–1539. [Google Scholar] [CrossRef]
  57. Kumar, R.; Mukherjee, A.; Singh, V.P. Community Sensor Network for Monitoring Road Roughness Using Smartphones. J. Comput. Civ. Eng. 2017, 31, 624. [Google Scholar] [CrossRef]
  58. Katicha, S.W.; Khoury, J.; Flintsch, G.W. Assessing the effectiveness of probe vehicle acceleration measurements in estimating road roughness. Int. J. Pavement Eng. 2015, 17, 698–708. [Google Scholar] [CrossRef]
  59. Fauriat, W.; Mattrand, C.; Gayton, N.; Beakou, A.; Cembrzynski, T. Estimation of road profile variability from measured vehicle responses. Veh. Syst. Dyn. 2016, 54, 585–605. [Google Scholar] [CrossRef]
  60. Bridgelall, R. Connected Vehicle Approach for Pavement Roughness Evaluation. J. Infrastruct. Syst. 2014, 20, 167. [Google Scholar] [CrossRef] [Green Version]
  61. Chou, C.-P.; Siao, G.-J.; Chen, A.-C.; Lee, C.-C. Algorithm for Estimating International Roughness Index by Response-Based Measuring Device. J. Transp. Eng. Part B Pavements 2020, 146, 4020031. [Google Scholar] [CrossRef]
  62. Spangler, E.B.; Kelly, W.J. GMR Road Profilometer: A Method for Measuring Road Profile. Highw. Res. Rec. 1964, 121, 27–54. [Google Scholar]
  63. Huft, D.L.; Corcoran, D.C.; Lunde, B.A.; Orth, P.A. Status of the South Dakota Profilometer. Transp. Res. Rec. 1987, 1117, 104–113. [Google Scholar]
  64. ASTM E 950/950M-09; Standard Test Method for Measuring Longitudinal Profile of Traveled Surfaces with an Accelerometer Established Inertial Profiling Reference. ASTM International: West Conshohocken, PA, USA, 2018. [CrossRef]
  65. ASTM E950/E950M-22; Standard Test Method for Measuring the Longitudinal Profile of Traveled Surfaces. ASTM International: West Conshohocken, PA, USA, 2022. [CrossRef]
  66. Mitchell; Chang, J.-R.; Chang, K.-T.; Chen, D.-H. Application of 3D Laser Scanning on Measuring Pavement Roughness. J. Test. Eval. 2006, 34, jte13178. [Google Scholar] [CrossRef]
  67. Khalifeh, V.; Golroo, A.; Ovaici, K. Application of an Inexpensive Sensor in Calculating the International Roughness Index. J. Comput. Civ. Eng. 2018, 32, 761. [Google Scholar] [CrossRef]
  68. Mahmoudzadeh, A.; Golroo, A.; Jahanshahi, M.R.; Yeganeh, S.F. Estimating Pavement Roughness by Fusing Color and Depth Data Obtained from an Inexpensive RGB-D Sensor. Sensors 2019, 19, 1655. [Google Scholar] [CrossRef] [Green Version]
  69. Aleadelat, W.; Aledealat, K.; Ksaibati, K. Estimating pavement roughness using a low-cost depth camera. Int. J. Pavement Eng. 2022, 23, 4923–4930. [Google Scholar] [CrossRef]
  70. Guo, R.; Yu, Z.; Zhou, Y. Development and Preliminary Evaluation of a Varying-Speed Road Profiler. J. Test. Eval. 2020, 48, 3479–3489. [Google Scholar] [CrossRef]
  71. Prosser-Contreras, M.; Atencio, E.; La Rivera, F.M.; Herrera, R.F. Use of Unmanned Aerial Vehicles (UAVs) and Photogrammetry to Obtain the International Roughness Index (IRI) on Roads. Appl. Sci. 2020, 10, 8788. [Google Scholar] [CrossRef]
  72. Ma, N.; Fan, J.; Wang, W.; Wu, J.; Jiang, Y.; Xie, L.; Fan, R. Computer vision for road imaging and pothole detection: A state-of-the-art review of systems and algorithms. Transp. Saf. Environ. 2022, 4, tdac026. [Google Scholar] [CrossRef]
  73. Huft, D.L. South Dakota Profilometer. Transp. Res. Rec. 1984, 1–8. Available online: https://onlinepubs.trb.org/Onlinepubs/trr/1984/1000/1000-001.pdf (accessed on 12 February 2023).
  74. Bloom, J.A.; Schwartz, P.C. Development of a Noncontact Pavement Smoothness Monitor for Use During Construction. Transp. Res. Rec. 1984, 986, 18–22. [Google Scholar]
  75. Brown, D. Evaluation of the PRORUT System. Public Roads 1990, 53, 118–122. [Google Scholar]
  76. Walker, R.S.; Lin, H.-T. Profilograph Correlation Study with Present Serviceability Index. Transp. Res. Rec. 1988, 1196, 257–275. Available online: http://onlinepubs.trb.org/Onlinepubs/trr/1988/1196/1196-026.pdf (accessed on 12 February 2023).
  77. Moore, R.K.; Clark, G.N.; Plumb, G.N. Present Serviceability-Roughness Correlations Using Rating Panel Data. Transp. Res. Rec. 1987, 1117, 152–158. [Google Scholar]
  78. Spangler, E.B.; Rizenbergs, R.L.; Burchett, J.L.; Robinson, D.C. Use of the Inertial Profilometer to Calibrate Kentucky Department of Highways Mays Ride Meter Systems. Transp. Res. Rec. 1988, 286–293. Available online: https://onlinepubs.trb.org/Onlinepubs/trr/1988/1196/1196-028.pdf (accessed on 12 February 2023).
  79. Kulakowski, B.T.; Henry, J.J.; Wambold, J.C. Relative Influence of Accelerometer and Displacement Transducer Signals in Road Roughness Measurements. Transp. Res. Rec. 1988, 1196, 313–317. Available online: http://onlinepubs.trb.org/Onlinepubs/trr/1988/1196/1196-032.pdf (accessed on 12 February 2023).
  80. Lenngren, C.A. Some Experience Using Noncontact Sensors on Airport Pavements. In Proceedings of the Nondestructive Evaluation of Aging Aircraft, Airports, and Aerospace Hardware, Scottsdale, AZ, USA, 3–5 December 1996; pp. 250–260. [Google Scholar] [CrossRef]
  81. Šprinc, J.; Kropác, O.; Šprinc, M. Characterization of Longitudinal Road Unevenness in the Light of the International PIARC? EVEN Experiment 1998. Veh. Syst. Dyn. 2002, 37, 263–281. [Google Scholar] [CrossRef]
  82. Ahlin, K.; Granlund, J.; Lindstrom, F. Comparing road profiles with vehicle perceived roughness. Int. J. Veh. Des. 2004, 36, 270. [Google Scholar] [CrossRef]
  83. Mitchell, D.; Chen, J.-S.; Chang, M.-K.; Lin, K.-Y. Device Harmonization to Determine Smoothness Specification for Asphalt Pavements. J. Test. Eval. 2006, 34, jte100031. [Google Scholar] [CrossRef]
  84. Sandamal, R.M.K.; Pasindu, H.R. Applicability of smartphone-based roughness data for rural road pavement condition evaluation. Int. J. Pavement Eng. 2020, 23, 663–672. [Google Scholar] [CrossRef]
  85. Daraghmi, Y.-A.; Wu, T.-H.; Ik, T.-U. Crowdsourcing-Based Road Surface Evaluation and Indexing. IEEE Trans. Intell. Transp. Syst. 2020, 23, 4164–4175. [Google Scholar] [CrossRef]
  86. Alatoom, Y.I.; Obaidat, T.I.A.-S. Development of pavement roughness models using Artificial Neural Network (ANN). Int. J. Pavement Eng. 2022, 23, 4622–4637. [Google Scholar] [CrossRef]
  87. Grabowski, D.; Szczodrak, M.; Czyzewski, A. Economical Methods for Measuring Road Surface Roughness. Metrol. Meas. Syst. 2018, 25, 533–549. [Google Scholar] [CrossRef]
  88. Bridgelall, R.; Hough, J.; Tolliver, D. Characterising pavement roughness at non-uniform speeds using connected vehicles. Int. J. Pavement Eng. 2019, 20, 958–964. [Google Scholar] [CrossRef]
  89. Zhao, B.; Nagayama, T.; Toyoda, M.; Makihata, N.; Takahashi, M.; Ieiri, M. Vehicle Model Calibration in the Frequency Domain and its Application to Large-Scale IRI Estimation. J. Disaster Res. 2017, 12, 446–455. [Google Scholar] [CrossRef]
  90. Medina, J.R.; Salim, R.; Underwood, B.S.; Kaloush, K. Experimental Study for Crowdsourced Ride Quality Index Estimation Using Smartphones. J. Transp. Eng. Part B Pavements 2020, 146, 04020070. [Google Scholar] [CrossRef]
  91. Medina, J.R.; Noorvand, H.; Underwood, B.S.; Kaloush, K. Statistical Validation of Crowdsourced Pavement Ride Quality Measurements from Smartphones. J. Comput. Civ. Eng. 2020, 34, 891. [Google Scholar] [CrossRef]
  92. Zhang, Z.; Zhang, H.; Xu, S.; Lv, W. Pavement roughness evaluation method based on the theoretical relationship between acceleration measured by smartphone and IRI. Int. J. Pavement Eng. 2022, 23, 3082–3098. [Google Scholar] [CrossRef]
  93. Ahmed, H.U.; Hu, L.; Yang, X.; Bridgelall, R.; Huang, Y. Effects of smartphone sensor variability in road roughness evaluation. Int. J. Pavement Eng. 2022, 23, 4404–4409. [Google Scholar] [CrossRef]
  94. Hanson, T.; Cameron, C.; Hildebrand, E. Evaluation of low-cost consumer-level mobile phone technology for measuring international roughness index (IRI) values. Can. J. Civ. Eng. 2014, 41, 819–827. [Google Scholar] [CrossRef]
  95. Bisconsini, D.R.; Pegorini, V.; Casanova, D.; de Oliveira, R.A.; Farias, B.A.; Júnior, J.L.F. Intervening Factors in Pavement Roughness Assessment with Smartphones: Quantifying the Effects and Proposing Mitigation. J. Transp. Eng. Part B Pavements 2021, 147, 04021051. [Google Scholar] [CrossRef]
  96. Zeng, H.; Park, H.; Smith, B.L. Impact of Vehicle Dynamic Systems on a Connected Vehicle-Enabled Pavement Roughness Estimation. J. Infrastruct. Syst. 2019, 25, 461. [Google Scholar] [CrossRef]
  97. Botshekan, M.; Asaadi, E.; Roxon, J.; Ulm, F.-J.; Tootkaboni, M.; Louhghalam, A. Smartphone-enabled road condition monitoring: From accelerations to road roughness and excess energy dissipation. Proc. R. Soc. A Math. Phys. Eng. Sci. 2021, 477, 20200701. [Google Scholar] [CrossRef]
  98. Janani, L.; Doley, R.; Sunitha, V.; Mathew, S. Precision enhancement of smartphone sensor-based pavement roughness estimation by standardizing host vehicle speed. Can. J. Civ. Eng. 2022, 49, 716–730. [Google Scholar] [CrossRef]
  99. Alessandroni, G.; Carini, A.; Lattanzi, E.; Freschi, V.; Bogliolo, A. A Study on the Influence of Speed on Road Roughness Sensing: The SmartRoadSense Case. Sensors 2017, 17, 305. [Google Scholar] [CrossRef]
  100. Bridgelall, R. Inertial Sensor Sample Rate Selection for Ride Quality Measures. J. Infrastruct. Syst. 2015, 21, 225. [Google Scholar] [CrossRef] [Green Version]
  101. Zeng, H.; Park, H.; Smith, B.L.; Parkany, E. Feasibility Assessment of a Smartphone-Based Application to Estimate Road Roughness. KSCE J. Civ. Eng. 2018, 22, 3120–3129. [Google Scholar] [CrossRef]
  102. Jeong, J.; Jo, H.; Ditzler, G. Convolutional neural networks for pavement roughness assessment using calibration-free vehicle dynamics. Comput. Civ. Infrastruct. Eng. 2020, 35, 1209–1229. [Google Scholar] [CrossRef]
  103. Opara, K.R.; Brzezinski, K.; Bukowicki, M.; Kaczmarek-Majer, K. Road Roughness Estimation Through Smartphone-Measured Acceleration. IEEE Intell. Transp. Syst. Mag. 2022, 14, 209–220. [Google Scholar] [CrossRef]
  104. Gamage, Y.T.; Thotawaththa, T.A.I.; Wijayasiri, A. Measuring Road Roughness through Crowdsourcing while Minimizing the Conditional Effects. Int. J. Intell. Transp. Syst. Res. 2022, 20, 581–601. [Google Scholar] [CrossRef]
  105. Liu, Q.; Sun, L.; Kornhauser, A.; Sun, J.; Sangwa, N. Road roughness acquisition and classification using improved restricted Boltzmann machine deep learning algorithm. Sens. Rev. 2019, 39, 733–742. [Google Scholar] [CrossRef]
  106. Nguyen, T.; Lechner, B.; Wong, Y.D.; Tan, J.Y. Bus Ride Index—A refined approach to evaluating road surface irregularities. Road Mater. Pavement Des. 2021, 22, 423–443. [Google Scholar] [CrossRef]
  107. Chen, S.; Xue, J. Road Roughness Level Identification Based on BiGRU Network. IEEE Access 2022, 10, 32696–32705. [Google Scholar] [CrossRef]
  108. Liu, C.; Wu, D.; Li, Y.; Jiang, S.; Du, Y. Mathematical insights into the relationship between pavement roughness and vehicle vibration. Int. J. Pavement Eng. 2022, 23, 1935–1947. [Google Scholar] [CrossRef]
  109. Bidgoli, M.A.; Golroo, A.; Nadjar, H.S.; Rashidabad, A.G.; Ganji, M.R. Road roughness measurement using a cost-effective sensor-based monitoring system. Autom. Constr. 2019, 104, 140–152. [Google Scholar] [CrossRef]
  110. Zhang, Q.; Hou, J.; Hu, X.; Yuan, L.; Jankowski, Ł.; An, X.; Duan, Z. Vehicle parameter identification and road roughness estimation using vehicle responses measured in field tests. Measurement 2022, 199, 111348. [Google Scholar] [CrossRef]
  111. Li, J.; Zhang, Z.; Wang, W. New Approach for Estimating International Roughness Index Based on the Inverse Pseudo Excitation Method. J. Transp. Eng. Part B Pavements 2019, 145, 04018059. [Google Scholar] [CrossRef]
  112. Du, Y.; Liu, C.; Wu, D.; Li, S. Application of Vehicle Mounted Accelerometers to Measure Pavement Roughness. Int. J. Distrib. Sens. Networks 2016, 12, 8413146. [Google Scholar] [CrossRef] [Green Version]
  113. Liu, W.; Wang, R.; Ding, R.; Meng, X.; Yang, L. On-line estimation of road profile in semi-active suspension based on unsprung mass acceleration. Mech. Syst. Signal Process. 2020, 135, 106370. [Google Scholar] [CrossRef]
  114. Zhang, Z.; Sun, C.; Bridgelall, R.; Sun, M. Application of a Machine Learning Method to Evaluate Road Roughness from Connected Vehicles. J. Transp. Eng. Part B Pavements 2018, 144, 04018043. [Google Scholar] [CrossRef]
  115. Nitsche, P.; Stütz, R.; Kammer, M.; Maurer, P. Comparison of Machine Learning Methods for Evaluating Pavement Roughness Based on Vehicle Response. J. Comput. Civ. Eng. 2014, 28, 285. [Google Scholar] [CrossRef]
  116. Bridgelall, R.; Rahman, T.; Tolliver, D.; Daleiden, J.F. Wavelength sensitivity of roughness measurements using connected vehicles. Int. J. Pavement Eng. 2019, 20, 566–572. [Google Scholar] [CrossRef]
  117. Wang, G.; Burrow, M.; Ghataora, G. Study of the Factors Affecting Road Roughness Measurement Using Smartphones. J. Infrastruct. Syst. 2020, 26, 04020020. [Google Scholar] [CrossRef]
  118. Li, Z.; Yu, W.; Cui, X. Online Classification of Road Roughness Conditions with Vehicle Unsprung Mass Acceleration by Sliding Time Window. Shock. Vib. 2018, 2018, 5131434. [Google Scholar] [CrossRef]
  119. Yousefzadeh, M.; Azadi, S.; Soltani, A. Road profile estimation using neural network algorithm. J. Mech. Sci. Technol. 2010, 24, 743–754. [Google Scholar] [CrossRef]
  120. Wei, W.; Shaoyi, B.; Lanchun, Z.; Yongzhi, W.; Hui, Y. Pavement Roughness Identification Research in Time Domain Based on Neural Network. J. Vibroeng. 2015, 17, 3865–3875. [Google Scholar]
  121. Zennaro, S.; Munaro, M.; Milani, S.; Zanuttigh, P.; Bernardi, A.; Ghidoni, S.; Menegatti, E. Performance evaluation of the 1st and 2nd generation Kinect for multimedia applications. In Proceedings of the 2015 IEEE International Conference on Multimedia and Expo (ICME), Turin, Italy, 29 June–3 July 2015; pp. 1–6. [Google Scholar]
  122. Tran, T.H.; Taweep, C. Automated extraction of expressway road surface from mobile laser scanning data. J. Cent. South Univ. 2020, 27, 1917–1938. [Google Scholar] [CrossRef]
  123. Kumar, P.; Lewis, P.; McElhinney, C.P.; Rahman, A.A. An Algorithm for Automated Estimation of Road Roughness from Mobile Laser Scanning Data. Photogramm. Rec. 2015, 30, 30–45. [Google Scholar] [CrossRef]
  124. Cahalane, C.; McCarthy, T.; Mc Elhinney, C.P. Mobile mapping system performance: An initial investigation into the effect of vehicle speed on laser scan lines. In Proceedings of the Remote Sensing & Photogrammety Society Annual Conference—From the Sea-Bed to the Cloudtops, Cork, Ireland, 1–3 September 2010. [Google Scholar]
  125. Alhasan, A.; White, D.J.; De Brabanter, K.; Alhsan, A. Spatial pavement roughness from stationary laser scanning. Int. J. Pavement Eng. 2017, 18, 1065403. [Google Scholar] [CrossRef]
  126. Lee, J.-H.; Lee, S.-H.; Kang, D.-K.; Na, S.-D.; Yoo, W.-S. Development of a 3D road profile measuring system for unpaved road severity analysis. Int. J. Precis. Eng. Manuf. 2017, 18, 155–162. [Google Scholar] [CrossRef]
  127. Abohamer, H.; Elseifi, M.; Dhakal, N.; Zhang, Z.; Fillastre, C.N. Development of a Deep Convolutional Neural Network for the Prediction of Pavement Roughness from 3D Images. J. Transp. Eng. Part B Pavements 2021, 147, 04021048. [Google Scholar] [CrossRef]
  128. Botha, T.R.; Els, P.S. Rough terrain profiling using digital image correlation. J. Terramechanics 2015, 59, 1–17. [Google Scholar] [CrossRef] [Green Version]
  129. Meyer, F.J.; Ajadi, O.A.; Hoppe, E.J. Studying the Applicability of X-Band SAR Data to the Network-Scale Mapping of Pavement Roughness on US Roads. Remote Sens. 2020, 12, 1507. [Google Scholar] [CrossRef]
  130. Bashar, M.Z.; Torres-Machi, C. Deep learning for estimating pavement roughness using synthetic aperture radar data. Autom. Constr. 2022, 142, 104504. [Google Scholar] [CrossRef]
  131. Suanpaga, W.; Yoshikazu, K. Riding Quality Model for Asphalt Pavement Monitoring Using Phase Array Type L-band Synthetic Aperture Radar (PALSAR). Remote Sens. 2010, 2, 2531–2546. [Google Scholar] [CrossRef] [Green Version]
  132. Karimzadeh, S.; Matsuoka, M. Development of Nationwide Road Quality Map: Remote Sensing Meets Field Sensing. Sensors 2021, 21, 2251. [Google Scholar] [CrossRef]
  133. Babu, A.; Baumgartner, S.V.; Krieger, G. Approaches for Road Surface Roughness Estimation Using Airborne Polarimetric SAR. IEEE J. Sel. Top. Appl. Earth Obs. Remote Sens. 2022, 15, 3444–3462. [Google Scholar] [CrossRef]
  134. Karimzadeh, S.; Matsuoka, M. Remote Sensing X-Band SAR Data for Land Subsidence and Pavement Monitoring. Sensors 2020, 20, 4751. [Google Scholar] [CrossRef]
  135. Rischioni, L.G.; Babu, A.; Baumgartner, S.V.; Krieger, G. Machine Learning Approaches for Road Condition Monitoring Using Synthetic Aperture Radar. IEEE J. Sel. Top. Appl. Earth Obs. Remote Sens. 2023, 16, 3070–3082. [Google Scholar] [CrossRef]
  136. Zeng, Q.; Hu, X.; Shi, X.; Ren, Y.; Li, Y.; Duan, Z. Estimation of Road Roughness Based on Tire Pressure Monitoring. Int. J. Struct. Stab. Dyn. 2022, 22, 22500730. [Google Scholar] [CrossRef]
  137. Zhao, Y.; McDaniel, J.G.; Wang, M.L. IRI estimation using analysis of dynamic tire pressure and axle acceleration. Smart Struct. Syst. 2017, 19, 151–161. [Google Scholar] [CrossRef]
  138. Zhao, Y.; Wang, M.L. IRI measurement using dynamic tire pressure sensor with an axle accelerometer. J. Civ. Struct. Health Monit. 2016, 6, 791–802. [Google Scholar] [CrossRef]
  139. Yang, S.; Wang, R.; Shi, R.; Chen, Y.; Lu, J.; Li, Z.; Cao, Y. An intelligent tyre system for road condition perception. Int. J. Pavement Eng. 2022, 1–12. [Google Scholar] [CrossRef]
  140. Becker, C.; Els, S. Profiling of rough terrain. Int. J. Veh. Des. 2014, 64, 240. [Google Scholar] [CrossRef]
  141. Zhao, Y.; McDaniel, J.G.; Wang, M.L. IRI Estimation Using Probabilistic Analysis of Acoustic Measurements. Mater. Perform. Charact. 2013, 2, 339–359. [Google Scholar] [CrossRef]
  142. Wang, H.-P.; Xiang, P.; Jiang, L.-Z. Optical fiber sensing technology for full-scale condition monitoring of pavement layers. Road Mater. Pavement Des. 2020, 21, 1258–1273. [Google Scholar] [CrossRef]
  143. Zhang, Z.; Deng, F.; Huang, Y.; Bridgelall, R. Road roughness evaluation using in-pavement strain sensors. Smart Mater. Struct. 2015, 24, 115029. [Google Scholar] [CrossRef]
  144. BumpRecorder Co., Ltd. BumpRecorder. 2023. Available online: http://www.bumprecorder.com/en/ (accessed on 8 May 2023).
  145. ARRB Systems. Hawkeye 2000. 2023. Available online: https://arrbsystems.com/fact-sheet/hawkeye-2000/ (accessed on 25 February 2023).
  146. Mandli Communications. Mandli Collection System. 2023. Available online: https://www.mandli.com/ (accessed on 25 February 2023).
  147. International Cybernetics Co. IrisGO Pave. 2023. Available online: https://www.internationalcybernetics.com/iris-gopave/ (accessed on 25 February 2023).
  148. International Cybernetics Co. IrisPRO Pave. 2023. Available online: https://www.internationalcybernetics.com/iris-propave/ (accessed on 25 February 2023).
  149. WayLink Systems, Co. PVision3D Application. 2023. Available online: http://www.pvision3d.com/ (accessed on 4 April 2023).
  150. Gui, R.; Xu, X.; Zhang, D.; Lin, H.; Pu, F.; He, L.; Cao, M. A Component Decomposition Model for 3D Laser Scanning Pavement Data Based on High-Pass Filtering and Sparse Analysis. Sensors 2018, 18, 2294. [Google Scholar] [CrossRef] [Green Version]
  151. AL-Engineering Oy. Roadmaster Road Roughness Meter. 2023. Available online: http://www.al-engineering.fi/en/roadmaster.html (accessed on 8 May 2023).
  152. ARRB Systems. Roughometer 4. 2023. Available online: https://arrbsystems.com/fact-sheet/roughometer-4/ (accessed on 25 February 2023).
  153. ARRB Systems. Walking Profiler G3. 2023. Available online: https://arrbsystems.com/fact-sheet/walking-profiler-g3/ (accessed on 25 February 2023).
  154. Zhuozhou Tianpeng Instrument Manufacturing Co., Ltd. DAPPES-3. 2023. Available online: https://www.testmould.com/test_on_site/walking-profiler.html (accessed on 8 May 2023).
  155. International Cybernetics, Co. SurPRO. 2023. Available online: https://www.internationalcybernetics.com/surpro/ (accessed on 25 February 2023).
  156. Surface Systems & Instruments Inc. CS8800 Walking Profiler. 2023. Available online: https://www.smoothroad.com/equipment/walking-profilers/#/tab=products (accessed on 25 February 2023).
  157. Dynatest. Road Surface Profiler MK III. 2023. Available online: https://dynatest.com/equipment/road-surface-profiler-2/ (accessed on 25 February 2023).
  158. Dynatest. Road Surface Profiler IV. 2023. Available online: https://dynatest.com/equipment/road-surface-profiler/ (accessed on 25 February 2023).
  159. Nanjing T-Bota Scietech Instruments & Equipment Co., Ltd. Road Surface Profiler. 2019. Available online: https://www.tbtscietech.com/Road-Surface-Profilometer-RSP-pd90700436.html (accessed on 8 May 2023).
  160. PaveTesting Ltd. PaveProf V2.0. 2023. Available online: https://pavetesting.com/ (accessed on 25 February 2023).
  161. ARRB Systems. Digital Laser Profiler. 2023. Available online: https://arrbsystems.com/fact-sheet/hawkeye-1000/ (accessed on 25 February 2023).
  162. Greenwood Engineering. LaserProf. 2023. Available online: https://greenwood.dk/road/laserprof/ (accessed on 25 February 2023).
  163. Greenwood Engineering. Greenwood Profiler. 2023. Available online: https://greenwood.dk/road/profiler/ (accessed on 25 February 2023).
  164. International Cybernetics Co. IrisGO Portable Profiler. 2023. Available online: https://www.internationalcybernetics.com/irisgo-portable/ (accessed on 25 February 2023).
  165. International Cybernetics, Co. IrisPRO Inertial Profiler. 2023. Available online: https://www.internationalcybernetics.com/inertial-profilers/ (accessed on 25 February 2023).
  166. Cafiso, S.; DI Graziano, A.; D’Agostino, C.; Pappalardo, G.; Delfino, E. A new perspective in the road asset management with the use of advanced monitoring system & BIM. MATEC Web Conf. 2018, 231, 01007. [Google Scholar] [CrossRef] [Green Version]
  167. Surface Systems & Instruments Inc. CS9550 Portable Survey Profiler. 2023. Available online: https://www.smoothroad.com/equipment/mobile-surveying/cs9550-portable-survey-profiler/#/tab=overview (accessed on 25 February 2023).
  168. Surface Systems & Instruments Inc. CS8600 Ultralight Surface Profiling System. 2023. Available online: https://www.smoothroad.com/equipment/ada-profilers/cs8600-ultra-light-profiler/ (accessed on 25 February 2023).
  169. Data Collection Limited. ROMDAS Laser Profilometer. 2023. Available online: https://romdas.com/romdas-laser-profiler.html (accessed on 25 February 2023).
  170. Applied Pavement Technology Inc. APTech’s EDGE. 2023. Available online: https://www.appliedpavement.com/the-aptech-edge (accessed on 8 May 2023).
  171. Serigos, P.A.; Prozzi, J.A.; Nam, B.H.; Murphy, M.R. Field Evaluation of Automated Rutting Measuring Equipment; No. FHWA/TX-12/0-6663-1; Texas Department of Transportation: Austin, TX, USA, 2012. [Google Scholar]
  172. Ames Engineering. 8300 High Speed Inertial Road Profiler. 2023. Available online: https://amesengineering.com/ (accessed on 25 February 2023).
  173. Ames Engineering. 6300 Lightweight Profiler. 2023. Available online: https://amesengineering.com/products/6300-lightweight-profiler/ (accessed on 25 February 2023).
  174. Pathway Services Inc. PathRunner. 2023. Available online: https://www.pathwayservices.com/technology/ (accessed on 25 February 2023).
  175. Fraunhofer IPM. Pavement Profile Scanner PPS. 2023. Available online: https://www.ipm.fraunhofer.de/en.html (accessed on 25 February 2023).
  176. LMI Technologies. A Global Leader in 3D Scanning and Inspection. 2023. Available online: https://lmi3d.com/wp-content/uploads/2016/08/BROCHURE_RoadandRail_US_WEB.pdf (accessed on 25 February 2023).
  177. Pavemetrics. Laser Crack Measurement System (LCMS®-2). 2023. Available online: https://www.pavemetrics.com/applications/road-inspection/lcms2-en/ (accessed on 25 February 2023).
  178. Fiorentini, N.; Maboudi, M.; Leandri, P.; Losa, M.; Gerke, M. Surface Motion Prediction and Mapping for Road Infrastructures Management by PS-InSAR Measurements and Machine Learning Algorithms. Remote Sens. 2020, 12, 3976. [Google Scholar] [CrossRef]
  179. Gao, H.; Qiu, B.; Barroso, R.J.D.; Hussain, W.; Xu, Y.; Wang, X. TSMAE: A Novel Anomaly Detection Approach for Internet of Things Time Series Data Using Memory-Augmented Autoencoder. IEEE Trans. Netw. Sci. Eng. 2022. [Google Scholar] [CrossRef]
  180. Rathee, G.; Sharma, A.; Iqbal, R.; Aloqaily, M.; Jaglan, N.; Kumar, R. A Blockchain Framework for Securing Connected and Autonomous Vehicles. Sensors 2019, 19, 3165. [Google Scholar] [CrossRef] [PubMed] [Green Version]
  181. Toulouse, M.; Dai, H.; Le, T.G. Distributed load-balancing for account-based sharded blockchains. Int. J. Web Inf. Syst. 2022, 18, 100–116. [Google Scholar] [CrossRef]
  182. Xu, W.; Duan, H.; Chen, X.; Huang, J.; Liu, D.; Chen, Y. Blockchain-based multi-skill mobile crowdsourcing services. EURASIP J. Wirel. Commun. Netw. 2022, 2022, 55. [Google Scholar] [CrossRef]
  183. Behera, H.K.; Pradhan, S.; Das, S.S. Low cost ultrasonic roughometer for pavement roughness measurement. Innov. Infrastruct. Solut. 2021, 6, 168. [Google Scholar] [CrossRef]
  184. Kheirati, A.; Golroo, A. Low-cost infrared-based pavement roughness data acquisition for low volume roads. Autom. Constr. 2020, 119, 103363. [Google Scholar] [CrossRef]
  185. Wessels, I.; Steyn, W.J. Continuous, response-based road roughness measurements utilising data harvested from telematics device sensors. Int. J. Pavement Eng. 2020, 21, 437–446. [Google Scholar] [CrossRef]
  186. Janani, L.; Sunitha, V.; Mathew, S. Influence of surface distresses on smartphone-based pavement roughness evaluation. Int. J. Pavement Eng. 2021, 22, 1637–1650. [Google Scholar] [CrossRef]
  187. Genser, A.; Spielhofer, R.; Nitsche, P.; Kouvelas, A. Ride comfort assessment for automated vehicles utilizing a road surface model and Monte Carlo simulations. Comput. Civ. Infrastruct. Eng. 2022, 37, 1316–1334. [Google Scholar] [CrossRef]
  188. Rahmani, O.; Tehrani, H.G.; Nasiri, A.S.A. A new procedure for analysis of ride quality in roads using multi-body dynamic simulation. Innov. Infrastruct. Solut. 2022, 7, 209. [Google Scholar] [CrossRef]
  189. Jiang, J.; Seaid, M.; Mohamed, M.S.; Li, H. Inverse algorithm for real-time road roughness estimation for autonomous vehicles. Arch. Appl. Mech. 2020, 90, 1333–1348. [Google Scholar] [CrossRef]
  190. Theunissen, J.; Tota, A.; Gruber, P.; Dhaens, M.; Sorniotti, A. Preview-based techniques for vehicle suspension control: A state-of-the-art review. Annu. Rev. Control 2021, 51, 206–235. [Google Scholar] [CrossRef]
  191. Qi, S.; Li, W.; Zhu, A.; Bai, X.F. Responses of Preview-based Vehicle Suspension System on Discrete Impact Roads. In Proceedings of the 6th CAA International Conference on Vehicular Control and Intelligence (CVCI2022), Nanjing, China, 28–30 October 2022; IEEE: Piscataway Township, NJ, USA; pp. 1–6. [Google Scholar] [CrossRef]
  192. Jagadeesh Babu, M.; Rahul, B.G. Analysis of Roughness Index of a Flexible Pavement Using Low Cost Instrumentation. Int. J. Civ. Eng. Technol. 2017, 8, 2036–2043. [Google Scholar]
  193. Liu, Y.; Cui, D. Research on Road Roughness Based on NARX Neural Network. Math. Probl. Eng. 2021, 2021, 9173870. [Google Scholar] [CrossRef]
Figure 1. Quarter car model [24].
Remotesensing 15 02941 g001
Figure 2. Research methodology.
Remotesensing 15 02941 g002
Figure 3. Number of surveyed agencies in the used seven syntheses.
Remotesensing 15 02941 g003
Figure 4. Periodic and cumulative number of publications.
Remotesensing 15 02941 g004
Figure 5. Number of publications for the top affiliated countries considering the corresponding author’s country.
Remotesensing 15 02941 g005
Figure 6. Word cloud of the most frequently occurring author keywords.
Remotesensing 15 02941 g006
Figure 7. Popularity of roughness data collection.
Remotesensing 15 02941 g007
Figure 8. Popularity of roughness data collection technologies in industry practice.
Remotesensing 15 02941 g008
Figure 9. Roughness evaluation using direct measurement equipment type [53].
Remotesensing 15 02941 g009
Figure 10. Roughness evaluation using response-type methods (accelerometer-based) [54].
Remotesensing 15 02941 g010
Figure 11. Numbers of roughness measurement equipment pieces owned by surveyed agencies as reported in the 1986 synthesis [25].
Remotesensing 15 02941 g011
Figure 12. Numbers of roughness measurement equipment pieces owned by surveyed agencies as reported in the 1994 synthesis [27].
Remotesensing 15 02941 g012
Figure 13. Popularity of major roughness data collection technologies in the research community.
Remotesensing 15 02941 g013
Figure 14. Roughness measurement approach used in articles published in study period IV.
Remotesensing 15 02941 g014
Figure 15. Anticipated future trends in industry practice for pavement roughness measurement.
Remotesensing 15 02941 g015
Figure 16. Anticipated future trends among the research community regarding pavement roughness measurement.
Remotesensing 15 02941 g016
Table 1. Summary of the analyzed NCHRP Synthesis of Highway Practice.
SynthesisYearRoughness Data CollectionRoughness Measurement Techniques
Spatial CoverageTemporal CoverageReporting Unit
NCHRP 76: Collection and Use of Pavement Condition Data [19]1981-
NCHRP 126: Equipment for Obtaining Pavement Condition and Traffic Loading Data [25]1986--
NCHRP 203: Current Practices in Determining Pavement Condition [27]1994
NCHRP 334: Automated Pavement Distress Collection Techniques [23]2004
NCHRP 401: Quality Management of Pavement Condition Data Collection [37]2009
NCHRP 589: Automated Data Collection and Quality Management for Pavement Condition Reporting [26]2017
NCHRP 589: Automated Data Collection and Quality Management for Pavement Condition Reporting [2]2022**
√ Information was included; - Information was missing; * All agencies in the USA were assumed to be entitled to PM2 [38] reporting requirements.
Table 2. Most relevant sources.
SourceNo. ArticlesCore Collection
Transportation Research Record17Civil Engineering; Transportation Science & Technology
International Journal of Pavement Engineering15Civil Engineering; Materials Science, Characterization, Testing; Construction & Building Technology
Sensors8Instruments & Instrumentation; Electrical & Electronic Engineering
Journal of Transportation Engineering Part B: Pavements6Civil Engineering; Transportation Science & Technology
Journal of Computing in Civil Engineering5Civil Engineering; Computer Science, Interdisciplinary Applications
Journal of Infrastructure Systems4Civil Engineering
Vehicle System Dynamics4Mechanical Engineering
Automation in Construction3Civil Engineering; Construction & Building Technology
Journal of Testing and Evaluation3Materials Science, Characterization & Testing
Table 3. Top relevant authors’ affiliations.
AffiliationsCountryCum. No. of Articles over the Four Studied Periods
IIIIIIIV
North Dakota State UniversityUSA00016
Tongji UniversityChina00015
Pennsylvania State UniversityUSA1101010
University College DublinIreland0048
Jiangsu UniversityChina0007
Beihang UniversityChina0007
Civil Aviation University of ChinaChina0007
Microwaves and Radar InstituteGermany0007
Table 4. Top cited articles.
ArticleYearTechnologyExperiment TypeSourceTotal Citations
[39]2008Vehicles’ built-in sensorsSimulationVehicle System Dynamics200
[40]2014Accelerometers-based systemFieldTransportation Modeling and Management74
[41]2018Smartphone-based systemFieldSensors68
[42]2020In-pavement strain sensors (optical fiber)FieldJournal of Lightwave Technology67
[43]2010Simulation, accelerometers-based systemSimulationJournal of Sound and Vibration62
[44]2015Accelerometers-based systemSimulation using testbedIEEE Transactions on Control Systems Technology57
[45]2021Vehicles’ built-in sensorsField and simulationTransportation Research Part C: Emerging Technologies57
Table 5. Most occurred author keywords.
KeywordOccurrenceTotal Link Strength
Pavement Roughness46209
International Roughness Index35158
Pavement Management1256
Smartphones1045
Accelerometers945
Artificial Neural Network842
Power Spectral Density840
Ride Quality833
Connected Vehicles737
Pavement Profiles728
Crowdsourcing625
Pavement Condition Assessment629
Machine Learning530
Road Roughness Estimation522
Vehicle Responses518
Table 6. Roughness measurement approaches used in articles published in study period I.
Roughness Measurement ApproachNumber of Studies *
Vehicle response10
Panel rating4
Contact profiler2
Non-contact profiler3
* Some studies made use of multiple approaches.
Table 7. Roughness measurement approach used in articles published in study period II.
Roughness Measurement ApproachNumber of Studies *
Response-type equipment6
Panel rating3
Profilographs1
Non-contact profilometer3
* Some studies made use of multiple approaches.
Table 8. Roughness measurement approach used in articles published in study period III.
Roughness Measurement ApproachNumber of Studies *
3D laser scanner1
Laser profiler4
Vehicle response3
* Some studies made use of multiple approaches.
Table 9. Major studied attributes affecting pavement roughness evaluation using smartphones.
AttributesArticles
Smartphone type[56,85,90,92,93,94,95]
Vehicle type[85,89,90,91,94,96,97]
Mounting arrangement[55,89,90,94,95,97]
Speed[55,89,90,94,95,97,98,99]
Sampling rate[55,100,101]
Table 11. ML models developed using simulated data.
StudyMLInputOutput
[114]ANN76 features (acceleration signal)IRI
ANN9 features (acceleration signal)Roughness class (1–5)
[118]ANNADV (acceleration divided by velocity in a time series considering a time window of 7.5 s)Roughness class (1–5)
[119]ANNAcceleration of a vehicle, delayed version of the vehicle acceleration and the road profilesPavement roughness (mm)
[117]Decision regression tree, Random forest, ANNGrms (RMS body acceleration), speed, suspension stiffness, suspension damping, tire pressure, sprung mass (number of people)IRI
[120]general regression neural network (GRNN)Vertical acceleration and the pitching angle acceleration of the vehicle mass centerPavement roughness (mm)
Table 12. Specifications of the used depth cameras.
BrandNumber of ImagersInfraredDepth TechnologyVertical Resolution (Lower Limit)Manufacturer
Depth Camera D435i2NoStereoscopic0.2 inIntel RealSense
Kinect One (v2)1YesTime-of-Flight0.04 inMicrosoft
Table 13. Specifications of GT–4 and XP-1 mobile laser scanning system.
ArticleBrand3D Laser ScannerGPSCamera
[122]GT–4 systemLaser scanners RIEGL VQ450 (2 sets)GNSS/IMU unit360-degree camera
[123]XP-1 system [124]Riegl VQ-250IXEA LandINS GPS/INS unit6 Progressive scan cameras
Table 15. Comparison of the developed approaches for measuring pavement roughness.
TechnologyTypeCostAccuracyNetwork LevelCrowdsourcing
SmartphonesIndirectLLYesYes
Attached accelerometersIndirectLLYesNo
Vehicles’ built-in sensorsIndirectLLYesYes
Vehicle telematicsIndirectLLYesYes
Piezoelectric cable on a tireIndirectLLYesNo
Tire pressure sensorsIndirectLLYesNo
3D imaging systems (laser)DirectHHYesNo
3D imaging systems (low-cost depth camera)DirectLL-MYesNo
3D imaging systems (stereography)DirectL-ML-HYesNo
Ultrasonic sensors (low-cost)DirectLLYesNo
Infrared sensors (low-cost)DirectLLYesNo
In pavement sensorsIndirect-MNoNo
MicrophonesIndirectMLYesNo
SAR (satellite and airborne)IndirectLLYesNo
Laser-based equipmentDirectHHYesNo
Can-Can (mechanical)DirectMHNoNo
L: low; M: medium; H: high.
Table 16. Crowdsourcing approaches for measuring pavement roughness.
ArticleUsed TechnologySmartphone TypesVehicle TypesDatabase Size (km)Application
[99]Smartphone14743224,000SmartRoadSense
[104]smartphone2356iRoads X
[41]Smartphone11 (bicycle)13.456RoadSR
[57]Smartphone510100Unnamed
[85]Smartphone230.35Server-based system
[90]Smartphone33453.2NA
[97]Smartphone21547NA
[54]Built-in sensors-NA32NA
[45]Built-in sensors-1200NA
Table 17. Low-cost approaches for measuring pavement roughness.
ArticleTechnologyCost (USD)
[67]Depth camera200
[69]Depth camera200
[86]Smartphone100
[109]Attached Sensors50
[184]Infrared sensors47
[51]Attached Sensors29
[183]Ultrasonic sensors20
Table 18. ML models used for pavement roughness evaluation.
ArticleMLTechnology
[102]CNNVehicle response (smartphones)
[104]Extreme Gradient Boosting
[115]ANN, SVM, and Random ForestsVehicle response (vehicles’ built-in sensors)
[45]Self-supervised Learning
[105]Deep Neural NetworkVehicle response (mounted sensors)
[107]BiGRU
[114,118,119]ANNVehicle response (simulated data)
[117]Decision Regression Tree, Random Forest, ANN
[120]General Regression Neural Network (GRNN)
[127]ANN, MNL, CNN3D imaging systems
[24,130]SVM, Deep LearningSAR images
Disclaimer/Publisher’s Note: The statements, opinions and data contained in all publications are solely those of the individual author(s) and contributor(s) and not of MDPI and/or the editor(s). MDPI and/or the editor(s) disclaim responsibility for any injury to people or property resulting from any ideas, methods, instructions or products referred to in the content.

