Article

Seismic Risk Regularization for Urban Changes Due to Earthquakes: A Case of Study of the 2023 Turkey Earthquake Sequence

GERDIS Research Group, Department of Engineering, Pontificia Universidad Católica del Perú, Av. Universitaria 1801, Lima 15088, Peru
*
Author to whom correspondence should be addressed.
These authors contributed equally to this work.
Remote Sens. 2023, 15(11), 2754; https://doi.org/10.3390/rs15112754
Submission received: 8 April 2023 / Revised: 18 May 2023 / Accepted: 24 May 2023 / Published: 25 May 2023
(This article belongs to the Section Earth Observation for Emergency Management)

Abstract

:
Damage identification soon after a large-magnitude earthquake is a major problem for early disaster response activities. The faster the damaged areas are identified, the higher the survival chances of inhabitants. Current methods for damage identification are based on the application of artificial intelligence techniques using remote sensing data. Such methods require a large amount of high-quality labeled data for calibration and/or fine-tuning processes, which are expensive in the aftermath of large-scale disasters. In this paper, we propose a novel semi-supervised classification approach for identifying urban changes induced by an earthquake between images recorded at different times. We integrate information from a small set of labeled data with information from ground motion and fragility functions computed on large unlabeled data. A relevant consideration is that ground motion and fragility functions can be computed in real time. The urban changes induced by the 2023 Turkey earthquake sequence are reported as an evaluation of the proposed method. The method was applied to the interferometric coherence computed from C-band synthetic aperture radar images from Sentinel-1. We use only 39 samples labeled as changed and 9000 unlabeled samples. The results show that our method is able to identify changes between images associated with the effects of an earthquake with an accuracy of about 81%. We conclude that the proposed method can rapidly identify affected areas in the aftermath of a large-magnitude earthquake.

1. Introduction

Earthquakes of large magnitude can cause significant human losses and damage to infrastructure. Notable examples include the 2011 Tohoku-Oki earthquake–tsunami, the 2010 Chile earthquake, the 2016 Mexico earthquake, and the recent 2023 Turkey earthquake. Efficient and prompt disaster response to such events is crucial. The faster the collapsed structures can be identified, the higher the chances of survival for entrapped occupants under collapsed buildings [1]. One way to support the early disaster response phase is by creating damage maps, as they can be used to prioritize areas for search and rescue activities and healthcare system reconstruction.
Currently, remote sensing technology plays a major role in creating damage maps within a few days of a disaster. The primary technique used is change detection on images captured before and after an earthquake. Satellite images can cover large areas, providing a general perspective of all the disaster’s effects. Many satellite data, such as Landsat [2], Sentinel-1 [3], and Sentinel-2 [4] images, are available to the public free of charge. In addition, the joint mission of the U.S. National Aeronautics and Space Administration (NASA) and the Indian Space Research Organisation (ISRO) launching in 2024 will provide L-band synthetic aperture Radar (SAR) images [5]. It is also worth noting that the private sector has provided significant support for research and disaster relief efforts [6,7]. Remote sensing has been extensively applied to identify the effects of earthquakes. Koshimura et al. [8] conducted a comprehensive review of remote sensing applications for tsunami damage detection. A visual inspection of damaged buildings was performed in [9] following the 2003 Bam, Iran, earthquake using high-resolution optical images. Matsuoka et al. [10] proposed two hand-engineered features to identify damage from SAR images, which were later used in [11] to identify affected areas following the 2011 Tohoku-Oki earthquake from TerraSAR images. Yamazaki and Liu [12] provided a comprehensive summary of the available remote sensing data for the 2016 Kumamoto, Japan, earthquake and [13] used LiDAR data to identify collapsed buildings. Moya et al. [14] proposed three-dimensional texture analysis to identify collapsed buildings following earthquakes, demonstrating its application in SAR images and LiDAR data. Moya et al. [15] proposed the use of phase correlation to identify changes between multispectral images that are not coregistered.
Alongside the development of remote sensing for the detection of changes caused by earthquakes, other fields have also advanced. The development of digital communication has enabled researchers and engineers from around the world to collaborate in real time. One example is the Structural Extreme Events Reconnaissance (StEER) framework, which gathers information from field surveys, social media, and news to provide an assessment of the affected area [16]. In [17], the potential usefulness of news and social media data for remote sensing-based damage mapping was proposed. Machine learning and deep learning applied to remote sensing data have also had a significant impact. Methods such as support vector machines [14,18,19], logistic regression [15], and random forest [20] have been adopted to map the effects of earthquakes. In recent years, deep learning methods have been applied intensively, and earthquake damage mapping is no exception. One of the earliest applications can be found in [21]. A cycle-consistent generative adversarial network was used in [22] to calibrate a generator network to transcode SAR images into the optical image domain. Then, the generator was used as a deep feature for change detection caused by the L’Aquila earthquake. In [23], the performance of convolutional neural networks (CNNs) under different settings of input data was evaluated. Nava et al. [24] used CNNs to identify changes associated with landslides caused by the 2018 Hokkaido, Japan, earthquake. In [25], a multilayer perceptron (MLP) was employed to identify changes in roads after earthquakes.
Machine/deep learning methods require a large amount of high-quality training data to be effective. Unfortunately, obtaining training samples for damage mapping is expensive and time-consuming, making it challenging to develop accurate models. To address this challenge, researchers have made significant efforts to collect training data from previous events [23,26]. However, there is still no exhaustive set containing training samples of all building structural systems. Additionally, training data are limited to samples recorded with specific remote sensors. Semi-supervised methods use information from unlabeled samples to mitigate the effect of a low number of labeled samples. In [27], a neural network for change detection in SAR images was calibrated using a semi-supervised approach. First, an initial layerwise calibration in which each layer represents part of an encoder of a variational autoencoder was performed using a large set of unlabeled samples. Then, the neural network was fine-tuned with the labeled samples. A synthetic sample generation model was proposed in [28] to mitigate the need for more real training data for change detection in long-time series SAR images. It is worth noting that images captured in the aftermath of a large earthquake often contain a large number of unlabeled samples, which may serve as an essential source of information and potentially reduce the heavy dependence on manually labeled data.
Although they cannot be predicted yet, earthquakes are perhaps one of the best-monitored disasters. Remote sensing is not the only source of information when an earthquake happens. Most earthquake-prone areas are equipped with ground motion sensors to measure earthquake waves in real time [29,30]. Global navigation satellite system (GNSS) stations are also installed to monitor permanent crustal deformation [31,32]. Furthermore, the dynamic properties of soils are investigated to identify potential amplification of earthquake waves [33,34,35]. Such information is extremely valuable, as it provides insight into the perturbation applied to buildings, enabling the computation of the total performance of infrastructure. A fragility function is a probabilistic estimation of the damage level in a building as a function of a ground motion parameter [36,37,38,39,40] and is a topic that has been studied for several decades. It is believed that these other sources of information should be used together with remote sensing data to identify changes. In [41], the use of fragility functions, together with remote sensing data, was proposed to automatically classify buildings as either collapsed or non-collapsed. However, the proposed method was limited to only a two-dimensional feature space. The method was extended to an n-dimensional feature space in [42]. In [43], it was pointed out that, in some situations, there are no fragility functions available; thus, a novel method to collect training samples using only a strong motion parameter was proposed.
This study represents a follow-up of the work presented in [42]. Here, we propose to employ information of the fragility function to regularize the calibration of a change classifier in a semi-supervised classification problem. Our goal is to exploit the small amount of information available regarding affected areas between the occurrence of a disaster and the recording time of satellite images, as well as the vast number of unlabeled samples. The rest of this manuscript is structured as follows. Section 2 reports the proposed method to include information from ground motion and the fragility function as a regularization term in the calibration process. Section 3 shows an experimental evaluation of the proposed method for the 2023 Turkey earthquake sequence. Section 4 discusses some issues associated with the proposed method in detail. Finally, Section 5 presents our conclusions.

2. Method

The fundamental basis of the methodology lies in the well-known spatial pattern of earthquakes, as schematically presented in Figure 1. When an earthquake occurs, waves travel from the source in all directions. The wave amplitude decreases while moving away from the source, although it may exhibit local amplifications due to soil mechanical properties. Such a pattern is referred to as the attenuation of earthquake waves [44,45,46]. In engineering practice, peak ground acceleration (PGA) and peak ground velocity (PGV) have been used to quantify amplitude. For generalization, in this study, a measure of the wave amplitude is referred to as a demand parameter. It is also known that most damaged buildings are located in areas where the demand is high. However, it should be noted that undamaged buildings can also be observed in high-demand areas. On the other hand, areas with very low demand contain only undamaged buildings. Furthermore, because of the attenuation pattern of the demand, more undamaged buildings will appear as the observed area is expanded.
The proposed method represents a follow-up of the method proposed in [42] for unsupervised change detection, with modifications for semi-supervised change detection. Given the occurrence of a large-magnitude earthquake, it is very likely that a small and incomplete inventory of the affected buildings will be available within hours. Thus, we are given a set of l labeled samples, { x i , y i } i = 1 l , where x i is a sample feature, and y i its label. At the same time, a much larger set of u unlabeled samples, { x i } i = l + 1 l + u , is also given. Consider the set { r i } i = 1 l + u , which contains measurements of the severity of the disaster at the location of each sample. Such information is computed from the demand parameter, which is available in real-time, as well as fragility functions, which are available before the disaster. Let us consider a general classifier function (f). The regularized loss function to be minimized is defined as
L = i = 1 l V ( x i , y i , f ) + γ R R ( f )
where V denotes a cost function that quantifies the error on a labeled sample, R ( f ) regularize f to consider the complexities in the spatial distribution of the demand and the severity of the earthquake at each sample, and γ R is a regularization factor. Hereafter, R ( f ) is denoted as risk regularization.
A modification of cross entropy is adopted for risk regularization.
R ( f ) = 1 i = l l + u ( r i log f ( x i ) + ( 1 r i ) log ( 1 f ( x i ) )
r i = Φ ( d i )
where d i denotes the demand experienced by sample x i , and Φ is a fragility function. In risk analysis, Φ is usually represented as a cumulative distribution function and is formally defined as the probability that an asset has reached or exceeded a certain level of damage, such as collapse, given that it has experienced a demand ( d i ) [37]. Note that risk regularization induces f to classify most samples with low r as unchanged. More samples with large r values are classified as changed. Furthermore, when γ R , then
L γ R R ( f )
the loss approximates to the loss proposed in [42] for an unsupervised problem. On the other hand, when γ R 0 , the equation becomes the loss of a supervised classification problem. Furthermore, when γ R = 1 and the study area is large enough, f tends to classify all samples as unchanged because u l and most unlabeled samples are unchanged. We considered this behavior advantageous because it provides an upper bound of the regularization factor, namely γ R < 1 , which is why a normalization to Equations (1) and (2) by the size of the samples was not performed.

3. Experimental Test

3.1. The 2023 Turkey Earthquakes

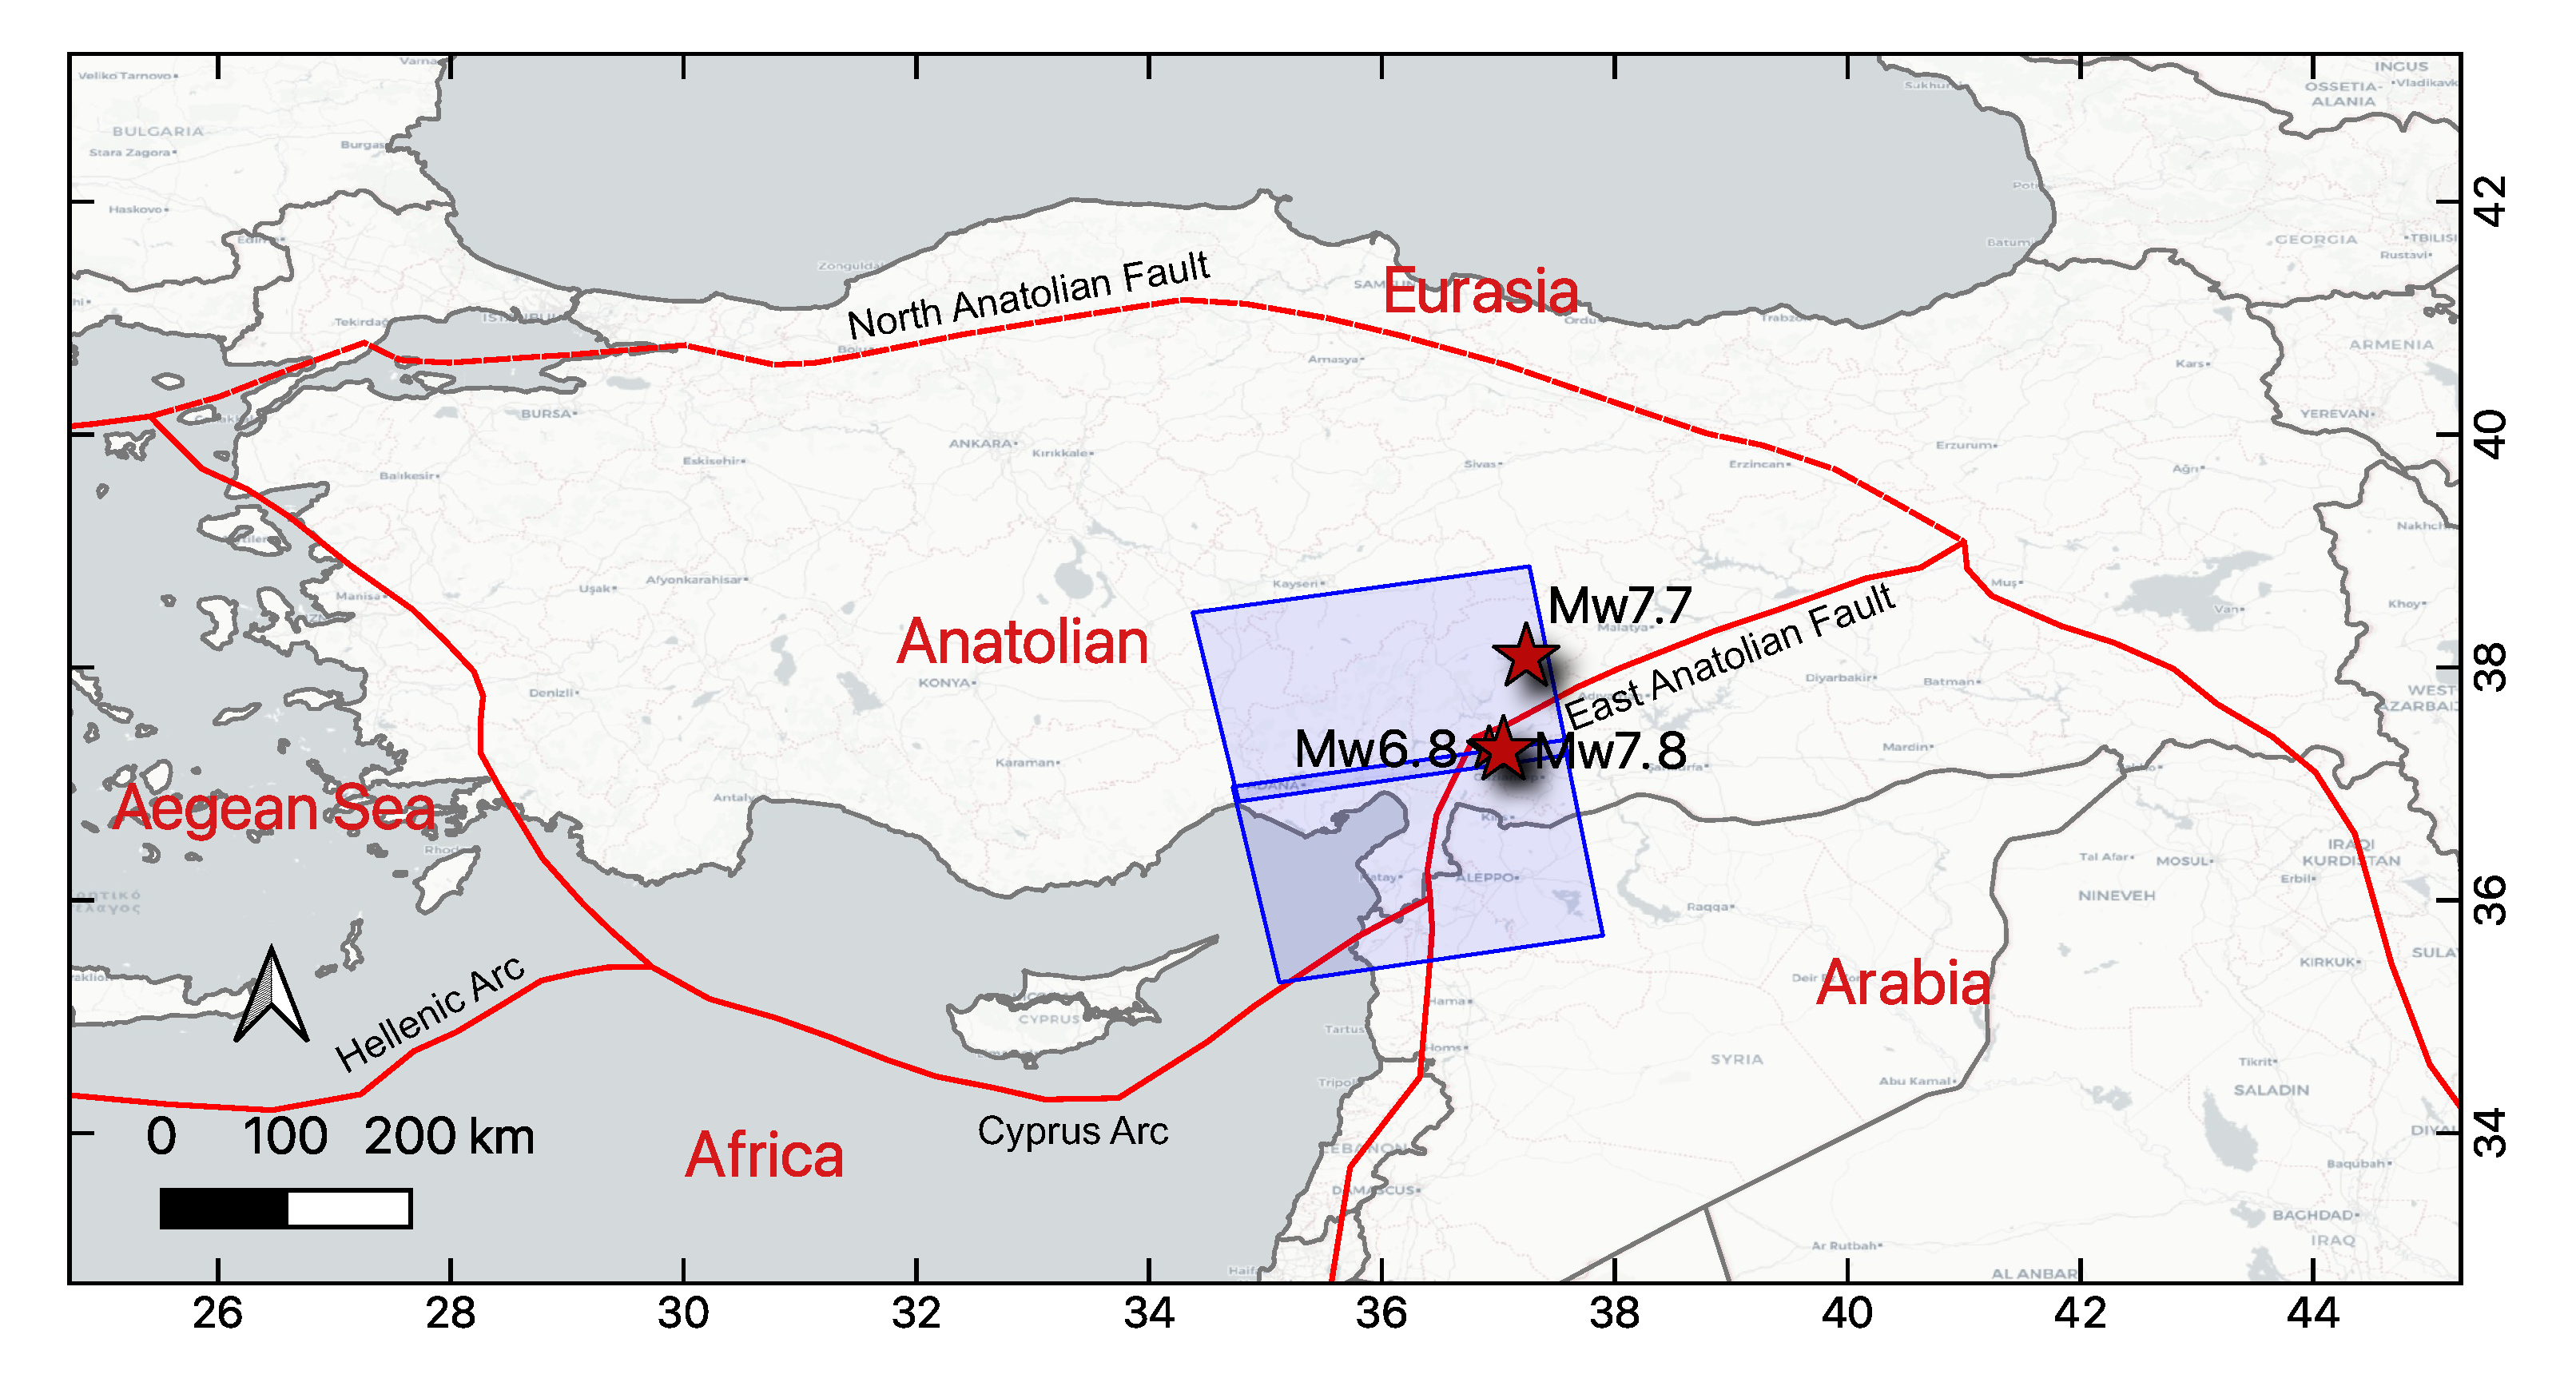
Most of Turkey is located on the Anatolian block and parts of the Eurasian, African, and Arabian plates (Figure 2). The Anatolian block is limited by the North Anatolian Fault in the north, the Hellenic and Cyprus subduction zones in the south, and the East Anatolian Fault in the east. The East Anatolian fault is a 700 km long lateral strike-slip fault. Geodetic, geomorphic, and paleoseismic studies indicate a slip rate of 10 mm/year [47]. On 6 February 2023 at 4:17 a.m. (UTC+3), an Mw 7.8 earthquake struck south–central Turkey and the north of Syria. The event induced a large number of aftershocks, including a second large Mw 7.7 event that occurred at 13:24 on the same day. All these events were produced by the East Anatolian fault system [48].
As of 16 February 2023, the government deployed 264,389 search and rescue workers, 12,600 vehicles, 26 ships, and an air bridge for early disaster response activities [49]. Furthermore, 11,488 teams from different countries offered assistance. As of 18 February 2023, more than 40,000 casualties and 110,000 injured people were reported. Researchers from Middle East Technical University [50] provided one of the earliest reports regarding the effects of the earthquake sequence. More than 100,000 collapsed or severely damaged buildings were reported in several provinces, such as Kahramanmaraş, Adıyaman, Hatay, Osmaniye, Gaziantep, Kilis, Şanlıurfa, Diyarbakır, Malatya, Adana, and Elazığ. The reasons for the poor structural performance of the buildings remain controversial [51,52]. Moreover, liquefaction, a phenomenon that makes certain soils types behave like fluid during earthquakes, was identified in the regions of Hatay-Paşaköy, Hatay-İskenderun, Adıyaman-Gölbaşı, and Adıyaman-Türkoğlu.

3.2. Dataset

Two sets of three C-band SAR images from Sentinel-1 SAR were used in this study (Table 1). The first images recorded in the ascending path after the event were obtained on 9 February. Two scenes were necessary to cover most of the affected areas in this study (Figure 2). Among the affected cities, the southern scene includes the cities of Hatay, Islahiye, Gaziantep, Osmaniye, and Kilis, and the northern scene includes Kahramanmaraş and Adana. For each scene, we selected two additional images recorded before the event and with similar acquisition parameters. These images were recorded on 16 January and 28 January 2023. All images were Level-1 Single Look Complex (SLC) products acquired with vertical–vertical (VV) polarization in interferometric wide swath (IW) mode. The images were coregistered using the image recorded on 28 January as the master image. Note that it is common to use the post-event image as a slave image because during the early disaster response, there is no available precise orbit information. We computed the interferometric coherence as follows.
γ = ( i , j ) I i , h A I i , j B * ( i , j ) I i , j A I i , j A * I i , j B I i , j B *
where I i , j A and I i , j B denote the complex backscattering of arbitrary images A and B, respectively, and * denotes the complex conjugate. The obtained values vary in the range of [0, 1], where 1.0 corresponds to fully correlated data and 0.0 accounts for totally uncorrelated data. Previous studies have shown that coherence can be used as a feature to identify changes in urban areas with high accuracy [53,54,55,56]. Hereafter, we denote a coevent coherence ( γ c o ) as the coherence computed between the post-event image and the image recorded on 28 January. Likewise, pre-event coherence ( γ p r e ) denotes the coherence computed between the two pre-event images.
As this study focuses on changes in urban areas, we used the World Settlement Footprint (WSF) updated to 2019 to pass filter urban areas [57]. The Earth Observation Center (EOC) of the German Aerospace Center (DLR) provided the dataset. The original spatial resolution was 10m, but it was resampled to fit the coherence resolution. Further details of the methods adopted to produce the settlement footprints can be found in [58].
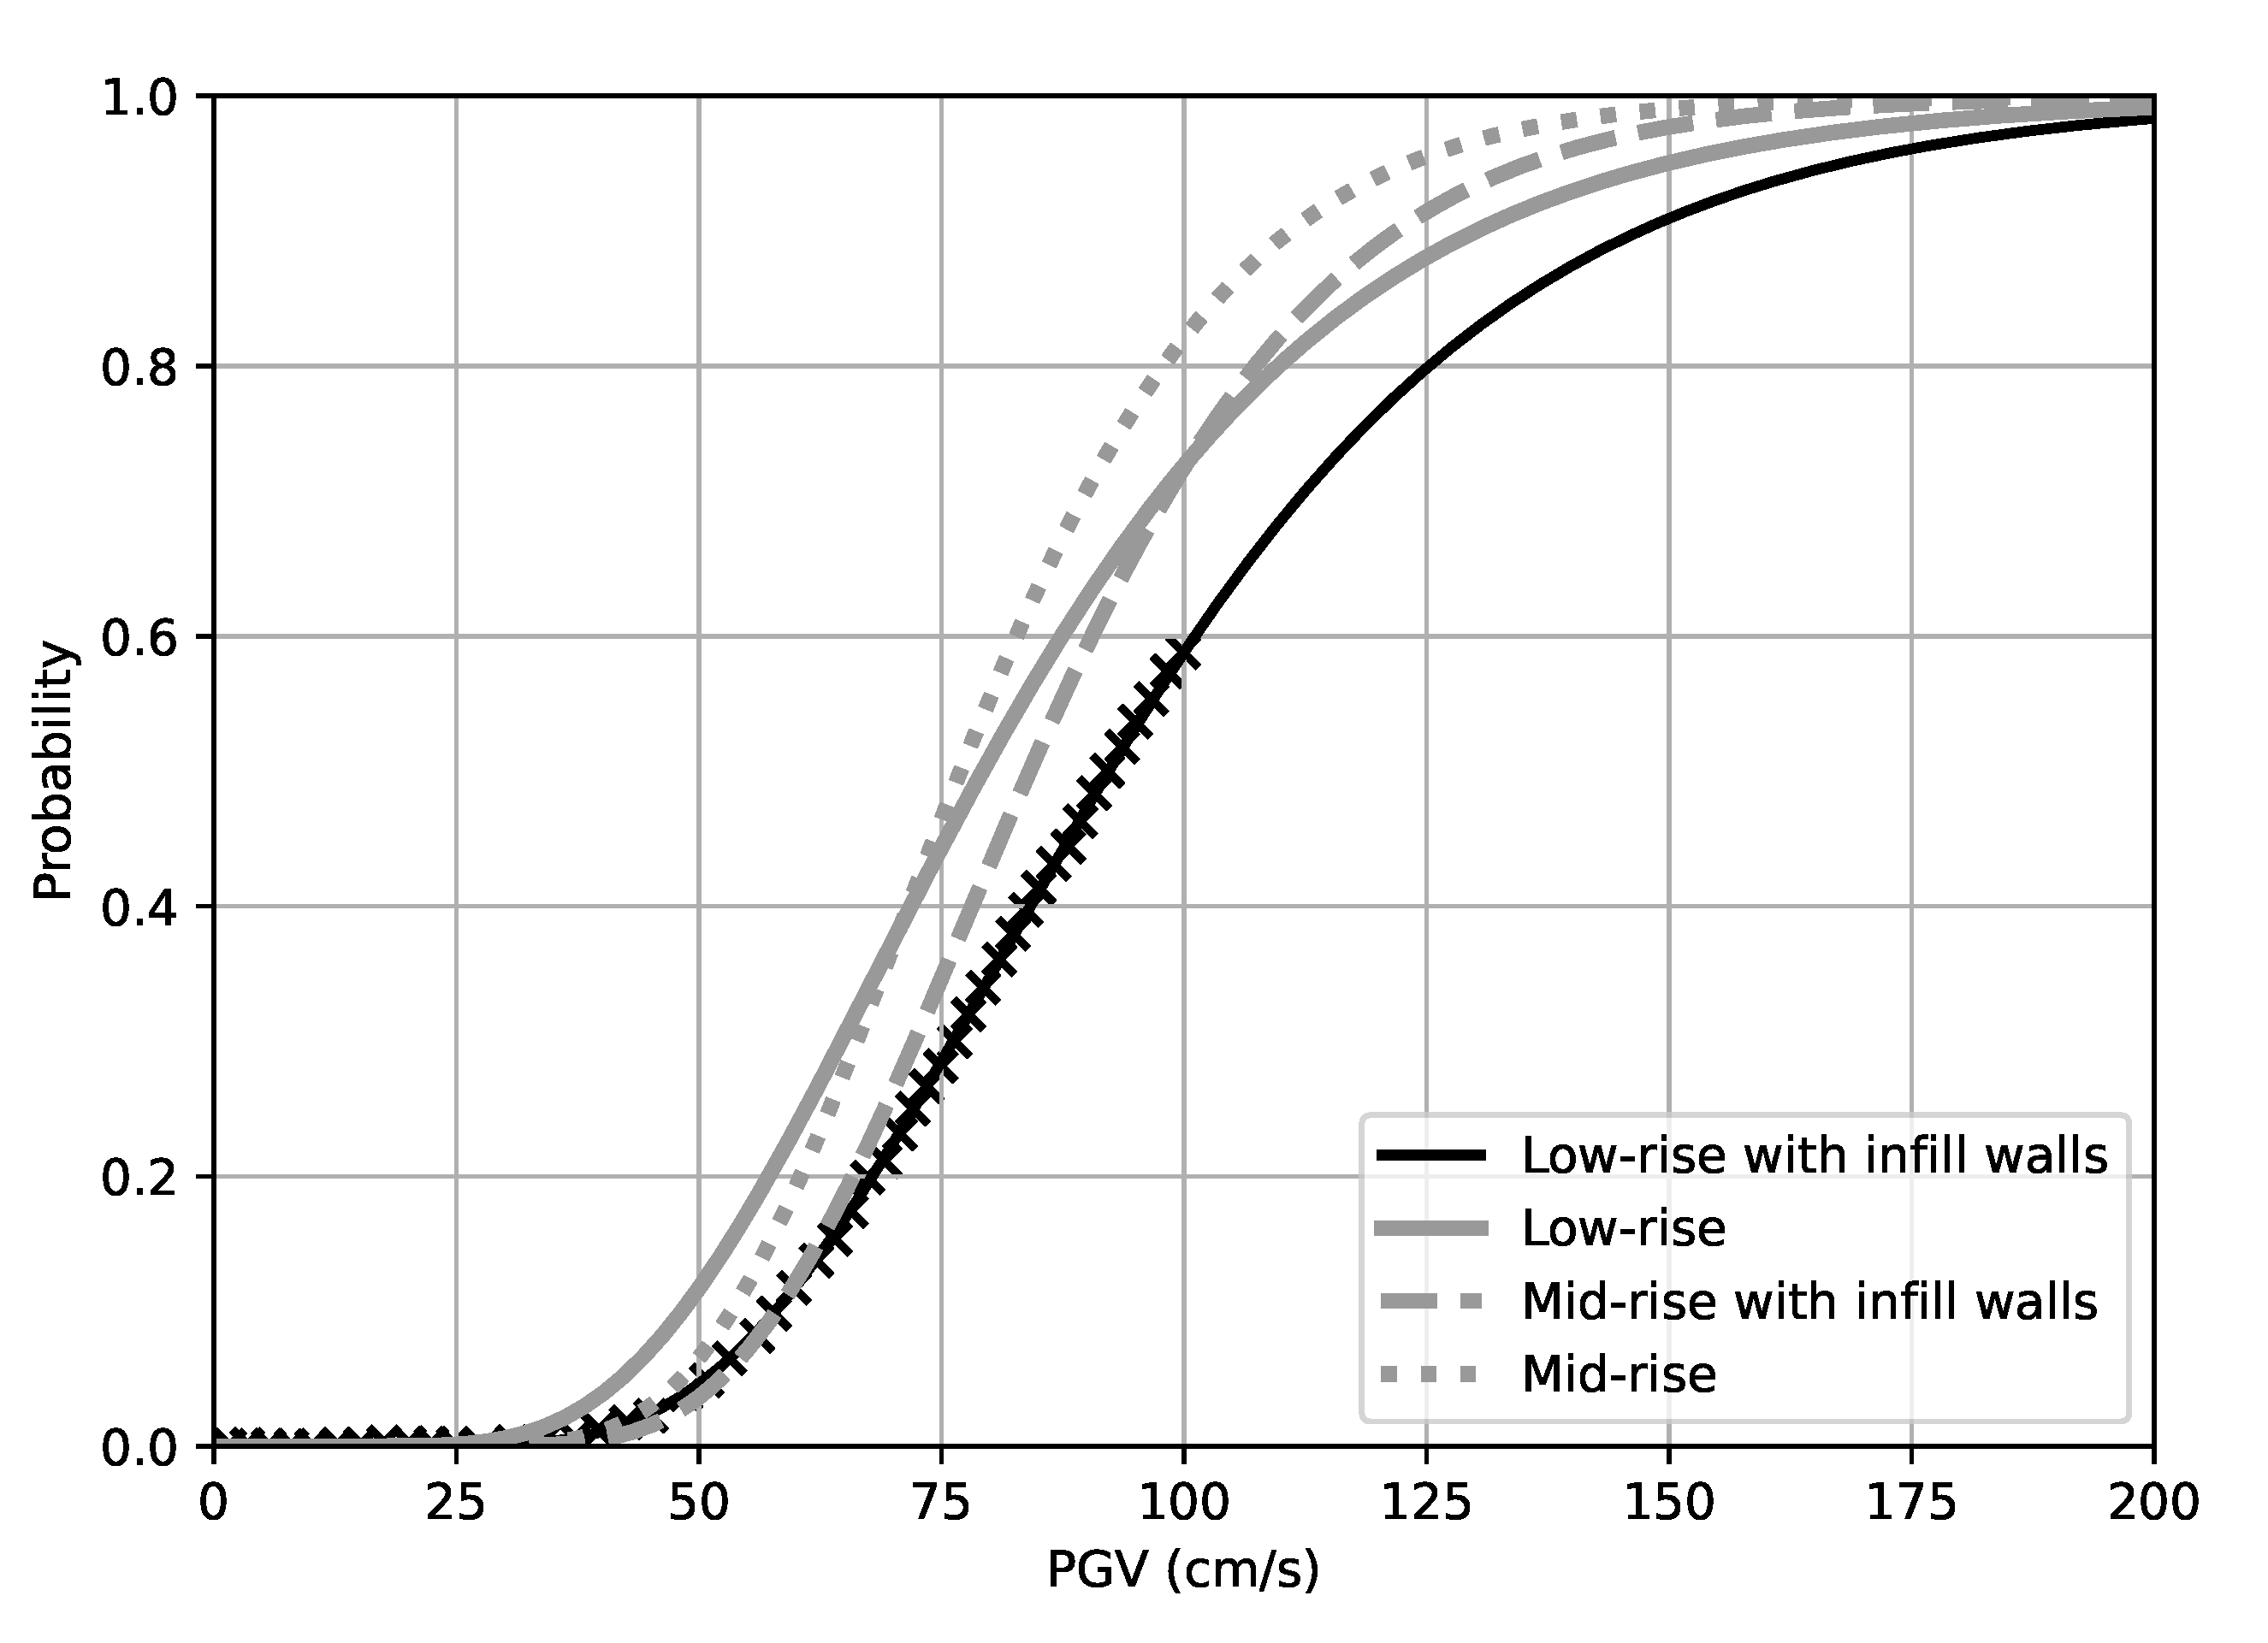
Regarding the fragility function, we adopted the fragility function for low-rise concrete buildings with infill walls proposed in [59]. Numerical simulations were adopted to construct the fragility function. However, the parameters used to model the buildings were selected to represent the properties of a building dataset collected in Düzce city after two major earthquakes in 1999. The Düzce dataset contains buildings with construction years ranging from 1962 to 1999. A cumulative log-normal distribution represents the fragility function. Because the distribution parameters were not provided, we digitized the fragility function plot and fitted a log-normal distribution using a procedure described in [37]. The black marks in Figure 4 show the digitized values from [59], and the solid black line shows the fitted log-normal function. The argument of the fragility function is the peak ground velocity (PGV); we used the PGV map reported by the USGS [60] (Figure 3).
Figure 3. PGV in cm/s according to the USGS [60]. Red stars show the location of the mainshock and the two largest aftershocks as of 21 February. The cyan triangles denote the location of collapsed buildings geocoded as of 8 February during the StEER Network activation. The black marks show the location of 2361 collapsed buildings reported in OpenStreetMap as of 6 March 2023. The white marks show the location of the cities of Kahramanmaras, Iskenderun, Hatay, Aleppo, Dayr Hafir, Al-Safirah, Ma`arat al-Nu`man, and Kafr Nabl.
Remotesensing 15 02754 g003
As pointed out in [17], information from news can be gathered as training data on damaged buildings, and the Turkey earthquake is no exception. On 7 February 2023, The Independent, an online newspaper, broadcast a video captured by a drone in the city of Hatay [61]. We were able to geocode 35 collapsed buildings, the locations of which are shown in Figure 3. In addition, the coordinates of four collapsed buildings were collected from the StEER response to the Turkey earthquake sequence [62]. Furthermore, collapsed buildings reported in OpenStreetMap as of 6 March 2023 were used for testing.

3.3. Results

In this experimental evaluation, sample consists of two features: pre-event and co-event coherence, x i = ( γ p r e , γ c o ) . The classifier function is a multilayer perceptron (MLP) with four internal layers of 10, 20, 20, and 10 nodes, respectively, and a binary output. The classification is performed over the urban footprint. Thus, each pixel is classified as changed or unchanged. For the calibration, we used 39 changed samples collected until 8 February. Samples labeled as unchanged were not available as of 8 February; therefore, they were not used in the calibration. The stochastic gradient descent method [63] was adopted for the calibration of the MLP. We used 200 epochs for the calibration. A total of 9000 unlabeled samples uniformly distributed with respect to the demand were randomly selected to be used in each epoch. A batch size of 1038 samples—1000 unlabeled samples and 38 labeled samples—was used. Note that we used 38 labeled samples for calibration and left one for testing. The calibration process was repeated 39 times, each with a different labeled sample for testing from the initial pool of 39 labeled samples. The number of times the testing sample was correctly classified is stored as an accuracy proxy. The accuracy under different values of the risk regularization factor is depicted in Figure 5. As already pointed out, when the risk regularization γ R = 1.0 , the testing sample was always classified as unchanged. For the final calibration, we used γ R = 1.14 × 10 3 .
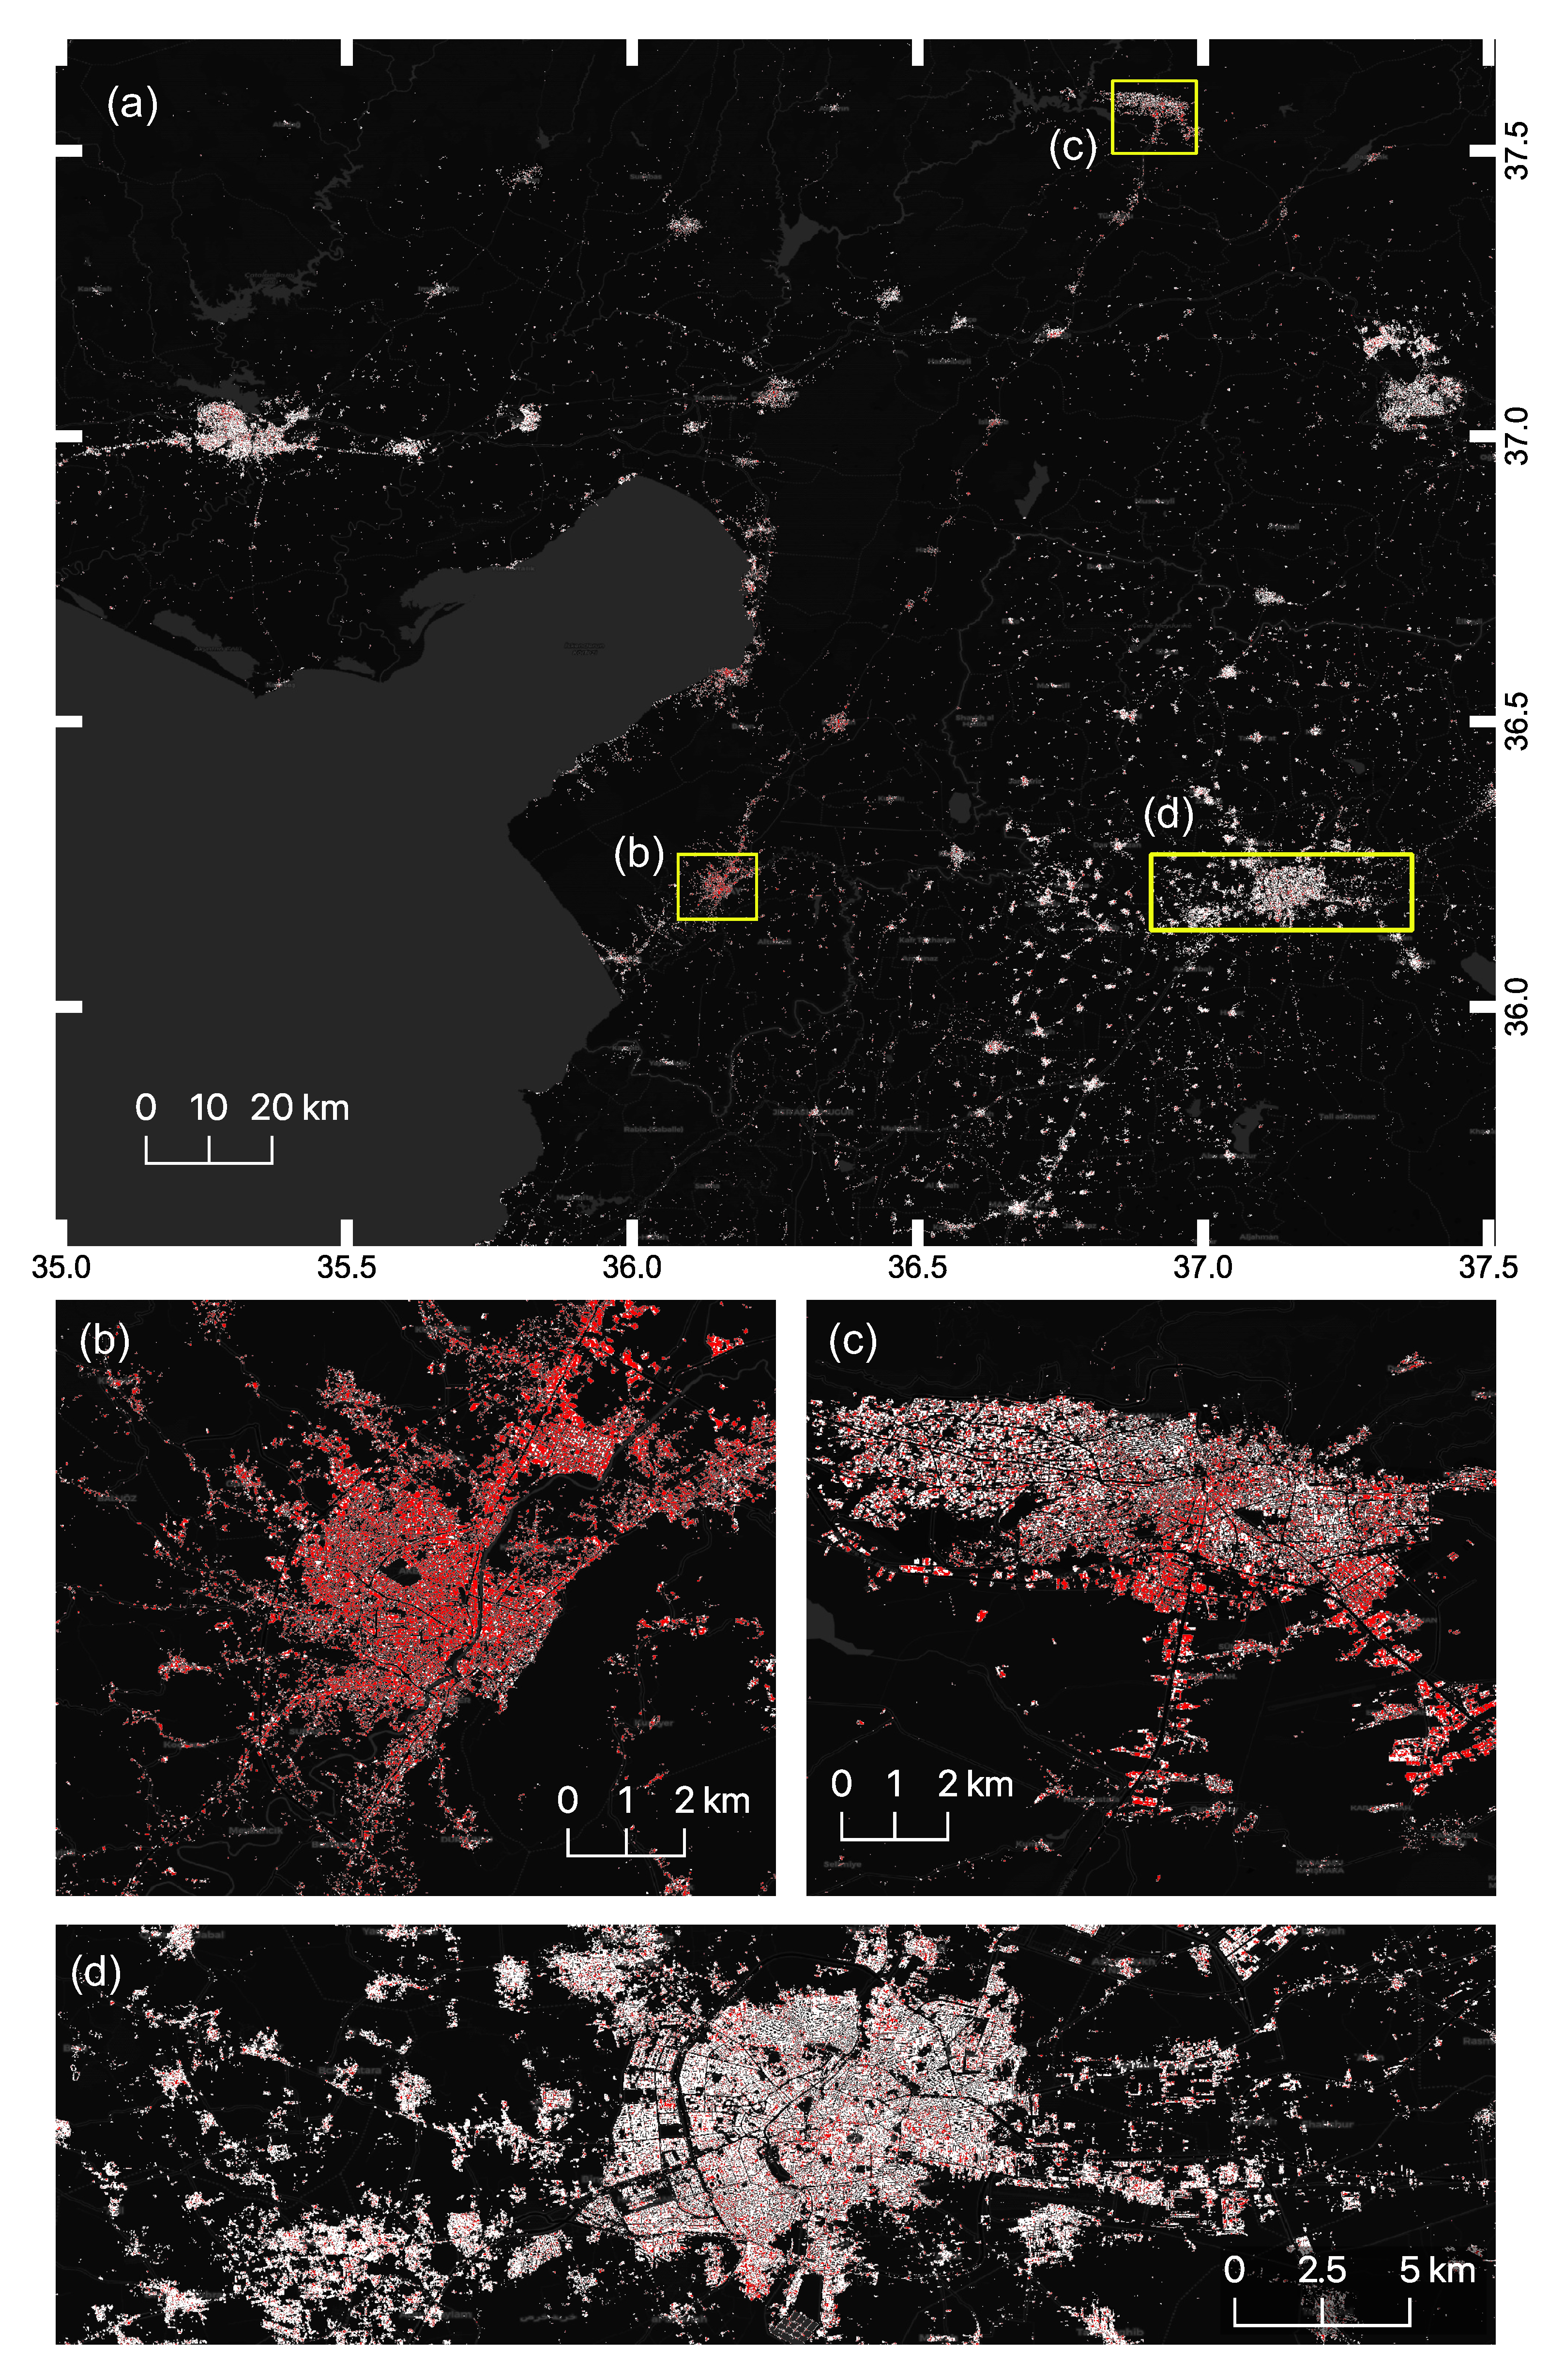
The changes detected in the urban footprint are depicted in Figure 6. A closer look shows that the earthquake dramatically affected the city of Antakya. On the other hand, Allepo city shows fewer changes. Table 2 reports the result of collapsed buildings reported in OpenStreetMap. To complete the testing set, 2361 samples were randomly collected from cities with low demand, such as Kafr Nabl, Ma`arat al-Nu`man, and Dayr Hafir (Figure 3), and considered unchanged. An overall accuracy of 81% was achieved. Furthermore, the averaged user accuracy, producer accuracy, and F1 scores were 82%, 81%, and 80%, respectively (Table 3).

4. Discussion

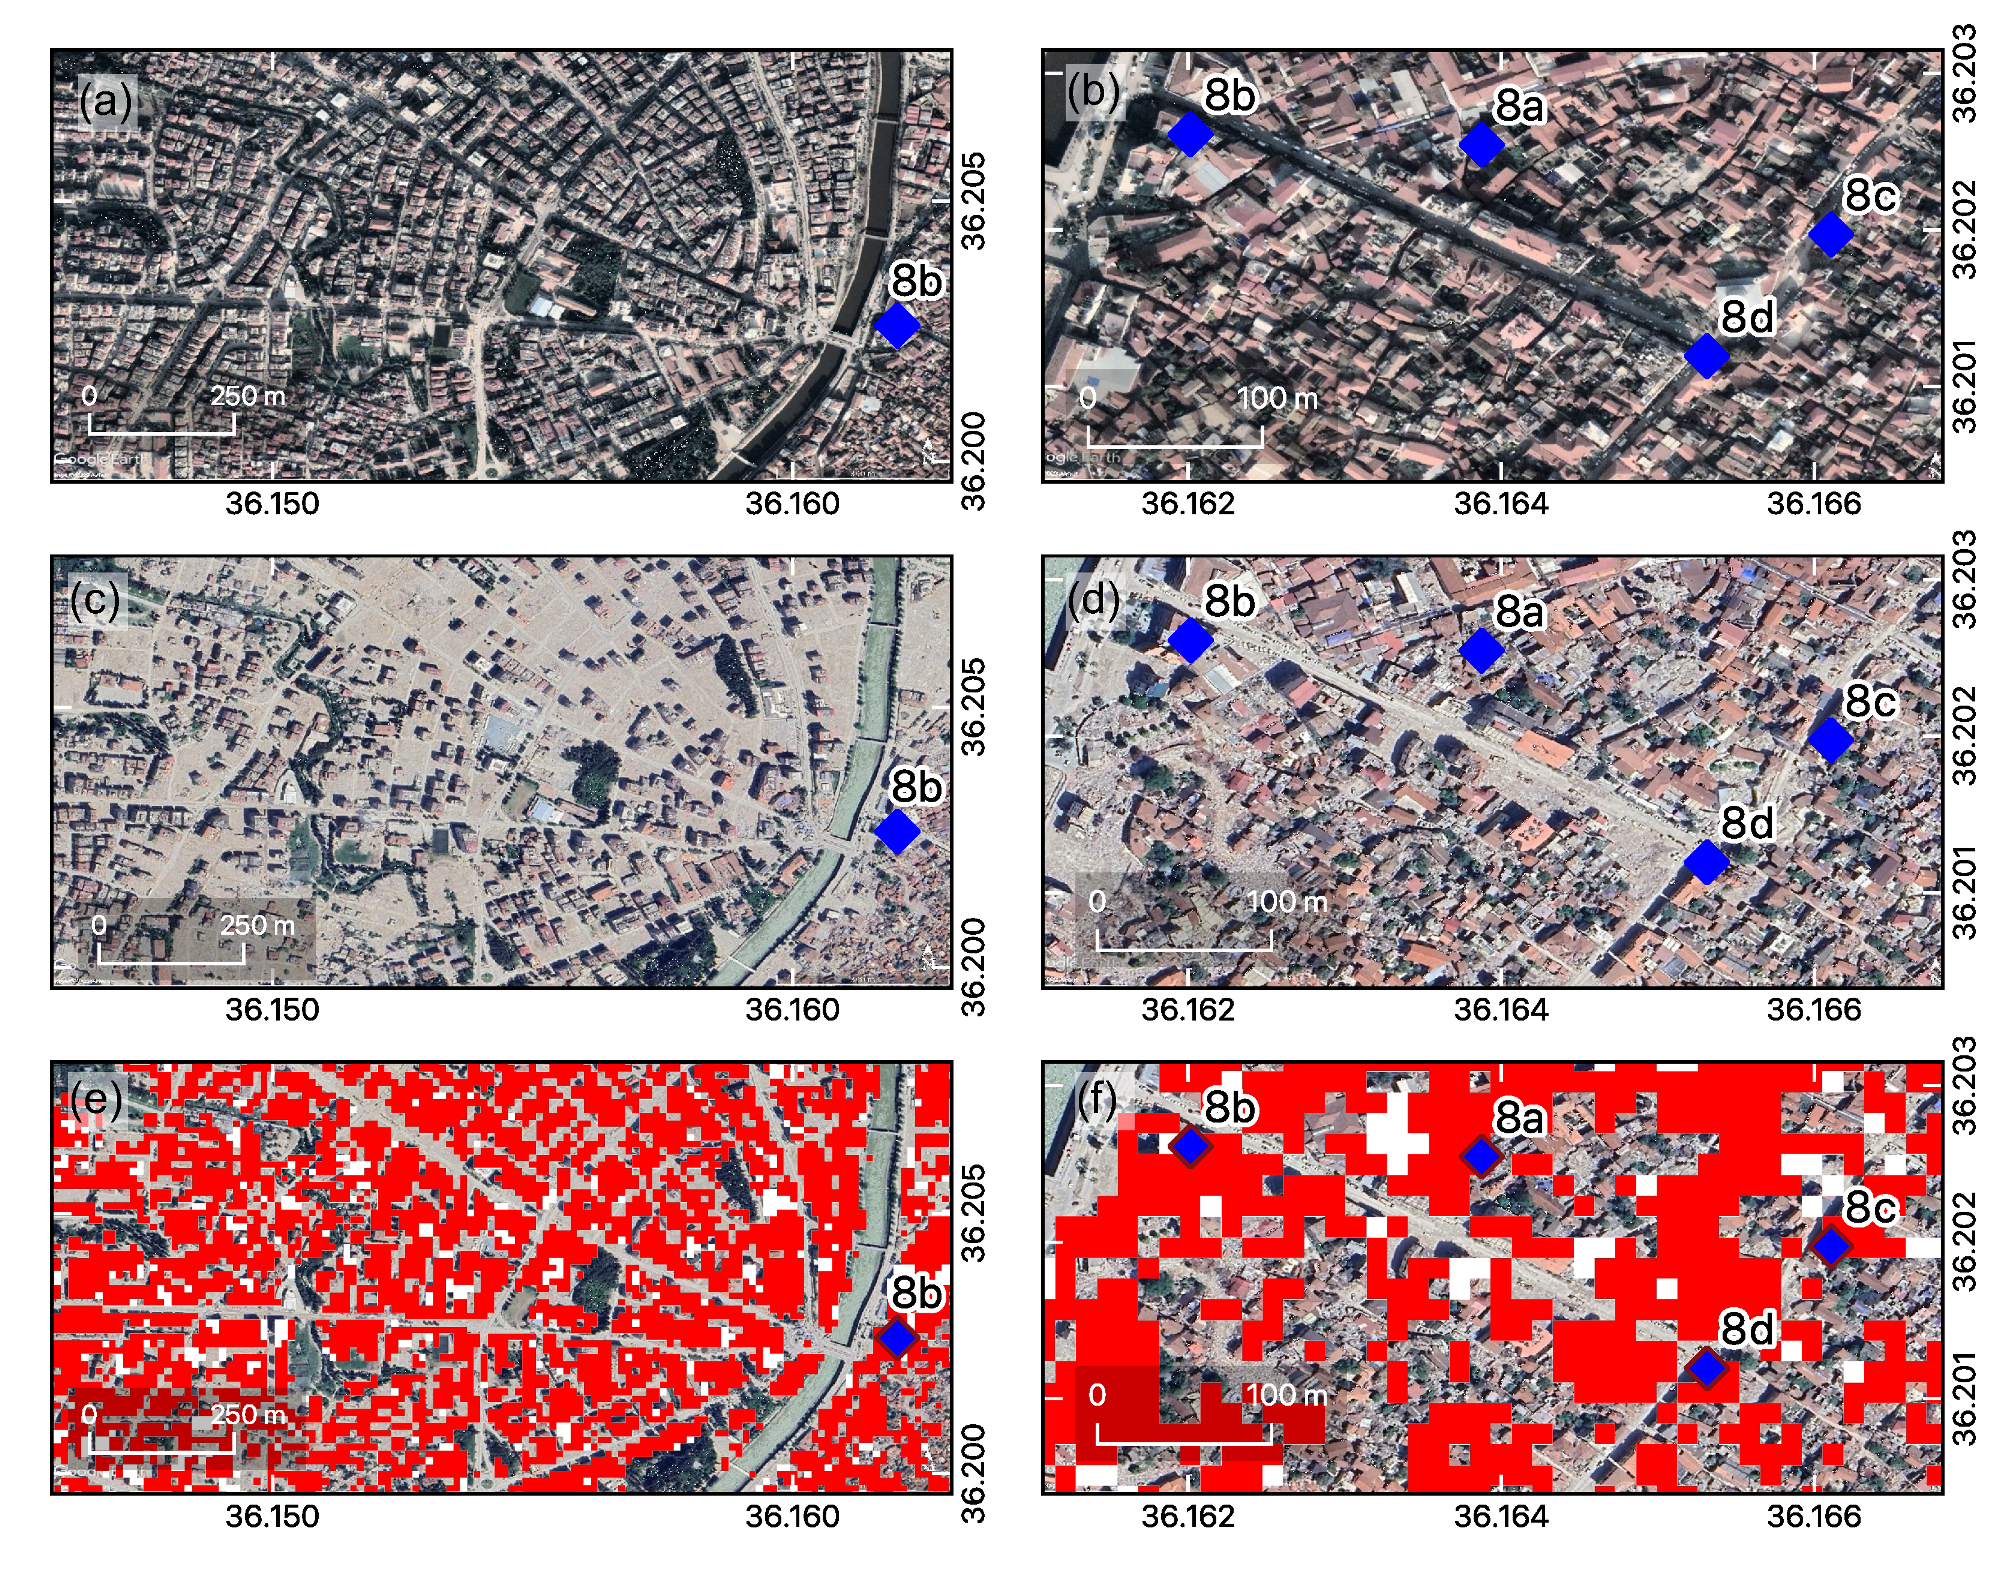
We begin the discussion with a closer look at the changes detected in the results. The previous section showed that the method identified 80% of collapsed buildings from an inventory collected by third parties within the first weeks after the 2023 Turkey earthquakes. Here, we complement this analysis with a qualitative assessment performed from a comparison with optical images. Visual interpretation of Google Earth images recorded in December 2022 and April 2023 confirms that the detected changes include collapsed buildings (Figure 7a,c,e). Furthermore, areas with no apparent change in a building’s roof were classified as changed (Figure 7b,d,f). However, photos recorded in a field survey conducted on 23 April 2023 verify that these areas contain severely damaged buildings with many collapsed walls (Figure 8). The ability to classify severely damaged buildings as changed lies in the hand-engineered feature used as input in the neural network classifier (Equation (5)). Interferometric coherence is a measure of changes in phase between a pair of SAR images. After an earthquake, an arbitrarily damaged building suffers deformations independent of the deformation of a damaged neighboring building. Consequently, disregarding the building’s roof condition, the coevent coherence is low. On the other hand, the pre-event coherence is high because the changes in the built-up area between 16 January and 28 January are minimal. Likewise, a collapsed building exhibits the same pattern, that is, a high pre-event coherence and a low coevent coherence.
The relevance of the proposed method is that it can be used for rapid mapping of the effects of an earthquake. However, the reader should be aware of certain issues, such as need for more detailed information on each building in the region of interest. Note that in the experimental evaluation (Section 3), we chose to use the urban footprint from DLR because there was no precise geocoded building inventory available over the whole region of interest. It is necessary to know the building’s structural system (i.e., reinforced concrete frames, steel frames) in order to determine appropriate fragility function. Thus, not all the available fragility functions could be used. Instead, we used the fragility function for low-rise concrete buildings with infill walls over the whole area, as it is the most representative structural system of the building stock [59]. This assumption was confirmed on a field trip to the Turkish cities of Hatay, Kahramanmaras, and Adana. The naive approach of using one fragility function is not harmful in cases in which there is a predominant building type in the study area. For instance, the fragility function of wooden buildings was used to successfully identify collapsed buildings during the 2011 Tohoku-Oki earthquake–tsunami [41,42]. For the current case study, Figure 4 shows the fragility function for low-rise concrete buildings with infill walls, together with the fragility functions for high-rise concrete buildings with infill walls, low-rise concrete buildings without infill walls, and high-rise concrete buildings without infill walls. Note that the most significant difference between the fragility curves is about 20% with intermediate values of PGV. However, the differences are negligible for low and high values of PGV. Generally, the performance of the proposed method increases if a detailed geocoded inventory of the building stock is available, which will be a subject of a future study.
Over the days following the 6 February 2023 Turkey earthquake, some damage maps were prepared using high-resolution optical images. For instance, the authors of ref. [64] collaborated with Turkey’s Ministry of Interior Disaster and Emergency Management Presidency (AFAD) to identify damaged buildings in four cities: Turkoglu, Nurdagi, Kahramanmaras, and Islahiye. Satellite imagery from Planet Labs [65] and Maxar Technologies [66] was used in the referenced study. Another building damage map was provided by the International Research Institute of Disaster Science, Tohoku University [67]. Their damage map was estimated from Maxar Technology imagery. Note that these studies focused on cities with intermediate or large PGV, and there was prior knowledge that those cities were affected. The coverage area of the imagery was limited to specific cities. It is worth noting that our proposed method cannot be used with the same imagery used in [64,67]. For the calibration of the classifier, unlabeled samples with low PGV are required, which are not included in the imagery provided by Planet Labs or Maxar Technology. The proposed method is better-suited for imagery with a medium resolution, such as SAR images from Sentinel-1 acquired with IW mode or multispectral imagery from Sentinel-2 because their broad coverage includes areas with different levels of PGV. An important advantage of broad coverage is that it can provide a broader perspective of the affected areas and identify cities for which damage might not be known. The disadvantage of using medium-resolution imagery is the limited capacity to estimate the damage at the building level. The application of our method with high-resolution images would require additional images in cities with low PGV. However, with high resolution images, different types of changes can be identified. This will be one subject of our future research.
The proposed regularization can also be adopted as an alternative for fine-tuning tasks in deep neural network (DNN) classifiers. A common practice of DNNs consists of first pretraining a model with a large dataset collected from previous events, then fine tuning with manually collected samples. It is our belief that the process of sample collection for fine tuning can be alleviated by adding our regularization term; this will be the subject of another future study.
In Section 2, it was stated that the proposed loss becomes the unsupervised method proposed in [42] when the risk regularization becomes very large. When this modification was performed in the current experimental evaluation, the classifier did not generalize and classified all samples as unchanged. The main reason for the poor performance is that there is still a significant number of unchanged samples with intermediate/high demand. This pattern was not observed in the case of the 2011 Tohoku-Oki earthquake–tsunami, for which the method proposed in [42] achieved high accuracy. This comparison shows that our method improves upon the method proposed in [42].

5. Conclusions

In this study, we proved that strong motion and fragility functions can support remote sensing data to detect changes caused by earthquakes with very limited labeled samples. We introduced a regularization term to be used in the loss function, which induces the classifier to consider the spatial distribution of the demand (i.e., peak ground velocity or peak ground acceleration) and the probability that a building will suffer damage under such demand. The key aspect of the study is that both the demand and the probability of damage can be computed in real time, and therefore, its calculation does not delay the change detection mapping processing chain.
The proposed method was evaluated on the 2023 Turkey earthquake sequence. The interferometric coherence computed from Sentinel-1 data before and during the earthquake was used as a sample feature. A total of 39 labeled samples and 9000 unlabeled samples were used during the calibration of the classifier function. To simulate a real situation, we used only labeled samples collected before Sentinel-1 data were available, that is, during the period of 6–8 February 2023. The results show about 80% of agreement with the damage inventory reported by a third party.

Author Contributions

Conceptualization, A.P. and L.M.; methodology, A.P. and L.M.; software, A.P. and L.M.; validation, A.P. and L.M.; formal analysis, A.P. and L.M.; investigation, A.P. and L.M.; resources, L.M; data curation, A.P. and L.M.; writing—original draft preparation, L.M.; writing—review and editing, A.P. and L.M.; visualization, L.M.; supervision, L.M.; project administration, L.M.; funding acquisition, L.M. All authors have read and agreed to the published version of the manuscript.

Funding

This research was funded by CONCYTEC/PROCIENCIA grant number PE501078853-2022, the Ángel San Bartolomé scholarship, and the Vicerrectorado de Investigación (VRI) at Pontificia Universidad Católica del Perú (PUCP).

Data Availability Statement

The SAR images are available from the Copernicus Open Access Hub (https://scihub.copernicus.eu/dhus/##/home, accessed on 9 February 2023). The urban footprint is available from the World Settlement Footprint (WSF) 2019-Sentinel-1/2-Global (https://download.geoservice.dlr.de/WSF2019/, accessed on 7 February 2023). The building samples used for the calibration of the classifier in Section 3 are available from Structural Extreme Events Reconnaissance (StEER) (https://www.steer.network/kaharamanmaras, accessed on 8 February 2023). The optical images are available from Google Earth Pro on desktop (https://www.google.com/earth/versions/#earth-pro, accessed on 1 May 2023). The field survey photos are available upon request.

Acknowledgments

This work was partly supported by CONCYTEC/PROCIENCIA (PE501078853-2022) and the Ángel San Bartolomé Scholarship. The authors would like to thank Professor Luis Ceferino for the field survey photos and the Disaster and Emergency Management Authority (AFAD) from Turkey for their support during the field survey.

Conflicts of Interest

The authors declare no conflict of interest. The funders had no role in the design of the study; in the collection, analyses, or interpretation of data; in the writing of the manuscript; or in the decision to publish the results.

References

  1. Ohta, Y.; Murakami, H.; Watoh, Y.; Koyama, M. A model for evaluating life span characteristics of entrapped occupants by an earthquake. In Proceedings of the 13th World Conference on Earthquake Engineering, Vancouver, BC, Canada, 1–6 August 2004. [Google Scholar]
  2. Masek, J.G.; Wulder, M.A.; Markham, B.; McCorkel, J.; Crawford, C.J.; Storey, J.; Jenstrom, D.T. Landsat 9: Empowering open science and applications through continuity. Remote Sens. Environ. 2020, 248, 111968. [Google Scholar] [CrossRef]
  3. Torres, R.; Snoeij, P.; Geudtner, D.; Bibby, D.; Davidson, M.; Attema, E.; Potin, P.; Rommen, B.; Floury, N.; Brown, M.; et al. GMES Sentinel-1 mission. Remote Sens. Environ. 2012, 120, 9–24. [Google Scholar] [CrossRef]
  4. Drusch, M.; Del Bello, U.; Carlier, S.; Colin, O.; Fernandez, V.; Gascon, F.; Hoersch, B.; Isola, C.; Laberinti, P.; Martimort, P.; et al. Sentinel-2: ESA’s optical high-resolution mission for GMES operational services. Remote Sens. Environ. 2012, 120, 25–36. [Google Scholar] [CrossRef]
  5. Jones, C.E.; P, M.; Rao, S. The NISAR Mission’s Capabilities for Natural Hazards Monitoring. In Proceedings of the 2021 IEEE International Geoscience and Remote Sensing Symposium IGARSS, Brussels, Belgium, 11–16 July 2021; pp. 1711–1714. [Google Scholar] [CrossRef]
  6. MAXAR. Open Data Program. 2023. Available online: https://www.maxar.com/open-data/ (accessed on 17 February 2023).
  7. Planet. Disaster DATA. 2023. Available online: https://www.planet.com/disasterdata/ (accessed on 1 March 2023).
  8. Koshimura, S.; Moya, L.; Mas, E.; Bai, Y. Tsunami damage detection with remote sensing: A review. Geosciences 2020, 10, 177. [Google Scholar] [CrossRef]
  9. Yamazaki, F.; Yano, Y.; Matsuoka, M. Visual damage interpretation of buildings in Bam city using QuickBird images following the 2003 Bam, Iran, earthquake. Earthq. Spectra 2005, 21, 329–336. [Google Scholar] [CrossRef]
  10. Matsuoka, M.; Yamazaki, F. Building damage mapping of the 2003 Bam, Iran, earthquake using Envisat/ASAR intensity imagery. Earthq. Spectra 2005, 21, 285–294. [Google Scholar] [CrossRef]
  11. Liu, W.; Yamazaki, F.; Gokon, H.; Koshimura, S. Extraction of Tsunami-Flooded Areas and Damaged Buildings in the 2011 Tohoku-Oki Earthquake from TerraSAR-X Intensity Images. Earthq. Spectra 2013, 29, 183–200. [Google Scholar] [CrossRef]
  12. Yamazaki, F.; Liu, W. Remote sensing technologies for post-earthquake damage assessment: A case study on the 2016 Kumamoto earthquake. In Proceedings of the 6th Asia Conference on Earthquake Engg, Cebu City, Philippines, 22–24 September 2016. [Google Scholar]
  13. Moya, L.; Yamazaki, F.; Liu, W.; Yamada, M. Detection of collapsed buildings from lidar data due to the 2016 Kumamoto earthquake in Japan. Nat. Hazards Earth Syst. Sci. 2018, 18, 65–78. [Google Scholar] [CrossRef]
  14. Moya, L.; Zakeri, H.; Yamazaki, F.; Liu, W.; Mas, E.; Koshimura, S. 3D gray level co-occurrence matrix and its application to identifying collapsed buildings. ISPRS J. Photogramm. Remote Sens. 2019, 149, 14–28. [Google Scholar] [CrossRef]
  15. Moya, L.; Muhari, A.; Adriano, B.; Koshimura, S.; Mas, E.; Marval-Perez, L.R.; Yokoya, N. Detecting urban changes using phase correlation and L1-based sparse model for early disaster response: A case study of the 2018 Sulawesi Indonesia earthquake-tsunami. Remote Sens. Environ. 2020, 242, 111743. [Google Scholar] [CrossRef]
  16. Kijewski-Correa, T.; Roueche, D.B.; Mosalam, K.M.; Prevatt, D.O.; Robertson, I. StEER: A community-centered approach to assessing the performance of the built environment after natural hazard events. Front. Built Environ. 2021, 7, 636197. [Google Scholar] [CrossRef]
  17. Okada, G.; Moya, L.; Mas, E.; Koshimura, S. The potential role of news media to construct a machine learning based damage mapping framework. Remote Sens. 2021, 13, 1401. [Google Scholar] [CrossRef]
  18. Wieland, M.; Liu, W.; Yamazaki, F. Learning change from synthetic aperture radar images: Performance evaluation of a support vector machine to detect earthquake and tsunami-induced changes. Remote Sens. 2016, 8, 792. [Google Scholar] [CrossRef]
  19. Bai, Y.; Adriano, B.; Mas, E.; Koshimura, S. Building damage assessment in the 2015 Gorkha, Nepal, earthquake using only post-event dual polarization synthetic aperture radar imagery. Earthq. Spectra 2017, 33, 185–195. [Google Scholar] [CrossRef]
  20. Adriano, B.; Xia, J.; Baier, G.; Yokoya, N.; Koshimura, S. Multi-source data fusion based on ensemble learning for rapid building damage mapping during the 2018 sulawesi earthquake and tsunami in Palu, Indonesia. Remote Sens. 2019, 11, 886. [Google Scholar] [CrossRef]
  21. Bai, Y.; Gao, C.; Singh, S.; Koch, M.; Adriano, B.; Mas, E.; Koshimura, S. A framework of rapid regional tsunami damage recognition from post-event TerraSAR-X imagery using deep neural networks. IEEE Geosci. Remote Sens. Lett. 2017, 15, 43–47. [Google Scholar] [CrossRef]
  22. Saha, S.; Bovolo, F.; Bruzzone, L. Building change detection in VHR SAR images via unsupervised deep transcoding. IEEE Trans. Geosci. Remote Sens. 2020, 59, 1917–1929. [Google Scholar] [CrossRef]
  23. Adriano, B.; Yokoya, N.; Xia, J.; Miura, H.; Liu, W.; Matsuoka, M.; Koshimura, S. Learning from multimodal and multitemporal earth observation data for building damage mapping. ISPRS J. Photogramm. Remote Sens. 2021, 175, 132–143. [Google Scholar] [CrossRef]
  24. Nava, L.; Monserrat, O.; Catani, F. Improving landslide detection on SAR data through deep learning. IEEE Geosci. Remote Sens. Lett. 2021, 19, 4020405. [Google Scholar] [CrossRef]
  25. Karimzadeh, S.; Ghasemi, M.; Matsuoka, M.; Yagi, K.; Zulfikar, A.C. A Deep Learning Model for Road Damage Detection After an Earthquake Based on Synthetic Aperture Radar (SAR) and Field Datasets. IEEE J. Sel. Top. Appl. Earth Obs. Remote Sens. 2022, 15, 5753–5765. [Google Scholar] [CrossRef]
  26. Gupta, R.; Goodman, B.; Patel, N.; Hosfelt, R.; Sajeev, S.; Heim, E.; Doshi, J.; Lucas, K.; Choset, H.; Gaston, M. Creating xBD: A dataset for assessing building damage from satellite imagery. In Proceedings of the IEEE/CVF Conference on Computer Vision and Pattern Recognition Workshops, Long Beach, CA, USA, 16–17 June 2019; pp. 10–17. [Google Scholar]
  27. Zhao, G.; Peng, Y. Semisupervised SAR image change detection based on a siamese variational autoencoder. Inf. Process. Manag. 2022, 59, 102726. [Google Scholar] [CrossRef]
  28. Li, W.; Ma, P.; Wang, H.; Fang, C. SAR-TSCC: A Novel Approach for Long Time Series SAR Image Change Detection and Pattern Analysis. IEEE Trans. Geosci. Remote Sens. 2023, 61, 5203016. [Google Scholar] [CrossRef]
  29. Katayama, T.; Yamazaki, F.; Nagata, S.; Lu, L.; Turker, T. A strong motion database for the Chiba seismometer array and its engineering analysis. Earthq. Eng. Struct. Dyn. 1990, 19, 1089–1106. [Google Scholar] [CrossRef]
  30. Aoi, S.; Kunugi, T.; Fujiwara, H. Strong-motion seismograph network operated by NIED: K-NET and KiK-net. J. Jpn. Assoc. Earthq. Eng. 2004, 4, 65–74. [Google Scholar] [CrossRef]
  31. Ozawa, S.; Nishimura, T.; Suito, H.; Kobayashi, T.; Tobita, M.; Imakiire, T. Coseismic and postseismic slip of the 2011 magnitude-9 Tohoku-Oki earthquake. Nature 2011, 475, 373–376. [Google Scholar] [CrossRef] [PubMed]
  32. Moya, L.; Yamazaki, F.; Liu, W. Comparison of coseismic displacement obtained from GEONET and seismic networks. J. Earthq. Tsunami 2016, 10, 1640002. [Google Scholar] [CrossRef]
  33. Lu, L.; Yamazaki, F.; Katayama, T. Soil amplification based on seismometer array and microtremor observations in Chiba, Japan. Earthq. Eng. Struct. Dyn. 1992, 21, 95–108. [Google Scholar] [CrossRef]
  34. Wakamatsu, K.; Matsuoka, M. Nationwide 7.5-arc-second Japan engineering geomorphologic classification map and Vs30 zoning. J. Disaster Res. 2013, 8, 904–911. [Google Scholar] [CrossRef]
  35. Karimzadeh, S.; Feizizadeh, B.; Matsuoka, M. DEM-based Vs30 map and terrain surface classification in nationwide scale—A case study in Iran. ISPRS Int. J. Geo-Inf. 2019, 8, 537. [Google Scholar] [CrossRef]
  36. Yamazaki, F.; Murao, O. Vulnerability functions for japanese. Implic. Recent Earthquakes Seism. Risk 2000, 2, 91. [Google Scholar]
  37. Porter, K.; Kennedy, R.; Bachman, R. Creating fragility functions for performance-based earthquake engineering. Earthq. Spectra 2007, 23, 471–489. [Google Scholar] [CrossRef]
  38. Koshimura, S.; Oie, T.; Yanagisawa, H.; Imamura, F. Developing fragility functions for tsunami damage estimation using numerical model and post-tsunami data from Banda Aceh, Indonesia. Coast. Eng. J. 2009, 51, 243–273. [Google Scholar] [CrossRef]
  39. Mas, E.; Paulik, R.; Pakoksung, K.; Adriano, B.; Moya, L.; Suppasri, A.; Muhari, A.; Khomarudin, R.; Yokoya, N.; Matsuoka, M.; et al. Characteristics of tsunami fragility functions developed using different sources of damage data from the 2018 Sulawesi earthquake and tsunami. Pure Appl. Geophys. 2020, 177, 2437–2455. [Google Scholar] [CrossRef]
  40. Torisawa, K.; Matsuoka, M.; Horie, K.; Inoguchi, M.; Yamazaki, F. Development of Fragility Curves for Japanese Buildings Based on Integrated Damage Data from the 2016 Kumamoto Earthquake. J. Disaster Res. 2022, 17, 464–474. [Google Scholar] [CrossRef]
  41. Moya, L.; Mas, E.; Adriano, B.; Koshimura, S.; Yamazaki, F.; Liu, W. An integrated method to extract collapsed buildings from satellite imagery, hazard distribution and fragility curves. Int. J. Disaster Risk Reduct. 2018, 31, 1374–1384. [Google Scholar] [CrossRef]
  42. Moya, L.; Marval Perez, L.R.; Mas, E.; Adriano, B.; Koshimura, S.; Yamazaki, F. Novel unsupervised classification of collapsed buildings using satellite imagery, hazard scenarios and fragility functions. Remote Sens. 2018, 10, 296. [Google Scholar] [CrossRef]
  43. Moya, L.; Geiß, C.; Hashimoto, M.; Mas, E.; Koshimura, S.; Strunz, G. Disaster intensity-based selection of training samples for remote sensing building damage classification. IEEE Trans. Geosci. Remote Sens. 2021, 59, 8288–8304. [Google Scholar] [CrossRef]
  44. Molas, G.L.; Yamazaki, F. Attenuation of earthquake ground motion in Japan including deep focus events. Bull. Seismol. Soc. Am. 1995, 85, 1343–1358. [Google Scholar] [CrossRef]
  45. Shabestari, K.T.; Yamazaki, F. Near-fault spatial variation in strong ground motion due to rupture directivity and hanging wall effects from the Chi-Chi, Taiwan earthquake. Earthq. Eng. Struct. Dyn. 2003, 32, 2197–2219. [Google Scholar] [CrossRef]
  46. Shabestari, K.T.; Yamazaki, F.; Saita, J.; Matsuoka, M. Estimation of the spatial distribution of ground motion parameters for two recent earthquakes in Japan. Tectonophysics 2004, 390, 193–204. [Google Scholar] [CrossRef]
  47. Önder, Çetin.; Bray, J.; Frost, D.; Hortacsu, A.; Miranda, E.; Moss, R.; Stewart, J. February 6, 2023 Türkiye Earthquakes: Report on Geoscience and Engineering Impacts; Technical Report GEER Association Report 082; The Earthquake Engineering Research Institute and Geotechnical Extreme Event Reconnaissance Association and The Earthquake Engineering Association and Earthquake Engineering Foundation of Türkiye: Istanbul, Turkey, 2023. [Google Scholar]
  48. USGS. M7.8 and M7.5 Kahramanmaraş Earthquake Sequence Struck near Nurdağı, Turkey (Türkiye). 2023. Available online: https://www.usgs.gov/news/featured-story/m78-and-m75-kahramanmaras-earthquake-sequence-near-nurdagi-turkey-turkiye (accessed on 6 February 2023).
  49. Disaster and Emergency Management Authority. Press Bulletin-32 about the Earthquake in Kahramanmaras; Technical Report; Ministry of Interior: Ankara, Turkey, 2023. [Google Scholar]
  50. Earthquake Engineering Research Center. Preliminary Reconnaissance Report on February 6, 2023, Pazarcik Mw=7.7 and Elbistan Mw=7.6, Kahramanmaras-Turkiye Earthquakes; Technical Report METU/EERC 2023-01; Middle East Technical University: Ankara, Turkey, 2023. [Google Scholar]
  51. Thompson, A. Why the Earthquake in Turkey Was So Damaging and Deadly. Scientific American. 2023. Available online: https://www.scientificamerican.com/article/why-the-earthquake-in-turkey-was-so-damaging-and-deadly/ (accessed on 20 February 2023).
  52. BBC. Turkey Earthquake: Why Did So Many Buildings Collapse? 2023. Available online: https://www.bbc.com/news/64568826 (accessed on 20 February 2023).
  53. Karimzadeh, S.; Matsuoka, M.; Miyajima, M.; Adriano, B.; Fallahi, A.; Karashi, J. Sequential SAR Coherence Method for the Monitoring of Buildings in Sarpole-Zahab, Iran. Remote Sens. 2018, 10, 1255. [Google Scholar] [CrossRef]
  54. Moya, L.; Endo, Y.; Okada, G.; Koshimura, S.; Mas, E. Drawback in the Change Detection Approach: False Detection during the 2018 Western Japan Floods. Remote Sens. 2019, 11, 2320. [Google Scholar] [CrossRef]
  55. Moya, L.; Mas, E.; Koshimura, S. Learning from the 2018 Western Japan Heavy Rains to Detect Floods during the 2019 Hagibis Typhoon. Remote Sens. 2020, 12, 2244. [Google Scholar] [CrossRef]
  56. Karimzadeh, S.; Matsuoka, M. A Preliminary Damage Assessment Using Dual Path Synthetic Aperture Radar Analysis for the M 6.4 Petrinja Earthquake (2020), Croatia. Remote Sens. 2021, 13, 2267. [Google Scholar] [CrossRef]
  57. Earth Observation Center. World Settlement Footprint 2019. Available online: https://download.geoservice.dlr.de/WSF2019/ (accessed on 17 February 2023).
  58. Marconcini, M.; Metz-Marconcini, A.; Esch, T.; Gorelick, N. Understanding current trends in global urbanisation-the world settlement footprint suite. GI_Forum 2021, 9, 33–38. [Google Scholar] [CrossRef]
  59. Erberik, M.A. Fragility-based assessment of typical mid-rise and low-rise RC buildings in Turkey. Eng. Struct. 2008, 30, 1360–1374. [Google Scholar] [CrossRef]
  60. USGS. M 7.8—26 Km ENE of Nurdağı, Turkey. 2023. Available online: https://earthquake.usgs.gov/earthquakes/eventpage/us6000jllz/executive (accessed on 20 February 2023).
  61. The Independent. Watch Again: View from Hatay after Third Quake Hits Turkey. 2023. Available online: https://youtu.be/QkSjKtSj7Ls (accessed on 7 February 2023).
  62. StEER. StEER Network Activation. 2023. Available online: https://www.steer.network/kaharamanmaras (accessed on 22 February 2023).
  63. Amari, S.i. Backpropagation and stochastic gradient descent method. Neurocomputing 1993, 5, 185–196. [Google Scholar] [CrossRef]
  64. Robinson, C.; Fobi Nsutezo, S.; Pound, E.; Ortiz, A.; Rosa, M.; White, K.; Dodhia, R.; Zolli, A.; Birge, C.; Ferres, L.; et al. Turkey Earthquake Report; Technical Report MSR-TR-2023-7; Microsoft: Redmond, WA, USA, 2023. [Google Scholar]
  65. Planet. Planet’s Response to Earthquakes in Turkey and Syria. 2023. Available online: https://www.planet.com/pulse/planets-response-to-earthquakes-in-turkey-and-syria/ (accessed on 1 March 2023).
  66. MAXAR. Turkey and Syria Earthquake 2023. Available online: https://www.maxar.com/open-data/turkey-earthquake-2023 (accessed on 8 February 2023).
  67. IRIDeS. 2023 Türkiye-Syria Earthquake. Online. 2023. Available online: https://irides.maps.arcgis.com/apps/dashboards/ffb8ae5f27964ad8843c5e99556e0ff5 (accessed on 11 May 2023).
Figure 1. Scheme of the relation between damaged samples and spatial distribution of the demand. Red to yellow tones denote demand. Blue and green marks show undamaged and damaged samples, respectively.
Remotesensing 15 02754 g001
Figure 2. Study area. Blue rectangles show the location of the Sentinel-1 scenes. The red stars show the location of the Mw. 7.8 mainshock and the Mw 6.8 and Mw 7.7 aftershocks. The red lines denote the tectonic plate boundaries.
Remotesensing 15 02754 g002
Figure 4. Fragility function adjusted from [59] for low-rise reinforced concrete (RC) buildings (gray solid line), low-rise RC buildings with infill walls (black solid line), mid-rise RC buildings (gray dotted line), and mid-rise RC buildings with infill walls (gray dashed line). Black marks are the values taken from [59] to fit the function for low-rise RC buildings with infill walls.
Remotesensing 15 02754 g004
Figure 5. Relationship between the risk regularization ( γ R ) and the percentage of correctly classified labeled samples (score). Note that when γ is greater than about 0.01, all samples are classified as unchanged, and thus, the score equals zero.
Remotesensing 15 02754 g005
Figure 6. (a) Map of changes in the urban footprint. Red and white pixels denote changed and unchanged pixels in the urban footprint, respectively. Closer views of the cities of Antakya, Kahramanmaraş, and Aleppo are shown in (bd), respectively.
Remotesensing 15 02754 g006
Figure 7. Closer look at the results using Google Earth images of Hatay. (a,b) Images recorded in December 2022 (image from Google, © 2023 Maxar Technologies). (c,d) Images recorded in April 2023 (image from Google, © 2023 Airbus). (e,f) Changes detected using the proposed method (base image from Google, © 2023 Airbus). Red tones denote areas with changes, and white tones are areas without changes. Blue marks denote the locations of the photos shown in Figure 8.
Remotesensing 15 02754 g007
Figure 8. Photos of buildings heavily damaged and collapsed during the 2023 Kahramanmaras, Turkey, earthquakes. The photos were captured on 23 April 2023. The locations of the photos are shown in Figure 7. (a) Obstruction of a narrow street because of debris from the collapse of a building’s wall. (b) The collapse of infill walls of a five-storey building. (c) The collapse of infill walls of a three-storey building. Note that the roofs of the buildings in (b,c), although severely damaged, were almost unchanged. (d) View of a collapsed wall in a building (left) and a collapsed building (center).
Remotesensing 15 02754 g008
Table 1. Characteristics of the SAR imagery used in the experimental evaluation. Note that each description represents two scenes (see Figure 2 and Figure 3). VV: vertical–vertical; SLC: single look complex; IW: interferometric wide swath.
SensorAcquisitionPathPolarizationBandType of
Product
Acquisition
Mode
Sentinel-19 February 2023AscendingVVCSLCIW
Sentinel-128 January 2023AscendingVVCSLCIW
Sentinel-116 January 2023AscendingVVCSLCIW
Table 2. Comparison of predictions from the classifier with labeled data. Changed samples were labeled by a third party. Unchanged samples belong to the cities with very low PGV. C: changed class, UC: unchanged class.
Observed
CUCTotal
PredictedC21356872822
UC22616741900
Total236123614722
Table 3. User accuracy (UA), producer accuracy (PA), and F1 scores for the predictions reported in Table 2.
UAPAF1
C0.750.900.82
UC0.880.710.79
Average0.820.810.80
Disclaimer/Publisher’s Note: The statements, opinions and data contained in all publications are solely those of the individual author(s) and contributor(s) and not of MDPI and/or the editor(s). MDPI and/or the editor(s) disclaim responsibility for any injury to people or property resulting from any ideas, methods, instructions or products referred to in the content.