Abstract
Carbon storage plays an important role in the global carbon cycle and climate change mitigation. Understanding the relationship between land use change and carbon storage can significantly contribute to carbon neutrality and sustainable development. However, most previous studies only analyze the carbon storage change due to land use change, while few studies quantitatively evaluate the contributions of various land use transitions (LUTs) to carbon storage change, which cannot provide enough information for land use management. In the context of rapid urbanization and ecological conservation, the Poyang Lake basin (PYLB) has experienced dramatic land use change, which has significantly affected local carbon storage. Therefore, this study used the InVEST model to evaluate carbon storage in the PYLB from 1990 to 2020. Then, the Geo-information Tupu method was used to quantify the contributions of various LUTs to carbon storage change and identify the key LUTs. The results showed that carbon storage in PYLB decreased by 17.26 Tg from 1990 to 2020. The carbon gain was mainly attributed to transitions from ‘farmland to forestland’ (36.87%), ‘grassland to forestland’ (22.58%), and ‘farmland to water’ (15.89%). In contrast, the transitions from ‘farmland to built-up land’, ‘forestland to built-up land’, and ‘forestland to grassland’ contributed 39.94%, 28.06%, and 13.25% to carbon loss, respectively. Massive carbon loss caused by built-up land expansion should attract attention. This study can provide references for the formulation and optimization of land use policies to achieve carbon neutrality and sustainable development in the PYLB.
1. Introduction
Global warming is becoming increasingly serious, which has threatened sustainable development and attracted worldwide attention [1,2]. Massive carbon emissions and human-induced land use change are considered two dominant driving forces of climate warming [3,4]. Carbon storage, as an important indicator of ecosystem function, is vital to the global carbon cycle and climate regulation [5,6]. Increasing carbon storage can effectively reduce the amount of CO2 in the atmosphere, which is one of the most important ways to mitigate climate warming [7]. Since China has proposed the goal of carbon neutrality, methods to reduce carbon emissions and increase carbon storage in the ecosystem have become essential issues [8,9,10]. Effective evaluation of carbon storage is of great significance for climate change adaptation and sustainable development [11]. Moreover, it can also provide useful references for formulation and optimization of land use policies [12,13].
At present, the methods used to evaluate carbon storage mainly include field surveys, remote sensing, and model simulations. Although the results of field surveys are precise, they are also time-consuming and laborious, which makes them more suitable for small scales [14,15]. The remote sensing method is very suitable for large scales because of its low cost and extensive coverage, while the accuracy of evaluation is influenced by the spatiotemporal dimensions of remote sensing data [16]. Model simulations have grown in popularity in recent years because they can spatially explicitly evaluate carbon storage at various scales [17,18]. Many models can be used to evaluate carbon storage, such as High Accuracy Surface Modeling (HASM) model [19], Century model [20], and Biome–Biogeochemical Cycles (Biome–BGC) model [21]. However, most of these models need a large amount of data and parameterization, which limits their application [11,22]. In contrast, the Integrated Valuation of Ecosystem Services and Tradeoffs Tool (InVEST) model has become increasingly popular in evaluating carbon storage due to its low input requirements and excellent output precision [5,18]. This model only needs remote sensing data (land use) and carbon density as inputs, and comprehensively considers four carbon pools: aboveground carbon, belowground carbon, dead organic carbon, and soil organic carbon. Since this model can link land use change and carbon storage, it has been widely used to quantify the effect of land use policies and ecological restoration programs on regional carbon storage [13,23,24,25,26,27,28].
Land use change is considered the dominant factor affecting carbon storage in terrestrial ecosystems [29]. In recent decades, China has experienced rapid urbanization, characterized by dramatic land use transitions (LUTs) from ecological land to built-up land, which has led to serious ecosystem degradation, including considerable loss of carbon storage [9,13]. Meanwhile, to mitigate ecosystem degradation, the Chinese government has also launched multiple ecological restoration programs, such as the Grain for Green program and natural forest conservation program, since the late 1990s [30]. Previous research revealed that these programs significantly increased ecosystem carbon storage [18,23,25,31,32]. However, most previous studies only analyzed the carbon storage change due to land use change, while few studies quantified the contributions of various LUTs to carbon storage change. Accurate quantification of contributions of various LUTs to carbon storage change can help identify the key LUTs affecting carbon storage and provide more detailed references for land use policies. Geo-information Tupu is a geographical spatiotemporal analysis method to explore the internal structure of geographic elements and the rules of spatial differentiation [33]. This method can record the composite spatiotemporal information of land use change based on Tupu units, which makes LUT research more accurate, intuitive, and realistic [34,35]. This method has been applied in many fields such as ecosystem service value [35], landscape multifunctionality [36], habitat quality [37], and landscape ecological risk [38].
The Poyang Lake basin (PYLB) plays an important role in ecological security in the middle-lower reaches of the Yangtze River [39]. In the context of rapid urbanization and ecological conservation, this basin has experienced dramatic land use change, which significantly affected local carbon storage. However, how carbon storage changed in the basin remains unclear. Therefore, this study utilized the InVEST model and Geo-information Tupu method to explore the effect of LUTs on carbon storage. The main objectives were to (1) assess the spatiotemporal change in land use and carbon storage in PYLB from 1990 to 2020; (2) quantify the contributions of various LUTs to carbon storage change and identify the key LUTs. This study can provide references for carbon neutrality and sustainable development in the PYLB.
2. Methods and Materials
2.1. Study Area
The PYLB (24°24′N–29°46′N, 113°23′E–118°46′E) covers an area of 1.62 × 10⁵ km2 (Figure 1). It consists of the Poyang Lake region and five subbasins (i.e., Ganjiang river basin, Fuhe river basin, Raohe river basin, Xinjiang river basin, and Xiushui river basin). This basin is dominated by a subtropical monsoon climate, with an annual temperature of approximately 17.6 °C and an annual precipitation of approximately 1680 mm [40]. The topography of this basin is complex and diverse, with mountains, hills, and plains covering 36%, 42%, and 12.1% of the basin, respectively [41].
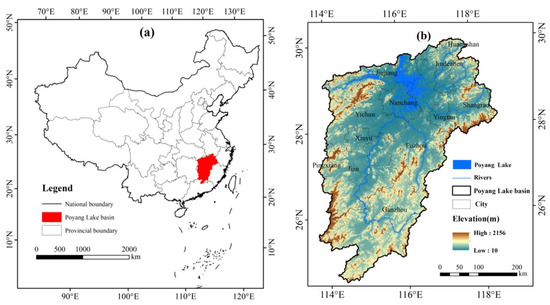
Figure 1.
Location (a) and elevation (b) of the PYLB.
2.2. Methods
Figure 2 illustrates the research framework of this study. First, we used the Geo-information Tupu method to analyze land use transitions in the PYLB from 1990 to 2020. Then, the InVEST model was used to estimate carbon storage, due to its low input requirements and excellent output precision, and hotspot analysis was used to explore the spatiotemporal change in carbon storage. Finally, based on the results of the previous two steps, we quantified the contributions of different land use transitions to carbon storage change during each period and identified the key land use transitions, which can provide references for land use management in the PYLB.
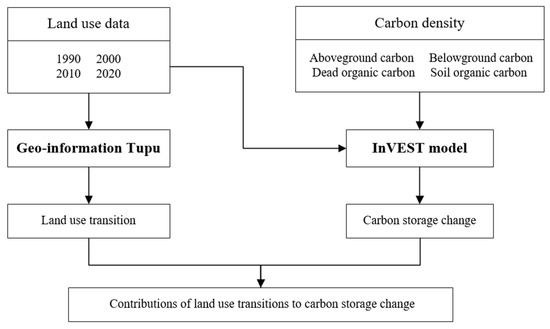
Figure 2.
The research framework of this study.
2.2.1. Geo-Information Tupu Method
The Geo-information Tupu method can reflect the spatiotemporal change in land use using the Tupu unit [33]. The land use types of farmland, forestland, grassland, water area, built-up land, and unused land were assigned codes 1, 2, 3, 4, 5, and 6, respectively. Then, the Raster Calculator tool in ArcGIS 10.2 was used to build the Tupu process for LUT. The equation is as follows [35]:
where is the code of LUT during the study period, and and are the codes of land use type at the beginning and end of the study period, respectively.
2.2.2. The InVEST Model
The Carbon Storage and Sequestration module of InVEST model was utilized to assess carbon storage. This model has been widely used in carbon storage assessment, due to its low input requirements and excellent output precision [8,10,11,12,14,29]. It only needs land use data and carbon density as inputs, and comprehensively considers four carbon pools: aboveground carbon, belowground carbon, dead organic carbon, and soil organic carbon. The equations are as follows:
where is the total carbon storage;, , , , and are total carbon density and the carbon densities of aboveground carbon, belowground carbon, dead organic carbon, and soil organic carbon in land use type i, respectively; and is the area of land use type i.
2.2.3. Hotspot Analysis
The Getis–Ord statistic can assess spatial high-value clusters and low-value clusters of regional elements and spatial patterns of hotspots, which can provide a scientific reference for land use policy [42]. This study applied the Getis–Ord statistic to analyze the spatial agglomeration of carbon storage change. To enhance the visualization, we defined the sample unit as a 6 km × 6 km grid, to cover the study area. The carbon storage changes in each grid were calculated. Then the hotspot analysis was conducted in ArcGIS 10.2. The equations are as follows [42]:
where is the z-score; is the number of regions, and each region is identified with a point i = 1,2, …, n, in which each point is connected with a value (weight) from a variable X, where denotes x associated with j points within distance d of the ith point; is a spatial weight matrix between i and j; and X and S are the sample mean and standard deviation, respectively. If statistically significant, a higher z-score (z-score > 0) means that the hotspots (high values) are clustered more closely. A lower z-score (z-score < 0) means that the cold spots (low values) are tightly clustered. Non-significant spots are not statistically significant.
2.3. Data Sources
2.3.1. Land Use Data
The land use data from 1990, 2000, 2010, and 2020, with a spatial resolution of 30 m, were obtained from the Resource and Environment Science Data Center of the Chinese Academy of Sciences (https://www.resdc.cn/, accessed on 21 May 2022). Data production was based on Landsat Thematic Mapper/Enhanced Thematic Mapper (TM/ETM) remote sensing images from various periods that were generated through visual interpretation based on national field surveys. The accuracy of this dataset is greater than 92.90% [43]. In this study, the land use dataset was divided into six types: farmland, forestland, grassland, wetland, built-up land, and unused land.
2.3.2. Carbon Density Data
The total carbon density of each land use type contains four parts: carbon density in aboveground carbon, belowground carbon, dead organic carbon, and soil organic carbon. In this study, we first collected carbon density data in the study area from published papers that used scientific methods (e.g., field surveys and geochemical experiments). The carbon densities of farmland, forestland, and grassland were 106.30 Mg/ha, 124.30 Mg/ha, and 102.50 Mg/ha, respectively [44,45]. The carbon density of wetland was 140.68 Mg/ha [46]. The carbon densities of soil organic carbon of built-up land and unused land were 34.33 Mg/h and 34.42 Mg/ha, respectively [29,47]. Then, according to the proportion of the four carbon pools as to each measurement of carbon density for individual land use type in the literature [48], we calculated the four measurements of carbon density of four carbon pools for each land use type (Table 1).

Table 1.
Carbon densities of each land use type in the PYLB.
3. Results
3.1. Land Use Change from 1990 to 2020
Forestland and farmland were the dominant land use types in the basin (Table 2 and Figure 3), accounting for 61.80% and 26.21% of the basin in 2020, respectively. Forestland was widely distributed in the basin and farmland was mainly concentrated in plain regions. Grassland, wetland, built-up land, and unused land occupied 4.45%, 4.46%, 3.08%, and 0.01% of the basin in 2020, respectively. The built-up land showed an accelerated upward trend, expanding by 15,989 ha, 102,031 ha, and 134,590 ha during 1990–2000, 2000–2010, and 2010–2020, respectively. The forestland increased by 22,665 ha during 1990–2000, while decreasing by 12,821 ha and 97,108 ha during 2000–2010 and 2010–2020, respectively. The farmland experienced an accelerating decreasing trend, decreasing by 19,215 ha, 35,381 ha, and 74,192 ha during 1990–2000, 2000–2010, and 2010–2020, respectively. The grassland decreased by 23,090 ha and 45,809 ha during 1990–2000 and 2000–2010, respectively, while increasing by 32,073 ha during 2010–2020. The wetland decreased by 7738 ha during 2000–2010, while increasing by 3653 ha and 4750 ha during 1990–2000 and 2010–2020, respectively. The unused land exhibited a continual downward trend.
Table 2.
Land use area and proportion in the PYLB from 1990 to 2020.
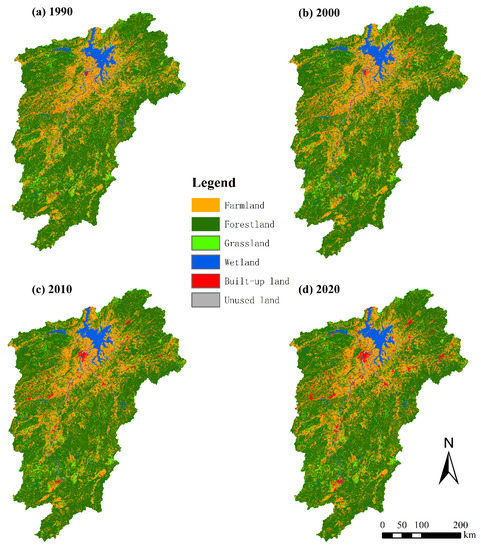
Figure 3.
Spatial pattern of land use types of the PYLB.
3.2. Land Use Transitions from 1990 to 2020
Based on the Geo-information Tupu method, the land use transitions during the three periods (1990–2000, 2000–2010, and 2010–2020) were analyzed (Figure 4 and Table 3). The land use conversion areas were 122,424 ha, 374,721 ha, and 684,779 ha during 1990–2000, 2000–2010, and 2010–2020, respectively. From 1990 to 2000, forestland expansion was obvious, and “grassland to forestland” and “farmland to forestland” accounted for 28.72% and 14.06% of the changed land. Meanwhile, there were 12,257 ha and 12,182 ha of forestland converted to grassland and farmland, accounting for 10.01% and 9.95% of the total changed area. The built-up land expanded mainly by encroaching on farmland and forestland. There was 12,568 ha of farmland converted into wetlands during this period. During 2000–2010, farmland was mainly converted to built-up land and forestland, which accounted for 18.70%, and 14.15% of the changed area. Forestland was mainly converted to farmland and built-up land. Grassland was mainly converted to forestland, and wetland was mainly converted to farmland, which occupied 11.67% and 8.09% of the changed area. During 2010–2020, the transition from forestland to farmland occupied 24.28% of the changed area. Meanwhile, 163,130 ha of farmland was converted to forestland, accounting for 23.82% of the changed area. This was much higher than in the previous two periods. The built-up land mainly occupied farmland (93,059 ha) and forestland (56,380 ha). It is noteworthy that the area of “forestland to grassland” was much higher than that of “grassland to forestland” (62,716 ha vs. 23,469 ha). Conversion of “wetland to farmland” only accounted for 1.95% of the changed area, which was much lower than that during the previous two periods.
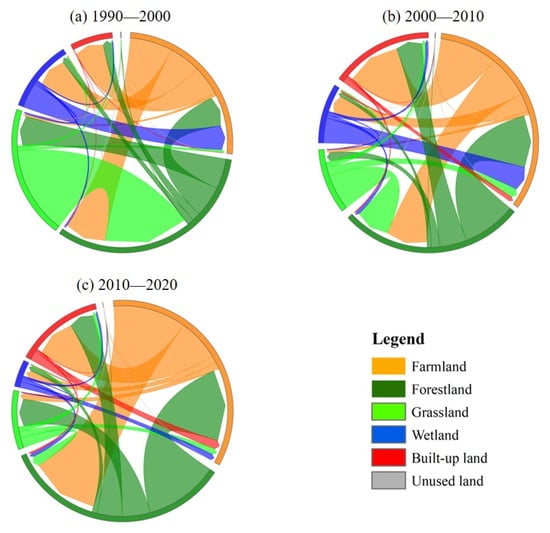
Figure 4.
Land use transitions in the PYLB.
Table 3.
Land use transitions in the PYLB.
3.3. Temporal Changes in Carbon Storage
The carbon storage in the basin was mainly in forestland and farmland, which occupied 65.74% and 23.85% in 2020, respectively (Table 4). Wetland, grassland, and built-up land occupied 5.37%, 3.90%, and 1.14%, respectively. The four carbon pools contributed differently to total carbon storage. The SOC was the largest carbon pool, which accounted for more than 72%, followed by AGC (about 19%). The proportion stored in BGC and DOC was relatively small. From 1990 to 2020, the total carbon storage decreased by 17.26 Tg (Table 5). The total carbon storage experienced an accelerating decreasing trend in the basin. Specifically, the total carbon storage decreased by 0.38 Tg, 6.72 Tg, and 10.16 Tg during 1990–2000, 2000–2010, and 2010–2020, respectively. With the exception of AGC, which increased by 0.17 Tg from 1990 to 2000, the four carbon pools all decreased during the past three decades in the study area.
Table 4.
Changes in carbon storage of each land use type in the PYLB (unit: Tg).
Table 5.
Changes in carbon storage of four carbon pools in the PYLB (unit: Tg).
3.4. Hotspots and Cold Spots of Changes in Carbon Storage
Hotspot analysis was conducted to analyze the spatial change in carbon storage (Figure 5). From 1990 to 2000, the hotspots of carbon storage change were mainly scattered across Shangrao, Jian, Pingxiang, and the southwest of Yichun. From 2000 to 2010, the area of hotspots of carbon storage change was less than in the previous period, and was mainly scattered throughout the south of Fuzhou, northeast of Nanchang, northwest of Jiujiang, and Guidong county of Hunan Province. From 2010 to 2020, the only hotspot of carbon storage change occurred in the southeast of Jiujiang. The cold spots of carbon storage change were mainly concentrated in urban regions and their surroundings during the three periods.
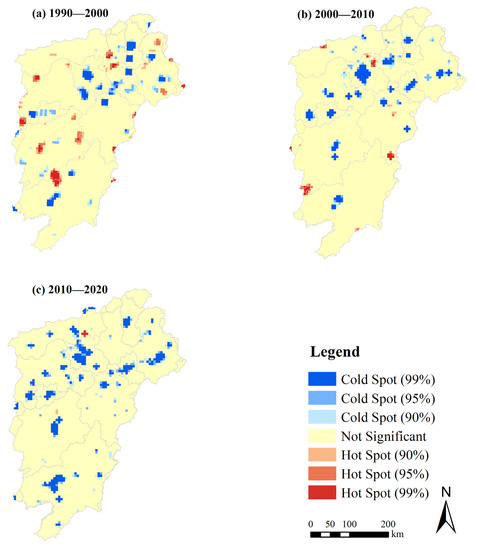
Figure 5.
Spatial distribution of hotspots and cold spots of changes in carbon storage in the PYLB.
3.5. Contributions of LUTs to Change in Carbon Storage
Contributions of various LUTs to carbon storage change were analyzed (Table 6). From 1990 to 2020, the carbon storage gain induced by LUTs was 8,891,560 Mg, in which the contributions of LUTs 12, 32, 14, and 51 were 36.87%, 22.58%, 15.89%, and 13.01%, respectively. Carbon loss resulting from LUTs was 26,154,446 Mg, in which the contributions of LUTs 15, 25, 21, and 41 were 39.94%, 28.06%, 13.25%, and 5.65%, respectively. Specifically, from 1990 to 2000, carbon gain resulting from LUTs was 1,589,292 Mg, in which the contributions of LUTs 32, 14, and 12 were 48.23%, 27.19%, and 19.50%, respectively. The carbon loss was 1,972,593 Mg, and LUTs 15, 41, 25, 23, and 21 contributed 38.18%, 17.71%, 13.83%, 13.55%, and 11.12%, respectively. From 2000 to 2010, the carbon gain was 3,567,010 Mg, in which LUTs 12, 32, 14, and 51 induced 26.76%, 26.71%, 21.63%, and 10.50%, respectively. Meanwhile, the carbon loss was 10,284,938 Mg, in which LUTs 15, 25, 21, and 41 contributed 42.81%, 25.97%, 11.64%, and 10.13%, respectively. From 2010 to 2020, the carbon gain induced by LUTs was 6,151,937 Mg, in which the contributions of LUTs 12, 51, 14, and 32 were 47.73%, 20.86%, 9.51%, and 8.32%, respectively. In contrast, the carbon loss caused by LUTs was 16,313,595 Mg, in which LUTs 15, 25, 21, and 23 contributed 35.85%, 27.94%, 18.35%, and 8.38%, respectively.
Table 6.
Contribution of LUTs to carbon storage change in the PYLB.
4. Discussion
4.1. Impact of Land Use Change on Carbon Storage
Land use change can significantly affect carbon storage [49]. In this study, the results revealed that the PYLB has experienced dramatic land use change, which resulted in a net loss of 17.26 Tg in carbon storage from 1990 to 2020. Urbanization can accelerate built-up land expansion, which eliminated a large amount of farmland, forestland, and wetland and induced significant ecosystem degradation [9,50]. Since the strategies of the Central Region Rise and the Yangtze River Economic Belt, the PYLB has experienced rapid economic development and urbanization [35,51], which has been characterized by remarkable built-up land expansion and has led to considerable carbon loss. In this study, LUTs resulted in 26.15 Tg of carbon loss from 1990 to 2020. Conversion from farmland and forestland to built-up land resulted in 10.45 Tg and 7.34 Tg of carbon loss, contributing 39.94% and 28.06% of carbon loss during the study period, respectively. This indicated that built-up land expansion was the dominant contributor to carbon loss in the PYLB. This was consistent with previous studies [13,24]. In this study, built-up land expanded by 159.89 km2, 1020.31 km2, and 1345.89 km2 during 1990–2000, 2000–2010, and 2010–2020, respectively, indicating that the PYLB experienced an accelerating urbanization process. Urbanization is expected to put more pressure on ecosystems in the future, leading to more carbon loss. Therefore, attention should be paid to the carbon loss resulting from built-up land expansion.
Previous studies indicated that farmland reclamation mainly occupied forests and wetlands, which resulted in considerable carbon loss [29,52]. Farmland expansion was also an important contributor to carbon loss in the PYLB. Conversion from forestland and wetland to farmland caused 3.46 Tg and 1.48 Tg of carbon loss, accounting for 13.25% and 5.65% of the total carbon loss from 1990 to 2020, respectively. This should be mainly ascribed to the “Requisition-compensation balance of farmland” (RCBF) policy. During past decades, China experienced rapid urbanization, which induced a large amount of farmland encroachment by built-up land and threatened food security [53,54]. Therefore, China launched the RCBF policy, to ensure food security, in 1997. This policy stated that the occupied farmland must be compensated by new farmland of the same quantity and quality [55]. However, it facilitated conversions from forestland, grassland, and wetland to farmland and induced ecosystem degradation. For example, Tang et al. [29] reported that farmland expansion resulted in 1.76 Tg of carbon loss in Hubei province from 2000 to 2010, which was mainly due to the RCBF policy. Chen et al. [35] revealed that the occupation of forestland by farmland was the dominant contributor to the decrease in ecosystem service value in the middle reaches of the Yangtze River Economic Belt from 1995 to 2015. Moreover, built-up land expansion mainly occupied plains farmland, while the newly added farmland was mainly sloping and terrace farmland. As reported by Chen et al. [56], the slope of unstable farmland increased by 0.48° in China from 1990 to 2019. The PYLB is a subtropical basin with high rainfall erosivity, and the new farmland mostly occurred on steep slopes, which not only resulted in carbon loss but also severe soil erosion, thereby threatening local ecological security.
During past decades, to mitigate ecosystem degradation, the Chinese government has implemented multiple ecological restoration programs, such as the Grain for Green program and the natural forest conservation program [30]. These programs have significantly improved ecosystem services [49,57,58]. In PYLB, the Mountain–River–Lake Program has also been implemented to systematically control soil erosion. These ecological restoration programs have promoted forestland expansion, which was the dominant contributor to carbon gain in the PYLB during the past three decades. Specifically, conversion from farmland to forestland resulted in 3.28 Tg of carbon gain, accounting for 36.87% of carbon gain from 1990 to 2020. This is likely mainly due to the Grain for Green program, which aimed to return farmland on the steep hills to forestland. Meanwhile, conversion from grassland to forestland has resulted in 2.01 Tg of carbon gain, responsible for 22.58% of carbon gain, which indicates that the ecological restoration programs have made great achievements in the PYLB. This is in agreement with previous studies [18,23,25,26]. Moreover, we found that the main measures of ecological restoration programs in the PYLB varied over different periods. From 1990 to 2000, conversion from grassland to forestland produced 48.23% of carbon gain, while conversion from farmland to forestland produced 19.50% of carbon gain, which means that grassland afforestation was the main measure. From 2000 to 2010, conversion from farmland and grassland contributed 26.76% and 26.71% of carbon gain, implying that both returning farmland to forest and grassland afforestation were important measures. From 2010 to 2020, the contribution of the transition from farmland to forestland was much higher than that from grassland to forestland (47.73% vs. 8.32%) to carbon gain, which indicates that returning farmland to forestland became the main measure. A similar phenomenon was observed in Guizhou Province, China [59].
Wetlands cover about 6% of the terrestrial surface and provide important ecosystem services to people [60]. However, more than 50% of global wetlands have been lost during the last century, and farmland encroachment is the dominant driver [52,61,62,63]. In this study, conversion from farmland to wetland produced 15.89% of carbon gain, which can be ascribed to the Grain for Blue Program, which aims to protect wetlands by returning farmland to wetlands or water areas [64]. Moreover, the contribution of conversion from wetland to farmland to carbon loss decreased from 17.71% during 1990–2000 to 2.81% during 2010–2020, indicating that wetland protection measures have made great achievements. In general, built-up land is inconvertible to other land use types. However, this study found that the conversion from built-up land to farmland contributed 13.01% of carbon gain. This could be mainly due to the RCBF policy and the urban built-up land increase vs. rural built-up land decrease policy [35,55]. Gao et al. [65] reported that 13,938 km2 of built-up land has been converted into farmland, which has led to an increase of 2.85 Tg in vegetation carbon in China from 2010 to 2015.
4.2. Policy Implication
Understanding the relationship between land use change and carbon storage can contribute to climate change mitigation and sustainable development [5]. However, most previous studies only estimate the carbon storage change resulting from land use change, while failing to reflect the internal gain and loss of carbon storage during the study period. To fill this gap, this study used the InVEST model and Geo-information Tupu method to quantitatively evaluate the contribution of various LUTs to carbon storage change, which can provide more detailed information for formulation and optimization of land use policies to achieve carbon neutrality and sustainable development in the PYLB. Moreover, it can also be applied in other regions. In this study, expansions of forestland and wetland have resulted in considerable carbon gain, which indicates that ecological restoration programs have made great achievements in the basin. However, built-up expansion has resulted in considerable carbon loss during the study period. Meanwhile, the urbanization process is accelerating in the basin, which is expected to result more carbon loss in the future. Therefore, the loss in ecosystem services, including carbon storage, caused by urban expansion should be taken into consideration in urban planning. This is vital to realize carbon neutrality and sustainable development. Since 2022, China’s population has begun to decline, which undoubtedly means lower food demand in the future. In addition, with the progress of modern agricultural technology, the yield per unit area will increase, which will further weaken the food crisis. However, the RCBF policy has promoted the conversion of ecological land to farmland in the PYLB. This partly offset the benefit of ecological restoration programs and resulted in ecosystem degradation. Therefore, we recommend that the RCBF policy be reconsidered [29,66,67].
4.3. Uncertainties and Limitations
The InVEST model estimates carbon storage based on carbon density and land use data. Firstly, the carbon density data used in this study were derived from previous re-search, not through field measurement. In future research, performing field sampling and surveying will improve the accuracy of carbon storage assessment. Secondly, the InVEST model assumes that the carbon density of each land use type remains unchanged, which brings uncertainties. However, the ecosystem usually experiences natural succession, and the carbon density tends to increase. In addition, human activities also significantly affect regional carbon density. Therefore, long-term continuous measurement of carbon density in the study area will reduce the uncertainty in the results. Thirdly, the InVEST model mainly focuses on the difference in carbon density between land use types, while ignoring the heterogeneity of the individual land use type. Taking forestland, for example, the conversion from broadleaf forest to shrub will undoubtedly change carbon density. In this study, the land use data with a spatial resolution of 30 m were obtained from the Resource and Environment Science Data Center of the Chinese Academy of Sciences (https://www.resdc.cn/, accessed on 21 May 2022), which has an accuracy higher than 92.90% [44]. However, it only contains six primary categories. Estimating carbon storage with more detailed land use data, such as data based on vegetation types, will improve the accuracy of the results, which should be a future direction.
5. Conclusions
This study quantified the contributions of various LUTs to carbon storage change in the PYLB based on the InVEST model and Geo-information Tupu method. The main conclusions are as follows: (1) The area of built-up land increased continuously, while the area of farmland continued to decrease from 1990 to 2020; (2) The PYLB has experienced a net decrease of 17.26 Tg in carbon storage during the past three decades; (3) The transition of ‘farmland to forestland’ contributed the most to carbon gain, with a proportion of 36.87%, followed by ‘grassland to forestland’ (22.58%), and ‘farmland to water’ (15.89%). In contrast, the transitions of ‘farmland to built-up land’, ‘forestland to built-up land’, and ‘forestland to grassland’ contributed the most to carbon loss, with proportions of 39.94%, 28.06%, and 13.25%, respectively. The results of this study can provide references for achieving carbon neutrality and sustainable development in the PYLB.
Author Contributions
Conceptualization, Y.W.; Methodology, Y.W.; Investigation, Y.W.; Writing—original draft, Y.W.; Writing—review & editing, Z.Z. and X.C.; Visualization, Y.W.; Supervision, Z.Z. and X.C.; Project administration, Z.Z.; Funding acquisition, Z.Z. All authors have read and agreed to the published version of the manuscript.
Funding
This paper was financially supported by the National Natural Science Foundation of China (Grant No. 41971025), Research Funding of China Three Gorges Corporation [grant number 202003251], the National Key Research and Development Project of China (Grant No. 2019YFC0409004), and the Postgraduate Research & Practice Innovation Program of Jiangsu Province (No. KYCX22_0634).
Data Availability Statement
The data that support the findings of this study are available from the corresponding author upon reasonable request.
Conflicts of Interest
The authors declare no conflict of interest.
References
- Wang, Z.; Li, X.; Mao, Y.; Li, L.; Wang, X.; Lin, Q. Dynamic simulation of land use change and assessment of carbon storage based on climate change scenarios at the city level: A case study of Bortala, China. Ecol. Indic. 2022, 134, 108499. [Google Scholar] [CrossRef]
- Cramer, W.; Guiot, J.; Fader, M.; Garrabou, J.; Gattuso, J.-P.; Iglesias, A.; Lange, M.A.; Lionello, P.; Llasat, M.C.; Paz, S.; et al. Climate change and interconnected risks to sustainable development in the Mediterranean. Nat. Clim. Chang. 2018, 8, 972–980. [Google Scholar] [CrossRef]
- Tokarska, K.B.; Gillett, N.P. Cumulative carbon emissions budgets consistent with 1.5 °C global warming. Nat. Clim. Chang. 2018, 8, 296–299. [Google Scholar] [CrossRef]
- Mendoza-Ponce, A.; Corona-Núñez, R.; Kraxner, F.; Leduc, S.; Patrizio, P. Identifying effects of land use cover changes and climate change on terrestrial ecosystems and carbon stocks in Mexico. Glob. Environ. Chang. 2018, 53, 12–23. [Google Scholar] [CrossRef]
- Aneseyee, A.B.; Soromessa, T.; Elias, E.; Noszczyk, T.; Hernik, J.; Benti, N.E. Expressing carbon storage in economic terms: The case of the upper Omo Gibe Basin in Ethiopia. Sci. Total Environ. 2022, 808, 152166. [Google Scholar] [CrossRef]
- Babbar, D.; Areendran, G.; Sahana, M.; Sarma, K.; Raj, K.; Sivadas, A. Assessment and prediction of carbon sequestration using Markov chain and InVEST model in Sariska Tiger Reserve, India. J. Clean. Prod. 2021, 278, 123333. [Google Scholar] [CrossRef]
- Dybala, K.E.; Steger, K.; Walsh, R.G.; Smart, D.R.; Gardali, T.; Seavy, N.E.; Macinnis-Ng, C. Optimizing carbon storage and biodiversity co-benefits in reforested riparian zones. J. Appl. Ecol. 2018, 56, 343–353. [Google Scholar] [CrossRef]
- Tian, L.; Tao, Y.; Fu, W.; Li, T.; Ren, F.; Li, M. Dynamic Simulation of Land Use/Cover Change and Assessment of Forest Ecosystem Carbon Storage under Climate Change Scenarios in Guangdong Province, China. Remote Sens. 2022, 14, 2330. [Google Scholar] [CrossRef]
- Xiang, S.; Wang, Y.; Deng, H.; Yang, C.; Wang, Z.; Gao, M. Response and multi-scenario prediction of carbon storage to land use/cover change in the main urban area of Chongqing, China. Ecol. Indic. 2022, 142, 109205. [Google Scholar] [CrossRef]
- Yang, H.; Huang, J.; Liu, D. Linking climate change and socioeconomic development to urban land use simulation: Analysis of their concurrent effects on carbon storage. Appl. Geogr. 2020, 115, 102135. [Google Scholar] [CrossRef]
- Rajbanshi, J.; Das, S. Changes in carbon stocks and its economic valuation under a changing land use pattern—A multitemporal study in Konar catchment, India. Land Degrad. Dev. 2021, 32, 3573–3587. [Google Scholar] [CrossRef]
- Gao, J.; Wang, L. Embedding spatiotemporal changes in carbon storage into urban agglomeration ecosystem management—A case study of the Yangtze River Delta, China. J. Clean. Prod. 2019, 237, 117764. [Google Scholar] [CrossRef]
- He, C.; Zhang, D.; Huang, Q.; Zhao, Y. Assessing the potential impacts of urban expansion on regional carbon storage by linking the LUSD-urban and InVEST models. Environ. Model. Softw. 2016, 75, 44–58. [Google Scholar] [CrossRef]
- Han, J.; Hu, Z.; Mao, Z.; Li, G.; Liu, S.; Yuan, D.; Guo, J. How to Account for Changes in Carbon Storage from Coal Mining and Reclamation in Eastern China? Taking Yanzhou Coalfield as an Example to Simulate and Estimate. Remote Sens. 2022, 14, 2014. [Google Scholar] [CrossRef]
- Hutyra, L.R.; Yoon, B.; Hepinstall-Cymerman, J.; Alberti, M. Carbon consequences of land cover change and expansion of urban lands: A case study in the Seattle metropolitan region. Landsc. Urban Plan. 2011, 103, 83–93. [Google Scholar] [CrossRef]
- Raciti, S.M.; Hutyra, L.R.; Newell, J.D. Mapping carbon storage in urban trees with multi-source remote sensing data: Relationships between biomass, land use, and demographics in Boston neighborhoods. Sci. Total Environ. 2014, 500-501, 72–83. [Google Scholar] [CrossRef]
- Nelson, E.; Mendoza, G.; Regetz, J.; Polasky, S.; Tallis, H.; Cameron, D.; Chan, K.M.A.; Daily, G.C.; Goldstein, J.; Kareiva, P.M.; et al. Modeling multiple ecosystem services, biodiversity conservation, commodity production, and tradeoffs at landscape scales. Front. Ecol. Environ. 2009, 7, 4–11. [Google Scholar] [CrossRef]
- Zhou, J.; Zhao, Y.; Huang, P.; Zhao, X.; Feng, W.; Li, Q.; Xue, D.; Dou, J.; Shi, W.; Wei, W.; et al. Impacts of ecological restoration projects on the ecosystem carbon storage of inland river basin in arid area, China. Ecol. Indic. 2020, 118, 106803. [Google Scholar] [CrossRef]
- Zhao, M.; Yue, T.; Zhao, N.; Sun, X.; Zhang, X. Combining LPJ-GUESS and HASM to simulate the spatial distribution of forest vegetation carbon stock in China. J. Geogr. Sci. 2014, 24, 249–268. [Google Scholar] [CrossRef]
- Parton, W.J.; Scurlock, J.M.O.; Ojima, D.S.; Gilmanov, T.G.; Scholes, R.J.; Schimel, D.S.; Kirchner, T.; Menaut, J.C.; Seastedt, T.; Moya, E.G.; et al. Observations and Modeling of Biomass and Soil Organic-Matter Dynamics for the Grassland Biome Worldwide. Glob. Biogeochem. Cycles 1993, 7, 785–809. [Google Scholar] [CrossRef]
- Melillo, J.M.; Borchers, J.; Chaney, J.; Fisher, H.; Fox, S.; Haxeltine, A.; Janetos, A.; Kicklighter, D.W.; Kittel, T.G.F.; Mcguire, A.D.; et al. Vegetation Ecosystem Modeling and Analysis Project-Comparing Biogeography and Biogeochemistry Models in a Continental-Scale Study of Terrestrial Ecosystem Responses to Climate-Change and CO2 Doubling. Glob. Biogeochem. Cycles 1995, 9, 407–437. [Google Scholar] [CrossRef]
- Brilli, L.; Bechini, L.; Bindi, M.; Carozzi, M.; Cavalli, D.; Conant, R.; Dorich, C.D.; Doro, L.; Ehrhardt, F.; Farina, R.; et al. Review and analysis of strengths and weaknesses of agro-ecosystem models for simulating C and N fluxes. Sci. Total Environ. 2017, 598, 445–470. [Google Scholar] [CrossRef] [PubMed]
- Liang, Y.; Hashimoto, S.; Liu, L. Integrated assessment of land-use/land-cover dynamics on carbon storage services in the Loess Plateau of China from 1995 to 2050. Ecol. Indic. 2021, 120, 106939. [Google Scholar] [CrossRef]
- Jiang, W.; Deng, Y.; Tang, Z.; Lei, X.; Chen, Z. Modelling the potential impacts of urban ecosystem changes on carbon storage under different scenarios by linking the CLUE-S and the InVEST models. Ecol. Model. 2017, 345, 30–40. [Google Scholar] [CrossRef]
- Zhao, M.; He, Z.; Du, J.; Chen, L.; Lin, P.; Fang, S. Assessing the effects of ecological engineering on carbon storage by linking the CA-Markov and InVEST models. Ecol. Indic. 2019, 98, 29–38. [Google Scholar] [CrossRef]
- Hu, X.Q.; Li, Z.W.; Chen, J.; Nie, X.D.; Liu, J.Y.; Wang, L.X.; Ning, K. Carbon sequestration benefits of the grain for Green Program in the hilly red soil region of southern China. Int. Soil Water Conserv. Res. 2021, 9, 271–278. [Google Scholar] [CrossRef]
- Wei, P.; Chen, S.; Wu, M.; Jia, Y.; Xu, H.; Liu, D. Increased Ecosystem Carbon Storage between 2001 and 2019 in the Northeastern Margin of the Qinghai-Tibet Plateau. Remote Sens. 2021, 13, 3986. [Google Scholar] [CrossRef]
- Li, J.; Gong, J.; Guldmann, J.-M.; Li, S.; Zhu, J. Carbon Dynamics in the Northeastern Qinghai–Tibetan Plateau from 1990 to 2030 Using Landsat Land Use/Cover Change Data. Remote Sens. 2020, 12, 528. [Google Scholar] [CrossRef]
- Tang, L.; Ke, X.; Zhou, T.; Zheng, W.; Wang, L. Impacts of cropland expansion on carbon storage: A case study in Hubei, China. J. Environ. Manag. 2020, 265, 110515. [Google Scholar] [CrossRef]
- Ouyang, Z.; Zheng, H.; Xiao, Y.; Polasky, S.; Liu, J.; Xu, W.; Wang, Q.; Zhang, L.; Xiao, Y.; Rao, E.; et al. Improvements in ecosystem services from investments in natural capital. Science 2016, 352, 1455–1459. [Google Scholar] [CrossRef]
- Zhu, G.; Qiu, D.; Zhang, Z.; Sang, L.; Liu, Y.; Wang, L.; Zhao, K.; Ma, H.; Xu, Y.; Wan, Q. Land-use changes lead to a decrease in carbon storage in arid region, China. Ecol. Indic. 2021, 127, 107770. [Google Scholar] [CrossRef]
- Chu, X.; Zhan, J.; Li, Z.; Zhang, F.; Qi, W. Assessment on forest carbon sequestration in the Three-North Shelterbelt Program region, China. J. Clean. Prod. 2019, 215, 382–389. [Google Scholar] [CrossRef]
- Ye, Q.; Tian, G.; Liu, G.; Ye, J.; Yao, X.; Liu, Q.; Lou, W.; Wu, S. Tupu methods of spatial-temporal pattern on land use change: A case study in the Yellow River Delta. J. Geogr. Sci. 2004, 14, 131–142. [Google Scholar] [CrossRef]
- Lu, X.; Shi, Y.; Chen, C.; Yu, M. Monitoring cropland transition and its impact on ecosystem services value in developed regions of China: A case study of Jiangsu Province. Land Use Policy 2017, 69, 25–40. [Google Scholar] [CrossRef]
- Chen, W.; Zhao, H.; Li, J.; Zhu, L.; Wang, Z.; Zeng, J. Land use transitions and the associated impacts on ecosystem services in the Middle Reaches of the Yangtze River Economic Belt in China based on the geo-informatic Tupu method. Sci. Total Environ. 2020, 701, 134690. [Google Scholar] [CrossRef] [PubMed]
- Liang, X.; Jin, X.; Ren, J.; Gu, Z.; Zhou, Y. A research framework of land use transition in Suzhou City coupled with land use structure and landscape multifunctionality. Sci. Total Environ. 2020, 737, 139932. [Google Scholar] [CrossRef]
- Song, Y.; Wang, M.; Sun, X.; Fan, Z. Quantitative assessment of the habitat quality dynamics in Yellow River Basin, China. Environ. Monit. Assess. 2021, 193, 614. [Google Scholar] [CrossRef]
- Wang, Q.; Yang, K.; Li, L.; Zhu, Y. Assessing the Terrain Gradient Effect of Landscape Ecological Risk in the Dianchi Lake Basin of China Using Geo-Information Tupu Method. Int. J. Environ. Res. Public Health 2022, 19, 9634. [Google Scholar] [CrossRef]
- Wang, Y.; Zhang, Z.; Chen, X. Quantifying Influences of Natural and Anthropogenic Factors on Vegetation Changes Based on Geodetector: A Case Study in the Poyang Lake Basin, China. Remote Sens. 2021, 13, 5081. [Google Scholar] [CrossRef]
- Liu, F.-h.; Xu, C.-Y.; Yang, X.-x.; Ye, X.-c. Controls of Climate and Land-Use Change on Terrestrial Net Primary Productivity Variation in a Subtropical Humid Basin. Remote Sens. 2020, 12, 3525. [Google Scholar] [CrossRef]
- Wang, R.; Peng, W.; Liu, X.; Jiang, C.; Wu, W.; Chen, X. Characteristics of Runoff Variations and Attribution Analysis in the Poyang Lake Basin over the Past 55 Years. Sustainability 2020, 12, 944. [Google Scholar] [CrossRef]
- Getis, A.; Ord, J.K. The Analysis of Spatial Association by Use of Distance Statistics. Geogr. Anal. 1992, 24, 189–206. [Google Scholar] [CrossRef]
- Liu, J.; Kuang, W.; Zhang, Z.; Xu, X.; Qin, Y.; Ning, J.; Zhou, W.; Zhang, S.; Li, R.; Yan, C.; et al. Spatiotemporal characteristics, patterns, and causes of land-use changes in China since the late 1980s. J. Geogr. Sci. 2014, 24, 195–210. [Google Scholar] [CrossRef]
- Chuai, X.; Huang, X.; Lai, L.; Wang, W.; Peng, J.; Zhao, R. Land use structure optimization based on carbon storage in several regional terrestrial ecosystems across China. Environ. Sci. Policy 2013, 25, 50–61. [Google Scholar] [CrossRef]
- Lai, L. Carbon Emission Effect of Land Use in China. Ph.D. Thesis, Nanjing University, Nanjing, China, 2010. [Google Scholar]
- Liu, G.; Chen, L. Study on carbon storage in Honghu lake wetland. J. Cent. South Univ. For. Technol. 2013, 33, 103–107. [Google Scholar]
- Xi, X.; Li, M.; Zhang, X.; Zhang, Y.; Zhang, D.; Zhang, J.; Dou, L.; Yang, Y. Research on soil organic carbon distribution and change trend in middle-east plain and its vicinity in China. Earth Sci. Front. 2013, 20, 154–165. [Google Scholar]
- Ke, X.; Tang, L. Impact of cascading processes of urban expansion and cropland reclamation on the ecosystem of a carbon storage service in Hubei Province, China. Acta Ecol. Sin. 2019, 39, 672–683. [Google Scholar]
- Lu, F.; Hu, H.; Sun, W.; Zhu, J.; Liu, G.; Zhou, W.; Zhang, Q.; Shi, P.; Liu, X.; Wu, X.; et al. Effects of national ecological restoration projects on carbon sequestration in China from 2001 to 2010. Proc. Natl. Acad. Sci. USA 2018, 115, 4039–4044. [Google Scholar] [CrossRef] [PubMed]
- Tang, L.; Ke, X.; Zhou, Q.; Wang, L.; Koomen, E. Projecting future impacts of cropland reclamation policies on carbon storage. Ecol. Indic. 2020, 119, 106835. [Google Scholar] [CrossRef]
- Xie, H.; He, Y.; Choi, Y.; Chen, Q.; Cheng, H. Warning of negative effects of land-use changes on ecological security based on GIS. Sci. Total Environ. 2020, 704, 135427. [Google Scholar] [CrossRef]
- Mao, D.; Luo, L.; Wang, Z.; Wilson, M.C.; Zeng, Y.; Wu, B.; Wu, J. Conversions between natural wetlands and farmland in China: A multiscale geospatial analysis. Sci. Total Environ. 2018, 634, 550–560. [Google Scholar] [CrossRef] [PubMed]
- Jiang, L.; Deng, X.; Seto, K.C. Multi-level modeling of urban expansion and cultivated land conversion for urban hotspot counties in China. Landsc. Urban Plan. 2012, 108, 131–139. [Google Scholar] [CrossRef]
- Chen, W.; Ye, X.; Li, J.; Fan, X.; Liu, Q.; Dong, W. Analyzing requisition–compensation balance of farmland policy in China through telecoupling: A case study in the middle reaches of Yangtze River Urban Agglomerations. Land Use Policy 2019, 83, 134–146. [Google Scholar] [CrossRef]
- Shen, X.; Wang, L.; Wu, C.; Lv, T.; Lu, Z.; Luo, W.; Li, G. Local interests or centralized targets? How China’s local government implements the farmland policy of Requisition–Compensation Balance. Land Use Policy 2017, 67, 716–724. [Google Scholar] [CrossRef]
- Chen, H.; Tan, Y.; Xiao, W.; Li, G.; Meng, F.; He, T.; Li, X. Urbanization in China drives farmland uphill under the constraint of the requisition-compensation balance. Sci. Total Environ. 2022, 831, 154895. [Google Scholar] [CrossRef]
- Tong, X.; Brandt, M.; Yue, Y.; Horion, S.; Wang, K.; Keersmaecker, W.D.; Tian, F.; Schurgers, G.; Xiao, X.; Luo, Y.; et al. Increased vegetation growth and carbon stock in China karst via ecological engineering. Nat. Sustain. 2018, 1, 44–50. [Google Scholar] [CrossRef]
- Chen, C.; Park, T.; Wang, X.; Piao, S.; Xu, B.; Chaturvedi, R.K.; Fuchs, R.; Brovkin, V.; Ciais, P.; Fensholt, R.; et al. China and India lead in greening of the world through land-use management. Nat. Sustain. 2019, 2, 122–129. [Google Scholar] [CrossRef]
- Wang, Y.; Zhang, Z.; Chen, X. Spatiotemporal change in ecosystem service value in response to land use change in Guizhou Province, southwest China. Ecol. Indic. 2022, 144, 109514. [Google Scholar] [CrossRef]
- Zedler, J.B.; Kercher, S. Wetland Resources: Status, Trends, Ecosystem Services, and Restorability. Annu. Rev. Environ. Resour. 2005, 30, 39–74. [Google Scholar] [CrossRef]
- Davidson, N.C. How much wetland has the world lost? Long-term and recent trends in global wetland area. Mar. Freshw. Res. 2014, 65, 934–941. [Google Scholar] [CrossRef]
- Beuel, S.; Alvarez, M.; Amler, E.; Behn, K.; Kotze, D.; Kreye, C.; Leemhuis, C.; Wagner, K.; Willy, D.K.; Ziegler, S.; et al. A rapid assessment of anthropogenic disturbances in East African wetlands. Ecol. Indic. 2016, 67, 684–692. [Google Scholar] [CrossRef]
- Fluet-Chouinard, E.; Stocker, B.D.; Zhang, Z.; Malhotra, A.; Melton, J.R.; Poulter, B.; Kaplan, J.O.; Goldewijk, K.K.; Siebert, S.; Minayeva, T.; et al. Extensive global wetland loss over the past three centuries. Nature 2023, 614, 281–286. [Google Scholar] [CrossRef] [PubMed]
- Song, W.; Deng, X.; Liu, B.; Li, Z.; Jin, G. Impacts of Grain-for-Green and Grain-for-Blue Policies on Valued Ecosystem Services in Shandong Province, China. Adv. Meteorol. 2015, 2015, 213534. [Google Scholar] [CrossRef]
- Gao, R.; Chuai, X.; Ge, J.; Wen, J.; Zhao, R.; Zuo, T. An integrated tele-coupling analysis for requisition–compensation balance and its influence on carbon storage in China. Land Use Policy 2022, 116, 106057. [Google Scholar] [CrossRef]
- Liu, X.; Zhao, C.; Song, W. Review of the evolution of cultivated land protection policies in the period following China’s reform and liberalization. Land Use Policy 2017, 67, 660–669. [Google Scholar] [CrossRef]
- Wu, Y.; Shan, L.; Guo, Z.; Peng, Y. Cultivated land protection policies in China facing 2030: Dynamic balance system versus basic farmland zoning. Habitat Int. 2017, 69, 126–138. [Google Scholar] [CrossRef]
Disclaimer/Publisher’s Note: The statements, opinions and data contained in all publications are solely those of the individual author(s) and contributor(s) and not of MDPI and/or the editor(s). MDPI and/or the editor(s) disclaim responsibility for any injury to people or property resulting from any ideas, methods, instructions or products referred to in the content. |
© 2023 by the authors. Licensee MDPI, Basel, Switzerland. This article is an open access article distributed under the terms and conditions of the Creative Commons Attribution (CC BY) license (https://creativecommons.org/licenses/by/4.0/).