Article

The Impact of Radar Radial Velocity Data Assimilation Using WRF-3DVAR System with Different Background Error Length Scales on the Forecast of Super Typhoon Lekima (2019)

Key Laboratory of Meteorological Disaster, Ministry of Education (KLME)/Joint International Research Laboratory of Climate and Environment Change (ILCEC)/Collaborative Innovation Center on Forecast and Evaluation of Meteorological Disasters (CIC-FEMD), Nanjing University of Information Science & Technology, Nanjing 210044, China
*
Author to whom correspondence should be addressed.
Remote Sens. 2023, 15(10), 2592; https://doi.org/10.3390/rs15102592
Submission received: 7 April 2023 / Revised: 3 May 2023 / Accepted: 10 May 2023 / Published: 16 May 2023

Abstract

:
This study explores the impact of assimilating radar radial velocity (RV) on the forecast of Super Typhoon Lekima (2019) using the Weather Research and Forecasting (WRF) model and three-dimensional variational (3DVAR) assimilation system with different background error length scales. The results of two single observation tests show that the smaller background error length scale is able to constrain the spread of radar observation information within a relatively reasonable range compared with the larger length scale. During the five data assimilation cycles, the position and structure of the near-land typhoon are found to be significantly affected by the setting of the background error length scale. With a reduced length scale, the WRF-3DVAR system could effectively assimilate the radar RV to produce more accurate analyses, resulting in an enhanced typhoon vortex with a dynamic and thermal balance. In the forecast fields, the experiment with a smaller length scale not only reduces the averaged track error for the 24-h forecasts to less than 20 km, but it also more accurately captures the evolutions of the typhoon vortex and rainband during typhoon landing. In addition, the spatial distribution and intensity of heavy precipitation are corrected. For the 24-h quantitative precipitation forecasts, the equitable threat scores of the experiment with a reduced length scale are greater than 0.4 for the threshold from 1 to 100 mm and not less than 0.2 until the threshold increases to 240 mm. The enhanced prediction performances are probably due to the improved TC analysis.

1. Introduction

Tropical cyclones (TCs) are the archetypal natural hazards. The landfall of TCs can bring high winds and extreme rainfall hazards to the coast, as well as secondary disasters such as floods and landslides, which severely disrupt the normal operation of human society. In the context of climate change, TCs are likely to land more intensively and even gradually threaten inland areas [1,2]. Fortunately, the development of Numerical Weather Prediction (NWP) systems and advancements in observational and operational forecasting techniques have significantly reduced the tracking error of TCs in recent decades, although there has only been only a slight improvement in intensity forecasts over the last decade [3,4,5]. The accuracy of landing predictions for TC is influenced by multiple factors, predominantly the Rapid Intensity (RI) and Rapid Decay (RD) of the TC, its structural evolution, and the TC’s interaction with the terrain when approaching land [6]. The solutions to these issues demand a comprehensive understanding of the structure of TC and the refinement of the TC vortex in NWP models [7,8]. As observation data types become increasingly diverse and the temporary and spatial resolution of data improves, exploring Data Assimilation (DA) techniques is vital to assimilate observation information as much as possible for accurate initialization of TC vortex structure in models.
In recent years, a significant body of research has verified the effectiveness of the assimilation of satellite and radar observations for TC forecasting. The main assimilation techniques used are variational DA, Ensemble Kalman Filter (EnKF) along with its derivatives, and hybrid methods that combine the traditional static background error covariance with the ensemble-derived background error covariance. Xu et al. [9] assimilated the Fengyun-3D satellite’s MWHS-2 clear-sky radiance data with the Three-Dimensional Variational (3DVAR) framework in the Weather Research and Forecasting Model’s DA system (WRFDA), leading to significant improvements in the track and intensity forecast for super typhoon Lekima (2019). Zhang et al. [10] explored the use of the EnKF method to assimilate all-sky microwave radiance data and accurately predicted the RI process and landing rainfall of Hurricane Harvey (2017). While incorporating all-sky radiance data into assimilation can improve the utility of radiance data that are contaminated by clouds, this approach still faces some challenges, particularly when dealing with infrared radiances. This is mainly manifested in several aspects: firstly, the NWP model exhibits more complex background errors in cloudy conditions, and its representation of clouds may be inconsistent with radiance observations. Additionally, the radiative transfer model is subject to uncertainties and biases, as well as interference from ice-phase clouds [11].
The Doppler weather radar observations have an extremely high spatial and temporal resolution, which are able to provide rich meso-scale and small-scale information that better reflects the internal structure of a TC when TC enters the radar coverage than satellite observations. Previous studies have demonstrated that the EnKF method is able to accurately analyze the vortex structures of TCs with the assimilation of radar data leading to improved deterministic predictions of TCs [12,13,14,15,16,17]. Shen et al. [18] investigated the prediction of Radial Velocity (RV) assimilation in Hurricane Ike (2008) using the WRF hybrid ETKF-3DVAR system. Their results showed that the hybrid method improves the structure and intensity of the hurricane vortex more quickly and effectively than 3DVAR, ultimately yielding more accurate predictions. This improvement is mainly attributed to the hybrid method’s integration of the ensemble-based flow dependency background error and the static background error covariance matrix of the 3DVAR method. Nevertheless, the 3DVAR is simply more practical and is computationally less demanding than ensemble-based methods. It has continued to be widely used for radar DA and landfall typhoon forecasting in recent years, although it largely relies on the static background error covariance. The impact of radar RV assimilation was studied on TC forecast with two types of momentum control variables in Shen et al. [19], which found that using the meridional and zonal components of the horizontal wind as the control variable brings more physically significant wind increments, further improving the TC structure. It becomes more complicated if Radar Reflectivity (RF) is also applied in data assimilation. For example, Xu et al. [20] directly assimilated the radar RV and reflectivity by the WRF-3DVAR system, significantly improving the forecast of Typhoon Chanthu (2010) by adding mixing ratios of hydrometers to the control variables and estimating the hydrometer-related background errors individually. In the Advanced Regional Prediction System (ARPS) [21,22,23], data from multiple radars are assimilated to evaluate the extreme rainfall forecast of Typhoon Morakot (2009). Their findings indicate that combining RV and RF brings the forecast track closer to observation, and assimilating RF notably enhances the precipitation forecast with the help of the complex cloud analysis system, which could combine multiple observations to adjust the hydrometeors and thermal conditions in cloud regions through thermodynamic equations or semiempirical rules [24,25].
From the above encouraging results on satellite and radar observations assimilation for TC forecasting, it is found the data assimilation techniques are still challenging in terms of better analyzing the TC structures with suitable descriptions of background error under different control variable frameworks. In addition, for TC systems with notable rotational dynamical characteristics, radar velocity data are considered one of the most efficient observations for TC analyses and forecasts. However, for regional model data assimilations with radar velocity using 3DVAR, the background error covariance matrix usually includes some balance constraints that mainly represent the synoptic-scale atmosphere [26]. For example, the commonly used National Meteorological Center (NMC) method likely potentially results in an underestimation of the meso-scale and small-scale background error information when estimating the background error covariance [27]. Some previous research has pointed out the importance of tuning the background error parameters for the assimilation of radar velocity data [28,29,30,31], including the length scale factor, the variance scale factor, different sources of flow-dependent background error, and horizontal and vertical localization in the hybrid method. For 3DVAR, although some previous studies have found the horizontal length scale factor is important, especially for observations with small scales, there is a lack of in-depth investigations on the specific atypical TC. As is well known, atypical TCs are characterized by complex microphysical differences in the concentric eyewalls especially with double-eyewalls, leading to large uncertainties in terms of simulating the structural evolution and precipitation forecast. In this study, Lekima (2019) is selected as the atypical TC case that maintained a double-eyewall structure for a long time, with strong convection frequently occurring in the western semicircle of the outer eyewall and finally made landfall as a super typhoon [15,32,33,34]. Analyzing such a case with super intensity and complex structure from multiple perspectives can illustrate the forecast potential of radar assimilation for analogous landfalling TCs as well as the mechanism and extent to which background error parameters tuning affect forecasted TC and rainfall. As a pilot, this study will explore the impact of radar RV assimilation using different background error length scale factor configurations on the Super Typhoon Lekima (2019) forecast.
The remainder of this study is organized as follows. Section 2 describes the cost function of 3DVAR, the RV observation operator, and the RV data quality control method. The Super Typhoon Lekima and the details of the model and experiment are introduced in Section 3. Section 4 presents the results of the single observation tests and analyses, as well as the forecasts and verifications. Finally, the discussion and conclusions are given in Section 5 and Section 6, respectively.

2. Materials and Methods

2.1. 3DVAR and Observation Operator

The general concept of the 3DVAR assimilation is to obtain an optimal estimation of the true atmospheric state, also known as the analysis, by minimizing a cost function that combines both background and observations. In the WRF-3DVAR system, the cost function is
J ( x ) = 1 2 x x b T B 1 x x b + 1 2 y o H x T R 1 y o H x .
The left J ( x ) in the above equation is the cost function and x means analysis vector. On the right-hand side of the equation, x b is the background vector and y o is the observation vector. Their distances to x are measured by the background error covariance matrix B and the observation error variance matrix R , respectively. H is the nonlinear observation operator. For radar data, Sun and Crook developed an operator to interpolate and transform model variables into radial velocity [35], as follows:
V r = u x x i r i + v y y i r i + ( w V T ) z z i r i ,
where ( u , v , w ) are the model wind components in Cartesian coordinates. ( x i , y i , z i ) are the radar observation location and ( x , y , z ) denotes the location of the radar. Here, r i is the distance between observation and radar. V T is the terminal velocity of raindrops, which is related to pressure, atmospheric density, and rainwater mixing ratio.

2.2. Radar Data Processing

In this study, the radar data used are from the S-band coastal Doppler weather radar located at Wenzhou (WZRD, 27.9°N, 120.74°E), Zhejiang Province. WZRD provides radar radial velocity (RV) at 9 elevations by 250 m range gate resolution to a range of 230 km, every 6 min. Doppler velocity de-aliasing is performed through the region-based algorithm in the Py-ART software library developed by Atmospheric Radiation Measurement Climate Research Facility [36]. Corrected RV data are interpolated into the Cartesian coordinate system with the same horizontal resolution as the forecast model grids, following Xiao et al. [37] and Xu et al. [38]. Figure 1 shows the comparison of the radar RV at the 0.5° elevation angle before and after de-aliasing. When the center of typhoon Lekima is about 170 km away from the WZRD at 1000 UTC on 9 August 2019, the distribution feature of raw RV observations is discontinuous and chaotic (Figure 1a), while the RV field corrected shows a more realistic and stronger cyclone structure (Figure 1b).

2.3. B matrix Estimation

In the WRF-3DVAR system, the cost function J ( x ) is linearized to simplify minimization and reduce computational costs. It is common to define innovation vector and analysis increment as d = y o H x b and δ x = x x b , respectively. In addition, it is assumed that the analysis is sufficiently close to the true state of the atmosphere and H be linearized within the region of x b . The y o H x in Equation (1) could be rewritten as:
y o H ( x ) = y o H ( x b + x x b ) y o H ( x b ) H ( x x b ) = d H δ x ,
where H is the linearization form of the nonlinear observation operator. Furthermore, based on the assumption that the background state x b is a good estimate of the true state, the cost function in the incremental formulation [39] could be represented as:
J ( δ x ) = 1 2 δ x T B 1 δ x + 1 2 d H δ x T R 1 d H δ x .
Generally, the matrix B has a large dimension ( 10 7 × 10 7 ) , and its inverse is difficult to calculate directly in practice. In order to make the solution feasible and reduce the cost, the huge matrix B is decomposed as B = U U T . Correspondingly, the analysis increment δ x is transformed into δ x = U v . Here, v is the control variable vector, and U is the transformation operator of v . Thus, Equation (4) is further rewritten as:
J ( v ) = 1 2 v T v + 1 2 d H U v T R 1 d H U v ,
where the cost function J ( v ) is minimized with respect to the control variables. After splitting U into U = U p U v U h in terms of a series of transformation operators [40], B could be further decomposed as B = U p U v U h U h T U v T U p T . The analysis increment also can be expressed as δ x = U p U v U h v . The physical transform U p converts control variables increments to model variables increments via linear regression. U v is the vertical transform, which is applied by first estimating the vertical part of B and then performing the Empirical Orthogonal Function (EOF) decomposition on it. U h denotes horizontal transform. It is typically executed using recursive filtering [41]. The length scale of recursive filtering determines the horizontal correlation range of background error. For each control variable, the corresponding length scale at each vertical level of the model can be estimated using the NMC method. Therefore, the characteristics of B can be represented by the regression coefficient for U p , the eigenvalues and eigenvectors for U v , and the length scale for U h . The effect of tuning the background error covariance length scale in radar velocity data assimilation for TC Lekima is discussed in this study. The length scale factor α ranges from 0 to 1, which is set to reduce the length scale by ( 1 α ) × 100 % .

3. Model Setup and Experimental Design

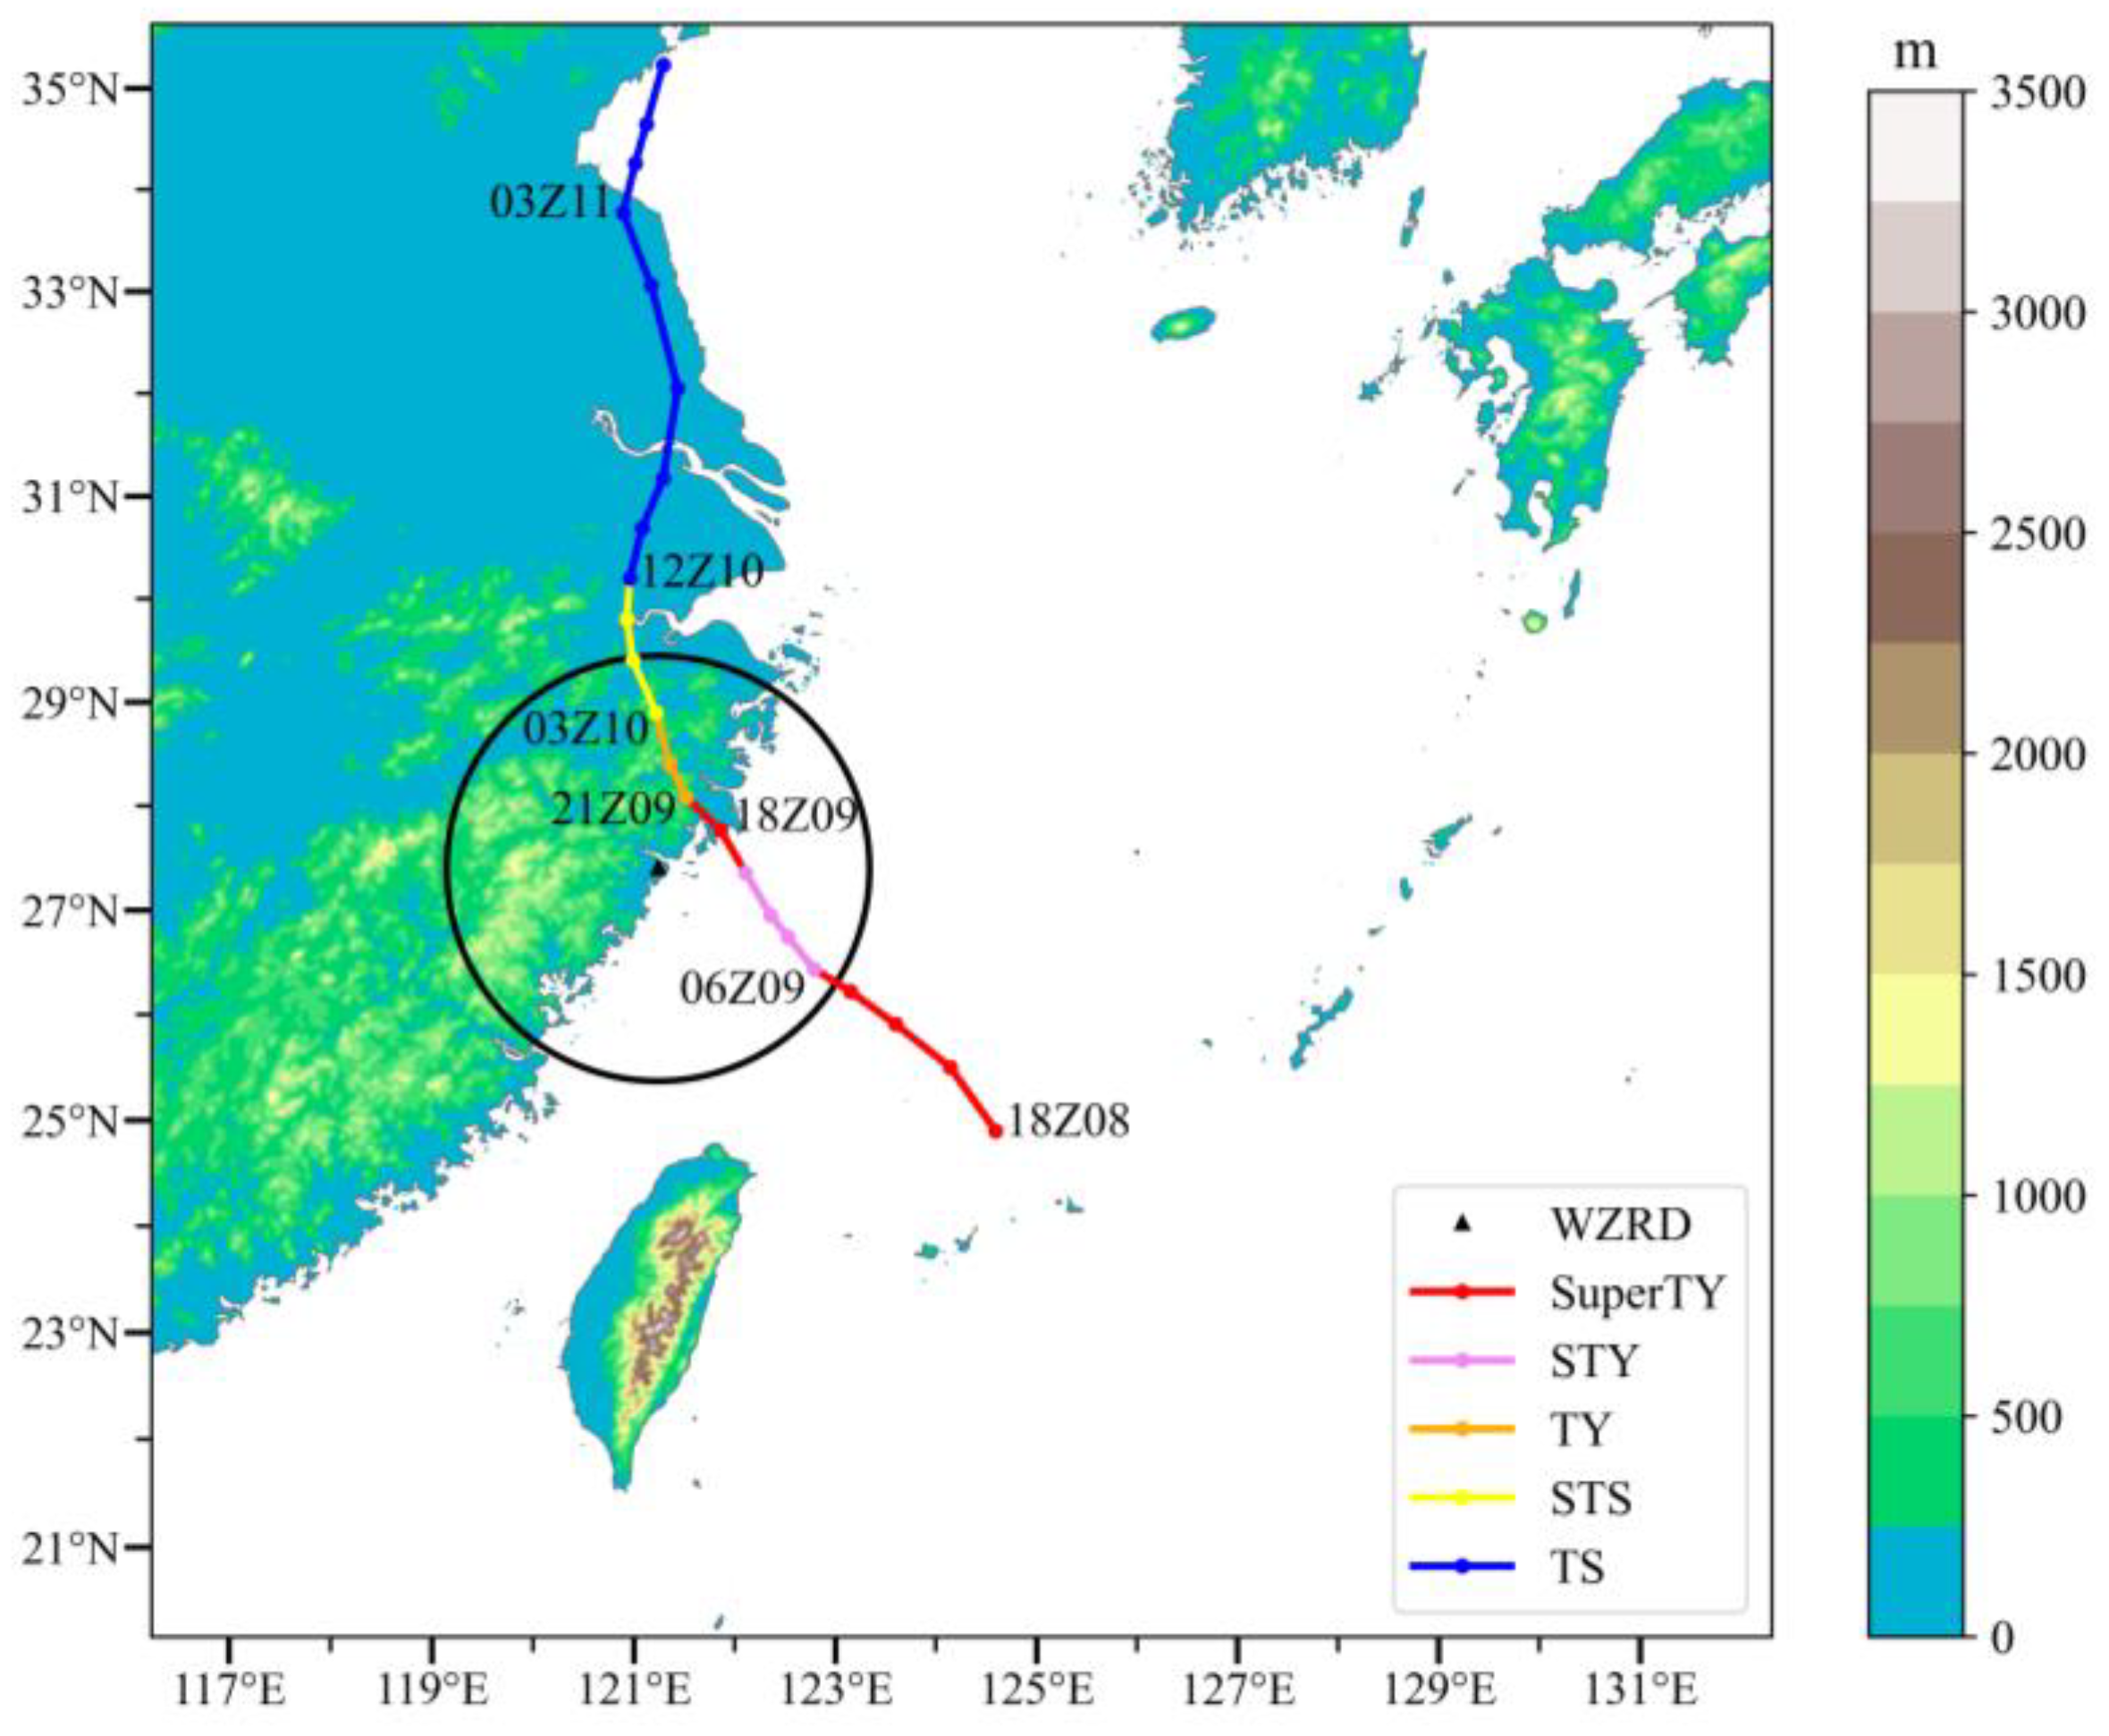
3.1. Overview of Typhoon Lekima

Typhoon Lekima originated from a tropical depression located east of Luzon, Philippines. It then developed and moved northward. At 0600 UTC on 4 August 2019, the Japan Meteorological Agency (JMA) upgraded it to a tropical cyclone and named it Lekima. Lekima kept moving northwest and at 1500 UTC on 7 August, it was upgraded to a super typhoon by the China Meteorological Administration (CMA). According to the observations of CMA, Lekima weakened to a strong typhoon with a Minimum Sea Level Pressure (MSLP) of 940 hPa at around 0600 UTC on 9 August. However, as Lekima approached the eastern coast of China, it rapidly intensified into a super typhoon again and made landfall at Wenling, Zhejiang Province at 1745 UTC on 9 August (approaching 1800 UTC, Figure 2), with a MSLP of 930 hPa and a Maximum Surface Wind (MSW) of 52 m/s. Lekima weakened as it moved inland, and was degraded to a tropical storm by the CMA and Joint Typhoon Warning Center (JTWC) at 1200 UTC 10 August. After staying in Zhejiang Province for about 20 h, it passed through Jiangsu Province and entered the Yellow Sea, and made landfall again in Shandong Province before finally dissipating after it moved out to sea. Lekima remained on land for 44 h, bringing extreme storm damage to the eastern coast of China, particularly near the landfall point in Zhejiang Province and in northern Shandong Province [42], where the daily rainfall of dozens of observation stations exceeded the historical extreme. In view of the fact that Lekima spent almost a half post-landfall presence in Zhejiang Province, as well as the timeliness and range of RV data, this study focuses on the landfall process of the typhoon during its intense phase. Furthermore, the CMA tropical cyclone best track set [43,44] (available from tcdata.typhoon.org.cn) is used for verification because the CMA data set offers more accurate information about when the Lekima made landfall [45].

3.2. WRF Model Setup

In this study, the non-hydrostatic WRF model version 4.1 was used as the forecasting model over a single non-nested domain with 601 × 601 horizontal model grids of 3 km grid spacing (Figure 2). The model domain had 51 vertical layers with a top at 10 hPa. The physical parameterization schemes used for this study included the WRF single-moment 6-class (WSM6) scheme [46], the Mellor-Yamada-Janjic (MYJ) boundary layer scheme [47], the unified Noah land-surface model [48], the Rapid Radiative Transfer Model (RRTM) longwave radiation scheme [49] and the Dudhia shortwave radiation scheme [50]. The European Centre for Medium-Range Weather Forecasting 5th generation reanalysis (ERA5) 6-hourly data with 0.25° spatial resolution were used for initial and boundary conditions. The background error covariance matrix B was estimated based on the above model configuration using the NMC method. Specifically, the procedures involve first running 12-h and 24-h forecasts at 0000 UTC and 1200 UTC every day in August and then averaging the series of differences between two forecasts valid at the same time. The control variables used were ψ , χ u , T u , R H s , and P s , u . The reason that stream function ( ψ ) and unbalanced velocity potential ( χ u ) are widely used as the control variable in data assimilation is that the relation between the stream function and the mass is linear with the geostrophic assumption. This relation makes the statistical regression between the stream function and the mass is possible. This balance between wind fields and mass will spread the information from one variable to others in data assimilation.

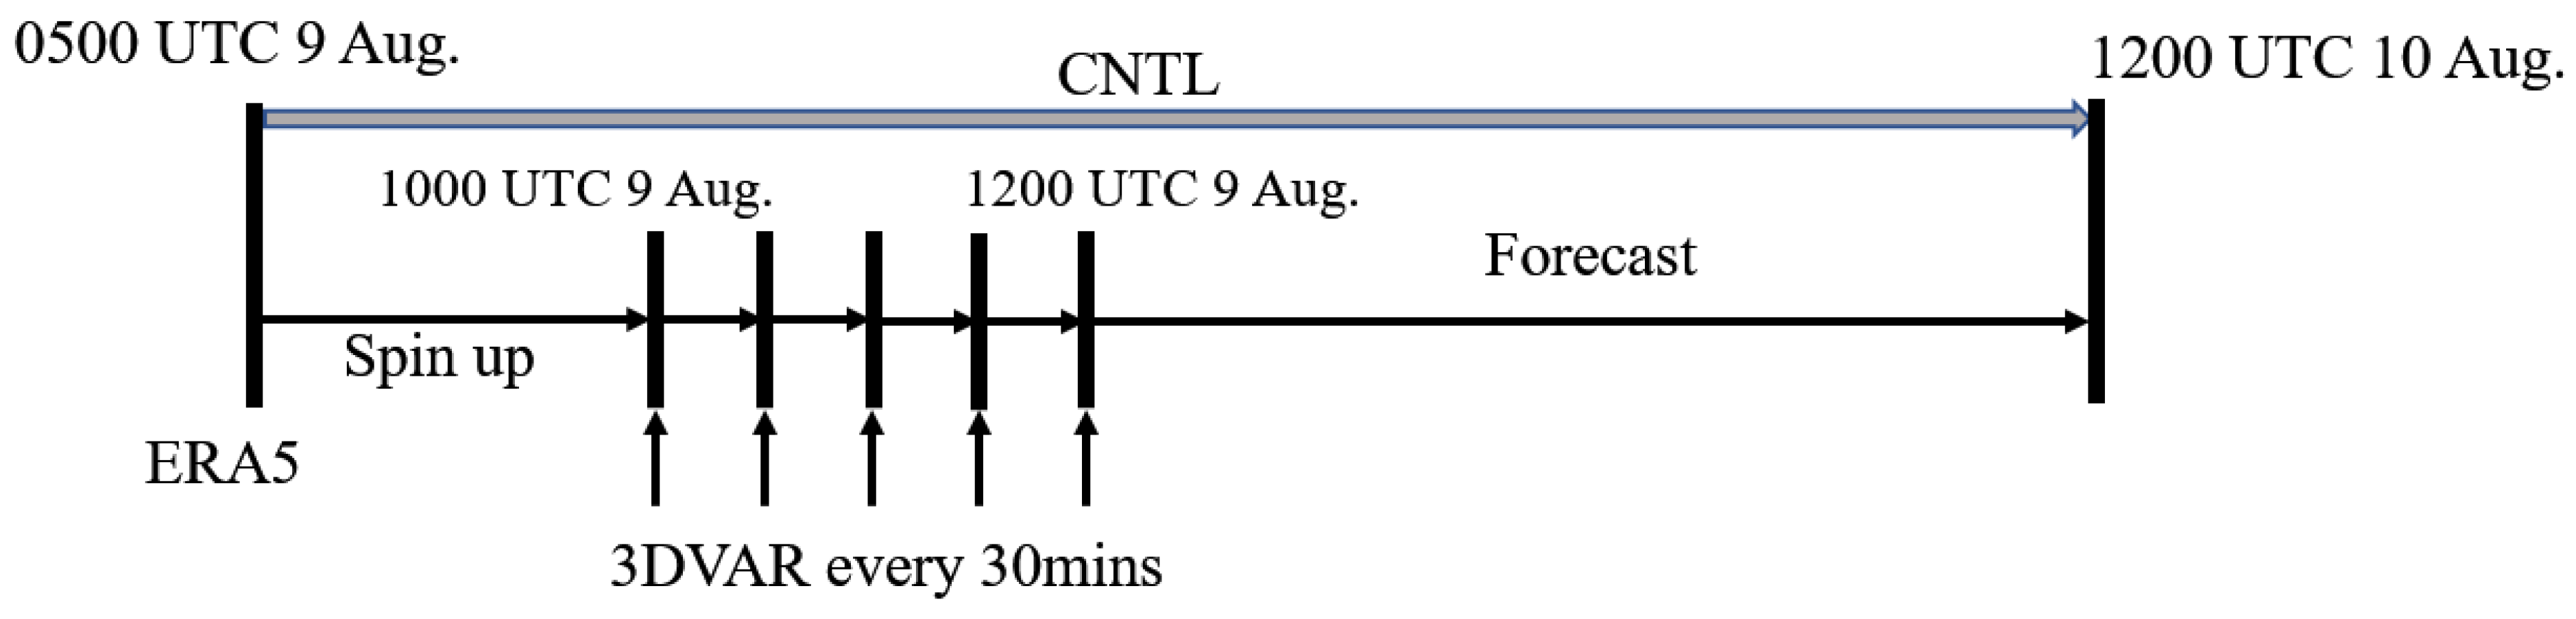
3.3. Experimental Design

In order to explore the impact of background error covariance length scale tuning on radar velocity data assimilation for TC Lekima, three groups of experiments were performed in this study (Table 1). Figure 3 shows the workflow of experiments. All three experiments were initialized from ERA5 data at 0500 UTC on 9 August 2019. The control experiment (CNTL) launched the forecast from 0500 UTC on 9 August 2019 to 1200 UTC on 10 August 2019 with no data assimilation as the benchmark forecast. Another two experiments (DA_len1.0, DA_len0.15) assimilated RV and conventional observations data every 30 min for 5 DA cycles after 5 h spin-up with a length scale factor of 1.0 and a length scale factor of 0.15, respectively. In the real case for TC Lekima, from the sensitivity results of the wind increment for the length scale from 0.1 to 1 with 0.05 increment, it is found that sensitivity experiments with 0.15, and 0.2 yield relatively satisfying and similar results. Hence, 0.15 is chosen for the cycling data assimilation experiments, which is similar to that of Shen et al. [51]. A deterministic 24 h forecast is conducted from 1200 UTC on 9 August to 1200 UTC on 10 August after the final data assimilation cycle.

4. Results

In this section, firstly, two sets of single observation tests with the different horizontal length scale factors are used to show how the information from the radar velocity observations are spread out in model space named DA_len1.0 and DA_len0.15. Secondly, the effect of assimilating radar velocity data on the analyses and the forecasts for the Lekima case will also be illustrated.

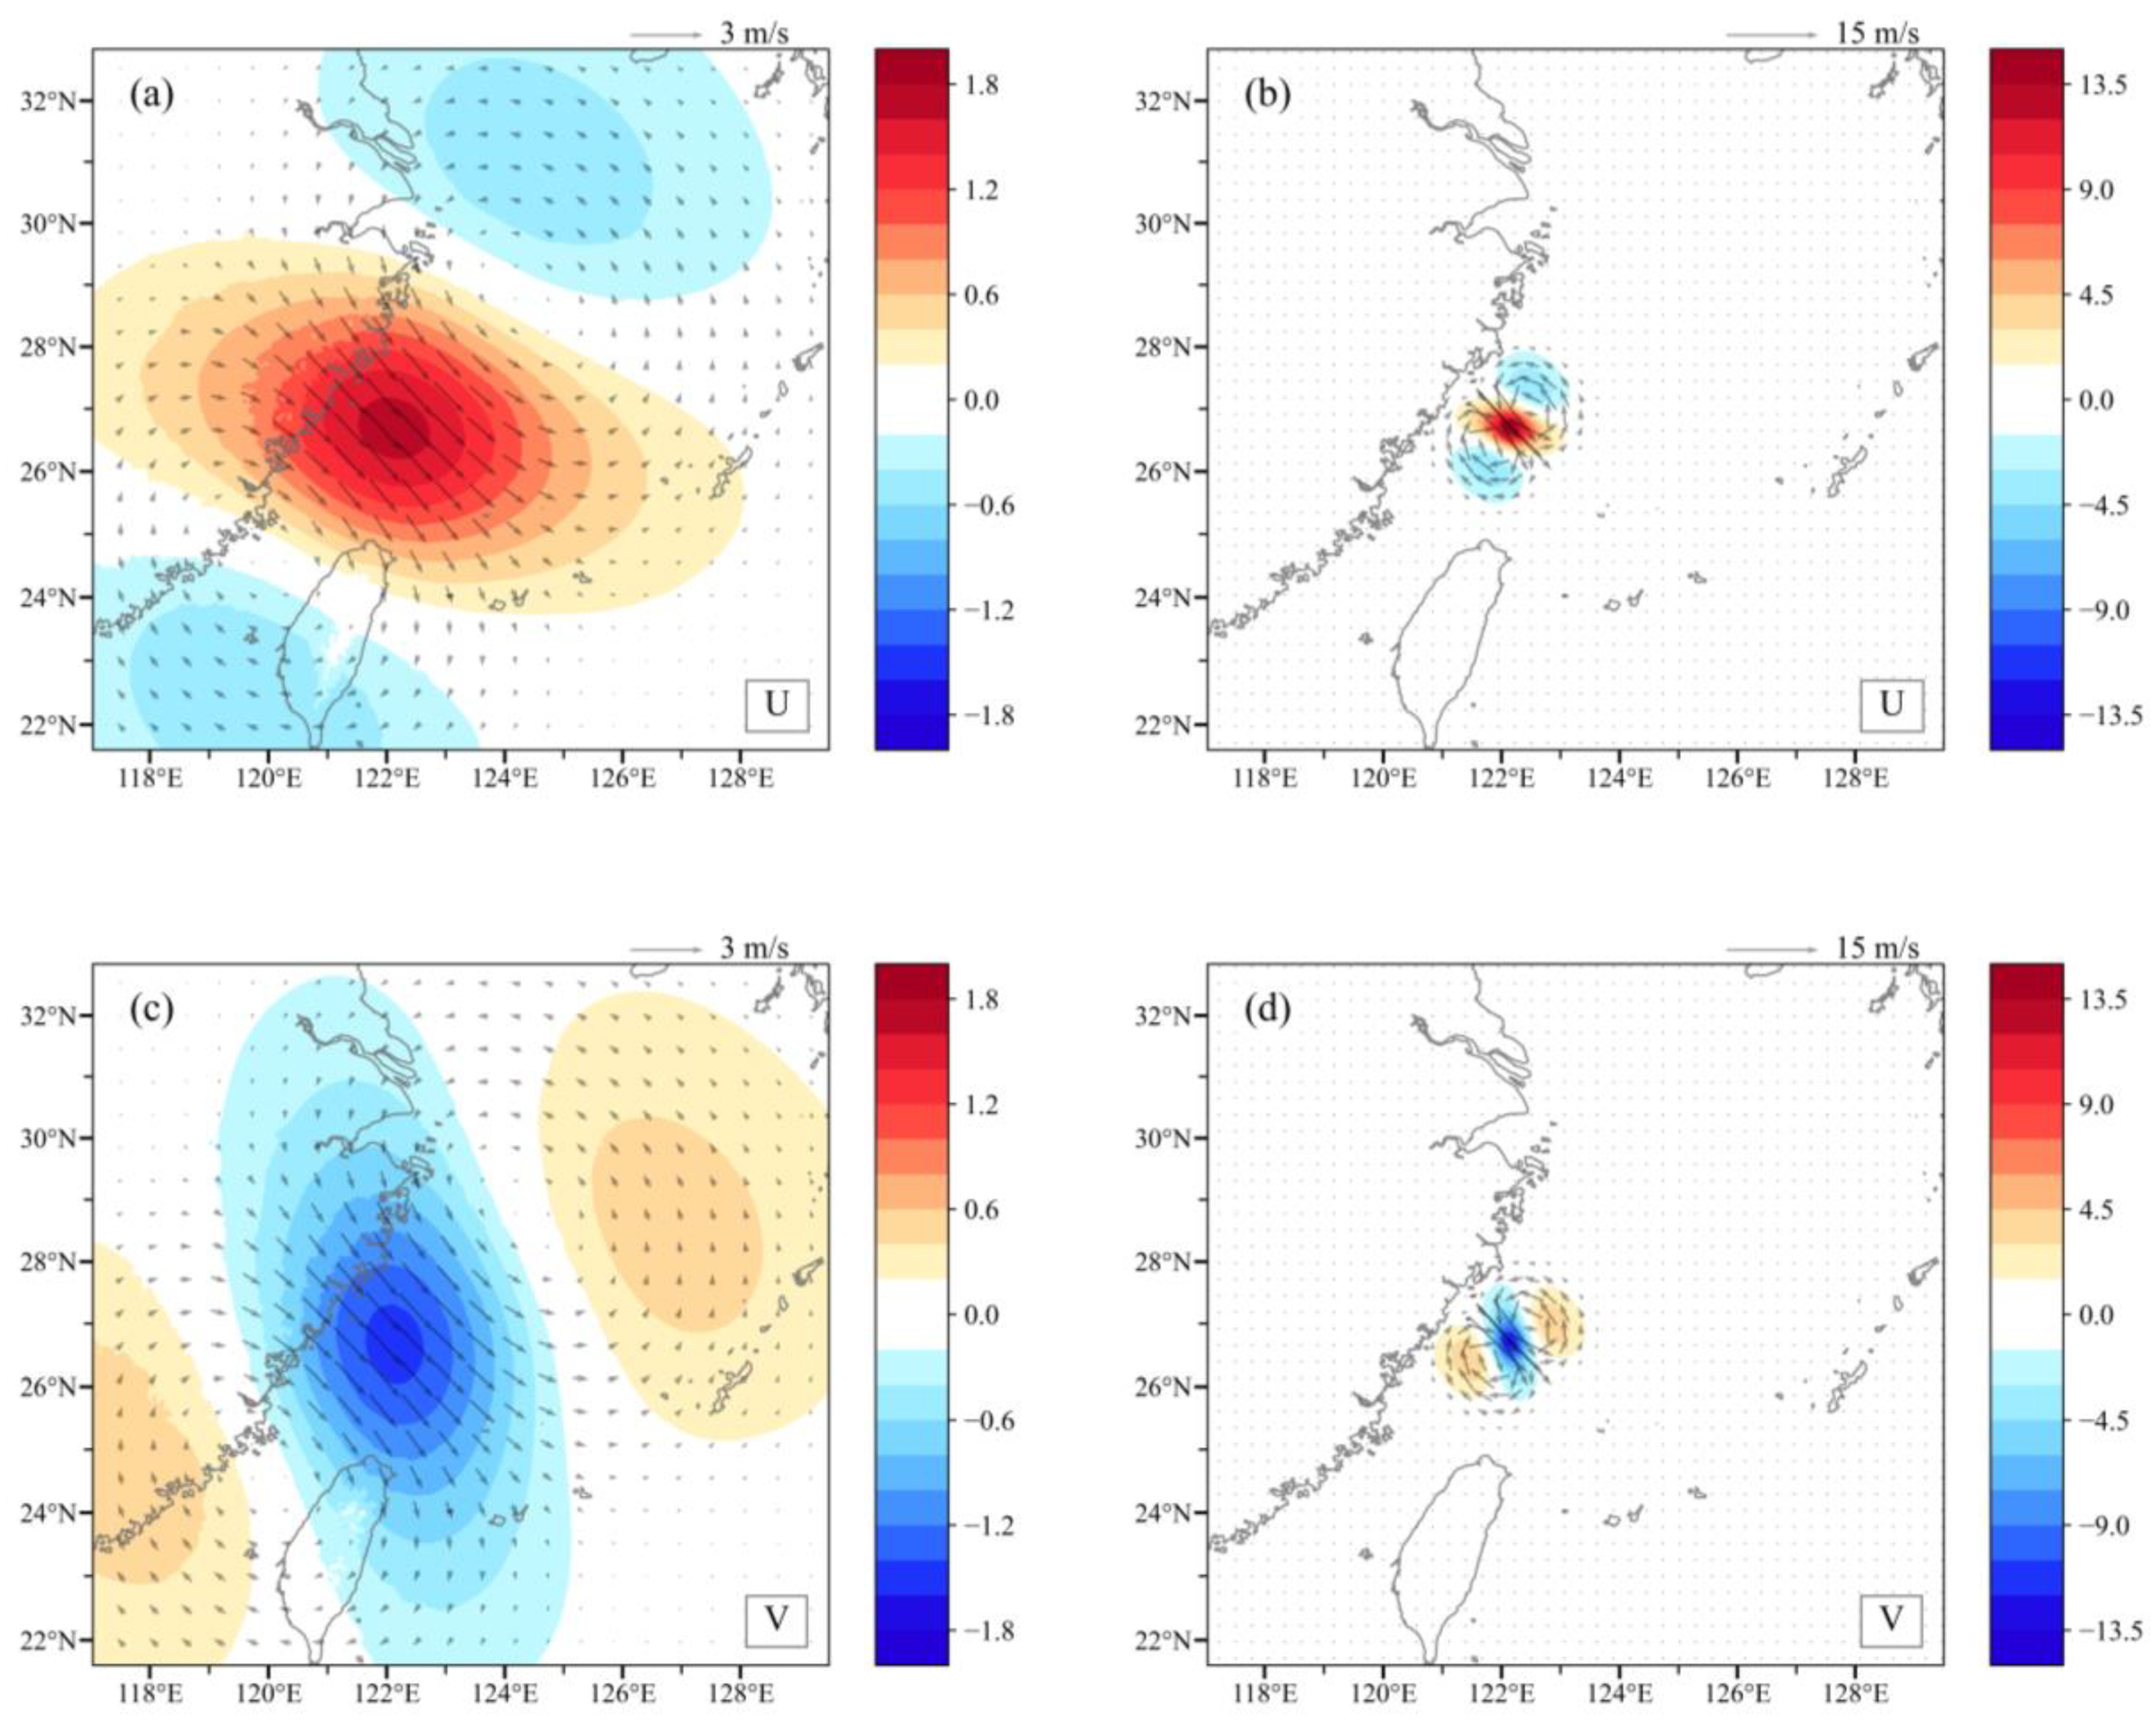
4.1. Single Observation Test

In this test, a real RV observation (27.13°N, 121.86°E, 29.20 m/s, altitude 3140 m) was selected to be assimilated in the southeast direction of radar at 1000 UTC 9 August 2019. The observation error was set to be 2 m/s, which was also used in the subsequent DA experiments in this study. Furthermore, the RV innovation was 23.7 m/s. Figure 4 shows the U and V wind increments at 700 hPa under two different length scale factor configurations. For U increments (Figure 4a,b), the value around the observation point is positive and negative on both sides, while the positive and negative distribution of V increments is opposite (Figure 4c,d), which indicates that opposite circulation occurs on either side of the observation point. Compared with the configuration with a smaller length scale factor (0.15, Figure 4a,c), the influence range of wind field increments under a larger length scale factor configuration is wider with smaller values (1.0, Figure 4b,d). It is found that the smaller length scale is able to constrain the spread of radar observations information within a relatively reasonable range.

4.2. Analyses and Forecasts

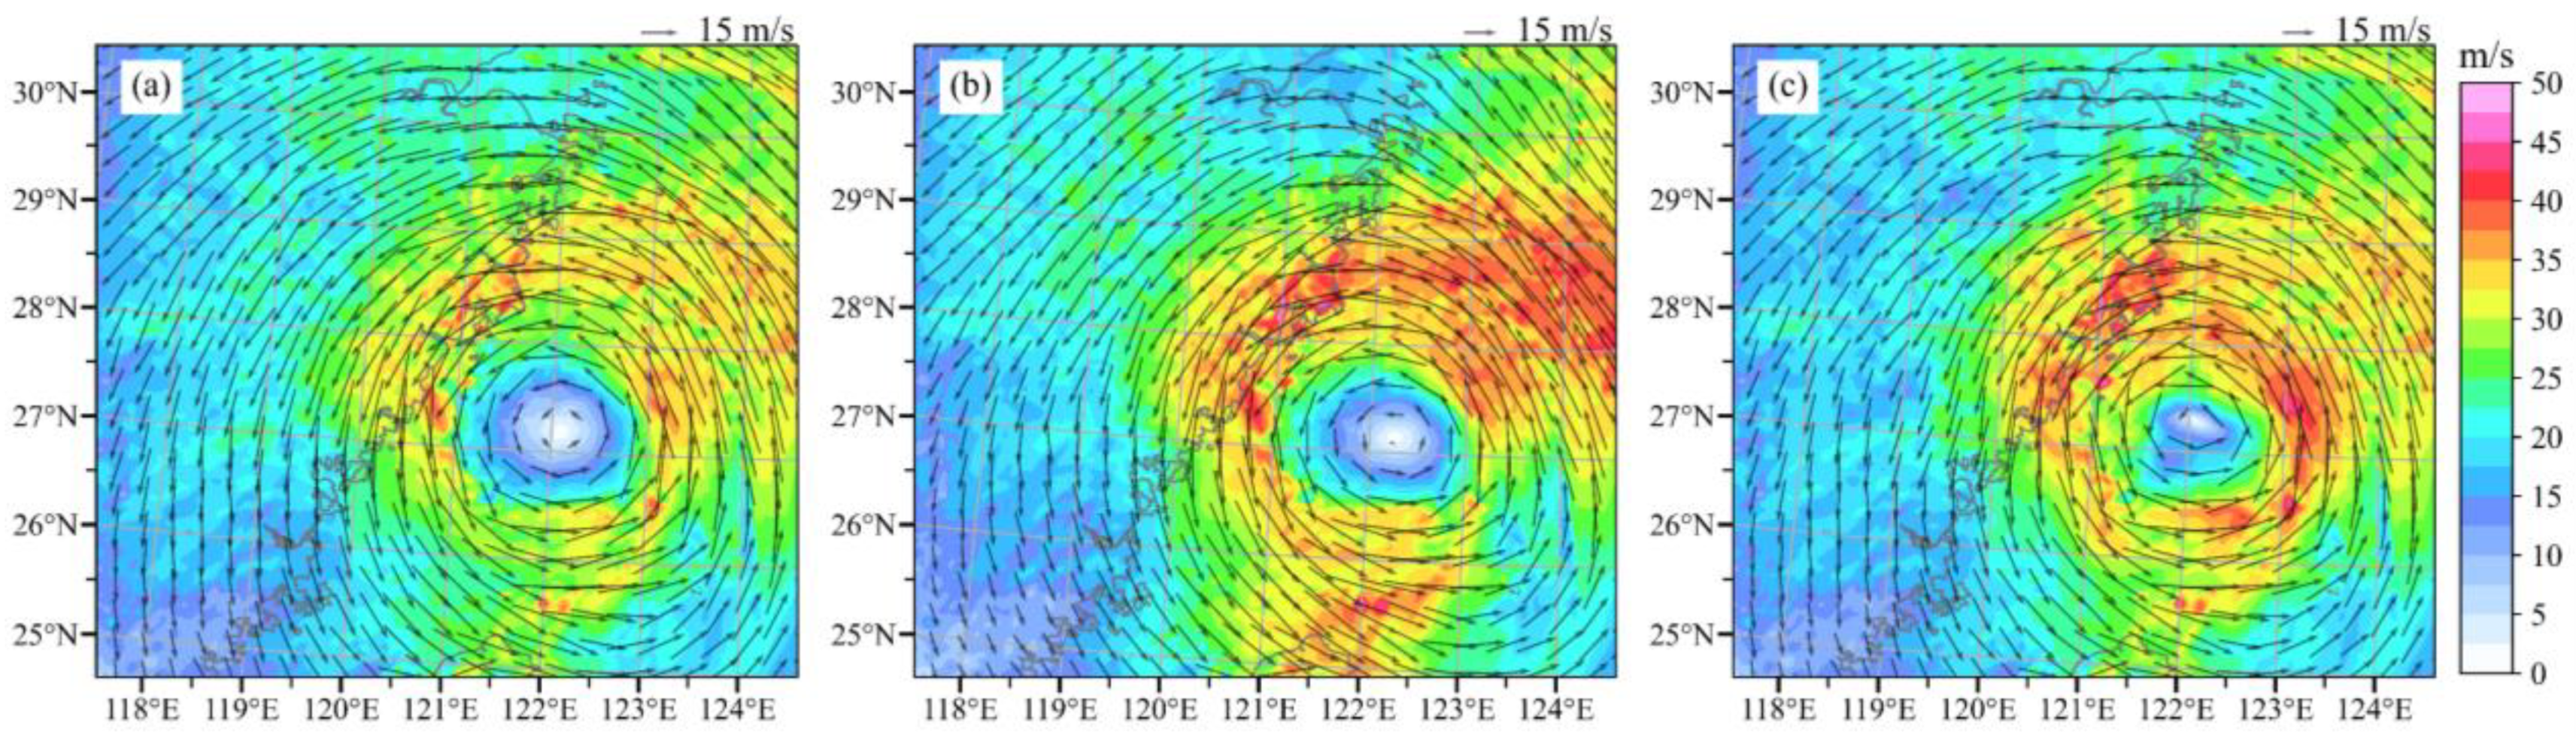
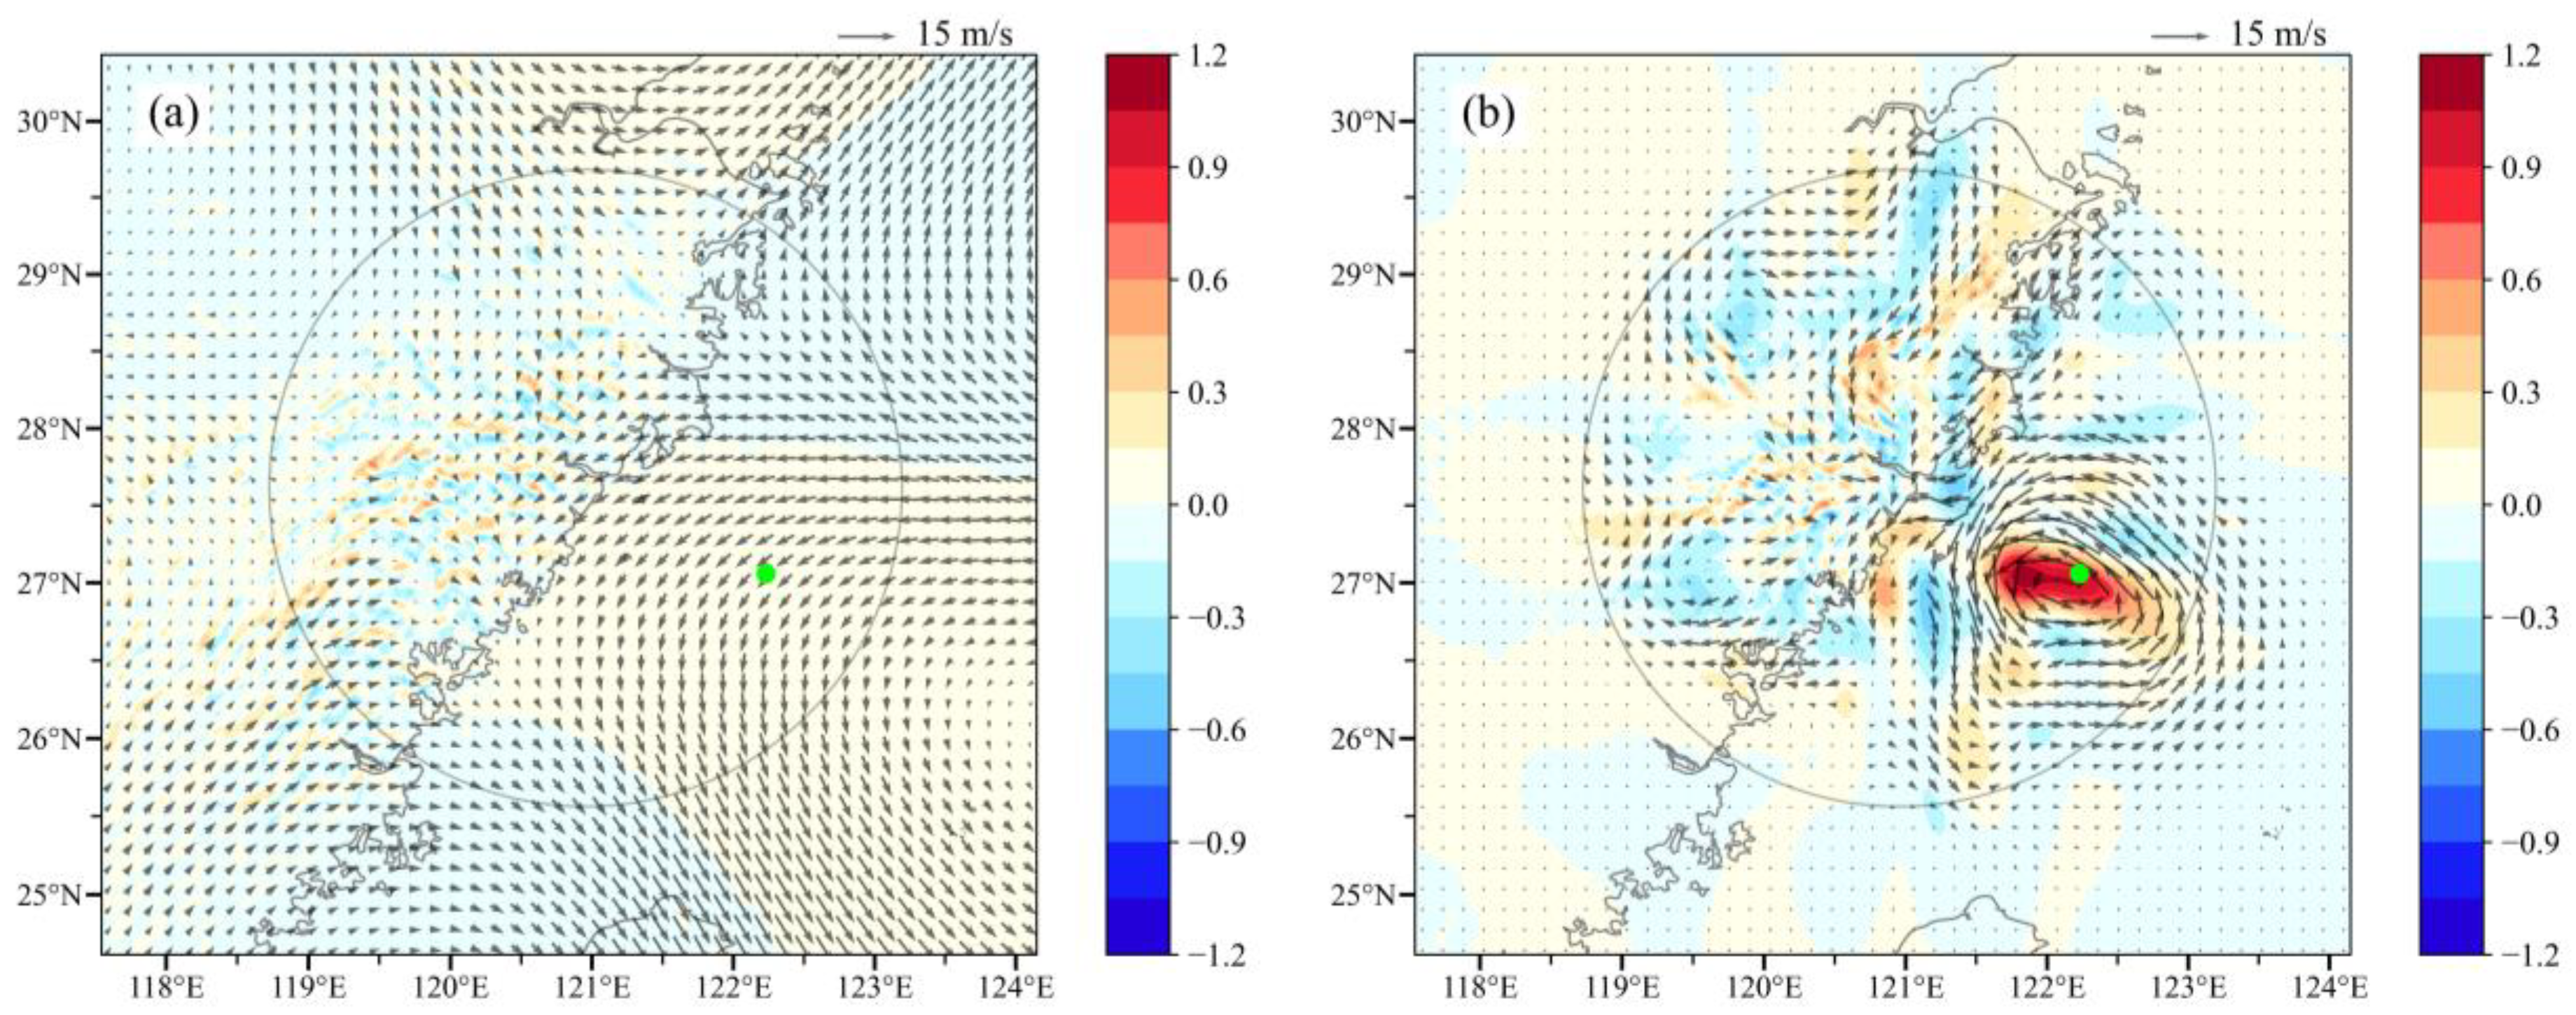
4.2.1. Impacts on Analyses

The distributions of the 700 hPa typhoon wind field are asymmetric at the first DA cycle for all three experiments (Figure 5) CNTL shows a wide eye and a weak wind band with a maximum wind speed of 43.2 m/s (Figure 5a). Compared to the CNTL, the wind band of DA_len1.0 expands to the northeast and south of the typhoon center with an intensified maximum wind speed of 48.6 m/s, while the eye does not change distinctly (Figure 5b). DA_len0.15 has a comparable wind band to that in the CNTL with an insignificant expansion, while the maximum wind speed in DA_len0.15 strengthens to 46.6 m/s and the wind eye becomes more compact (Figure 5c).
To better understand the effect of analysis on the dynamic structure of typhoons, Figure 6 shows the increments of horizontal wind and relative vorticity at 700 hPa for the first DA cycle. Similar to Figure 4, the cyclonic wind field increments are not formed in DA_len1.0 around the observed typhoon location, and the impact range of increments is over-extended (Figure 6a), resulting in the broad wind band in Figure 5b. DA_len0.15 generates clear cyclonic wind field increments and positive relative vorticity increments near the observed typhoon location (Figure 6b). Notably, the maximum magnitude of positive relative vorticity increments reaches 1.1 × 10⁻³ s−2. The enhancement of the local vortex is conducive to the formation of the compact eye in Figure 5c. It is found that when the length scale factor is set to 0.15, the small-scale and meso-scale information of radar observations is better applied, yielding a more reasonable analysis field.
For the two DA experiments, the wind analysis fields exhibit large differences at the first DA cycle as described previously. In order to further investigate the effects of analysis under different length scale factor settings in all DA cycles, the time series of Root Mean Square Error (RMSE) of RV and MSLP before and after each assimilation are shown in Figure 7a,b, respectively. During the first assimilation, the RMSE of RV (Figure 7a) for DA_len1.0 is decreased by 1.37 m/s from 4.74 m/s to 3.37 m/s, but for DA_len0.15 it is decreased by 2.54 m/s. After each analysis, the error is increased due to the forecast adjustment. The mean RMSE of RV for DA_len1.0 is about 3.6 m/s, and the RMSE of RV for DA_len0.15 is stable at about 2.2 m/s close to the observation error (2 m/s). The respective RMSE of the two experiments are decreased most at 1000 UTC, probably because the background field used during the first assimilation is the weakest. Figure 7b shows that the MSLP for DA_len1.0 (964.6 hPa) is only reduced by about 5 hPa after five DA cycles, which is close to the CNTL forecast (969.6 hPa). However, for DA_len0.15, the MSLP is significantly reduced by the forecast adjustment from 969.5 hPa to 943.9 hPa, which is finally only 8.9 hPa away from the CMA observations (935 hPa). Accordingly, the smaller length scale factor leads to a more precise wind analysis field, resulting in a stronger typhoon.
Figure 8 shows the analyzed sea level pressure and 10 m wind fields at the last DA cycle. Similar to the 1000 UTC, the simulation of the typhoon without any data assimilation exhibits weaker intensity compared to observations, maintaining a broad eye with the center of the typhoon displaced to the northwest of the observation location. The isobaric lines around the typhoon center are relatively sparse and the MSW is below 30 m/s (Figure 8a). Through multiple assimilations of RV data, the eye of the typhoon is further contracted, and the surface wind speeds are significantly strengthened. The simulated center of the typhoon is corrected to the southeast quadrant of the observation location, and the position error is reduced. Although the assimilation experiments still exhibit a slight offset between the simulated and observed typhoon centers, the compact distribution of isobaric lines in DA_len0.15 matches the observed circulation pattern of the wind field with almost overlapped centers (Figure 8c). This indicates that assimilating the radar wind field with a length scale factor of 0.15 leads to a better dynamical balance than using a factor of 1.0.
In the previous section, the horizontal structure characteristics of the simulated typhoons have been analyzed. To gain a clearer comparison of the typhoon’s 3D structure for three experiments, Figure 9 presents a northeast-southwest vertical cross-section of potential temperature and horizontal wind speed across the typhoon center. As previously noted, the background field driven by ERA5 data produced a weak typhoon. This is further demonstrated in Figure 9a, where the eye of the typhoon in CNTL is wide. It is found that there is no significant depression of isentropes within the eye region, and the warm core is also weak. After five DA cycles, there is a broad and robust wind field to the east of the eye in CNTL, with the center of maximum wind speed roughly at 2.5 km height and reaching over 60 m/s. The eyewall is extended to a height of 8 km, with a slight depression of isentropes above this height (Figure 9b). In contrast, the eye in DA_len0.15 is narrowed more significantly than that in DA_len1.0, and the horizontal wind area is tighter, with a more pronounced depression of isentropes above 6 km vertical height, corresponding to a stronger warm area aloft (Figure 9c). From the understanding of the mechanism for a well-developing TC, the enhanced TC vortex circulation is supposed to be accompanied by strong wind warming of the vortex and inner-core region physically. Similar results and figures are also found in Dong and Xue [52] and Zhao and Xue [53]. While both experiments exhibit enhanced asymmetric typhoon vortices after assimilation and a greater wind speed gradient influenced by the warm core near 8 km height on the east side of the typhoon, the strong wind area in DA_len0.15 is extended to nearly 14 km height, which is higher than that in DA_len1.0. It is evident that DA_len0.15 has a large value of wind speed at 13 km to 14 km height, and the wind speed gradient is much stronger than that of DA_len1.0. These results suggest that there is likely a large temperature gradient here, according to the thermal wind balance.
Figure 10 further illustrates the vertical structure of typhoon wind and temperature fields in terms of the azimuthal mean vertical distribution of tangential wind and horizontal temperature anomalies for CNTL, DA_len1.0, and DA_len0.15, respectively. In CNTL, the maximum wind speed radius of the typhoon is about 130 km, and the positive temperature anomaly is about 4 K (Figure 10a). Compared with CNTL, both DA_len1.0, and DA_len0.15 improve the analysis of the eyewall and warm core. However, the enhancement of the warm core in DA_len1.0 is relatively weak, and the vertical distribution of the high wind speed region is scattered, with the maximum wind speed radius being larger than that of CNTL (Figure 10b). In contrast, DA_len0.15 strengthens the warm core by 5 K compared to DA_len1.0 and effectively corrects the maximum wind speed radius to 60 km, with a more concentrated eyewall structure close to the temperature-positive anomaly center (Figure 10c). In addition, DA_len0.15 has the strongest wind circulation in the lower atmosphere, with the core of tangential wind speed appearing below 1 km and reaching values above 48 m/s. It is worth noting that except for the 8 km height, there is another positive temperature anomaly center above 8 K near the 14 km height in Figure 10c, which may be related to the double warm-core structure near the 8 km and 16 km heights during the RI process of Typhoon Lekima [54]. Similar to Figure 9c, DA_len0.15 may better simulate the influence of the early double warm-core structure. In general, DA_len0.15 coordinates the strengthening of the wind field and the narrowing of the eye and matches the warm core with the vertical distribution of the wind. It can be seen that the tuning of the length scale factor results in effective adjustments of both the dynamic and thermal structure of TC Lekima.

4.2.2. Impacts on Forecasts

Track and Intensity Forecasts

In order to compare the impacts of tuning the horizontal length scale on typhoon forecasting, the analysis field at the last DA cycle is selected as the initial condition for a 24-h deterministic forecast. Figure 11 shows the predicted track, track error, and intensity of the typhoon, with the CMA tropical cyclones best track as the reference. The initial typhoon in CNTL is biased towards the western side of the observed typhoon, with a tracking error of 30 km (Figure 11a,b). In comparison, the assimilation experiments lead to a reduction in the initial position error. From the 3rd to 21st hour of the forecast, the typhoon in CNTL continues to move inland at a faster pace than the observed typhoon but with a lower track error than DA_len1.0. It eventually set roughly 100 km northwest of the observed position. The DA_len1.0 track error reaches a peak of nearly 115 km after a 9-h forecast, with an average value of about 60 km. The average error of CNTL is smaller, 41 km, compared to DA_len1.0 (Figure 11b). It can be inferred that the length scale factor of DA_len1.0 is unsuitably set, rendering the environmental wind field adjustments during the assimilation process inadequate. As a result, the typhoon’s track oscillates to the greatest extent around the observed path during the forecasting process (Figure 11a). Conversely, for DA_len0.15, the tracking error is swiftly reduced to 2 km in the third hour of the forecast, and the position is extremely close to the observed typhoon’s landing location in the sixth hour. The average track error for the 24-h forecast is less than 20 km, which is optimal for the three experiments. Although the speed of the typhoon in DA_len0.15 deviates somewhat from the observed typhoon, its movement is comparable to the best track, initially moving northwestward and later turning northward.
The best track shows that the typhoon intensified before landfall (Figure 11c,d), with an MSW of about 52 m/s and an MSLP of 930 hPa at 1800 UTC on 9 August (the sixth hour of the forecast). The larger MSWs in the DA experiments are observed than those in the CTNL. After landfall, the intensity of the typhoon weakened rapidly. Nevertheless, the MSWs in DA_len0.15 are still closer to the observations compared to CNTL. In contrast, there are smaller MSWs in DA_len1.0 than those in CNTL, indicating the effect of assimilation in DA_len1.0 may not be well maintained. This is further illustrated in Figure 11d. As the forecast length increases, the MSLPs in DA_len1.0 gradually approach those in CNTL and are very close to the observations after 12 h. The MSLPs from the DA_len0.15 are underpredicted after roughly 9 h, probably due to the slow spin-down problem, which is also found in the previous studies [52,53].
The results suggest that the three experiments seem to exhibit opposite forecasting performances for the landfalling typhoon when evaluated using the criteria of MSW and MSLP, respectively. It is worth noting that the decrease gradient of the observed typhoon MSW is larger at 9–15 h than at 18–24 h, all three experiments well reflect this feature (Figure 11c). However, in Figure 11d, CNTL and DA_len1.0 predict a slow rise in MSLP, which is inconsistent with observation, DA_len0.15 better simulates the fact that MSLP rises rapidly after typhoon landfall. In general, the forecast track of DA_len0.15 is closest to the observation, maintaining better the positive impact of assimilation during the forecast process and possibly more accurately capturing the trend of typhoon intensity change.

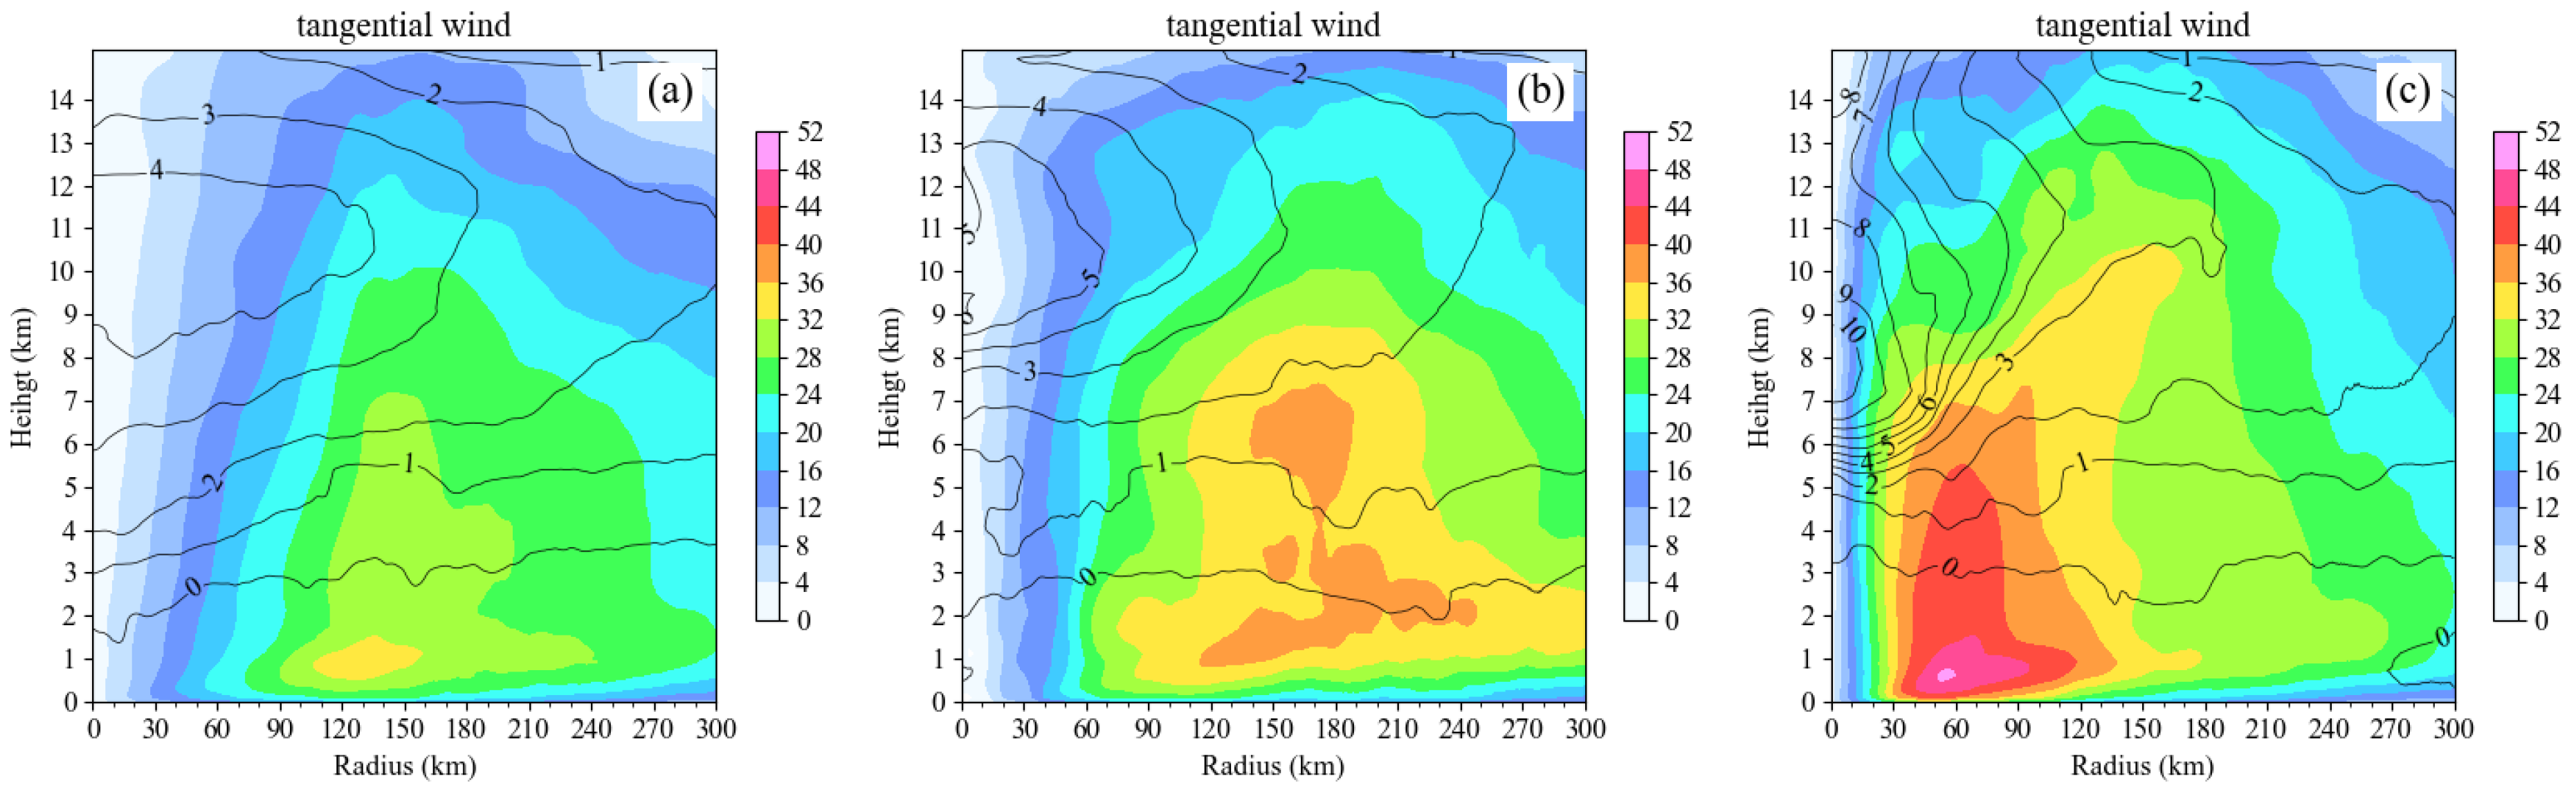
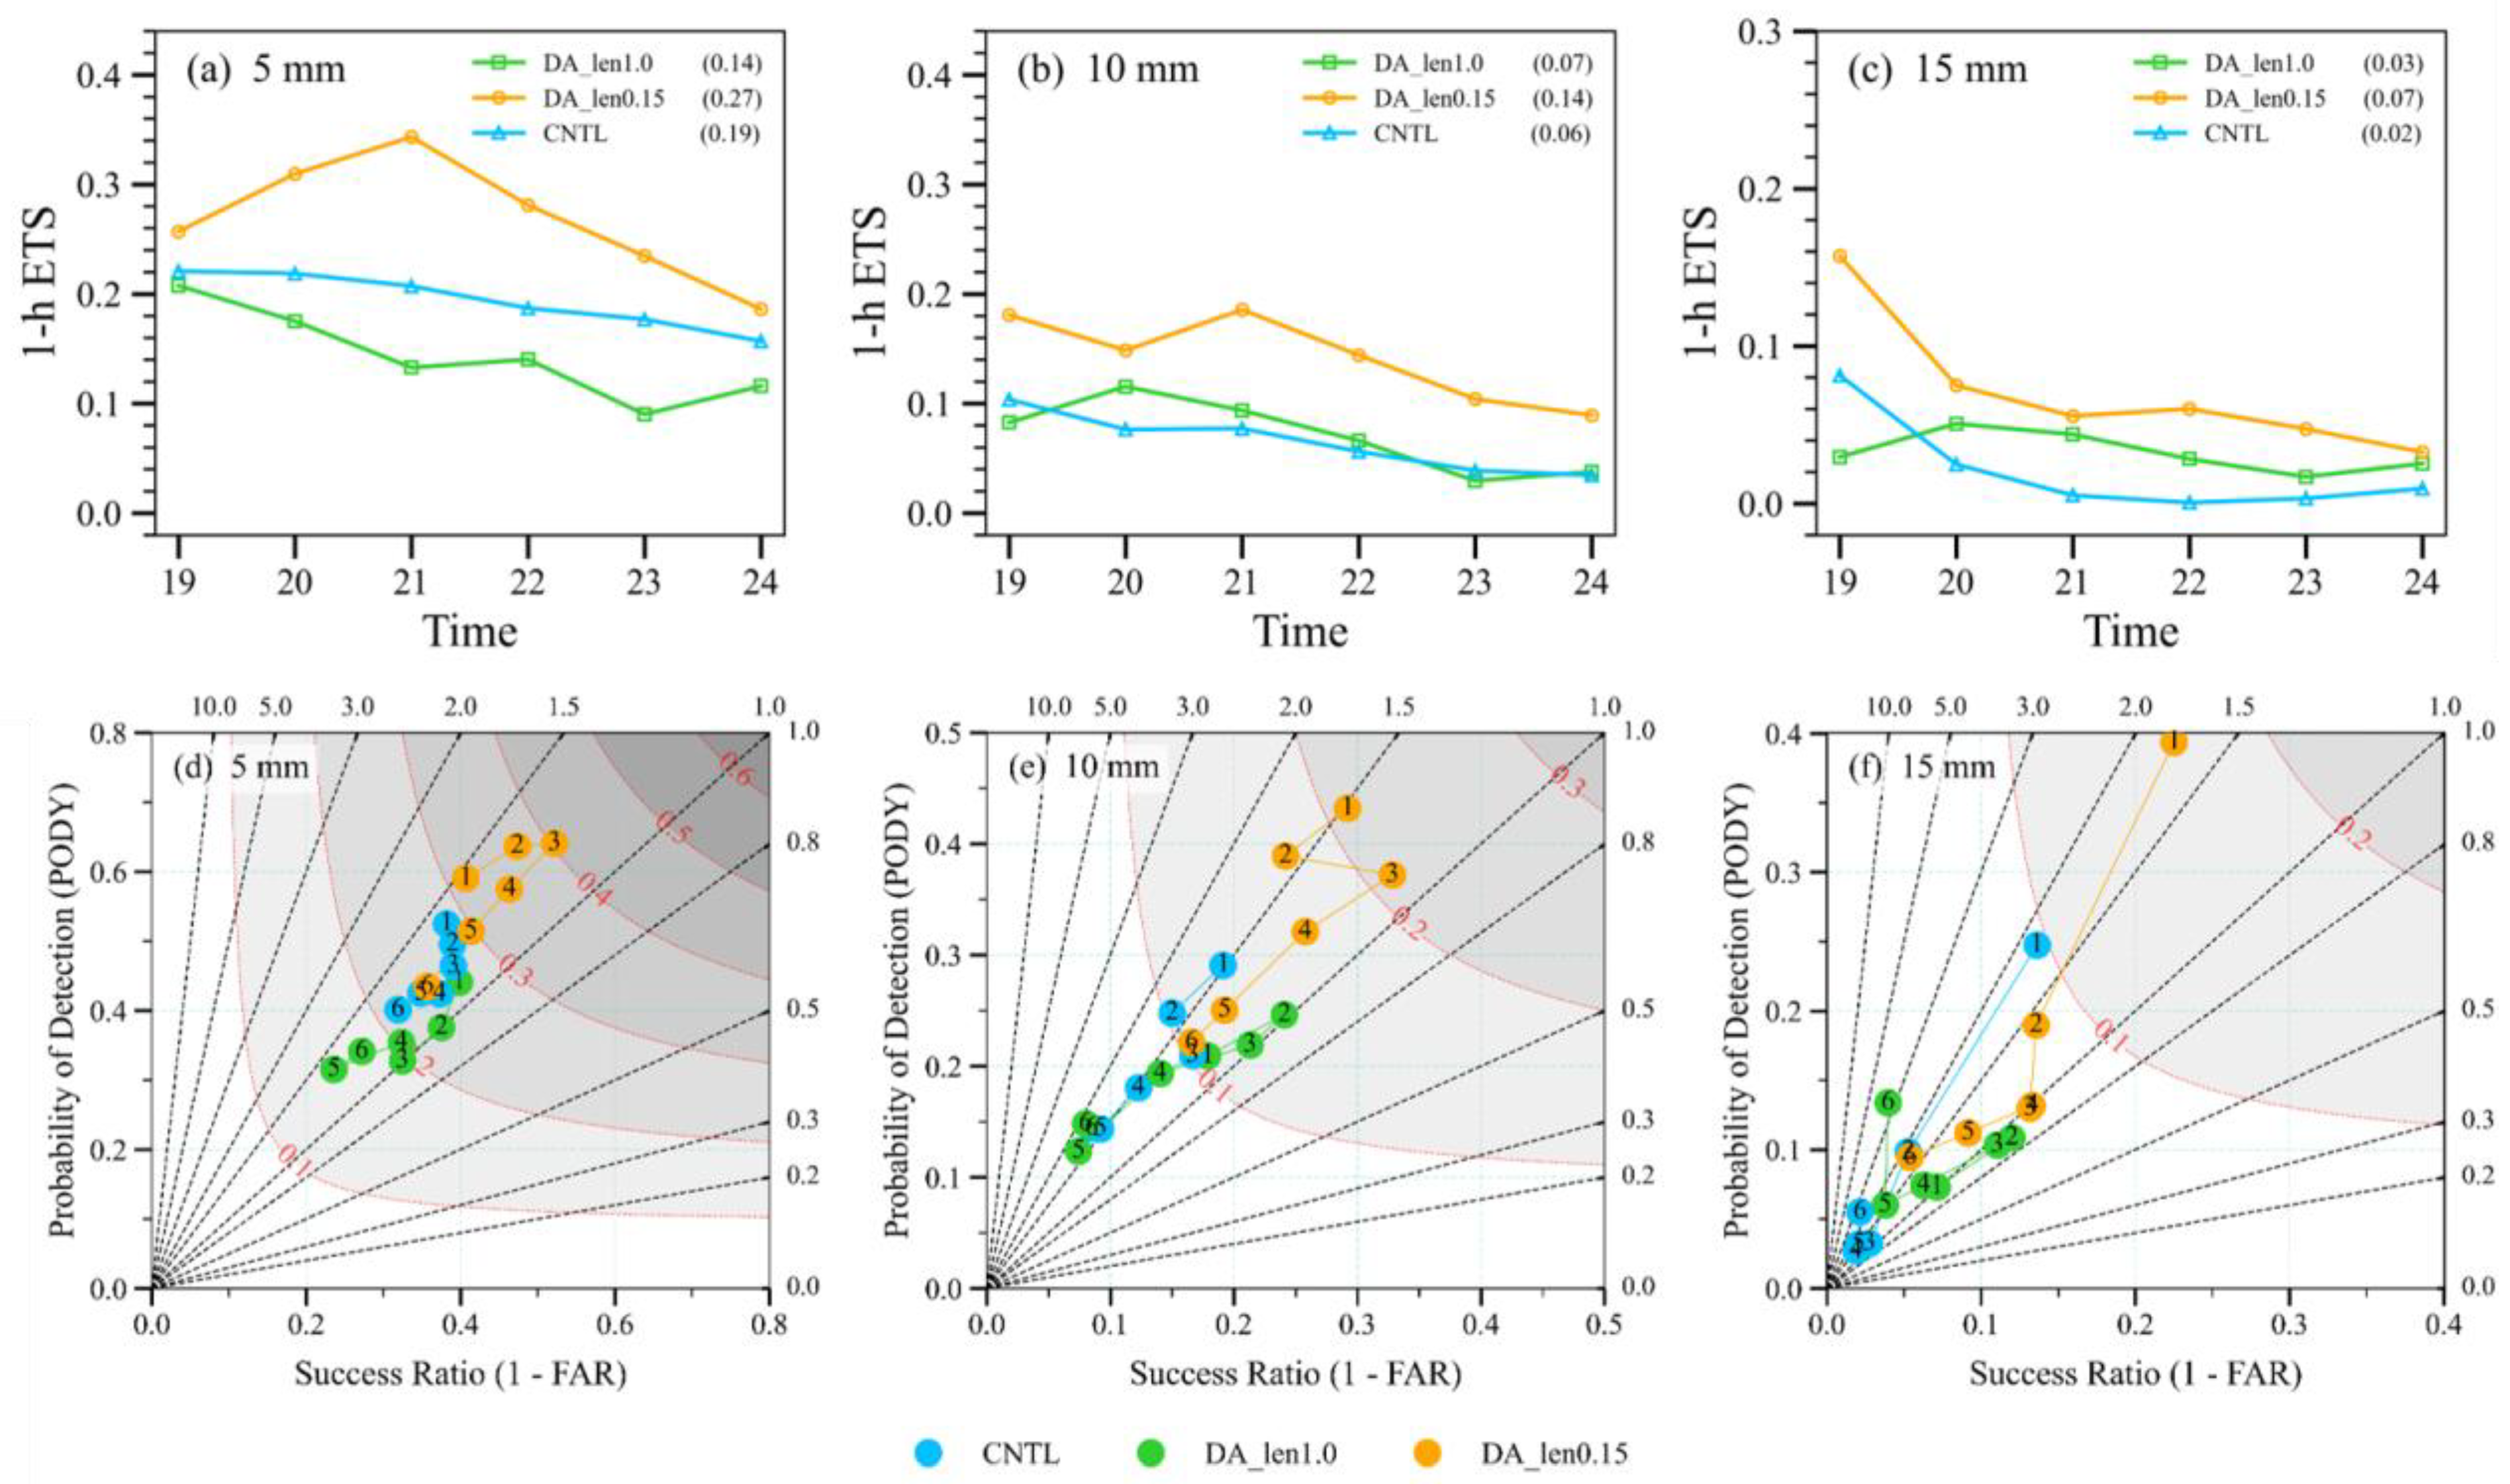
Structure and Precipitation Forecasts

To examine the structural features of predicted typhoons, this study presents a comparison between the composite reflectivity of observation and the predicted maximum reflectivity at the first 6-h forecasts, as shown in Figure 12. At 1200 UTC on 9 August 2019, Typhoon Lekima is positioned in the southeast of the coast, approximately 100 km away from Zhejiang Province. An obvious asymmetrical double eye-wall structure is found in DA_len0.15 (Figure 12d) with the strongest reflectivity in the northwestern similar to those in the observed truth (Figure 12a). This feature was missing in the CNTL (Figure 12b) and the reflectivity is over-estimated in DA_len1.0 (Figure 12c). At 1500 UTC, the symmetric eyewall structure observed (Figure 12e) has not appeared in CNTL and DA_len1.0, both of which simulate a missing reflectivity hole, failing to reflect the precise information of the eye (Figure 12f,g). In contrast, DA_len0.15 exhibits a tighter eye of the typhoon, with the outer rainband position closer to the observation and the convection more organized (Figure 12h). At 1800 UTC, the observation shows the filling of the typhoon, the structure of the rainband becomes more dispersed, and the eye is replaced by strong composite reflectivity (Figure 12i). Compared to observation, the CNTL still maintains a wider area of non-reflectivity at the centre of the vortex, bringing a larger area of spuriously heavy rainfall in the northwest quadrant of the typhoon and losing information on the southern outer rainband of the typhoon (Figure 12j). The results from DA_len1.0 is comparable to the CNTL, but the typhoon vortex structure is further damaged (Figure 12k). In the DA_len0.15, the distribution of strong reflectivity is more concentrated towards the core compared to the other experiments. Although this experiment also fails to simulate the outer rainband in the south at 1800 UTC, its rainband structure is more distinct (Figure 12l). During the landing of the typhoon, DA_len0.15 exhibits a more complete and clearer eyewall and typhoon vortex than the other experiments. Moreover, the simulated typhoon spiral rainband pattern in DA_len0.15 is highly similar to the observed pattern on the sea. Despite some slight deviations in terms of the position and intensity on the land, the forecast results are superior to those of the other two experiments.
The distribution and intensity of the precipitation during the typhoon landfall are crucial components for accurate NWP predictions, which will be explored in Figure 13. The accumulated precipitation is largely affected by the cloud precipitation related to model variables, including multi-phase hydrometers and water vapor. These model variables are changed during the data assimilation cycles through the cross-variable background error correlations in 3DVAR and the model integrations with complex physics parametrizations considered. The near real-time precipitation data of the CMA Land Data Assimilation System (CLDAS-V2.0) are used as the observations. Prior to the landfall, from 1200 UTC 9 August 2019 to 1800 UTC 9 August 2019, observed onshore heavy precipitations (over 50 mm) are concentrated in the eastern part of Zhejiang Province (Figure 13a). CNTL simulates a more northerly and wider region of heavy precipitation, with overestimated precipitation in southwestern Zhejiang (Figure 13b). Meanwhile, DA_len1.0 predicts a weak and excessively wide typhoon rainband, as a result of the unreasonable simulation of the typhoon vortex, leading to a near-total loss of information regarding the heavy precipitation area near 28.5°N, 121°E (Figure 13c). DA_len0.15 has a similar pattern of rainstorm areas near the typhoon vortex to that of the observation, although the rainband in the southeast quadrant is overpredicted due to the simulated eye of the typhoon being larger than observed (Figure 13d). Within 6 h of typhoon landfall, heavy precipitations are more concentrated along the eastern coast, with two small rainstorm areas in the west and southwest of Zhejiang Province (Figure 13e). Due to the rapid shift of the typhoon predicted by CNTL and DA_len1.0 during this period (Figure 11a), the rainfall areas are located further away from the coast (Figure 13f,g). The heavy precipitation centers in DA_len0.15 are also scattered, but predominantly located in Zhejiang Province and intensified along the eastern coast compared to CNTL and DA_len1.0 (Figure 13h). In subsequent forecasts, the main rainfall areas in CNTL are closer than observed (Figure 13j). DA_len1.0 is better than CNTL to distinguish the location of rainfall areas more than 25 mm, although there are some misleading forecasts in terms of the position and intensity compared with observations (Figure 13k). DA_len0.15 captures the pattern of the arc-type heavy precipitation area in northern Zhejiang, and better corrects the intensity of the precipitation centers (Figure 13l).
To investigate the performance of different experiments on short-term precipitation forecast, the Equitable Threat Score (ETS) and the performance diagrams [55] of hourly accumulated precipitation within 6 h after typhoon landing for 5 mm, 10 mm, and 15 mm thresholds are shown in Figure 14. For a threshold of 5 mm, the experiments with the highest to lowest scores at each moment are DA_len0.15, CNTL, DA_len1.0, and the averaged ETSs are 0.27, 0.19, and 0.14, respectively (Figure 14a). The results from performance diagrams also show that DA_len0.15 has a higher Critical Success Index (CSI) and Probability of Detection (POD) (Figure 14d). For the 10 mm precipitation forecasts, DA_len0.15 still maintains the highest score among the three experiments, and the averaged ETS is 0.14. DA_len1.0 has higher ETSs than CNTL from the 2nd to 4th hours, and the mean ETS is 0.07, 0.01 more than CNTL (Figure 14b). Furthermore, the success ratio of CNTL is almost the lowest in the first four hours (Figure 14e). The precipitation forecasts of the 15 mm threshold are comparable to that of the 10 mm threshold, with the scores from all three experiments showing a continuing decrease (Figure 14c). Nevertheless, on the performance diagram for the 15 mm threshold, the hourly accumulated precipitation forecasts for DA_len0.15 are generally closer to the upper right corner of the diagram, meaning that DA_len0.15 still has more accurate forecasts. Except for the first two hours, the results of CNTL are clustered in the lower left corner of the diagram, implying lower POD and higher False Alarm Rate (FAR), although the averaged ETS for CNTL is only slightly lower by 0.01 compared to DA_len1. 0 (Figure 14f).
Figure 15 further illustrates the ETS of 24-h accumulated precipitation for the different thresholds, quantifying the forecast performances of the three experiments for different intensities of precipitation over the entire deterministic forecast period. It can be seen that DA_len0.15 has almost the highest ETSs for the whole threshold interval shown, with the ETSs greater than 0.4 for the threshold from 1 to 100 mm and not less than 0.2 until the threshold increases to 240 mm. Similar to He et al. and Yu et al. [42,56], the ETSs presented in DA_len0.15 indicate that it possesses certain skills in forecasting precipitation for Typhoon Lekima. Although the ETSs of CNTL are lower than DA_len0.15, these values stay ahead of DA_len1.0 as the threshold increases until they are exceeded by DA_len1.0 when the threshold increases to 190 mm. This indicates that CNTL outperforms DA_len1.0 for lighter precipitation. The inference can be drawn that the extensive rainband predicted by DA_len1.0 produces widespread false light precipitation (Figure 13), ultimately resulting in a decline in ETSs.
The different length scale factor configurations during assimilation have a significant impact on the deterministic forecast of typhoon precipitation. Although a larger length scale factor does not improve the accuracy of precipitation distribution forecasts at certain times, it is slightly more accurate than no assimilation at precipitation thresholds above heavy precipitation, while a smaller length scale factor has a more consistent positive gain on both the distribution and intensity of the predicted precipitation. As mentioned earlier, the 24-h forecast based on the initial condition generated by a smaller length scale has a lower averaged track error and simulates more complete rainbands, which promotes improvements in precipitation forecasting of DA_len0.15.

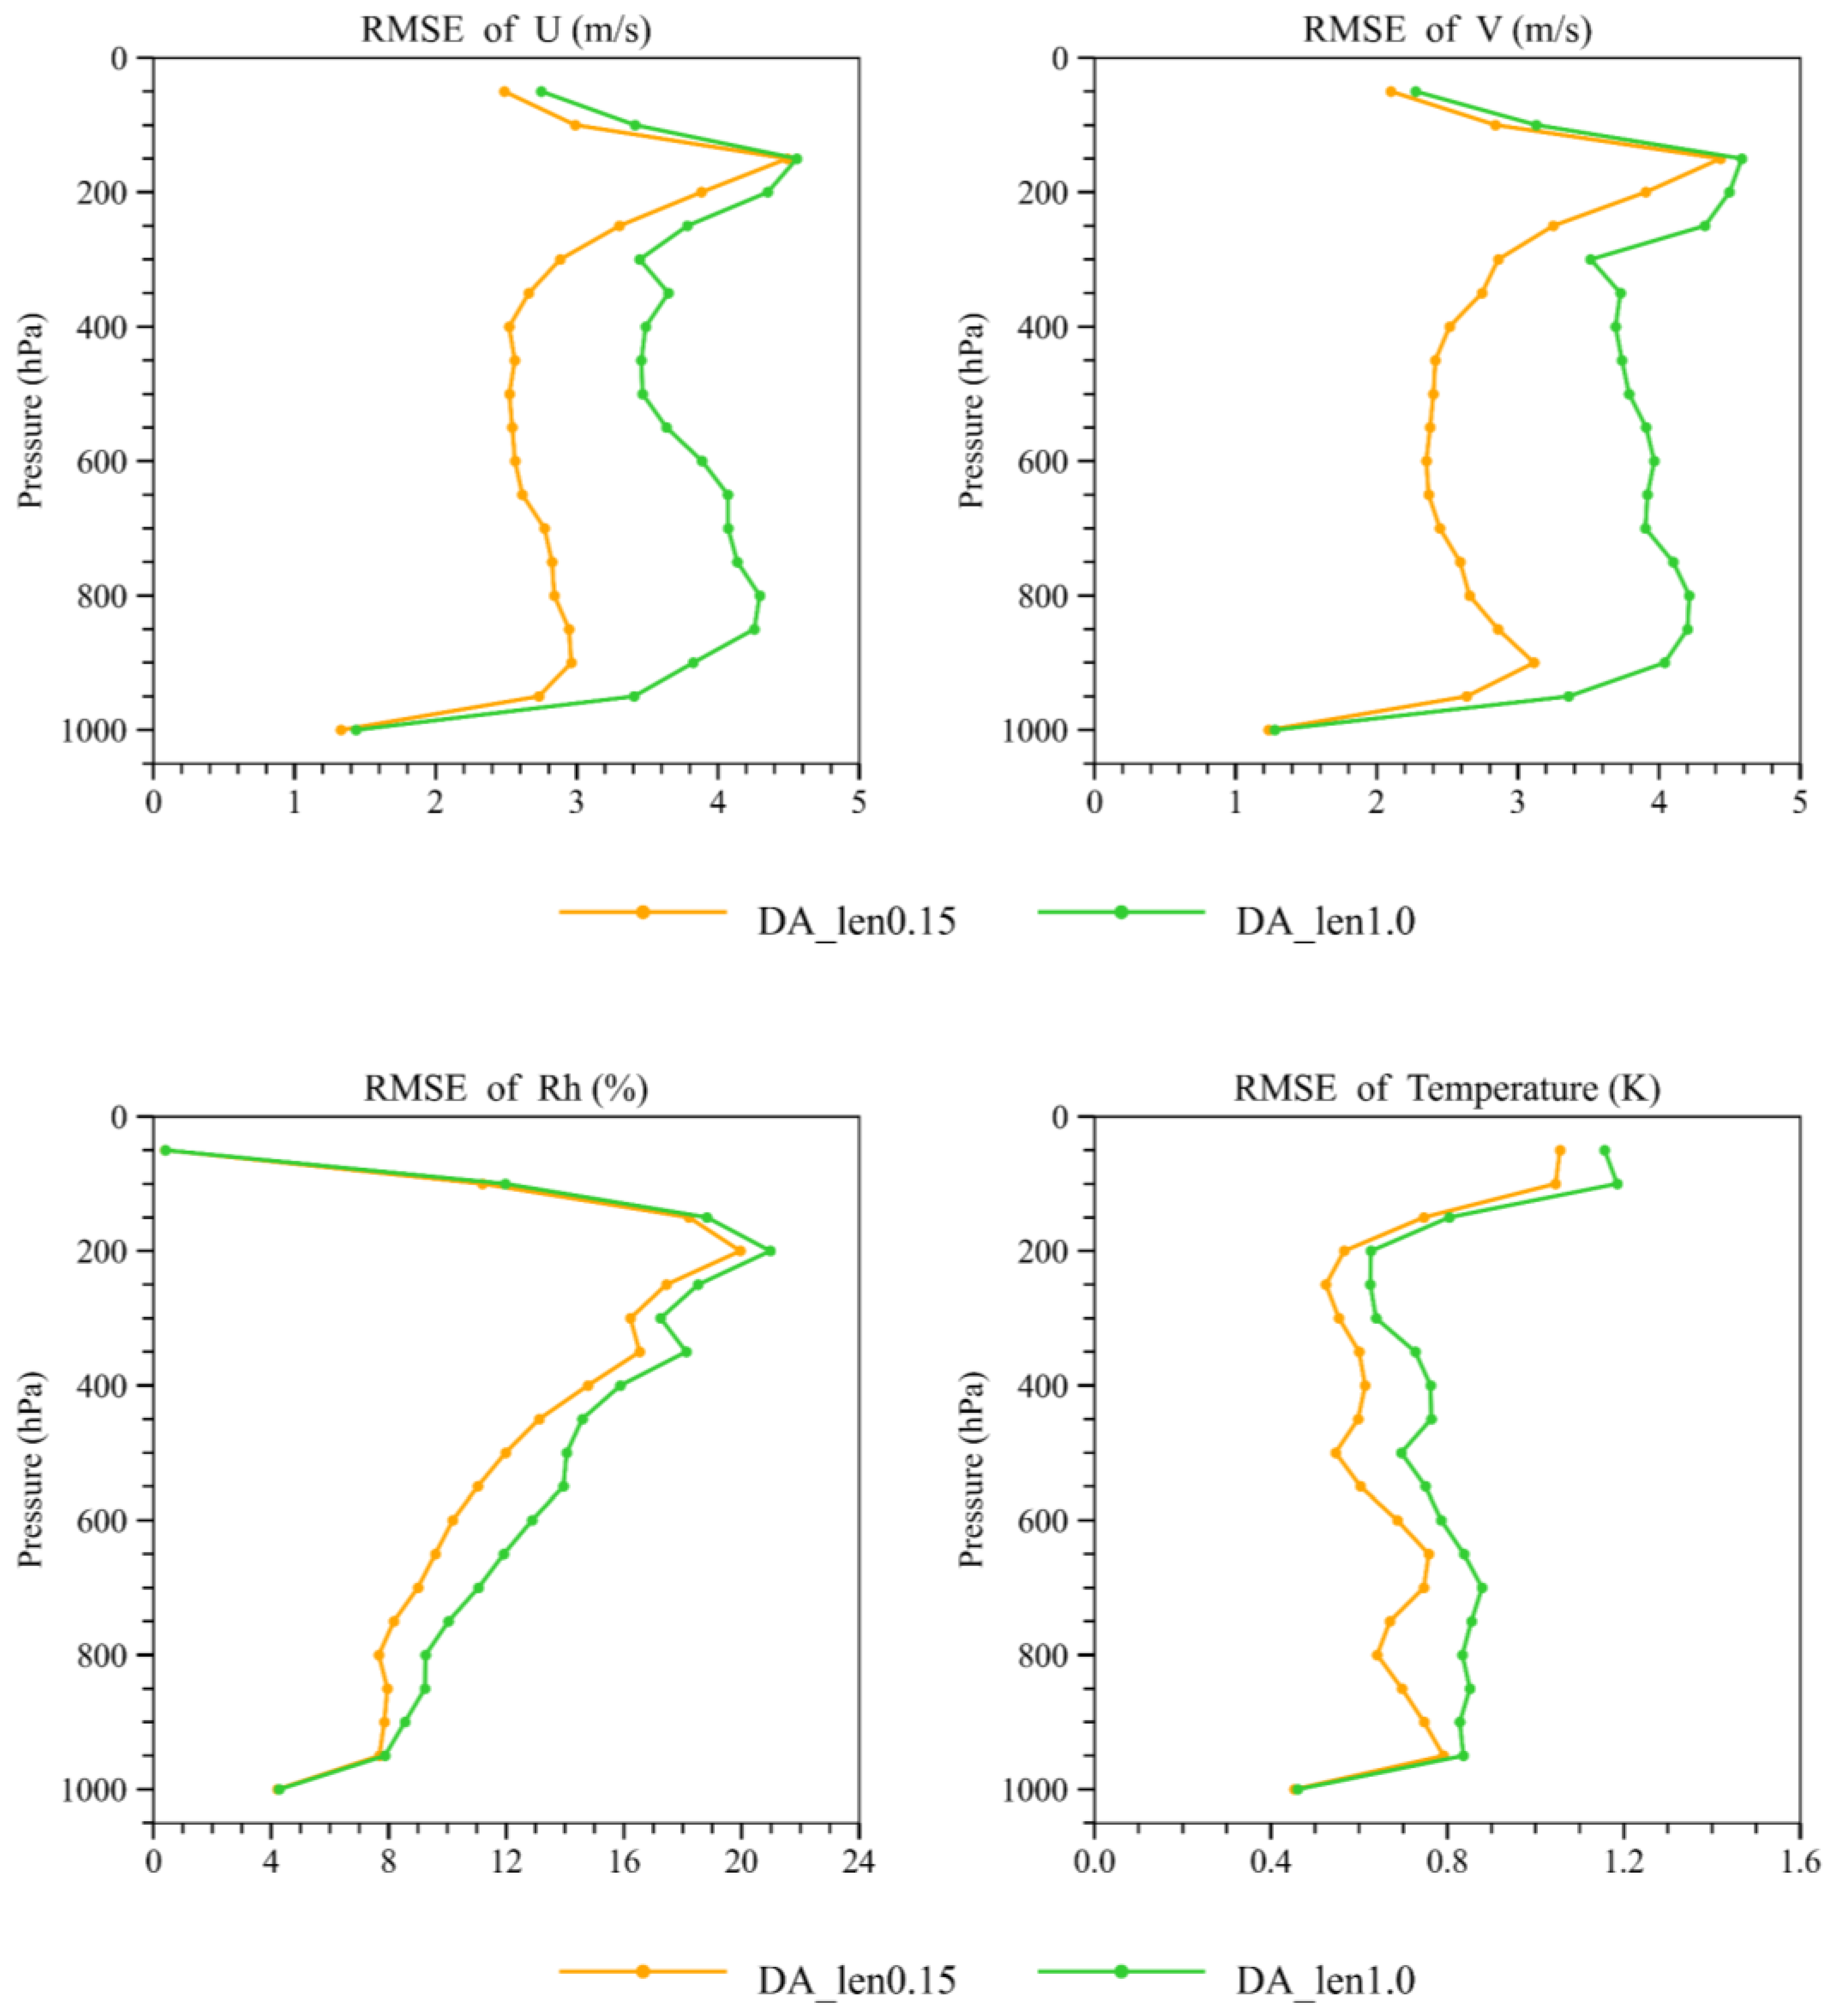
TC Environment Forecasts

Earlier in the article, we analyzed the impact of different length scale factors on assimilation and evaluated the forecast performances of different length scale factors for typhoons. In order to visually display the overall effect of length scale factor tuning on forecasts, Figure 16 shows the mean RMSE vertical profile of the predicted wind, relative humidity, and temperature. The predicted fields are verified against the ERA5 data. For wind fields, the RMSEs of DA_len0.15 are smaller than that of DA_len1.0 in the whole vertical layers of the model, especially from 300 hPa to 925 hPa. For relative humidity, DA_len0.15 has a better effect in the middle and low layers (450~850 hPa), and the averaged RMSE is reduced by about 2% compared with DA_len1.0. Similarly, at approximately 400 hPa and 800 hPa, the temperature RMSEs of DA_len0.15 are significantly small than those of DA_len1.0. As a result of reducing the length scale factor, the averaged errors of primary forecast variables within the model space are also reduced, probably due to the improved TC analysis.

5. Discussion

In this study, the case of Super Typhoon Lekima (2019) is selected to investigate the impact of radar RV assimilation with different background error length scales on landfalling TC by the WRF-3DVAR system. Firstly, two single observation tests were carried out. The analysis results and forecast performances of the three experiments with different configurations were further discussed in detail, and the prediction results were verified with multiple credible data.
The results from two single observation tests show that the smaller length scale factor can constrain the spread of radar observations information within a relatively reasonable range. Correspondingly, the position and structure of the near-land typhoon are found to be significantly affected by the length scale tuning. During the five DA cycles, the configuration with a smaller length scale can significantly enhance the typhoon and maintain a smaller wind field error, which ultimately leads to a more accurate and stronger 3D typhoon vortex with a dynamic and thermal balance.
The three experiments show great differences in the landfalling typhoon forecast due to the different initial vortices. The averaged track error for the 24-h forecast generated by the larger length scale configuration is greater than the control run. This phenomenon may be attributed to the excessive expansion of the wind increment range by the larger length scale, resulting in insufficient adjustments to the wind and mass fields during the DA cycles, which further diminishes the accuracy of forecasts. Conversely, the experiment with a smaller length scale reduces the averaged track error to less than 20 km and may capture the trend of typhoon intensity change more accurately. During the landfall of the typhoon, it represents a more complete and clearer eyewall and typhoon vortex. Moreover, the spiral rainband pattern, the distribution of heavy rainfall, and the intensity of precipitation centers are also refined to align more closely with the observations. Nevertheless, some overpredicted convections can be easily observed in these experiments, especially in the areas with reflectivity above 45 dBZ, which is likely related to the WSM6 scheme used. Similar phenomena are also present in some TCs studies that adopted the same microphysics scheme [57,58].
The ETS and performance diagrams are used to evaluate the quantitative precipitation forecasts. Within six hours of typhoon landfall, the smaller length scale gains a higher CSI, and its averaged ETSs of 1-h accumulated precipitation for the 5 mm, 10 mm, and 15 mm thresholds are 0.27, 0.14, and 0.07, respectively. It also leads to better performance for the 24-h forecast with the ETSs greater than 0.4 for the threshold from 1 to 100 mm and not less than 0.2 until the threshold increases to 240 mm. It is worth noting that although the assimilation with a larger length scale seems to not improve the distribution of rainfall, it is slightly more accurate than no assimilation at the precipitation thresholds above heavy precipitation.
In the present study, reducing the length scale decreases the errors of the main forecast variables. It can be reasonably inferred that the leading prediction performances caused by the smaller length scale factor are probably due to the overall improvement of the TC analysis.

6. Conclusions

In general, this study illustrates that the WRF-3DVAR system is able to effectively assimilate radar RV data to produce relatively accurate forecasts for Super Typhoon Lekima. The reduced length scale is conducive to constraining the correlation range of background error, enabling the reasonable propagation of meso- and small-scale observation information, and then generating a more accurate analysis field. As the cause of the improved forecasts, the advanced analysis provides an appropriate initial condition with a dynamic and thermal balance in terms of the simulation of typhoons’ intensity, track, and structural evolution. In the future, it is necessary to verify the radar velocity data assimilation techniques in more Super atypical typhoon cases. Moreover, assimilating the reflectivity or polarimetric variables is also planned in terms of adopting the advanced cloud analysis technology with more objective background error parameterization algorithms.

Author Contributions

Conceptualization, D.X.; writing—original draft, J.C. and D.X.; writing—review & editing, D.X. and L.S.; formal analysis; A.S. and L.S.; data curation, J.C. and A.S. All authors have read and agreed to the published version of the manuscript.

Funding

This research was funded by the Chinese National Natural Science Foundation of China (G42192553), National Natural Science Foundation of China (U2242212), Program of Shanghai Academic/Technology Research Leader (21XD1404500), the Shanghai Typhoon Research Foundation (TFJJ202107), the Chinese National Natural Science Foundation of China (G41805016), the research project of Heavy Rain and Drought-Flood Disasters in Plateau and Basin Key Laboratory of Sichuan Province in China (SZKT201901), the research project of the Institute of Atmospheric Environment, China Meteorological Administration, Shenyang in China (2020SYIAE02).

Data Availability Statement

The data from the S-band Doppler weather radar in Wenzhou is available from the Chinese Meteorological Administration (CMA) upon request. The conventional observations are from the National Centers for Environmental Prediction (NCEP) operational Global Telecommunication System (GTS) (http://rda.ucar.edu/datasets/ds337.0/, accessed on 4 April 2023). The near real-time precipitations data of the CMA Land Data Assimilation system can be downloaded from the China Meteorological Data Service Centre website (https://data.cma.cn/data/detail/dataCode/NAFP_CLDAS2.0_NRT.html, accessed on 4 April 2023). Part of the software is associated with the National Center for Atmospheric Research (NCAR) using the version 4.1 of WRF and WRF-3DVAR system. The reanalysis data used for the model runs is available at the ERA5 website (https://cds.climate.copernicus.eu/cdsapp#!/search?text=ERA5, accessed on 4 April 2023). Figures were made with Python version 3.8 from https://www.python.org, accessed on 4 April 2023.

Acknowledgments

We acknowledge the High Performance Computing Center of Nanjing University of Information Science & Technology for their support of this work.

Conflicts of Interest

The authors declare no conflict of interest.

References

  1. Li, L.; Chakraborty, P. Slower decay of landfalling hurricanes in a warming world. Nature 2020, 587, 230–234. [Google Scholar] [CrossRef] [PubMed]
  2. Knutson, T.; Camargo, S.J.; Chan, J.C.L.; Emanuel, K.; Ho, C.-H.; Kossin, J.; Mohapatra, M.; Satoh, M.; Sugi, M.; Walsh, K.; et al. Tropical Cyclones and Climate Change Assessment: Part II: Projected Response to Anthropogenic Warming. Bull. Am. Meteorol. Soc. 2020, 101, E303–E322. [Google Scholar] [CrossRef]
  3. Elsberry, R.L. Advances in research and forecasting of tropical cyclones from 1963–2013. Asia-Pac. J. Atmos. Sci. 2014, 50, 3–16. [Google Scholar] [CrossRef]
  4. Emanuel, K. 100 Years of Progress in Tropical Cyclone Research. Meteorol. Monogr. 2018, 59, 15.1–15.68. [Google Scholar] [CrossRef]
  5. Cangialosi, J.P.; Blake, E.; DeMaria, M.; Penny, A.; Latto, A.; Rappaport, E.; Tallapragada, V. Recent Progress in Tropical Cyclone Intensity Forecasting at the National Hurricane Center. Weather Forecast. 2020, 35, 1913–1922. [Google Scholar] [CrossRef]
  6. Leroux, M.-D.; Wood, K.; Elsberry, R.L.; Cayanan, E.O.; Hendricks, E.; Kucas, M.; Otto, P.; Rogers, R.; Sampson, B.; Yu, Z. Recent Advances in Research and Forecasting of Tropical Cyclone Track, Intensity, and Structure at Landfall. Trop. Cyclone Res. Rev. 2018, 7, 85–105. [Google Scholar] [CrossRef]
  7. Rappin, E.D.; Nolan, D.S.; Majumdar, S.J. A Highly Configurable Vortex Initialization Method for Tropical Cyclones. Mon. Weather Rev. 2013, 141, 3556–3575. [Google Scholar] [CrossRef]
  8. Huang, C.-Y.; Lin, J.-Y.; Skamarock, W.C.; Chen, S.-Y. Typhoon Forecasts with Dynamic Vortex Initialization Using an Unstructured Mesh Global Model. Mon. Weather Rev. 2022, 150, 3011–3030. [Google Scholar] [CrossRef]
  9. Xu, D.; Zhang, X.; Li, H.; Wu, H.; Shen, F.; Shu, A.; Wang, Y.; Zhuang, X. Evaluation of the Simulation of Typhoon Lekima (2019) Based on Different Physical Parameterization Schemes and FY-3D Satellite’s MWHS-2 Data Assimilation. Remote Sens. 2021, 13, 4556. [Google Scholar] [CrossRef]
  10. Zhang, Y.; Sieron, S.B.; Lu, Y.; Chen, X.; Nystrom, R.G.; Minamide, M.; Chan, M.Y.; Hartman, C.M.; Yao, Z.; Ruppert, J.H.; et al. Ensemble-Based Assimilation of Satellite All-Sky Microwave Radiances Improves Intensity and Rainfall Predictions for Hurricane Harvey (2017). Geophys. Res. Lett. 2021, 48, e2021GL096410. [Google Scholar] [CrossRef]
  11. Li, J.; Geer, A.J.; Okamoto, K.; Otkin, J.A.; Liu, Z.; Han, W.; Wang, P. Satellite All-sky Infrared Radiance Assimilation: Recent Progress and Future Perspectives. Adv. Atmos. Sci. 2022, 39, 9–21. [Google Scholar] [CrossRef]
  12. Zhang, F.; Weng, Y.; Sippel, J.A.; Meng, Z.; Bishop, C.H. Cloud-Resolving Hurricane Initialization and Prediction through Assimilation of Doppler Radar Observations with an Ensemble Kalman Filter. Mon. Weather Rev. 2009, 137, 2105–2125. [Google Scholar] [CrossRef]
  13. Zhu, L.; Wan, Q.; Shen, X.; Meng, Z.; Zhang, F.; Weng, Y.; Sippel, J.; Gao, Y.; Zhang, Y.; Yue, J. Prediction and Predictability of High-Impact Western Pacific Landfalling Tropical Cyclone Vicente (2012) through Convection-Permitting Ensemble Assimilation of Doppler Radar Velocity. Mon. Weather Rev. 2016, 144, 21–43. [Google Scholar] [CrossRef]
  14. Yue, J.; Meng, Z.; Yu, C.-K.; Cheng, L.-W. Impact of coastal radar observability on the forecast of the track and rainfall of Typhoon Morakot (2009) using WRF-based ensemble Kalman filter data assimilation. Adv. Atmos. Sci. 2017, 34, 66–78. [Google Scholar] [CrossRef]
  15. Luo, J.; Li, H.; Xue, M.; Zhu, Y. Direct Assimilation of Radar Reflectivity Data Using Ensemble Kalman Filter Based on a Two-Moment Microphysics Scheme for the Analysis and Forecast of Typhoon Lekima (2019). Remote Sens. 2022, 14, 3987. [Google Scholar] [CrossRef]
  16. Whitaker, J.S.; Hamill, T.M. Ensemble Data Assimilation without Perturbed Observations. Mon. Weather Rev. 2002, 130, 1913–1924. [Google Scholar] [CrossRef]
  17. Houtekamer, P.L.; Zhang, F. Review of the Ensemble Kalman Filter for Atmospheric Data Assimilation. Mon. Weather Rev. 2016, 144, 4489–4532. [Google Scholar] [CrossRef]
  18. Shen, F.; Min, J.; Xu, D. Assimilation of radar radial velocity data with the WRF Hybrid ETKF–3DVAR system for the prediction of Hurricane Ike (2008). Atmos. Res. 2016, 169, 127–138. [Google Scholar] [CrossRef]
  19. Shen, F.; Xu, D.; Min, J. Effect of momentum control variables on assimilating radar observations for the analysis and forecast for Typhoon Chanthu (2010). Atmos. Res. 2019, 230, 104622. [Google Scholar] [CrossRef]
  20. Xu, D.; Shen, F.; Min, J. Effect of Adding Hydrometeor Mixing Ratios Control Variables on Assimilating Radar Observations for the Analysis and Forecast of a Typhoon. Atmosphere 2019, 10, 415. [Google Scholar] [CrossRef]
  21. Bao, X.; Wu, D.; Lei, X.; Ma, L.; Wang, D.; Zhao, K.; Jou, B.J.-D. Improving the extreme rainfall forecast of Typhoon Morakot (2009) by assimilating radar data from Taiwan Island and mainland China. J. Meteorol. Res. 2017, 31, 747–766. [Google Scholar] [CrossRef]
  22. Xue, M.; Droegemeier, K.K.; Wong, V. The Advanced Regional Prediction System (ARPS)—A multi-scale nonhydrostatic atmospheric simulation and prediction model. Part I: Model dynamics and verification. Meteorol. Atmos. Phys. 2000, 75, 161–193. [Google Scholar] [CrossRef]
  23. Xue, M.; Wang, D.; Gao, J.; Brewster, K.; Droegemeier, K.K. The Advanced Regional Prediction System (ARPS), storm-scale numerical weather prediction and data assimilation. Meteorol. Atmos. Phys. 2003, 82, 139–170. [Google Scholar] [CrossRef]
  24. Albers, S.C.; McGinley, J.A.; Birkenheuer, D.L.; Smart, J.R. The Local Analysis and Prediction System (LAPS): Analyses of Clouds, Precipitation, and Temperature. Weather Forecast. 1996, 11, 273–287. [Google Scholar] [CrossRef]
  25. Hu, M.; Xue, M.; Gao, J.; Brewster, K. 3DVAR and Cloud Analysis with WSR-88D Level-II Data for the Prediction of the Fort Worth, Texas, Tornadic Thunderstorms. Part I: Cloud Analysis and Its Impact. Mon. Weather Rev. 2006, 134, 675–698. [Google Scholar] [CrossRef]
  26. Parrish, D.F.; Derber, J.C. The National Meteorological Center’s Spectral Statistical-Interpolation Analysis System. Mon. Weather Rev. 1992, 120, 1747–1763. [Google Scholar] [CrossRef]
  27. Sun, J.; Wang, H.; Tong, W.; Zhang, Y.; Lin, C.; Xu, D. Comparison of the Impacts of Momentum Control Variables on High-Resolution Variational Data Assimilation and Precipitation Forecasting. Mon. Weather Rev. 2016, 144, 149–169. [Google Scholar] [CrossRef]
  28. Lee, J.-H.; Lee, H.-H.; Choi, Y.; Kim, H.-W.; Lee, D.-K. Radar data assimilation for the simulation of mesoscale convective systems. Adv. Atmos. Sci. 2010, 27, 1025–1042. [Google Scholar] [CrossRef]
  29. Choi, Y.; Cha, D.-H.; Kim, J. Tuning of length-scale and observation-error for radar data assimilation using four dimensional variational (4D-Var) method: Length-scale and observation-error tuning for radar data assimilation. Atmos. Sci. Lett. 2017, 18, 441–448. [Google Scholar] [CrossRef]
  30. Xu, D.; Shen, F.; Min, J. Effect of background error tuning on assimilating radar radial velocity observations for the forecast of hurricane tracks and intensities. Meteorol. Appl. 2020, 27, e1820. [Google Scholar] [CrossRef]
  31. Kong, R.; Xue, M.; Liu, C. Development of a Hybrid En3DVar Data Assimilation System and Comparisons with 3DVar and EnKF for Radar Data Assimilation with Observing System Simulation Experiments. Mon. Weather Rev. 2018, 146, 175–198. [Google Scholar] [CrossRef]
  32. Liu, T.; Duan, Y.; Feng, J.; Wang, H. Characteristics and Mechanisms of Long-lived Concentric Eyewalls in Typhoon Lekima in 2019. J. Appl. Meteorol. Sci. 2021, 32, 289. [Google Scholar] [CrossRef]
  33. Dai, H.; Zhao, K.; Li, Q.; Lee, W.C.; Ming, J.; Zhou, A.; Fan, X.; Yang, Z.; Zheng, F.; Duan, Y. Quasi-Periodic Intensification of Convective Asymmetries in the Outer Eyewall of Typhoon Lekima (2019). Geophys. Res. Lett. 2021, 48, e2020GL091633. [Google Scholar] [CrossRef]
  34. Bao, X.; Zhang, S.; Liang, Y. Microphysical Differences in the Concentric Eyewalls of Typhoon Lekima (2019). Geophys. Res. Lett. 2022, 49, e2022GL100579. [Google Scholar] [CrossRef]
  35. Sun, J.; Crook, N.A. Dynamical and Microphysical Retrieval from Doppler Radar Observations Using a Cloud Model and Its Adjoint. Part I: Model Development and Simulated Data Experiments. J. Atmos. Sci. 1997, 54, 1642–1661. [Google Scholar] [CrossRef]
  36. Helmus, J.J.; Collis, S.M. The Python ARM Radar Toolkit (Py-ART), a Library for Working with Weather Radar Data in the Python Programming Language. J. Open Res. Softw. 2016, 4, 25. [Google Scholar] [CrossRef]
  37. Xiao, Q.; Zhang, X.; Davis, C.; Tuttle, J.; Holland, G.; Fitzpatrick, P.J. Experiments of Hurricane Initialization with Airborne Doppler Radar Data for the Advanced Research Hurricane WRF (AHW) Model. Mon. Weather Rev. 2009, 137, 2758–2777. [Google Scholar] [CrossRef]
  38. Xu, Q.; Nai, K.; Wei, L.; Lu, H.; Zhang, P.; Liu, S.; Parris, D. Estimating radar wind observation error and NCEP WRF background wind error covariances from radar radial-velocity innovations. In Proceedings of the 18th Conference on Numerical Weather Prediction, Park City, UT, USA, 25–29 June 2007; Available online: http://ams.confex.com/ams/pdfpapers/123419.pdf (accessed on 4 April 2023).
  39. Courtier, P.; Thépaut, J.-N.; Hollingsworth, A. A strategy for operational implementation of 4D-Var, using an incremental approach. Q. J. R. Meteorol. Soc. 1994, 120, 1367–1387. [Google Scholar] [CrossRef]
  40. Barker, D.M.; Huang, W.; Guo, Y.-R.; Bourgeois, A.J.; Xiao, Q.N. A Three-Dimensional Variational Data Assimilation System for MM5: Implementation and Initial Results. Mon. Weather Rev. 2004, 132, 897–914. [Google Scholar] [CrossRef]
  41. Purser, R.J.; Wu, W.-S.; Parrish, D.F.; Roberts, N.M. Numerical aspects of the application of recursive filters to variational statistical analysis. Part I: Spatially homogeneous and isotropic Gaussian covariances. Mon. Weather Rev. 2003, 131, 1524–1535. [Google Scholar] [CrossRef]
  42. He, B.; Yu, Z.; Tan, Y.; Shen, Y.; Chen, Y. Rainfall forecast errors in different landfall stages of Super Typhoon Lekima (2019). Front. Earth Sci. 2022, 16, 34–51. [Google Scholar] [CrossRef]
  43. Ying, M.; Zhang, W.; Yu, H.; Lu, X.; Feng, J.; Fan, Y.; Zhu, Y.; Chen, D. An Overview of the China Meteorological Administration Tropical Cyclone Database. J. Atmos. Ocean. Technol. 2014, 31, 287–301. [Google Scholar] [CrossRef]
  44. Lu, X.; Yu, H.; Ying, M.; Zhao, B.; Zhang, S.; Lin, L.; Bai, L.; Wan, R. Western North Pacific Tropical Cyclone Database Created by the China Meteorological Administration. Adv. Atmos. Sci. 2021, 38, 690–699. [Google Scholar] [CrossRef]
  45. Bai, L.; Tang, J.; Guo, R.; Zhang, S.; Liu, K. Quantifying interagency differences in intensity estimations of Super Typhoon Lekima (2019). Front. Earth Sci. 2022, 16, 5–16. [Google Scholar] [CrossRef]
  46. Hong, S.-Y.; Kim, J.-H.; Lim, J.-O.; Dudhia, J. The WRF single moment microphysics scheme (WSM). J. Korean Meteorol. Soc. 2006, 42, 129–151. [Google Scholar]
  47. Janjić, Z.I. The Step-Mountain Eta Coordinate Model: Further Developments of the Convection, Viscous Sublayer, and Turbulence Closure Schemes. Mon. Weather Rev. 1994, 122, 927–945. [Google Scholar] [CrossRef]
  48. Ek, M.B.; Mitchell, K.E.; Lin, Y.; Rogers, E.; Grunmann, P.; Koren, V.; Gayno, G.; Tarpley, J.D. Implementation of Noah land surface model advances in the National Centers for Environmental Prediction operational mesoscale Eta model. J. Geophys. Res. Atmos. 2003, 108, 2002JD003296. [Google Scholar] [CrossRef]
  49. Mlawer, E.J.; Taubman, S.J.; Brown, P.D.; Iacono, M.J.; Clough, S.A. Radiative transfer for inhomogeneous atmospheres: RRTM, a validated correlated-k model for the longwave. J. Geophys. Res. Atmos. 1997, 102, 16663–16682. [Google Scholar] [CrossRef]
  50. Dudhia, J. Numerical Study of Convection Observed during the Winter Monsoon Experiment Using a Mesoscale Two-Dimensional Model. J. Atmos. Sci. 1989, 46, 3077–3107. [Google Scholar] [CrossRef]
  51. Shen, F.; Xue, M.; Min, J. A comparison of limited-area 3DVAR and ETKF-En3DVAR data assimilation using radar observations at convective scale for the prediction of Typhoon Saomai (2006). Meteorol. Appl. 2017, 24, 628–641. [Google Scholar] [CrossRef]
  52. Dong, J.; Xue, M. Assimilation of radial velocity and reflectivity data from coastal WSR-88D radars using an ensemble Kalman filter for the analysis and forecast of landfalling hurricaneIke(2008). Q. J. R. Meteorol. Soc. 2013, 139, 467–487. [Google Scholar] [CrossRef]
  53. Zhao, K.; Xue, M. Assimilation of coastal Doppler radar data with the ARPS 3DVAR and cloud analysis for the prediction of Hurricane Ike (2008). Geophys. Res. Lett. 2009, 36. [Google Scholar] [CrossRef]
  54. Shi, D.; Chen, G. Double warm-core structure and potential vorticity diagnosis during the rapid intensification of Supertyphoon Lekima (2019). J. Atmos. Sci. 2021, 78, 2471–2492. [Google Scholar] [CrossRef]
  55. Roebber, P.J. Visualizing Multiple Measures of Forecast Quality. Weather Forecast. 2009, 24, 601–608. [Google Scholar] [CrossRef]
  56. Yu, Z.; Chen, Y.J.; Ebert, B.; Davidson, N.E.; Xiao, Y.; Yu, H.; Duan, Y. Benchmark rainfall verification of landfall tropical cyclone forecasts by operational ACCESS-TC over China. Meteorol. Appl. 2019, 27, e1842. [Google Scholar] [CrossRef]
  57. Ming, J.; Shu, S.; Wang, Y.; Tang, J.; Chen, B. Modeling Rapid Intensification of Typhoon Saomai (2006) with the Weather Research and Forecasting Model and Sensitivity to Cloud Microphysical Parameterizations. J. Meteorol. Soc. Japan. Ser. II 2012, 90, 771–789. [Google Scholar] [CrossRef]
  58. Matyas, C.J.; Zick, S.E.; Tang, J. Using an Object-Based Approach to Quantify the Spatial Structure of Reflectivity Regions in Hurricane Isabel (2003). Part I: Comparisons between Radar Observations and Model Simulations. Mon. Weather Rev. 2018, 146, 1319–1340. [Google Scholar] [CrossRef]
Figure 1. Wenzhou radar radial velocity (shaded, units: m/s) at the 0.5° elevation angle at 1000 UTC on 9 August 2019. (a) Raw observation. (b) Corrected data.
Remotesensing 15 02592 g001
Figure 2. Model domain and the CMA best track of Super Typhoon Lekima. The black triangle represents the position of the Wenzhou radar, and the black circle represents the radar radial velocity coverage.
Remotesensing 15 02592 g002
Figure 3. The flow chart of the experimental design.
Remotesensing 15 02592 g003
Figure 4. The U (a,b) and V (c,d) increments (shaded, units: m/s) from a single observation test at 700 hPa at 1000 UTC on 9 August 2019. (left) Length scale factor = 1.0, (right) length scale factor = 0.15.
Remotesensing 15 02592 g004
Figure 5. The analysis wind field (units: m/s) distribution at 700 Pa for the first DA cycle. (a) CNTL, (b) DA_len1.0, and (c) DA_len0.15.
Remotesensing 15 02592 g005
Figure 6. The increments of horizontal wind (quiver, units: m/s) and relative vorticity (shaded, units: 10−3 s−2) at 700 hPa for the first DA cycle. (a) DA_len1.0, (b) DA_len0.15. The green dot represents the location of the observed typhoon center.
Remotesensing 15 02592 g006
Figure 7. The variations of RV (units: m/s) and MSLP (units: hPa) during the five DA cycles. (a) The RMSE of RV, and (b) MSLP.
Remotesensing 15 02592 g007
Figure 8. The sea level pressure (contours) and 10 m wind field (white quiver, units: m/s) at the last DA cycle. (a) CNTL, (b) DA_len1.0, and (c) DA_len0.15. The black dot represents the observed typhoon center, while the red dot represents the simulated typhoon center; the distance between the two is shown in the lower-left corner of each figure.
Remotesensing 15 02592 g008
Figure 9. The northeast-southwest vertical cross-section of the potential temperature (contours, units: K) and the horizontal wind speed (shaded, units: m/s) across the analyzed typhoon center at the last DA cycle. (a) CNTL, (b) DA_len1.0, and (c) DA_len0.15.
Remotesensing 15 02592 g009
Figure 10. Azimuthal averaged horizontal temperature anomalies (contours, units: K) and tangential wind speed (shaded, units: m/s) at the last DA cycle. (a) CNTL, (b) DA_len1.0, and (c) DA_len0.15.
Remotesensing 15 02592 g010
Figure 11. 24-h deterministic forecasts of (a) typhoon tracks, (b) track errors (units: km), (c) Maximum surface wind speed (units: m/s), and (d) Minimum sea level pressure (units: hPa).
Remotesensing 15 02592 g011
Figure 12. The observed composite reflectivity and the predicted maximum reflectivity at 1200 UTC (ad), 1500 UTC (eh), and 1800 UTC (il). From left to right, the first column are observations, and the other three columns are forecasts from CNTL, DA_len1.0, and DA_len0.15, respectively.
Remotesensing 15 02592 g012
Figure 13. The distribution of the 6-h accumulated precipitation from 1200 UTC 9 to 1800 UTC 9 (ad), 1800 UTC 9 to 2400 UTC 9 (eh), 2400 UTC 9 to 0600 UTC 10 (il). The first column are observations, and the 2nd, 3rd, and 4th column are from CNTL, DA_len1.0, and DA_len0.15, respectively.
Remotesensing 15 02592 g013
Figure 14. The ETSs (ac) and performance diagrams (df) of hourly accumulated precipitation from 1800 UTC 9 August to 2400 UTC 9 August. The thresholds are 5 mm, 10 mm, and 15 mm from left to right. In the performance diagrams, the dots marked with the sequence number represent the results of the corresponding time interval.
Remotesensing 15 02592 g014
Figure 15. The ETSs of accumulated precipitation for the 24-h forecast.
Remotesensing 15 02592 g015
Figure 16. The mean RMSE vertical profile of the 24-h forecast for wind, relative humidity, and temperature. The ERA5 data are valid at the same time as DA experiments are used for verification.
Remotesensing 15 02592 g016
Table 1. List of experiments.
NumberExperimentAssimilated DataLength Scale
1CNTLN/AN/A
2DA_len1.0Conventional observations and radial velocity1.0
3DA_len0.15Conventional observations and radial velocity0.15
Disclaimer/Publisher’s Note: The statements, opinions and data contained in all publications are solely those of the individual author(s) and contributor(s) and not of MDPI and/or the editor(s). MDPI and/or the editor(s) disclaim responsibility for any injury to people or property resulting from any ideas, methods, instructions or products referred to in the content.

