Article

Mapping Waterlogging Damage to Winter Wheat Yield Using Downscaling–Merging Satellite Daily Precipitation in the Middle and Lower Reaches of the Yangtze River

1
Department of Geography and Spatial Information Techniques, Ningbo University, Ningbo 315211, China
2
Zhejiang Carbon Neutral Innovation Institute, Zhejiang University of Technology, Hangzhou 310014, China
3
School of Automation, Hangzhou Dianzi University, Xiasha Higher Education Zone, Hangzhou 310018, China
4
Institute of Applied Remote Sensing and Information Technology, Zhejiang University, Hangzhou 310058, China
5
Key Laboratory of Agricultural Remote Sensing and Information Systems, Hangzhou 310058, China
*
Author to whom correspondence should be addressed.
Remote Sens. 2023, 15(10), 2573; https://doi.org/10.3390/rs15102573
Submission received: 20 March 2023 / Revised: 4 May 2023 / Accepted: 10 May 2023 / Published: 15 May 2023

Abstract

:
Excessive water and water deficit are two important factors that limit agricultural development worldwide. However, the impact of waterlogging on winter wheat yield on a large scale, compared with drought caused by water deficit, remains unclear. In this study, we assessed the waterlogging damage to winter wheat yield using the downscaled and fused TRMM 3B42 from 1998 to 2014. First, we downscaled the TRMM 3B42 with area-to-point kriging (APK) and fused it with rain gauge measurements using geographically weighted regression kriging (GWRK). Then, we calculated the accumulated number of rainy days (ARD) of different continuous rain processes (CRPs) with durations ranging from 5 to 15 days as a waterlogging indicator. A quadratic polynomial model was used to fit the yield change rate (YCR) and the waterlogging indicator, and the waterlogging levels (mild, moderate, and severe) based on the estimated YCR from the optimal model were determined. Our results showed that downscaling the TRMM 3B42 using APK improved the limited accuracy, while GWRK fusion significantly increased the precision of quantitative indicators, such as R (from 0.67 to 0.84), and the detectability of precipitation events, such as the probability of detection (POD) (from 0.60 to 0.78). Furthermore, we found that 67% of the variation in the YCR could be explained by the ARD of a CRP of 11 days, followed by the ARD of a CRP of 13 days (R2 of 0.65). During the typical wet growing season of 2001–2002, the percentages of mild, moderate, and severe waterlogged pixels were 5.72%, 2.00%, and 0.63%, respectively. Long time series waterlogging spatial mapping can clearly show the distribution and degree of waterlogging, providing a basis for policymakers to carry out waterlogging disaster prevention and mitigation strategies.

1. Introduction

Global warming is causing frequent extreme weather events, such as waterlogging/flooding, drought, and heatwaves, which have a significant impact on crop production [1,2,3,4]. However, most research has focused on the effect of drought [5,6,7], heatwaves [8], or extreme temperatures [9,10] on crop yield, while few studies pay attention to excessive precipitation [11,12]. Excessive rainfall has been shown to slow down the global economy [13,14] and lead to maize yield loss comparable to extreme drought in the United States [11]. Moreover, the impact of extreme wet events on spatial patterns of vegetation greenness is equivalent to that of extreme dry events [15]. The lack of quantitative research on the effect of excessive rainfall is a critical knowledge gap that may hinder our ability to understand and assess the influence of climate change on crops.
Waterlogging is a type of flood that arises from excessive rainfall and can significantly hinder crop growth and development by creating an oxygen-deficient, anaerobic environment. Research on waterlogging has mainly focused on greenhouse or field experiments to explore its impact on biomass [16], photosynthetic rates [17,18], and yield [19,20]. However, such local studies may not be applicable to other regions. It has been demonstrated that excessive rainfall is the key meteorological limiting factor for winter wheat yield in the middle and lower reaches of the Yangtze River [21]. Therefore, it is crucial to develop precipitation-based waterlogging mapping and yield loss assessment, particularly for winter wheat yield in this region.
There are two main methods for quantifying the impact of excessive precipitation on crop yield on a large scale: process-based crop models (PCMs) [11,22] and empirical models [2,15,21,23]. PCMs require many measurements to calibrate numerous parameters, and large-scale PCM simulation accuracy is difficult to guarantee due to the spatial heterogeneity among environmental variables. Empirical models involve exploring empirical relationships between yield reduction and climate extreme indices, such as the Palmer drought severity index (PDSI), standardized precipitation index (SPI), standardized precipitation evapotranspiration index (SPEI), and maximum precipitation in a five-day period [24], to estimate the impact of excessive rainfall on yield. Empirical models are straightforward and therefore widely used [7]. However, for large-scale comprehensive waterlogging mapping and crop yield loss assessment, two important gaps need to be addressed.
First, there is still a lack of effective precipitation indicators for waterlogging. Most commonly used precipitation indices are based on monthly, seasonal, or annual precipitation, which cannot meet the needs of waterlogging mapping and yield loss assessment, as continuous rainfall processes (CRPs) rarely last for a month or more. This results in insignificant “waterlogging signals” in such a low-time-resolution precipitation indicator, making it difficult to capture short-term precipitation extremes that could cause agrometeorological disasters [25,26]. In addition, harmful effects of waterlogging on crop yield may not only result from heavy rainfall in a short period, but also from prolonged rain, which would indicate a sunlight deficit [27,28]. This highlights the need for a finer-temporal-resolution precipitation indicator for accurate crop yield loss estimates due to waterlogging, especially in the middle and lower reaches of the Yangtze River.
Secondly, obtaining a precipitation dataset with high precision and simultaneously high spatial and temporal resolution is challenging. Presently, precipitation products either have low spatial or temporal resolution. Although many researchers have focused on downscaling low-spatial-resolution precipitation using multiple linear regression [29], univariate regression, and geographically weighted regression [30], most of these methods are based on monthly precipitation products [31,32]. Only a few studies have explored daily-scale precipitation downscaling for a short period [33,34]. Consequently, there is a need for long time series of finer-spatial–temporal-resolution precipitation datasets for waterlogging monitoring.
To address these knowledge gaps, this study proposed a waterlogging indicator based on the accumulated number of rainy days (ARD) of different CRPs in the winter wheat growing season and then used it to map the waterlogging damage from 1998 to 2014. Additionally, the relationship between the indicator and yield reduction was explored. The optimal estimation model of yield reduction was adopted to map the waterlogging damage to winter wheat from 1998 to 2014. More specifically, we first downscaled the TRMM 3B42 satellite precipitation product using area-to-point kriging (APK) and fused it with rain gauge measurements using geographically weighted regression. Then, the ARD was calculated, and its relationship with yield reduction was explored with a quadratic polynomial model. Moderate, mild, and severe waterlogging damage levels based on yield loss were determined, and the waterlogging damage map for the winter wheat growing season from 1998 to 2014 was obtained. Waterlogging mapping based on historical data could provide a basis for local disaster prevention and mitigation.

2. Study Area and Data Processing
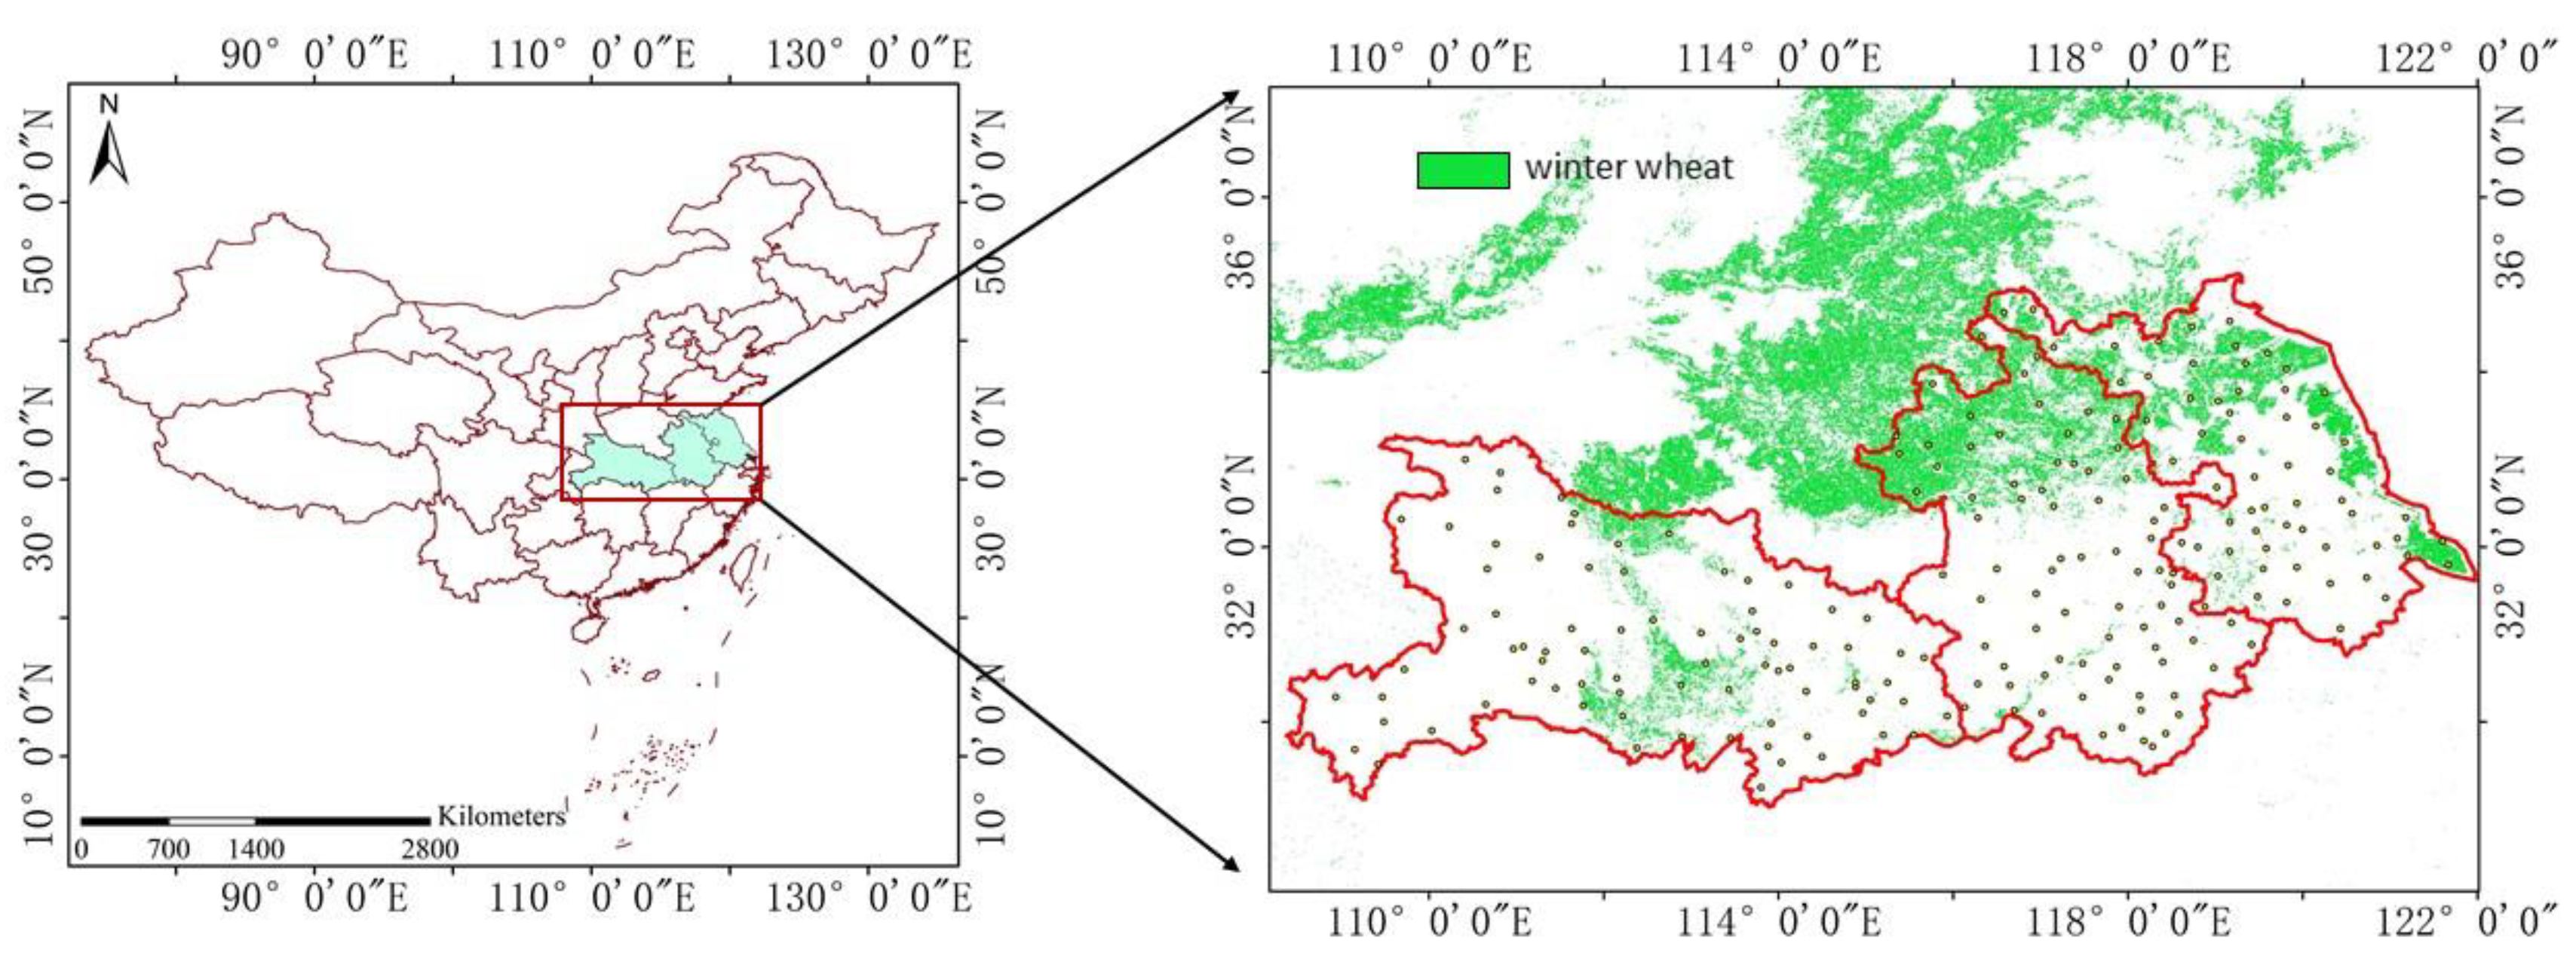
2.1. Study Area

The study area is located in the middle and lower reaches of the Yangtze River, including Jiangsu, Anhui, and Hubei Provinces (Figure 1), belonging to a subtropical and semi-humid monsoon climate and the warm temperate zone. Influenced by the monsoon climate, the annual precipitation is between 700 and 1600 mm, while the average annual temperature is between 13 and 18 °C. This region is an important breadbasket in China, where paddy rice–winter wheat and paddy rice–rape rotations are common planting patterns. Due to the low elevation, abundant precipitation, and numerous rivers, waterlogging is a common agricultural meteorological disaster (Figure A1 and Figure A2).

2.2. Data and Processing

2.2.1. Remote Sensing Data

(1)
TRMM 3B42
The Tropical Rainfall Measuring Mission (TRMM) was launched in 1997 and has provided critical precipitation measurements in the tropical and subtropical regions of our planet. It carried five sensors, including the Precipitation Radar (PR), TRMM Microwave Imager (TMI), Visible Infrared Scanner (VIRS), Clouds and the Earth’s Radiant Energy System (CERES), and Lightning Imaging Sensor (LSI). The TRMM 3B42 (version 7) product has a time resolution of 3 h and spatial resolution of 0.25°. The TRMM 3B42 was first downloaded and then transformed into daily precipitation from the rain rate. Data are available at: https://disc.gsfc.nasa.gov/datasets?keywords=TRMM_3b42&page=1, (accessed on 1 August 2022).
Waterlogging begins with excessive rainfall. In this study, we quantified the precipitation anomaly using the precipitation condition index (PCI, Equation (1)). Considering the temporal unevenness of the precipitation, we used a sliding window with a step size of one day to calculate the monthly-scale precipitation anomalies. The closer the value of the PCI is to 1, the wetter the conditions are. Meanwhile, the closer the value of the PCI is to 0, the drier the conditions are. In this study, a threshold of 0.5 was set, which means that the precipitation is starting to become excessive.
PCI = P P m i n P m a x P m i n
where P , P m a x , and P m i n are the precipitation of a pixel and its maximum and minimum values from the same period from 1998 to 2014, respectively.
(2)
Soil moisture data
If excessive precipitation cannot be drained, the corresponding soil moisture content will increase. Under such conditions, vegetation’s tolerance to unfavorable environments will prevent it from suddenly showing symptoms of waterlogging in a short period of time. In this study, the Global Land Data Assimilation System version 2 (GLDAS-2.0) Noah Land Surface Model L4 soil moisture product, which has a monthly time resolution and a spatial resolution of 0.25°, was adopted to define whether the soil is wet using the soil moisture condition index (SMCI, Equation (2)). We chose a threshold of 0.6 to indicate that the soil moisture has sensed a signal of excessive precipitation, which is the onset of waterlogging.
SMCI = S M S M m i n S M m a x   S M m i n
where SMCI , S M m i n , and S M m a x are the soil moisture of a pixel and its minimum and maximum values from the same month from 1998 to 2014, respectively.
(3)
AVHRR NDVI data
After a period of sustained high soil moisture, vegetation begins to exhibit symptoms such as wilting and loss of greenness. This can be represented using the normalized difference vegetation index (NDVI). The phenology of vegetation controls the changes in the NDVI in the growing season; therefore, in this study, we quantitatively represented whether vegetation exhibited signs of waterlogging damage using the vegetation condition index (VCI, Equation (3)). If the VCI begins to drop below 0.5 after the PCI exceeds 0.5 and the SMCI exceeds 0.6 at the same time, this indicates that vegetation has been affected by waterlogging. In this study, we used the Advanced Very-High-Resolution Radiometer (AVHRR) from the National Oceanic and Atmospheric Administration (NOAA) Center for Satellite Applications and Research. The AVHRR_NDVI product has a time resolution of one week and a spatial resolution of 4 km.
VCI = N D V I N D V I m i n N D V I m a x N D V I m i n
where VCI , V C I m i n , and V C I m a x are the NDVI of a pixel and its minimum and maximum values from the same week from 1998 to 2014, respectively.
(4)
Winter wheat map
The winter wheat classification product was adopted from [36]. Its spatial resolution is 30 m. A time-weighted dynamic time warping (TWDTW) method was proposed to extract winter wheat based on Sentinel and Landsat dataset. Its user and producer accuracies are 90.59% and 89.30%, respectively. The classification map only applies to 2016 to 2018, and the winter wheat mapping of 2016 was selected for the subsequent analysis. For more detailed information, please refer to [36].
(5)
DEM data
The DEM (digital elevation model) data were obtained from the Shuttle Radar Topography Mission (SRTM) project, which covered 60°S to 60°N. The data can be downloaded from http://srtm.csi.cgiar.org/srtmdata/, (accessed on 1 August 2019).

2.2.2. Statistics Datasets

(1)
Rain gauge data
A total of 203 rain gauge stations, operated by the Hubei Meteorological Information and Technology Support Center (HMITSC), Anhui Meteorological Information Center (AMIC), and Jiangsu Meteorological Information Center (JMIC), provided the daily precipitation from 1998 to 2014. Almost every county had one rain gauge station, and the county without rain gauge observations was excluded.
(2)
Winter wheat yield data
County-level winter wheat yield from 1978 to 2014 was also obtained from the HMITSC, AMIC, and JMIC. Because the yield and precipitation data are necessary for subsequent analysis, only the samples with both were used in this study. There were 76, 67, and 60 stations (counties) in Anhui, Hubei, and Jiangsu, respectively. More information is presented in Table 1.

3. Method

This study began by downscaling the long-term TRMM 3B42 precipitation product using APK to achieve fine-spatial-resolution precipitation estimates. The downscaled precipitation estimate was then combined with station-based rain gauge measurements and other auxiliary variables to obtain a more precise and accurate precipitation estimate. Based on the fused precipitation, the ARD of different CRPs was proposed as an indicator of waterlogging, and its impact on winter wheat yield reduction was quantified using a polynomial model. The optimal model between the ARD of CRPs and yield reduction was then used to create a spatial map of the waterlogging distribution. The waterlogged area and corresponding damage level were obtained for each growing season from 1998 to 2014. The overall framework is shown in Figure 2.

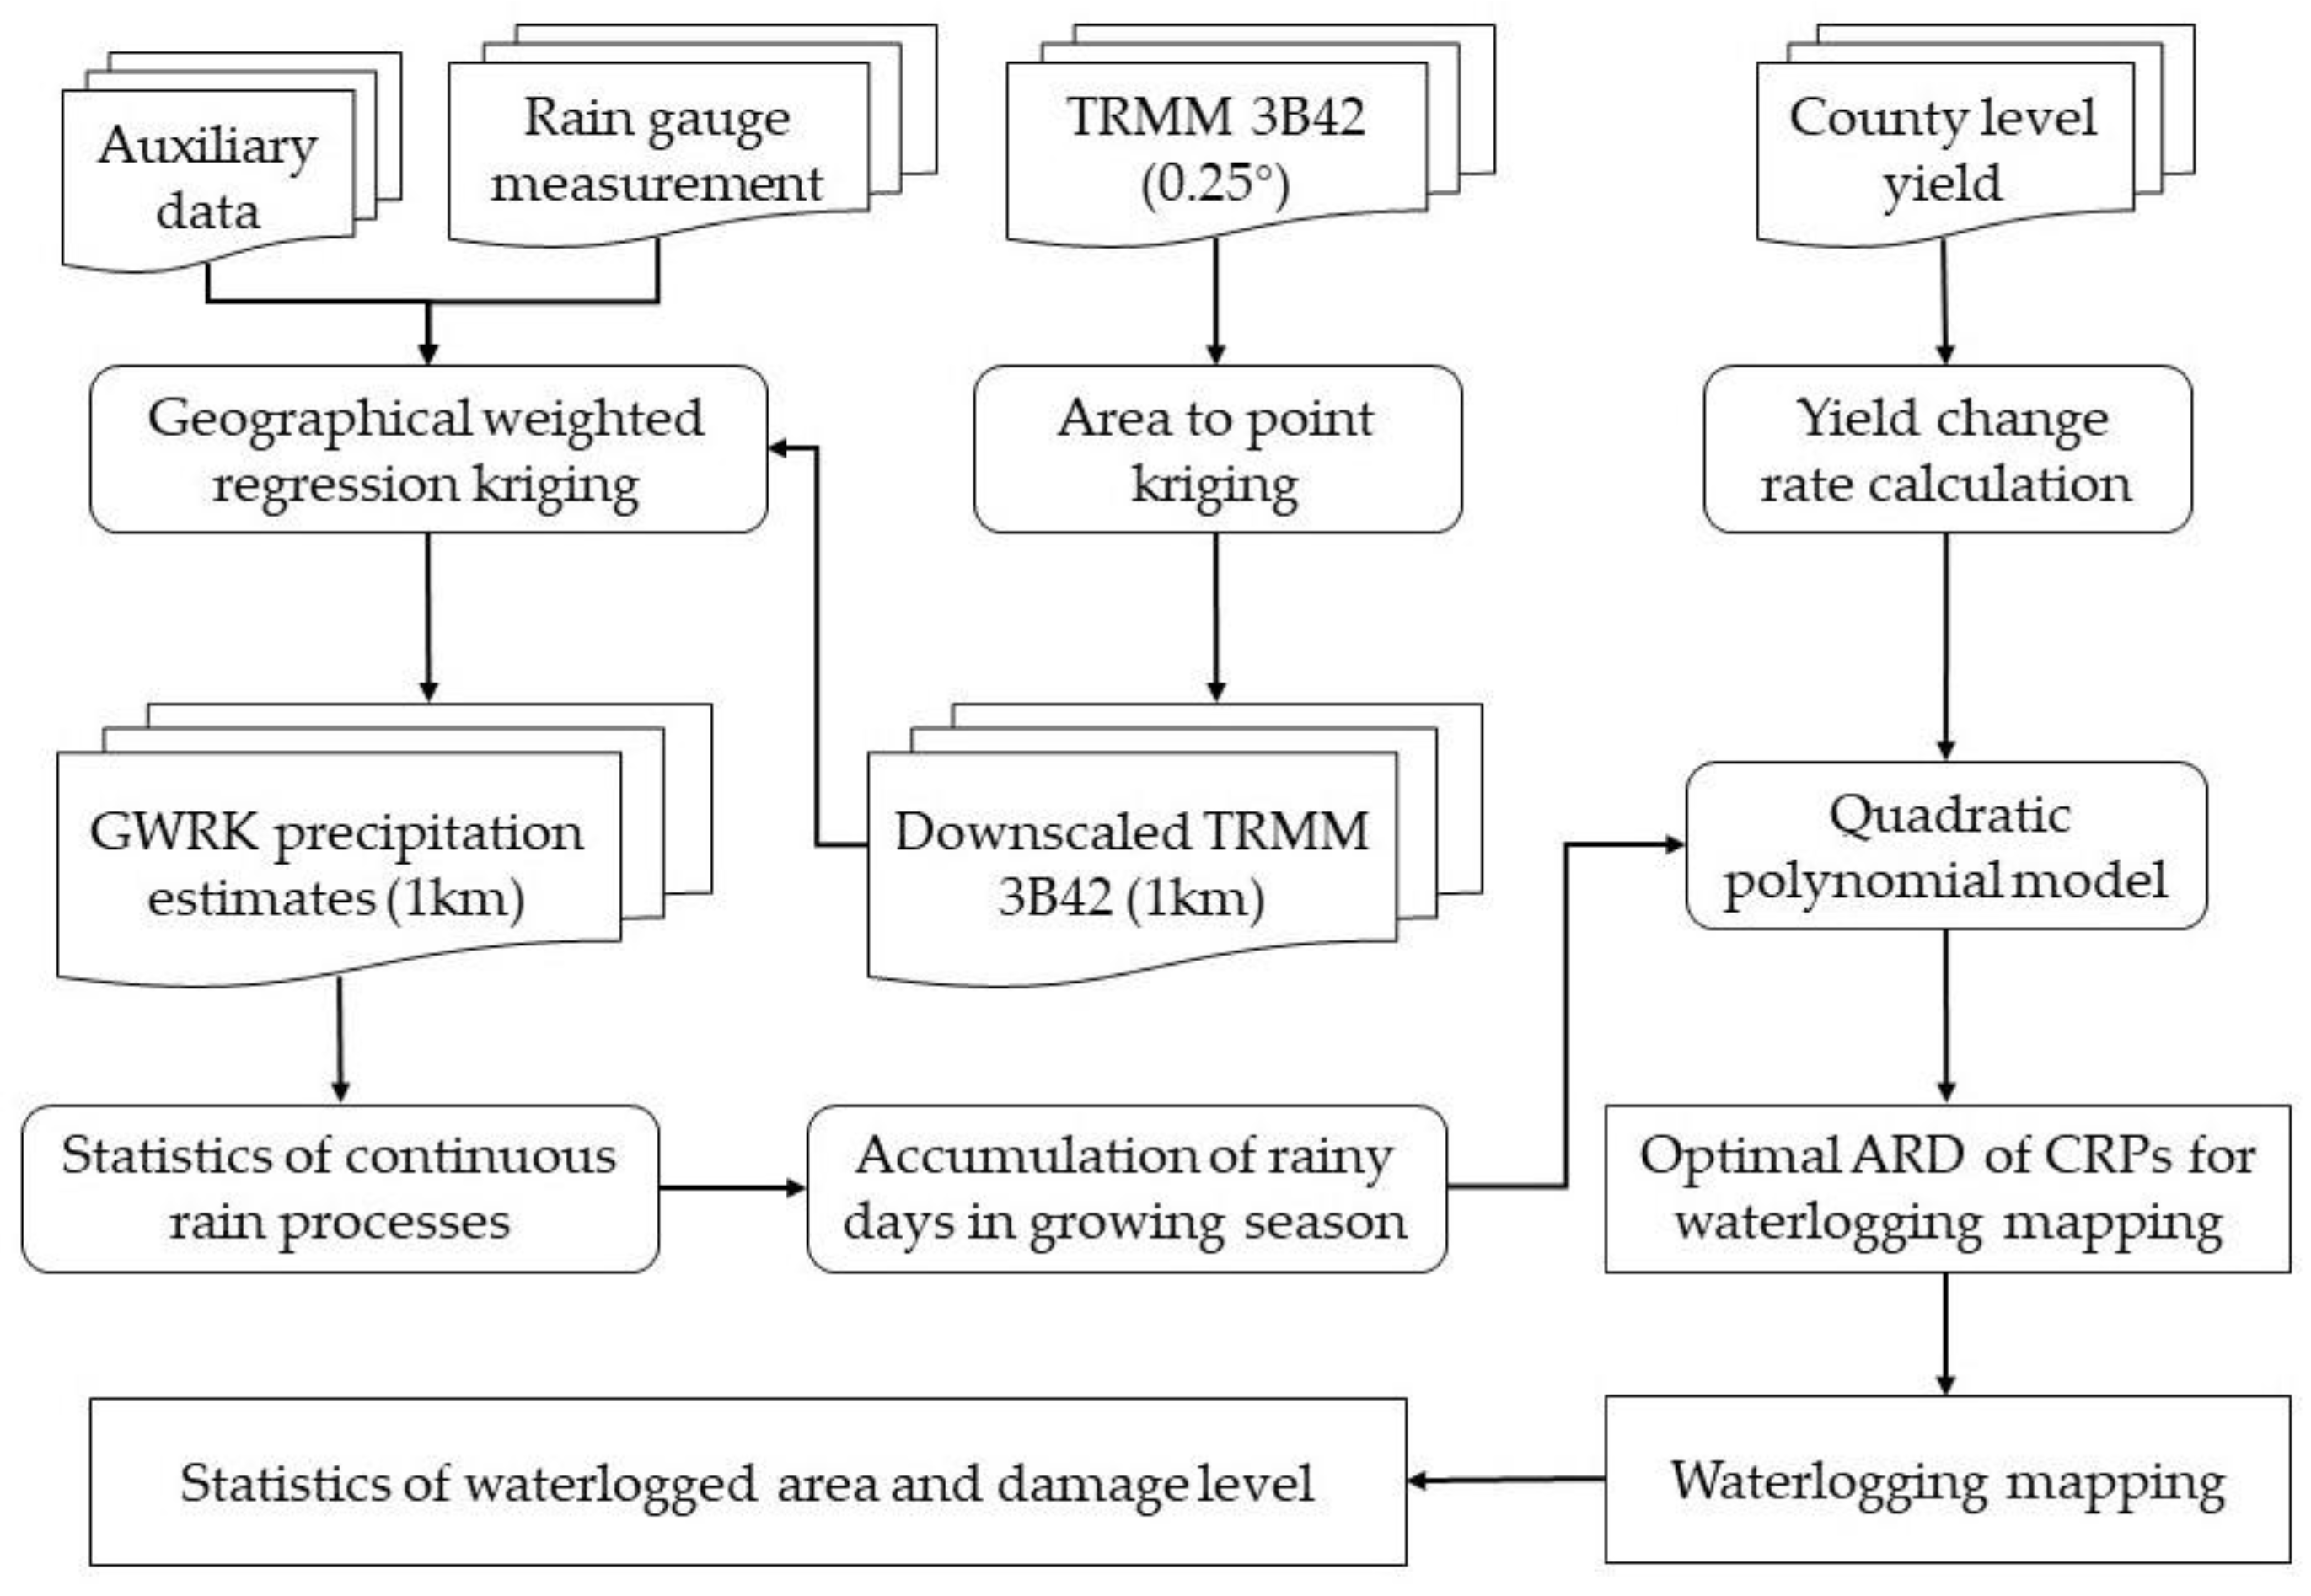
3.1. Precipitation Downscaling and Fusion

Each TRMM 3B42 pixel covers hundreds of square kilometers, while the rain gauge measurements provide point-scale observations. To address this issue, the TRMM 3B42 was downscaled first from 0.25° to 1 km using area-to-point kriging (APK), a method that infers point information from area information [37,38]. APK has been widely used in various applications, such as image pan sharpening [39,40], image fusion [41] and downscaling [42], crop yield disaggregation [43], and monthly precipitation downscaling and fusion [32]. However, downscaled TRMM precipitation alone cannot significantly improve accuracy, and therefore we used the geographically weighted regression kriging (GWRK) method [32] to fuse the downscaled precipitation with other auxiliary variables. This involved adding the longitude, latitude, and digital elevation model (DEM) of ground stations to the GWR (geographically weighted regression) model. We obtained station-based GWR model parameters through cross-validation and spatialized them using the nearest neighbor assignment method. GWRK is an extension of GWR that involves first obtaining the spatial regression coefficients and residuals of each sample point using GWR, and then performing kriging interpolation on the residuals. Finally, the kriging results were added to the GWR results to obtain the GWRK results. It has been proved that a downscaling–integration framework can generate more accurate precipitation estimates [32].

3.2. Waterlogging Mapping

3.2.1. Waterlogging Index (WI) Based on Accumulated Number of Rainy Days

Excessive rainfall can refer to both heavy rainfall and a prolonged precipitation process. Our study specifically focused on the latter, which involves days of precipitation, especially for the CRPs. Although there is no widely accepted definition of CRPs, previous studies have defined them based on either rainy days or rainfall. For example, Ying Xiang et al. [44] defined a CRP as a precipitation process lasting at least 5 days with a total rainfall of at least 10 mm. Additionally, if the CRP lasts longer than 5 days, there can be no rainy days in the middle, but the proportion of rainy days in this CRP must be greater than 70%. The CRP ends when there is no precipitation (rainfall < 0.1 mm) for 3 consecutive days. We adopted this definition in our study. We first calculated the starting date, end date, and rainfall for each precipitation process in the growing season, and then counted the CRPs with durations from 5 to 15 days (Figure 3). We then added the rainy days with CRPs greater than a predefined minimum number of rainy days (e.g., 5 days) to obtain the ARD. For instance, there were 7 CRPs with more than 5 rainy days in one growing season, and the ARD for a 5-day CRP is 68 days (Figure 3). Similarly, the ARD for 10- and 15-day CRPs is 47 and 15 days, respectively.

3.2.2. Quantifying Waterlogging Damage to Winter Wheat Yield

Crop yields have increased over time (Figure A3) due to advancements in technology, such as breeding, fertilizer application, management practices, and irrigation facilities. However, as our study focused on the impact of excessive rainfall on winter wheat yield, we isolated the contribution of these anthropogenic factors. Therefore, we used a linear model to calculate the trend yield ( y i e l d t r e ), which represents the expected yield in the absence of unfavorable weather conditions [7,45,46]. We then calculated the yield change rate (YCR, Equation (4)) by dividing the difference between y i e l d o b s and y i e l d t r e by y i e l d o b s , providing a measure of the influence of excessive rainfall on crop yield.
Y C R = y i e l d o b s y i e l d t r e y i e l d t r e × 100 %
Crop yield is influenced by multiple factors such as nutrients, sunlight, precipitation, temperature, and management practices. Therefore, even with similar climate conditions, counties may have significant variance in the YCR. To obtain the yield response to excessive precipitation, a binning method was employed. This involved aggregating county-level YCR samples that fell into the same ARD bin with a 1-day interval from 0 to 59. This can alleviate the impact of other factors on yield to some extent.

3.2.3. Mapping Waterlogging Damage to Winter Wheat Yield Using WI

A quadratic polynomial model (Equation (5)) was used to quantify the relationship between the ARD of different CRPs and their corresponding YCR. After that, a map of the YCR due to excessive rainfall during the period between the 1998–1999 and 2013–2014 growing seasons was obtained. Considering the dissimilarity of the estimated YCR from ARDs of CRPs of 5 days to 15 days, the YCR of the optimal model was considered as the result. Then, mild, moderate, and severe waterlogging damage levels were defined based on YCR values falling within the ranges of [−10%, −20%), [−20%, −30%), and [−30, −∞), respectively.
Y C R = a A R D 2 + b A R D + c

3.3. Validation

In this study, ten-fold cross-validation was used for the TRMM precipitation downscaling and fusion. The 203 rain gauge stations were evenly divided into 10 parts, with 1 part serving as the validation data and the rest as training data. This process was repeated ten times to ensure that each part served as verification data. Quantitative indicators, such as the root mean square error (RMSE), bias, mean average error (MAE), and correlation coefficient (R), and qualitative indicators, including the probability of detection (POD), false alarm ratio (FAR), and critical success index (CSI), were used to evaluate the accuracy of the downscaled and fused precipitation.
RMSE = i = 1 n y i y i ^ 2 n
Bias = i = 1 n y i ^ y i i = 1 n y i
MAE = i = 1 n y i ^ y i n
R = i = 1 n y i y ¯ y i ^ y ^ ¯ i = 1 n y i y ¯ 2 i = 1 n y i ^ y ^ ¯ 2
R 2 = i = 1 n y i ^ y ¯ 2 y i y ¯ 2
POD = H H + G
FAR = F H + F
CSI = H H + F + G
where y i and y i ^ are the measured and predicted precipitation for station i; n is the total number of rain gauge stations, i.e., 203; y ^ ¯ and y ¯ indicate the means of the estimated and observed precipitation; H represents the number of precipitation events observed by both the rain gauge stations and TRMM 3B42, and the threshold for a precipitation event is 0.1 mm/day; G represents the number of times the TRMM 3B42 indicated that there was no rain, but the rain gauge recorded precipitation; and F represents the number of times that no precipitation was observed by the ground station, but the TRMM 3B42 indicated that there was precipitation.

4. Results

4.1. Performance of Precipitation Estimates

4.1.1. Overall Performance of Precipitation Estimates

To quantitatively assess the effect of downscaling and fusion, the original-scale TRMM precipitation estimates (ori_TRMM), downscaled TRMM precipitation estimates (DTRMM), and GWRK fusion precipitation estimates (DTRMM_GWRK) were compared with the rainfall obtained from the 203 rain gauge stations from 1998 to 2014. The density plots of the three are shown in Figure 4, and the corresponding error statistics are also presented. The consistency of the ori_TRMM estimates is poor, with many points far away from the 1:1 line. Similar phenomena are observed for the downscaled estimates (DTRMM), with a nonsignificant improvement. This shows that the downscaling process does not provide much benefit to the accuracy of precipitation estimates, which is in line with a previous study of monthly precipitation estimates [32]. Compared with the ori_TRMM and DTRMM estimates, the DTRMM_GWRK estimates are in better agreement with the rain gauge measurements, demonstrating a larger point density on or near the 1:1 line (Figure 4c). The quantitative error statistics results also support these qualitative analyses. For example, the downscaled precipitation estimates produce less error, with a decrease in the RMSE and MAE from 8.57 and 2.84 to 8.04 and 2.71, respectively. However, DTRMM_GWRK witnesses a significant improvement in precipitation estimates for all the qualitative indicators (Figure 4c).

4.1.2. Performance of Precipitation Estimates at Station Scale

Figure 5 presents the box plots of the station-based RMSE, bias, MAE, R, POD, FAR, and CSI, to further evaluate the accuracy of the ori_TRMM, DTRMM, and GWRK_DTRMM estimates. The results show little difference between ori_TRMM and DTRMM, with the median R ranging from 0.67 to 0.70, possibly due to the accuracy of the original TRMM. However, as a result of the fusion with the rain gauge measurements using GWRK, a significant increase in accuracy is observed, with the median RMSE decreasing from 7.88 to 5.57 mm, median R increasing from 0.70 to 0.85, and median MAE decreasing from 2.65 mm to 1.52 mm.

4.1.3. Performance of Precipitation Estimates at Daily Precipitation Level

The precipitation detection capabilities of ori_TRMM, DTRMM, and DTRMM_GWRK at different precipitation levels are shown in Figure 6. It is shown that both POD and CSI decrease gradually as the precipitation level increases, and then increase again after exceeding a certain magnitude (50 mm in this study). This is likely because precipitation exceeding 50 mm is considered a rainstorm, and the TRMM and rain gauge stations are unlikely to miss such heavy rain. Conversely, FAR shows the opposite trend.

4.2. The Relationship between Precipitation and YCR

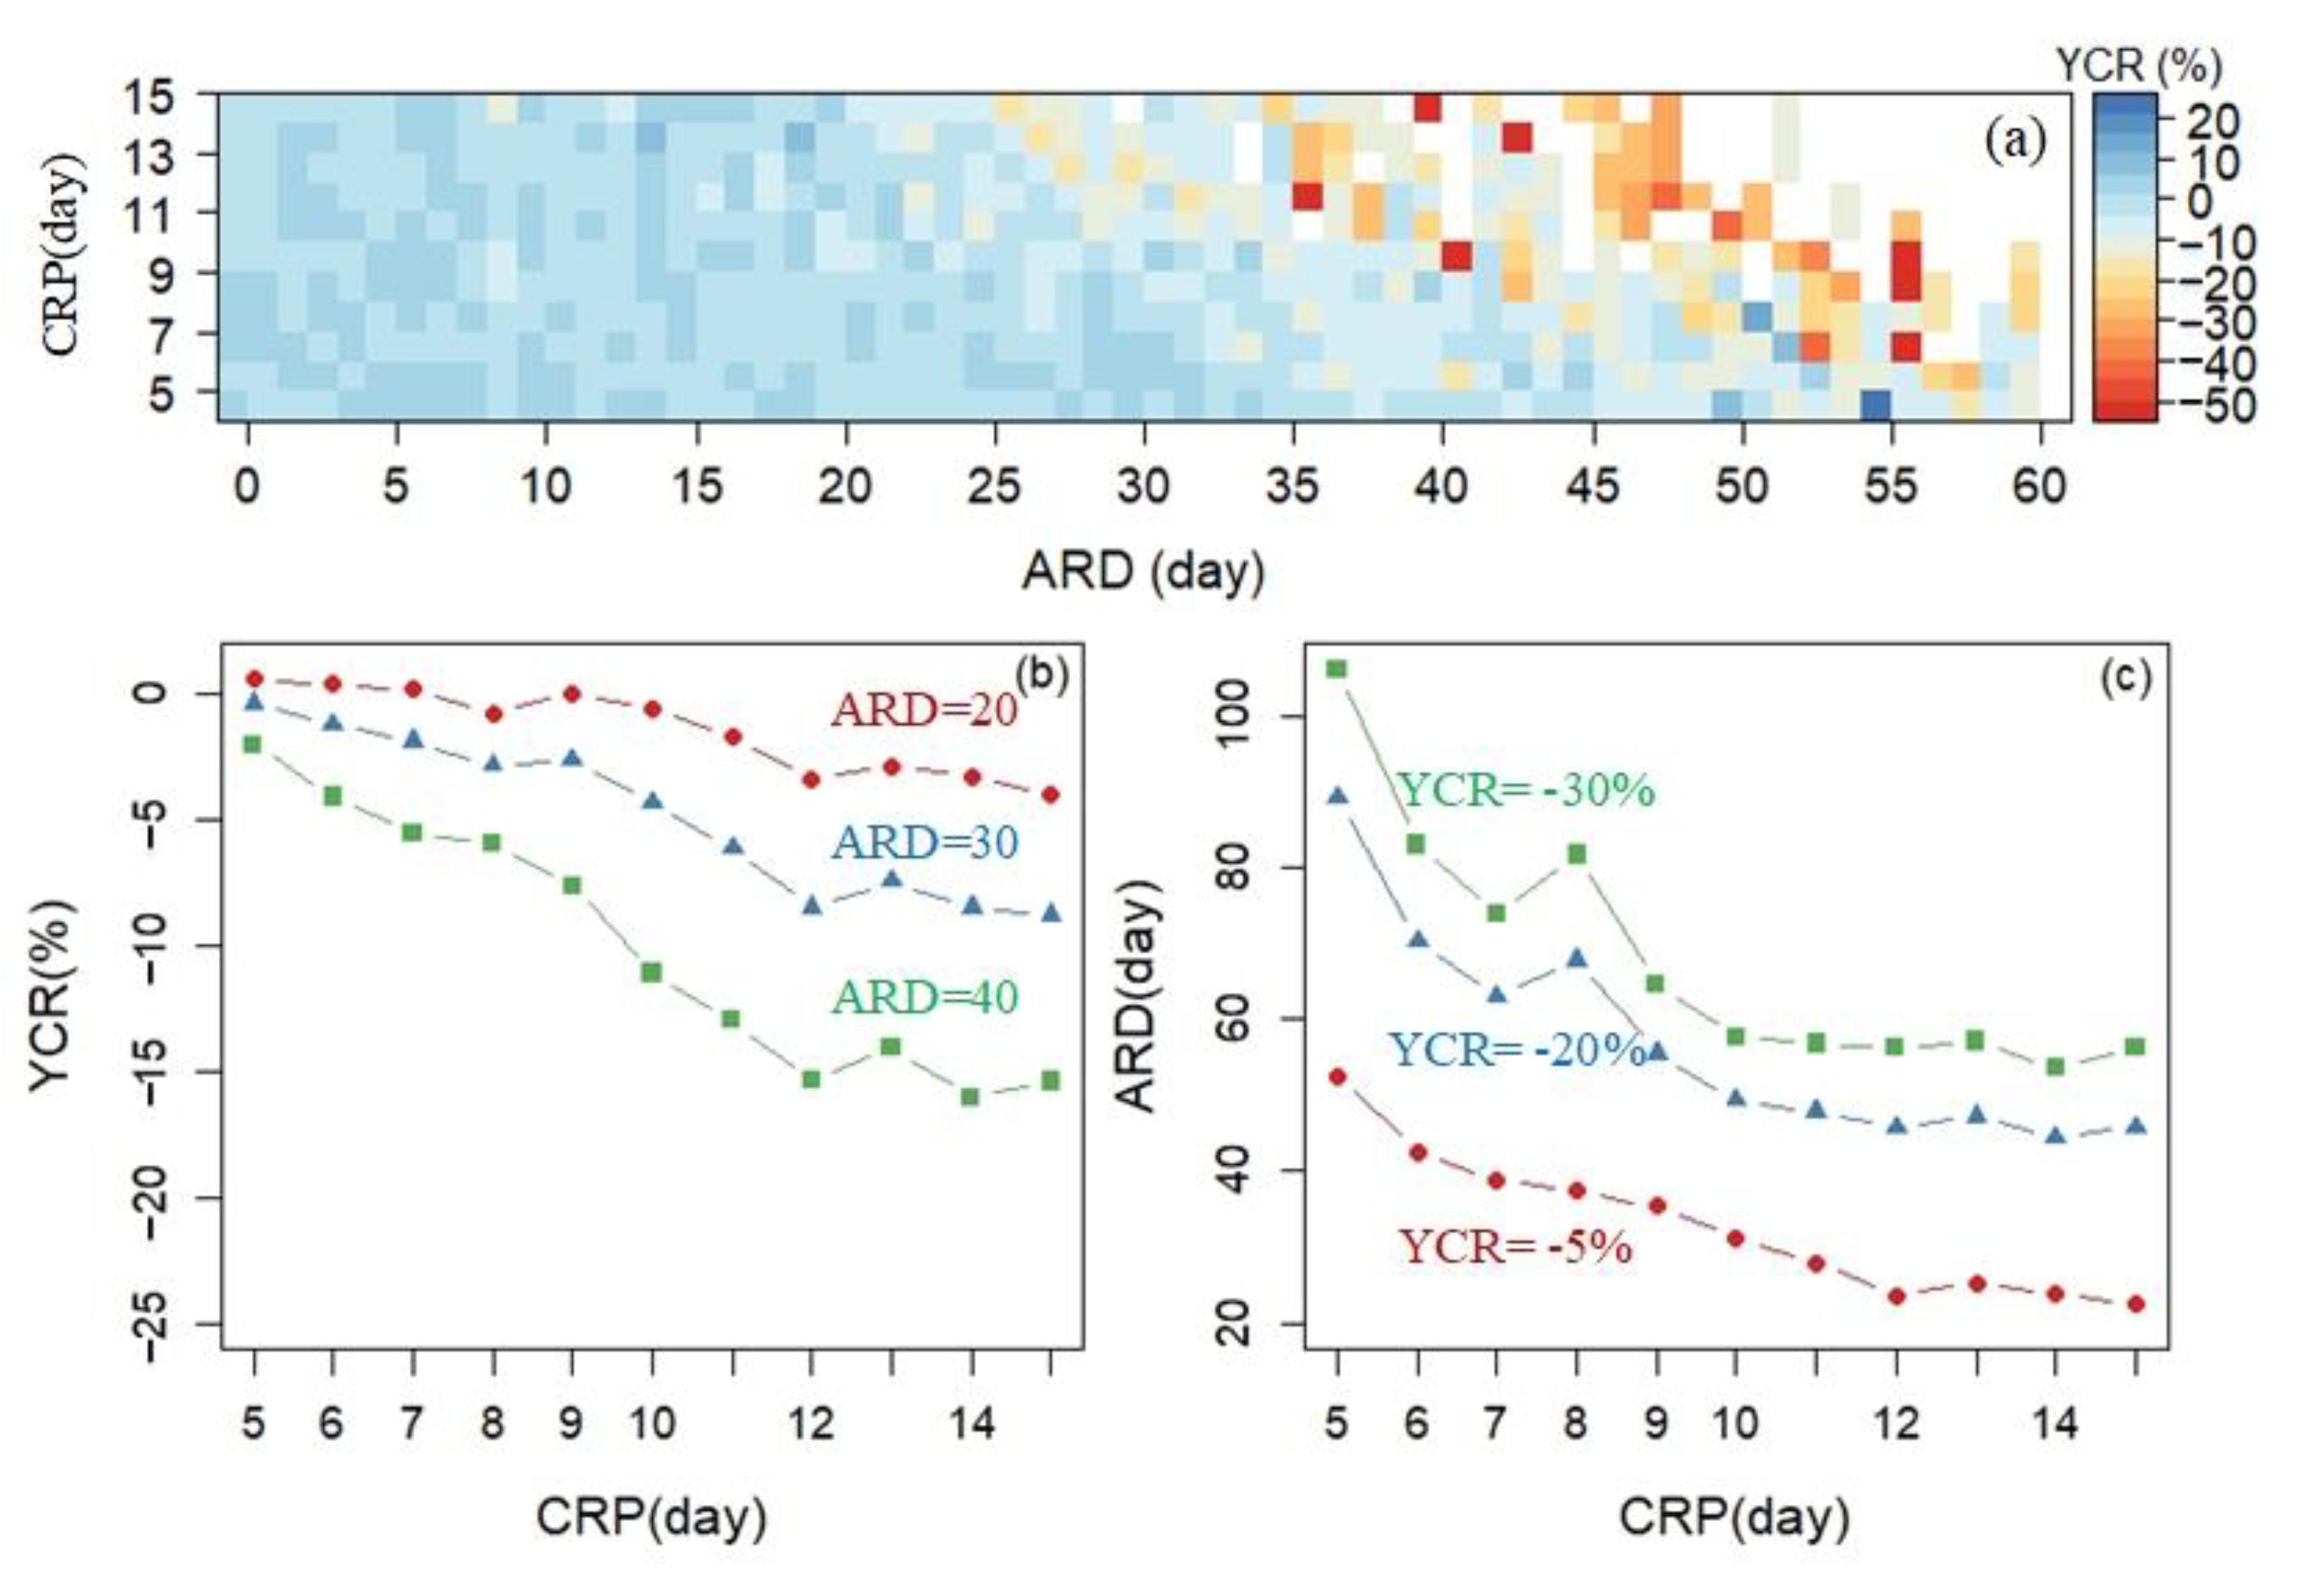
4.2.1. The Relationship between YCR and ARD of Different CRPs

Figure 7a presents a heatmap of the YCR of different combinations of ARDs and CRPs. The figure shows that higher ARDs, particularly for longer CRPs, are always associated with a greater yield reduction. With a low ARD, there are no significant differences in the YCR between different CRPs (red line in Figure 7b). However, with a higher ARD, the greater the CRP, the greater the yield reduction (Figure 7b). For example, with an ARD of 40 days, the YCR is −15.4% with a CRP of 15 days, while it is only −2% for a CRP of 5 days. Conversely, for the same yield reduction, a longer CRP corresponds to a lower ARD (Figure 7c). For instance, with a YCR of −20%, the ARD is 89 days for a CRP of 5 days, and only 45 days for a CRP of 15 days.
Figure 8 shows scatter plots of the average county-level YCR and ARD for CRPs ranging from 5 to 15 days, along with the fitted polynomial line. Initially, the YCR either slightly increases or remains unchanged as the ARD increases. However, after the ARD exceeds a certain range, the YCR decreases. This suggests that when the ARD is beyond the optimum range, the increase in rainy days indicates that there is excessive precipitation for the growth of winter wheat, which will result in waterlogging and ultimately lead to yield reduction. Importantly, with a shorter CRP, even higher ARDs rarely result in a yield reduction exceeding 10% (Figure 8a). All models passed the significance test, with R2 values ranging from 0.24 to 0.67. The optimal model is based on the CRP of 11 days (R2 = 0.67), followed by the CRP of 13 days (R2 = 0.65).

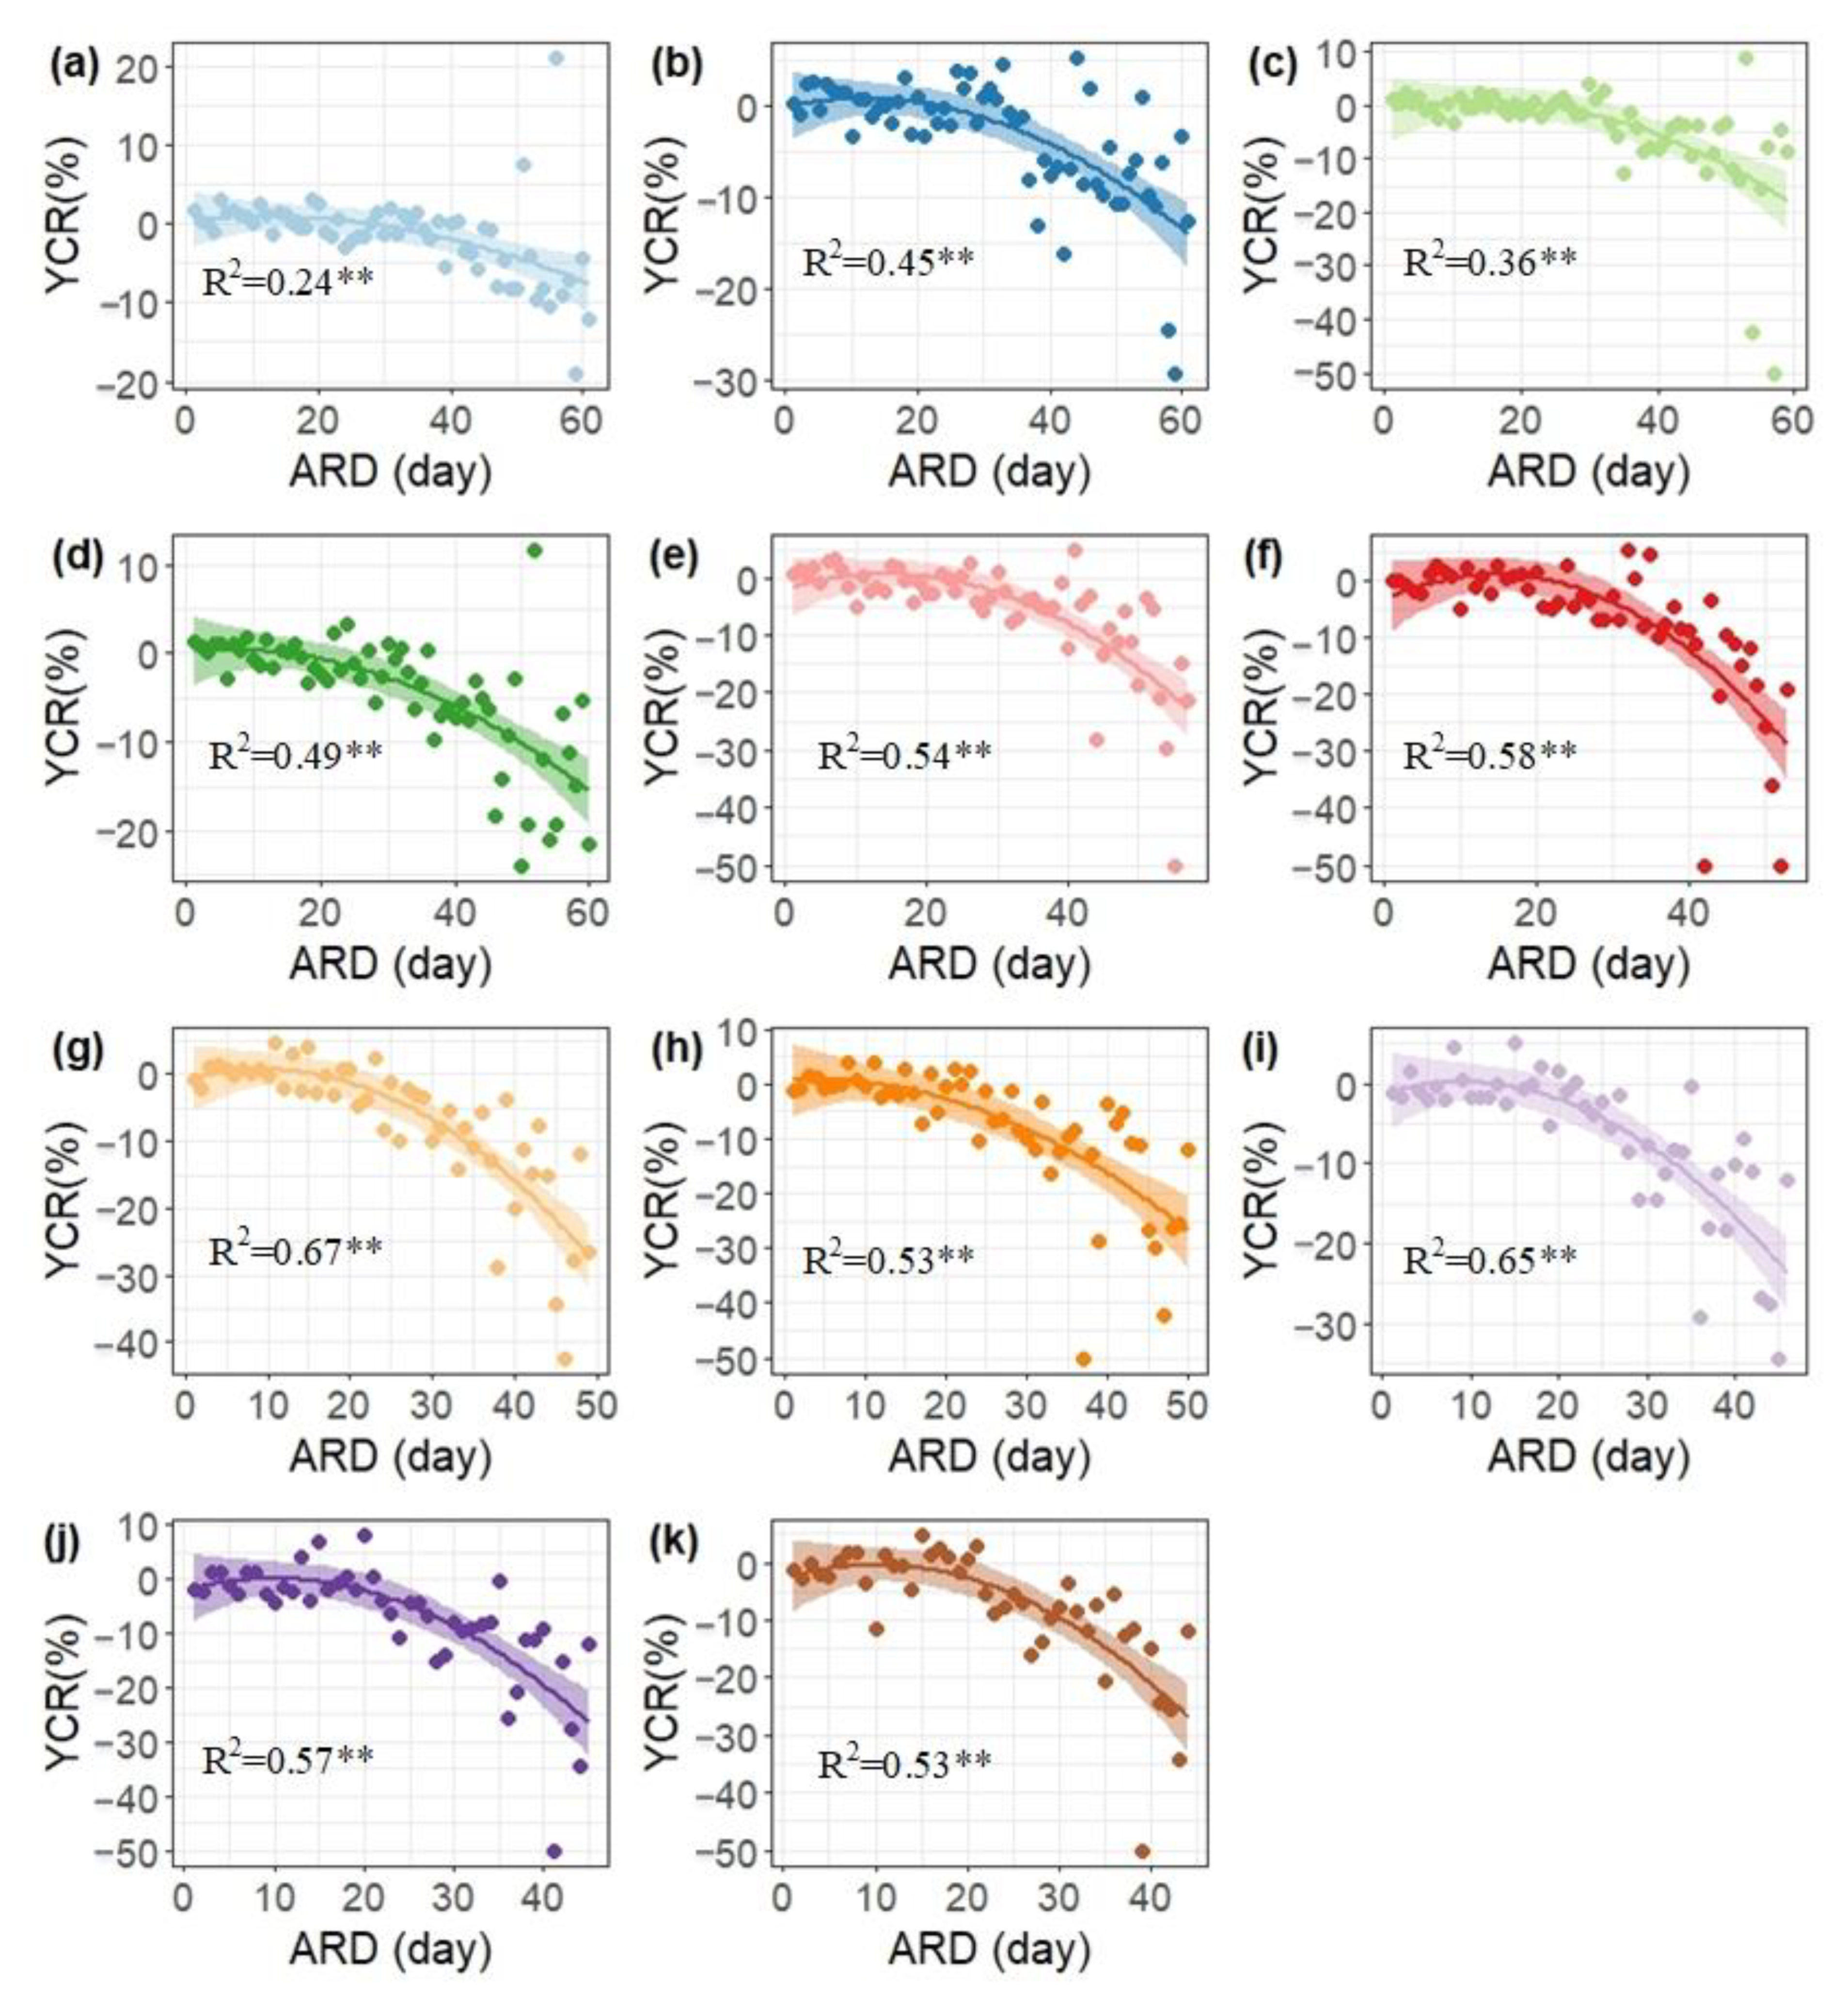
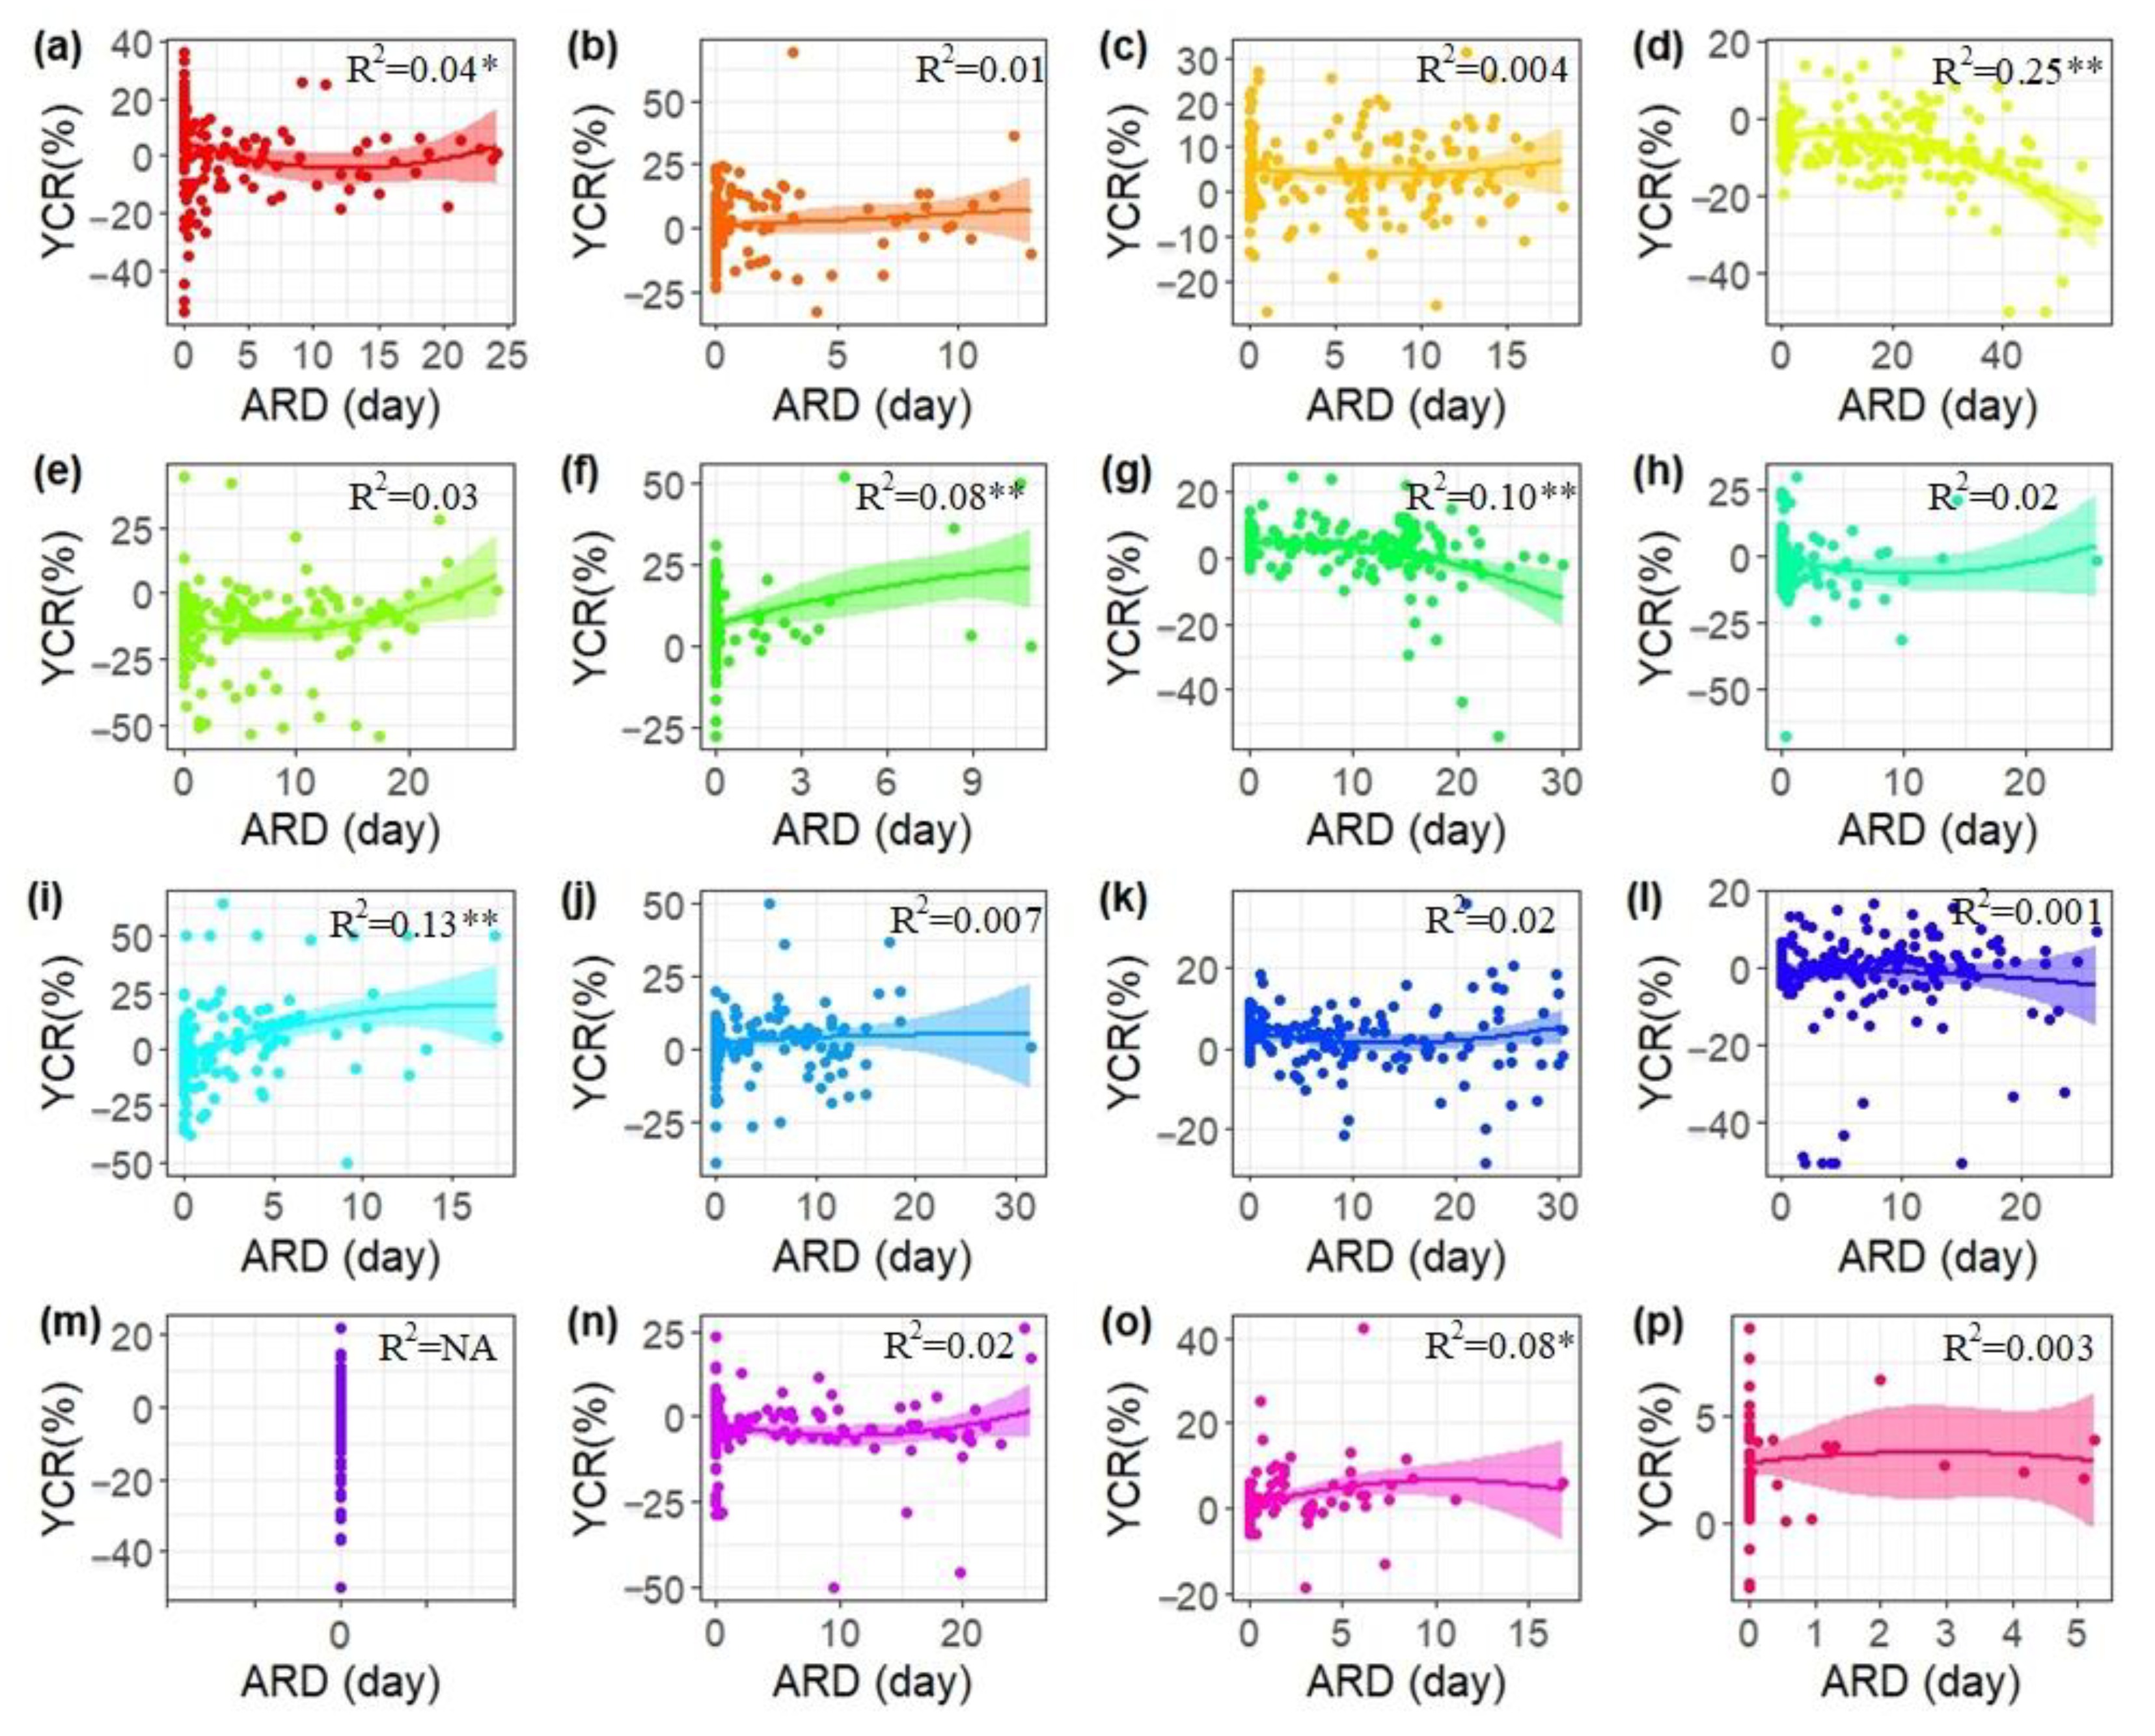
4.2.2. The Relationship between YCR and ARD of CRP of 11 Days for Each Growing Season

High rainfall and low-lying terrain, combined with a dense and complex river network, make a significant contribution to excess water supply for crops in the middle and lower reaches of the Yangtze River. However, in wet years, where waterlogging damage is caused by excessive precipitation, yield reduction would be expected to have strong dependence on precipitation. The relationship between the YCR and the ARD of the CRP of 11 days from the 1998–1999 to 2013–2014 growing seasons implies that the ARD has little to do with the YCR in most growing seasons, with R2 ranging from 0.001 to 0.1, except for the typical wet growing season of 2001 to 2002 (Figure 9d). Yield reduction is observed in wet growing seasons when the ARD exceeds a specific value, with a quadratic polynomial fitting R2 of 0.25 (p < 0.001). On average, the 2001–2002 growing season has the largest ARD of 19.7 days, meaning there was at least one CRP of 11 days in the growing season, implying less sunshine hours, which are necessary for crop growth [47]. The 2010–2011 growing season, with an average ARD of 0, demonstrated that the YCR has nothing to do with excessive rainfall, as it was a typical dry growing season [48].

4.3. Results of Waterlogging Mapping

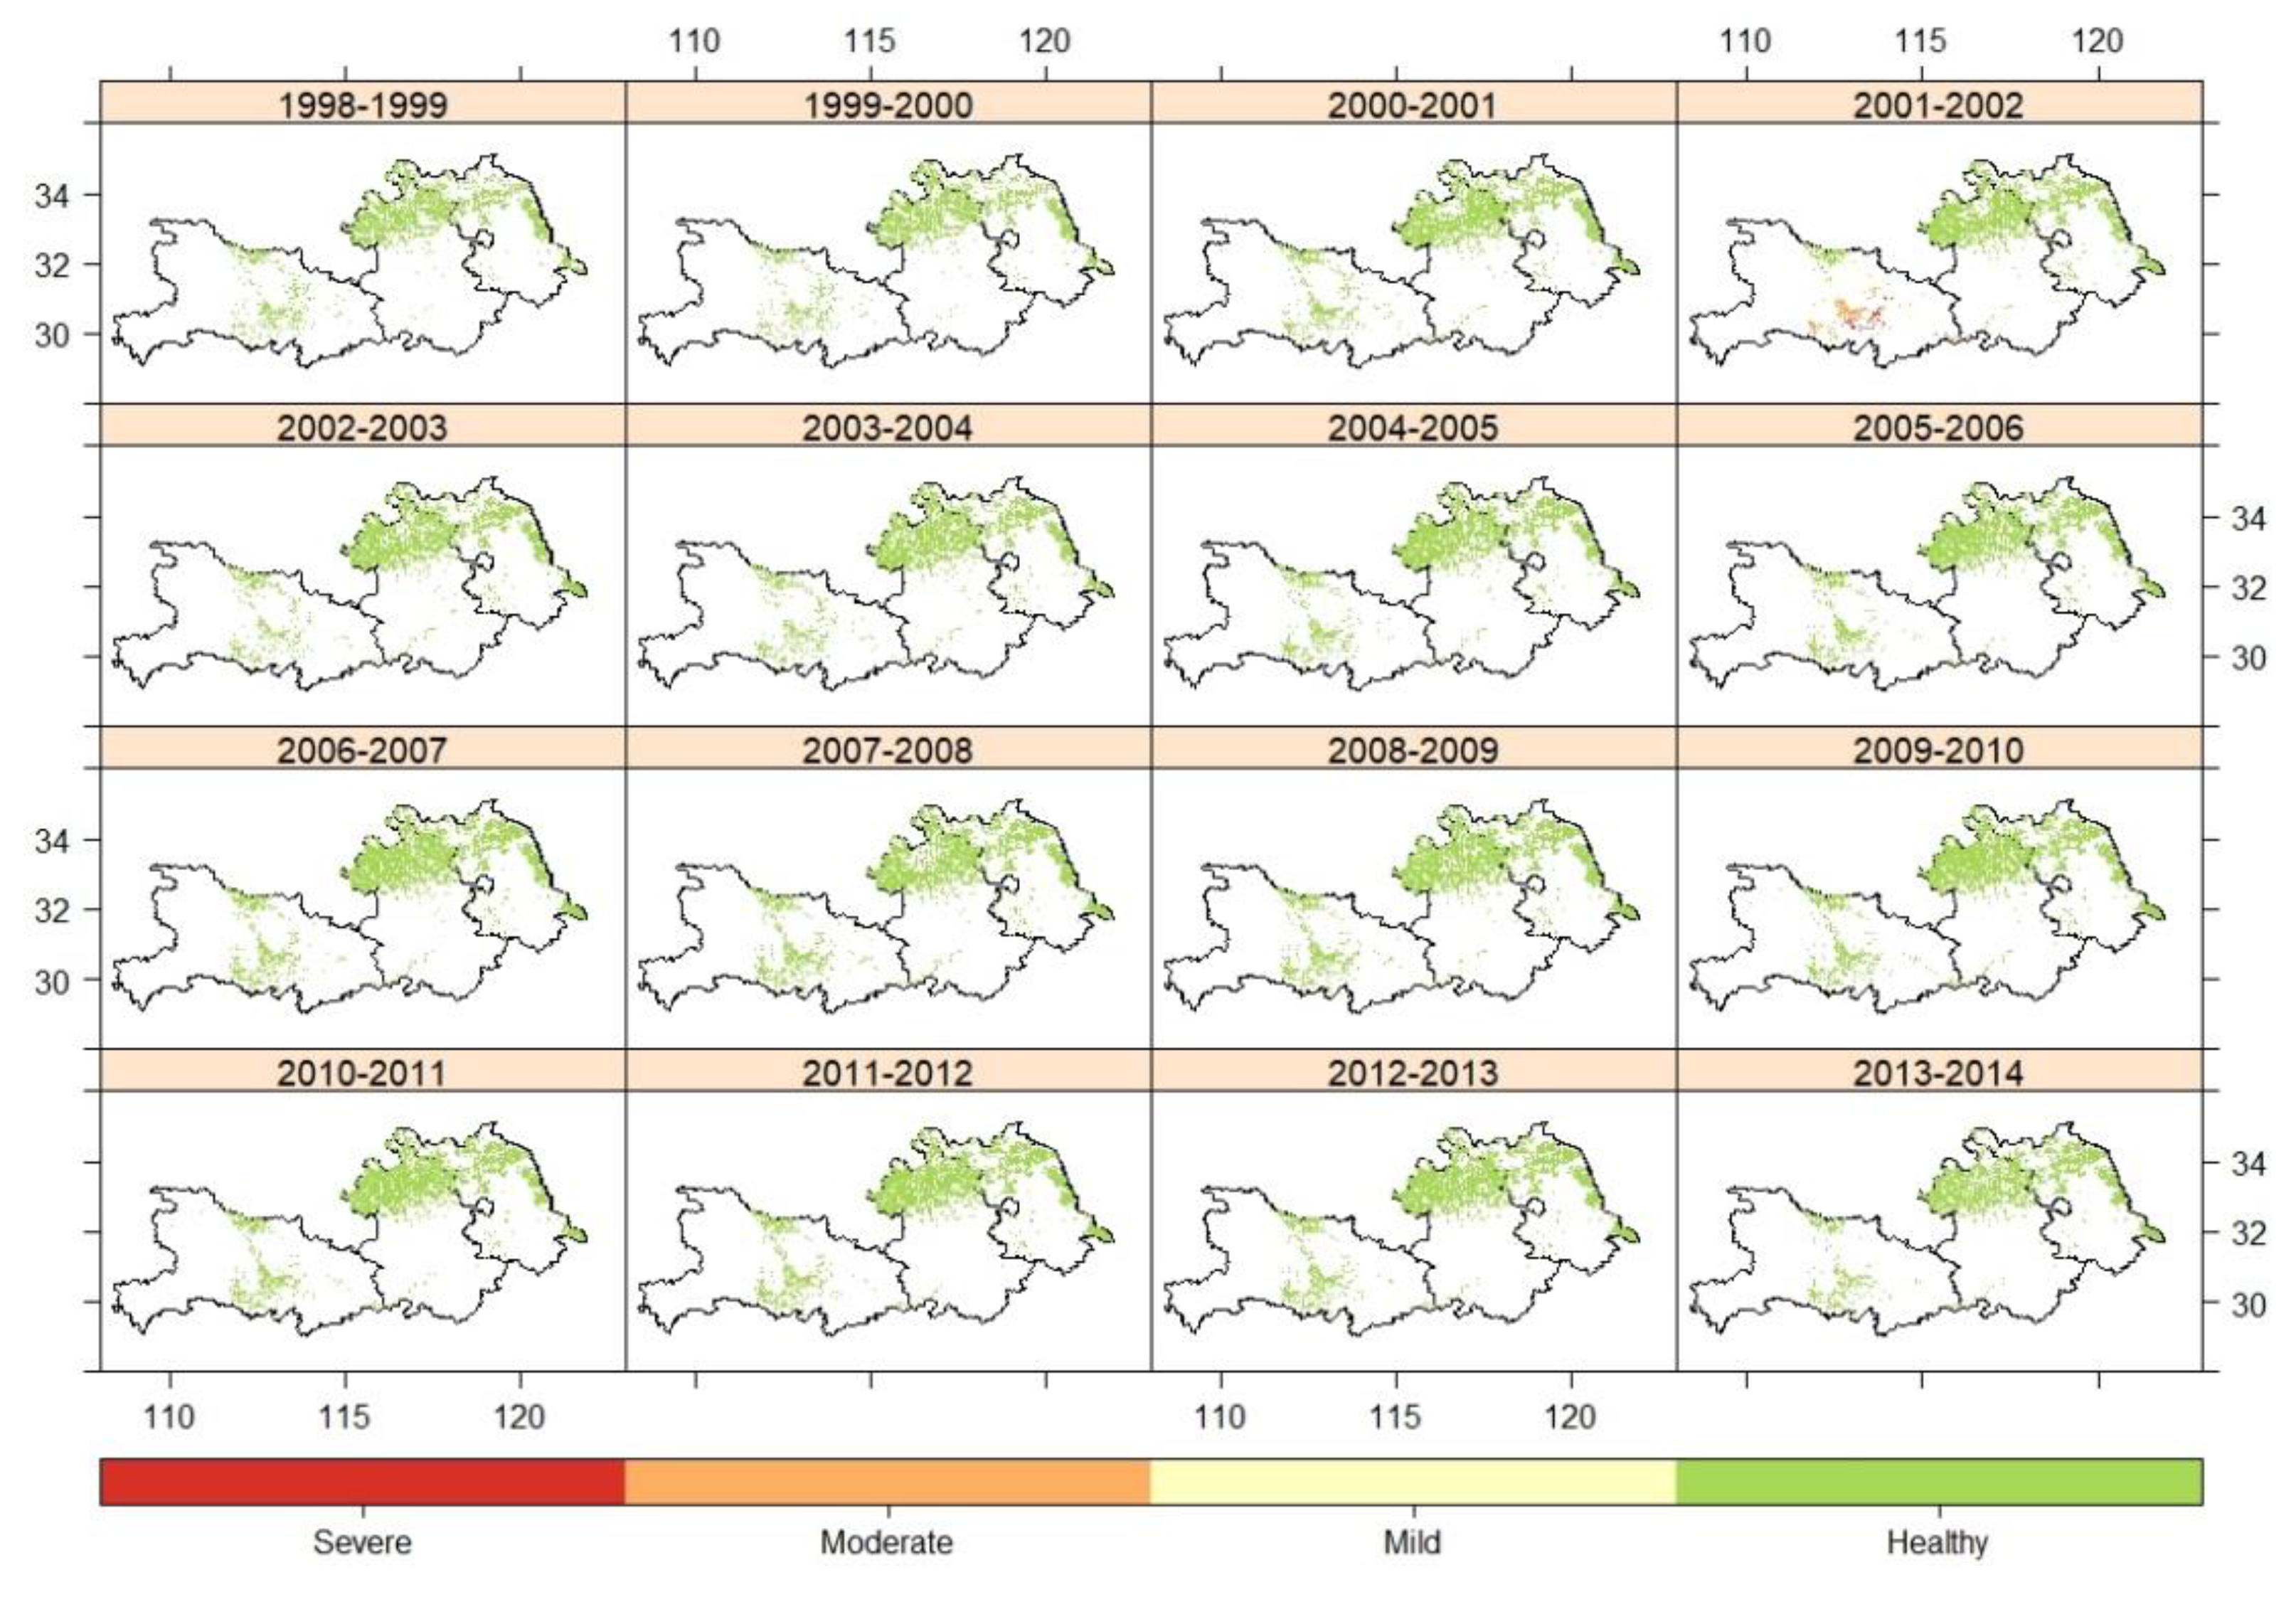
4.3.1. Waterlogging Mapping Results of Winter Wheat from 1998 to 2014

The mapping of waterlogging damage based on the estimated YCR and the proportion of waterlogged area with three waterlogging levels are shown in Figure 10 and Figure 11, respectively. Different levels of waterlogging were observed in 10 out of 16 growing seasons from 1998 to 2014. Additionally, the 2001–2002 growing season was a typical wet season, with severe, moderate, and mild waterlogging occurring in 5.72%, 2.00%, and 0.63% of the winter wheat area, respectively. These areas were mainly located in Tianmen and Jiangling and Gongan Counties in Hubei, as well as south of Anhui and Jiangsu. In the 2002–2003 growing season, mild waterlogging was observed in Tongling, Langxi, and Guangde in the south of Anhui. In addition, no waterlogging occurred in the dry growing seasons, such as in 1999–2000 and 2010–2011.

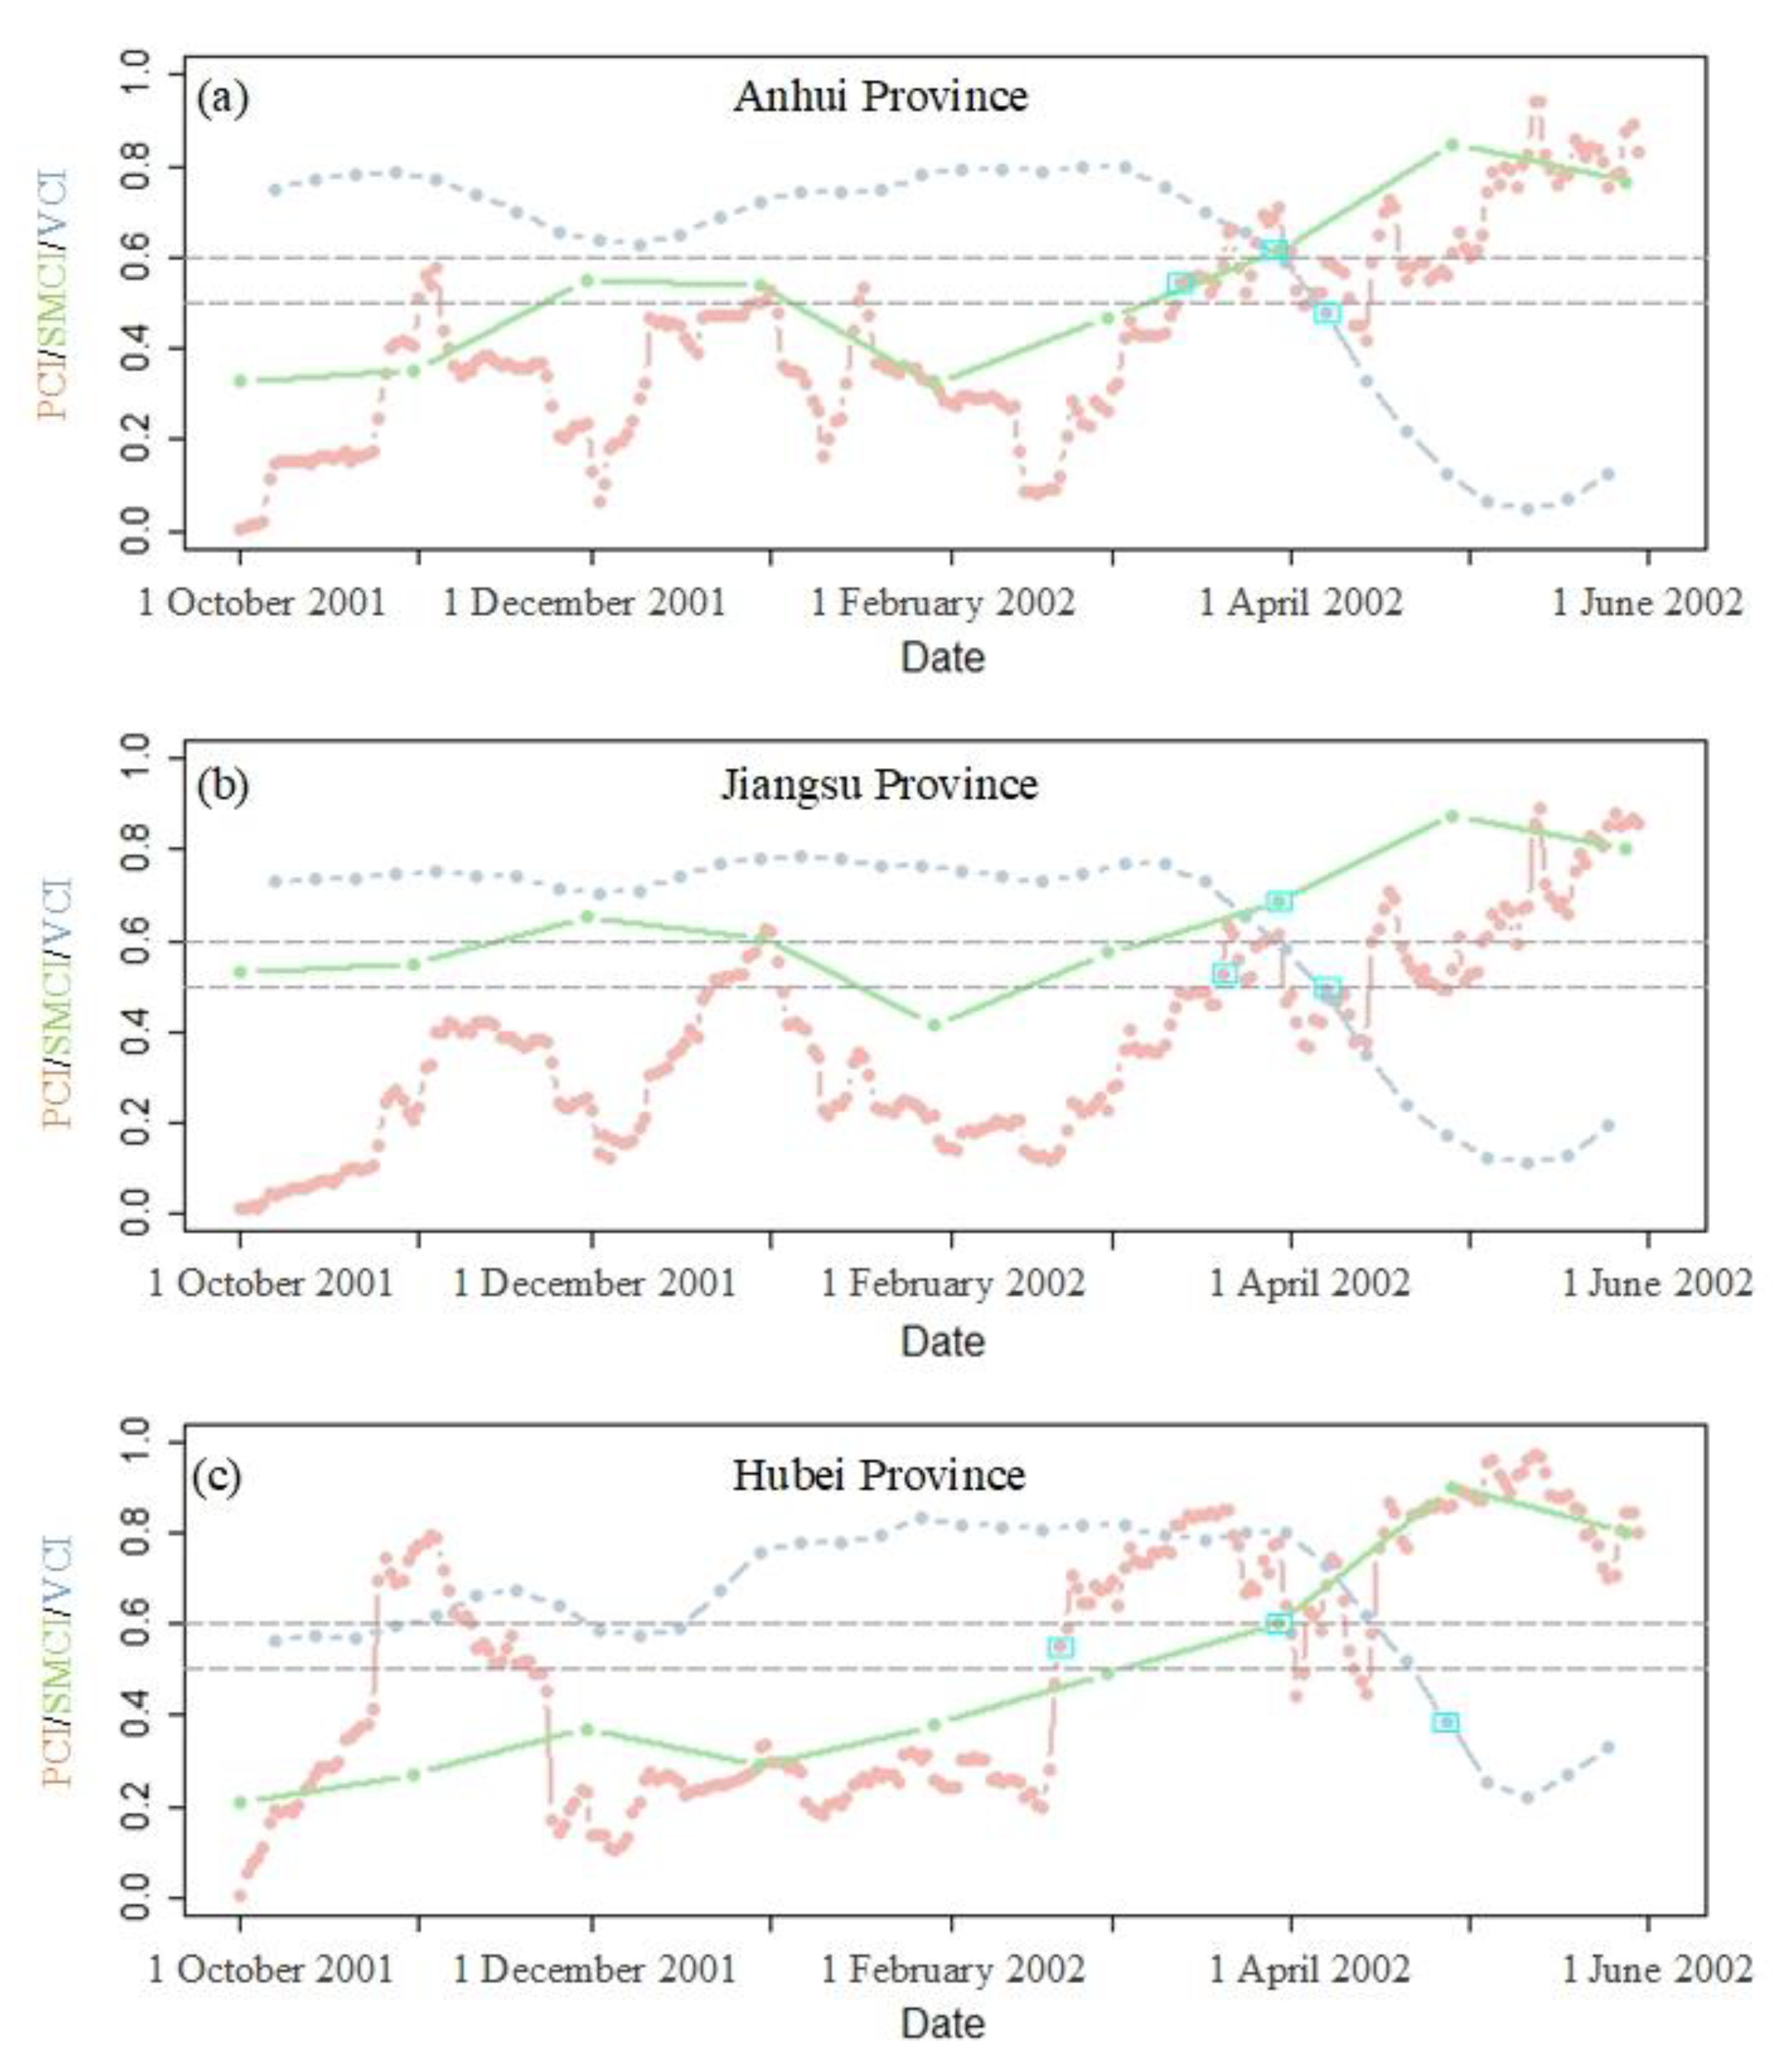
4.3.2. Waterlogging Result Comparison between the TRMM Downscaled–Fusion Estimates and Rain Gauge Measurements for Typical Wet Growing Seasons

The county/station-level waterlogging risk map of typical wet years based on the rain gauge dataset shows a similar temporal pattern to the spatial waterlogging mapping, with higher waterlogging damage located in the middle of Hubei and south of Anhui (Figure 12b). It is worth noting that counties that suffered a high waterlogging risk according to the rain gauge measurements are not shown on the corresponding waterlogging map based on the DTRMM_GWRK estimates (Figure 12a), which means that the actual damage was not necessarily serious in these areas. This is because no winter wheat was extracted, such as in Susong County in Anhui and Huangmei County in Hubei. According to risk-assessment-related theory, risk estimation should consider the threat intensity, exposure, and vulnerability of physical entities [49]; if there were no winter wheat, then waterlogging loss would not exist. However, in those areas with a high waterlogging risk, local smallholders could have adopted strategies to avoid this risk by planting more tolerant varieties and switching to another crop, or even abandoned the growing season [50,51].

4.3.3. Verification of Typical Waterlogging Process Based on Multi-Source Data

Yield loss due to excessive rainfall is primarily a result of: (a) restricted water, oxygen, and nutrient uptake due to root damage resulting from higher soil moisture [52,53]; (b) crop photosynthesis rate reduction [28]; (c) decreases in the green leaf area index and biomass [54]. Therefore, as for the onset and development of waterlogging, precipitation, soil moisture, and vegetation growth conditions are all involved in this process. To more clearly illustrate the occurrence and development of waterlogging, this section explores the response of precipitation, soil moisture, and vegetation growth to the process of waterlogging. A typical wet season, from 1 October 2001 to 30 May 2002, was selected to demonstrate the process of waterlogging onset to development (Figure 13). There was a significant lag effect in the manifestation of waterlogging damage to vegetation after excessive rainfall and increased soil moisture. Taking Hubei Province as an example, precipitation started to become excessive in late February 2002 (PCI exceeded 0.5). However, it was not until April that the soil moisture began to show signs of being wet, and it was not until early to mid-April that the vegetation began to show clear signs of damage (VCI was less than 0.5).

5. Discussion

In this study, a waterlogging indicator was proposed to quantitatively evaluate the impact of excessive precipitation on winter wheat yield in the middle and lower reaches of the Yangtze River. To our knowledge, this is the first study to apply remote sensing daily-scale precipitation for waterlogging mapping over a large area. However, as yield is the output of the comprehensive influence of numerous factors, understanding how to attribute the yield reduction to waterlogging more precisely is still challenging.

5.1. An Indicator of Extremes Is Important for Quantifiing Their Impact on Crop Yield

There is no unified indicator to indicate the extremes. For meteorological extremes, such as drought and waterlogging, precipitation indices are mainly used, such as the SPI [55] and SPEI [56]. The advantage of these indices is that different numerical intervals are used to demonstrate the occurrence and severity of these extremes. They are simple and intuitive. However, the time scale of these indices is generally monthly, seasonal, or annual. Such a coarse time resolution of precipitation anomalies is not suitable for waterlogging mapping. This is mainly due to the characteristics of waterlogging. The uneven distribution of precipitation over time leads to short-term signals of excessive precipitation becoming diluted in monthly or seasonal anomalies, resulting in an underestimate of the impact of waterlogging on yields. On the other hand, there is large spatial–temporal heterogeneity in the impact of precipitation on crop yield [11]. Crop yield could respond positively to excessive rainfall in dry areas, while it could respond negatively in wet areas. It has been proved that as precipitation increases, maize yields first increase and then decrease in northern China [57].
The characteristics of waterlogging determine that daily precipitation with a fine spatial resolution is necessary for large-scale waterlogging mapping. Researchers have explored the possibility of waterlogging monitoring at the station scale based on daily precipitation. Lu [58] proposed a weighted average of precipitation (WAP), which comprehensively considers the precipitation of a given day and the precipitation for the period before that day, and finally obtains the probability of daily waterlogging occurrence. The advantage of WAP is its high temporal resolution, but it is also affected by the threshold of the waterlogging determination, which limits its application in agricultural meteorological departments. In addition, Qin et al. took soil evapotranspiration into consideration and constructed a weighted moisture index (WMI) [59]. Based on that, they further proposed an effective precipitation index (EP) to monitor the frequency and degree of waterlogging in Hubei Province [60]. Their results showed that the 2001–2002 growing season was a typical wet season, which is consistent with our findings.

5.2. Challenges in Determining the Influence of Extremes on Crop Yield

Crop yield is an integrated outcome of various abiotic and biotic factors. Other confounding factors can make it difficult to determine the impact of extremes on crop yield, especially for nonextreme conditions. Univariate and multiple linear regression models have been employed to determine the impact of temperature and precipitation on crop yield on regional [7,12] and global scales [3]. The significance of coefficients and the type of fitting curve of these models are used to determine the type of yield response to precipitation, such as a linear decrease or a decrease [61]. Moreover, Pearson and Spearman rank correlations between climate anomalies and crop yield anomalies can also be calculated to determine the influence of temperature and precipitation extremes on maize yield [46]. Additionally, the Mann–Whitney U test can be adopted to detect which extreme is more detrimental to yield reduction. In addition, considering the heterogeneity in the impact of rainfall on cereal yield, a threshold regression estimation strategy has been proposed to empirically quantify the impact of the SPEI on yield [23]. Focusing on extreme conditions, such as years of extreme wet or dry with significant yield reduction, can improve the detection and determination of extreme climate impacts [15]. In our study, the YCR was closely related to the ARD only when the growing season was a typical wet season (Figure 8d), aligning with previous research. However, this approach makes the quantification inherently dependent on the definitions and occurrence of such events. On the other hand, as the occurrence of typical wet years is rare, and the impact of excessive rainfall is highly variable across space and time, the impacts could be influenced by the spatial and temporal domains.

5.3. Limitations and Future Work

There are several limitations in our study. First, GWRK was adopted to downscale and fuse the TRMM 3B42 precipitation product, aiming to obtain a higher accuracy of the daily precipitation. However, more advanced algorithms are worth exploring to achieve a better accuracy of precipitation estimates, such as recurrent neural networks in deep learning. A higher accuracy of precipitation estimates can directly benefit waterlogging mapping. Secondly, the waterlogging indicator proposed in this study, which is the ARD of different CRPs, is inspired by the growing degree days (GDDs) and killing degree days (KDDs), which are commonly used in exploring the impact of temperature on crops [22,62]. However, the waterlogging mapping is solely based on the indicator of rainy days, which ignores the contribution of rainfall to yield loss. This also leaves room to improve this type of waterlogging mapping.

6. Conclusions

It is very important to determine the impact of precipitation, especially excessive precipitation, on winter wheat yield in the middle and lower reaches of the Yangtze River. In this study, we proposed a waterlogging indicator, named ARD, to estimate waterlogging damage in different growing seasons. After that, the relationship between the ARD of different CRPs and the YCR was explored using a quadratic polynomial model. Additionally, according to the optimal model, the relationship between the ARD and YCR in different growing seasons was further analyzed. The results showed that the ARD of a CRP of 11 days is the optimal indicator to quantify the impact of waterlogging on yield, with an R2 of 0.67. The 2001–2002 growing season was a typical wet year, with the largest waterlogged area, which is proved by the temporal variations in the PCI, SMCI, and VCI during this growing season. Large-scale waterlogging mapping not only provides a basis for policymakers to develop appropriate strategies for alleviating the impact of waterlogging, but also offers a reference for smallholders to avoid the risk of waterlogging damage.

Author Contributions

Conceptualization, W.L. and R.H.; methodology, W.L. and J.H.; software, W.L. and W.S.; validation, Y.C. and W.L.; writing—original draft preparation, W.L.; writing—review and editing, R.H., Y.C. and J.H.; visualization, W.S. and W.L.; supervision, W.S.; funding acquisition, R.H. and J.H. All authors have read and agreed to the published version of the manuscript.

Funding

This research was funded by the National Natural Science Foundation of China (Grant Nos. 42101336, 42101364, 41901363) and, in part, by the Special Fund for Industrial Scientific Research in the Public Interest (Meteorology) (Grant No. GYHY201406028) and the Science and Technology Innovation 2025 Major Project of Ningbo City (Grant No. 2021Z107).

Acknowledgments

The authors would like to thank the AMIC, JMIC, and HMITSC for providing the precipitation data and yield data. The editors’ and anonymous reviewers’ valuable comments and advice that significantly improved this manuscript are also much appreciated.

Conflicts of Interest

The authors declare that they have no known competing financial interests or personal relationships that could have appeared to influence the work reported in this paper.

Appendix A

Figure A1. Areas covered (a) and affected (b) by excessive rainfall, drought, hailstorms, and cold from 1978 to 2014 in China (data source: National Bureau of Statistics of China, http://www.stats.gov.cn/, accessed on 1 January 2019).
Remotesensing 15 02573 g0a1
Figure A2. Areas affected by excessive rainfall, drought, hailstorms, and cold from 1978 to 2014 in Jiangsu (a), Anhui (b), and Hubei (c) Provinces (data source: National Bureau of Statistics of China, http://www.stats.gov.cn/, accessed on 1 January 2019).
Remotesensing 15 02573 g0a2
Figure A3. Box plot of 203 counties from 1978 to 2014. The lower and upper box boundaries of the box plot in the inset figure indicate the 25th and 75th percentiles, the horizontal line within the box represents the median, and the lower and upper whiskers indicate the minimum and 1.5 times the interquartile range for that box.
Remotesensing 15 02573 g0a3

References

  1. Leng, G. Maize yield loss risk under droughts in observations and crop models in the United States. Environ. Res. Lett. 2021, 16, 024016. [Google Scholar] [CrossRef]
  2. Chen, H.L.; Liang, Z.Y.; Liu, Y.; Jiang, Q.S.; Xie, S.G. Effects of drought and flood on crop production in China across 1949–2015: Spatial heterogeneity analysis with Bayesian hierarchical modeling. Nat. Hazards 2018, 92, 525–541. [Google Scholar] [CrossRef]
  3. Feng, S.; Hao, Z. Quantifying likelihoods of extreme occurrences causing maize yield reduction at the global scale. Sci. Total Environ. 2020, 704, 135250. [Google Scholar] [CrossRef] [PubMed]
  4. Min, S.K.; Zhang, X.B.; Zwiers, F.W.; Hegerl, G.C. Human contribution to more-intense precipitation extremes. Nature 2011, 470, 378–381. [Google Scholar] [CrossRef]
  5. Jiao, W.; Tian, C.; Chang, Q.; Novick, K.A.; Wang, L. A new multi-sensor integrated index for drought monitoring. Agr. Forest. Meteorol. 2019, 268, 74–85. [Google Scholar] [CrossRef]
  6. Couedel, A.; Edreira, J.I.R.; Lollato, R.P.; Archontoulis, S.; Sadras, V.; Grassini, P. Assessing environment types for maize, soybean, and wheat in the United States as determined by spatio-temporal variation in drought and heat stress. Agric. For. Meteorol. 2021, 307, 108513. [Google Scholar] [CrossRef]
  7. Liu, S.; Wu, W.; Yang, X.; Yang, P.; Sun, J. Exploring drought dynamics and its impacts on maize yield in the Huang-Huai-Hai farming region of China. Clim. Chang. 2020, 163, 415–430. [Google Scholar] [CrossRef]
  8. Yu, H.; Wu, D.; Piao, X.; Zhang, T.; Yan, Y.; Tian, Y.; Li, Q.; Cui, X. Reduced impacts of heat extremes from limiting global warming to under 1.5 degrees C or 2 degrees C over Mediterranean regions. Environ. Res. Lett. 2021, 16, 014034. [Google Scholar] [CrossRef]
  9. Jackson, N.D.; Konar, M.; Debaere, P.; Sheffield, J. Crop-specific exposure to extreme temperature and moisture for the globe for the last half century. Environ. Res. Lett. 2021, 16, 064006. [Google Scholar] [CrossRef]
  10. Perry, E.D.; Yu, J.; Tack, J. Using insurance data to quantify the multidimensional impacts of warming temperatures on yield risk. Nat. Commun. 2020, 11, 4542. [Google Scholar] [CrossRef]
  11. Li, Y.; Guan, K.Y.; Schnitkey, G.D.; DeLucia, E.; Peng, B. Excessive rainfall leads to maize yield loss of a comparable magnitude to extreme drought in the United States. Glob. Chang. Biol. 2019, 25, 2325–2337. [Google Scholar] [CrossRef]
  12. Urban, D.W.; Roberts, M.J.; Schlenker, W.; Lobell, D.B. The effects of extremely wet planting conditions on maize and soybean yields. Clim. Chang. 2015, 130, 247–260. [Google Scholar] [CrossRef]
  13. Liang, X.-Z. Extreme rainfall slows the global economy. Nature 2022, 601, 193–194. [Google Scholar] [CrossRef]
  14. Kotz, M.; Levermann, A.; Wenz, L. The effect of rainfall changes on economic production. Nature 2022, 601, 223–227. [Google Scholar] [CrossRef]
  15. Famiglietti, C.A.; Michalak, A.M.; Konings, A.G. Extreme wet events as important as extreme dry events in controlling spatial patterns of vegetation greenness anomalies. Environ. Res. Lett. 2021, 16, 074014. [Google Scholar] [CrossRef]
  16. de San Celedonio, R.P.; Abeledo, L.G.; Mantese, A.I.; Miralles, D.J. Differential root and shoot biomass recovery in wheat and barley with transient waterlogging during preflowering. Plant Soil 2017, 417, 481–498. [Google Scholar] [CrossRef]
  17. Wu, X.; Tang, Y.; Li, C.; Wu, C.; Huang, G. Chlorophyll Fluorescence and Yield Responses of Winter Wheat to Waterlogging at Different Growth Stages. Plant Prod. Sci. 2015, 18, 284–294. [Google Scholar] [CrossRef]
  18. Inoue, Y.; Morinaga, S.; Shibayama, M. Distinctive response of photosynthetic rate and water-use efficiency in 3 soybean varieties to waterlogging and drought-stress. Jpn. J. Crop Sci. 1993, 62, 638–640. [Google Scholar] [CrossRef]
  19. Dickin, E.; Wright, D. The effects of winter waterlogging and summer drought on the growth and yield of winter wheat (Triticum aestivum L.). Eur. J. Agron. 2008, 28, 234–244. [Google Scholar] [CrossRef]
  20. Cannell, R.Q.; Belford, R.K.; Gales, K.; Dennis, C.W.; Prew, R.D. Effects of waterlogging at different stages of development on the growth and yield of winter wheat. J. Sci. Food Agric. 1980, 31, 117–132. [Google Scholar] [CrossRef]
  21. Liu, W.W.; Sun, W.W.; Huang, J.F.; Wen, H.Y.; Huang, R. Excessive Rainfall Is the Key Meteorological Limiting Factor for Winter Wheat Yield in the Middle and Lower Reaches of the Yangtze River. Agronomy 2022, 12, 50. [Google Scholar] [CrossRef]
  22. Lesk, C.; Coffel, E.; Horton, R. Net benefits to US soy and maize yields from intensifying hourly rainfall. Nat. Clim. Chang. 2020, 10, 819–822. [Google Scholar] [CrossRef]
  23. Fontes, F.; Gorst, A.; Palmer, C. Threshold effects of extreme weather events on cereal yields in India. Clim. Change 2021, 165, 26. [Google Scholar] [CrossRef]
  24. Troy, T.J.; Kipgen, C.; Pal, I. The impact of climate extremes and irrigation on US crop yields. Environ. Res. Lett. 2015, 10, 054013. [Google Scholar] [CrossRef]
  25. Kalkuhl, M.; Wenz, L. The impact of climate conditions on economic production. Evidence from a global panel of regions. J. Environ. Econ. Manag. 2020, 103, 102360. [Google Scholar] [CrossRef]
  26. Holtermann, L. Precipitation anomalies, economic production, and the role of “first-nature” and “second-nature” geographies: A disaggregated analysis in high-income countries. Glob. Environ. Chang. 2020, 65, 102167. [Google Scholar] [CrossRef]
  27. Li, Q.; Ding, Q.; Wang, L.X.; Wu, D.L.; Hu, Z.H.; Wu, R.J. Effects of Shading and Waterlogging on the Photosynthesis and Yield Performance of Winter Wheat in Jiangsu Province, China. Int. J. Agric. Biol. 2019, 21, 472–478. [Google Scholar]
  28. Hu, J.; Yu, W.Z.; Liu, P.; Zhao, B.; Zhang, J.W.; Ren, B.Z. Responses of canopy functionality, crop growth and grain yield of summer maize to shading, waterlogging, and their combination stress at different crop stages. Eur. J. Agron. 2023, 144, 126761. [Google Scholar] [CrossRef]
  29. Jia, S.F.; Zhu, W.B.; Lu, A.F.; Yan, T.T. A statistical spatial downscaling algorithm of TRMM precipitation based on NDVI and DEM in the Qaidam Basin of China. Remote Sens. Environ. 2011, 115, 3069–3079. [Google Scholar] [CrossRef]
  30. Chen, C.; Zhao, S.H.; Duan, Z.; Qin, Z.H. An Improved Spatial Downscaling Procedure for TRMM 3B43 Precipitation Product Using Geographically Weighted Regression. IEEE J. Sel. Top. Appl. Earth Obs. Remote Sens. 2015, 8, 4592–4604. [Google Scholar] [CrossRef]
  31. Teng, H.F.; Shi, Z.; Ma, Z.Q.; Li, Y. Estimating spatially downscaled rainfall by regression kriging using TRMM precipitation and elevation in Zhejiang Province, southeast China. Int. J Remote Sens. 2014, 35, 7775–7794. [Google Scholar] [CrossRef]
  32. Chen, Y.Y.; Huang, J.F.; Sheng, S.X.; Mansaray, L.R.; Liu, Z.X.; Wu, H.Y.; Wang, X.Z. A new downscaling-integration framework for high-resolution monthly precipitation estimates: Combining rain gauge observations, satellite-derived precipitation data and geographical ancillary data. Remote Sens. Environ. 2018, 214, 154–172. [Google Scholar] [CrossRef]
  33. Chen, F.R.; Gao, Y.Q.; Wang, Y.G.; Li, X. A downscaling-merging method for high-resolution daily precipitation estimation. J. Hydrol. 2020, 581. [Google Scholar] [CrossRef]
  34. Ma, Z.Q.; He, K.; Tan, X.; Liu, Y.; Lu, H.Y.; Shi, Z. A new approach for obtaining precipitation estimates with a finer spatial resolution on a daily scale based on TMPA V7 data over the Tibetan Plateau. Int. J. Remote Sens. 2019, 40, 8465–8483. [Google Scholar] [CrossRef]
  35. Luo, Y.; Zhang, Z.; Li, Z.; Chen, Y.; Zhang, L.; Cao, J.; Tao, F. Identifying the spatiotemporal changes of annual harvesting areas for three staple crops in China by integrating multi-data sources. Environ. Res. Lett. 2020, 15, 074003. [Google Scholar] [CrossRef]
  36. Dong, J.; Fu, Y.Y.; Wang, J.J.; Tian, H.F.; Fu, S.; Niu, Z.; Han, W.; Zheng, Y.; Huang, J.X.; Yuan, W.P. Early-season mapping of winter wheat in China based on Landsat and Sentinel images. Earth Syst. Sci. Data 2020, 12, 3081–3095. [Google Scholar] [CrossRef]
  37. Kyriakidis, P. A geostatistical framework for area-to-point spatial interpolation. Geogr. Anal. 2004, 36, 259–289. [Google Scholar] [CrossRef]
  38. Kyriakidis, P.C.; Yoo, E.H. Geostatistical prediction and simulation of point values from areal data. Geogr. Anal. 2005, 37, 124–151. [Google Scholar] [CrossRef]
  39. Wang, Q.M.; Shi, W.Z.; Atkinson, P.M. Area-to-point regression kriging for pan-sharpening. Isprs J. Photogramm. Remote Sens. 2016, 114, 151–165. [Google Scholar] [CrossRef]
  40. Zhang, Y.H.; Atkinson, P.M.; Ling, F.; Foody, G.M.; Wang, Q.; Ge, Y.; Li, X.D.; Du, Y. Object based area to point pegression kriging for pansharpening. IEEE T Geosci. Remote 2021, 59, 8599–8614. [Google Scholar] [CrossRef]
  41. Wang, Q.M.; Shi, W.Z.; Li, Z.B.; Atkinson, P.M. Fusion of Sentinel-2 images. Remote Sens. Environ. 2016, 187, 241–252. [Google Scholar] [CrossRef]
  42. Zhang, Y.H.; Atkinson, P.M.; Ling, F.; Wang, Q.M.; Li, X.D.; Shi, L.F.; Du, Y. Spectral-spatial adaptive area to point regression kriging for MODIS image downscaling. IEEE J. Sel. Top. Appl. Earth Obs. Remote Sens. 2017, 10, 1883–1896. [Google Scholar] [CrossRef]
  43. Brus, D.J.; Boogaard, H.; Ceccarelli, T.; Orton, T.G.; Traore, S.; Zhang, M. Geostatistical disaggregation of polygon maps of average crop yields by area-to-point kriging. Eur. J. Agron. 2018, 97, 48–59. [Google Scholar] [CrossRef]
  44. Xang, Y.; Cheng, T.; Wang, K.; Li, J.; Tang, H. The analysis on spatial and temporal distribution features of continuous rain in Jiangsu. J. Meteorol. Sci. 2011, 31, 36–39. [Google Scholar]
  45. Lesk, C.; Coffel, E.; Winter, J.; Ray, D.; Zscheischler, J.; Seneviratne, S.I.; Horton, R. Stronger temperature-moisture couplings exacerbate the impact of climate warming on global crop yields. Nat. Food 2021, 2, 683–691. [Google Scholar] [CrossRef]
  46. Eck, M.A.; Murray, A.R.; Ward, A.R.; Konrad, C.E. Influence of growing season temperature and precipitation anomalies on crop yield in the southeastern United States. Agric. For. Meteorol. 2020, 291, 108053. [Google Scholar] [CrossRef]
  47. Jiang, M.; Xuan, S.L.; Muneer, M.A.; Sun, B.; Shi, C.L.; Liu, F.S.; Wu, R.Y. Response of dry matter partition and yield components to waterlogging and sunlight shortage in different growth stages of wheat. Nat. Hazards 2022, 110, 1133–1152. [Google Scholar] [CrossRef]
  48. Zhang, X.; Chen, N.C.; Li, J.Z.; Chen, Z.H.; Niyogi, D. Multi-sensor integrated framework and index for agricultural drought monitoring. Remote Sens. Environ. 2017, 188, 141–163. [Google Scholar] [CrossRef]
  49. Linkov, I.; Bridges, T.; Creutzig, F.; Decker, J.; Fox-Lent, C.; Kröger, W.; Lambert, J.H.; Levermann, A.; Montreuil, B.; Nathwani, J.; et al. Changing the resilience paradigm. Nat. Clim. Chang. 2014, 4, 407–409. [Google Scholar] [CrossRef]
  50. Atube, F.; Okello, D.M.; Malinga, G.M.; Nyeko, M.; Okello-Uma, I. Farmers’ adaptation to climate change and crop yield: A case of Amuru and Apac districts of Northern Uganda. Int. J. Agric. Sustain. 2022, 20, 967–981. [Google Scholar] [CrossRef]
  51. Marie, M.; Yirga, F.; Haile, M.; Tquabo, F. Farmers’ choices and factors affecting adoption of climate change adaptation strategies: Evidence from northwestern Ethiopia. Heliyon 2020, 6, e03867. [Google Scholar] [CrossRef]
  52. Jackson, M.B.; Colmer, T.D. Response and adaptation by plants to flooding stress-Preface. Ann. Bot. 2005, 96, 501–505. [Google Scholar] [CrossRef]
  53. Parent, C.; Capelli, N.; Berger, A.; Crevècoeur, M.; Dat, J. An Overview of Plant Responses to Soil Waterlogging. Plant Stress 2008, 2, 20–27. [Google Scholar]
  54. Liu, W.; Huang, J.; Wei, C.; Wang, X.; Mansaray, L.R.; Han, J.; Zhang, D.; Chen, Y. Mapping water-logging damage on winter wheat at parcel level using high spatial resolution satellite data. ISPRS J. Photogramm. Remote Sens. 2018, 142, 243–256. [Google Scholar] [CrossRef]
  55. Leng, G.Y.; Hall, J. Crop yield sensitivity of global major agricultural countries to droughts and the projected changes in the future. Sci. Total Environ. 2019, 654, 811–821. [Google Scholar] [CrossRef]
  56. Hamal, K.; Sharma, S.; Khadka, N.; Haile, G.G.; Joshi, B.B.; Xu, T.L.; Dawadi, B. Assessment of drought impacts on crop yields across Nepal during 1987–2017. Meteorol. Appl. 2020, 27, e1950. [Google Scholar] [CrossRef]
  57. Liu, Y.E.; Hou, P.; Huang, G.R.; Zhong, X.L.; Li, H.R.; Zhao, J.R.; Li, S.K.; Mei, X.R. Maize grain yield and water use efficiency in relation to climatic factors and plant population in northern China. J. Integr. Agric. 2021, 20, 3156–3169. [Google Scholar] [CrossRef]
  58. Lu, E. Determining the start, duration, and strength of flood and drought with daily precipitation: Rationale. Geophys. Res. Lett. 2009, 36. [Google Scholar] [CrossRef]
  59. Pengcheng, Q.; Zhixiong, L.; Suqin, W.; Min, L.; Rongrui, S. Application and Validation of Weighted Moisture Index in Waterlogging Disaster Monitoring. Resour. Environ. Yangtze Basin 2018, 27, 328–334. [Google Scholar]
  60. Pengcheng, Q.; Min, L.; Lan, L. Application of Effective Precipitation Index in Rainstorm Flood Disaster Monitoring and Assessment. Chin. J. Agrometeorol. 2016, 37, 84–90. [Google Scholar]
  61. Xu, R.; Li, Y.; Guan, K.; Zhao, L.; Peng, B.; Miao, C.; Fu, B. Divergent responses of maize yield to precipitation in the United States. Environ. Res. Lett. 2022, 17, 014016. [Google Scholar] [CrossRef]
  62. Butler, E.E.; Huybers, P. Adaptation of US maize to temperature variations. Nat. Clim. Chang. 2013, 3, 68–72. [Google Scholar] [CrossRef]
Figure 1. Study area with winter wheat mapping from [35]; the yellow points represent rain gauge stations.
Remotesensing 15 02573 g001
Figure 2. The framework proposed in this study.
Remotesensing 15 02573 g002
Figure 3. The conceptual graphs of the ARD calculation for different CRPs in a winter wheat growing season, taking CRPs of 5 days, 10 days, and 15 days as examples to calculate the corresponding ARD.
Remotesensing 15 02573 g003
Figure 4. Scatter density plot of original TRMM (ori-TRMM, (a)), DTRMM (b), and DTRMM_GWRK (c) estimates compared with rain gauge observations from 1998 to 2014 and the corresponding quantitative error statistics.
Remotesensing 15 02573 g004
Figure 5. Box plots of error statistics of ori_TRMM, DTRMM, and DTRMM_GWRK estimates for all 203 stations: RMSE (a), bias (b), MAE (c), R (d), POD (e), FAR (f), and CSI (g).
Remotesensing 15 02573 g005
Figure 6. The accuracy of POD (a), FAR (b), and CSI (c) of TRMM 3B42, DTRMM, and DTRMM_GWRK at different daily precipitation levels.
Remotesensing 15 02573 g006
Figure 7. Heatmap of the YCR under different combinations of ARDs and CRPs (a); variation in the YCR with the CRPs for same the ARD (b); the ARD variation for a specific YCR under different CRPs (c).
Remotesensing 15 02573 g007
Figure 8. Scatter plots of the YCR and ARD for CRPs of 5 days (a), 6 days (b), 7 days (c), 8 days (d), 9 days (e), 10 days (f), 11 days (g), 12 days (h), 13 days (i), 14 days (j), and 15 days (k). Note: ** means the determination coefficient is significant at the p ≤ 0.01 level.
Remotesensing 15 02573 g008
Figure 9. Scatter plots of the county-level YCR and the corresponding mean ARD for a CRP of 11 days from the 1998–1999 to 2013–2014 (ap) growing seasons with the quadratic polynomial fitting line and 95% confidence interval. The fitting R2 is also presented. Note: * and ** means the determination coefficient is significant at the p ≤ 0.05 and p ≤ 0.01 level, respectively.
Remotesensing 15 02573 g009
Figure 10. Waterlogging mapping for the 1998–1999 to 2013–2014 growing seasons.
Remotesensing 15 02573 g010
Figure 11. Different waterlogged areas according to the waterlogging mapping from 1999 to 2014.
Remotesensing 15 02573 g011
Figure 12. Waterlogging mapping results using the TRMM 3B42 downscaled–fusion precipitation estimates (a) and rain gauge measurements for the 2001–2002 winter wheat growing season (b).
Remotesensing 15 02573 g012
Figure 13. Variation in PCI, SMCI, and VCI in Anhui (a), Jiangsu (b), and Hubei (c) from October 2001 to May 2002.
Remotesensing 15 02573 g013
Table 1. Detailed information of rain gauge stations and winter wheat yield.
Study AreaCounty-Level
Yield
Used in This StudyNumber of Stations
Anhui1978–20141998–201476
Jiangsu1978–20141998–201460
Hubei1978–20141998–201467
Disclaimer/Publisher’s Note: The statements, opinions and data contained in all publications are solely those of the individual author(s) and contributor(s) and not of MDPI and/or the editor(s). MDPI and/or the editor(s) disclaim responsibility for any injury to people or property resulting from any ideas, methods, instructions or products referred to in the content.

