Article

Has the Dominant Climatic Driver for the Carbon Budget of Alpine Grassland Shifted from Temperature to Precipitation on the Qinghai–Tibet Plateau?

1
Lhasa Plateau Ecosystem Research Station, Key Laboratory of Ecosystem Network Observation and Modeling, Institute of Geographic Sciences and Natural Resources Research, Chinese Academy of Sciences, Beijing 100101, China
2
College of Resources and Environment, University of Chinese Academy of Sciences, Beijing 100190, China
*
Author to whom correspondence should be addressed.
Remote Sens. 2023, 15(10), 2492; https://doi.org/10.3390/rs15102492
Submission received: 25 March 2023 / Revised: 6 May 2023 / Accepted: 7 May 2023 / Published: 9 May 2023

Abstract

:
The alpine grassland on the Qinghai–Tibet Plateau (AGQTP) has undergone severe climate change. Although the carbon budget of AGQTP proved to have altered significantly, the spatiotemporal dynamics and the driving mechanism of the changes remain debated. This study estimated the gross primary productivity (GPP), ecosystem respiration (ER), and net ecosystem productivity (NEP) of the AGQTP, based on remote sensing models, and analyzed their spatiotemporal dynamics and their climatic driving mechanism. Our results showed that the GPP, ER, and NEP increased at rates of 0.002 Pg C yr−2, 0.013 Pg C yr−2, and 0.0007 Pg C yr−2, respectively, during 2000–2020, with substantial spatiotemporal variability. The changes in GPP were influenced by both temperature and precipitation, while NEP and ER were primarily affected by precipitation and temperature, respectively. However, the primary climatic driver of the carbon budget may have shifted from temperature to precipitation around 2010, and the impact of temperature on carbon sink was limited by local water conditions. Furthermore, we found that climate change, particularly precipitation variation, had notable legacy effects on the carbon budget of the AGQTP. Our findings highlight that the climatic impact on the carbon budget is dynamic and long-lasting, rather than static and short-lived, which should be considered in ecosystem carbon budget simulations and other related studies.

Graphical Abstract

1. Introduction

Human-induced climate change beyond natural climate variability has caused widespread adverse impacts and damage to ecosystems [1,2]. Global warming, which is expected to reach 1.5 °C shortly (currently 1.2 °C) [2], presents multiple risks to ecosystems that will result in irreversible impacts on polar and mountain ecosystems with low resilience [2]. Previous studies have indicated that high-altitude and high-latitude regions are more sensitive to climate change than other regions [3,4,5]. The Qinghai–Tibet Plateau (QTP) is the highest and one of the most climatically sensitive and ecologically fragile regions in the world [6,7,8]. The QTP exerts a profound impact on both the regional and global climate [9,10,11]. Moreover, its influence extends beyond Asia, affecting environmental changes throughout the northern hemisphere [9,12]. With a warming rate of ~0.4 °C decade−1 (almost twice the global mean) and a wetting trend [9,13], the plateau has experienced great eco-environmental changes over the last 50 years [5,14].
With its coverage spanning over 60% of the QTP, alpine grassland constitutes the dominant vegetation type in the region [15,16,17]. It accounts for 44% of China’s grasslands and 6% of the world’s grasslands [7,18]. The structure and function of the alpine grassland have changed dramatically since the 1980s due to climate change [19,20,21]. Warming and wetting have greatly enhanced the productivity and respiration of the grassland ecosystem on the plateau [22,23]. However, in the context of carbon neutrality, greater attention is being paid to the spatiotemporal variation of net carbon uptake, which has not yet been systematically evaluated. In addition, the respiratory sensitivity of the ecosystem on the plateau will decrease significantly as the climate warms [24], but the extent of the decrease is unclear. Therefore, it is necessary to systematically evaluate the carbon budget and its climatic driving mechanism in the alpine grassland on the QTP (AGQTP).
Process-based ecosystem models have become an important method for the carbon budget assessment of global and regional ecosystems [25], including the Global Carbon Project [26]. However, there are often large gaps in the carbon budget results estimated using different models [25,27]. Estimating regional carbon budgets in the QTP is challenging due to the complexity of vegetation, soils, and weather patterns, and a lack of adequate ground-based data for model calibration and validation [20,23]. Additionally, climate change is impacting temperature and precipitation patterns at an accelerated rate, further complicating the estimation of regional carbon budgets [20,28]. Research based on the ORCHIDEE (Organizing Carbon and Hydrology In Dynamic Ecosystems) model showed that the carbon sink of the AGQTP in the 2000s was 21.8 Tg C yr−1 [7], while research based on the Terrestrial Ecosystem Model showed that the carbon sink was about 16.5 Tg C yr−1 during the same period [29]. However, a recent study utilizing the CASA (Carnegie–Ames–Stanford Approach) model and the soil heterotrophic respiration model developed by Bond-Lamberty [30] indicated that the carbon sink during the period of 2001–2015 was approximately 128 Tg C yr−1, significantly surpassing the previous findings of the aforementioned research [31].
There is also great controversy about the driving mechanism of the carbon budget of the AGQTP. A previous study revealed that variations in CO2 concentration and precipitation were the main drivers of changes in the carbon sink of the AGQTP during 1961–2009, and although climate warming benefited vegetation growth, it did not significantly accelerate the net carbon uptake due to its acceleration of soil organic matter decomposition [7]. A study based on field experiments and meta-analysis has also shown that under drought conditions, the indirect effect of warming will inhibit the direct effect of temperature increases on the NEP [32]. However, another study suggested that the increase in temperature, instead of precipitation, was the main driver of the carbon budget of the AGQTP [29]. In addition, one previous study even suggested that the increase in precipitation and temperature constrained the carbon sink of the AGQTP [31]. Therefore, the estimation and driving mechanisms of the carbon budget of the AGQTP, especially in the last decade, remain uncertain.
Building on the background and findings of prior research, we hypothesized that the carbon budget of the QTP exhibited an overall upsurge in the first 20 years of the 21st century due to climate change, but the climatic driving factors of the carbon budget varied both in space and time. To test the hypotheses, we utilized both remote sensing and observational data, and we employed two models, namely the Photosynthetic Capacity Model (PCM) [33] and the Ecosystem Respiration Remote Sensing Model (ReRSM) [34], which enabled us to simulate three essential carbon budget indicators relevant to the alpine grassland on the QTP (AGQTP), including gross primary productivity (GPP), ecosystem respiration (ER), and net ecosystem productivity (NEP). The primary objective of this study is to examine the spatiotemporal dynamics in the carbon budget of the AGQTP, to elucidate the impact of climatic factors (air temperature and precipitation) on the carbon budget dynamics, and to clarify their driving strength, spatial heterogeneity, and temporal variability over 21 years (2000–2020).

2. Materials and Methods

2.1. Study Area

The QTP (26°00′–39°47′N, 73°19′–104°47′E), known as the Third Pole of the earth, covering about 2.5 million km2, is the largest and highest plateau in the world (average elevation >4000 m a.s.l) [6,7,8]. The QTP is higher in the west and lower in the east, with diverse land cover, including glaciers, permafrost, deserts, and various vegetation types, but it is mainly (more than 60%) covered by grassland (Figure 1a) [8,15,16]. The annual average air temperature in most areas of the plateau is below 0 °C, and the average monthly air temperature ranged from –11.6 °C in January to 9.1 °C in July during 2000–2020. The annual average precipitation ranges from 100 mm year−1 on the northwest to over 1000 mm year−1 on the southeast [35]. Regionally, the air temperature and precipitation on the QTP increase from the northwest to the southeast (Figure 1c,d) [9,36]. From 2000 to 2020, the air temperature (TEMP) and precipitation (PPT) over the grassland increased at rates of 0.037 °C yr−1 and 1.97 mm yr−1, respectively (Figure 1b). In this study, six types of grassland on the QTP were involved (Figure 1a), among which alpine meadow and alpine steppe are the main grassland types, accounting for 45.8% and 44.9% of the total grassland area, respectively. The other four grassland types are temperate meadow, temperate steppe, alpine desert steppe, and tropical–subtropical grassland, and their area accounts for less than 10%. The grassland was divided into six types and different model parameters were assigned to reflect the differences among different grasslands and improve the accuracy of carbon budget simulations. However, in terms of spatial heterogeneity, this study focused on distinguishing the differences in carbon budget among different orientations and climate zones (Figure 1a, Arid, Semi-arid, Semi-humid, and Humid) on the QTP.

2.2. Data and Data Processing

The monthly total precipitation and mean temperature between 2000 and 2020 were collected from the National Meteorological Information Center (http://data.cma.cn/, accessed on 8 May 2022) and interpolated into 1 km resolution raster data using ANUSPLIN 4.3 [37], which includes the incorporation of covariate variables to improve accuracy [38]. Validation of our interpolated meteorological data using data from multiple meteorological observation stations, such as Damxung and Nagqu, showed that our interpolated data explained over 90% of the actual observed data for both temperature and precipitation [38,39]. The MODIS data of the enhanced vegetation index (EVI) and the land surface temperature (LST), as well as imagery data for the land surface water index (LSWI), were downloaded from the Land Processes Distributed Active Archive Center (https://lpdaac.usgs.gov/, accessed on 12 July 2022) and converted to raster data with a spatial resolution of 1 km. The data on grassland type were obtained from the vegetation atlas of China, which is available at the Resource and Environment Science and Data Center of the Chinese Academy of Sciences (https://www.resdc.cn/data.aspx?DATAID=122, accessed on 25 December 2021). The GPP, ER, and NEP data from different CMIP6 (Coupled Model Intercomparison Project Phase 6) earth system models were downloaded from the World Climate Research Programme (https://esgf-node.llnl.gov/search/cmip6/, accessed on 10 September 2022).

2.3. Model Description

In this study, the GPP was estimated using the Photosynthetic Capacity Model (PCM) [33]. The PCM can be expressed as follows:
G P P = P C m a x × E V I 0.1 × 1 + L S W I 1 + L S W I m a x
where PCmax represents the maximum photosynthetic capacity of a certain region, EVI is the enhanced vegetation index, LSWI is the land surface water index, and LSWImax is the maximum LSWI during the growing season for each pixel [33]. The equation for LSWI is as follows [40]:
L S W I = ρ n i r ρ s w i r ρ n i r + ρ s w i r
where ρ n i r and ρ s w i r are the spectral reflectances of the near-infrared and short-infrared bands in the MODIS imagery, respectively [33,40].
The ER was estimated using a remote sensing model (ReRSM) [34]. The ReRSM can be expressed as follows:
E R = R G P P + R E O M = a × G P P + R r e f × e E 0 × 1 / 61.02 1 / L S T + 46.02
where RGPP is the GPP-derived respiration, which can be represented by a fraction of GPP (parameter a) [34]. REOM stands for respiration derived from reserved ecosystem organic matter (EOM) [34]. Rref is the EOM-derived respiration at the reference temperature [34]. E0 is the activation energy parameter and LST is the land surface temperature [34].
The NEP was calculated by subtracting the ER from the GPP, i.e., the following equation [41]:
N E P = G P P E R
where GPP and ER are calculated from the above equations.

2.4. Model Calibration and Validation

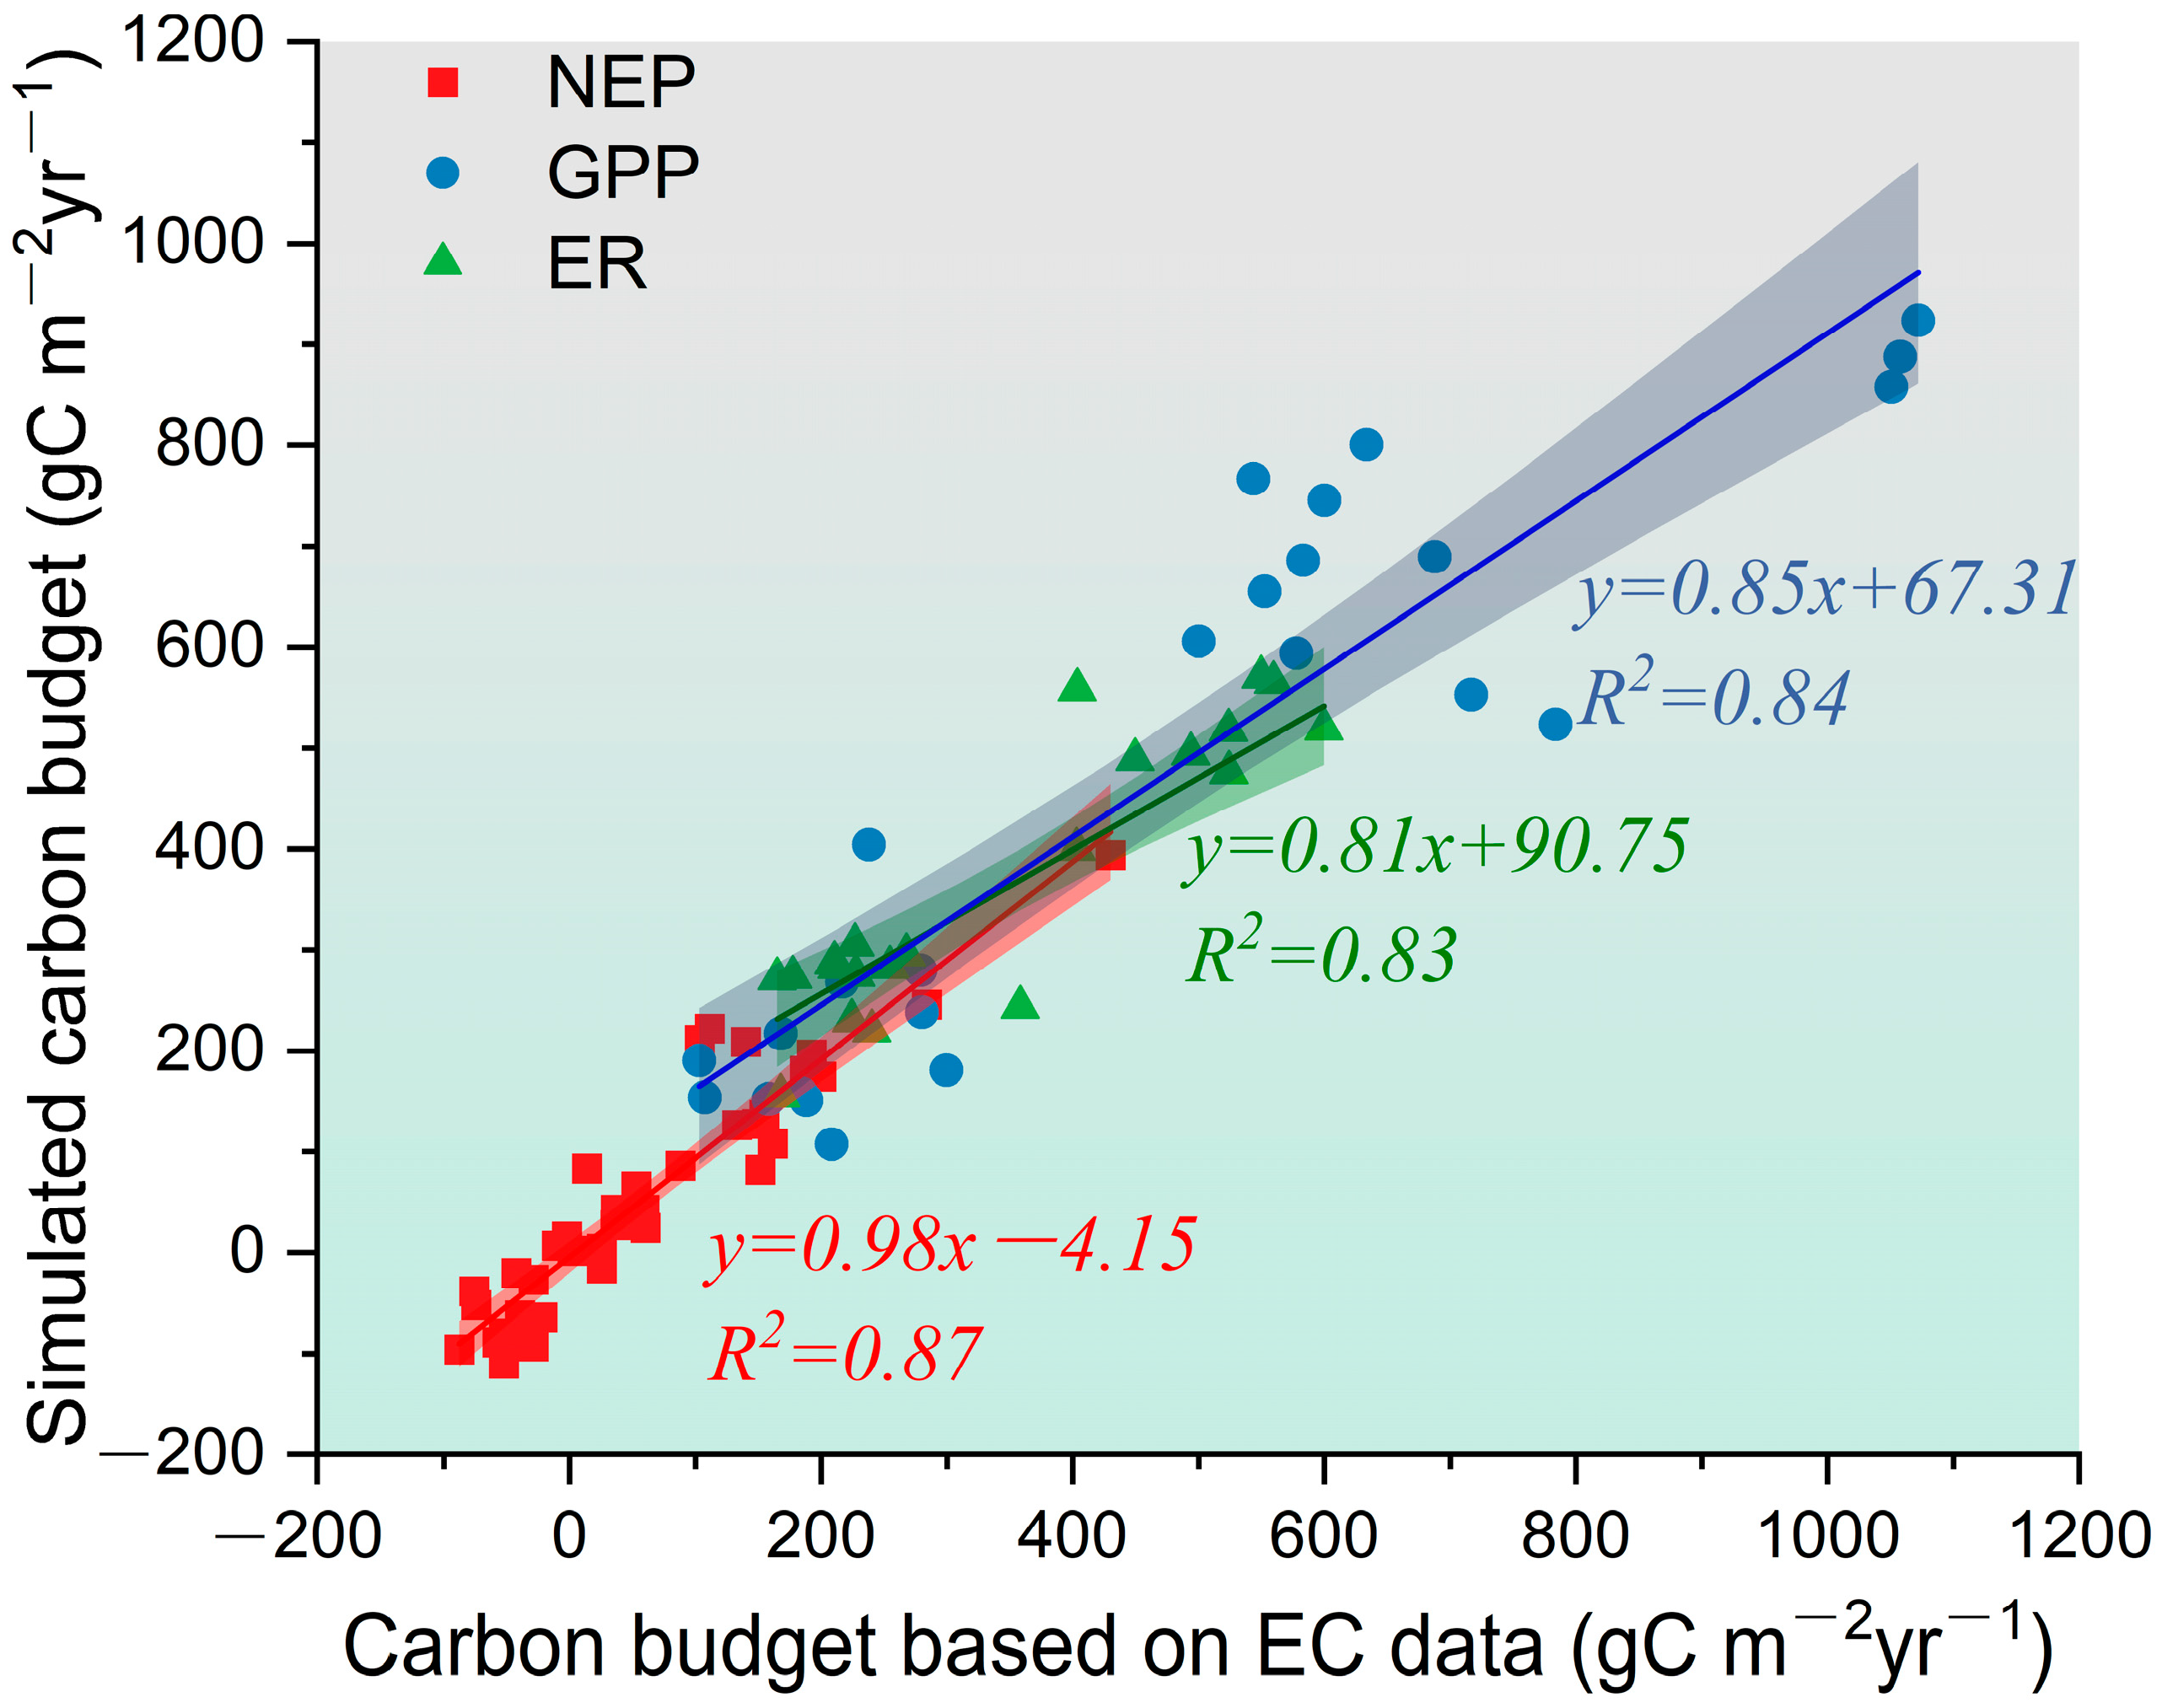
The eddy covariance (EC) technique is an efficient method used to observe the instantaneous net CO2 exchange between the atmosphere and the biosphere [42,43,44]. This technique is increasingly used for the calibration and validation of ecosystem models [44,45]. To calibrate and validate the model, 40 site-years of NEP data, 26 site-years of GPP data, and 22 site-years of ER data from 21 eddy covariance (EC) observation sites (16 sites on meadow and 5 sites on steppe) (Figure 1a) were collected from previous research [5,44,46,47] and the National Tibetan Plateau Data Center (https://data.tpdc.ac.cn/home, accessed on 22 March 2022). The linear fitting method was employed to test the agreement between simulated results and the EC data, and R2 and 95% confidence bands were used to characterize the degree of fitting (Figure 2). The validation results indicated that the simulated carbon budget (GPP, ER, and NEP) data matched well with the EC-based data (Figure 2).

2.5. Statistical Analysis

In this study, various statistical methods were employed to analyze the trends and correlations of variables such as air temperature, precipitation, and carbon budget indicators. Specifically, linear regression was used to determine the overall trend of these variables. The Sen’s slope estimator, originally proposed by Sen in 1968 [48], has been utilized to detect trends in carbon budget indicators at the pixel scale. Concurrently, the nonparametric Mann–Kendall (MK) test [49,50] was employed to test the statistical significance of these trends. Furthermore, the partial correlation method was applied to test the correlation between two variables. To investigate the differences in NEP among different grassland categories, the one-way analysis of variance (ANOVA) was employed. The significance in statistical analysis of non-raster data was determined through T-tests or F-tests, and the degree of significance was reflected by the p value. Prior to conducting statistical analysis, all non-raster data were subjected to normality testing using the Shapiro–Wilk test and homogeneity of variance testing using the Bartlett test. In addition, the sliding window method was utilized to analyze trend changes, with a sliding step of 1 year. To identify the optimal window lengths that yielded the most significant changes in trends, all window lengths ranging from 3 to 18 years were tested. It is noteworthy that the selection of window length settings was based on specific application scenarios and was not uniform across all analyses.

3. Results

3.1. Change and Distribution of the Annual GPP, ER, and NEP

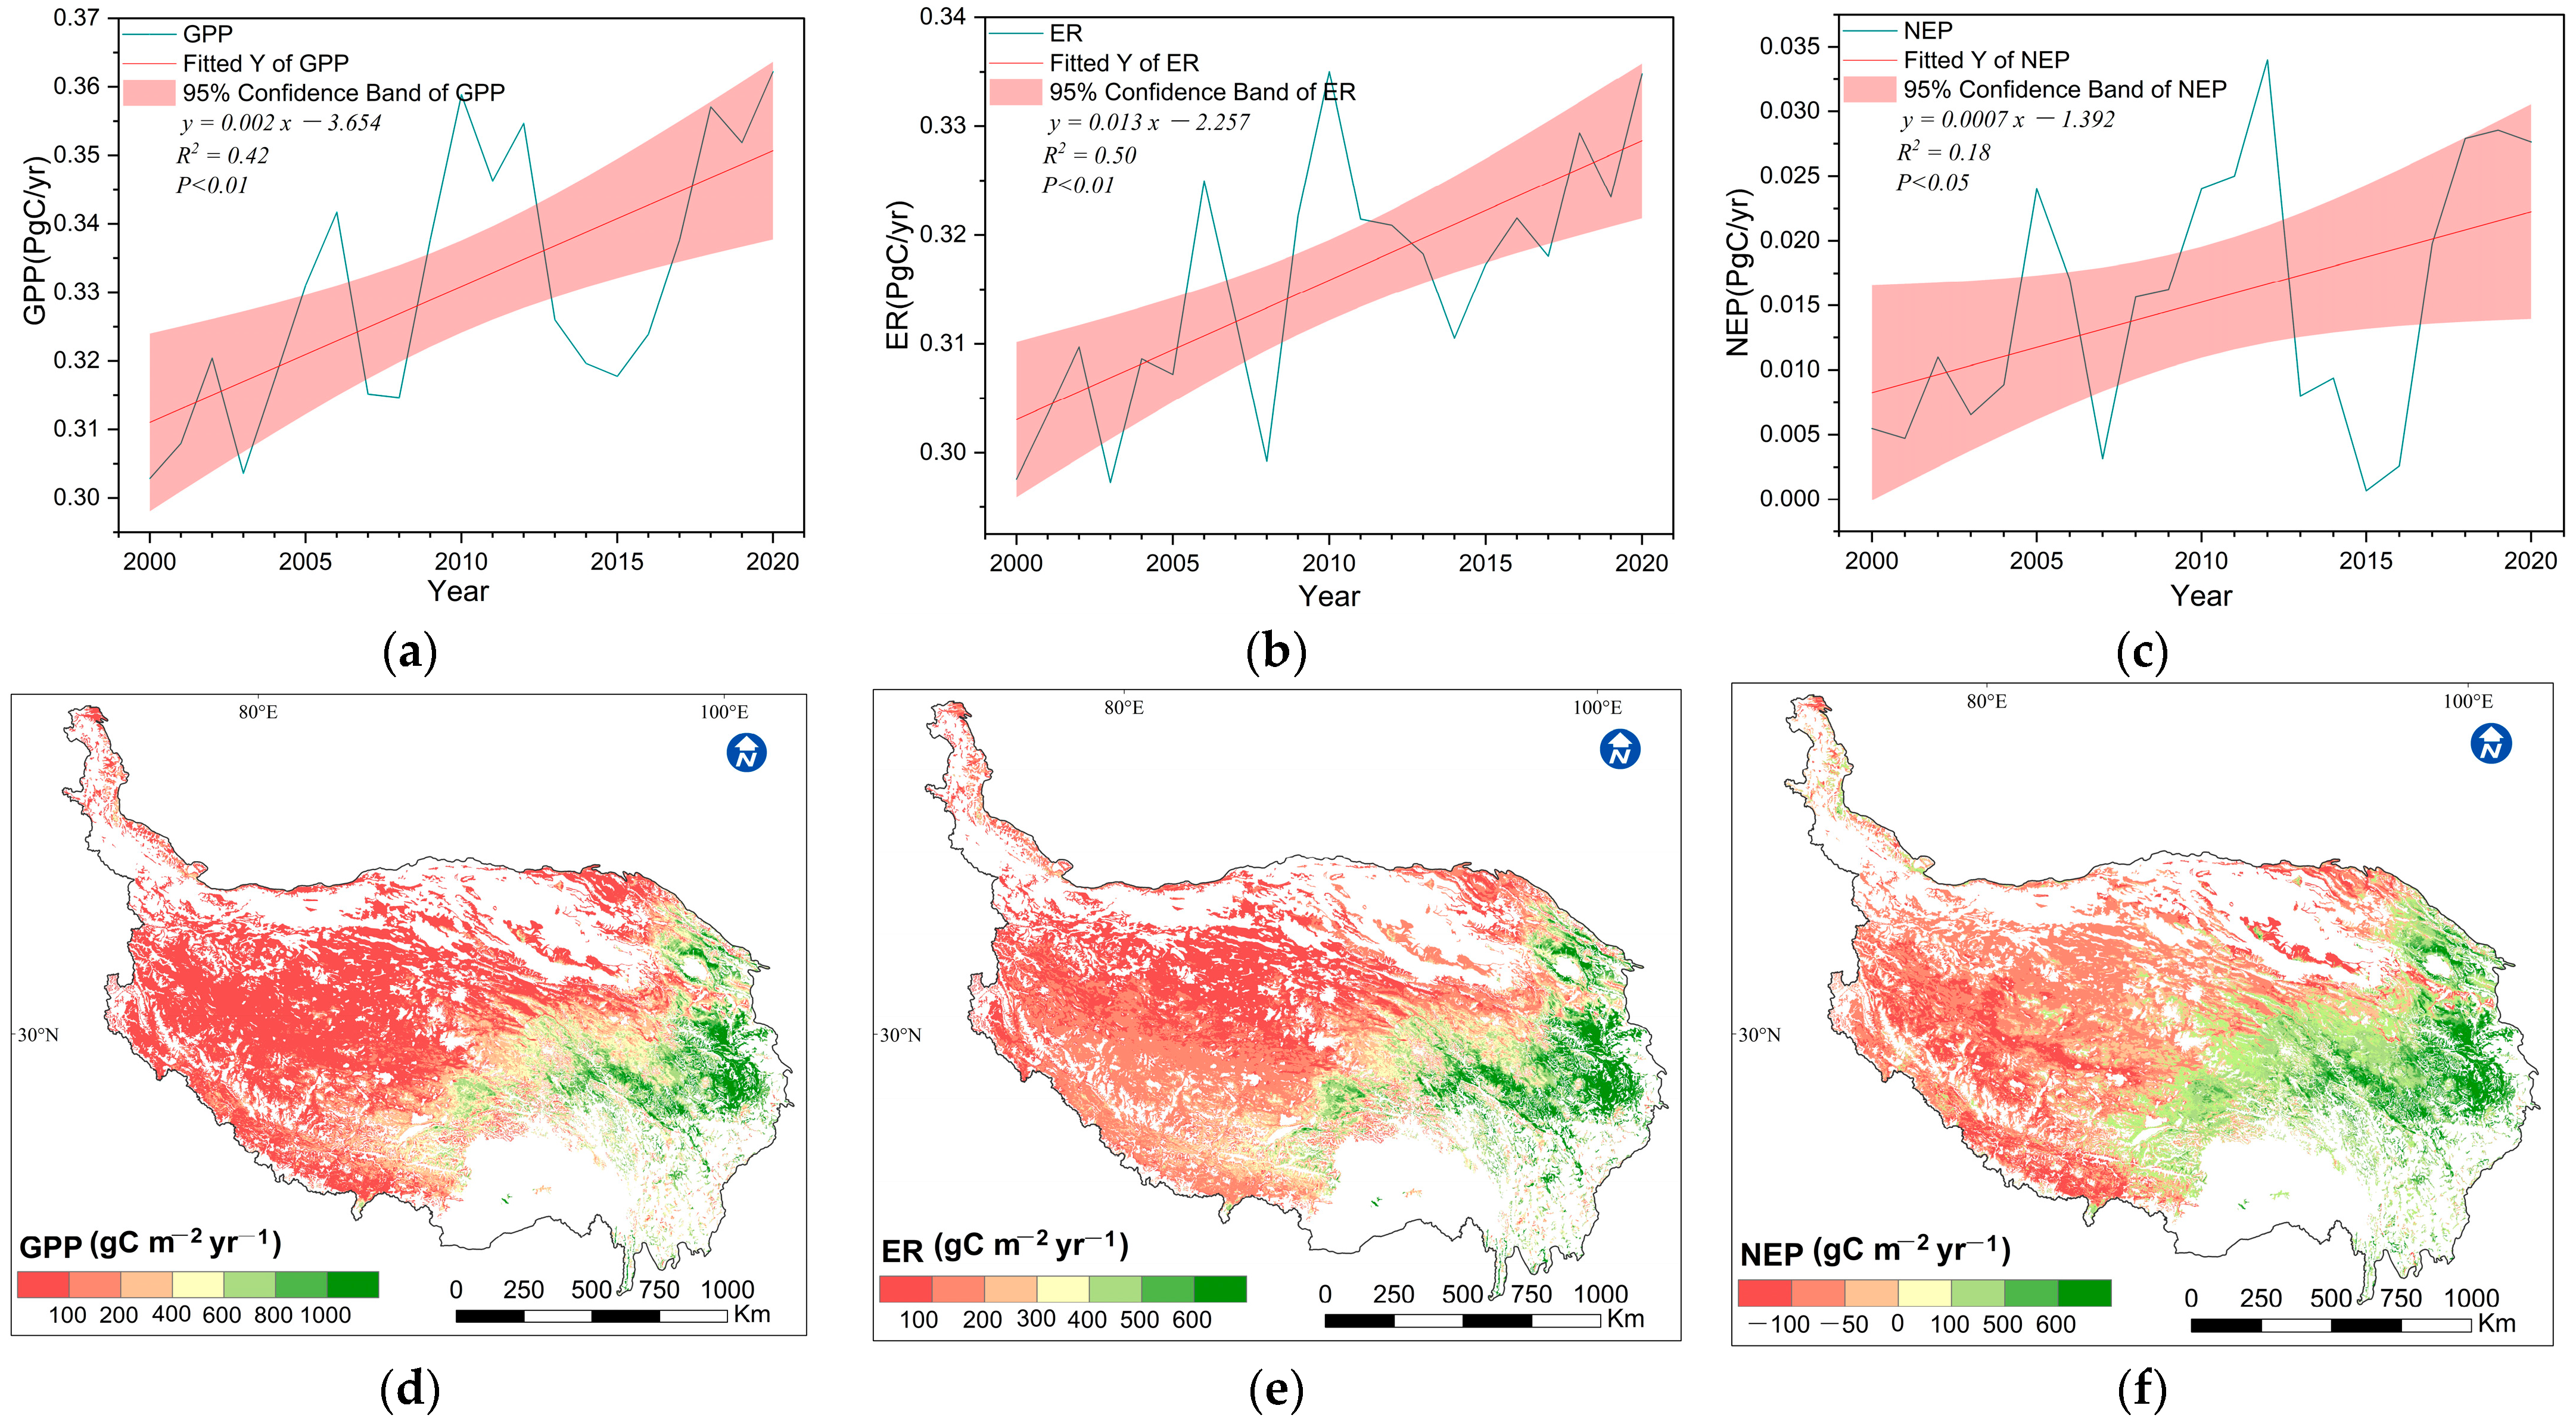
Simulation results indicate that AGQTP had an average annual GPP, ER, and NEP of 330.9 Tg C yr−1, 315.9 Tg C yr−1, and 15.25 Tg C yr−1, respectively. From 2000 to 2020, GPP, ER, and NEP all significantly increased (p < 0.05) at rates of 0.002 Pg C yr−2, 0.013 Pg C yr−2, and 0.0007 Pg C yr−2, respectively, but displayed noticeable inter-annual fluctuations (Figure 3a–c). It was noted that from 2012 to 2018, both the GPP and NEP dropped sharply and then rebounded rapidly (Figure 3a,c). As shown, the mean annual GPP, ER, and NEP gradually increased from northwest to southeast generally, which was roughly consistent with the hydrothermal gradient of the QTP (Figure 3d–f). The one-way analysis of variance (ANOVA) based on the NEP pixel values of meadows and steppes showed significant differences (p < 0.05) in NEP between these two categories of grasslands. The majority of meadows had higher NEP values, with a mean of 82.03 gC m−2yr−1 and a range of –153.42 to 429.89 gC m−2yr−1, indicating that they primarily functioned as carbon sinks (Figure 3f). In contrast, most steppes functioned as carbon sources, as evidenced by their low NEP values (mean −56.62 gC m−2yr−1) (Figure 3f).

3.2. Spatiotemporal Trends in GPP, ER, and NEP

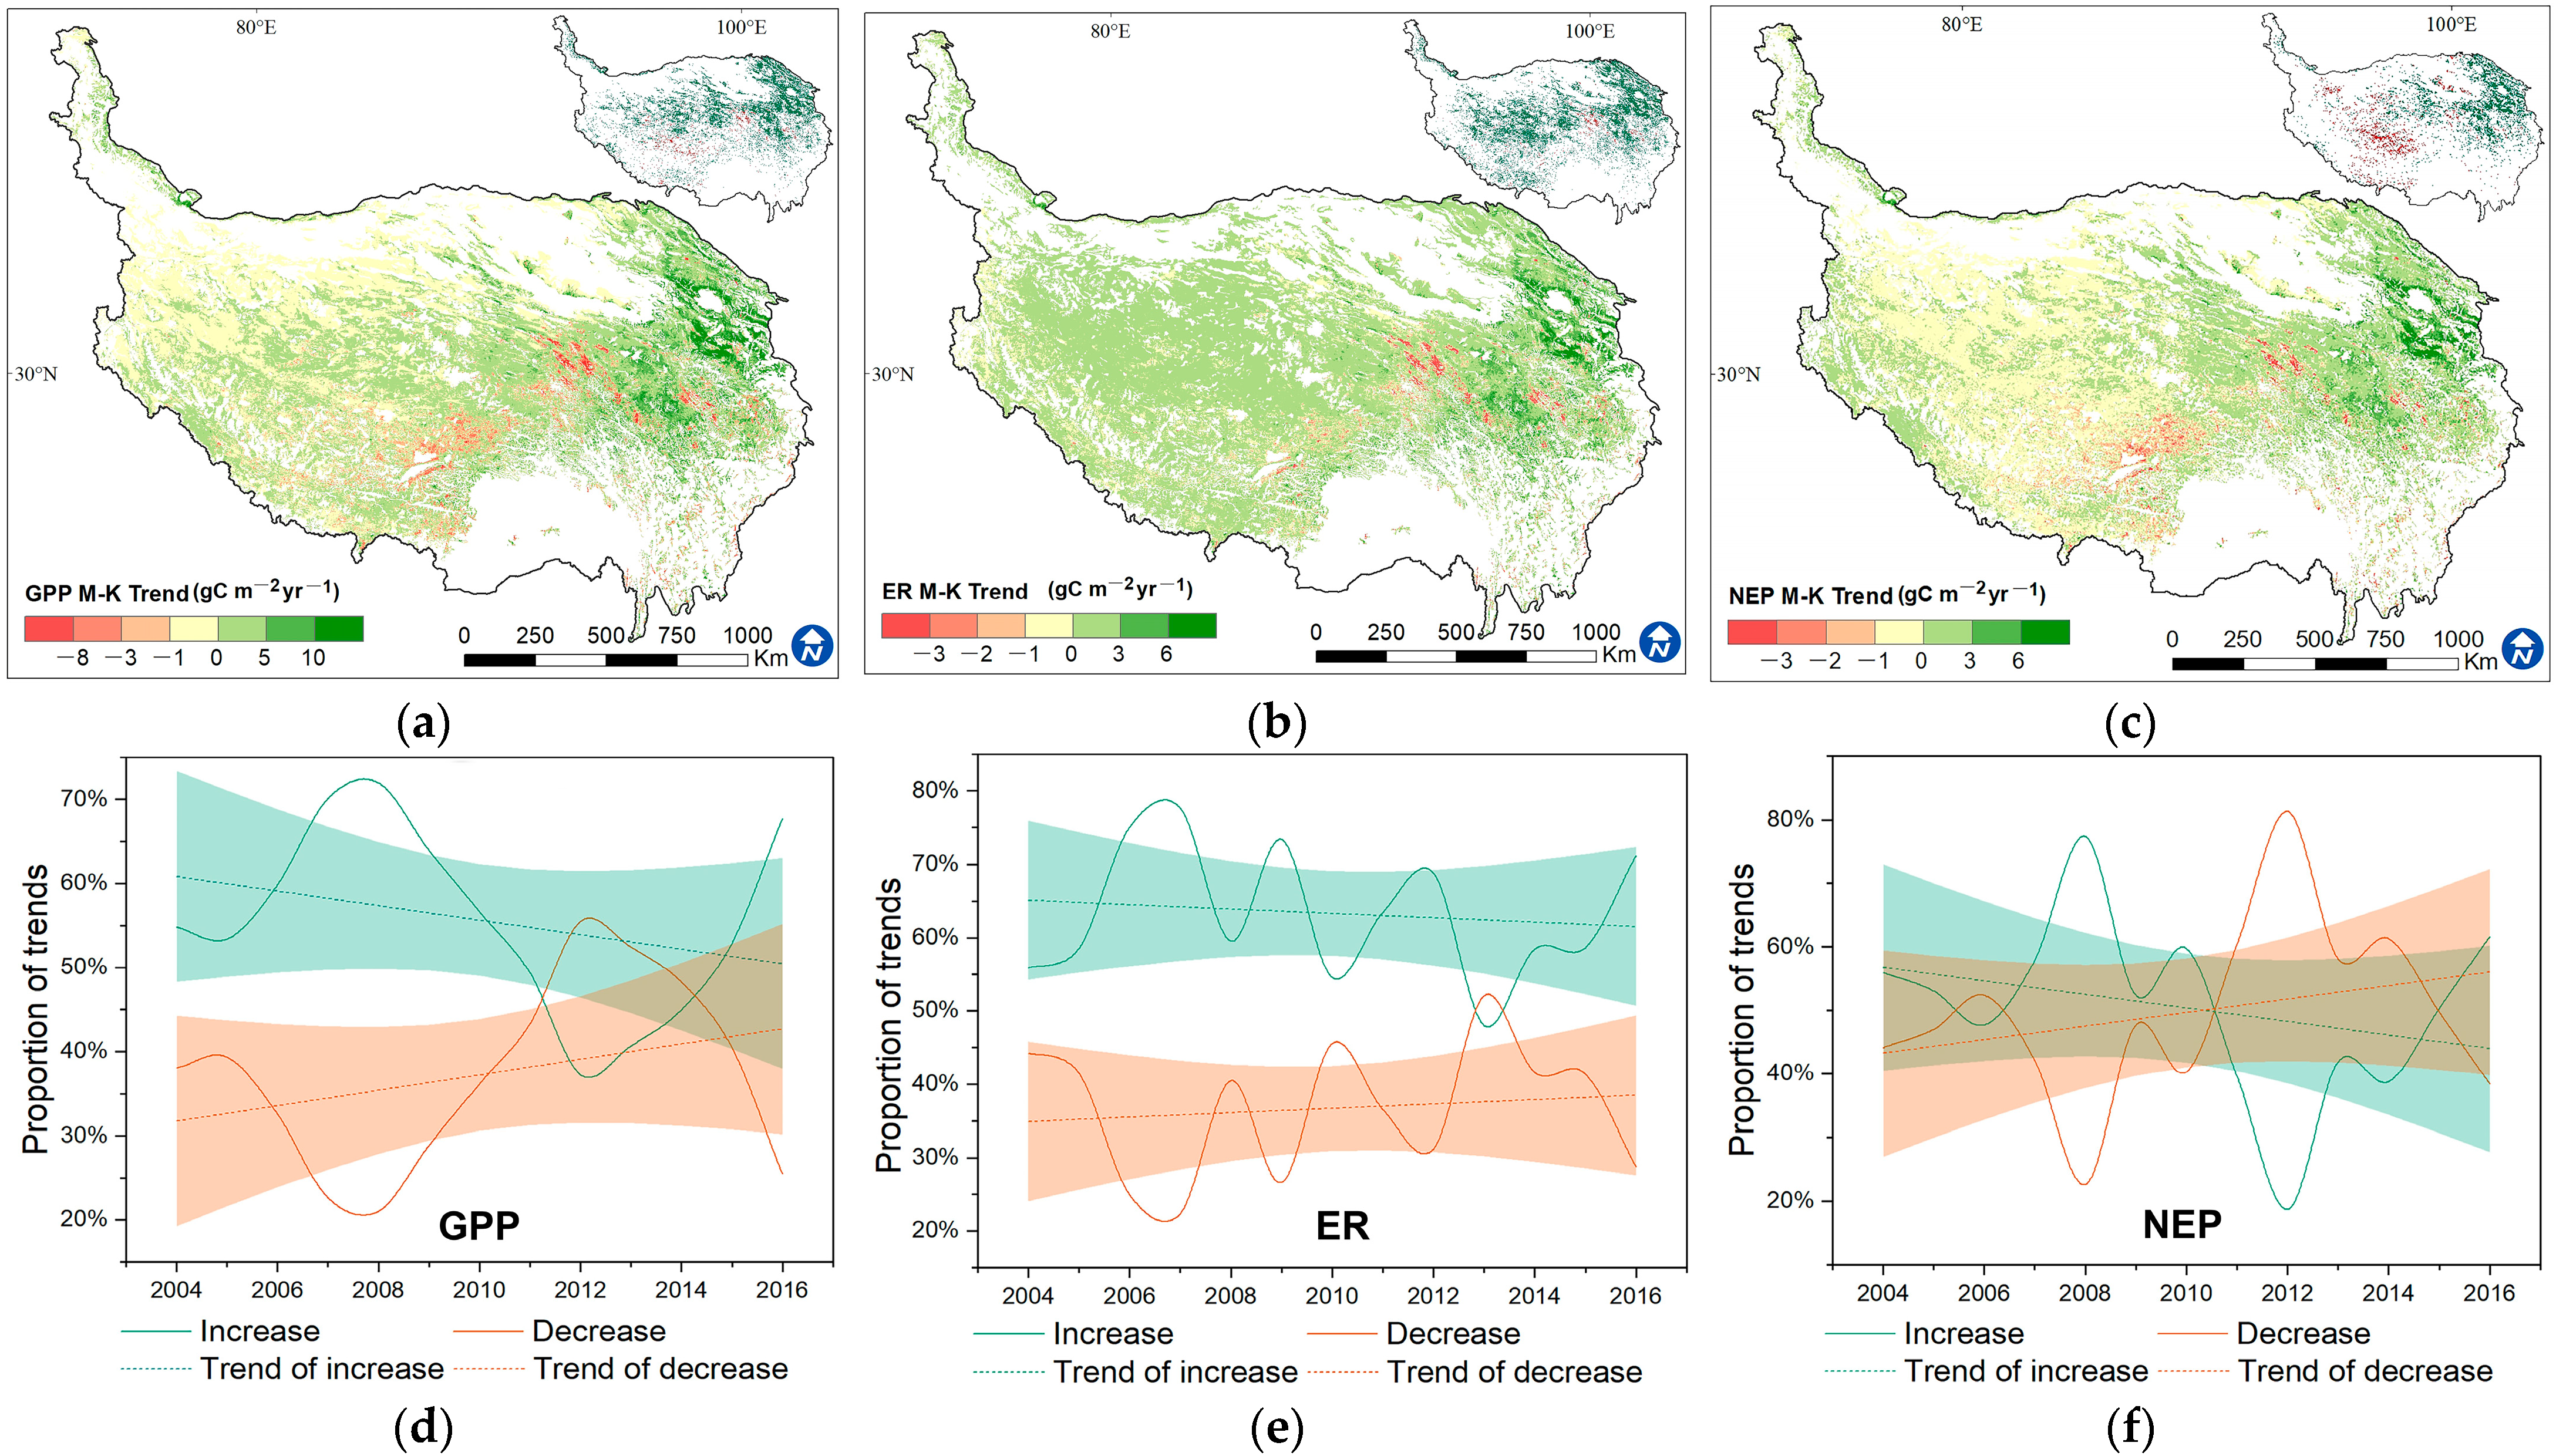
During 2000–2020, the annual GPP and ER increased in 69% and 84% of the alpine grasslands on the QTP, respectively, with significant increases found in 29% and 30% of them for GPP and ER, respectively (Figure 4a,b). The annual NEP increased in 52% of the alpine grasslands, with a significant increase found in 15% of them (Figure 4c). Although all carbon budget indicators generally increased across most alpine grasslands from 2000 to 2020, they exhibited significant differences in the spatial patterns of their trends (Figure 4a–c). In the alpine grasslands, areas with increasing GPP were mainly concentrated in the northeastern part and scattered in the western region (Figure 4a), while upward trends in ER were widely distributed throughout the plateau (Figure 4b). The spatial pattern of trends in NEP showed pronounced heterogeneity, with areas of increasing NEP mainly concentrated in the northeast and areas of decreasing NEP mainly distributed in the west (Figure 4c). In addition, grasslands with significantly decreased NEP accounted for more than 5% of the total grassland area (inset map in Figure 4c), while only a very small percentage (<2%) of grasslands experienced a significant decrease in GPP or ER (inset maps in Figure 4a,b).
The analysis results based on the sliding window method indicated that in the majority of windows (70%), the alpine grassland area where GPP increased was larger than the area where it decreased (Figure 4d). In almost all windows (92%), the proportion of grasslands with increasing ER was significantly greater than the proportion with decreasing ER (Figure 4e). The variability in the proportion of grasslands exhibiting different trends in NEP was relatively large. For instance, from the window of 2008 to 2012, the proportion of grasslands with increasing NEP dropped sharply from nearly 80% to 20% (Figure 4f). Despite these differences, overall, the proportion of grasslands with increasing GPP, ER, or NEP generally decreased from 2000 to 2020.

3.3. Drivers of Change in the Carbon Budget

3.3.1. Climate Effects on the Inter-Annual Carbon Budget

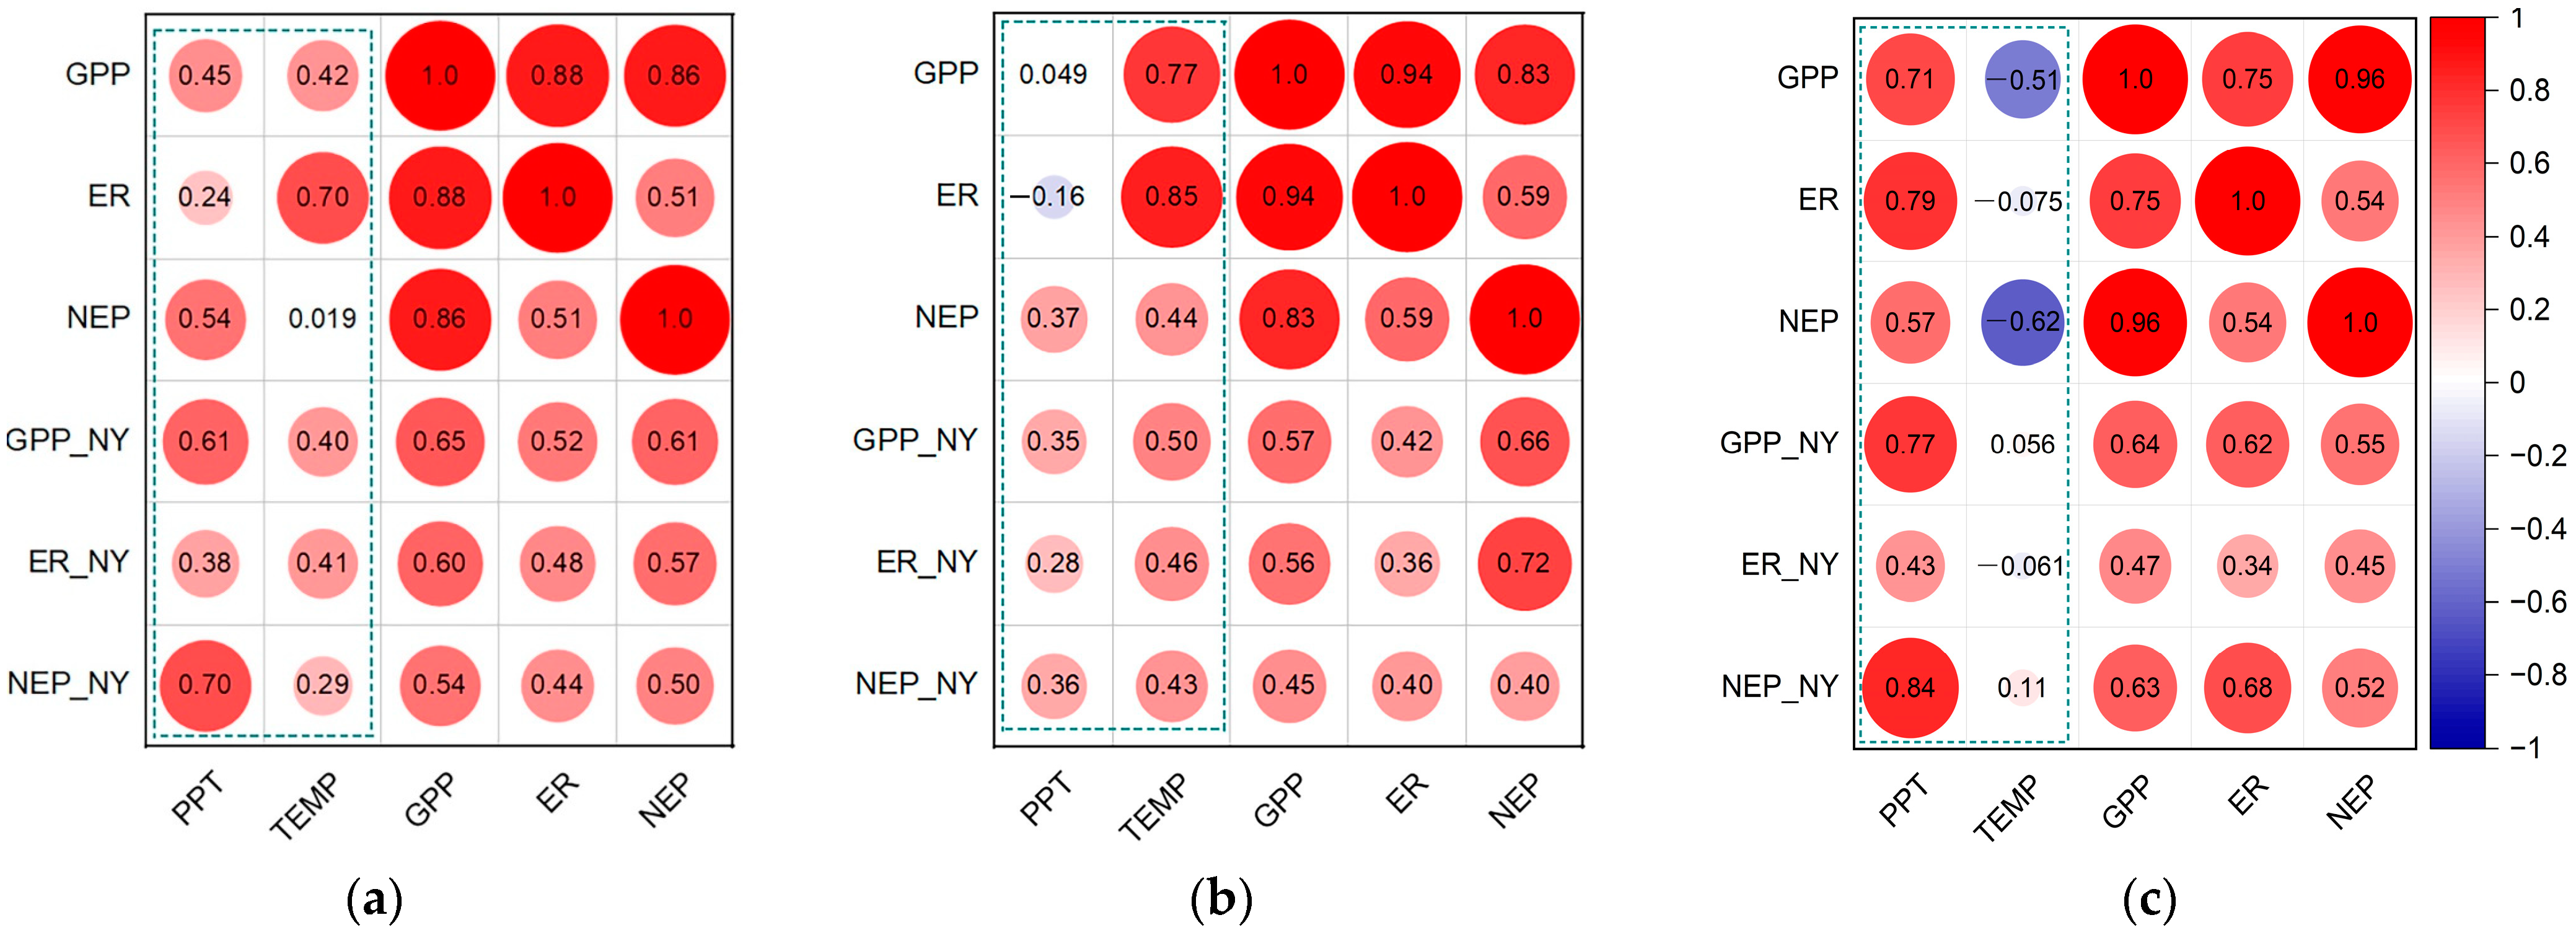
The results of partial correlation analysis showed that during 2000–2020, GPP in the alpine grasslands was roughly equally correlated with precipitation and temperature, while NEP and ER were mainly correlated with precipitation and temperature, respectively (Figure 5a). It was noteworthy that the primary climatic driver of the carbon budget may have shifted around 2010. The carbon budget indicators primarily related to temperature, particularly GPP and ER, before 2010 (Figure 5b). During this period, precipitation had a lesser impact on the carbon budget, and ER was even negatively correlated with precipitation. However, after 2010, the correlations were reversed, with carbon budget indicators mainly positively correlated with precipitation and negatively correlated with temperature, especially for GPP (r = −0.51) and NEP (r = −0.62), respectively (Figure 5c).
Additionally, this study uncovered notable climate legacy effects on the carbon budget of the alpine grassland. Precipitation, in particular, demonstrated a stronger correlation with the following year’s GPP and NEP during all three periods on the QTP (Figure 5). Moreover, precipitation was found to be more correlated with the next year’s ER in the periods of 2000–2010 and 2000–2020. However, compared to precipitation, the legacy effects of temperature were less pronounced and varied more across different periods.

3.3.2. Spatial Distributions of Climate Effects on the Inter-Annual Carbon Budget

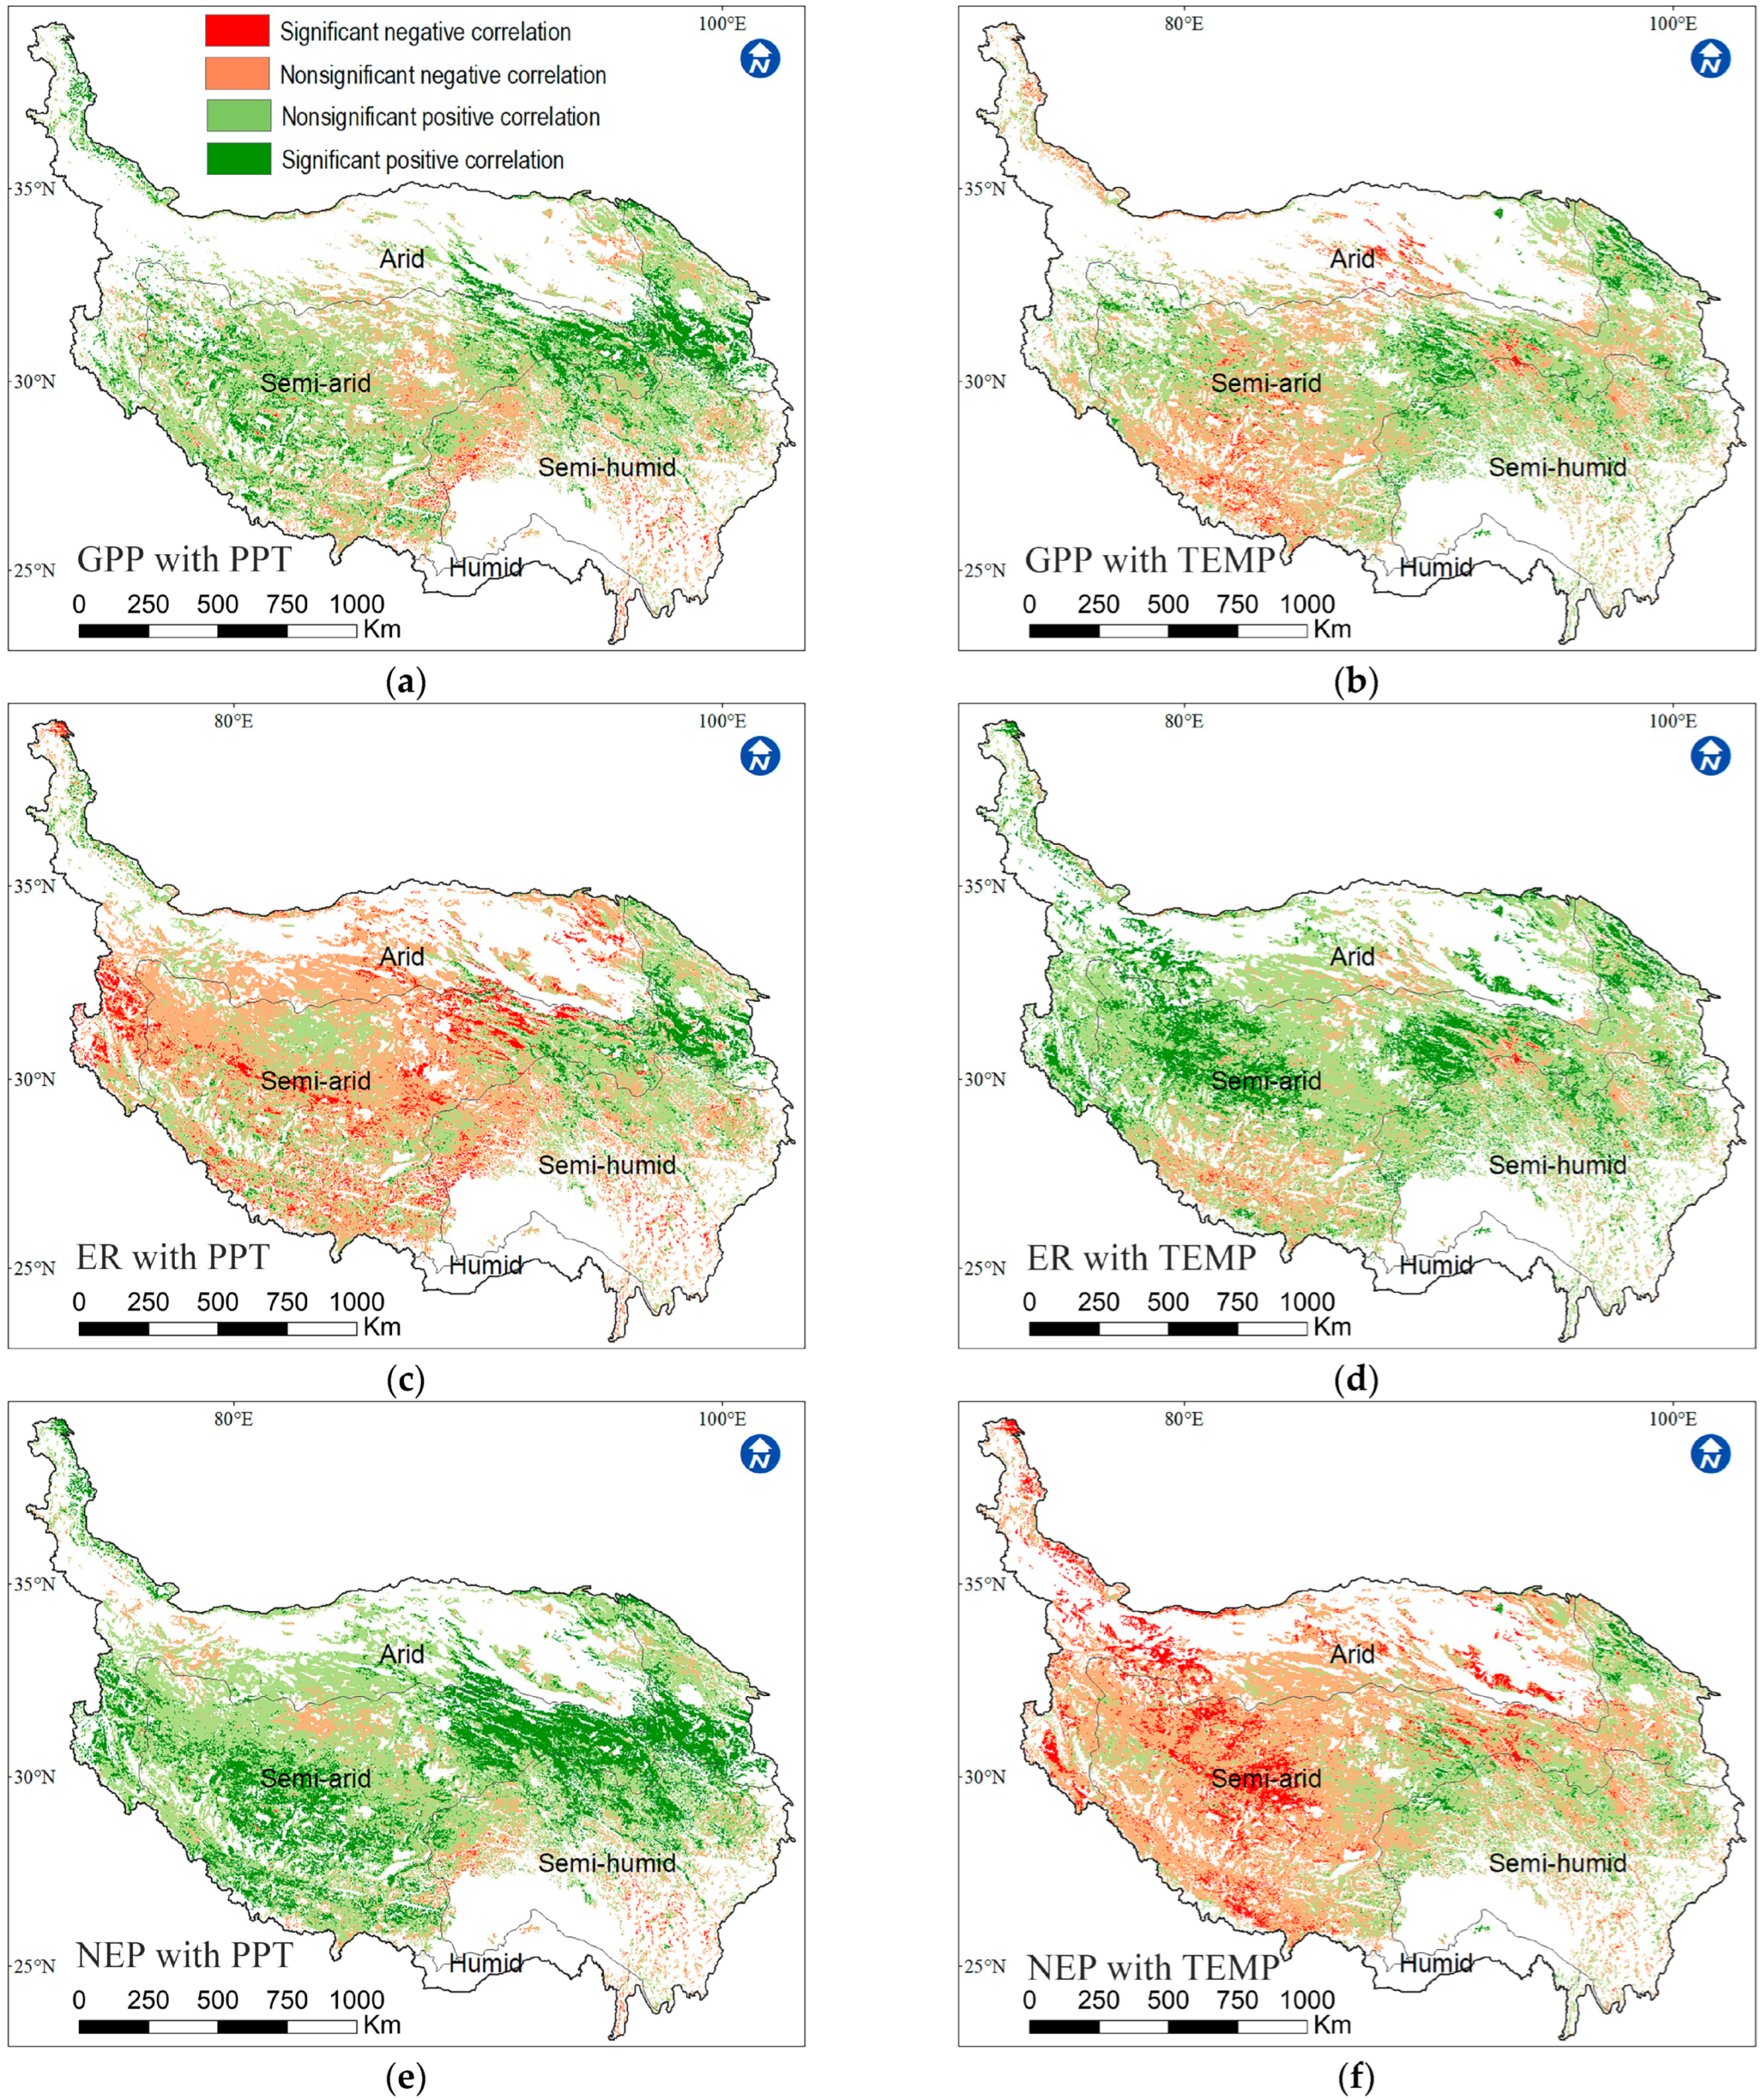
During 2000–2020, around 76% of the alpine grasslands on the QTP exhibited a positive correlation between GPP and precipitation, with about 20% of the area showing a significant (p < 0.05) positive correlation (Figure 6a). Compared with precipitation, a smaller proportion (63%) of the grasslands showed a positive correlation between GPP and temperature, with less than 10% of the area exhibiting a significant positive correlation (Figure 6b). Unlike GPP, ER exhibited a positive correlation with precipitation in only 40% of the alpine grasslands, while it was positively correlated with the temperature in most (85%) of the grasslands on the QTP (Figure 6c,d). In contrast, NEP showed positive correlations with precipitation in 89% of and significant positive correlations in 30% of the alpine grasslands but showed negative correlations with temperature in most (65%) of the grasslands (Figure 6e,f).

3.3.3. Temporal Dynamics of Climate Effects on the Carbon Budget

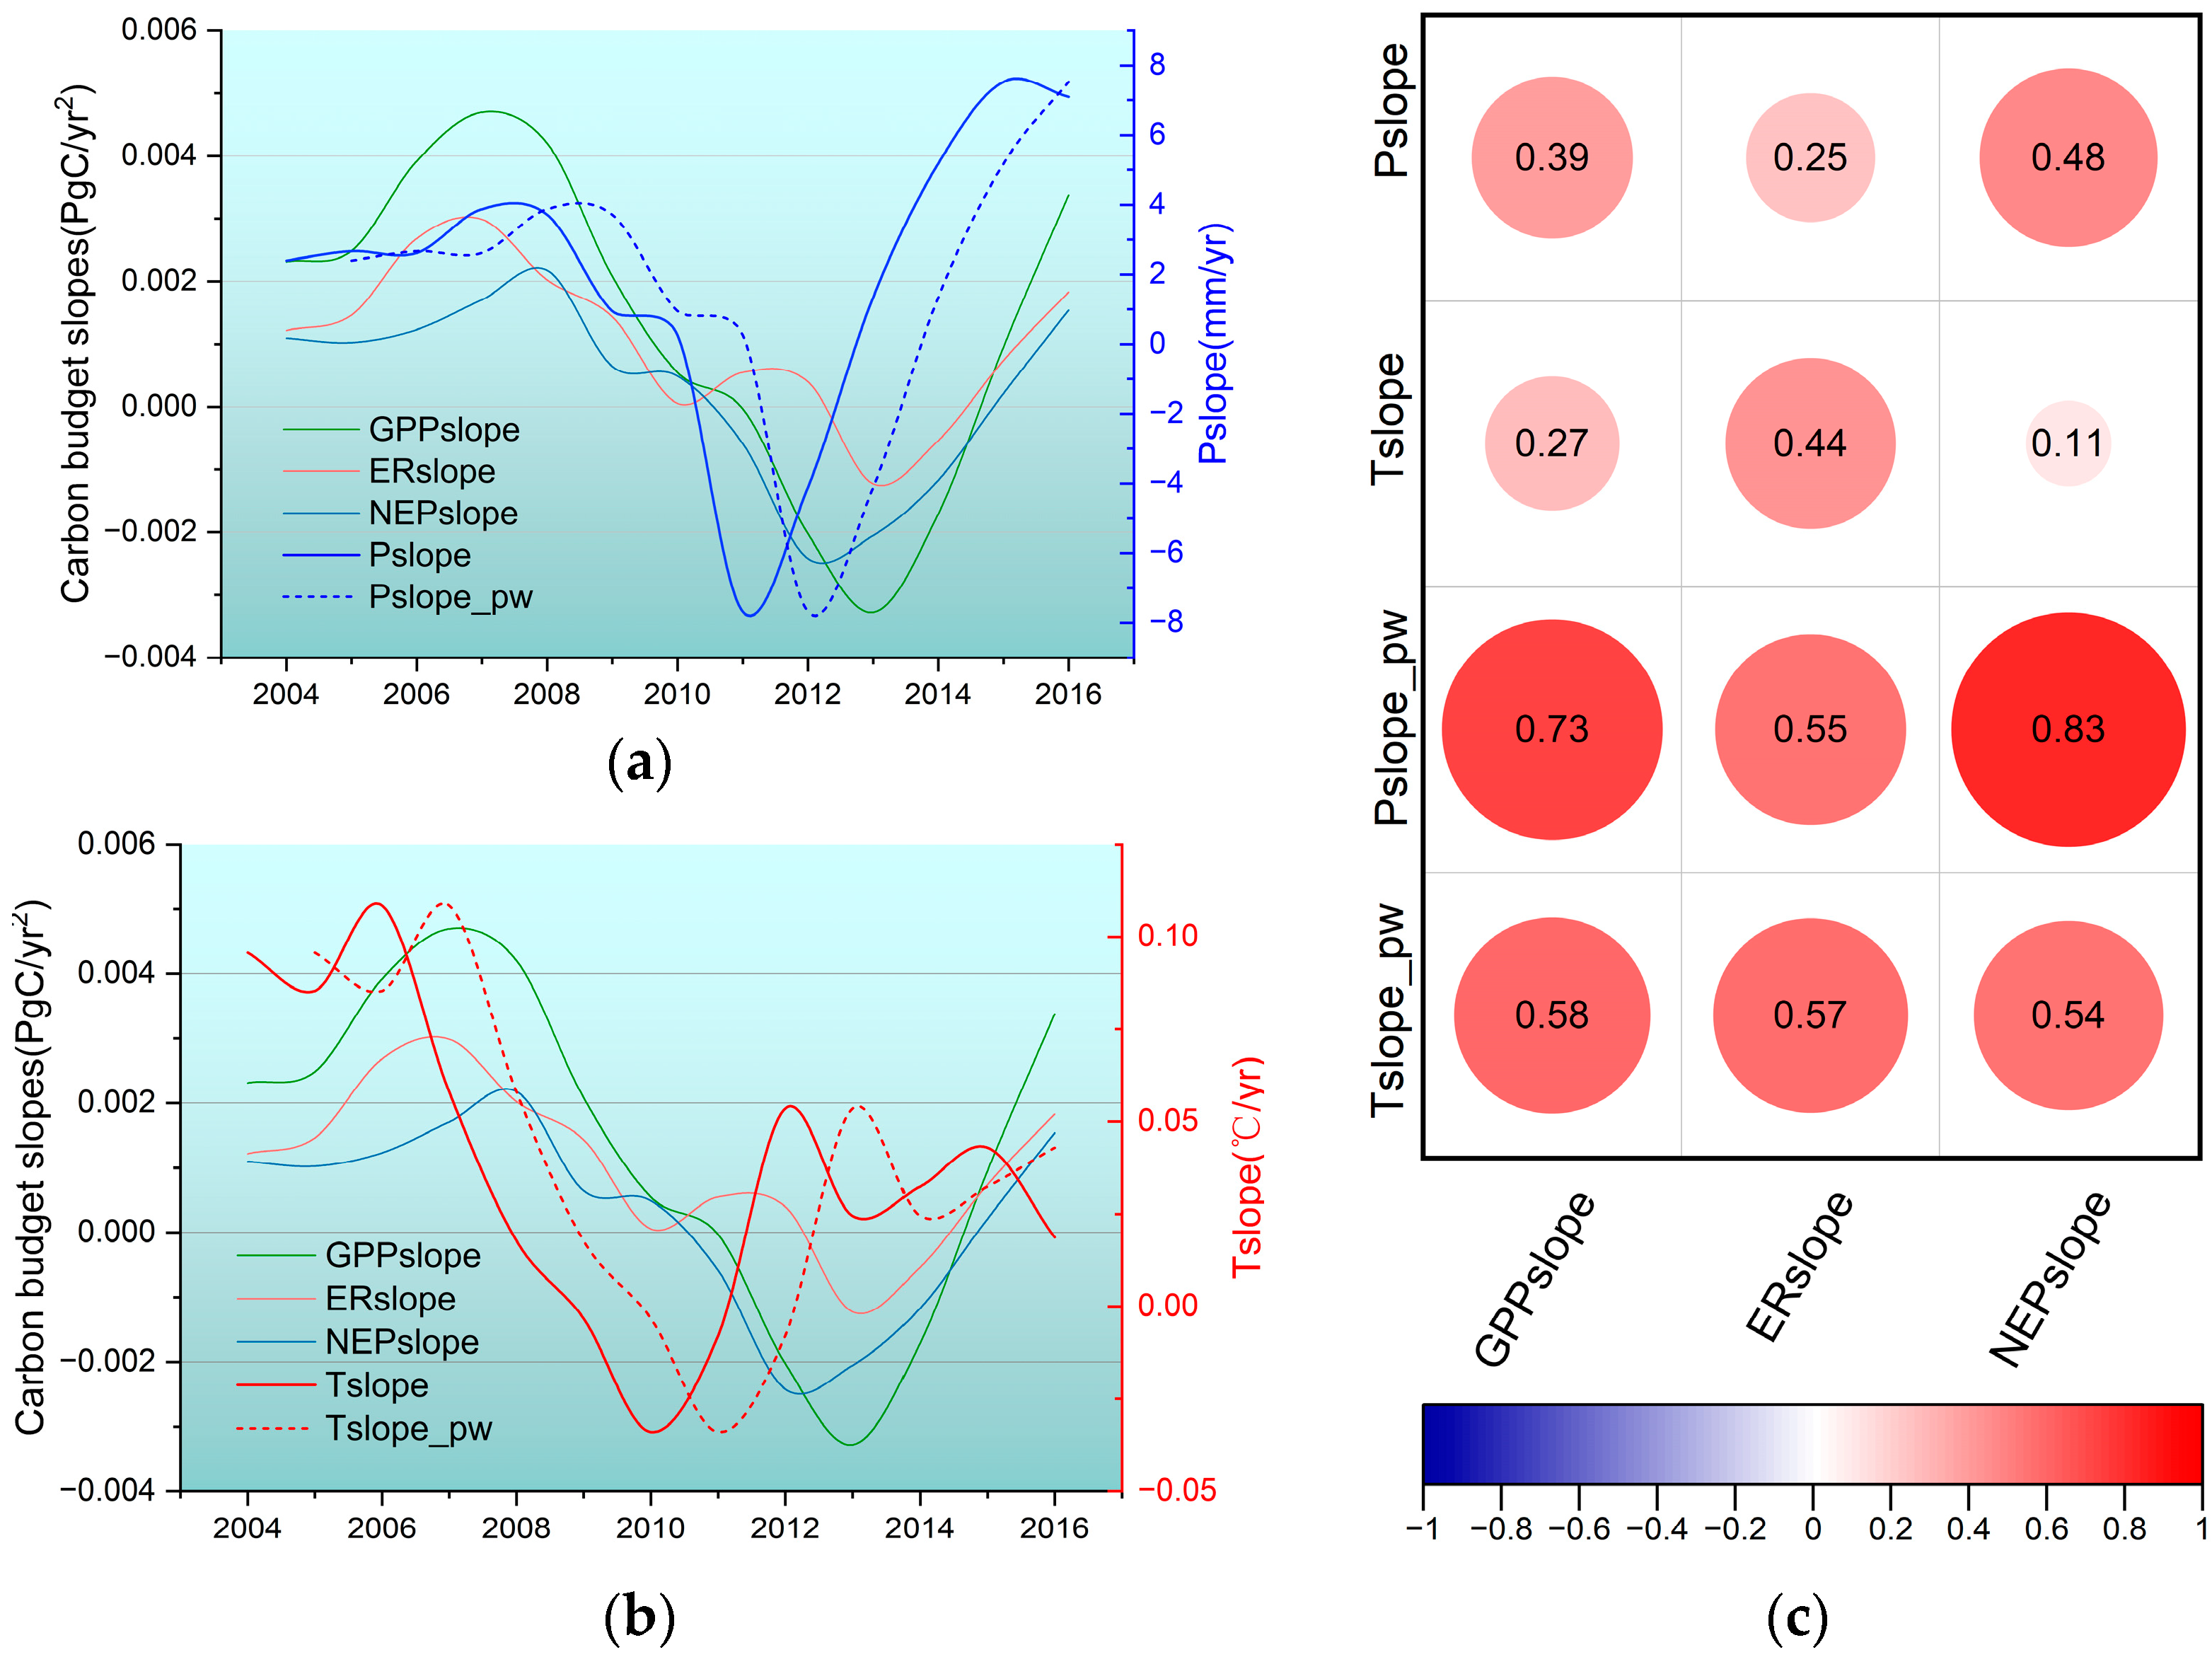
The sliding window method was used to compare the dynamics of trends in the carbon budget indicators and climatic factors (the window length was set to 9 years after testing). The changes in trends of the carbon budget indicator were more closely associated with the trend changes in precipitation than with trend changes in temperature. The trend variations in both temperature and precipitation in the preceding windows (relative to the carbon budget indicators) were more in line with the trend variations in the carbon budget indicators (Figure 7a,b). The results of partial correlation analysis revealed that the trends in GPP and NEP were more strongly correlated with precipitation trends than with temperature trends, while the trends in ER were more strongly correlated with temperature trends (Figure 7c). Moreover, the trends in carbon budget indicators were found more correlated with the trends in climatic factors in the preceding windows than in the simultaneous windows.

4. Discussion

4.1. Carbon Budget Dynamics

It is well known that the AGQTP has transferred from a carbon source to a carbon sink due to climate change [7,17,29]. However, the estimation of the carbon budget of the AGQTP remains uncertain [7,29,51]. This study simulated the carbon budget of the AGQTP using remote sensing data and models and validated the simulation results primarily using EC observation data. In addition, carbon budget data from multiple models in CMIP6 were used as a supplementary method to roughly validate the magnitude and overall trend of the simulated carbon budget in this study (Figure A1). According to the simulation results, the mean annual GPP and ER of the AGQTP were 330.9 Tg C yr−1 and 315.9 Tg C yr−1, respectively, between 2000 and 2020. The AGQTP acted as a carbon sink during this period, with a mean annual NEP of 15.25 Tg C yr−1. This value was smaller than the estimation of 21.8 Tg C yr−1 reported by Piao et al. (2012) for the period of 2000–2009, but similar to the estimation of 16.76 Tg C yr−1 reported by Yan et al. (2015) for the period of 2000–2010 [7,29]. The annual GPP, ER, and NEP increased at rates of 0.002 Pg C yr−2, 0.013 Pg C yr−2, and 0.0007 Pg C yr−2, respectively, from 2000 to 2020 (Figure 3a–c), and their spatial distribution showed a general decreasing trend from southeast to northwest (Figure 3d–f), which was similar to that reported by previous studies [7,29,51]. The areas characterized as carbon sinks were mainly distributed in the southeastern and eastern regions, where the dominant ecosystem type was alpine meadow. Meanwhile, the areas with carbon sources were mainly located in the northwestern regions, where the dominant ecosystem type was alpine steppe (Figure 3f and Figure 1a), and this spatial pattern of carbon sources and sinks was consistent with the findings of most previous studies [29,31,51].
Although GPP, ER, and NEP increased in most alpine grasslands between 2000 and 2020, the proportion and spatial distribution of their trends exhibited notable variations (Figure 4). According to the spatial pattern of the trends (Figure 4a–c), the ER increased most significantly, followed by the GPP and NEP. The trend of NEP was jointly determined by the trends of GPP and ER. Therefore, the NEP showed a regional downward trend and a local significant decrease in the western QTP (Figure 4f) because the increase in GPP was less than the increase in ER in this region. The proportion of alpine grasslands with increased NEP generally decreased (Figure 4f), indicating that the increasing rate of carbon sequestration in the AGQTP slowed down during 2000–2020. However, future research is needed to verify whether this trend of slowdown will continue.

4.2. Climate-Driven Mechanisms of the Carbon Budget

The driving factors and mechanisms of the changes in the AGQTP are still debated [23,28,52]. Most previous studies have concluded that climate change is the primary cause [7,13]. However, the following question remains: whether temperature or precipitation is the dominant climatic factor and how does it drive the carbon budget? Various studies have reported different conclusions and interpretations on this matter. For instance, a study has shown that temperature changes have a greater influence on GPP than changes in precipitation and solar radiation throughout the entire QTP [53]. Another study has also concluded that climate warming is the primary driving force behind the improvement of vegetation on the QTP, similar to the vegetation growth promotion mechanism in the Pan-Arctic region [23]. However, some other studies have reported that increasing temperature exerted complex effects on the NPP and that precipitation is the primary driving force behind the changes in the AGQTP [7,17,54]. In contrast to GPP, the ER of the AGQTP is primarily driven by temperature, and previous studies have consistently demonstrated this [24,55,56]. In contrast, there is a high level of inconsistency in previous studies regarding the climate-driven mechanism of NEP. Some studies have demonstrated that the NEP of the AGQTP is primarily affected by temperature [29], while others have indicated that precipitation is the dominant factor [7]. Furthermore, a study has even suggested that the NEP of the AGQTP is negatively correlated with both precipitation and temperature, which are the factors hindering the formation of carbon sinks [31].
To clarify the driving mechanism of climatic factors (temperature and precipitation) on the carbon budget of the AGQTP, this study conducted a comprehensive and systematic analysis from multiple perspectives, including temporal differences, spatial distribution, and trend dynamics. Analysis based on annual data showed that, throughout the entire QTP, the NEP and ER were mainly driven by precipitation and temperature, respectively, while the GPP was roughly equally driven by precipitation and temperature during 2000–2020 (Figure 5a). However, the impact of climatic factors on the carbon budget exhibited significant spatiotemporal heterogeneity, which was consistent with findings from previous studies [7,29].
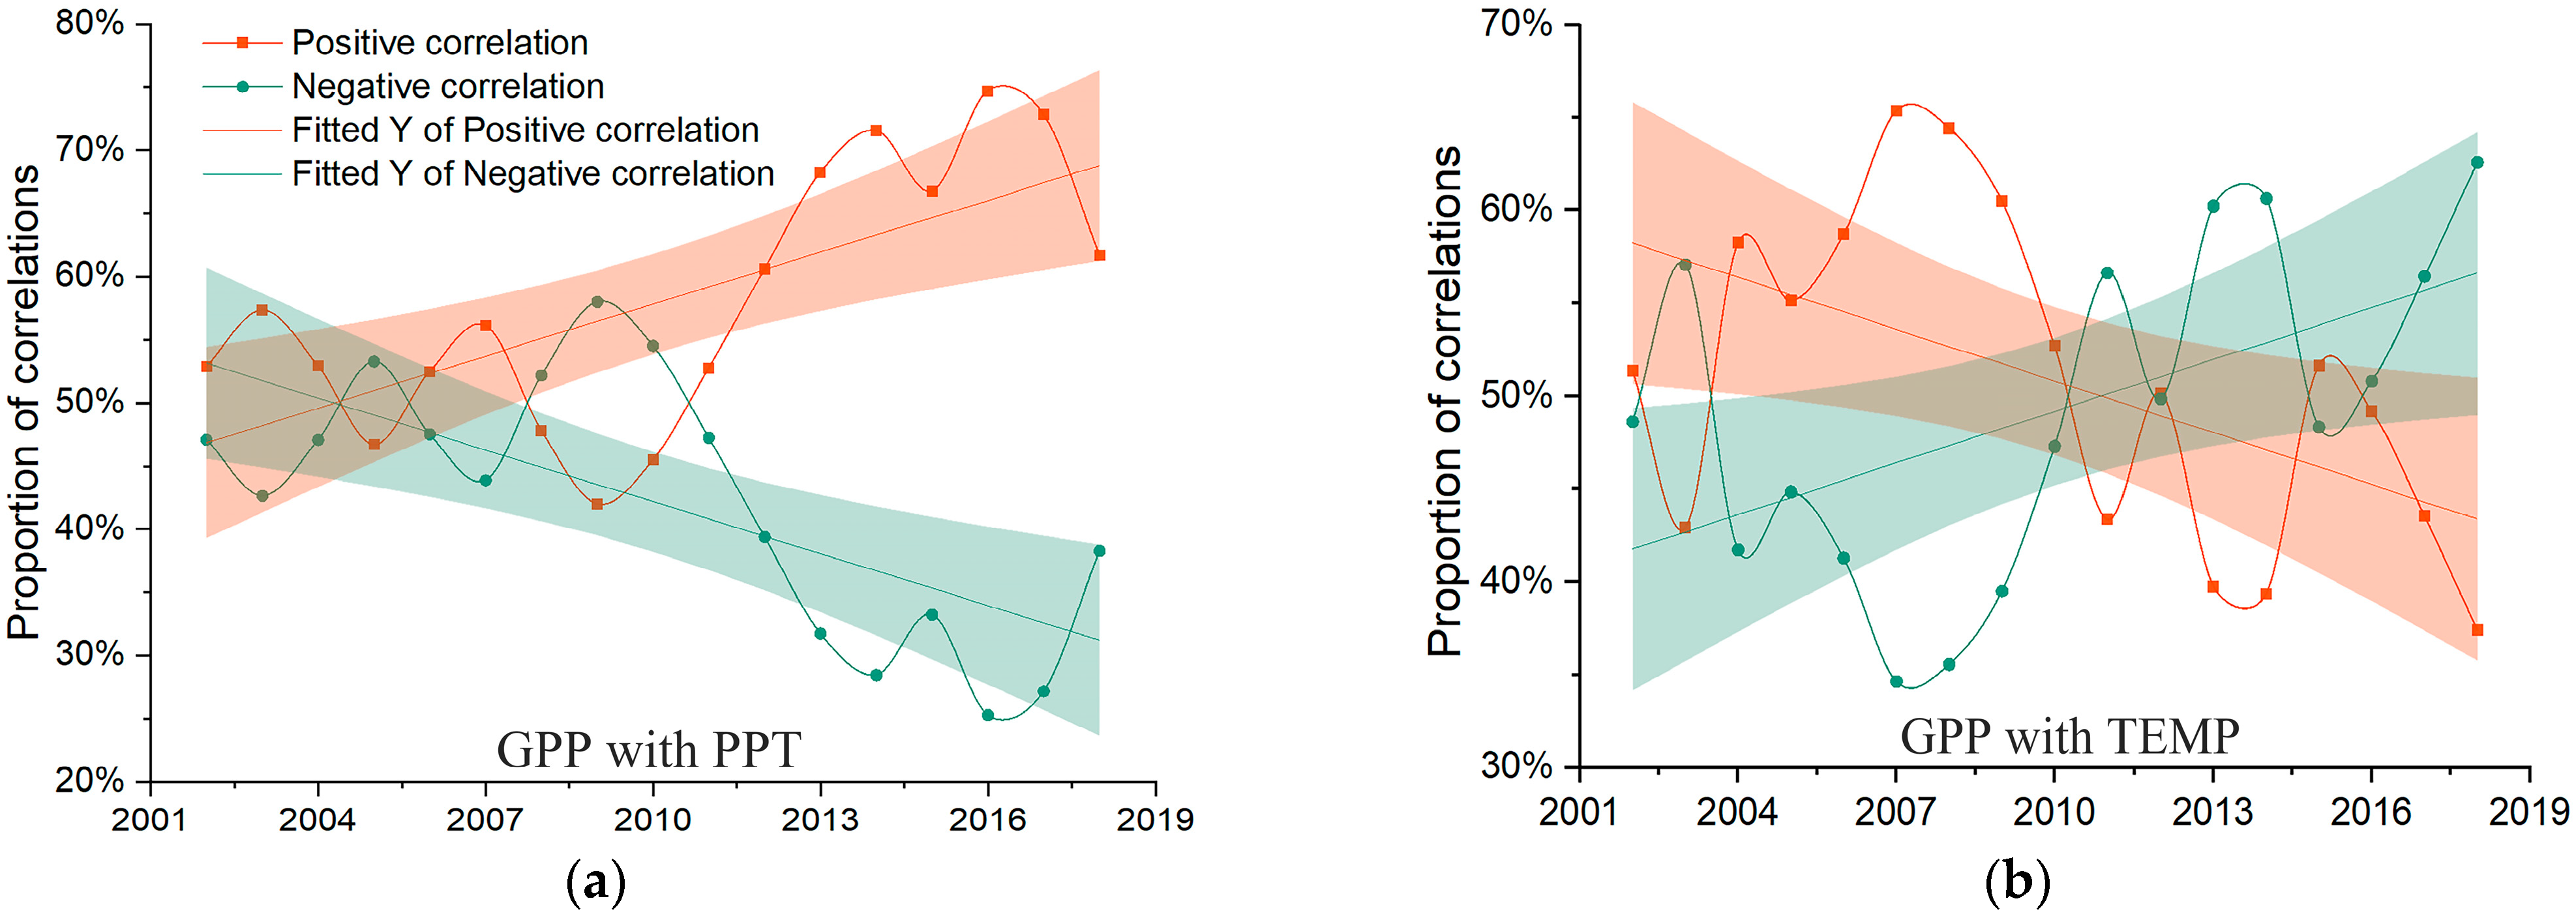
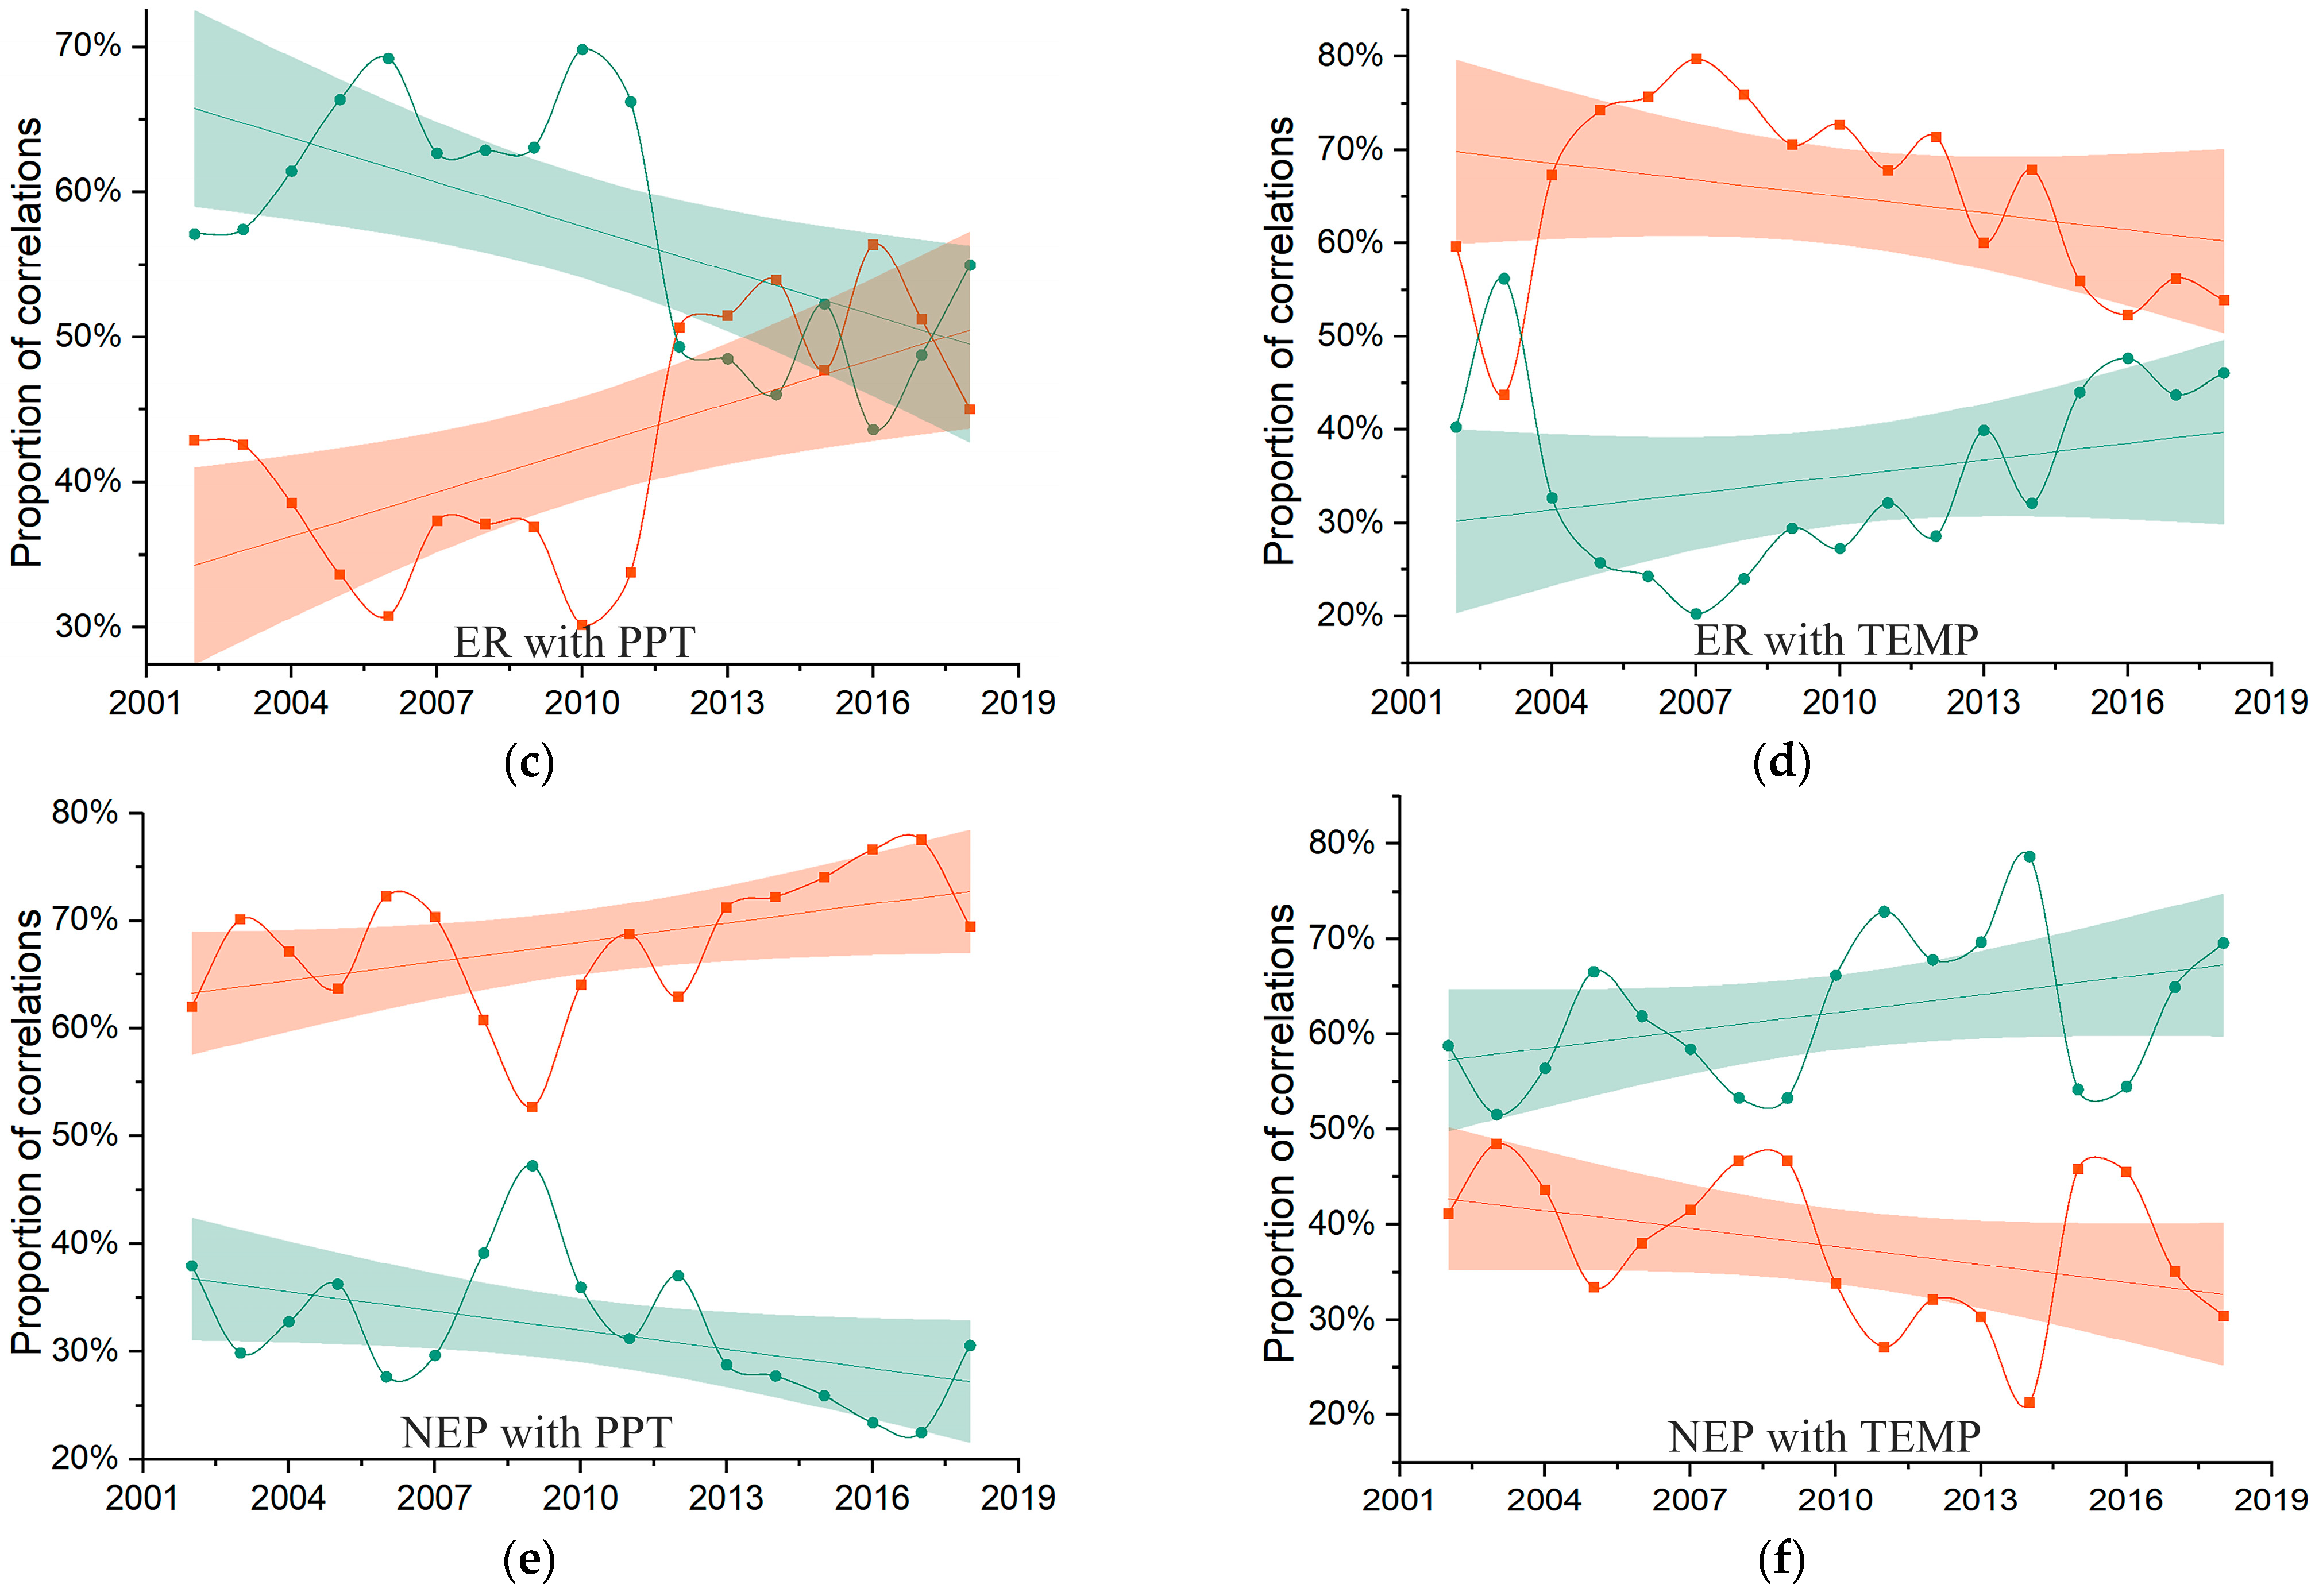
Firstly, a drastic temporal variation was found in the impact of climatic driving factors on the carbon budget, where the driving factors may have changed around 2010 (Figure 5b,c and Figure A2). Prior to 2010, the carbon budget was primarily influenced by air temperature, especially for GPP and ER. However, after 2010, it appears that precipitation may have replaced temperature and become the primary climatic driving factor of the carbon budget, while the rising temperature hindered the growth of the carbon budget, especially for the GPP and NEP. A recent study on the net primary productivity (NPP) of grasslands on the QTP also reached a similar conclusion, indicating a shift from temperature to precipitation as the controlling factor for alpine grassland productivity from 2000–2009 to 2010–2019 [57].
During 2011–2015, there was a significant decrease in the precipitation on the AGQTP, reaching the lowest level in 21 years, while the temperature exhibited an increasing trend (Figure 1b). Previous studies on the QTP have confirmed that warming will lead to an increase in ecosystem evapotranspiration, thereby exacerbating the soil water deficit [23,58]. Most of the alpine grasslands on the QTP are distributed in semi-arid and arid climate zones (Figure 6). The contrasting trends of temperature and precipitation made these grasslands more drought-susceptible, and the inadequate water supply and relatively high temperature severely constrained the carbon sequestration capacity of the grasslands [59]. Consequently, the GPP and NEP of the AGQTP decreased drastically from 2012 to 2015 (Figure 3). According to the results of the sliding window analysis, although the positive driving of precipitation on the carbon sink (NEP) was strengthened, the negative effect of temperature on the carbon sink was also strengthened (Figure A3). In addition, according to the fitted line of precipitation and temperature (Figure 1b), relative to 2000, precipitation increased by about 0.45% per year, while temperature increased by about 1.82% per year, which was much greater than the precipitation increase rate. We believe that this difference in temperature and precipitation changes is an important explanation for the slowdown in the increase rate of grassland carbon sinks from 2000 to 2020.
Secondly, there was significant spatial heterogeneity in the impact of climatic factors on the carbon budget of the AGQTP. Precipitation was the primary climatic driving factor for GPP and NEP in most alpine grasslands located in semi-arid and arid climate zones (Figure 6a,c,e), but it was the restraining factor for ER in most of the grasslands. Water deficiency and droughts in arid and semi-arid climate zones can limit photosynthesis because soil moisture, as an intermediary, is crucial for plants to absorb and transport nutrients [59,60,61]. In addition, water availability has important effects on soil nutrient availability [59,62]. Therefore, precipitation variation determined the carbon uptake and sequestration dynamics of the AGQTP by altering photosynthesis and soil nutrients. The impact of precipitation on ER is relatively complex [56,63]. The ER was tightly coupled to the photosynthetic rate [64], indicating that precipitation can increase ER through increasing photosynthesis. However, precipitation can also reduce the temperature and the air permeability of the soil, thereby inhibiting respiration [63]. In the western QTP, temperature was the primary driver of respiration (Figure 6d), and precipitation led to lower temperatures, resulting in lower ER.
Compared to precipitation, temperature was the primary climatic driving factor of the ER in most alpine grasslands on the QTP (Figure 6d), as temperature acted as the primary limiting factor for ER on the cold QTP [55,56,65]. The influence of temperature on GPP and NEP had relatively higher spatial heterogeneity (Figure 6b,d,f). Although the GPP in most alpine grasslands (64%) was primarily driven by temperature, these grasslands were mainly located in the eastern part of the semi-arid climate zone and semi-humid zone with relatively higher precipitation. However, warming in relatively dry regions such as the arid zone and the western part of the semi-arid zone suppressed the increase in GPP (Figure 6b). In relatively humid areas, temperature is the primary limiting factor for plant growth, and an increase in temperature will lead to an increase in GPP. However, in relatively arid regions, water is the primary limiting factor, and rising temperature will exacerbate water loss and drought, ultimately inhibiting grassland growth. The effect of temperature on NEP is more complex and spatially heterogeneous [7] because NEP is jointly affected by GPP and ER, which respond differently to temperature, as described above. The NEP in most alpine grasslands on the QTP was reduced by temperature, mainly in the semi-arid zone and arid zone where warming decreased GPP and increased ER. The downward trend in NEP in the west of the QTP (Figure 4c) was attributed to the greater increase in temperature compared to precipitation (Figure 6), leading to a higher contribution of temperature to ER than precipitation to GPP. This resulted in a slower increase in the GPP than ER and eventually led to a decrease or even a significant decrease in NEP. In conclusion, the temperature driving of GPP and NEP was limited by local water availability. In general, temperature increases promoted carbon absorption and sequestration only in areas and during periods with sufficient water.
In addition to the spatiotemporal heterogeneity, precipitation was found to have a greater impact on the next year’s carbon budget indicators during 2000–2020 (Figure 5). Furthermore, the trends of carbon budget indicators, particularly the GPP and NEP, were more consistent and correlated with the trends of precipitation and temperature in the previous windows (Figure 7). Therefore, it was concluded that climate change, particularly precipitation, had a significant legacy effect on the carbon budget of the AGQTP during 2000–2020 (Figure 5 and Figure 7). The AGQTP is dominated by perennial herbaceous plants [66], and the underground portion of the grassland can survive for many years. Hence, this underground portion is considered a crucial component linking the interannual variation of the grassland and is the key to explaining the legacy effect. Belowground meristems, such as bud banks, are critical for grasses to respond to changes in precipitation and are essential drivers of legacies [67,68]. Low tiller production in a dry year hinders the grass response to subsequent wet years, while high tiller yield and root production resulting from wet years can help grasses cope with subsequent drought by increasing soil moisture acquisition [67,69]. Thus, precipitation in previous years affects the production of roots and tillers by altering the underground meristems, which, in turn, affects the plant carbon uptake in subsequent years. The legacy effect of precipitation on respiration may be attributed mainly to the carryover of organic material [70], as autotrophic and heterotrophic respiration rates have positive correlations with the size of biomass, litter, and soil organic matter pools [71,72,73]. In comparison to precipitation, the legacy effect of temperature was less significant, and the findings of this study suggest that temperature had a legacy effect on the carbon budget by altering the soil moisture.

4.3. Uncertainties and Limitations

Ecosystem models have become well-accepted methods for estimating global and regional carbon budgets. However, the limited number of weather stations and EC observation sites on the QTP, especially in the western region, leads to higher uncertainty when estimating the carbon budget [74]. This study focused solely on the impact of two typical climatic factors, air temperature, and precipitation, on the carbon budget of the AGQTP. Other factors, such as CO2 concentration, nitrogen deposition, and human activities, also have significant impacts on the carbon balance of grasslands [13,29,51], which should be considered in future research. Although the present study identified a shift in the driving factors of the grassland carbon budget around 2010, it was not clear whether this occurred because the temperature exceeded the threshold that could positively drive the budget or whether this phenomenon was related to the short-term (2011–2015) drought, and further verification is needed in future studies. This study investigated the mechanism of the climatic legacy effects on the carbon budget of the alpine grassland, but further research is necessary to gain a more profound understanding of the underlying mechanisms.

5. Conclusions

This study systematically analyzed the dynamics of the carbon budget in the AGQTP and its climate-driven mechanism during 2000–2020. Results indicated that the alpine grassland over the plateau acted as a carbon sink (with a mean annual NEP of 15.25 Tg C yr−1), and the annual GPP, ER, and NEP increased at rates of 0.002 Pg C yr−2, 0.013 Pg C yr−2, and 0.0007 Pg C yr−2, respectively, during the study period. However, the rate of increase in carbon uptake and sequestration slowed down over the study period. It was found that the impact of precipitation on the carbon budget was strengthened, while the influence of temperature was weakened, during 2000–2020, and the warming rate on the QTP was greater than the wetting rate, potentially becoming a main contributing factor to the slowdown of the increase in grassland carbon sinks. In the entire period, GPP was influenced by both precipitation and temperature, while NEP and ER were primarily impacted by precipitation and temperature, respectively. However, the primary climatic driver of the carbon budget may have changed from temperature to precipitation around 2010. Our study also revealed that the positive effect of warming on the grassland’s carbon uptake was strongly constrained by local water conditions on the plateau. Specifically, temperature promoted carbon fixation by the grassland only in the areas with relatively abundant water. The findings of this study also suggested that climate change, particularly variations in precipitation, had notable legacy effects on the carbon budget of the AGQTP, and the response of belowground meristems to climate factors is likely the main cause of the legacy effect. However, additional research should be conducted to further clarify the mechanism of this legacy effect.

Author Contributions

Supervision, X.Z. and B.N; conceptualization, X.Z. and B.N.; methodology, Z.H.; writing—original draft preparation, Z.H.; writing—review and editing, B.N.; investigation, Z.H., Y.Z. and M.X.; data curation, Z.H.; formal analysis, Z.H.; validation, X.Z. and B.N.; software, Z.H. and J.T.; resources, Z.H.; visualization, Z.H.; project administration, X.Z.; funding acquisition, X.Z. All authors have read and agreed to the published version of the manuscript.

Funding

This research was jointly supported by the Second Tibetan Plateau Scientific Expedition and Research Program (STEP) (grant number 2019QZKK1002), the Major Science & Technology Special Projects of Tibet Autonomous Region (grant number XZ202101ZD0007G), and the Tibet Autonomous Region Science and Technology Planning Project (grant number XZ202201ZY0016G).

Data Availability Statement

All data are available from the corresponding author upon rational request.

Conflicts of Interest

The authors declare no conflict of interest.

Appendix A

Figure A1. Comparison between the simulated carbon budget and the carbon budget from the CMIP6 models (ac), and comparison between the simulated carbon budget and the average carbon budget of CMIP6 models (df).
Remotesensing 15 02492 g0a1
Figure A2. The changes in correlation coefficients between carbon budget indicators (GPP (gross primary productivity), ER (ecosystem respiration), and NEP (net ecosystem respiration)) and climatic factors (PPT (precipitation) and TEMP (temperature)) over sliding windows (the window length was set to 6 years after testing).
Remotesensing 15 02492 g0a2
Figure A3. The changes in the proportion of the area of different correlations between carbon budget indicators (GPP, ER, NEP) and precipitation (PPT) (a,c,e), and correlations between carbon budget indicators and temperature (TEMP) (b,d,f) over the alpine grassland on the Qinghai–Tibet Plateau (AGQTP) during 2000–2020. The vertical axis represents the proportion of the grassland area exhibiting different correlations between carbon budget indicators and climatic factors, in each window, and the horizontal axis corresponds to the year in the middle of the window (the window length was set to 5 years after testing).
Remotesensing 15 02492 g0a3aRemotesensing 15 02492 g0a3b

References

  1. Trenberth, K.E. Climate change caused by human activities is happening and it already has major consequences. J. Energy Nat. Resour. Law 2018, 36, 463–481. [Google Scholar] [CrossRef]
  2. Pörtner, H.-O.; Roberts, D.C.; Poloczanska, E.; Mintenbeck, K.; Tignor, M.; Alegría, A.; Craig, M.; Langsdorf, S.; Löschke, S.; Möller, V. Summary for Policymakers; IPCC: Geneva, Switzerland, 2022. [Google Scholar]
  3. Pepin, N.; Bradley, R.S.; Diaz, H.; Baraër, M.; Caceres, E.; Forsythe, N.; Fowler, H.; Greenwood, G.; Hashmi, M.; Liu, X. Elevation-dependent warming in mountain regions of the world. Nat. Clim. Chang. 2015, 5, 424–430. [Google Scholar]
  4. Huss, M.; Hock, R. Global-scale hydrological response to future glacier mass loss. Nat. Clim. Chang. 2018, 8, 135–140. [Google Scholar] [CrossRef]
  5. Wei, Y.; Lu, H.; Wang, J.; Wang, X.; Su, J. Dual Influence of Climate Change and Anthropogenic Activities on the Spatiotemporal Vegetation Dynamics Over the Qinghai–Tibetan Plateau from 1981 to 2015. Earth’s Future 2022, 6, 24367. [Google Scholar] [CrossRef]
  6. Li, C.; Kang, S. Review of the studies on climate change since the last inter-glacial period on the Tibetan Plateau. J. Geogr. Sci. 2006, 16, 337–345. [Google Scholar] [CrossRef]
  7. Piao, S.; Tan, K.; Nan, H.; Ciais, P.; Fang, J.; Wang, T.; Vuichard, N.; Zhu, B. Impacts of climate and CO2 changes on the vegetation growth and carbon balance of Qinghai–Tibetan grasslands over the past five decades. Glob. Planet. Chang. 2012, 98, 73–80. [Google Scholar] [CrossRef]
  8. Zhu, Z.; Wang, H.; Harrison, S.P.; Prentice, I.C.; Qiao, S.; Tan, S. Optimality principles explaining divergent responses of alpine vegetation to environmental change. Glob. Chang. Biol. 2022, 29, 126–142. [Google Scholar] [CrossRef]
  9. Kuang, X.; Jiao, J.J. Review on climate change on the Tibetan Plateau during the last half century. J. Geophys. Res. Atmos. 2016, 121, 3979–4007. [Google Scholar] [CrossRef]
  10. Liu, X.; Chen, B. Climatic warming in the Tibetan Plateau during recent decades. Int. J. Climatol. 2000, 20, 1729–1742. [Google Scholar] [CrossRef]
  11. Molnar, P.; Boos, W.R.; Battisti, D.S. Orographic controls on climate and paleoclimate of Asia: Thermal and mechanical roles for the Tibetan Plateau. Annu. Rev. Earth Planet. Sci. 2010, 38, 77–102. [Google Scholar] [CrossRef]
  12. Liu, X.; Zheng, H.; Zhang, M.; Liu, C. Identification of dominant climate factor for pan evaporation trend in the Tibetan Plateau. J. Geogr. Sci. 2011, 21, 594–608. [Google Scholar] [CrossRef]
  13. Chen, H.; Ju, P.; Zhu, Q.; Xu, X.; Wu, N.; Gao, Y.; Feng, X.; Tian, J.; Niu, S.; Zhang, Y.; et al. Carbon and nitrogen cycling on the Qinghai–Tibetan Plateau. Nat. Rev. Earth Environ. 2022, 3, 701–716. [Google Scholar] [CrossRef]
  14. Chen, H.; Zhu, Q.; Peng, C.; Wu, N.; Wang, Y.; Fang, X.; Gao, Y.; Zhu, D.; Yang, G.; Tian, J.; et al. The impacts of climate change and human activities on biogeochemical cycles on the Qinghai–Tibetan Plateau. Glob. Chang. Biol. 2013, 19, 2940–2955. [Google Scholar] [CrossRef] [PubMed]
  15. Zhang, Y.; Qi, W.; Zhou, C.; Ding, M.; Liu, L.; Gao, J.; Bai, W.; Wang, Z.; Zheng, D. Spatial and temporal variability in the net primary production of alpine grassland on the Tibetan Plateau since 1982. J. Geogr. Sci. 2014, 24, 269–287. [Google Scholar] [CrossRef]
  16. Fu, B.; Ouyang, Z.; Shi, P.; Fan, J.; Wang, X.; Zheng, H.; Zhao, W.; Wu, F. Current Condition and Protection Strategies of Qinghai–Tibet Plateau Ecological Security Barrier. Bull. Chin. Acad. Sci. (Chin. Version) 2021, 36, 1298–1306. [Google Scholar] [CrossRef]
  17. Chen, B.X.; Zhang, X.Z.; Tao, J.; Wu, J.S.; Wang, J.S.; Shi, P.L.; Zhang, Y.J.; Yu, C.Q. The impact of climate change and anthropogenic activities on alpine grassland over the Qinghai–Tibet Plateau. Agric. For. Meteorol. 2014, 189, 11–18. [Google Scholar] [CrossRef]
  18. Scurlock, J.; Hall, D. The global carbon sink: A grassland perspective. Glob. Chang. Biol. 1998, 4, 229–233. [Google Scholar] [CrossRef]
  19. Zhong, L.; Ma, Y.; Xue, Y.; Piao, S. Climate Change Trends and Impacts on Vegetation Greening over the Tibetan Plateau. J. Geophys. Res. Atmos. 2019, 124, 7540–7552. [Google Scholar] [CrossRef]
  20. Wang, Y.; Lv, W.; Xue, K.; Wang, S.; Zhang, L.; Hu, R.; Zeng, H.; Xu, X.; Li, Y.; Jiang, L.; et al. Grassland changes and adaptive management on the Qinghai–Tibetan Plateau. Nat. Rev. Earth Environ. 2022, 3, 668–683. [Google Scholar] [CrossRef]
  21. Li, M.; Wu, J.; Feng, Y.; Niu, B.; He, Y.; Zhang, X. Climate variability rather than livestock grazing dominates changes in alpine grassland productivity across Tibet. Front. Ecol. Evol. 2021, 9, 631024. [Google Scholar] [CrossRef]
  22. Shen, W.; Zou, C.; Liu, D.; Ouyang, Y.; Zhang, H.; Yang, C.; Bai, S.; Lin, N. Climate-forced ecological changes over the Tibetan Plateau. Cold Reg. Sci. Technol. 2015, 114, 27–35. [Google Scholar] [CrossRef]
  23. Piao, S.; Niu, B.; Zhu, J.; Zhang, X.; Wang, T.; Wang, S.; Liang, E. Responses and feedback of the Tibetan Plateau’s alpine ecosystem to climate change. Chin. Sci. Bull. 2019, 64, 2842–2855. [Google Scholar] [CrossRef]
  24. Niu, B.; Zhang, X.; Piao, S.; Janssens, I.A.; Fu, G.; He, Y.; Zhang, Y.; Shi, P.; Dai, E.; Yu, C.; et al. Warming homogenizes apparent temperature sensitivity of ecosystem respiration. Sci. Adv. 2021, 7, eabc7358. [Google Scholar] [CrossRef] [PubMed]
  25. Piao, S.; He, Y.; Wang, X.; Chen, F. Estimation of China’s terrestrial ecosystem carbon sink: Methods, progress and prospects. Sci. China Earth Sci. 2022, 65, 641–651. [Google Scholar] [CrossRef]
  26. Friedlingstein, P.; O’sullivan, M.; Jones, M.W.; Andrew, R.M.; Hauck, J.; Olsen, A.; Peters, G.P.; Peters, W.; Pongratz, J.; Sitch, S. Global carbon budget 2020. Earth Syst. Sci. Data 2020, 12, 3269–3340. [Google Scholar] [CrossRef]
  27. Yang, Y.; Shi, Y.; Sun, W.; Chang, J.; Zhu, J.; Chen, L.; Wang, X.; Guo, Y.; Zhang, H.; Yu, L. Terrestrial carbon sinks in China and around the world and their contribution to carbon neutrality. Sci. China Life Sci. 2022, 65, 861–895. [Google Scholar] [CrossRef]
  28. Chen, J.; Yan, F.; Lu, Q. Spatiotemporal variation of vegetation on the Qinghai–Tibet Plateau and the influence of climatic factors and human activities on vegetation trend (2000–2019). Remote Sens. 2020, 12, 3150. [Google Scholar] [CrossRef]
  29. Yan, L.; Zhou, G.S.; Wang, Y.H.; Hu, T.Y.; Sui, X.H. The spatial and temporal dynamics of carbon budget in the alpine grasslands on the Qinghai–Tibetan Plateau using the Terrestrial Ecosystem Model. J. Clean. Prod. 2015, 107, 195–201. [Google Scholar] [CrossRef]
  30. Bond-Lamberty, B.; Wang, C.; Gower, S.T. A global relationship between the heterotrophic and autotrophic components of soil respiration? Glob. Chang. Biol. 2004, 10, 1756–1766. [Google Scholar] [CrossRef]
  31. Zhou, X.; Yu, F.; Cao, G.; Yang, W.; Zhou, Y. Spatiotemporal features of carbon source-sink and its relationship with climate factors in Qinghai–Tibet Plateau grassland ecosystem during 2001–2015. Soil Water Conserv. 2019, 26, 76–81. [Google Scholar]
  32. Quan, Q.; Tian, D.; Luo, Y.; Zhang, F.; Crowther, T.W.; Zhu, K.; Chen, H.Y.; Zhou, Q.; Niu, S. Water scaling of ecosystem carbon cycle feedback to climate warming. Sci. Adv. 2019, 5, eaav1131. [Google Scholar] [CrossRef] [PubMed]
  33. Gao, Y.; Yu, G.; Yan, H.; Zhu, X.; Li, S.; Wang, Q.; Zhang, J.; Wang, Y.; Li, Y.; Zhao, L.; et al. A MODIS-based Photosynthetic Capacity Model to estimate gross primary production in Northern China and the Tibetan Plateau. Remote Sens. Environ. 2014, 148, 108–118. [Google Scholar] [CrossRef]
  34. Gao, Y.; Yu, G.; Li, S.; Yan, H.; Zhu, X.; Wang, Q.; Shi, P.; Zhao, L.; Li, Y.; Zhang, F.; et al. A remote sensing model to estimate ecosystem respiration in Northern China and the Tibetan Plateau. Ecol. Model. 2015, 304, 34–43. [Google Scholar] [CrossRef]
  35. Chen, A.; Huang, L.; Liu, Q.; Piao, S. Optimal temperature of vegetation productivity and its linkage with climate and elevation on the Tibetan Plateau. Glob. Chang. Biol. 2021, 27, 1942–1951. [Google Scholar] [CrossRef] [PubMed]
  36. Yin, Y.; Wu, S.; Zhao, D.; Zheng, D.; Pan, T. Modeled effects of climate change on actual evapotranspiration in different eco-geographical regions in the Tibetan Plateau. J. Geogr. Sci. 2013, 23, 195–207. [Google Scholar] [CrossRef]
  37. Hutchinson, M. ANUSPLIN Version 4.3; Centre for Resource and Environmental Studies, The Australian National University: Canberra, Australia, 2004. [Google Scholar]
  38. Li, M.; Wu, J.S.; Song, C.Q.; He, Y.T.; Niu, B.; Fu, G.; Tarolli, P.; Tietjen, B.; Zhang, X.Z. Temporal Variability of Precipitation and Biomass of Alpine Grasslands on the Northern Tibetan Plateau. Remote Sens. 2019, 11, 360. [Google Scholar] [CrossRef]
  39. Li, M.; Zhang, X.; Wu, J.; Ding, Q.; Niu, B.; He, Y. Declining human activity intensity on alpine grasslands of the Tibetan Plateau. J. Environ. Manag. 2021, 296, 113198. [Google Scholar] [CrossRef]
  40. Xiao, X.; Hollinger, D.; Aber, J.; Goltz, M.; Davidson, E.A.; Zhang, Q.; Moore, B. Satellite-based modeling of gross primary production in an evergreen needleleaf forest. Remote Sens. Environ. 2004, 89, 519–534. [Google Scholar] [CrossRef]
  41. Woodwell, G.M.; Whittaker, R.H. Primary production in terrestrial ecosystems. Am. Zool. 1968, 8, 19–30. [Google Scholar] [CrossRef]
  42. Baldocchi, D.D.; Hincks, B.B.; Meyers, T.P. Measuring biosphere-atmosphere exchanges of biologically related gases with micrometeorological methods. Ecology 1988, 69, 1331–1340. [Google Scholar] [CrossRef]
  43. Reichstein, M.; Falge, E.; Baldocchi, D.; Papale, D.; Aubinet, M.; Berbigier, P.; Bernhofer, C.; Buchmann, N.; Gilmanov, T.; Granier, A. On the separation of net ecosystem exchange into assimilation and ecosystem respiration: Review and improved algorithm. Glob. Chang. Biol. 2005, 11, 1424–1439. [Google Scholar] [CrossRef]
  44. Xu, L.; Niu, B.; Zhang, X.; He, Y. Dynamic Threshold of Carbon Phenology in Two Cold Temperate Grasslands in China. Remote Sens. 2021, 13, 574. [Google Scholar] [CrossRef]
  45. Peng, D.; Zhang, X.; Wu, C.; Huang, W.; Gonsamo, A.; Huete, A.R.; Didan, K.; Tan, B.; Liu, X.; Zhang, B. Intercomparison and evaluation of spring phenology products using National Phenology Network and AmeriFlux observations in the contiguous United States. Agric. For. Meteorol. 2017, 242, 33–46. [Google Scholar] [CrossRef]
  46. Shi, P.; Sun, X.; Xu, L.; Zhang, X.; He, Y.; Zhang, D.; Yu, G. Net ecosystem CO2 exchange and controlling factors in a steppe—Kobresia meadow on the Tibetan Plateau. Sci. China Ser. D Earth Sci. 2006, 49, 207–218. [Google Scholar] [CrossRef]
  47. Niu, B.; He, Y.; Zhang, X.; Zong, N.; Fu, G.; Shi, P.; Zhang, Y.; Du, M.; Zhang, J. Satellite-Based Inversion and Field Validation of Autotrophic and Heterotrophic Respiration in an Alpine Meadow on the Tibetan Plateau. Remote Sens. 2017, 9, 615. [Google Scholar] [CrossRef]
  48. Sen, P.K. Estimates of the regression coefficient based on Kendall’s tau. J. Am. Stat. Assoc. 1968, 63, 1379–1389. [Google Scholar] [CrossRef]
  49. Kendall, M.G. Rank Correlation Methods; Charles Griffin: London, UK, 1948. [Google Scholar]
  50. Mann, H.B. Nonparametric tests against trend. Econom. J. Econom. Soc. 1945, 13, 245–259. [Google Scholar] [CrossRef]
  51. Wu, T.; Ma, W.; Wu, X.; Li, R.; Qiao, Y.; Li, X.; Yue, G.; Zhu, X.; Ni, J. Weakening of carbon sink on the Qinghai–Tibet Plateau. Geoderma 2022, 412, 115707. [Google Scholar] [CrossRef]
  52. Li, L.; Zhang, Y.; Liu, L.; Wu, J.; Li, S.; Zhang, H.; Zhang, B.; Ding, M.; Wang, Z.; Paudel, B. Current challenges in distinguishing climatic and anthropogenic contributions to alpine grassland variation on the Tibetan Plateau. Ecol. Evol. 2018, 8, 5949–5963. [Google Scholar] [CrossRef]
  53. Ma, M.; Yuan, W.; Dong, J.; Zhang, F.; Cai, W.; Li, H. Large-scale estimates of gross primary production on the Qinghai–Tibet plateau based on remote sensing data. Int. J. Digit. Earth 2018, 11, 1166–1183. [Google Scholar] [CrossRef]
  54. Zhuang, Q.; He, J.; Lu, Y.; Ji, L.; Xiao, J.; Luo, T. Carbon dynamics of terrestrial ecosystems on the Tibetan Plateau during the 20th century: An analysis with a process-based biogeochemical model. Glob. Ecol. Biogeogr. 2010, 19, 649–662. [Google Scholar] [CrossRef]
  55. Davidson, E.A.; Janssens, I.A. Temperature sensitivity of soil carbon decomposition and feedbacks to climate change. Nature 2006, 440, 165–173. [Google Scholar] [CrossRef] [PubMed]
  56. Ma, X.; He, P.; Zeng, Y.; Ma, J.; Wu, X. A global-drive analysis of ecosystem respiration in the Arctic and Third Pole. Ecol. Indic. 2022, 145, 109668. [Google Scholar] [CrossRef]
  57. Zha, X.; Niu, B.; Li, M.; Duan, C. Increasing Impact of Precipitation on Alpine-Grassland Productivity over Last Two Decades on the Tibetan Plateau. Remote Sens. 2022, 14, 3430. [Google Scholar] [CrossRef]
  58. Fu, G.; Zhang, X.; Zhang, Y.; Shi, P.; Li, Y.; Zhou, Y.; Yang, P.; Shen, Z. Experimental warming does not enhance gross primary production and above-ground biomass in the alpine meadow of Tibet. J. Appl. Remote Sens. 2013, 7, 073505. [Google Scholar] [CrossRef]
  59. Sun, J.; Zhou, T.C.; Liu, M.; Chen, Y.C.; Liu, G.H.; Xu, M.; Shi, P.L.; Peng, F.; Tsunekawa, A.; Liu, Y.; et al. Water and heat availability are drivers of the aboveground plant carbon accumulation rate in alpine grasslands on the Tibetan Plateau. Glob. Ecol. Biogeogr. 2019, 29, 50–64. [Google Scholar] [CrossRef]
  60. Doughty, C.E.; Metcalfe, D.; Girardin, C.; Amézquita, F.F.; Cabrera, D.G.; Huasco, W.H.; Silva-Espejo, J.; Araujo-Murakami, A.; Da Costa, M.; Rocha, W. Drought impact on forest carbon dynamics and fluxes in Amazonia. Nature 2015, 519, 78–82. [Google Scholar] [CrossRef]
  61. Mäkiranta, P.; Laiho, R.; Mehtätalo, L.; Straková, P.; Sormunen, J.; Minkkinen, K.; Penttilä, T.; Fritze, H.; Tuittila, E.S. Responses of phenology and biomass production of boreal fens to climate warming under different water-table level regimes. Glob. Chang. Biol. 2018, 24, 944–956. [Google Scholar] [CrossRef]
  62. Niu, S.; Wu, M.; Han, Y.; Xia, J.; Li, L.; Wan, S. Water-mediated responses of ecosystem carbon fluxes to climatic change in a temperate steppe. New Phytol. 2008, 177, 209–219. [Google Scholar] [CrossRef]
  63. Li, D.; Luo, X.; Cao, G.; Wu, Q.; Zhuo, M.; Li, H.; Yang, Y.; Pang, B. Simulating of the response of soil heterotrophic respiration to climate change and nitrogen deposition in alpine meadows. Acta Pratacult. Sin. 2015, 24, 1–11. [Google Scholar]
  64. Larsen, K.S.; Ibrom, A.; Beier, C.; Jonasson, S.; Michelsen, A. Ecosystem respiration depends strongly on photosynthesis in a temperate heath. Biogeochemistry 2007, 85, 201–213. [Google Scholar] [CrossRef]
  65. Wei, D.; Qi, Y.; Ma, Y.; Wang, X.; Ma, W.; Gao, T.; Huang, L.; Zhao, H.; Zhang, J.; Wang, X. Plant uptake of CO2 outpaces losses from permafrost and plant respiration on the Tibetan Plateau. Proc. Natl. Acad. Sci. USA 2021, 118, e2015283118. [Google Scholar] [CrossRef]
  66. Yang, C.; Zhang, Y.; Hou, F.; Millner, J.P.; Wang, Z.; Chang, S. Grazing activity increases decomposition of yak dung and litter in an alpine meadow on the Qinghai–Tibet plateau. Plant Soil 2019, 444, 239–250. [Google Scholar] [CrossRef]
  67. Heckman, R.W.; Rueda, A.; Bonnette, J.E.; Aspinwall, M.J.; Khasanova, A.; Hawkes, C.V.; Juenger, T.E.; Fay, P.A. Legacies of precipitation influence primary production in Panicum virgatum. Oecologia 2022, 201, 269–278. [Google Scholar] [CrossRef] [PubMed]
  68. Ott, J.P.; Klimešová, J.; Hartnett, D.C. The ecology and significance of below-ground bud banks in plants. Ann. Bot. 2019, 123, 1099–1118. [Google Scholar] [CrossRef] [PubMed]
  69. Sala, O.E.; Gherardi, L.A.; Reichmann, L.; Jobbagy, E.; Peters, D. Legacies of precipitation fluctuations on primary production: Theory and data synthesis. Philos. Trans. R. Soc. B Biol. Sci. 2012, 367, 3135–3144. [Google Scholar] [CrossRef] [PubMed]
  70. He, Y.; Xu, X.; Kueffer, C.; Zhang, X.; Shi, P. Leaf litter of a dominant cushion plant shifts nitrogen mineralization to immobilization at high but not low temperature in an alpine meadow. Plant Soil 2014, 383, 415–426. [Google Scholar] [CrossRef]
  71. Kemp, P.; Reynolds, J.; Virginia, R.; Whitford, W. Decomposition of leaf and root litter of Chihuahuan desert shrubs: Effects of three years of summer drought. J. Arid. Environ. 2003, 53, 21–39. [Google Scholar] [CrossRef]
  72. Shen, W.; Jenerette, G.D.; Hui, D.; Phillips, R.P.; Ren, H. Effects of changing precipitation regimes on dryland soil respiration and C pool dynamics at rainfall event, seasonal and interannual scales. J. Geophys. Res. Biogeosci. 2008, 113. [Google Scholar] [CrossRef]
  73. Shen, W.; Jenerette, G.; Hui, D.; Scott, R.L. Precipitation legacy effects on dryland ecosystem carbon fluxes: Direction, magnitude and biogeochemical carryovers. Biogeosciences 2016, 13, 425–439. [Google Scholar] [CrossRef]
  74. He, H.; Liu, M.; Xiao, X.; Ren, X.; Zhang, L.; Sun, X.; Yang, Y.; Li, Y.; Zhao, L.; Shi, P. Large-scale estimation and uncertainty analysis of gross primary production in Tibetan alpine grasslands. J. Geophys. Res. Biogeosci. 2014, 119, 466–486. [Google Scholar] [CrossRef]
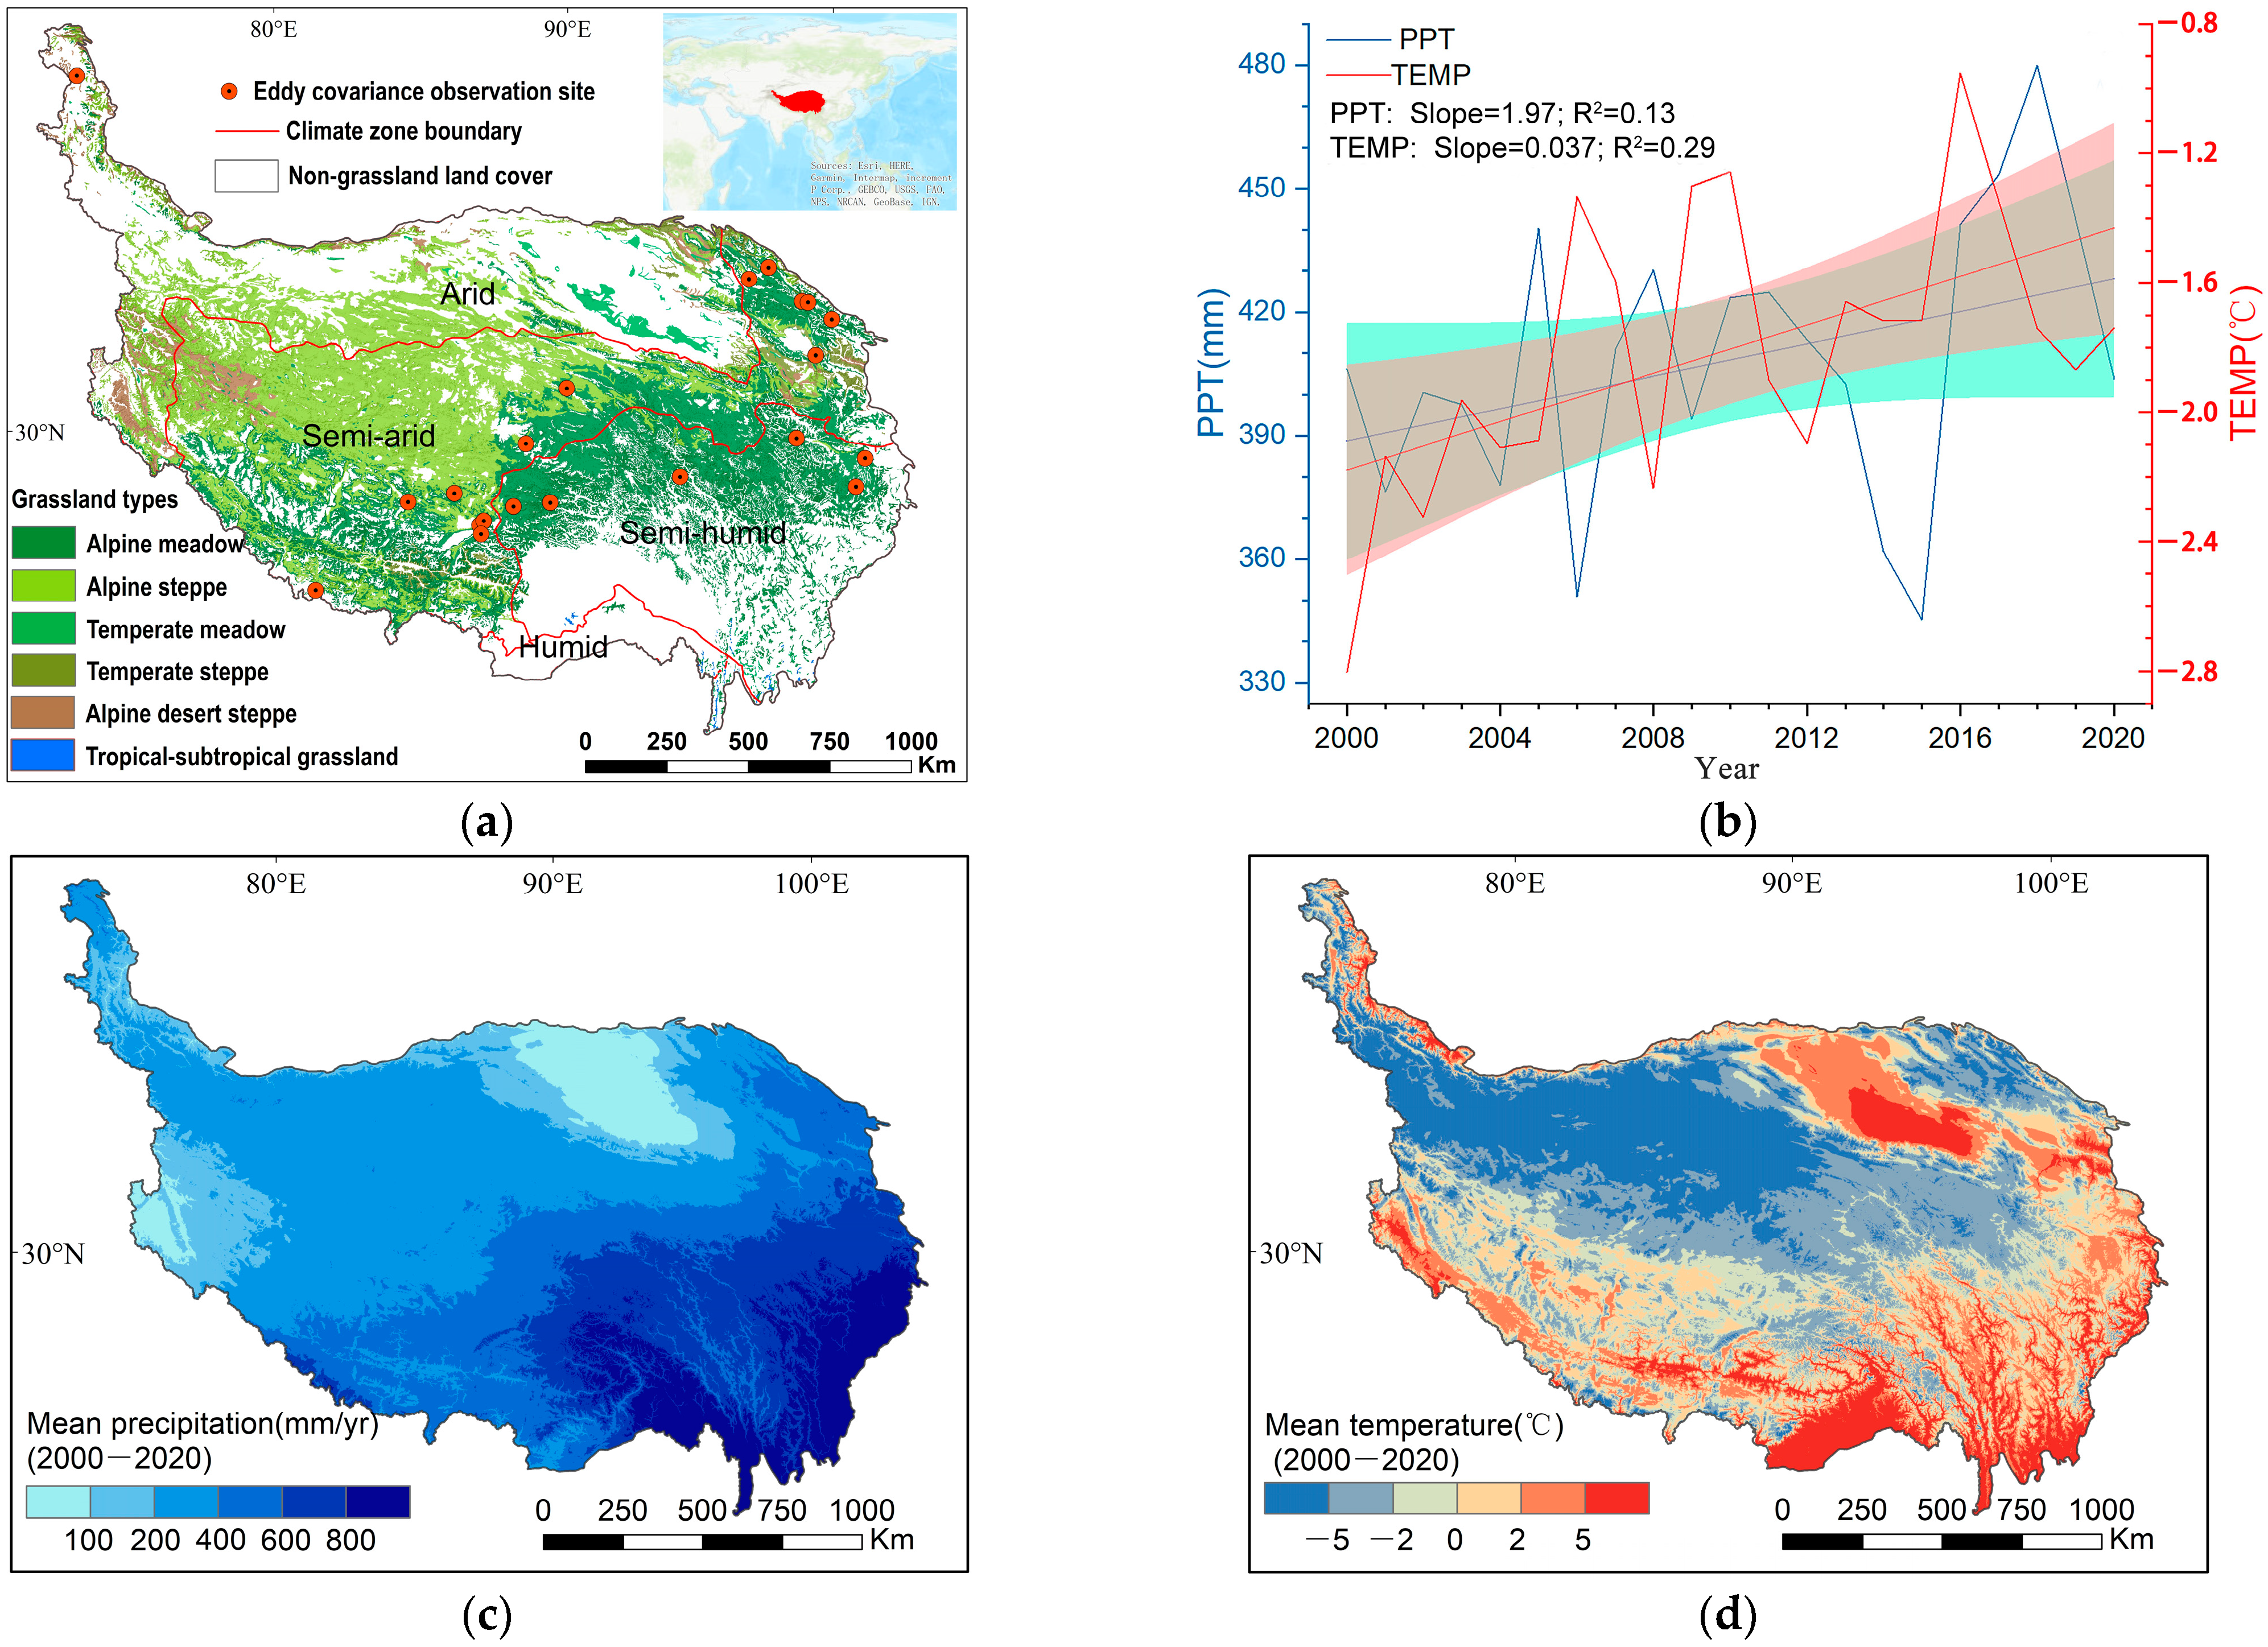
Figure 1. Distribution of grassland types and eddy covariance observation sites (a), the trends (b) of precipitation (blue line) and temperature (red line), the spatial pattern of multi-year (2000–2020) mean annual precipitation (c) and multi-year mean air temperature (d) over the grassland on the Qinghai–Tibet Plateau (QTP) from 2000 to 2020 (reference system: WGS 84).
Remotesensing 15 02492 g001
Figure 2. Comparison between the simulated carbon budget (net ecosystem productivity (NEP), gross primary productivity (GPP), and ecosystem respiration (ER)) and eddy covariance (EC)-based carbon budget. Confidence bands in the figure represent 95% confidence.
Remotesensing 15 02492 g002
Figure 3. Overall dynamics of annual GPP (gross primary productivity) (a), ER (ecosystem respiration) (b), and NEP (net ecosystem productivity) (c) of the alpine grassland on the Qinghai–Tibet Plateau (AGQTP), and the spatial distribution of the average GPP (d), ER (e), and NEP (f) during 2000–2020.
Remotesensing 15 02492 g003
Figure 4. Spatial distributions of trends (ac) and the changes in the proportion of the area of different trends (df) in gross primary productivity (GPP) (a,d), ecosystem respiration (ER) (b,e), and net ecosystem respiration (NEP) (c,f) over the alpine grassland on the Qinghai–Tibet Plateau (AGQTP) during 2000–2020. The inset maps (a,b) show significant (p < 0.05) decreases (red), and significant increases (green). The lower panels (df) display the proportion of the grassland areas with different trends in each window on the vertical axis, while the horizontal axis indicates the year in the middle of each window (e.g., 2004 represents the window of 2000–2008).
Remotesensing 15 02492 g004
Figure 5. Partial correlation between annual net ecosystem productivity (NEP), gross primary productivity (GPP), ecosystem respiration (ER), and climatic factors (annual precipitation (PPT) and temperature (TEMP)) during 2000–2020 (a), 2000–2010 (b), and 2011–2020 (c) over the alpine grassland on the Qinghai–Tibet Plateau (AGQTP). GPP_NY, ER_NY, and NEP_NY represent the next year’s GPP, ER, and NEP, respectively, compared to the climatic factors.
Remotesensing 15 02492 g005
Figure 6. Spatial distributions of the correlations between the multi-year average gross primary productivity (GPP) (a,b), ecosystem respiration (ER) (c,d), net ecosystem productivity (NEP) (e,f), and climatic factors (PPT: precipitation, TEMP: temperature) over the alpine grassland on the Qinghai–Tibet Plateau (AGQTP) during 2000–2020.
Remotesensing 15 02492 g006
Figure 7. Comparison of trends in carbon budget indicators and climatic factors over sliding windows (a,b), and correlations between them (c) over the alpine grassland on the Qinghai–Tibet Plateau (AGQTP) during 2000–2020. Pslope_pw and Tslope_pw are the slopes of precipitation and temperature trends, respectively, in the preceding window relative to the carbon budget indicators.
Remotesensing 15 02492 g007
Disclaimer/Publisher’s Note: The statements, opinions and data contained in all publications are solely those of the individual author(s) and contributor(s) and not of MDPI and/or the editor(s). MDPI and/or the editor(s) disclaim responsibility for any injury to people or property resulting from any ideas, methods, instructions or products referred to in the content.