Article

Snowmelt Runoff in the Yarlung Zangbo River Basin and Runoff Change in the Future

1
College of Water Sciences, Beijing Normal University, Beijing 100875, China
2
Beijing Key Laboratory of Urban Hydrological Cycle and Sponge City Technology, Beijing 100875, China
*
Author to whom correspondence should be addressed.
Remote Sens. 2023, 15(1), 55; https://doi.org/10.3390/rs15010055
Submission received: 31 October 2022 / Revised: 6 December 2022 / Accepted: 19 December 2022 / Published: 22 December 2022

Abstract

:
Comprehending the impacts of climate change on regional hydrology and future projections of water supplies is of great value to manage the water resources in the Yarlung Zangbo River Basin (YZRB). However, large uncertainties from both input data and the model itself exert obstacles to accurate projections. In this work, a hydrological modeling framework was established over the YZRB linking the Variable Infiltration Capacity (VIC) with an empirical formulation, called the degree-day glacier-melt scheme (VIC–Glacier). The model performance was evaluated through three aspects, including streamflow, snow cover area, and glacier area. Nine GCM models and three emission scenarios (SSP1-2.6, SSP2-4.5, and SSP5-8.5) in CMIP6 were chosen to drive the calibrated VIC–Glacier model. The results showed that both precipitation and temperature resulted in an increase of around 25% and 13%, respectively, in multi-year average runoff from June to September, under SSP5-8.5 and SSP1-2.6. The precipitation runoff was projected to increase, as compensation for the decrease of glacier runoff and snow runoff by the end of the 21st century. An apparent increasing trend in the runoff was expected over the YZRB before 2050 and after the year 2060 under SSP 5-8.5, with a steeply decreasing trend from 2050 to 2060, and a negligible decreasing trend under SSP1-2.6 from 2020 to 2060, in contrast to an increasing trend from 2060 to 2100.

1. Introduction

Climate change, induced by natural processes and anthropogenetic factors, demonstrates that global warming has become an important environmental issue and poses great threats for both governments and individuals, with time scales varying from many millions of years down to a few years [1]. The collateral upheavals retain a latent capability to menace both natural systems and human society, including biodiversity, the environmental system, food security, and the terrestrial water cycle [2,3]. Strengthened evidence facilitates the growing opinion that the global water cycle will continue to intensify as the global temperature heats up, with precipitation and surface runoff projected to become more prevalent in most lands.
Ice and snow combined exert a major control on climate and hydrology over many glacierized and snow-covered areas, such as the Tibetan Plateau (TP) in China, probably due to the intrinsic property of glaciers and frozen soil to serve as ‘water tanks’ and to regulate the regime of streamflow [4,5,6,7,8]. Acting as an indicator, the TP exerts great mutual interaction with regional and global climates and, thereby, potentially affects reliability of the headwaters of many prominent Asian rivers. As a result, ongoing attempts are conducted to assess the underlying impact of climate change. Trend analysis on temperature, in light of meteorological observations, multi-source products, and in-field ice core records, presented a statistically significant warming trend (0.16 °C/decade to 0.36 °C/decade) over the TP in recent decades [9,10,11,12,13], which, in turn, caused pronounced seasonal and spatial differences and altered the snow and glacier distribution, finally changing the streamflow, owing to its vulnerability and connectivity [14]. Moreover, the intertwined competition between the two dominating large-scale circulations, namely, the westerlies and the Indian monsoon, has constituted the distinct north–south dipole pattern of precipitation changes, exhibiting inhomogeneous increasing trends in endorheic and exoreic basins and complexing the water cycle. Evident cryosphere changes were detected, including glacier shrinkage, increasing negative glacier mass balance, continued expansion of glacier-fed lakes, and constant degradation of permafrost, all of which ultimately caused upward winter runoff and advanced snow melt. These effects alleviated the water shortage downstream, while leading to a surge in concern about the sustainability of this phenomenon in the long term [15,16,17,18].
Situated in the south of the TP, the westerlies and upstream warm moist flow from the Bay of Bengal complicate the situation and increase the uncertainty concerning climate change in the Yarlung Zangbo River Basin (YZRB). Over the last several decades, increased air temperature and precipitation have been detected in the YZRB [14,19,20,21]. Changes in temperature and precipitation are bound to seriously affect the melt characteristics of mountain glaciers and snow, regulation of the runoff regime, and, finally, crop cultivation and people downstream [22,23,24,25]. Along with a warming climate, several studies have reported that retreating perennial snow and shrinking glaciers impact runoff generation, especially in the YZRB [10,26,27,28]. Given the unique weather conditions of the Tibet Autonomous Region (TAR) and its indispensable status as the ‘granary’ of the YZRB [29], quantifying the potential impacts of future climate changes on glaciers and river flow over the YZRB is essential to assist policy-makers in adopting strategies that depend on state-of-the-art scientific understanding.
Global climate models (GCMs) are considered the most attainable tools for investigating future climate change and have, so far, been widely utilized in many areas [30,31,32,33]. Assessing the impacts of cryosphere change quantitatively in most research is restricted to modeling approaches, probably due to the inaccessibility of field measurements [34,35,36]. Coupling hydrological models with GCM models provides a distinct research perspective on climate changes at the catchment scale, and, up to now, most works projected future hydrological process over the TP in this way [37]. For example, Zhao et al. [37] analyzed the future change in glaciers and runoff in the Yellow River, Yangtze River, Mekong, Salween, and Brahmaputra rivers on the TP using an extended Variable Infiltration Capacity (VIC) coupled with a glacier module. The results illustrated that the decrease in glacier runoff would be compensated by the increased precipitation induced by the rising temperature and these combined factors could cause a surge in runoff of the five basins. Liu et al. [38] coupled the VIC model with the MIROC6 dataset to simulate the future hydrological process in the YZRB over TP. The study pointed out the possibility that runoff in the basin would decrease from 2046 to 2060 and increase from 2086 to 2100. Similarly, Immerzeel et al. [39] revealed that the streamflow would possibly reduce, due to reductions in glacier meltwater in the upper sources, like the Yangtze River, Brahmaputra, and Ganges, by mid-century. They also noted a notable increase in runoff of the Yellow River basin due to increasing precipitation and low proportion of glacier melt. Su et al. [40] researched future climate change on water balance for the six major rivers in the TP through an established VIC–Glacier model, coupled with 20 CMIP5 GCMs. The results indicated that the streamflow of six rivers (Yellow River, Yangtze River, Salween, Mekong, Brahmaputra, and Indus) would remain moderate in the near term (2011–2040) and increase by 2.7–22.4% due to increased precipitation and glacier meltwater. Meanwhile, accelerated glacier melt was thought to be the main reason for the increased runoff from the Brahmaputra and Indus basins.
However, the accuracy of the simulations varied with the model adopted, the calibrated parameters, and the input sources driving the model. Although there have been diverse experimental attempts, to varying degrees, to assess the impact of climate on runoff in the YZRB, there is not a general consensus among researchers about the proportions. and variations of glacier and snow, because the errors possibly induced by the model, parameters and input cannot be ruled out. For starters, among these studies, several studies chose the model in the absence of a glacier module, which could not represent the circumstances in the YZRB [38]. Additionally, most research set streamflow as the only calibration standard, and few calibrated studies calibrated both the parameters of snow and glaciers, with many of them only calibrating either glaciers or snow [37,40,41,42]. On top of that, the CMIP5 dataset is always set as the input driving the model, which is known to exhibit systematic errors in reproducing temperature and precipitation, especially in the TP [43,44,45], and this error could be amplified by the non-linear characteristics of the hydrological model [40]. New research proved that CMIP6 could yield better performance in reconstructing temperature and precipitation over TP [33]. Therefore, there is a vast, unfulfilled, demand for accurate simulation for the YZRB. A well-calibrated hydrological model incorporating both snow and glacier modules driven by CMIP6 has great significance in future simulation for the YZRB. Currently, three traditional hydrological models (VIC, SPHY and SRM), coupled with a temperature-index scheme, were mainly applied to simulate both historic and future hydrological processes, and a physical-based model, coupled with a glacier module, and driven by the latest CMIP6, has not been experimentally applied in the YZRB, leaving the field vacant to do so, and highlighting the necessity of our work.
Above all, this study primarily aimed to investigate the variation of meteorological factors and their corresponding impacts on runoff components under future scenarios. Specifically, the objectives were the following: (1) to analyze future monthly variation of the downscaled precipitation and temperature, compared with the basis under examination, i.e., China Meteorological Forcing Data (CMFD); (2) to calibrate the coupled model in different aspects, including streamflow, snow cover area and glacier volume; (3) to drive the VIC coupled with the glacier model (VIC–Glacier), using the commonly adopted Multi-Model Ensemble (MME) method [46], and, thereby, to project future hydrological processing and the variation of precipitation, snow and glacier runoff, to assist policy-makers in governing water resources in the context of climate change.

2. Materials and Methods

2.1. Study Area

The study focused on the YZRB, located between 82–97°7′E and 28–31°16′N in the southeast of the TP and embraced by the Himalayas and Gangdise–Nyainqentanglha Mountains. The YZRB has a drainage area of 242,000 km2, with elevations from 165 m to 7259 m and a river length of around 2100 km. Based on the gauged meteorological stations, the mean annual precipitation is around 430 mm, with greatly uneven distribution across the year from the east to the west. The climate characteristics of the YZRB are mainly described by the Indian monsoon systems, with additional influences from the midlatitude westerlies and East Asian monsoon, and the combination of these cause the bulk of precipitation to fall during summer [47].

2.2. Data

2.2.1. China Meteorological Forcing Dataset

Due to the scarcity and uneven distribution of gauge stations in Figure 1, a reconstructed meteorological dataset called CMFD was adopted in our study. The dataset has been extensively and rigorously assessed and validated in various regions in previous studies [48,49]. The CMFD is a near-surface meteorological and environmental reanalysis dataset developed by the Institute of Tibetan Plateau Research at the Chinese Academy of Science, covering the region 70–140°E and 15–55°N, and including precipitation, downward shortwave radiation, downward longwave radiation, 2 m air temperature, specific humidity, wind speed and surface pressure [14]. In this study, the 0.1° × 0.1° 3-hourly CMFD products from 1979 to 2014 were obtained from http://data.tpdc.ac.cn (accessed on 30 October 2022) and, later, processed into a 0.25° × 0.25° 1-day product to serve as the historical meteorological forcing driving the model and benchmark, compared with future forcing.

2.2.2. GCM

The latest CMIP6 is currently underway and consists of nearly 50 models from 14 countries. It first considers both the socioeconomic scenarios and the radiation forcing scenarios. Through the latest SPPs, it is possible to quantitatively portray the challenges that society may confront in the future under pressure from both climate change and socioeconomic factors [50]. In this study, we adopted 9 models according to variability and availability, as shown in Table 1. Three scenarios, indicating low, middle, and high radiative forcing, were chosen for governmental management.

2.2.3. Gauged Observation

Twelve meteorological gauges from the China Meteorological Administration (CMA), were used to constitute the elements in Figure 1. The streamflow data at Nuxia was used to determine the model parameters, and were primarily collected from the Tibet Hydrology and Water Resources Survey Bureau and then passed for quality control procedures. In our study, the qualified time period selected was from 1979 to 2014 to calibrate the model.

2.2.4. MODIS Snow Cover Data

The latest daily cloud-free snow area dataset, with a spatial resolution of 500 m, from 2000 to 2020, based on the MODIS product MOD/MYD09GA, provided the national snow distribution, downloaded from http://www.ncdc.ac.cn/ (accessed on 30 October 2022) [51]. Currently, the dataset has been rigorously validated across the China [51], and therefore provides an ideal reference to validate the snow parameter in the model.

2.2.5. Glacier Datasets

The Randolph Glacier Inventory (RGI) and the Second Chinese Glacier Inventory (SCGI) provided the profile of glaciers in YRZB, thereby enabling calibration of the glacier parameters in the model. The RGI is a global inventory designed to sketch glacier outlines all over the world and is released as a supplement to the Global Land Ice Measurement from Space initiative (GLIMS). The SCGI is compiled in the basis of historical topographic maps, as well as remote-sensing images after 2004, including Landsat TM/ETM+ and ASTER images, and SRTM DEM [52]. The spatial distribution of glaciers from RGI was used to determine the initial glacier input information for the model. The updated glacier distribution datasets of SCGI were used to provide consecutive glacier information and to calibrate and validate the glacier parameters, like degree-day factors in the model.

2.2.6. Other Data

The essential requisites for the VIC model are soil property, land use, and topography data. The soil parameters were derived from the International Geosphere–Biosphere Program Data and Information System (IGBP-BIS), which provided the global distribution and property for soils. The vegetation types were obtained from the 1 km global land cover map, provided by the University of Maryland [53]. The topography data in this study was obtained from the Advanced Spaceborne Thermal Emission and Reflection Radiometer Global Digital Elevation Model.

2.3. Method

2.3.1. Variable Infiltration Capacity Model

The VIC model was originally developed by the University of Washington [54] and simulates various processes of the water cycle, based on the principle of energy and water balance, and used to calculate fluxes in each grid. The routing process was carried out through a procedure coupled with VIC [55,56]. The sensitive parameters of the VIC model that needed to be calibrated are listed in Table 2 and determined by the Genetic Algorithm (GA) in this work.

2.3.2. Statistical Downscaling

The CMIP6 GCMs are improvements of the earlier CMIP5 model. They are reported to be reliable in simulating the geographical distribution of meteorological characteristics in China. However, deviations in the dataset are still inevitable. The Bias Correction and Spatial Downscaling Algorithm (BCSD) is commonly utilized to correct GCM data, due to its simplicity, efficiency, and effectiveness in reducing systematic errors [57,58,59]. This method corrects systematic error through two-part frames of bias correction and spatial disaggregation, and applies this to each day for each of the meteorological variables (i.e., precipitation, maximum temperature, minimum temperature, and wind). In this paper, the CMFD was set as the baseline historic meteorological data, and outputs of GCMs from 9 models were bias-corrected into a 0.25° × 0.25° gird by using the BCSD method over the YZRB. The common bilinear interpolation was used to downscale the raw CMIP6 into higher spatial resolution. For the bias-correction step, the biases from raw GCM-simulated monthly meteorological data at each grid, which were already interpolated into finer resolution, were removed by adjusting the modeled cumulative distribution functions (CDFs) to those of the benchmarked CMFD CDFs from 1979 to 2014. Next, the bias-corrected high-resolution GCM fields were calculated by adding (precipitation, maximum and minimum temperature) or multiplying (wind) the change factors.

2.3.3. Glacier Module

During the past decades, the methods used to simulate the process of snow and ice melt fall into two categories: temperature index and energy balance. These methods have been refined through continuous usage around the world [60,61,62]. Although the latter enjoy the benefit of solid physical bases, they are often difficult to implement in high mountain catchments, due to the highly demanding volume of meteorological variables. Instead, the temperature index serves as an alternative to estimate glacier/snow melt, due to its simplicity in concept and low restriction in data requirement [63,64,65].
In this work, an extended degree-day algorithm was adopted to calculate the glacier melt in each glacier band, combining the traditional degree-day method and the exposure dependence on the surface aspect [66,67]:
M i , b a n d = { D D F s n o w / i c e × ( 1 R exp × cos a s p i , b a n d ) × T b a n d , T b a n d > 0 0 , T b a n d < 0
where M i , b a n d is the total melt of snow/ice (mm) for a glacier in the b a n d i t h glacier band; D D F s n o w / i c e is the degree-day factor for snow/ice (mm °C−1 day−1); R exp is the factor quantifying the aspect dependence of D D F s n o w / i c e ; and cos a s p i , b a n d is the mean cosine of the surface aspect for glacier i within the elevation band.
Reproducing the process of glacier retreating and advancing plays a vital role in accurate simulation and is regarded as the indispensable component in the glacier scheme. The volume-area scaling approach has been widely applied to derive the dynamic evolution of glaciers, due to its simple concept compensating for the flaws caused by the high data demanded of the numerical ice-flow model [28,39,68].
V = c A γ
A = ( V / c ) 1 / γ
where V is the volume of the glacier and A is the area of each glacier in the calculated unit, respectively. In our study, the constant c and the dimensionless scaling coefficient were set as 0.0365 and 1.375 according to previous research [69].
The initial glacier profile was determined through the RGI. Then, the area fraction of each glacier was adjusted through the updated glacier volume, using Equation (3). Due to the band setting in our study, we assumed that the glacial advance or retreat phenomena first occurs in the lowest band, which, thereby, simplifies the computation, which has been testified to by former researches in the TP and Himalaya [37].

2.3.4. Routing Scheme

Here, the separate Lohamann routing module [55,56], which essentially describes the convergence time for runoff reaching the outlet of a gridded basin, as well as the transport of water in the channel river, was used as the postprocessor for the VIC model. Considering the module of glacier runoff, the total runoff generated in each grid was calculated by the following formulation [70]:
R i = f × M i + ( 1 f ) × R v i c
where R i is the total runoff (mm) in the grid i; f is the glacier area fraction in the grid i; R v i c is the runoff (mm) in the grid i generated from VIC for the ice-free area; M i is the melt water (mm) for the glacier area in the grid i.

2.3.5. Evaluation Criteria

In this study, the Nash–Sutcliffe Efficient index (NSE) [71] and Relative Error (RE) were used to evaluate the model performance, and a successive difference NSE less than 0.001 was utilized as the stopping standard of the GA to address the convergence issue, regarded as an effective calibration program in many trials.
N S E = 1 i = 1 N ( Q o b s , i Q s i m , i ) 2 i = 1 N ( Q o b s , i Q ¯ o b s ) 2
R E = i = 1 N ( Q s i m , i Q o b s , i ) i = 1 N Q o b s , i
where Q s i m and Q o b s denote the simulated and observed streamflow, respectively; Q ¯ o b s denotes the average value of the observed stream, and N denotes the total sequence numbers of the period.

3. Results

In this section, we analyzed the future climate change in temperature and precipitation. We assessed the model performance, based on multiple source products, including historical observations, glacier data, and a reconstructed snow dataset. We also projected future runoff and its components change and use of the VIC–Glacier model forced by the downscaled outputs of GCM under different emissions.

3.1. BCSD Downscaling

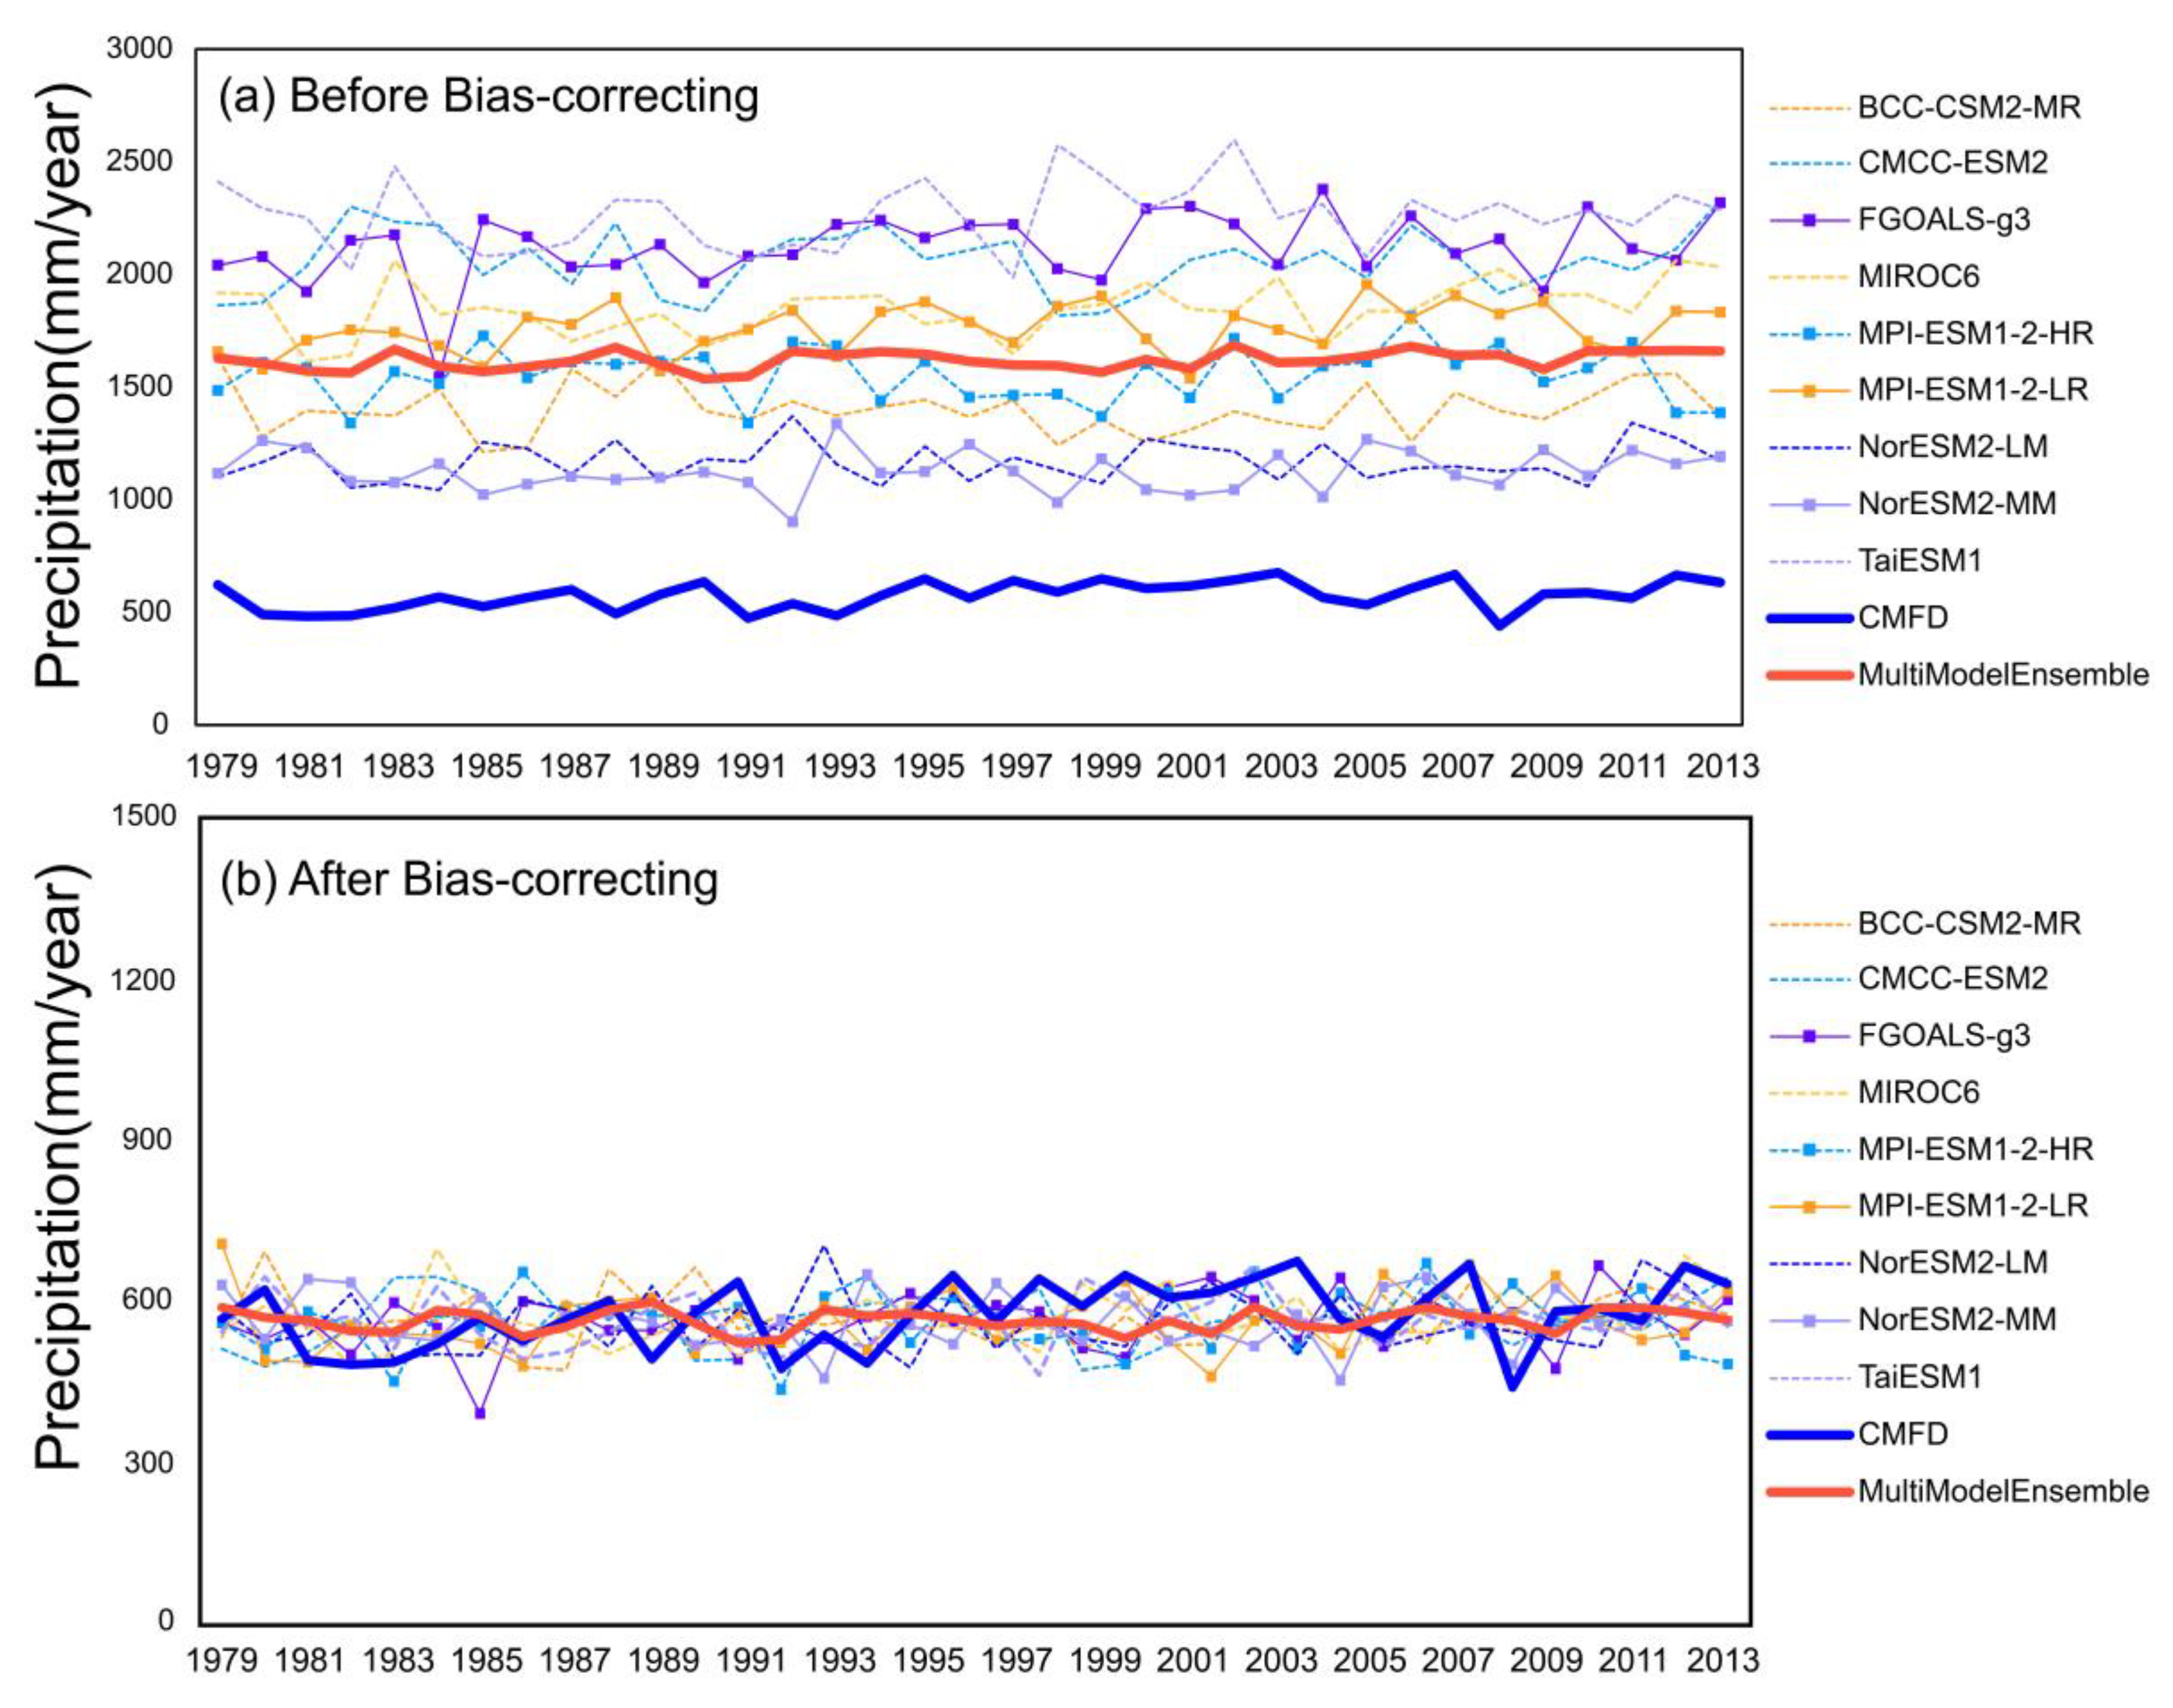
The BCSD downscaling method was applied to bias-correct the raw CMIP6 meteorological elements at the closest grid to reduce the systematic bias and increase the accuracy. Figure 2 shows the variation in annual mean precipitation in individual CMIP6 compared with CMFD. The time series in Figure 2a were not consistent but overall overvalued from 1979 to 2014, with most values being from 893 mm to 2259 mm, and a large variation was found between CMCC–ESM2 and TaiESM1. Similar to previous studies, the MME of 9 models, before downscaling, exhibited great differences compared with CMFD, and the average precipitation from 1979–2014 in CMIP6 was 1045 mm higher than the CMFD. After bias-correction, the accuracy of precipitation was significantly improved in Figure 2b, showing a great relationship with the CMFD data, and the average error was reduced to 9.1 mm. on average, with BCC–CSM2–MR performing best at 6 mm.

3.2. Changes in Precipitation and Temperature

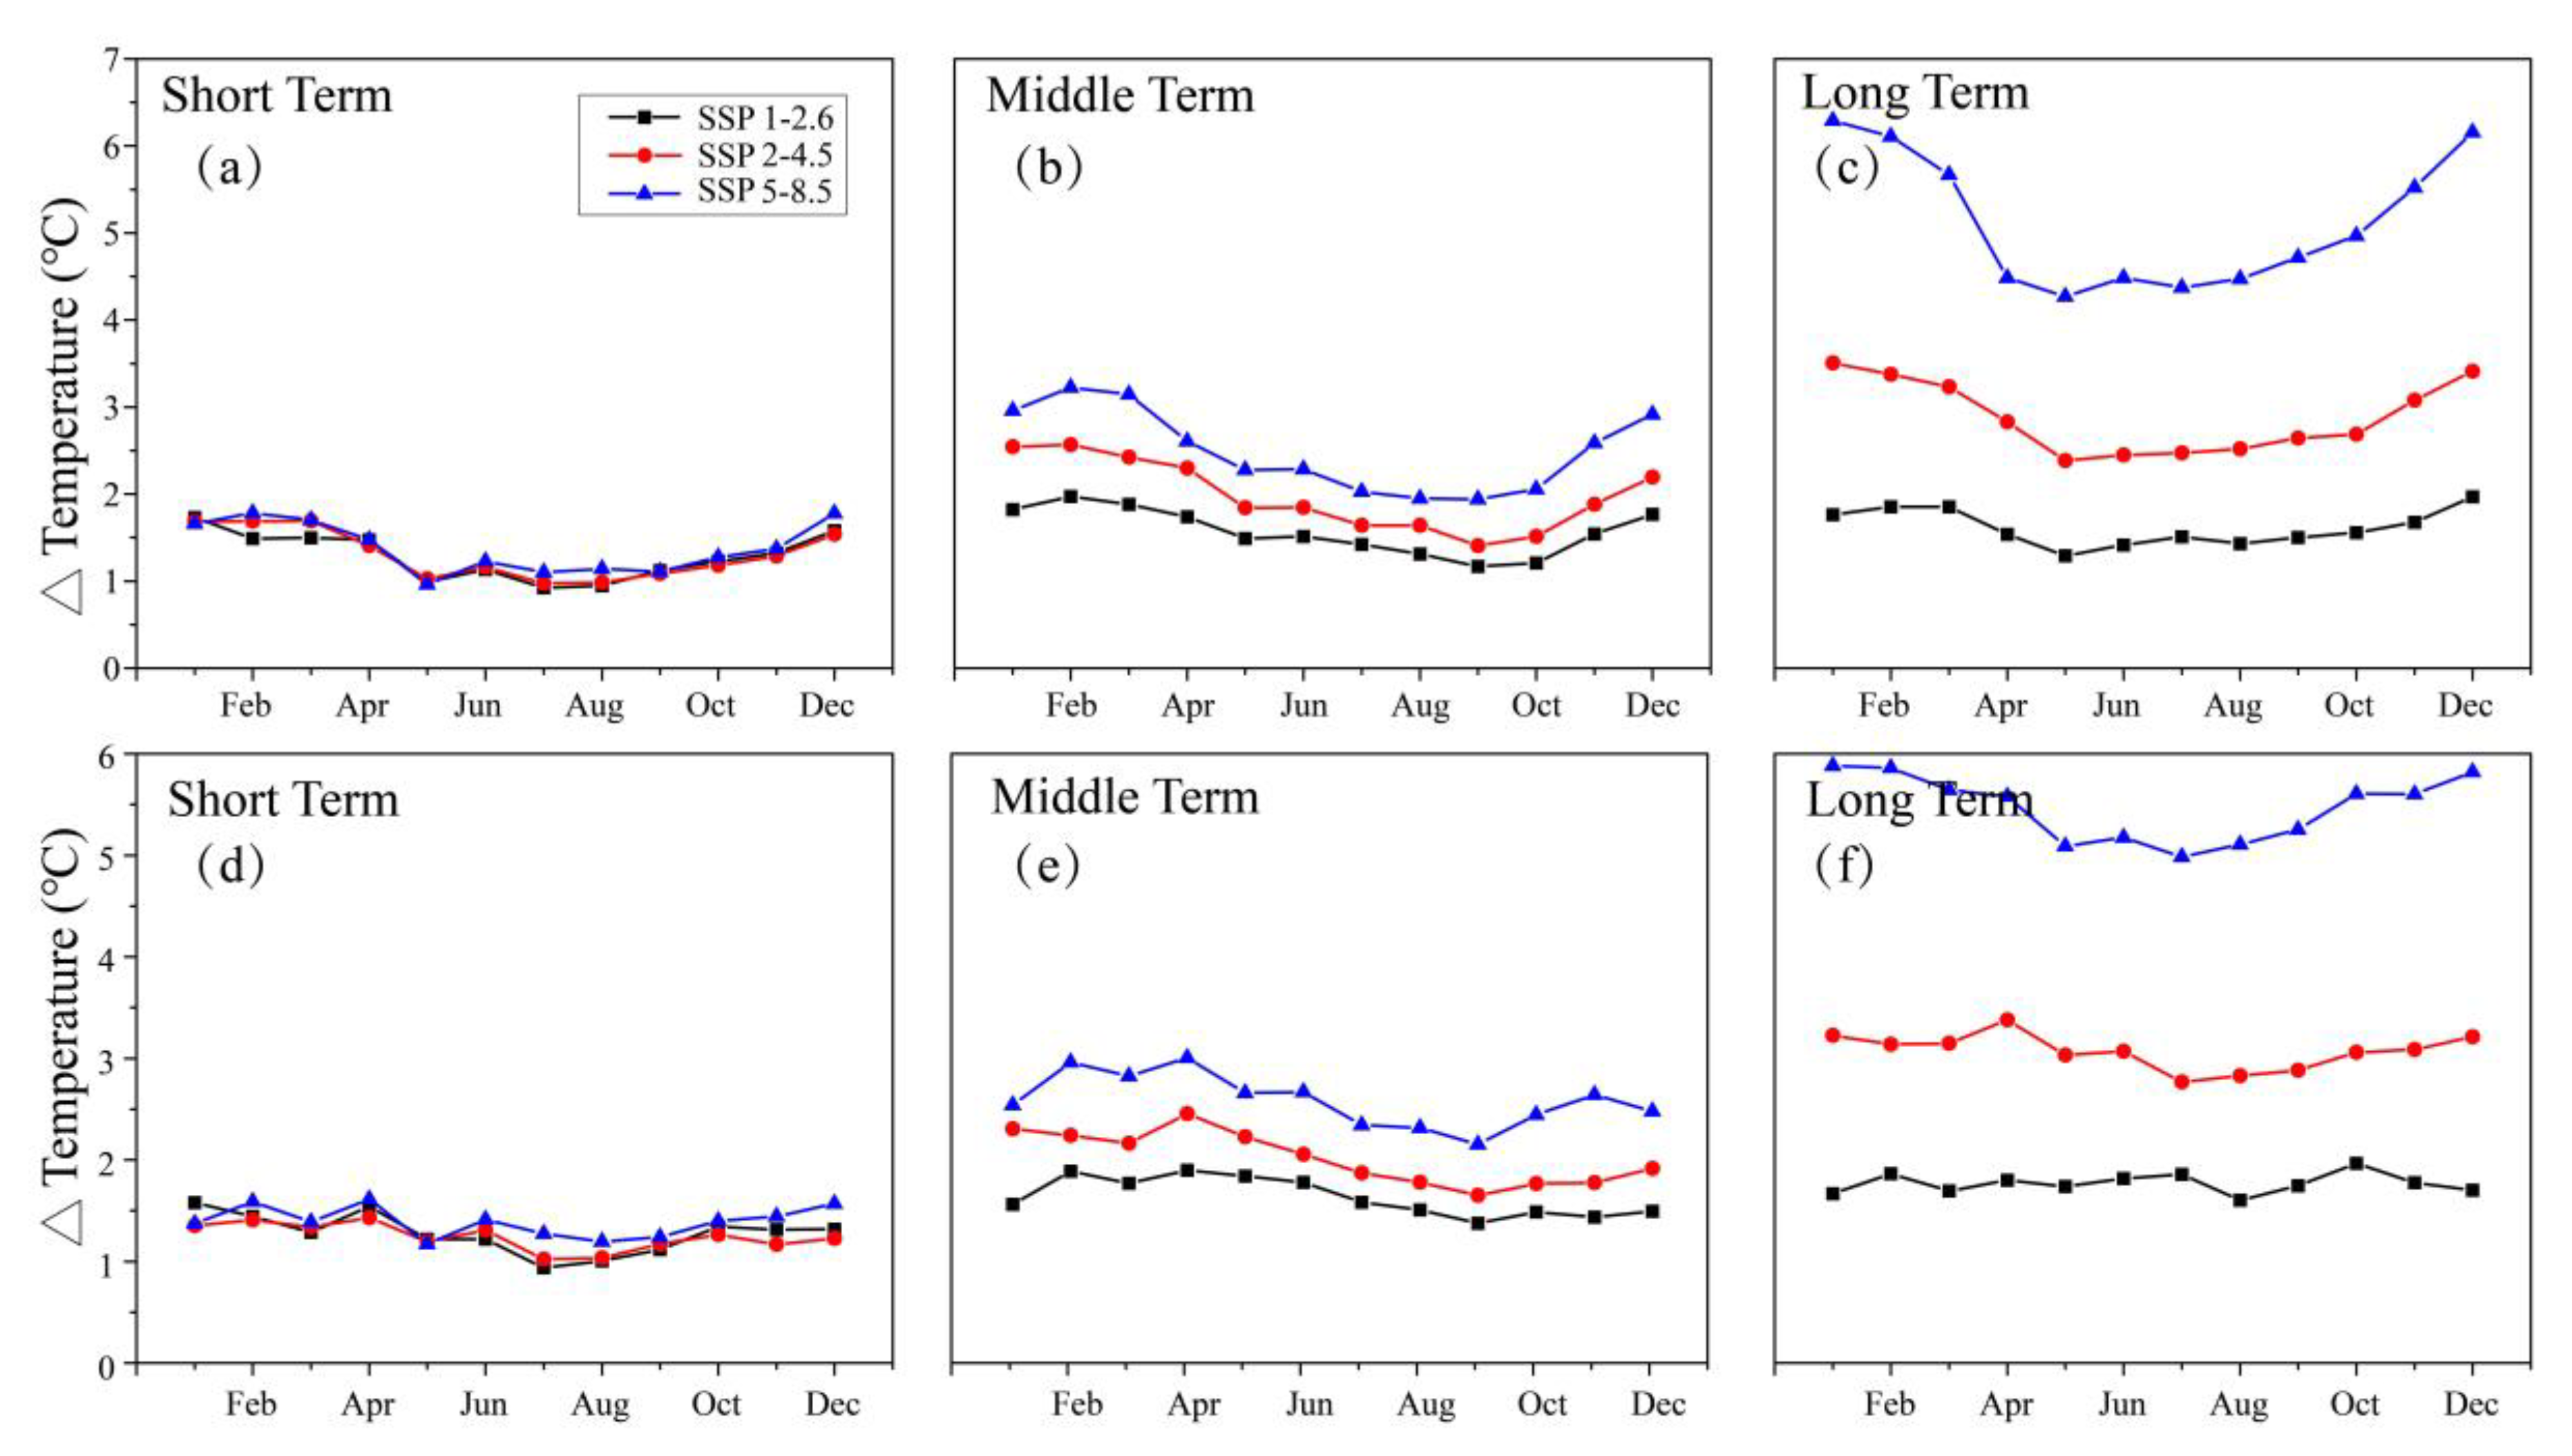
Figure 3 and Figure 4 present the seasonal patterns of the basin-averaged precipitation and temperature changes, respectively, and the time series was divided into three periods: the short-term (2020–2040), the middle-term (2040–2060) and the long-term (2080–2100). Great periodical changes among seasons were observed in both precipitation and temperature. In all scenarios and periods, precipitation was projected to increase during the monsoon season (June to September) to varying degrees, ranging from a minimum of 0–10 percent at SSP 1-2.6 to a maximum of 20–40 percent at SSP 5-8.5. In the short term, the average precipitation changes were below 5% for all in the monsoon season, while the average increasing percentage was 9%, 12%, and 27% in the long term. In the dry season (October to May), there was a moderate increase in precipitation of about 0–20%, but a special reduction was observed in all scenarios and periods in February and December.
The temperature was projected to increase in all seasons and the largest increase appeared in winter and spring (Figure 4). The maximum and minimum temperatures were likely to increase under 2 °C in the short period, and to jump to under 3 °C in the middle period. The greater warming trend and discrepancy among the scenarios were displayed in the long term with temperature differences from 0 to 7 °C. As Figure 3 and Figure 4 combined indicate more precipitation and more warming-related events were more likely to take place in the long term than middle or short terms, as well as more variation and uncertainties existed after 2080.

3.3. Performance of VIC–Glacier Model

A well-established VIC–Glacier framework was adopted in this study [24,40]. The glacier distribution was split into dozens of elevation bands in 100 m intervals, off-line coupled with the 0.25° × 0.25° VIC model. To warm up the model and achieve proper parameters, the simulated period was set in 1979. The periods of 1981–2007 and 2008–2014 were used to calibrate and validate the model, respectively.
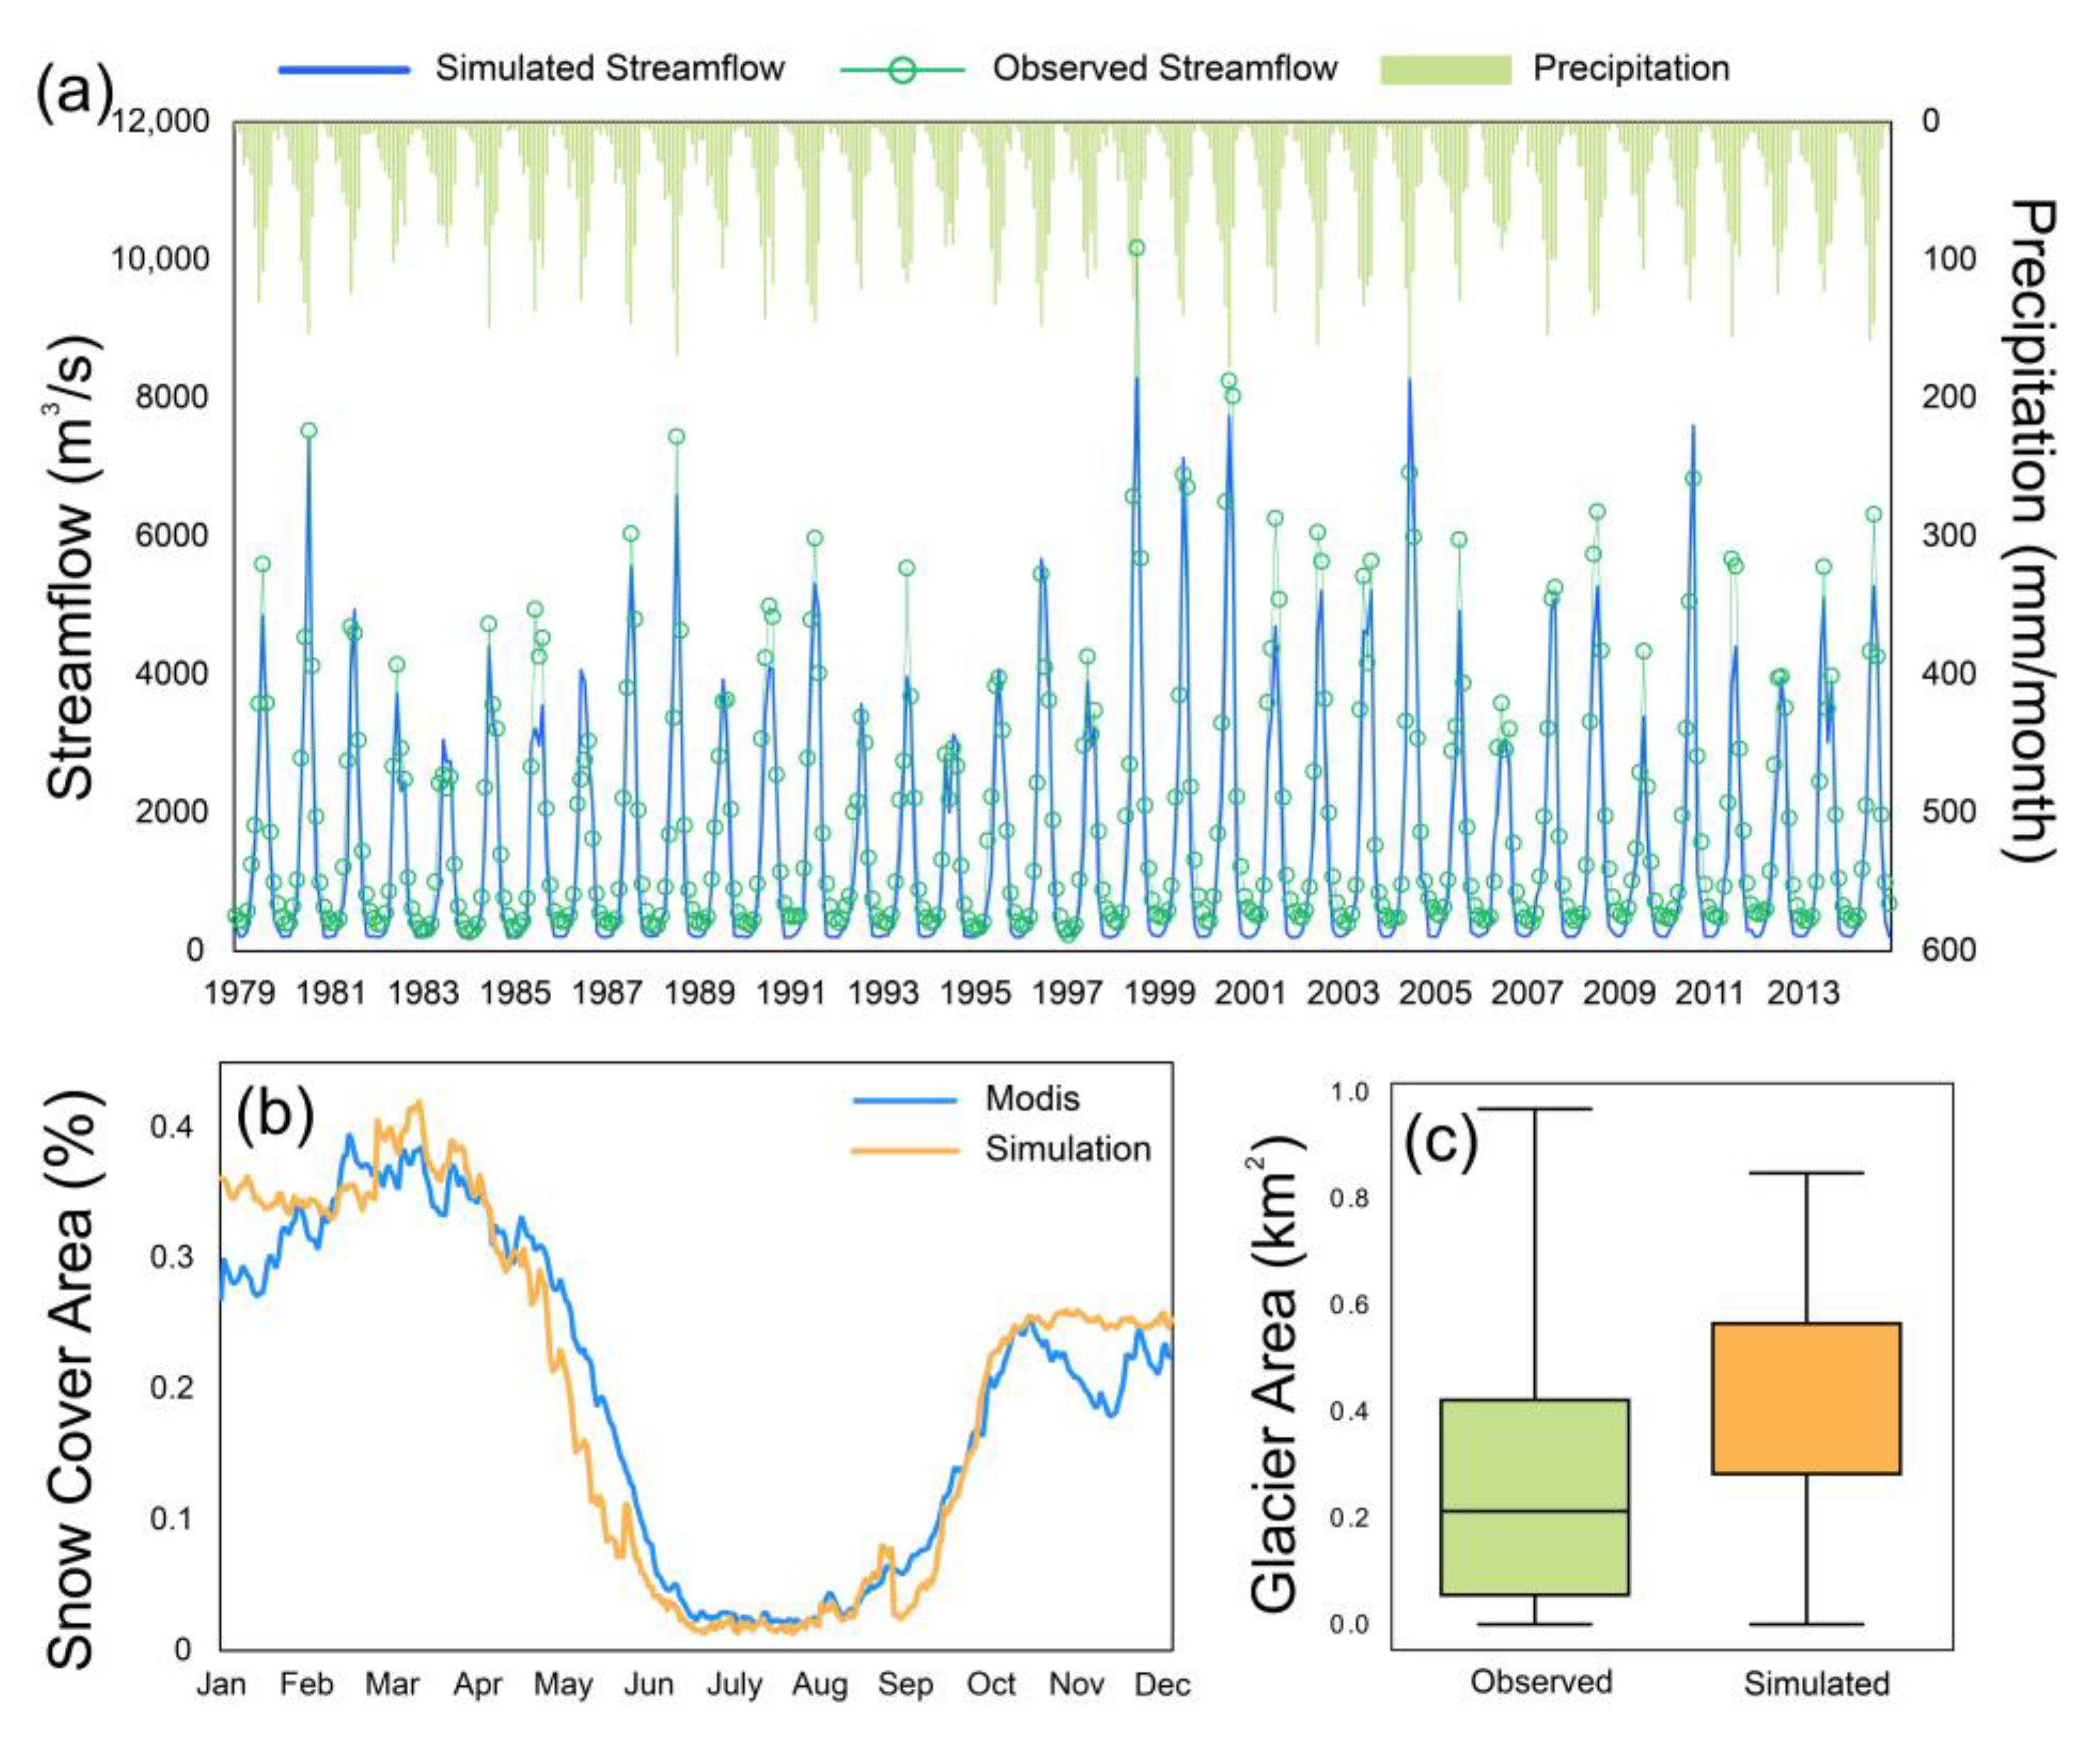
The model successfully reconstructed the streamflow with NSE above 0.85 and RE of −10.8%. Comparisons of the simulated and observed streamflow in calibration and validation are shown in Figure 5a. The results were consistent with the interannual variability of precipitation enhancing the model’s robustness for future projection. When reconstructing the multi-year average snow cover area, a reasonable result was achieved in summer (June to August), and an overestimation for both winter and spring was detected in Figure 5b, compared with the MODIS. Considering that the glaciers covering the basin are mostly small in size and primarily occupied by small glaciers, the area of less than 1 km2 was chosen to simulate the glacier inventory. The corresponding glaciers in two different glacier inventories, compiled in different periods, were designated to act as the calibration dataset, and the SCGI was regarded presumably as the ‘observed data’, due to its high accuracy [52]. The simulated data did not coincide completely with the observed data but showed a certain overestimation, as seen in Figure 5c.

3.4. Hydrological Response to Climate Changes

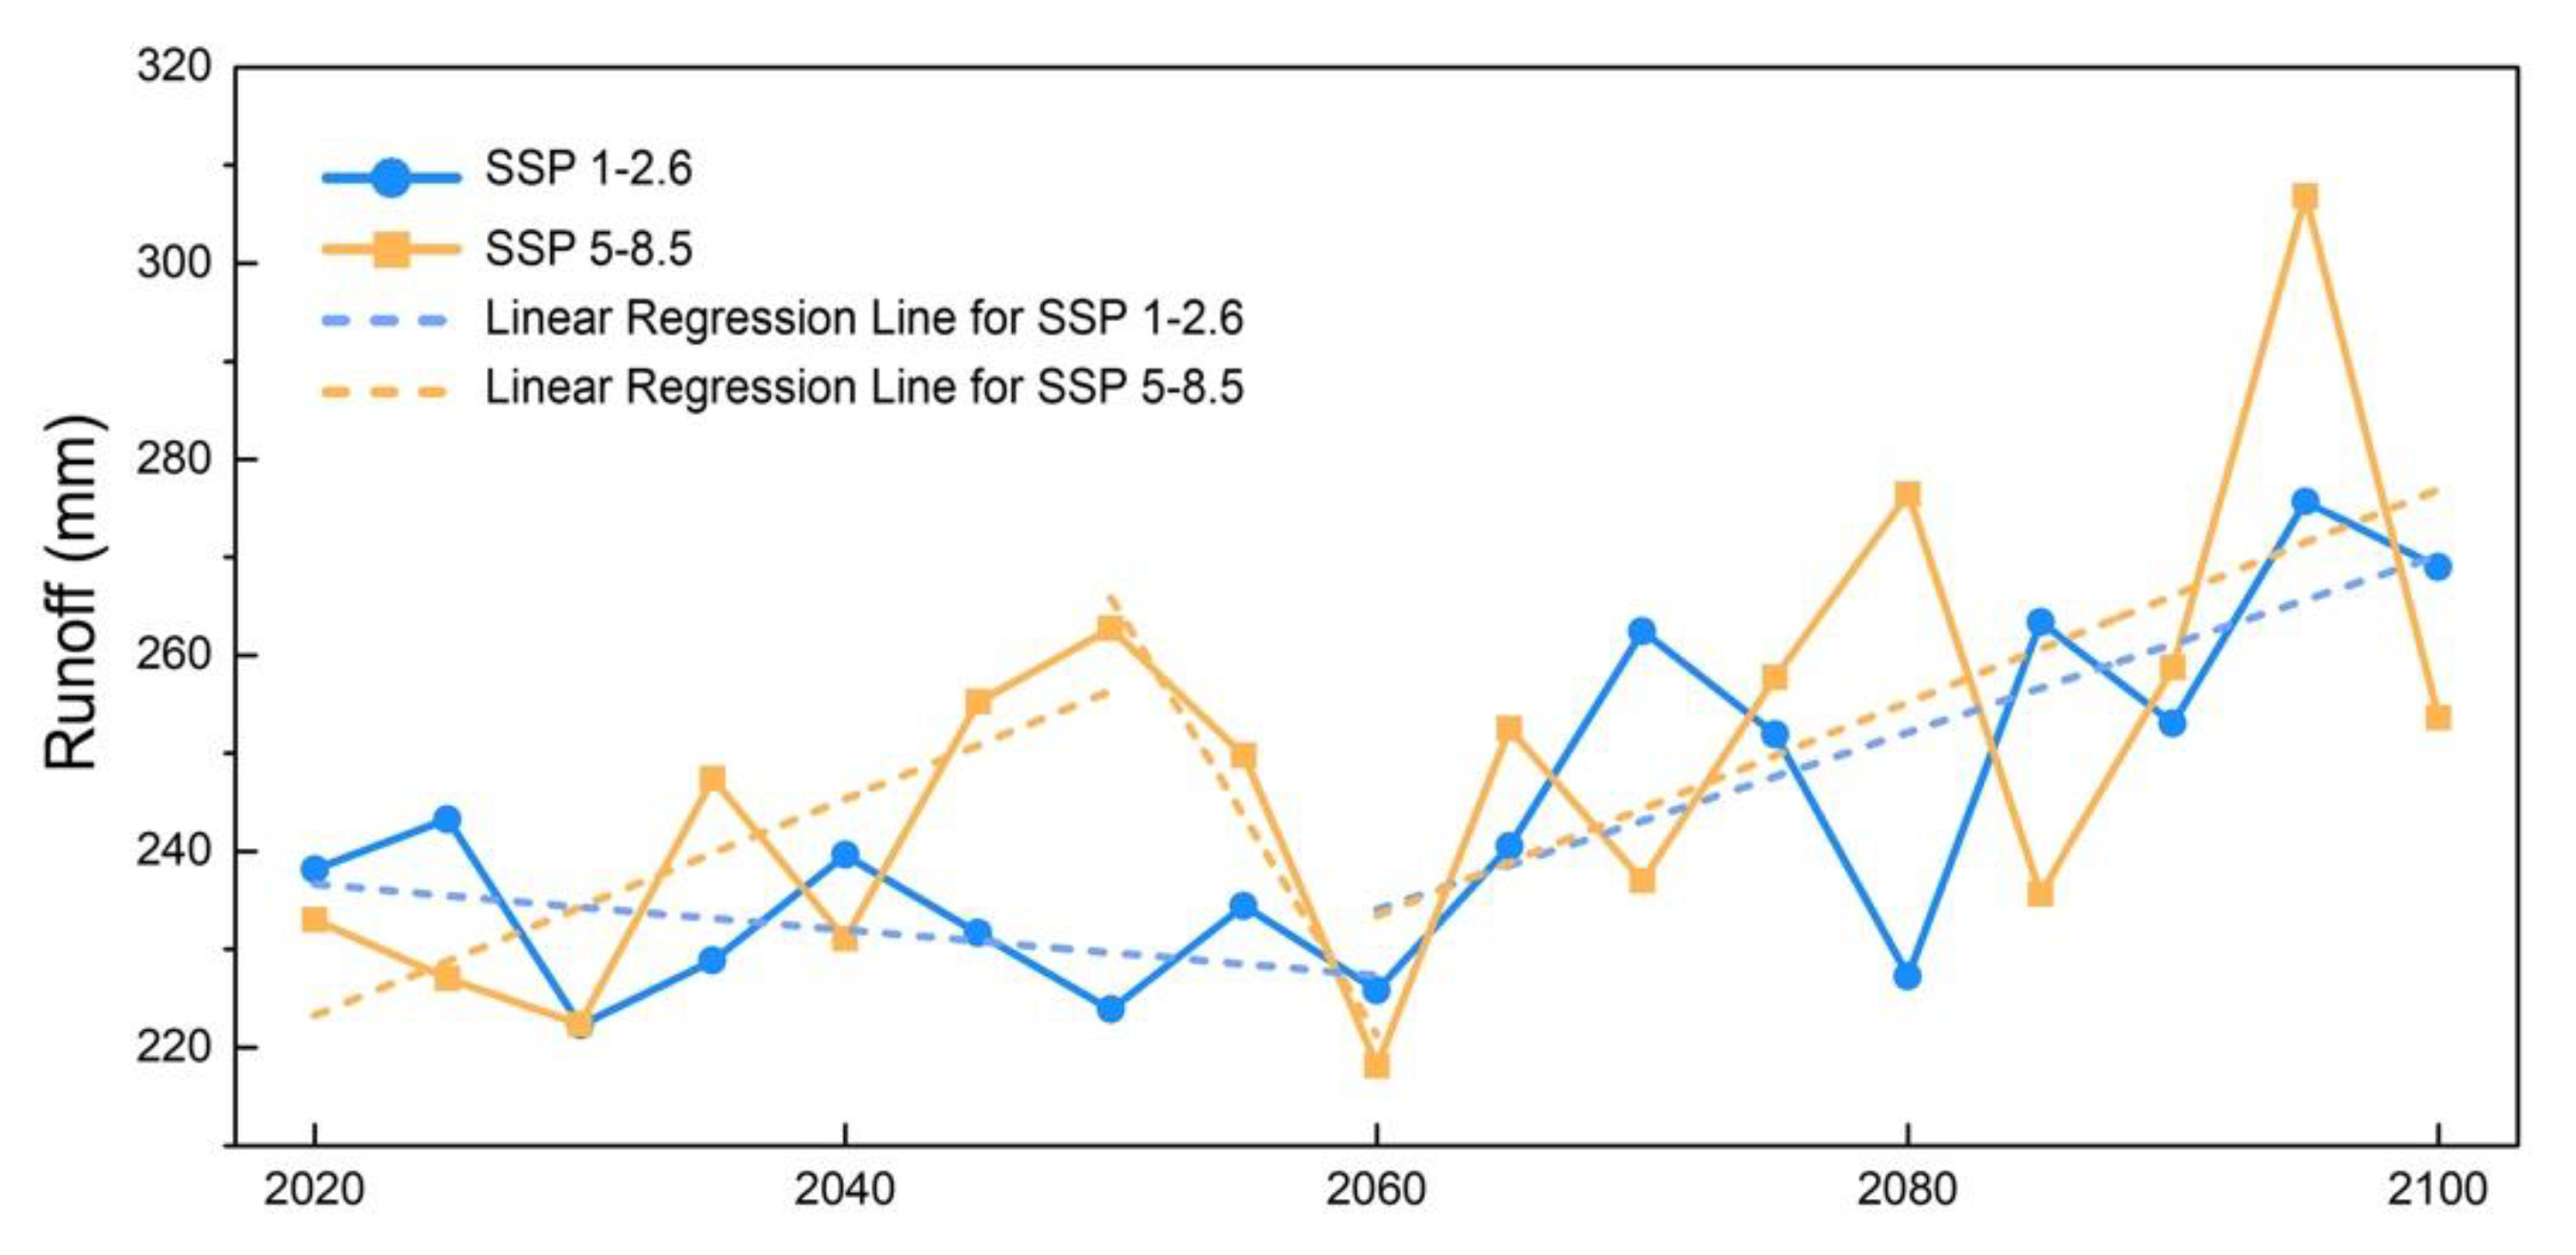
To be better prepared for future climate change, we simulated the future runoff under two different extreme scenarios. Figure 6 compares the amount of total runoff converged at Nuxia under two different scenarios over a period of 80 years. It was clear that there existed an increasing trend after 2060 in both scenarios. Before that point, a negligible decreasing trend was detected under SSP 1-2.6. However, a contrasting trend was found under SSP 5-8.5, which showed an increasing trend before 2050 and a decreasing trend from 2050 to 2060. Between 2090 and 2100, the runoff skyrocketed dramatically to a peak of above 300 mm under SSP 5-8.5. The seasonal cycle changed at the end of the century for runoff components under two extreme scenarios, as shown in Figure 7. The annual hydrograph remained practically unchanged and stable, where large positive runoff changes generally occurred during the monsoon season (June to September), during which the snow runoff showed a negative change, probably as a result of the warming climate and more precipitation falling in the form of rain. Positive snowmelt runoff was observed in the spring months in the basin by the end of the century, indicating that the advance of spring snowmelt may happen in the future over the YZRB. Under the extreme scenario of SSP 5-8.5, the precipitation runoff saw an increase in the monsoon season (June to September) of 26%, 21%, 25%, and 26%, respectively, with an average of 25%, and in the case of SSP 1-2.6 increases of 15%, 12%, 10%, and 15%, respectively, with an average of 13%, were observed. Large positive total runoff changes were generally projected during the dry season (January to March and November to December), and the increasing rate of the monsoon season was clearly less than that of the annual and dry seasons. The differences in streamflow change in the monsoon and dry seasons were mostly related to the degradation of permafrost soil, which resulted in increased infiltration during the monsoon season and greater water release during the dry season. By the end of this century, the contribution of glacier runoff to total runoff will be negligible, due to the irreversible shrinkage of glaciers.

4. Discussion

4.1. Uncertainty Analysis of CMIP6

In the projection and analysis of future climate change, the primary uncertainty arises from the model itself, combined with hydrometeorological forcing, specifically referring to CMIP6 and VIC–Glacier in our study. The uncertainty in CMIP6 could also be propagated and expanded in the hydrological frame due to the nonlinearity character of the model behavior [72]. The uncertainty in CMIP6 itself acts as a non-negligible factor for the analysis.
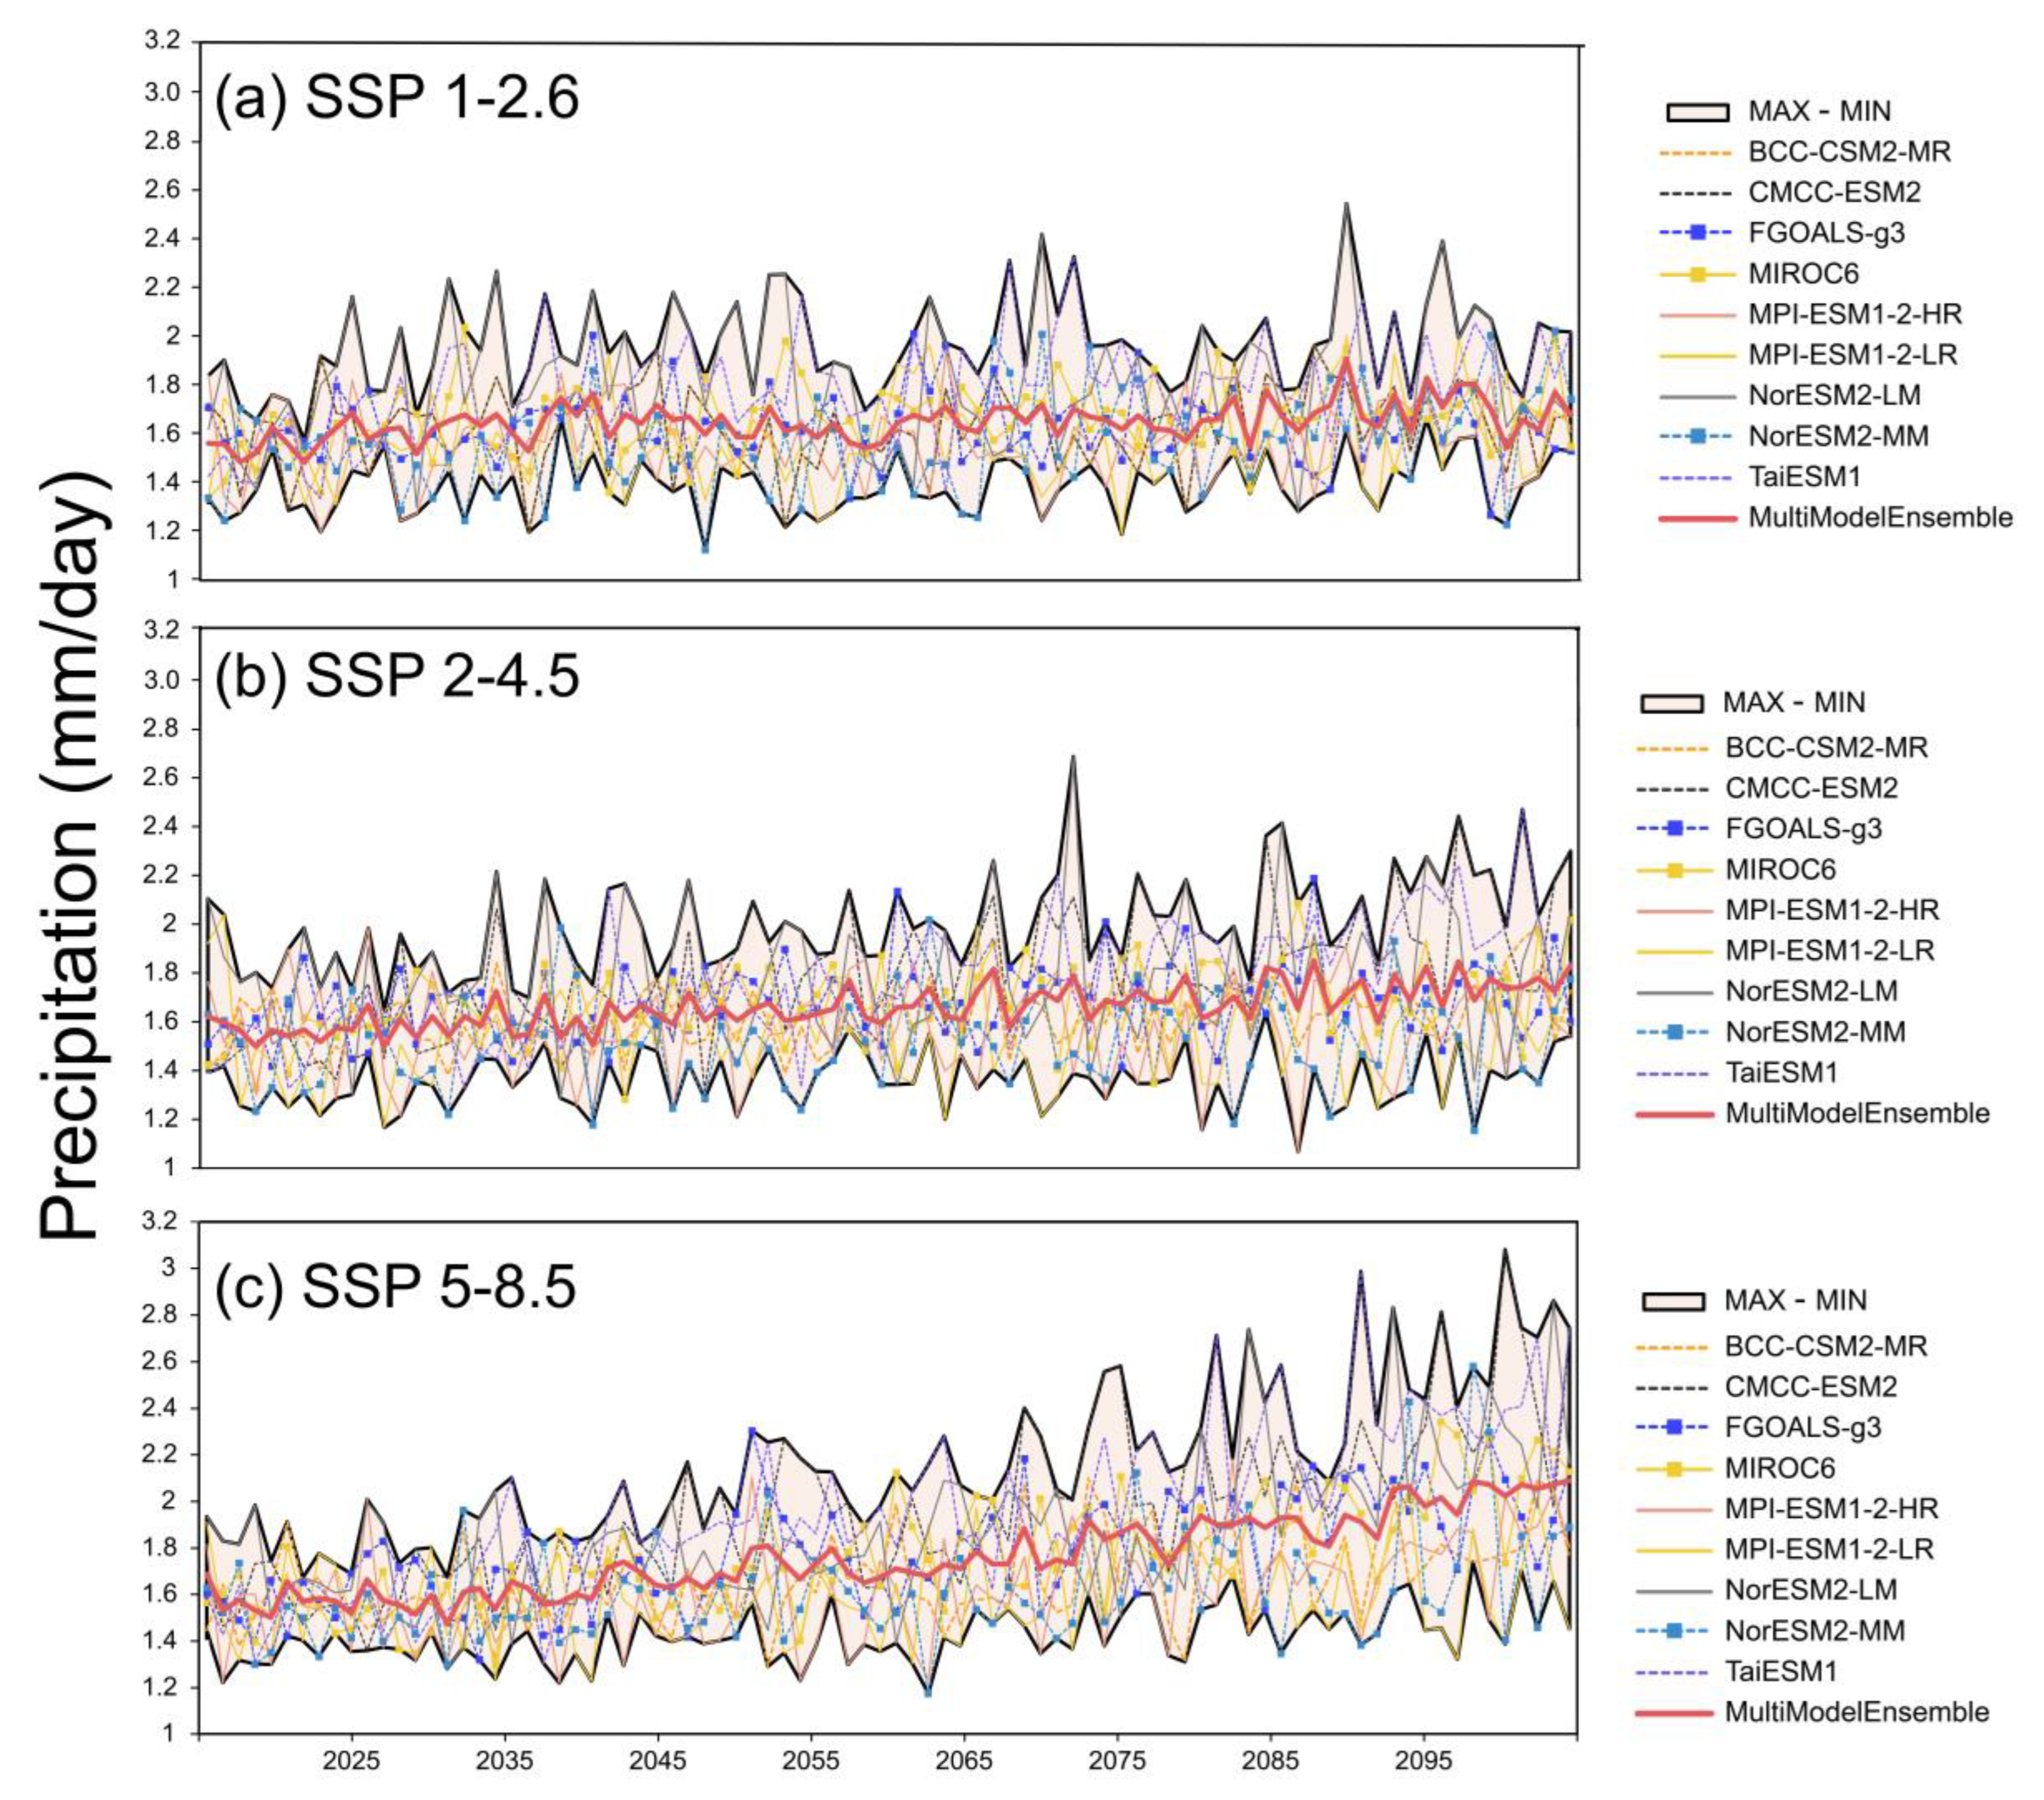
At present multi-model selection and ensemble analysis serves as the mainstream processing strategy for future projects [46,73,74]. Research about CMIP6 remains lacking in the YZRB, leaving broad uncertainty and unfulfilled demand for future analysis. According to relevant research [38], runoff demonstrates a decrease in 2045–2060 and an increase in 2086–2100. The single model-induced results appeared to be unconvincing due to sensitivity to precipitation [75]. In this study, we chose nine GCMs and three scenarios in the YZRB and processed them into annual average precipitation, as shown in Figure 8. It can be seen that although each model displayed an increasing trend in the long period, to varying degrees, the interannual fluctuation of each model varied greatly with large uncertainty. The average daily precipitation saw a larger change in SSP 5-8.5 than those of SSP 1-2.6 and SSP 2-4.5. The MME uncertainty under SSP 5-8.5 in the long term (2080~2100) exhibited fewer fluctuation scopes and was replaced by a steady increase. The precipitation in SSP 1-2.6 and SSP 2-4.5 indicated moderate fluctuation in the future and saw a smaller growth between 2020 and 2100 compared with SSP 5-8.5, during which a large jump in an adjacent year was possible, later compensated by a decrease. The uncertainty and fluctuation in precipitation were greatly alleviated after MME with the line situated in the middle. In this work, the future runoff was expected to increase before 2050 and after 2060, and decrease between 2050 and 2060, under SSP 5-8.5, while the decreasing trend was negligible under SSP 1-2.6 from 2020 to 2060, contrasting with the increasing trend after 2060, and some of the results were consistent with former research.

4.2. Uncertainties in the VIC–Glacier Model

The regional characteristics, like complex terrain and variable precipitation types, in alpine mountains exerted fundamental effects on the results the model simulated. As the research illustrates, the YZRB, as an exoreic basin in TP, dominated by the Indian monsoon, was mainly affected by precipitation [76], thereby stressing the emphasis of its type portrait in the algorithm. The precipitation in alpine areas falls into two categories, i.e., solid and liquid, and the parameterization methods based on critical temperature/dew are widely applied [77] in the process-based simulation. The two-temperature method was also adopted in our VIC–Glacier model, similar to HBV and DWHC [78,79]. Due to the lack of systematic observations and statistical analysis of critical temperatures in the alpine regions, researchers tend to adjust temperature thresholds according to local conditions. In our study, the GA was adopted to calibrate the two temperatures in the model against the snow cover derived from the MODIS. Our results indicated that the threshold of 5.6/0.1 could result in a reasonable simulation in a multi-year simulation, which coincides with the distinct condition that the temperature threshold exceeds 5.6 °C in Tibet [77]. A more complicated method was also adopted in our study [80], while a smaller NSE of snow (<0.5) meant less applicability in the YZRB compared with the two-temperature method, indicating the broad applicability of the two-temperature method in the alpine area.
Current understanding and capacity to predict the consequences of potential climate change are still insufficient and the demand for understanding and predictability is likely to rise, due to surged risks of extreme events, like floods and droughts. The simulated results from our calibrated process-based model may inform policy-makers of the required critical information on regional hydrological responses to implement, for example, China’s pledge of carbon neutrality by 2060, and to safeguard the sustainability of the Tibetan Plateau’s ecosystems. An improved understanding of water resources from various sources, as well as the effects of projected impacts of climate are prerequisites for such policy.
In fact, in the calibration of glaciers there still exist uncertainties which need to be tackled in the future. Lack of direct observation of glaciers, resulted in the scheme adopted in [36]. Compiling the interval between two glacier datasets is too short, and we cannot rule out the possible error caused by the simple glacier area change method, lacking an inner mechanism in simulating interannual variability. Thus, a more complicated method combined with a more multi-source dataset to calibrate glacier parameters is required in the future.

5. Conclusions

In this work, we coupled a glacier module and glacier evolution, namely, the Volume–Area scaling approach scheme was combined with the VIC model, to comprehend the impacts of climate on the YZRB. A combination of an ensemble of the latest CMIP6 and a well-calibrated model aimed to reduce the uncertainties in the projection process. The following major conclusions were drawn:
The coupled VIC–Glacier model allows an accurate simulation of streamflow, snow cover area, and glacier area.
Precipitation is expected to increase by 0–10% in the short term (2020–2040) and 20–40% in the long term (2080–2100) relative to the reference period (1979–2014). Maximum and minimum temperature is generally projected to increase 0–2 °C and 1–7 °C in the short term and long term in different scenarios.
The interannual total runoff is expected to increase before 2050 and after 2060, and decrease between 2050 and 2060 under SSP 5-8.5, while the decreasing trend is negligible under SSP 1-2.6 from 2020 to 2060 contrasted by the increasing trend after 2060.
The annual hydrograph will remain practically unchanged in the YZRB by the end of the century, as the precipitation runoff increase compensates for the decrease of snow and glacier runoff. Increased snowmelt water was noticed in spring.

Author Contributions

Conceptualization, H.J. and D.P.; methodology, H.J. and D.P.; software, H.J. and Y.G.; validation, H.J. and X.L.; investigation, H.J., resources, D.P.; writing—original draft preparation, H.J.; writing—review and editing, H.J. and D.P.; visualization, H.J.; supervision, D.P., B.P. and Z.Z.; project administration, D.P. All authors have read and agreed to the published version of the manuscript.

Funding

This work was supported by the National Natural Science Foundation of China (51779006) and the National Key Research and Development Program of China (2017YFC1502706).

Data Availability Statement

China Meteorological Forcing Dataset is openly available via http://data.tpdc.ac.cn (accessed on 30 October 2022), GCMs is available via https://esgf-node.llnl.gov/search/cmip6/ (accessed on 30 October 2022), MODIS snow cover data is available via http://www.ncdc.ac.cn/ (accessed on 30 October 2022), the Glacier datasets are available via http://data.tpdc.ac.cn/ (accessed on 30 October 2022), the gauged observation is not available currently.

Conflicts of Interest

The authors declare no conflict of interest.

References

  1. Alexandrov, V.A.; Hoogenboom, G. The impact of climate variability and change on crop yield in Bulgaria. Agric Meteorol. 2000, 104, 315–327. [Google Scholar] [CrossRef]
  2. Doll, P. Impact of climate change and variability on irrigation requirements: A global perspective. Clim. Chang. 2002, 54, 269–293. [Google Scholar] [CrossRef]
  3. Mori, A.S. Advancing nature-based approaches to address the biodiversity and climate emergency. Ecol. Lett. 2020, 23, 1729–1732. [Google Scholar] [CrossRef] [PubMed]
  4. Lan, C.; Zhang, Y.; Zhu, F.; Liang, L. Characteristics and changes of streamflow on the Tibetan Plateau: A review. J. Hydrol. Reg. Stud. 2014, 2, 49–68. [Google Scholar] [CrossRef] [Green Version]
  5. Bhatti, A.M.; Koike, T.; Shrestha, M. Climate change impact assessment on mountain snow hydrology by water and energy budget-based distributed hydrological model. J. Hydrol. 2016, 543, 523–541. [Google Scholar] [CrossRef]
  6. Kraaijenbrink, P.D.A.; Bierkens, M.F.P.; Lutz, A.F.; Immerzeel, W.W. Impact of a global temperature rise of 1.5 degrees Celsius on Asia’s glaciers. Nature 2017, 549, 257–260. [Google Scholar] [CrossRef]
  7. Zhong, R.; He, Y.; Chen, X. Responses of the hydrological regime to variations in meteorological factors under climate change of the Tibetan plateau. Atmos. Res. 2018, 214, 296–310. [Google Scholar] [CrossRef]
  8. Zhao, K.; Peng, D.; Gu, Y.; Luo, X.; Pang, B.; Zhu, F. Temperature lapse rate estimation and snowmelt runoff simulation in a high-altitude basin. Sci. Rep. 2022, 12, 13638. [Google Scholar] [CrossRef] [PubMed]
  9. Thompason, L.G.; Yao, T.; Mosley-Thompson, E.; Davis, M.E.; Henderson, K.A.; Lin, P. A high-resolution millennial record of the south asian monsoon from himalayan ice cores. Science 2000, 289, 1916–1919. [Google Scholar] [CrossRef] [Green Version]
  10. Yao, T.; Liu, X.; Wang, N.; Shi, Y. Amplitude of climate changes in Qinghai-Tibetan Plateau. Chin. Sci. Bull. 2000, 45, 1236. [Google Scholar] [CrossRef]
  11. Frauenfeld, O.W. Climate change and variability using European Centre for Medium-Range Weather Forecasts reanalysis (ERA-40) temperatures on the Tibetan Plateau. J. Geophys. Res. 2005, 110. [Google Scholar] [CrossRef]
  12. Wang, B.; Bao, Q.; Hoskins, B.; Wu, G.; Liu, Y. Tibetan Plateau warming and precipitation changes in East Asia. Geophys. Res. Lett. 2008, 35, 1–5. [Google Scholar] [CrossRef] [Green Version]
  13. Xu, Z.X.; Gong, T.L.; Li, J.Y. Decadal trend of climate in the Tibetan Plateau—Regional temperature and precipitation. Hydrol. Process. 2008, 22, 3056–3065. [Google Scholar] [CrossRef]
  14. Yang, K.; Ye, B.; Zhou, D.; Wu, B.; Thomas, F.; Qin, J.; Zhou, Z. Response of hydrological cycle to recent climate changes in the Tibetan Plateau. Clim. Chang. 2011, 109, 517–534. [Google Scholar] [CrossRef]
  15. Li, X.; Cheng, G.; Jin, H.; Kang, E.; Che, T.; Jin, R.; Wu, L.; Nan, Z.; Wang, J.; Shen, Y. Cryospheric change in China. Glob Planet Chang. 2008, 62, 210–218. [Google Scholar] [CrossRef]
  16. Ye, B.; Yang, D.; Zhang, Z.; Kane, D. Variation of hydrological regime with permafrost coverage over Lena Basin in Siberia. J. Geophys. Res. 2009, 114. [Google Scholar] [CrossRef] [Green Version]
  17. Niu, L.; Ye, B.; Li, J.; Yu, S. Effect of permafrost degradation on hydrological processes in typical basins with various permafrost coverage in Western China. Sci. China Earth Sci. 2010, 54, 615–624. [Google Scholar] [CrossRef]
  18. Guo, D.; Wang, H.; Li, D. A projection of permafrost degradation on the Tibetan Plateau during the 21st century. J. Geophys. Res. Atmos. 2012, 117. [Google Scholar] [CrossRef]
  19. Yang, B.; Tang, L.; Bräuning, A.; Davis, M.; Shao, J.; Liu, J. Summer temperature reconstruction on the central Tibetan Plateau during 1860–2002 derived from annually resolved ice core pollen. J. Geophys. Res. 2008, 113, 1–9. [Google Scholar] [CrossRef]
  20. Ji, H.; Peng, D.; Gu, Y.; Liang, Y.; Luo, X. Evaluation of multiple satellite precipitation products and their potential utilities in the Yarlung Zangbo River Basin. Sci. Rep. 2022, 12, 13334. [Google Scholar] [CrossRef]
  21. Zhao, K.; Peng, D.; Gu, Y.; Pang, B.; Zhu, Z. Daily precipitation dataset at 0.1° for the Yarlung Zangbo River basin from 2001 to 2015. Sci. Data 2022, 9, 349. [Google Scholar] [CrossRef] [PubMed]
  22. Immerzeel, W.W.; Droogers, P.; de Jong, S.; Bierkens, M.F. Large-scale monitoring of snow cover and runoff simulation in Himalayan river basins using remote sensing. Remote Sens Environ. 2009, 113, 40–49. [Google Scholar] [CrossRef]
  23. Immerzeel, W.W.; Pellicciotti, F.; Bierkens, M.F.P. Rising river flows throughout the twenty-first century in two Himalayan glacierized watersheds. Nat. Geosci. 2013, 6, 742–745. [Google Scholar] [CrossRef]
  24. Zhang, L.; Su, F.; Yang, D.; Hao, Z.; Tong, K. Discharge regime and simulation for the upstream of major rivers over Tibetan Plateau. J. Geophys. Res. Atmos. 2013, 118, 8500–8518. [Google Scholar] [CrossRef]
  25. Gao, Q.; Guo, Y.; Xu, H.; Hasbagen, G.; Li, Y.; Wan, Y.; Qin, X.; Ma, X.; Liu, S. Climate change and its impacts on vegetation distribution and net primary productivity of the alpine ecosystem in the Qinghai-Tibetan Plateau. Sci. Total Environ. 2016, 554–555, 34–41. [Google Scholar] [CrossRef]
  26. Bolch, T.; Kulkarni, A.; Kaab, A.; Huggel, C.; Paul, F.; Cogley, J.G.; Frey, H.; Kargel, J.S.; Fujita, K.; Scheel, M. The state and fate of Himalayan glaciers. Science 2012, 336, 310–314. [Google Scholar] [CrossRef] [Green Version]
  27. Yao, T.; Thompson, L.; Yang, W.; Yu, W.; Gao, Y.; Guo, X.; Yang, X.; Duan, K.; Zhao, H.; Xu, B.; et al. Different glacier status with atmospheric circulations in Tibetan Plateau and surroundings. Nat. Clim. Chang. 2012, 2, 663–667. [Google Scholar] [CrossRef]
  28. Lutz, A.F.; Immerzeel, W.; Shrestha, A.; Bierkens, M.F. Consistent increase in High Asia’s runoff due to increasing glacier melt and precipitation. Nat. Clim. Chang. 2014, 4, 587–592. [Google Scholar] [CrossRef] [Green Version]
  29. Yang, Z.; Zhuo, M.; Lu, H.; Dava, C.; Ma, P.; Zhou, K. Characteristics of precipitation variation and its effects on runoff in the Yarlung Zangbo River basin during 1961–2010. J. Glaciol. Geocryol. 2014, 36, 166–172. [Google Scholar]
  30. Su, B.; Huang, J.; Gemmer, M.; Jian, D.; Tao, H.; Jiang, T.; Zhao, C. Statistical downscaling of CMIP5 multi-model ensemble for projected changes of climate in the Indus River Basin. Atmos Res. 2016, 178–179, 138–149. [Google Scholar] [CrossRef]
  31. Zhang, Y.; You, Q.; Chen, C.; Ge, J. Impacts of climate change on streamflows under RCP scenarios: A case study in Xin River Basin, China. Atmos Res. 2016, 178–179, 521–534. [Google Scholar] [CrossRef]
  32. Wang, Z.; Zhong, R.; Lai, C.; Zeng, Z.; Lian, Y.; Bai, X. Climate change enhances the severity and variability of drought in the Pearl River Basin in South China in the 21st century. Agric Meteorol. 2018, 249, 149–162. [Google Scholar] [CrossRef]
  33. He, S.; Yang, J.; He, S.; Bao, Q.; Wang, L.; Wang, B. Fidelity of the Observational/Reanalysis Datasets and Global Climate Models in Representation of Extreme Precipitation in East China. J. Clim. 2019, 32, 195–212. [Google Scholar] [CrossRef]
  34. Cherkauer, K.A.; Lettenmaier, D.P. Hydrologic effects of frozen soils in the upper Mississippi River basin. J. Geophys. Res. Atmos. 1999, 104, 19599–19610. [Google Scholar] [CrossRef]
  35. Li, Z.; Feng, Q.; Wei, L.; Wang, T.; Cheng, A.; Gao, Y.; Guo, X.; Pan, Y.; Li, J.; Guo, R.; et al. Study on the contribution of cryosphere to runoff in the cold alpine basin: A case study of Hulugou River Basin in the Qilian Mountains. Glob. Planet Chang. 2014, 122, 345–361. [Google Scholar] [CrossRef]
  36. Cuo, L.; Zhang, Y.; Bohn, T.; Zhao, L.; Li, J.; Liu, Q.; Zhou, B. Frozen soil degradation and its effects on surface hydrology in the northern Tibetan Plateau. J. Geophys. Res. Atmos. 2015, 120, 8276–8298. [Google Scholar] [CrossRef] [Green Version]
  37. Zhao, Q.; Ding, Y.; Wang, J.; Gao, H.; Zhang, S.; Zhao, C.; Xu, J.; Han, H.; Shangguan, D. Projecting climate change impacts on hydrological processes on the Tibetan Plateau with model calibration against the glacier inventory data and observed streamflow. J. Hydrol. 2019, 573, 60–81. [Google Scholar] [CrossRef]
  38. Liu, X.; Xu, Z.; Liu, W.; Liu, L. Responses of hydrological processes to climate change in the Yarlung Zangbo River basin. Hydrol. Sci. J. 2019, 64, 2057–2067. [Google Scholar] [CrossRef]
  39. Immerzeel, W.W.; van Beek, L.; Bierkens, M.F. Climate change will affect the Asian water towers. Science 2010, 328, 1382–1385. [Google Scholar] [CrossRef]
  40. Su, F.; Zhang, L.; Ou, T.; Chen, D.; Yao, T.; Tong, K.; Qi, Y. Hydrological response to future climate changes for the major upstream river basins in the Tibetan Plateau. Glob. Planet Chang. 2016, 136, 82–95. [Google Scholar] [CrossRef]
  41. Qiu, L.; You, J.; Qiao, F.; Peng, D. Simulation of snowmelt runoff in ungauged basin based on MODIS: A case study in Lhasa River basin. Stoch. Environ. Res. Risk Assess. 2014, 28, 1577–1585. [Google Scholar] [CrossRef]
  42. Peng, D.; Chen, J.; Fang, J. Simulation of summer hourly stream flow by applying TOPMODEL and two routing algorithms to the sparsely gauged Lhasa River basin in China. Water 2015, 7, 4041–4053. [Google Scholar] [CrossRef] [Green Version]
  43. Su, F.; Duan, X.; Chen, D.; Hao, Z.; Lan, C. Evaluation of the Global Climate Models in the CMIP5 over the Tibetan Plateau. J. Clim. 2013, 26, 3187–3208. [Google Scholar] [CrossRef] [Green Version]
  44. Qin, H.; Dabang, J.; Guangzhou, F. Evaluation of CMIP5 models over the Qinghai-Tibietan Plateau. Chin. J. Atmos. Sci. 2014, 38, 924–938. [Google Scholar]
  45. You, Q.; Min, J.; Kang, S. Rapid warming in the Tibetan Plateau from observations and CMIP5 models in recent decades. Int. J. Climatol. 2016, 36, 2660–2670. [Google Scholar] [CrossRef] [Green Version]
  46. Kim, Y.-H.; Min, S.-K.; Zhang, X.; Jana, S.; Marit, S. Evaluation of the CMIP6 multi-model ensemble for climate extreme indices. Weather. Clim. Extrem. 2020, 29. [Google Scholar] [CrossRef]
  47. Wang, Y.; Wang, L.; Zhou, J.; Yao, T.; Yang, W.; Zhong, X.; Liu, R.; Hu, Z.; Luo, L.; Ye, Q.; et al. Vanishing Glaciers at Southeast Tibetan Plateau Have Not Offset the Declining Runoff at Yarlung Zangbo. Geophys. Res. Lett. 2021, 48, 1–12. [Google Scholar] [CrossRef]
  48. He, J.; Yang, K.; Tang, W.; Lu, H.; Qin, J.; Chen, Y.; Li, X. The first high-resolution meteorological forcing dataset for land process studies over China. Sci. Data. 2020, 7, 25–35. [Google Scholar] [CrossRef] [Green Version]
  49. Wu, Y.; Guo, L.; Zheng, H.; Zhang, B.; Li, M. Hydroclimate assessment of gridded precipitation products for the Tibetan Plateau. Sci Total Environ. 2019, 660, 1555–1564. [Google Scholar] [CrossRef]
  50. Eyring, V.; Bony, S.; Meehl, G.; Senior, C.; Stevens, B.; Stouffer, R.; Taylor, K. Overview of the Coupled Model Intercomparison Project Phase 6 (CMIP6) experimental design and organization. Geosci Model Dev. 2016, 9, 1937–1958. [Google Scholar] [CrossRef] [Green Version]
  51. Hao, X.; Huang, G.; Zheng, Z.; Sun, X.; Ji, W.; Zhao, H.; Wang, J.; Li, H.; Wang, X. Development and validation of a new MODIS snow-cover-extent product over China. Hydrol. Earth Syst Sci. 2002, 26, 1937–1952. [Google Scholar] [CrossRef]
  52. Wei, J.; Liu, S.; Guo, W.; Yao, X.; Xu, J.; Bao, W.; Jiang, Z. Surface-area changes of glaciers in the Tibetan Plateau interior area since the 1970s using recent Landsat images and historical maps. Ann. Glaciol. 2014, 55, 213–222. [Google Scholar] [CrossRef]
  53. Hansen, M.C.; Defries, R.; Townshend, J.; Sohlberg, R. Global land cover classification at 1 km spatial resolution using a classification tree approach. Int. J. Remote Sens. 2000, 21, 1331–1364. [Google Scholar] [CrossRef]
  54. Liang, X.; Wood, E.F.; Lettenmaier, D.P. Surface soil moisture parameterization of the VIC-2L model: Evaluation and modification. Glob. Planet Chang. 1996, 13, 195–206. [Google Scholar] [CrossRef]
  55. Lohmann, D.; Raschke, E.; Nijssen, B.; Lettenmaier, D.P. Regional scale hydrology: I. Formulation of the VIC-2L model coupled to a routing model. Hydrol. Sci. J. 2009, 43, 131–141. [Google Scholar] [CrossRef]
  56. Lohmann, D.; Nolte-Holube, R.; Raschke, E. A large-scale horizontal routing model to be coupled to land surface parametrization schemes. Tellus A Dyn. Meteorol. Oceanogr. 2016, 48, 708–721. [Google Scholar] [CrossRef]
  57. Maurer, E.P.; Hidalgo, H.G. Utility of daily vs. monthly large-scale climate data: An intercomparison of two statistical downscaling methods. Hydrol Earth Syst Sci. 2008, 12, 551–563. [Google Scholar] [CrossRef] [Green Version]
  58. Maurer, E.P.; Hidalgo, H.; Das, T.; Dettinger, M.; Cayan, D. The utility of daily large-scale climate data in the assessment of climate change impacts on daily streamflow in California. Hydrol Earth Syst Sci. 2010, 14, 1125–1138. [Google Scholar] [CrossRef] [Green Version]
  59. Dars, G.H.; Najafi, M.; Qureshi, A.L. Assessing the impacts of climate change on future precipitation trends based on downscaled CMIP5 simulation data. Mehran Univ. Res. J. Eng. Technol. 2017, 36, 385–394. [Google Scholar] [CrossRef] [Green Version]
  60. Hock, R. Glacier melt: A review of processes and their modelling. Prog. Phys. Geogr. Earth Environ. 2005, 29, 362–391. [Google Scholar] [CrossRef]
  61. Hock, R.; Holmgren, B. A distributed surface energy-balance model for complex topography and its application to Storglaciaren, Sweden. J. Glaciol. 2005, 51, 25–36. [Google Scholar] [CrossRef] [Green Version]
  62. Zhang, S.; Ye, B.; Liu, S.; Zhang, X.; Hagemann, S. A modified monthly degree-day model for evaluating glacier runoff changes in China. Part I: Model development. Hydrol. Process. 2012, 26, 1686–1696. [Google Scholar] [CrossRef]
  63. Matthias, H.; Daniel, F.; Andreas, B.; Martin, F. Modelling runoff from highly glacierized alpine drainage basins in a changing climate. Hydrol. Process. 2008, 22, 3888–3902. [Google Scholar] [CrossRef]
  64. Marco, C.; Francesca, P.; Stefan, R.; Paolo, B. Assessing the transferability and robustness of an enhanced temperature-index glacier-melt model. J. Glaciol. 2009, 55, 258–274. [Google Scholar]
  65. Gao, H.; He, X.; Ye, B.; Pu, J. Modeling the runoff and glacier mass balance in a small watershed on the Central Tibetan Plateau, China, from 1955 to 2008. Hydrol. Process. 2012, 26, 1593–1603. [Google Scholar] [CrossRef]
  66. Konz, M.; Uhlenbrook, S.; Braun, L.; Shrestha, A.; Demuth, S. Implementation of a process-based catchment model in a poorly gauged, highly glacierized Himalayan headwater. Hydrol. Earth Syst. Sci. 2007, 11, 1323–1339. [Google Scholar] [CrossRef] [Green Version]
  67. Immerzeel, W.W.; van Beek, L.; Konz, M.; Shrestha, A.; Bierkens, M.F. Hydrological response to climate change in a glacierized catchment in the Himalayas. Clim. Chang. 2012, 110, 721–736. [Google Scholar] [CrossRef] [Green Version]
  68. Raper, S.C.; Braithwaite, R.J. Low sea level rise projections from mountain glaciers and icecaps under global warming. Nature 2006, 439, 311–313. [Google Scholar] [CrossRef]
  69. Radić, V.; Hock, R. Regional and global volumes of glaciers derived from statistical upscaling of glacier inventory data. J. Geophys. Res. 2010, 115. [Google Scholar] [CrossRef]
  70. Wang, Y.; Xie, X.; Shi, J.; Zhu, B. Ensemble runoff modeling driven by multi-source precipitation products over the Tibetan Plateau. Chin. Sci. Bull. 2021, 66, 4169–4186. [Google Scholar] [CrossRef]
  71. Nash, J.E.; Sutcliffe, J.V. River flow forecasting through conceptual models part1—A discussion of principles. J. Hydrol. 1970, 10, 282–290. [Google Scholar] [CrossRef]
  72. Su, F.; Hong, Y.; Lettenmaier, D.P. Evaluation of TRMM Multisatellite Precipitation Analysis (TMPA) and Its Utility in Hydrologic Prediction in the La Plata Basin. J. Hydrometeorol. 2008, 9, 622–640. [Google Scholar] [CrossRef] [Green Version]
  73. Paltan, H.; Allen, M.; Haustein, K.; Fuldauer, L.; Dadson, S. Global implications of 1.5 °C and 2 °C warmer worlds on extreme river flows. Environ. Res. Lett. 2018, 13, 1–10. [Google Scholar] [CrossRef]
  74. Zhou, M.; Zhou, G.; Lv, X.; Zhou, L.; Ji, Y. Global warming from 1.5 to 2 °C will lead to increase in precipitation intensity in China. Int. J. Climatol. 2018, 39, 2351–2361. [Google Scholar] [CrossRef]
  75. Arnell, N.W. Effects of IPCC SRES emissions scenarios on river runoff: A global perspective. Hydrol. Earth Syst. Sci. 2003, 7, 619–641. [Google Scholar] [CrossRef] [Green Version]
  76. Yao, T.; Bolch, T.; Chen, D.; Gao, J.; Immerzeel, W.; Piao, S.; Su, F.; Thompson, L.; Wada, Y.; Wang, L.; et al. The imbalance of the Asian water tower. Nat. Rev. Earth Environ. 2022, 3, 618–632. [Google Scholar] [CrossRef]
  77. Chen, R.-S.; Liu, J.-F.; Song, Y.-X. Precipitation type estimation and validation in China. J. Mt. Sci. 2014, 11, 917–925. [Google Scholar] [CrossRef]
  78. Wigmosta, M.S.; Vail, L.; Lettenmaier, D.P. A distributed hydrology-vegatation model for complex terrain. Water Resour. Res. 1994, 30, 1665–1679. [Google Scholar] [CrossRef]
  79. Kang, E.; Chen, G.; Lan, Y.; Jin, H. A model for simulating the response of runoff from the mountainous watersheds of inland river basins in the arid area of northwest China to climatic changes. Sci. China 1999, 42. [Google Scholar] [CrossRef]
  80. Ding, B.; Yang, K.; Qin, J.; Wang, L.; Chen, Y.; He, X. The dependence of precipitation types on surface elevation and meteorological conditions and its parameterization. J. Hydrol. 2014, 513, 154–163. [Google Scholar] [CrossRef]
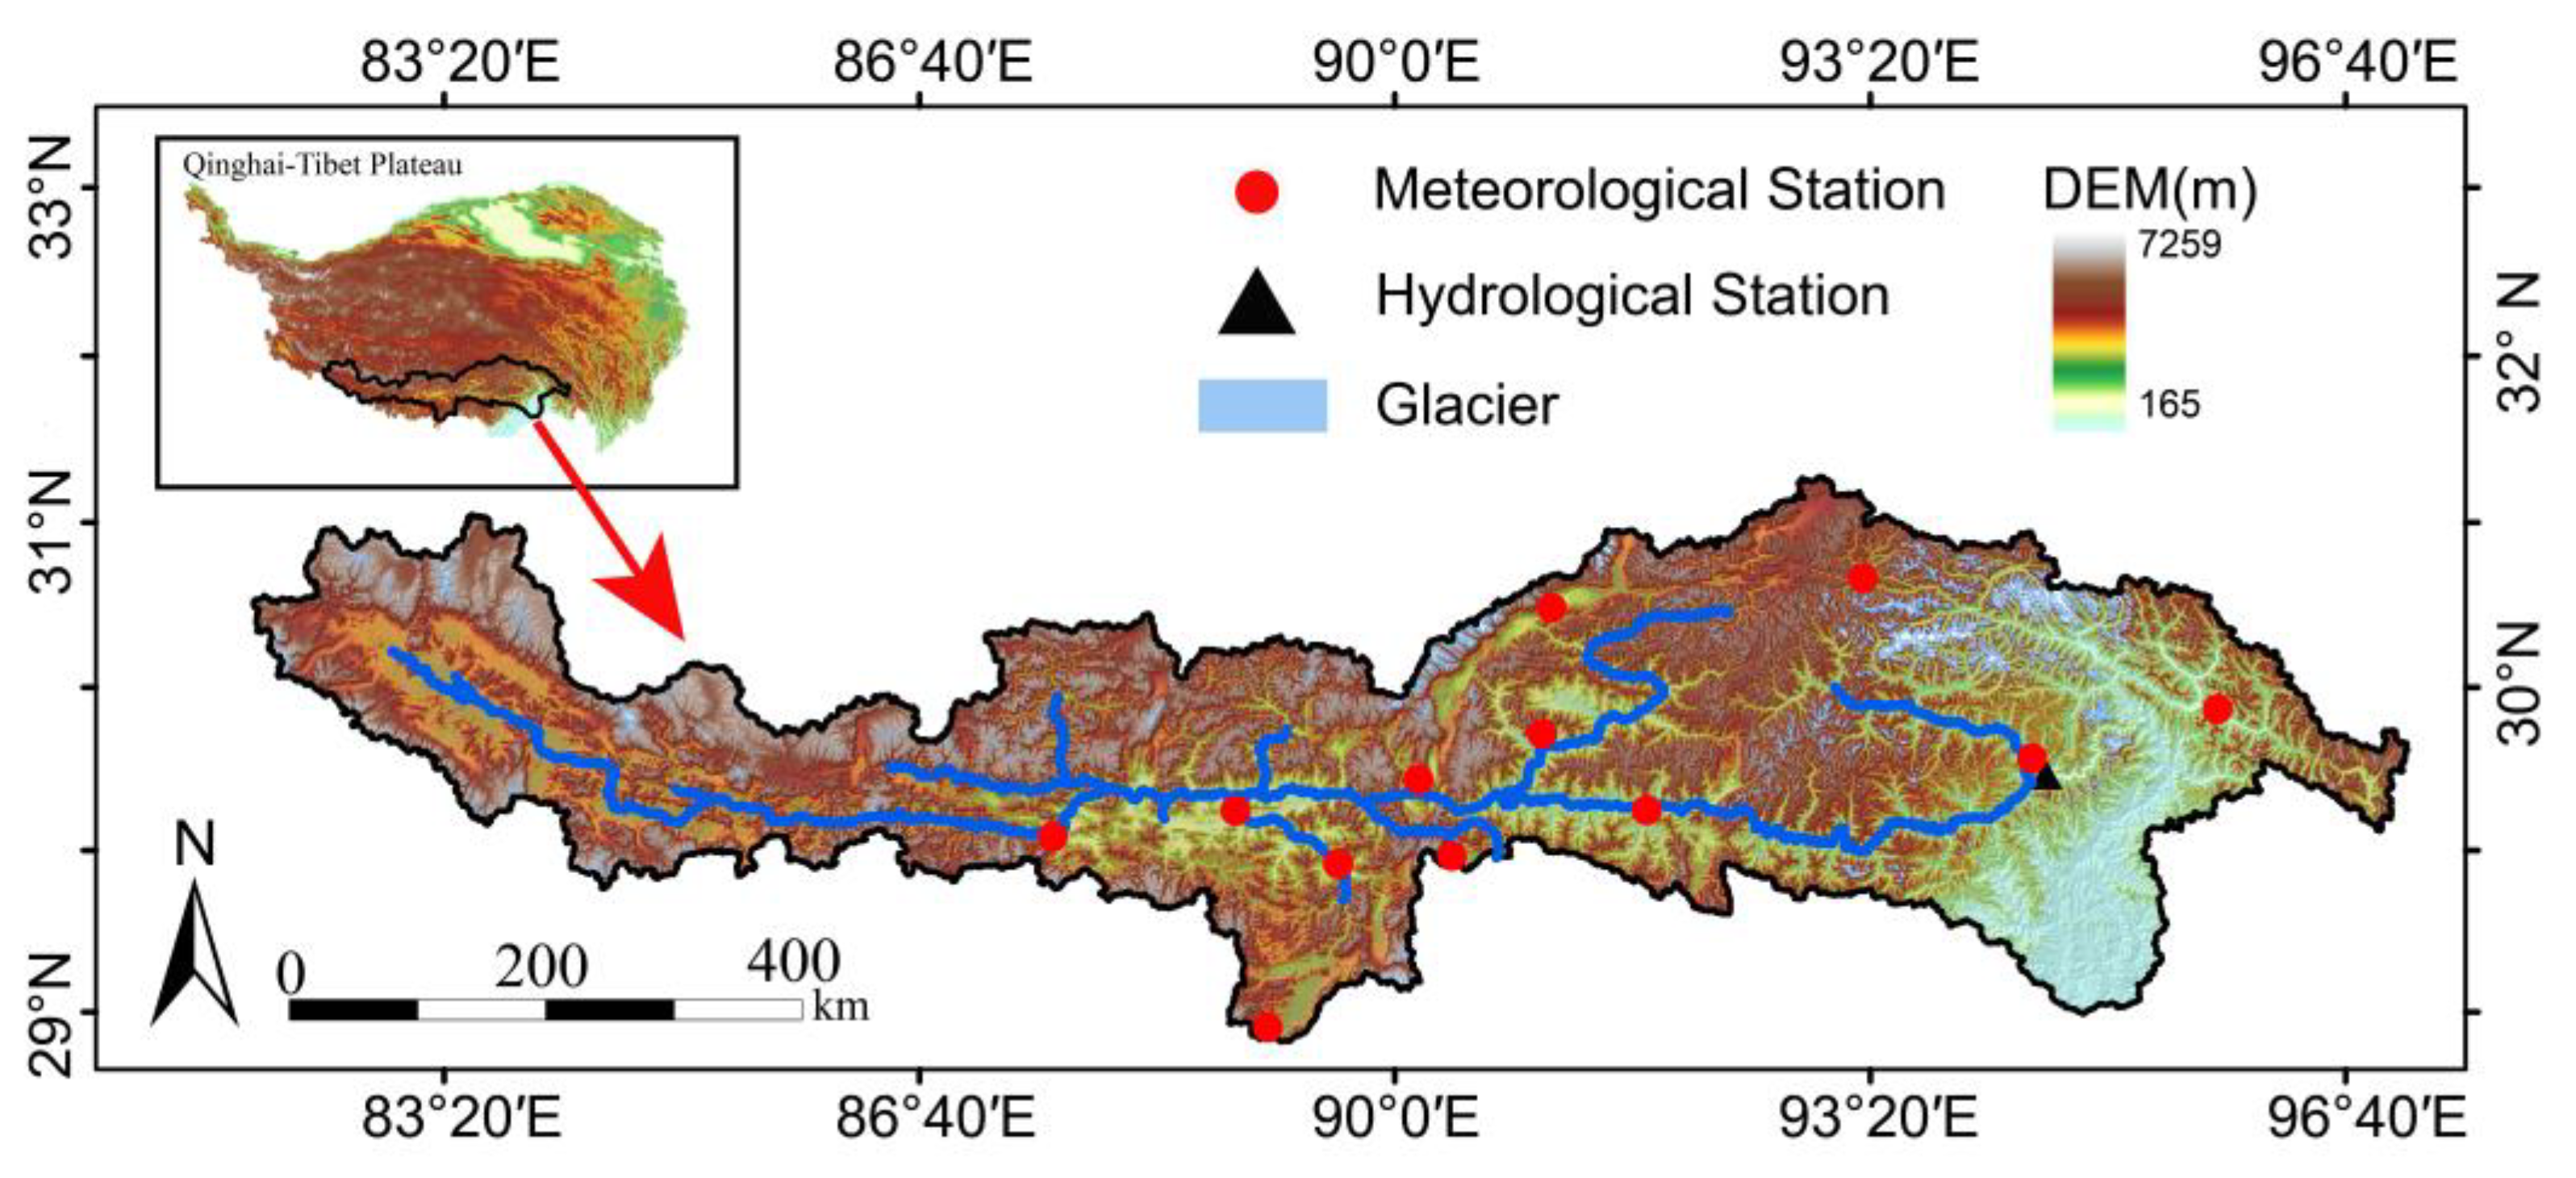
Figure 1. Location of the Yarlung Zangbo River Basin.
Remotesensing 15 00055 g001
Figure 2. Annual mean precipitation in observation and CMIP6 models before (a) and after (b) BCSD over YZRB.
Remotesensing 15 00055 g002
Figure 3. Average precipitation changes over the YZRB for the periods (2020–2040, 2040–2060 and 2080–2100) with respect to the baseline (1979–2014) under SSP 1-2.6, SSP 2-4.5, and SSP 5-8.5.
Remotesensing 15 00055 g003
Figure 4. Average maximum (above) and minimum (below) temperature changes over the YZRB for the periods (2020–2040, 2040–2060, and 2080–2100) with respect to the baseline (1979–2014) under SSP 1-2.6, SSP 2-4.5, and SSP 5-8.5.
Remotesensing 15 00055 g004
Figure 5. Results of the streamflow (a), snow cover area (b), and glacier area (c).
Remotesensing 15 00055 g005
Figure 6. Annual total runoff under SSP 5-8.5 and SSP 1-2.6.
Remotesensing 15 00055 g006
Figure 7. The runoff, and its components, in the reference period (1979–2010) and the end of the 21st century (2090–2100) under SSP 1-2.6, SSP 2-4.5 and SSP 5-8.5.
Remotesensing 15 00055 g007
Figure 8. Annual average precipitation for each model and MME from 2015 to 2100.
Remotesensing 15 00055 g008
Table 1. Basic information of 9 GCMs in CMIP6.
GCMResolution (km × km)Country
BCC-CSM2-MR320 × 160China
FGOALS-g3180 × 80China
MIROC6256 × 128Japan
NorESM2-LM144 × 96Norway
NorESM2-MM288 × 192Norway
CMCC-ESM2288 × 192Italy
MPI-ESM1-2-HR384 × 192Germany
MPI-ESM1-2-LR192 × 96Germany
TaiESM1288 × 192China
Table 2. Basic parameters for the VIC–Glacier model.
ParameterDescriptionUnitRange
B_infVariable infiltration curve parameter 0.01–1
DsFraction of Dsmax where nonlinear baseflow begins 0.3–1
DsmaxMaximum velocity of baseflowmm/d10–50
WsFraction of Dsmaximum soil moisture where nonlinear baseflow Occurs 0.1–1
D1Thickness of the first soil moisture layerm0.03–0.1
D2Thickness of the second soil moisture layerm0.1–1
D3Thickness of the third soil moisture layerm0.5–2
DDFsnowEmpirical melting of snow 5–10
DDFglacierEmpirical melting of glacier 5–10
ReFactor quantify the dependence of aspect 0–1
Disclaimer/Publisher’s Note: The statements, opinions and data contained in all publications are solely those of the individual author(s) and contributor(s) and not of MDPI and/or the editor(s). MDPI and/or the editor(s) disclaim responsibility for any injury to people or property resulting from any ideas, methods, instructions or products referred to in the content.