Abstract
The Moderate Resolution Imaging Spectroradiometer (MODIS) aerosol optical depth (AOD) has been widely used in atmospheric environment and climate change research. Based on data of the Aerosol Robotic Network and Sun–Sky Radiometer Observation Network in the Yangtze River Delta, the retrieval accuracies of MODIS C6.1 Dark Target (DT), Deep Blue (DB), and C6.0 Multi-angle Implementation of Atmospheric Correction (MAIAC) products under different land cover types, aerosol types, and observation geometries were analyzed. About 65.64% of MAIAC AOD is within the expected error (Within EE), which is significantly higher than 41.43% for DT and 56.98% for DB. The DT product accuracy varies most obviously with the seasons, and the Within EE in winter is more than three times that in spring. The DB and MAIAC products have low accuracy in summer but high in other seasons. The accuracy of the DT product gradually decreases with the increase in urban and water land-cover proportion. After being corrected by bias and mean relative error, the DT accuracy is significantly improved, and the Within EE increases by 24.12% and 32.33%, respectively. The observation geometries and aerosol types were also examined to investigate their effects on AOD retrieval.
Keywords:
Yangtze River Delta; aerosol optical depth; AERONET; SONET; MODIS; aerosol type; land cover 1. Introduction
Aerosols are tiny particles suspended in the atmosphere, and they are one of the main pollutants in the atmosphere [1]. This pollutant is an important factor affecting climate change, by scattering and absorbing solar radiation and changing the microphysical properties of clouds to disturb the Earth’s radiation balance [2,3,4,5]. The impact of atmospheric aerosols on climate forcing is uncertain due to the relatively high spatial and temporal variability in their physical and chemical characteristics [6,7]. The observation of aerosol’s optical and physical properties and the quantification of the impact of aerosol particles on the climate and environment have also attracted extensive attention. Aerosol optical depth (AOD) is the integral of the aerosol extinction coefficient in the vertical direction, and it is a key factor used to describe aerosol optical properties and determine the influence of climate effects. It is widely used in atmospheric environment monitoring, atmospheric radiation transmission, remote sensing applications, and climate change research [8,9,10].
Remote sensing technology is an important method for aerosol monitoring at present [11]. Satellite remote sensing has a large observation region and relatively low cost, and it can reflect the spatial and temporal variations in regional and even global atmospheric aerosol. The Moderate Resolution Imaging Spectroradiometer (MODIS) on the Terra/Aqua satellite has been widely used as a global-coverage satellite remote sensing instrument to detect aerosol optical properties [12]. However, the radiation information received by the satellite’s sensor is subject to the complex influence of atmospheric scattering and surface reflection [13]. Moreover, uncertainties are introduced by surface reflectance and the aerosol model used in AOD retrieval [14,15], which results in uncertainty in the results of satellite retrieval. Therefore, the applicability of MODIS aerosol products for different regions still needs to be verified by comparison with ground observation data. East Asia is one of the regions with the largest aerosol loads in the world. Considerable research has been conducted on the applicability of MODIS AOD in East Asia, especially China, including the Yangtze River Delta (YRD), the Beijing–Tianjin–Hebei region, Pearl River Delta, and northwest China [16,17,18].
The land surface reflectance is high, and the aerosol types are complex compared with those in ocean aerosol retrieval, and the retrieval of aerosols over land is still an important and difficult topic [19]. The solar radiation at the top of the atmosphere (TOA) received by satellite sensors includes atmospheric scattering and surface reflection. Obtaining accurate surface reflectance is a key problem to be solved for aerosol retrieval. Land cover type also affects aerosol characteristics. The reason is that different land cover types will produce different atmospheric emissions, and this factor can change the local climate and affect the transmission of aerosols by affecting radiation transport [20]. Therefore, an increasing number of scholars focus on the influence of surface types on aerosol characteristics and AOD retrieval accuracy [21,22,23,24].
The YRD is one of the fastest-growing and most prosperous regions in China. It is considered to be a high-aerosol value area in the global context and a heavily polluted area in China, because of its dense population and industries [25]. The composition of aerosols in this region is complex, including anthropogenic aerosols such as sulfates, biomass burning aerosol, as well as natural aerosols, such as dust and sea salt transported over a long distance, and their optical properties are highly diverse [26,27,28,29]. Therefore, the applicability of the MODIS aerosol product in the YRD needs to be further analyzed to clarify the influence of different land cover types, aerosol types, and observation geometries on aerosol retrieval accuracy.
In this study, the YRD is taken as the research area, and the AOD data of the Aerosol Robotic Network (AERONET) and the Sun–Sky Radiometer Observation Network (SONET) ground-based observation sites, representing the underlying surface of forest, cropland, urban, and water, are selected as the benchmark. The aerosol retrieval accuracies of MODIS Collection 6.1 (C6.1) Dark Target (DT), Deep Blue (DB), and MODIS Collection 6 (C6) Multi-angle Implementation of Atmospheric Correction (MAIAC) AOD products under different land cover types, aerosol types, and observation geometries are studied. The accuracy of MODIS AOD is also corrected according to the land-cover proportion of urban and water areas to provide a new reference for the more accurate evaluation of the applicability of MODIS AOD products in different regions and the improvement in the retrieval method.
2. Materials and Methods
2.1. MODIS Aerosol Products
MODIS is one of the most important sensors used by the Earth Observing System (EOS) Terra/Aqua satellites for aerosol monitoring [12]. It has 36 bands covering the spectrum from 0.4 µm to 14 µm. Its spatial resolution range includes 250 m (bands 1–2), 500 m (bands 3–7), and 1 km (bands 8–36), and thus, it provides global coverage every 2 days [30]. At present, MODIS aerosol products have been developed for the DT and DB of C6.1 version [31,32]. The daily aerosol products of C6.1 Level 2 are MOD04_L2 and MYD04_L2 with a spatial resolution of 10 km, where “MOD” is used for Terra and “MYD” for Aqua. The MAIAC product has been developed for C6 [33], and its daily aerosol product is MCD19A2, with a spatial resolution of 1 km.
2.1.1. DT Products
Over vegetated and dark soiled surfaces, a proportional relationship exists between the surface reflectance in visible wavelengths (0.47 and 0.66 µm) and in the shortwave infrared wavelengths (2.12 µm), which is called the “VISvs2.12” relationship [34,35]. The DT algorithm assumes that the aerosol is transparent at 2.12 µm and that the surface reflectance equals the TOA reflectance in this band; then, the AOD is retrieved based on the selected aerosol model and look-up table (LUT). Under a dust aerosol regime, aerosol transparency is an extremely poor assumption, and the 2.12 µm channel contains information about coarse mode aerosol and the surface reflectance. Levy et al. found that a single set of “VISvs2.12” ratios is not globally applicable [13,36]. The C5 defined the “VISvs2.12” relationship as a function between the scattering angle (SA) and the Normalized Difference Vegetation Index (NDVI) based on 2.12 µm. The C6.1 product over land was corrected as follows: when the coastal proportion in the 10 km × 10 km grid was greater than 50% or the water proportion was greater than 20%, the quality assurance (QA) of AOD was dropped to 0; when the proportion of urban was more than 20%, the surface reflectance calculation scheme was modified using the MODIS land surface reflectance and land cover type products [37]. The dataset of “Optical_Depth_Land_And_Ocean” from C6.1 MOD04_L2 and MYD04_L2 was used, and it contains AOD values for the filtered, quantitatively useful retrievals over dark targets, where the QA for AOD over land is 3 (representing high-quality retrieval).
2.1.2. DB Products
Hsu et al. found that the surface reflectance of MODIS in the blue channel is still low, even in areas of high surface reflectance, such as urban and desert [38]. The DB algorithm assumes that the surface reflectance of most figures remains constant in a short time and retrieves AOD by constructing a seasonal surface reflectance database [39]. The C6 algorithm divides the land surface into three types: arid and semi-arid regions, vegetated regions, and urban/built-up and transitional regions [40]. The surface reflectance database is improved using knowledge of NDVI, SA, and season. The C6.1 product has been updated in the following aspects: radiometric calibration, heavy smoke detection, artifact correction for heterogeneous terrain, seasonal and regional aerosol model, and surface reflectance in elevated terrain [41]. The dataset of “Deep_Blue_Aerosol_Optical_Depth_550_Land_Best_Estimate” from the MODIS C6.1 product was used, where QA = 2, 3 (representing good quality retrieval). Datasets such as “Solar_Zenith”, “Sensor_Zenith”, “Solar_Azimuth”, “Sensor_Azimuth”, and “Scattering_Angle” were used to evaluate the impact of observation geometry on the accuracy of DT and DB AOD.
2.1.3. MAIAC Products
The MAIAC algorithm assumes that (1) surface reflectance slightly changes in a short period of time and that (2) AOD does not change remarkably in adjacent regions [42,43]. MAIAC retrieves AOD through time-series MODIS observations. MAIAC applies the MODIS L1B data to a fixed grid with a resolution of 1 km, analyzes the time series of observation data from the past 4 days (polar) to 16 days (equatorial) using the sliding window strategy to obtain the linear spectral regression coefficient (SRC), and calculates AOD based on SRC and surface bidirectional reflectance factors via LUT. MODIS C6 has been improved in terms of cloud mask, SRC estimation, and aerosol properties. MAIAC utilizes the minimal ratio of spectral reflectance (0.47/2.13 μm) in a 2-month period to estimate SRC at a 1 km scale, which helps to remove the occasional blockiness at the 25 km scale in the AOD and in the surface reflectance. Smoke and dust models are introduced in C6 to distinguish between fine and coarse aerosol models [33]. “Optical_Depth_055” and “AOD_QA” in the C6 product were used in this study, where “0000” for the QA of AOD was selected to represent the best quality. The datasets “cosSZA”, “cosVZA”, “RelAZ”, and “Scattering_Angle” were selected to evaluate the impacts of observation geometry on the accuracy of MAIAC products.
2.2. Ground-Based Measurements
2.2.1. AERONET Data
AERONET is a global aerosol optical property monitoring network established by the National Aeronautics and Space Administration [44]. Through the establishment of ground-based monitoring sites in representative regions around the world, the benchmark data of global aerosol parameters have been obtained to study aerosol optical and physicochemical properties. The AERONET uses the French CIMEL CE318 Sun photometer to obtain the columnar AOD for the whole atmosphere by measuring the direct (collimated) solar radiation at different wavelengths, directions, and times. AERONET uses the spectral ed-convolution algorithm to yield fine and coarse AOD at a standard wavelength of 500 nm, from which the fine mode fraction to total AOD can be computed [45]. The CE318 Sun photometer sky radiance measurements can be inverted to produce aerosol characteristics, such as size distribution, single scattering albedo (SSA), phase functions, and the complex index of refraction. The AERONET aerosol products are classified into Level 1.0, Level 1.5, and Level 2.0 [46]. L1.0 data are unscreened and do not undergo final calibration; L1.5 data are cloud-cleared, and quality controls have been applied, but these data may not undergo final calibration; L2.0 data are automatically cloud-cleared and quality-assured, with pre-field and post-field calibration applied. The V3 Level 2.0 data (Table 1) for Taihu (TH), Qiandaohu (QDH), Hangzhou_City (HZC), Hangzhou_ZFU (HZZ), NUIST, Shouxian (SX), Hefie (HF), XuZhou-CUMT (XZ), and LA-TM in the YRD (Figure 1) from 2007 to 2018 were used in this study.

Table 1.
Information of ground-based observation sites.
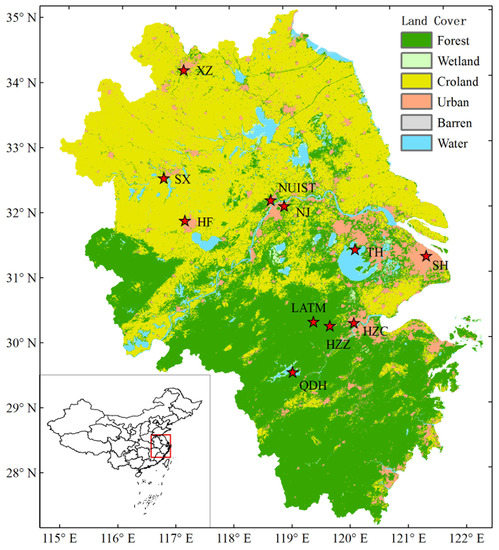
Figure 1.
Locations of the AERONET and SONET sites in the Yangtze River Delta displayed on the land-cover map.
2.2.2. SONET Data
SONET is a ground-based observation network organized and implemented by the Chinese Academy of Sciences in typical areas of China, including rural, urban, desert, coastal, basin, mountain, and plateau areas [47]. It obtains the physical, chemical, and optical characteristics of the total column aerosol for aerosol characteristic modeling and the authenticity inspection of satellite remote sensing products in China. SONET uses the French CIMEL’s multiwavelength polarized sun–sky radiometer CE318-DP to observe the solar and sky radiation and their polarization characteristics in eight wavebands (the central wavelengths are 340, 380, 440, 500, 675, 870, 1020, and 1640 nm) and to detect the total column water vapor at 936 nm. Aerosol products are divided into three grades according to the AERONET product grades, namely, Level 1.0, Level 1.5, and Level 2.0 [48]. L1.0 data are original data; L1.5 data are cloud-cleared through the automatic cloud identification algorithm; L2.0 data are cloud-cleared, and calibration coefficient interpolation and expert identification have been applied. SONET L2.0 data (Table 1) from Hefei (HF), Nanjing (NJ), and Shanghai (SH) were adopted in this study.
The AERONET/SONET AOD at 500 and 675 nm were interpolated into AOD at 550 nm using the Ångström exponent (AE) because MODIS AOD is at 550 nm, but AERONET/SONET AOD does not have such a wavelength.
where τ500 is AOD at 500 nm, τ675 is AOD at 675 nm, α is the AE at 500–675 nm, and τ550 is AOD at 550 nm obtained by interpolation.
2.3. Land Cover Data
MCD12Q1 data are the 500 m resolution land classification products formed by extracting different land cover types based on the annual MODIS Aqua and Terra data using the decision tree-supervised classification method [49]. These data can be divided into 17 land cover types. The land cover type percentages of each of the AERONET and SONET sites in the YRD corresponding to 3 × 3 pixels of MODIS L2 data within the range of 30 km × 30 km are counted in Table 2. The areas around QDH, LATM, and HZZ are dominated by forest; notably, the forest proportions of LATM and HZZ account for more than 90%. HF and SX are dominated by cropland, and the proportions account for more than 60%. The land cover types at HZC and SH are mainly urban, of which the urban area in SH accounts for more than 90%. TH is dominated by water; approximately half of it is water, and it is slightly more urban than forest. The land cover types at XZ, NJ, and NUIST are mixtures of forest, cropland, and urban. According to the land cover proportion, the ground-based observation sites are classified into five land cover types, which are forest, cropland, urban, mixed, and water.
Table 2.
Percentage of land cover around AERONET/SONET sites (%).
2.4. Evaluation Method
2.4.1. Spatiotemporal Matching
AERONET/SONET data represent the continuous observation of the ground sites at fixed intervals daily, whereas MODIS AOD represents the instantaneous observations with a 10 km × 10 km spatial resolution. The spatiotemporal scales of MODIS and ground-based observations differ. Therefore, the ground-based data were filtered with a temporal window of 30 min before and after satellite overpass to obtain the average of AOD. The 30 km × 30 km range of the ground site was considered a spatial window, and the average MODIS AOD under this window was calculated to form the AERONET/SONET-MODIS AOD dataset matching the temporal and spatial resolution.
2.4.2. Evaluation Method
The expected error (EE hereinafter) is usually used to evaluate the quality of AOD retrieved by satellite. A large number of experiments have been conducted by the MODIS science team; EE adopts ±(0.05 + 0.15 × AOD) for DT and DB AOD products, and ±(0.05 + 0.1 × AOD) is used for MAIAC products [33,50,51,52]. To uniformly compare and analyze the quality of each algorithm, the EE of ±(0.05 + 0.15 × AOD) is adopted. Above EE, Within EE and Below EE are expressed by Equations (4)–(6):
where AODG is the observed AEROENT/SONET AOD, and AODM is the AOD retrieved from MODIS. In addition, error analysis is performed by root mean squared errors (RMSE), bias, the square of the correlation coefficient (R2), and the slope (a) of regression analysis.
3. Results
3.1. Overall Accuracy of DT, DB, and MAIAC
The accuracies of DT, DB, and MAIAC products in the YRD differ greatly (Figure 2), and the matched number and accuracy of MAIAC are significantly better than those of DT and DB. The matched number of DT is the lowest, with a value of 3239, which indicates that it is more difficult to satisfy the DT algorithm than MAIAC or DB. The DT product also has the lowest accuracy, with a Within EE of only 41.43% (Figure 2a), which is more than 24% lower than that of MAIAC, and the RMSE of DT is the highest at 0.243. In the matched data of DT, about 54.58% is Above EE, only 3.98% is Below EE, and the bias is 0.151, which implies that DT AOD in the YRD is mostly overestimated. The bias box at different AODs is shown in Figure 2d. When the AOD is less than 0.8, the mean bias exceeds the EE, and the mean bias decreases gradually with the increase in AOD. The mean bias is −0.006 when the AOD is 1.78, and this suggests that the DT AOD in the YRD is overestimated mainly in the middle and low value ranges.
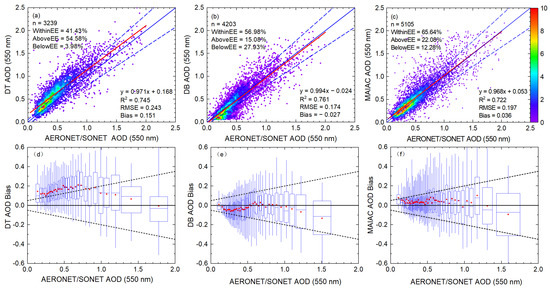
Figure 2.
Overall accuracy of (a) DT, (b) DB, (c) MAIAC; the solid red line represents the regression line; the solid blue line represents the 1:1 reference line, and the dashed blue line represents the expected error line. The AOD bias box plot of (d) DT, (e) DB, (f) MAIAC products; each box is based on 100 matched data; the dashed line represents the expected error line, and the red dot represents mean bias.
A total of 4203 DB matched data have a Within EE of 56.98%, an RMSE of 0.174, and a bias of −0.027. The number and accuracy of DB matched data are better than those of DT but lower than those of MAIAC. However, 27.93% of DB AOD is Below EE, which is the highest among the three methods. The bias statistics of different AODs are shown in Figure 2e. The mean bias is less than 0 when the AOD is between 0.15 and 0.5. The mean bias is relatively small and fluctuates around 0 when the AOD is between 0.5 and 1.0. The deviation is larger and becomes less than 0 with the increase in AOD when the AOD is greater than 1.0. Therefore, DB AOD is mostly underestimated when AOD is greater than 1.0 and less than 0.5.
The MAIAC product is the best of the three algorithms. It has a matched number of 5105, a Within EE of 65.64%, an RMSE of 0.196, and a bias of 0.036, which values are obviously better than those of DT and DB. The bias statistics of different AODs are shown in Figure 2f. The mean bias of MAIAC is relatively large when the AOD is low. In particular, the mean bias is 0.079 when the AOD is 0.105, and it is the only mean bias value that exceeds the EE in the MAIAC product. Therefore, the MAIAC AOD is obviously overestimated at a low AOD. When the AOD is between 0.2 and 0.5, the mean bias is relatively low, most of which values are lower than 0.04. The mean bias slightly increases with the rise in AOD.
The retrieval accuracy values for DT, DB, and MAIAC products show discrepancy in different seasons (Table 3). The matched number is the lowest in winter, and the Within EE is the lowest in spring for the DT product. The matched number and Within EE of DB and MAIAC AOD products are the lowest in summer. The matched numbers for the three algorithms in summer are very low; among them, the matched number of DT in summer is 575, which is smaller than the 1224 in spring and the 996 in autumn, and this value for DB and MAIAC is lower in summer than in other seasons, only accounting for 12.0% and 13.6% of all matched numbers, which may be due to the rainy weather in the YRD in summer [25].
Table 3.
Accuracy validation of DT, DB, and MAIAC AOD in the Yangtze River Delta in each season.
The matched number of DT AOD in winter is the lowest, with a value of 444, which is mainly due to the reduction in green vegetation in winter. The Within EE of DT shows the most significant seasonal variation, with a peak of 63.51% in winter, and only 23.29% in spring, which is one-third of that in winter.
The Within EE of DB does not change considerably in spring, autumn, and winter, and the values are all close to 60%, while the lowest value is 40.36% in summer. The main reason is that the Deep Blue surface database method is mainly adopted for the surface reflection in the YRD, and the lush vegetation in summer leads to low accuracy for AOD retrieval.
The Within EE of MAIAC AOD also shows significant seasonal variation, with 56.46% in summer, which is the lowest value, 61.72% in spring, 65.49% in autumn, and 73.82% in winter, which is the highest value. The matched number is also the lowest in summer, while little change is observed in other seasons. Therefore, the quantity and accuracy of MAIAC AOD are good, except in summer.
3.2. Influence of Land Cover Types on AOD Retrieval
The three algorithms perform significantly differently for different land cover types (Table 4). The highest accuracy of the DT product regards the data for forest, where it obtains a Within EE of 68.75%, an RMSE of 0.163, and a bias of −0.059. The Within EE of DT for cropland with a higher vegetation proportion is 53.59%, which is obviously higher than that for mixed, urban, and water areas. The Within EE values of DT for urban and water are 18.96% and 26.04%, respectively, which are relatively low. The analysis of the relationship between the land cover proportion of urban and water (LCPUW) and the Within EE at eight sites with more matched data in the YRD (Figure 3a) shows that Within EE is significantly negatively related to LCPUW, that the R2 is 0.892, and that the accuracy of DT AOD decreases with the increase in LCPUW.
Table 4.
Accuracy of DT, DB, and MAIAC AOD in different land cover types in the Yangtze River Delta.
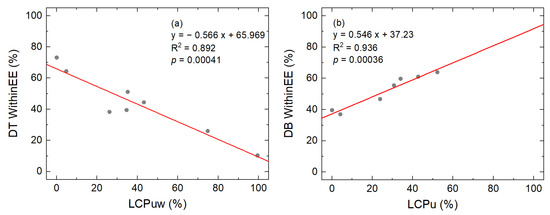
Figure 3.
(a) Correlations between land-−cover proportions of urban and water and DT Within EE. (Three sites with the least matched data are removed, which are QDH, HZC, and SX). (b) Correlations between land-cover proportion of urban without water and DB Within EE (QDH, HZC, and SX with fewer matching data and SH with a high urban proportion close to 100% are removed).
The lowest accuracy of the DB product regards the data for forest, where it obtains a Within EE of only 36.97%. Different from other regions [21,53], the Within EE of DB for urban in the YRD is only 48.68%, which is lower than that for cropland, mixed, and water land cover. Among the two sites with urban cover, the Within EE at HZC is 63.10%, which is significantly higher than that at SH (45.40%). Therefore, other factors besides land cover type have a great impact on the DB product in SH. The Within EE in TH mainly dominated by water is 63.91%, which is the highest among all land cover types. The reason is that DB filters water land cover according to the MCD12C1 dataset and retrieves aerosols of other land cover types [40]. After the water land cover around TH is removed, about 52.29% of the underlying surface is urban, which value is second only to SH and HZC. After the water land cover is removed in each site, a significant linear relationship can be observed between the land cover proportion of urban without water (LCPU) and the Within EE of DB (Figure 3b), and the Within EE of DB increases with the rise in the LCPU.
The accuracy of MAIAC in forest, cropland, and mixed land cover types with a high vegetation proportion is relatively high. The Within EE values of Mixed1 and Mixed2 are over 70%, while the Within EE values of cropland and forest are close to 80%, which are 78.74% and 79.24%, respectively. The RMSE and bias are also relatively low, and the lowest RMSE and bias in cropland are 0.126 and −0.008, respectively. The accuracy of MAIAC in urban is low, with a Within EE of 63%. The accuracy of MAIAC in water is the lowest, with a Within EE of only 45.50%.
3.3. DT and DB AOD Correction
The bias and Mean Relative Error (MRE) (defined by Equation (10)) of DT have an obvious linear relationship with LCPUW (Figure 4a,b), and the R2 values are 0.814 and 0.932, respectively. The bias and MRE of DT are positive, except for at LATM and HZZ, with a very small LCPUW. The bias and MRE of DT increase, and the accuracy decreases with the rise in LCPUW. The bias and MRE of DB have an obvious linear relationship with LCPU (Figure 4c,d). Different from those of DT, the bias and MRE of DB are all negative, except for those for XZ, with a high LCPU. Overall, the bias and MRE of DB increase with the rise in LCPU, and the accuracy improves.
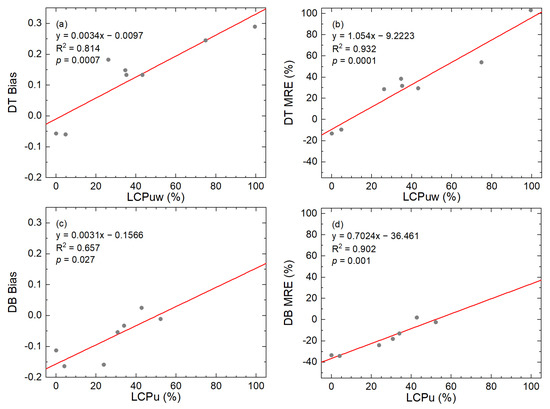
Figure 4.
Correlations between land-cover proportion of urban and water and (a) DT bias; (b) DT MRE; correlations between land-cover proportion of urban without water and (c) DB bias; (d) DB MRE.
Therefore, AOD can be corrected according to LCPUW and LCPU [24]. In this study, DT and DB products are corrected according to Equations (11) and (12). If the DT product is corrected, then Biaspredict and MREpredict are determined by regression equations in Figure 4a,b and LCPUW. If the DB products are corrected, then Biaspredict and MREpredict are determined by the regression equations in Figure 4c,d and LCPU.
The accuracy of DT is greatly improved when corrected by the two methods (Figure 5). In particular, the Within EE of the DT MRE-corrected product has been increased to 72.29%, but its regression coefficient is only 0.704. The RMSE and bias of the DT MRE-corrected product are slightly higher than those of the DT bias-corrected product. The change curve of the mean bias of the DT bias-corrected product (Figure 5e) is similar to that of the DT-uncorrected product, but the mean bias is significantly reduced and around zero. The mean bias of the DT MRE-corrected product (Figure 5f) gradually decreases with the increase in AOD, with a value from 0.048 to −0.327. The lower quartile limit of bias exceeds the EE when AOD is around 0.8, and the mean bias also exceeds the EE when AOD is around 1.0. Therefore, the accuracy of the DT MRE-corrected product is significantly improved in the middle and low AOD intervals. However, the error will already exceed that of DT-uncorrected products with the increase in AOD, especially when the AOD is greater than 1.0.
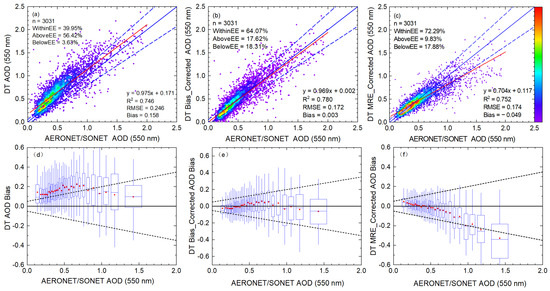
Figure 5.
Accuracy of (a) DT, (b) DT bias-corrected, (c) DT MRE-corrected AOD; the solid red line represents the regression line; the solid blue line represents the 1:1 reference line, and the blue dashed line represents the expected error line. Bias boxplot of (d) DT, (e) DT bias-corrected, (f) DT MRE-corrected AOD; each box is based on 100 matching data points; the dashed line represents the expected error line, and the red dot represents the mean bias.
A comparison of the DT Within EE before and after correction at each site is shown in Figure 6a. The Within EE of LATM and HZZ with low LCPUW does not change considerably after correction, but the Within EE at TH and SH with a large LCPUW is significantly improved. Therefore, the DT product can be corrected effectively, especially for urban and water land cover types.
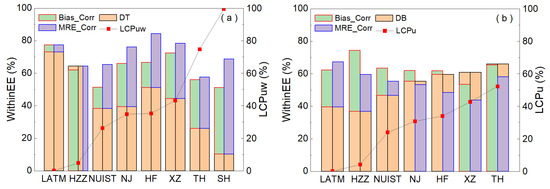
Figure 6.
Accuracy comparison at each site before and after the correction of DT (a) and DB (b) products. (a) The orange bar represents the DT Within EE, and the green and purple bars represent the increased Within EE value following bias correction and MRE correction, respectively. The Within EE shows no change before and after MRE correction at HZZ. (b) The lower orange bar represents the DB Within EE, and the upper orange bar represents the decreased value after correction.
The comparison of the Within EE of DB before and after correction at each site is shown in Figure 6b. The Within EE of the DB-corrected product at LATM, HZZ, and NUIST with low LCPU is significantly improved, but the improvement of Within EE gradually decreases with the rise in LCPU. When the LCPU exceeds 30%, the Within EE of the DB MRE-corrected product becomes lower than that of the uncorrected product, and the bias and MRE-corrected methods lead to a decrease in DB Within EE at HF, XZ, and TH. Therefore, only the DB product with an LCPU less than 30% can be corrected effectively.
Table 5 shows the accuracy comparison results at LATM, HZZ, and NUIST with low LCPU before and after the correction of DB AOD. The Within EE based on both correction methods has been significantly improved; in particular, the Within EE of the DB bias-corrected product has been increased to 67.88%, and the RMSE and bias have been significantly reduced, but the R2 has been decreased.
Table 5.
Accuracy comparison at LATM, HZZ, and NUIST before and after correction of DB AOD.
3.4. Influence of Observation Geometry on AOD Retrieval
The influence of observation geometry, such as solar zenith angle (SZA), view zenith angle (VZA), scattering angle (SA), and relative azimuth angle (RAA), on the aerosol retrieval accuracy is shown in Figure 7. SZA, VZA, and SA are divided into three sections: Low (0°–30°), Moderate (30°–60°), and High (60°–90°). RAA is also divided into six sections at 30° intervals.
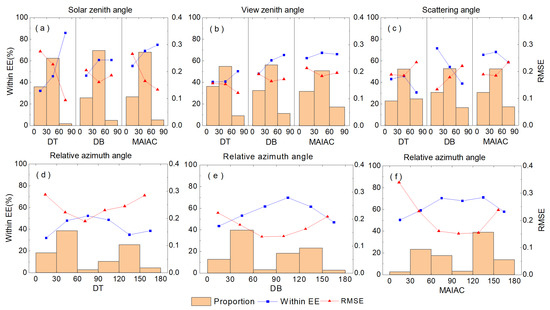
Figure 7.
Influence of SZA (a), VZA (b), SA (c), and RAA (d–f) on the accuracy of DT, DB, and MAIAC products. The orange vertical bar represents the proportions of matches in each angle section.
SZA greatly influences the accuracy of DT, DB, and MAIAC products (Figure 7a). The accuracy generally increases with the rise in SZA. The SZA values of DT, DB, and MAIAC are mainly concentrated in the Moderate and Low sections; Moderate accounts for about 60–70% of the total. The accuracy of AOD in the Low section is significantly lower than that in the Moderate section, and the Within EE in the Moderate sections of the three algorithms is about 14 percentage points higher than that in the Low section. The RMSE value of DT and DB at a Moderate SZA is about 0.05 lower than that at the Low SZA, while the difference between the RMSE values of MAIAC in the two sections is 0.101. The proportion of SZA in the High section is very low. The proportion of SZA of MAIAC in the High section, which represents the highest proportion of the High section in the three algorithms, is only 5.22%. The SZA of DT in the High section is less than 2%, but its accuracy is the highest, with a Within EE of 85.71% and an RMSE of 0.094.
VZA is also mainly concentrated in the Moderate and Low sections (Figure 7b). The accuracies of DT, DB, and MAIAC in the Moderate and High VZA are also higher than that in the Low VZA, but the influence of VZA is obviously smaller than that of SZA. In particular, the accuracy shows nearly no difference between the DT in the Moderate VZA and that in the Low VZA; the Within EE values are 40.74% and 40.27%, and the RMSE values of DT are 0.153 and 0.156. However, the accuracy of DT in the High section is significantly improved. The difference in the Within EE of MAIAC between Moderate and Low VZA is no more than five percentage points, and the difference in RMSE is about 0.023. The accuracy of MAIAC in High VZA is slightly reduced, and the accuracy does not change considerably with VZA. The DB product shows the largest change with VZA—the Within EE of Moderate VZA is 12.38 percentage points higher than that of Low VZA, and the RMSE is 0.026 lower.
The influence of SA is mainly reflected in that the accuracy of the three algorithms is the lowest for High SA (Figure 7c). The accuracy of the DT and MAIAC AOD varies with the SA, and the accuracy in Low SA is similar to that in Moderate SA. The difference in the Within EE between them is less than 3%, and the difference in RMSE between them is less than 0.1. Meanwhile, the accuracy of DB decreases with the rise in SA, and the accuracy difference of DB between Low and Moderate SA is large. The difference in Within EE is close to 17%, and the difference in RMSE is about 0.044.
The influence of RAA on the AOD accuracy of the three algorithms mainly manifests as high accuracy when RAA is close to vertical, but low accuracy when RAA is close to 0 or 180. The accuracy of DT in the three sections of 30°–60°, 60°–90°, and 90°–120° are better, with Within EE values of about 50%, among which the highest is 52.27% at 60°–90°, and the lowest RMSE is 0.189. The maximum Within EE of DB is 69.77% at 90°–120° RAA, and the lowest RMSE is 0.134 at 60°–90 ° RAA. MAIAC has good accuracy at 60°–90°, 90°–120°, and 120°–150° RAA, and their within EE values are close to 70%.
3.5. Influence of Aerosol Types on AOD Retrieval
Aerosol type is an important source of aerosol retrieval error. The DT algorithm establishes five aerosol models based on the global AERONET aerosol data through cluster analysis, and the appropriate aerosol model is selected according to regions and seasons. The DB algorithm uses the maximum likelihood method to calculate a mixing ratio between various dust and smoke models and then retrieves the AOD and AE. The MAIAC algorithm divides aerosols into eight types according to aerosol size distribution and the concentration ratios of coarse and fine particle columns, as well as other parameters observed by AERONET. Model 5 is mainly used for aerosol retrieval in China. The bias distributions of DT, DB, and MAIAC products under different AE and SSA are shown in Figure 8.
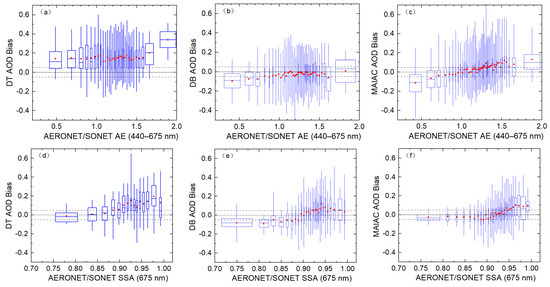
Figure 8.
Accuracy of DT, DB, and MAIAC products under different AE (a–c) and SSA (d–f); each box is based on 100 matched data points, the dashed line represents the expected error line, and the red dot represents mean bias.
The bias of DT and DB does not change considerably with AE. The bias of DT is generally large and mainly positive (Figure 8a). The mean bias does not change considerably with AE, and the mean bias of DT is around 0.15 except when the AE is greater than 1.6. The bias of DB is mainly negative (Figure 8b). The mean bias of DB also does not change considerably with AE. The mean bias of DB with an AE of 0.8–1.6 is very small and does not fluctuate considerably. The bias of MAIAC increases with the rise in AE (Figure 8c). The mean bias at each interval increases linearly with AE. The mean bias is less than 0 when the AE is less than 1.0, which indicates that the AOD of MAIAC is underestimated. The AOD of MAIAC is overestimated when the AE is greater than 1.0.
The AOD bias values of three algorithms change more obviously with SSA than with AE. Overall, the mean bias increases and then flattens with the increase in SSA. The mean bias increases with SSA when it is less than 0.93. The mean bias fluctuates significantly when the SSA is greater than 0.93. The mean DB bias is negative when the SSA is lower than 0.89; otherwise, it is positive. The mean bias of DB also increases with SSA before it reaches 0.95, and then, it changes slightly. The mean bias of MAIAC increases with SSA before 0.96. The mean bias of MAIAC is negative when the SSA is lower than 0.91; otherwise, it is positive. It changes slightly when the SSA is greater than 0.96.
4. Discussion
MODIS products have been extensively evaluated and verified at both global and regional scales. Many scholars have compared the accuracy of MODIS DT, DB, and MAIAC aerosol products and found that MAIAC products have greater advantages in terms of matched number, with more than double those of the DB and DT AOD, and they show higher accuracy [17,19], which matches our findings in the YRD (Table 3). MODIS DT AOD is generally overestimated, while DB AOD is mostly underestimated [24]. MODIS products in the YRD also show a similar phenomenon. However, the Within EE of DT AOD in the YRD is only 41.43%, which is significantly lower than those in other regions [54]. There are only 320 matching data points at HZZ, LATM, and QDH for forest, accounting for 8.4% of the total matching number of DT, while SH and TH with higher urban and water proportions have 943 matching data points, which are about three times those of the forest sites. Therefore, the accuracy of DT products in the YRD is low, but the accuracy of DT products for forest in the YRD is relatively high, with a Within EE of 68.75% (Table 4). The Within EE of DT for cropland is 53.59%, which is obviously lower than that for forest, which may be due to the high urban presence in the two cropland sites, where the proportion of urban in HF is 33.41%. As can be seen from Figure 1, the southern YRD is dominated by forest, while the northern YRD is dominated by cropland. The whole YRD is covered by about 43% forest, 45% cropland, and only 10% urban and water. Therefore, the accuracy of DT in the YRD should be high. In addition, we found that the accuracy of MAIAC in the YRD in summer is significantly lower than that in other seasons, so the DT AOD in summer can be used to make up for the low accuracy of MAIAC in summer.
5. Conclusions
In this study, the overall accuracy and seasonal variations in MODIS DT, DB, and MAIAC products in the YRD were analyzed based on AERONET and SONET ground monitoring data. The influences of land cover type, observation geometry, and aerosol type on AOD retrieval accuracy were also explored. LCPUW and LCPU were used to correct DT and DB products. The conclusions are as follows.
The MAIAC product is obviously superior to the DT and DB products in matched number and accuracy. The accuracy of DT product varies most obviously with seasons, and it has the highest accuracy in winter and the lowest in spring. The accuracy of DB and MAIAC is low in summer and high in other seasons.
The accuracy of MAIAC is higher in forests, cropland, and mixed land cover types with high vegetation proportions, and the accuracy is lowest in water. The accuracy of the DT product is negatively correlated with LCPUW (R2 = 0.892). The accuracy of DT AOD decreases gradually with the increase in urban and water proportion. A significant linear relationship exists between the accuracy of the DB product and the LCPU (R2 = 0.936), as the accuracy increases with the rise in LCPU.
A correction method based on bias and MRE can significantly improve the accuracy of DT products, especially the accuracy at TH and SH with large LCPUW. The MRE correction method works very well at low AOD, but it amplifies the error at high AOD values. The correction method also works well for DB AOD with low LCPU, but it amplifies the error for DB AOD with high LCPU.
The effect of SZA on accuracy is stronger than that of VZA, and the accuracy increases with the rise in SZA. The accuracy is the lowest when SA is high, but it is high when the RAA is close to vertical.
The bias of MAIAC increases with the rise in AE. The change in bias for the three algorithms with SSA is more obvious than that with AE. Notably, mean bias increases and then flattens with the rise in SSA.
Author Contributions
Conceptualization, methodology, writing, J.J.; writing, J.L. and D.J.; writing—review and editing, Y.Z. and S.C. All authors have read and agreed to the published version of the manuscript.
Funding
This research was funded by NUPTSF, grant number NY220211.
Data Availability Statement
The MODIS Collection 6.1 aerosol product (MOD04_L2 and MYD04_L2), MODIS Collection 6 aerosol product (MCD19A2) and MODIS Collection 6 land cover type product (MCD12Q1) are available at https://ladsweb.modaps.eosdis.nasa.gov/search/, accessed on 20 August 2021. The AERONET product is available at https://aeronet.gsfc.nasa.gov/, accessed on 20 August 2021.
Conflicts of Interest
The authors declare no conflict of interest.
References
- Li, Z.Q.; Guo, J.P.; Ding, A.J.; Liao, H.; Liu, J.J.; Sun, Y.L.; Wang, T.J.; Xue, H.W.; Zhang, H.S.; Zhu, B. Aerosol and boundary-layer interactions and impact on air quality. Natl. Sci. Rev. 2017, 4, 810–833. [Google Scholar] [CrossRef]
- Kaufman, Y.J.; Tanré, D.; Boucher, O. A satellite view of aerosols in the climate system. Nature 2002, 419, 215–223. [Google Scholar] [CrossRef]
- Haywood, J.; Boucher, O. Estimates of the direct and indirect radiative forcing due to tropospheric aerosols: A review. Rev. Geophys. 2000, 38, 513–543. [Google Scholar] [CrossRef]
- Rosenfeld, D.; Lohmann, U.; Raga, G.B.; O’Dowd, C.D.; Kulmala, M.; Fuzzi, S.; Reissell, A.; Andreae, M.O. Flood or drought: How do aerosols affect precipitation? Science 2008, 321, 1309–1313. [Google Scholar] [CrossRef]
- Bellouin, N.; Quaas, J.; Gryspeerdt, E.; Kinne, S.; Stier, P.; Watson-Parris, D.; Boucher, O.; Carslaw, K.S.; Christensen, M.; Daniau, A.L.; et al. Bounding Global Aerosol Radiative Forcing of Climate Change. Rev. Geophys. 2020, 58, e2019RG000660. [Google Scholar] [CrossRef]
- Sun, J.M.; Ariya, P.A. Atmospheric organic and bio-aerosols as cloud condensation nuclei (CCN): A review. Atmos. Environ. 2006, 40, 795–820. [Google Scholar] [CrossRef]
- Mehta, M.; Singh, R.; Singh, A.; Singh, N.; Anshumali. Recent global aerosol optical depth variations and trends—A comparative study using MODIS and MISR level 3 datasets. Remote Sens. Environ. 2016, 181, 137–150. [Google Scholar] [CrossRef]
- Hsu, N.C.; Herman, J.R.; Torres, O.; Holben, B.N.; Tanre, D.; Eck, T.F.; Lavenu, F. Comparisons of the TOMS aerosol index with Sun-photometer aerosol optical thickness: Results and applications. J. Geophys. Res. 1999, 104, 6269–6279. [Google Scholar] [CrossRef]
- Butt, E.W.; Rap, A.; Schmidt, A.; Scott, C.E.; Pringle, K.J.; Reddington, C.L.; Richards, N.A.D.; Woodhouse, M.T.; Ramirez-Villegas, J.; Yang, H.; et al. The impact of residential combustion emissions on atmospheric aerosol, human health, and climate. Atmos. Chem. Phys. 2016, 16, 873–905. [Google Scholar] [CrossRef]
- Gupta, P.; Christopher, S.A.; Wang, J.; Gehrig, R.; Lee, Y.; Kumar, N. Satellite remote sensing of particulate matter and air quality assessment over global cities. Atmos. Environ. 2006, 40, 5880–5892. [Google Scholar] [CrossRef]
- Martin, R.V. Satellite remote sensing of surface air quality. Atmos. Environ. 2008, 42, 7823–7843. [Google Scholar] [CrossRef]
- Remer, L.A.; Kaufman, Y.J.; Tanre, D.; Mattoo, S.; Chu, D.A.; Martins, J.V.; Li, R.R.; Ichoku, C.; Levy, R.C.; Kleidman, R.G.; et al. The MODIS aerosol algorithm, products, and validation. J. Atmos. Sci. 2005, 62, 947–973. [Google Scholar] [CrossRef]
- Levy, R.C.; Remer, L.A.; Dubovik, O. Global aerosol optical properties and application to Moderate Resolution Imaging Spectroradiometer aerosol retrieval over land. J. Geophys. Res. Atmos. 2007, 112, 1–15. [Google Scholar] [CrossRef]
- Li, Z.; Zhao, X.; Kahn, R.; Mishchenko, M.; Remer, L.; Lee, K.H.; Wang, M.; Laszlo, I.; Nakajima, T.; Maring, H. Uncertainties in satellite remote sensing of aerosols and impact on monitoring its long-term trend: A review and perspective. Ann. Geophys. 2009, 27, 2755–2770. [Google Scholar] [CrossRef]
- Povey, A.C.; Grainger, R.G. Known and unknown unknowns: Uncertainty estimation in satellite remote sensing. Atmos. Meas. Tech. 2015, 8, 4699–4718. [Google Scholar] [CrossRef]
- Xiao, Q.; Zhang, H.; Choi, M.; Li, S.; Kondragunta, S.; Kim, J.; Holben, B.; Levy, R.C.; Liu, Y. Evaluation of VIIRS, GOCI, and MODIS Collection 6 AOD retrievals against ground sunphotometer observations over East Asia. Atmos. Chem. Phys. 2016, 16, 1255–1269. [Google Scholar] [CrossRef]
- Zhang, Z.Y.; Wu, W.L.; Fan, M.; Wei, J.; Tan, Y.H.; Wang, Q. Evaluation of MAIAC aerosol retrievals over China. Atmos. Environ. 2019, 202, 8–16. [Google Scholar] [CrossRef]
- Li, B.; Yuan, H.; Feng, N.; Tao, S. Comparing MODIS and AERONET aerosol optical depth over China. Int. J. Remote Sens. 2009, 30, 6519–6529. [Google Scholar] [CrossRef]
- Drury, E.; Jacob, D.J.; Wang, J.; Spurr, R.J.D.; Chance, K. Improved algorithm for MODIS satellite retrievals of aerosol optical depths over western North America. J. Geophys. Res. Atmos. 2008, 113, D16204. [Google Scholar] [CrossRef]
- Ganzeveld, L.; Bouwman, L.; Stehfest, E.; van Vuuren, D.P.; Eickhout, B.; Lelieveld, J. Impact of future land use and land cover changes on atmospheric chemistry-climate interactions. J. Geophys. Res. Atmos 2010, 115, D23301. [Google Scholar] [CrossRef]
- Wang, Y.; Yuan, Q.Q.; Li, T.W.; Shen, H.F.; Zheng, L.; Zhang, L.P. Evaluation and comparison of MODIS Collection 6.1 aerosol optical depth against AERONET over regions in China with multifarious underlying surfaces. Atmos. Environ. 2019, 200, 280–301. [Google Scholar] [CrossRef]
- Liu, J.; Ding, J.; Li, L.; Li, X.; Zhang, Z.; Ran, S.; Ge, X.; Zhang, J.; Wang, J. Characteristics of aerosol optical depth over land types in central Asia. Sci. Total Environ. 2020, 727, 138676. [Google Scholar] [CrossRef] [PubMed]
- Yang, Y.; Cermak, J.; Yang, K.; Pauli, E.; Chen, Y. Land Use and Land Cover Influence on Sentinel-2 Aerosol Optical Depth below City Scales over Beijing. Remote Sens. 2022, 14, 4677. [Google Scholar] [CrossRef]
- Sun, K.; Gao, Y.; Qi, B.; Yu, Z.F. The Influence of Underlying Land Cover on the Accuracy of MODIS C6.1 Aerosol Products-A Case Study over the Yangtze River Delta Region of China. Remote Sens. 2022, 14, 938. [Google Scholar] [CrossRef]
- Zhang, M.; Ma, Y.Y.; Wang, L.C.; Gong, W.; Hu, B.; Shi, Y.F. Spatial-temporal characteristics of aerosol loading over the Yangtze River Basin during 2001–2015. Int. J. Climatol. 2018, 38, 2138–2152. [Google Scholar] [CrossRef]
- Li, L.; Chen, C.H.; Fu, J.S.; Huang, C.; Streets, D.G.; Huang, H.Y.; Zhang, G.F.; Wang, Y.; Jang, C.; Wang, H.L. Air quality and emissions in the Yangtze River Delta, China. Atmos. Chem. Phys. 2010, 11, 1621–1639. [Google Scholar] [CrossRef]
- Ma, J.Z.; Xu, X.B.; Zhao, C.S.; Yan, P. A review of atmospheric chemistry research in China: Photochemical smog, haze pollution, and gas-aerosol interactions. Adv. Atmos. Sci. 2012, 29, 1006–1026. [Google Scholar] [CrossRef]
- Huang, R.J.; Zhang, Y.L.; Bozzetti, C.; Ho, K.F.; Cao, J.J.; Han, Y.M.; Daellenbach, K.R.; Slowik, J.G.; Platt, S.M.; Canonaco, F.; et al. High secondary aerosol contribution to particulate pollution during haze events in China. Nature 2014, 514, 218–222. [Google Scholar] [CrossRef]
- Li, J.; Jiang, L.; Chen, C.; Liu, D.T.; Du, S.S.; Zhang, Y.J.; Yang, Y.F.; Tang, L.L. Characteristics and Sources of Black Carbon Aerosol in a Mega-City in the Western Yangtze River Delta, China. Atmosphere 2020, 11, 315. [Google Scholar] [CrossRef]
- Barnes, W.L.; Pagano, T.S.; Salomonson, V.V. Prelaunch characteristics of the Moderate Resolution Imaging Spectroradiometer (MODIS) on EOS-AM1. IEEE T. Geosci. Remote 1998, 36, 1088–1100. [Google Scholar] [CrossRef]
- Levy, R.C.; Mattoo, S.; Munchak, L.A.; Remer, L.A.; Sayer, A.M.; Patadia, F.; Hsu, N.C. The Collection 6 MODIS aerosol products over land and ocean. Atmos. Meas. Tech. 2013, 6, 2989–3034. [Google Scholar] [CrossRef]
- Tian, X.; Gao, Z. Validation and Accuracy Assessment of MODIS C6.1 Aerosol Products over the Heavy Aerosol Loading Area. Atmosphere 2019, 10, 548. [Google Scholar] [CrossRef]
- Lyapustin, A.; Wang, Y.J.; Korkin, S.; Huang, D. MODIS Collection 6 MAIAC algorithm. Atmos. Meas. Tech. 2018, 11, 5741–5765. [Google Scholar] [CrossRef]
- Kaufman, Y.J.; Tanre, D.; Remer, L.A.; Vermote, E.F.; Chu, A.; Holben, B.N. Operational remote sensing of tropospheric aerosol over land from EOS moderate resolution imaging spectroradiometer. J. Geophys. Res. Atmos. 1997, 102, 17051–17067. [Google Scholar] [CrossRef]
- Remer, L.A.; Levy, R.C.; Mattoo, S.; Tanre, D.; Gupta, P.; Shi, Y.X.; Sawyer, V.; Munchak, L.A.; Zhou, Y.P.; Kim, M.; et al. The Dark Target Algorithm for Observing the Global Aerosol System: Past, Present, and Future. Remote Sens. 2020, 12, 2900. [Google Scholar] [CrossRef]
- Levy, R.C.; Remer, L.A.; Mattoo, S.; Vermote, E.F.; Kaufman, Y.J. Second-generation operational algorithm: Retrieval of aerosol properties over land from inversion of Moderate Resolution Imaging Spectroradiometer spectral reflectance. J. Geophys. Res.-Atmos. 2007, 112, D13211. [Google Scholar] [CrossRef]
- Gupta, P.; Levy, R.C.; Mattoo, S.; Remer, L.A.; Munchak, L.A. A surface reflectance scheme for retrieving aerosol optical depth over urban surfaces in MODIS Dark Target retrieval algorithm. Atmos. Meas. Tech. 2016, 9, 3293–3308. [Google Scholar] [CrossRef]
- Hsu, N.C.; Tsay, S.C.; King, M.D.; Herman, J.R. Aerosol properties over bright-reflecting source regions. IEEE T. Geosci. Remote 2004, 42, 557–569. [Google Scholar] [CrossRef]
- Hsu, N.C.; Tsay, S.C.; King, M.D.; Herman, J.R. Deep blue retrievals of Asian aerosol properties during ACE-Asia. IEEE Trans. Geosci. Remote 2006, 44, 3180–3195. [Google Scholar] [CrossRef]
- Hsu, N.C.; Jeong, M.J.; Bettenhausen, C.; Sayer, A.M.; Hansell, R.; Seftor, C.S.; Huang, J.; Tsay, S.C. Enhanced Deep Blue aerosol retrieval algorithm: The second generation. J. Geophys. Res. Atmos. 2013, 118, 9296–9315. [Google Scholar] [CrossRef]
- Hsu, N.C.; Lee, J.; Sayer, A.M.; Carletta, N.; Chen, S.H.; Tucker, C.J.; Holben, B.N.; Tsay, S.C. Retrieving near-global aerosol loading over land and ocean from AVHRR. J. Geophys. Res. Atmos. 2017, 122, 9968–9989. [Google Scholar] [CrossRef]
- Lyapustin, A.; Martonchik, J.; Wang, Y.J.; Laszlo, I.; Korkin, S. Multiangle implementation of atmospheric correction (MAIAC): 1. Radiative transfer basis and look-up tables. J. Geophys. Res. Atmos. 2011, 116, D03210. [Google Scholar] [CrossRef]
- Lyapustin, A.; Wang, Y.; Laszlo, I.; Kahn, R.; Korkin, S.; Remer, L.; Levy, R.; Reid, J.S. Multiangle implementation of atmospheric correction (MAIAC): 2. Aerosol algorithm. J. Geophys. Res. Atmos. 2011, 116, D03211. [Google Scholar] [CrossRef]
- Holben, B.N.; Eck, T.F.; Slutsker, I.; Tanre, D.; Buis, J.P.; Setzer, A.; Vermote, E.; Reagan, J.A.; Kaufman, Y.J.; Nakajima, T.; et al. AERONET—A federated instrument network and data archive for aerosol characterization. Remote Sens. Environ. 1998, 66, 1–16. [Google Scholar] [CrossRef]
- Dubovik, O.; King, M.D. A flexible inversion algorithm for retrieval of aerosol optical properties from Sun and sky radiance measurements. J. Geophys. Res. Atmos. 2000, 105, 20673–20696. [Google Scholar] [CrossRef]
- Smirnov, A.; Holben, B.N.; Eck, T.F.; Dubovik, O.; Slutsker, I. Cloud-screening and quality control algorithms for the AERONET database. Remote Sens. Environ. 2000, 73, 337–349. [Google Scholar] [CrossRef]
- Li, Z.Q. Sun-sky radiometer observation network with the extension of multi-wavelength polarization measurements. J. Remote Sens. 2015, 19, 495–519. [Google Scholar]
- Li, Z.Q.; Xu, H.; Li, K.T.; Li, D.H.; Xie, Y.S.; Li, L.; Zhang, Y.; Gu, X.F.; Zhao, W.; Tian, Q.J.; et al. Comprehensive Study of Optical, Physical, Chemical, and Radiative Properties of Total Columnar Atmospheric Aerosols over China: An Overview of Sun–Sky Radiometer Observation Network (SONET) Measurements. Bull. Am. Meteorol. Soc. 2018, 99, 739–755. [Google Scholar] [CrossRef]
- Sulla-Menashe, D.; Gray, J.M.; Abercrombie, S.P.; Friedl, M.A. Hierarchical mapping of annual global land cover 2001 to present: The MODIS Collection 6 Land Cover product. Remote Sens. Environ. 2019, 222, 183–194. [Google Scholar] [CrossRef]
- Mhawish, A.; Banerjee, T.; Sorek-Hamer, M.; Lyapustin, A.; Broday, D.M.; Chatfield, R. Comparison and evaluation of MODIS Multi-angle Implementation of Atmospheric Correction (MAIAC) aerosol product over South Asia. Remote Sens. Environ. 2019, 224, 12–28. [Google Scholar] [CrossRef]
- Sayer, A.M.; Hsu, N.C.; Bettenhausen, C.; Jeong, M.-J. Validation and uncertainty estimates for MODIS Collection 6 “Deep Blue” aerosol data. J. Geophys. Res. Atmos. 2013, 118, 7864–7872. [Google Scholar] [CrossRef]
- Sayer, A.M.; Munchak, L.A.; Hsu, N.C.; Levy, R.C.; Bettenhausen, C.; Jeong, M.J. MODIS Collection 6 aerosol products: Comparison between Aqua’s e-Deep Blue, Dark Target, and “merged” data sets, and usage recommendations. J. Geophys. Res. Atmos. 2014, 119, 13965–13989. [Google Scholar] [CrossRef]
- Wei, J.; Li, Z.Q.; Peng, Y.R.; Sun, L. MODIS Collection 6.1 aerosol optical depth products over land and ocean: Validation and comparison. Atmos. Environ. 2019, 201, 428–440. [Google Scholar] [CrossRef]
- Liu, N.; Zou, B.; Feng, H.H.; Wang, W.; Tang, Y.Q.; Liang, Y. Evaluation and comparison of multiangle implementation of the atmospheric correction algorithm, Dark Target, and Deep Blue aerosol products over China. Atmos. Chem. Phys. 2019, 19, 8243–8268. [Google Scholar] [CrossRef]
Disclaimer/Publisher’s Note: The statements, opinions and data contained in all publications are solely those of the individual author(s) and contributor(s) and not of MDPI and/or the editor(s). MDPI and/or the editor(s) disclaim responsibility for any injury to people or property resulting from any ideas, methods, instructions or products referred to in the content. |
© 2023 by the authors. Licensee MDPI, Basel, Switzerland. This article is an open access article distributed under the terms and conditions of the Creative Commons Attribution (CC BY) license (https://creativecommons.org/licenses/by/4.0/).