
Decision Tree and Random Forest Classification Algorithms for Mangrove Forest Mapping in Sembilang National Park, Indonesia


Abstract
1. Introduction
2. Materials and Methods
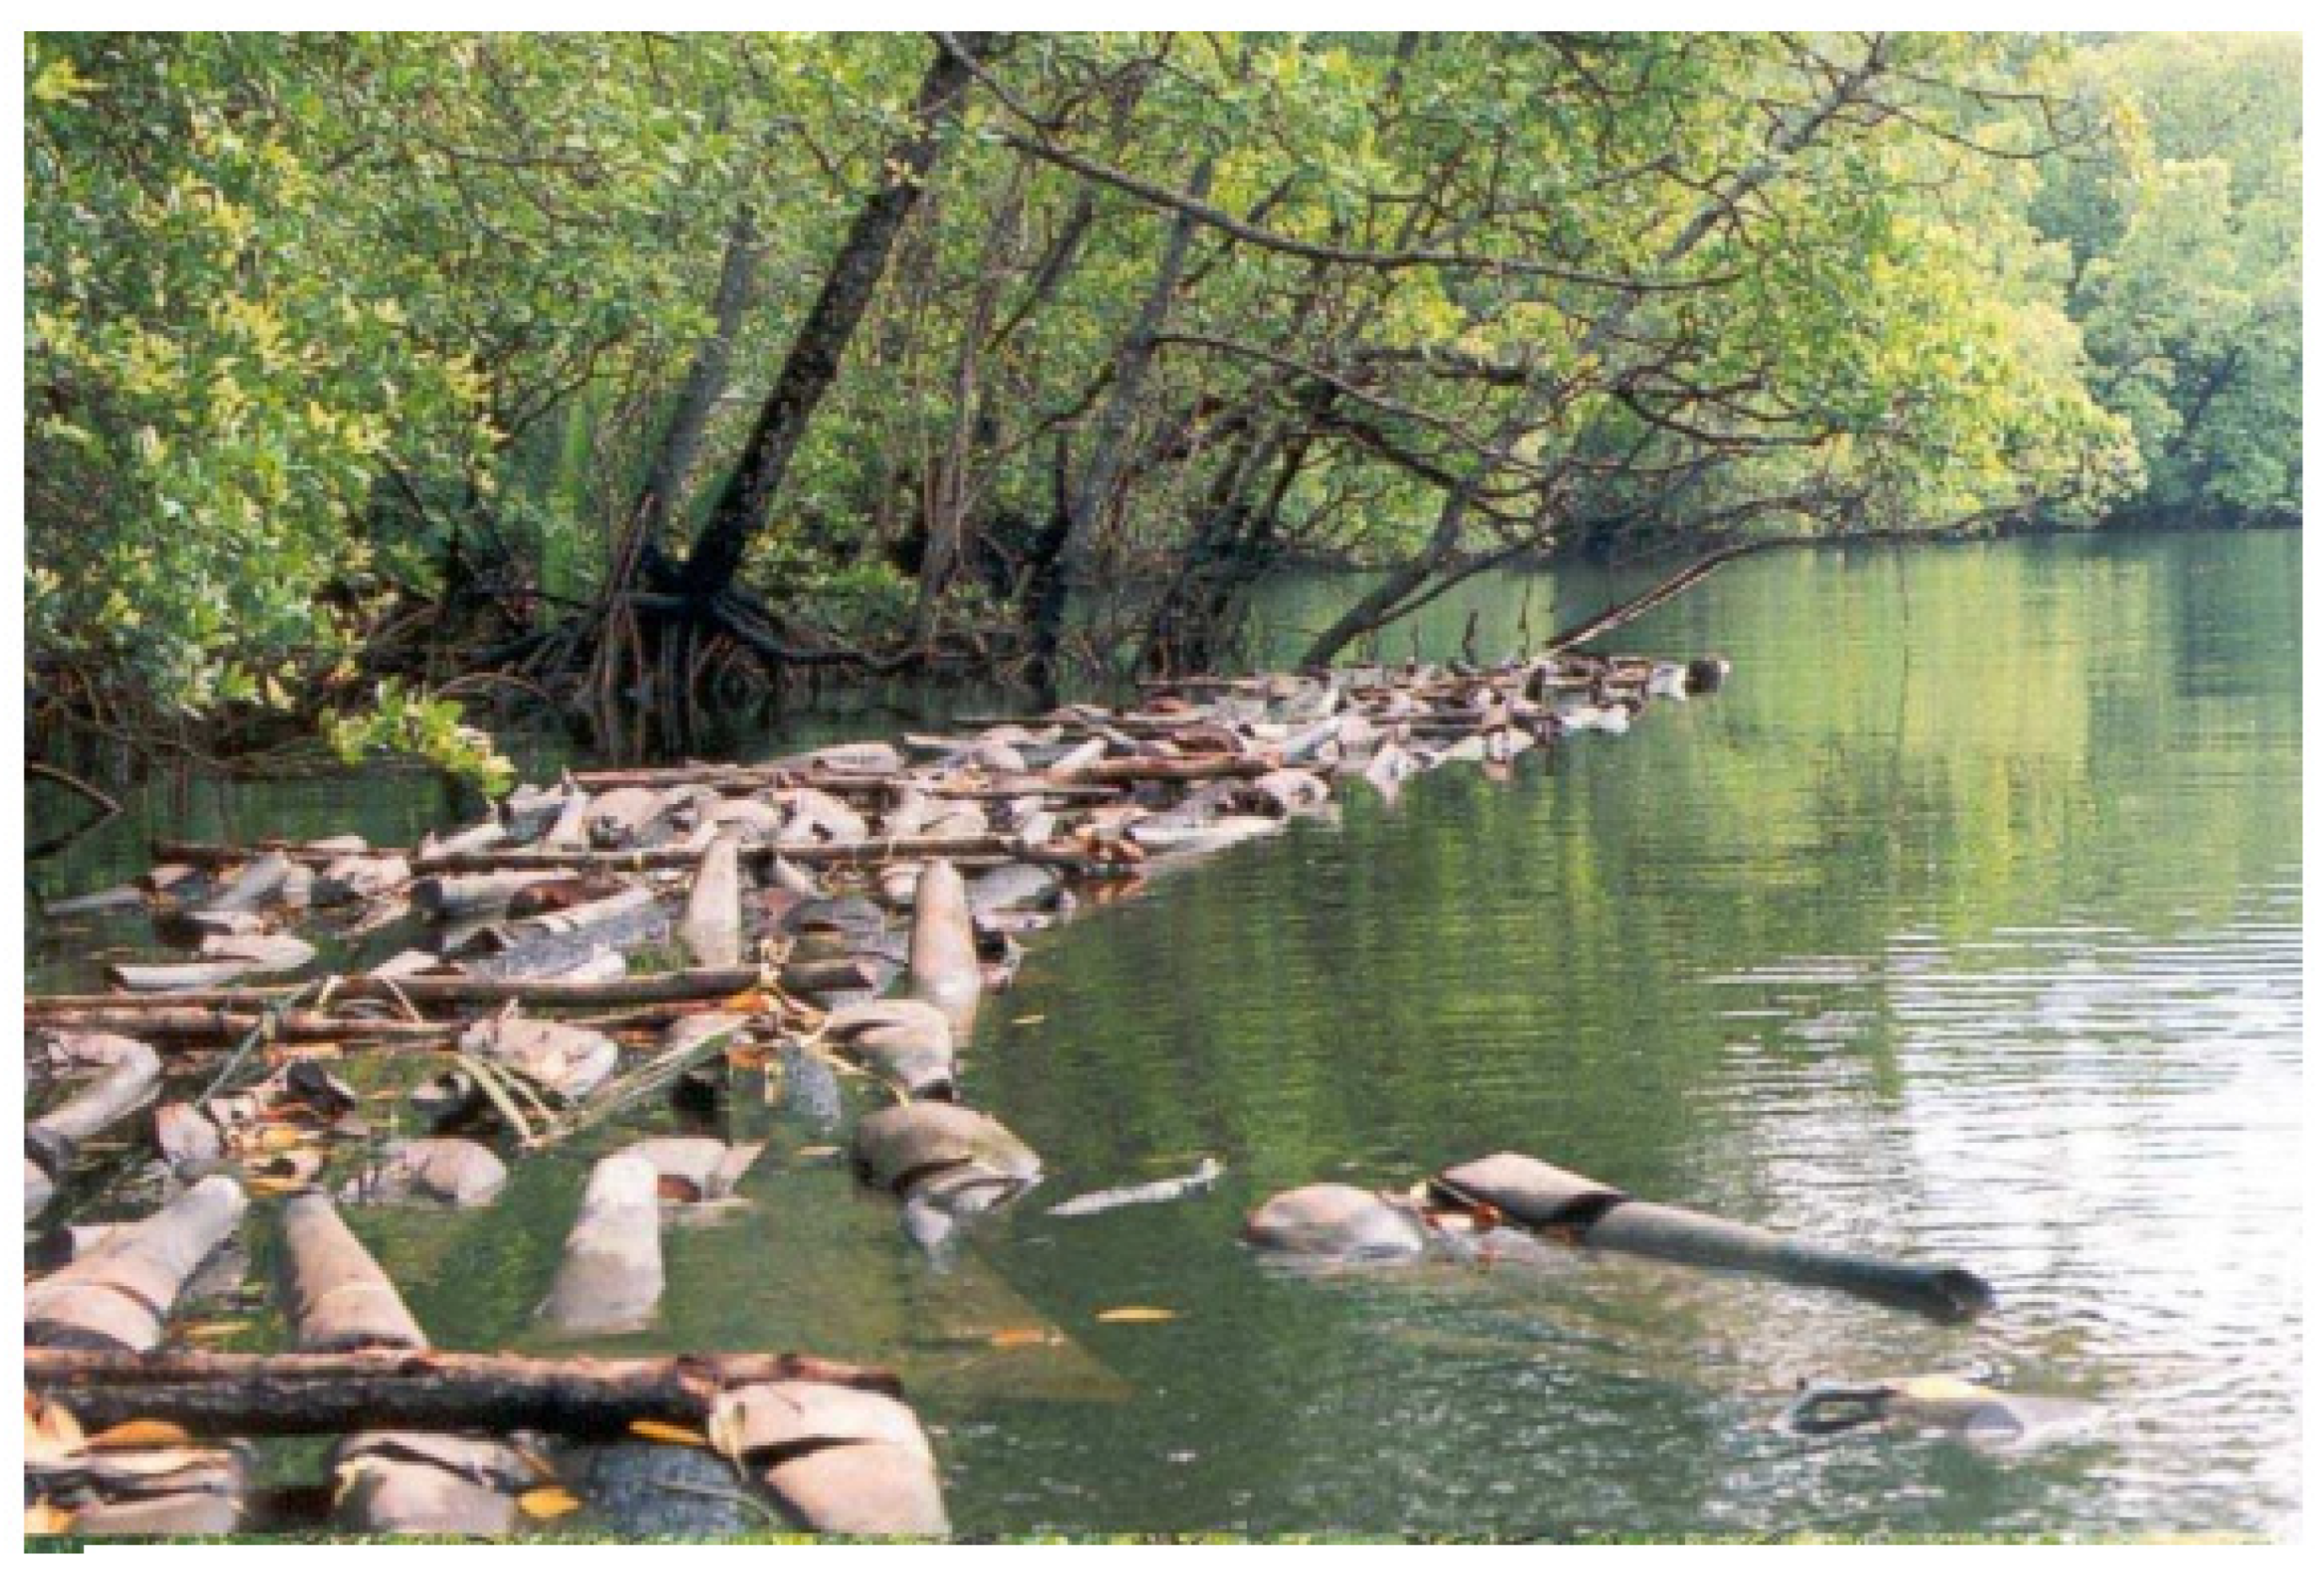
2.1. Study Area
2.2. Satellite Data
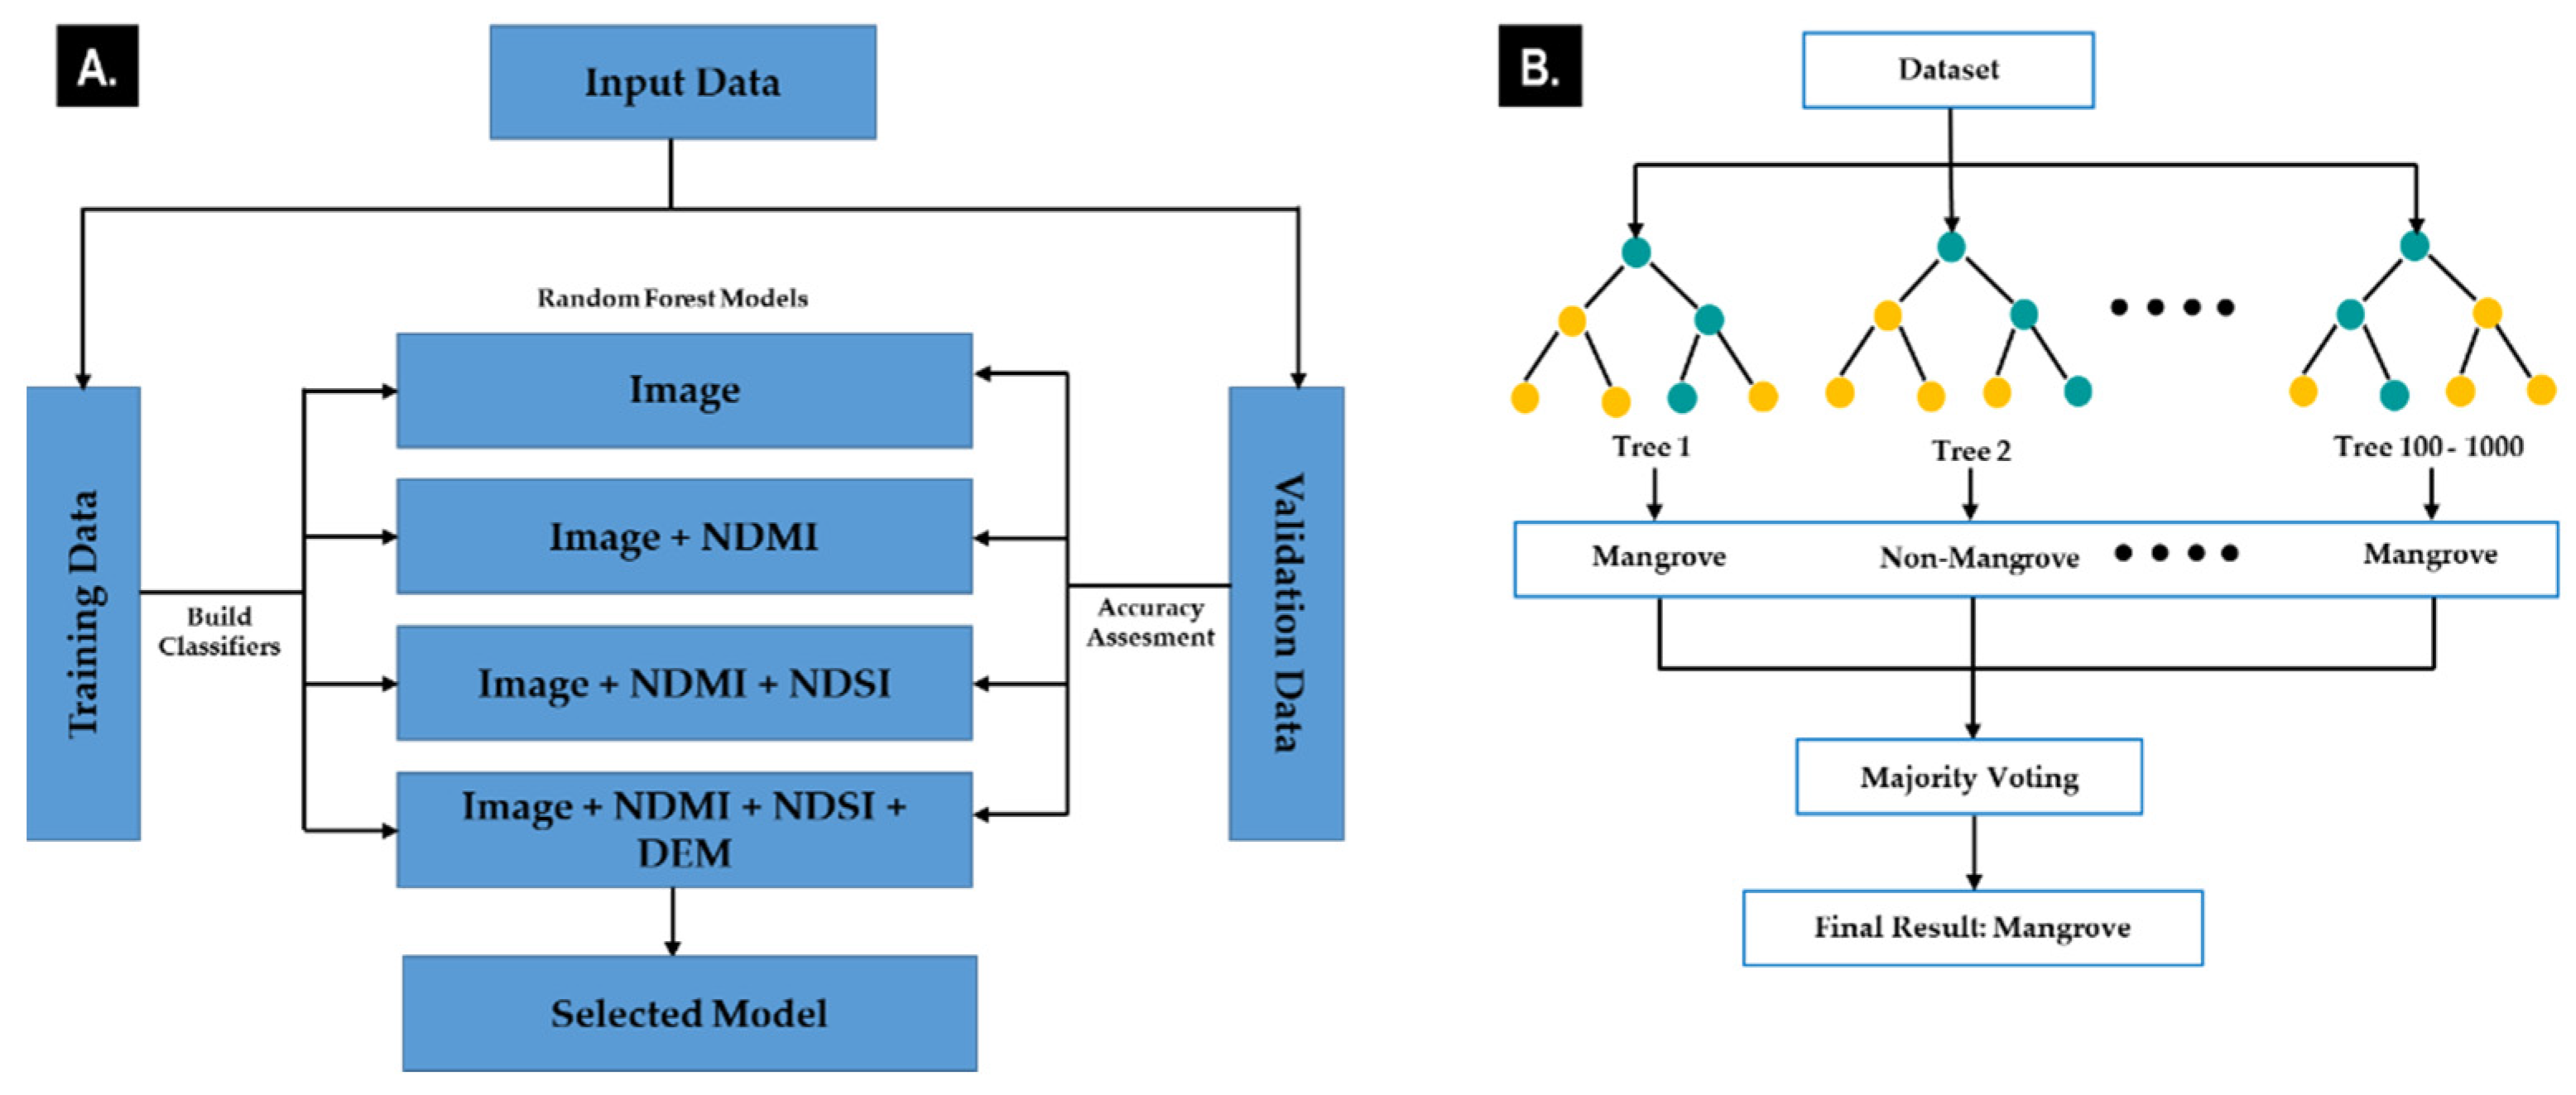
2.3. Method
2.3.1. Pre-Processing
2.3.2. Spectral Indices
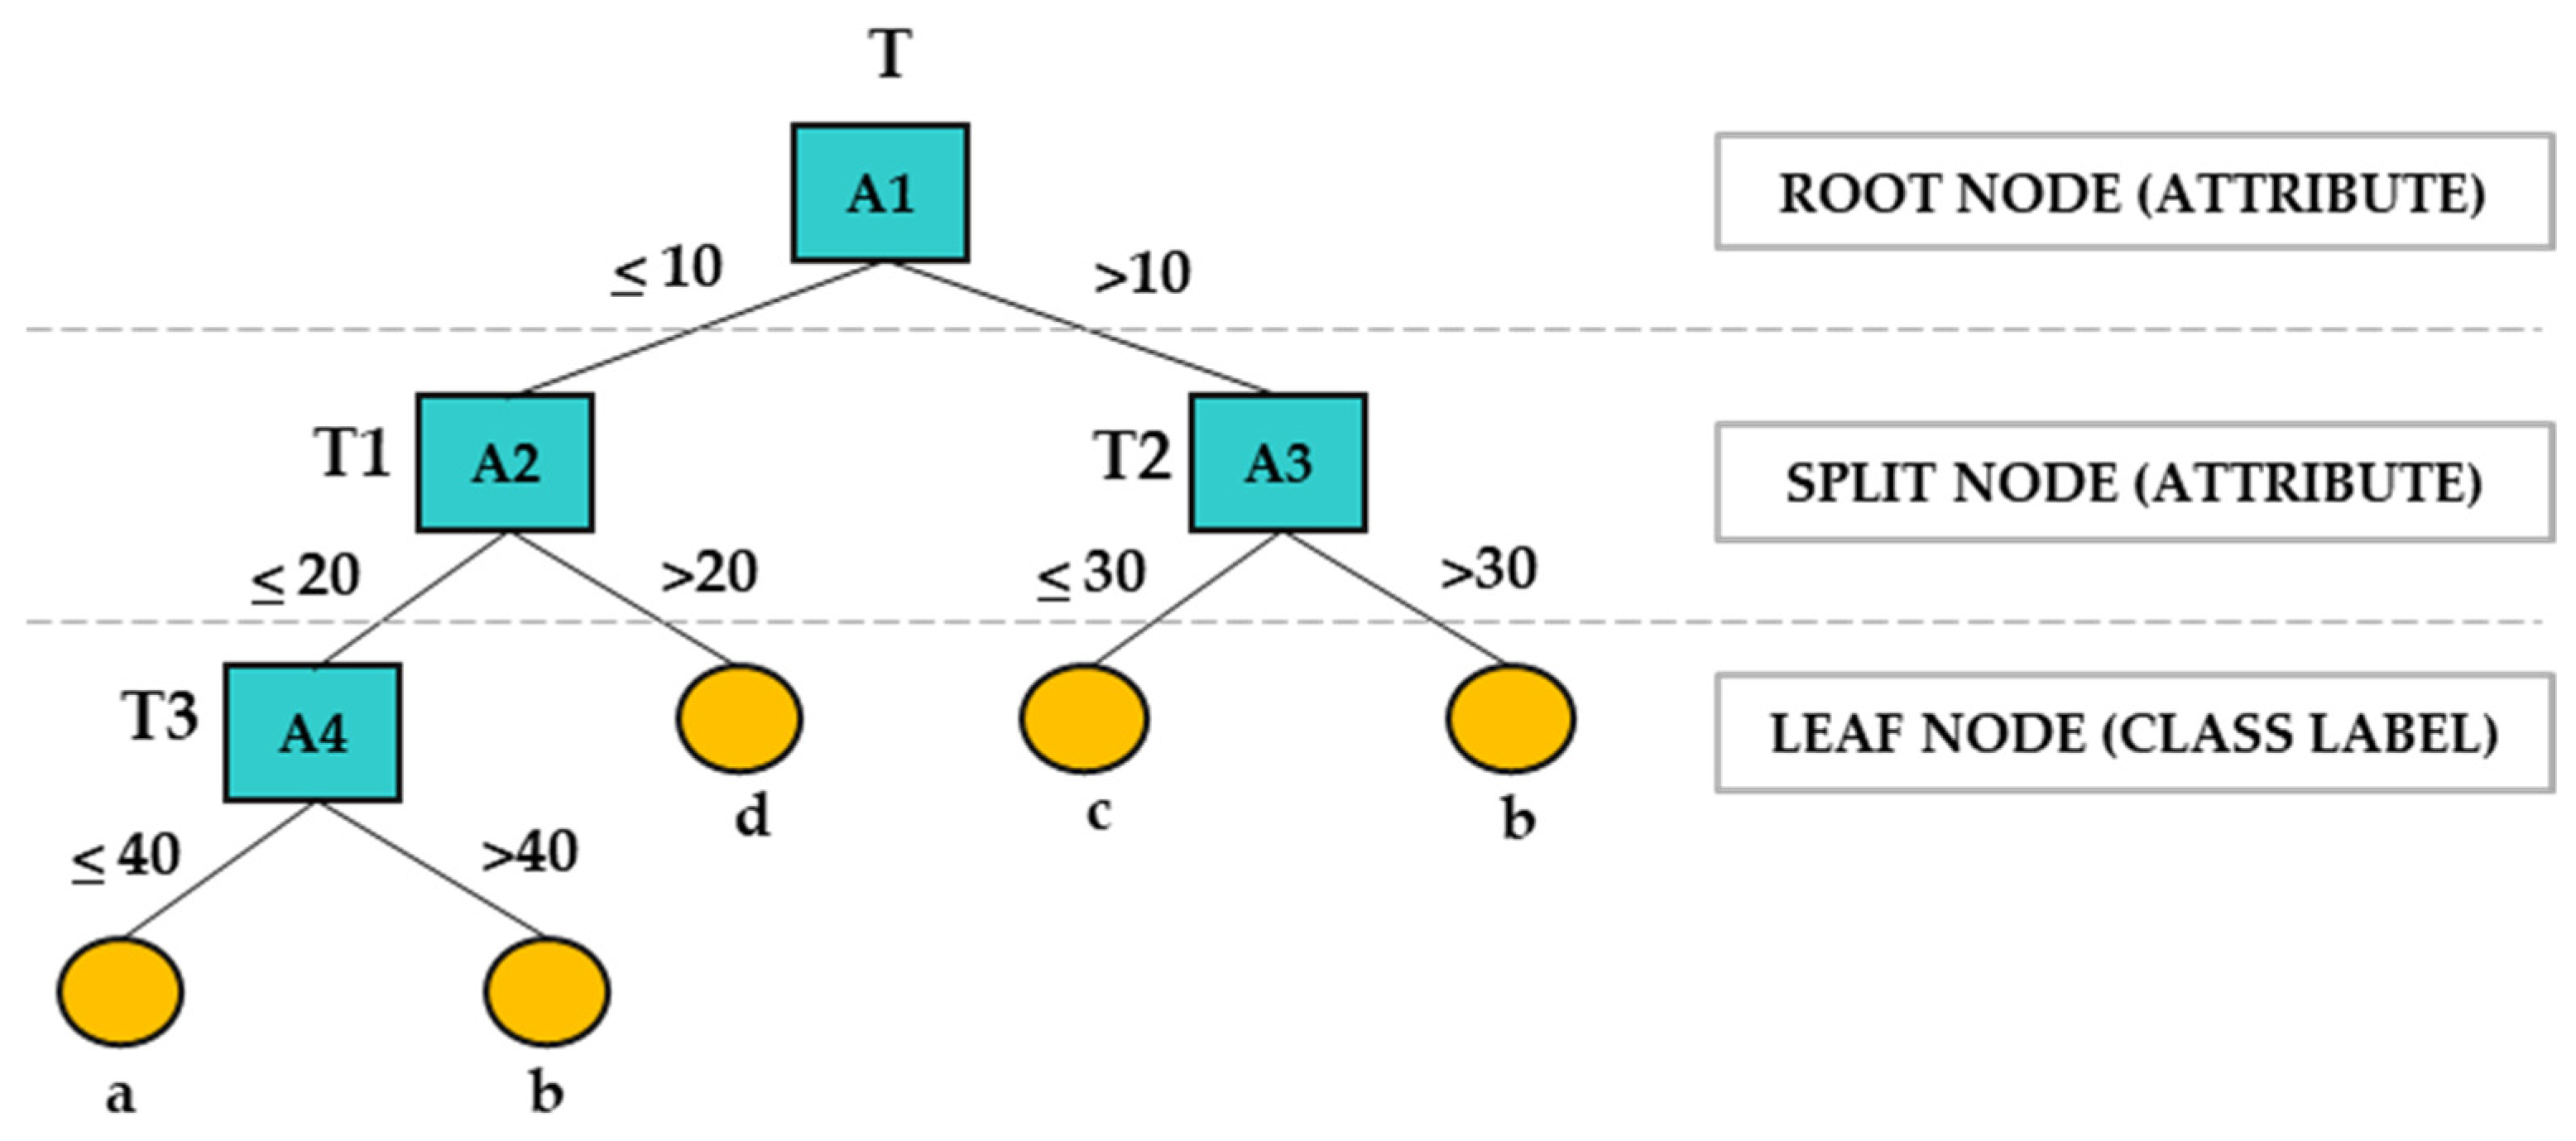
2.3.3. Decision Tree Algorithm
- (1)
- IF: (A1 > 10) and (A3 ≤ 30) THEN class = c
- (2)
- IF: (A1 ≤ 10) and (A2 ≤ 20) and (A4 > 40) THEN class = b
2.3.4. Random Forest Algorithm
3. Results
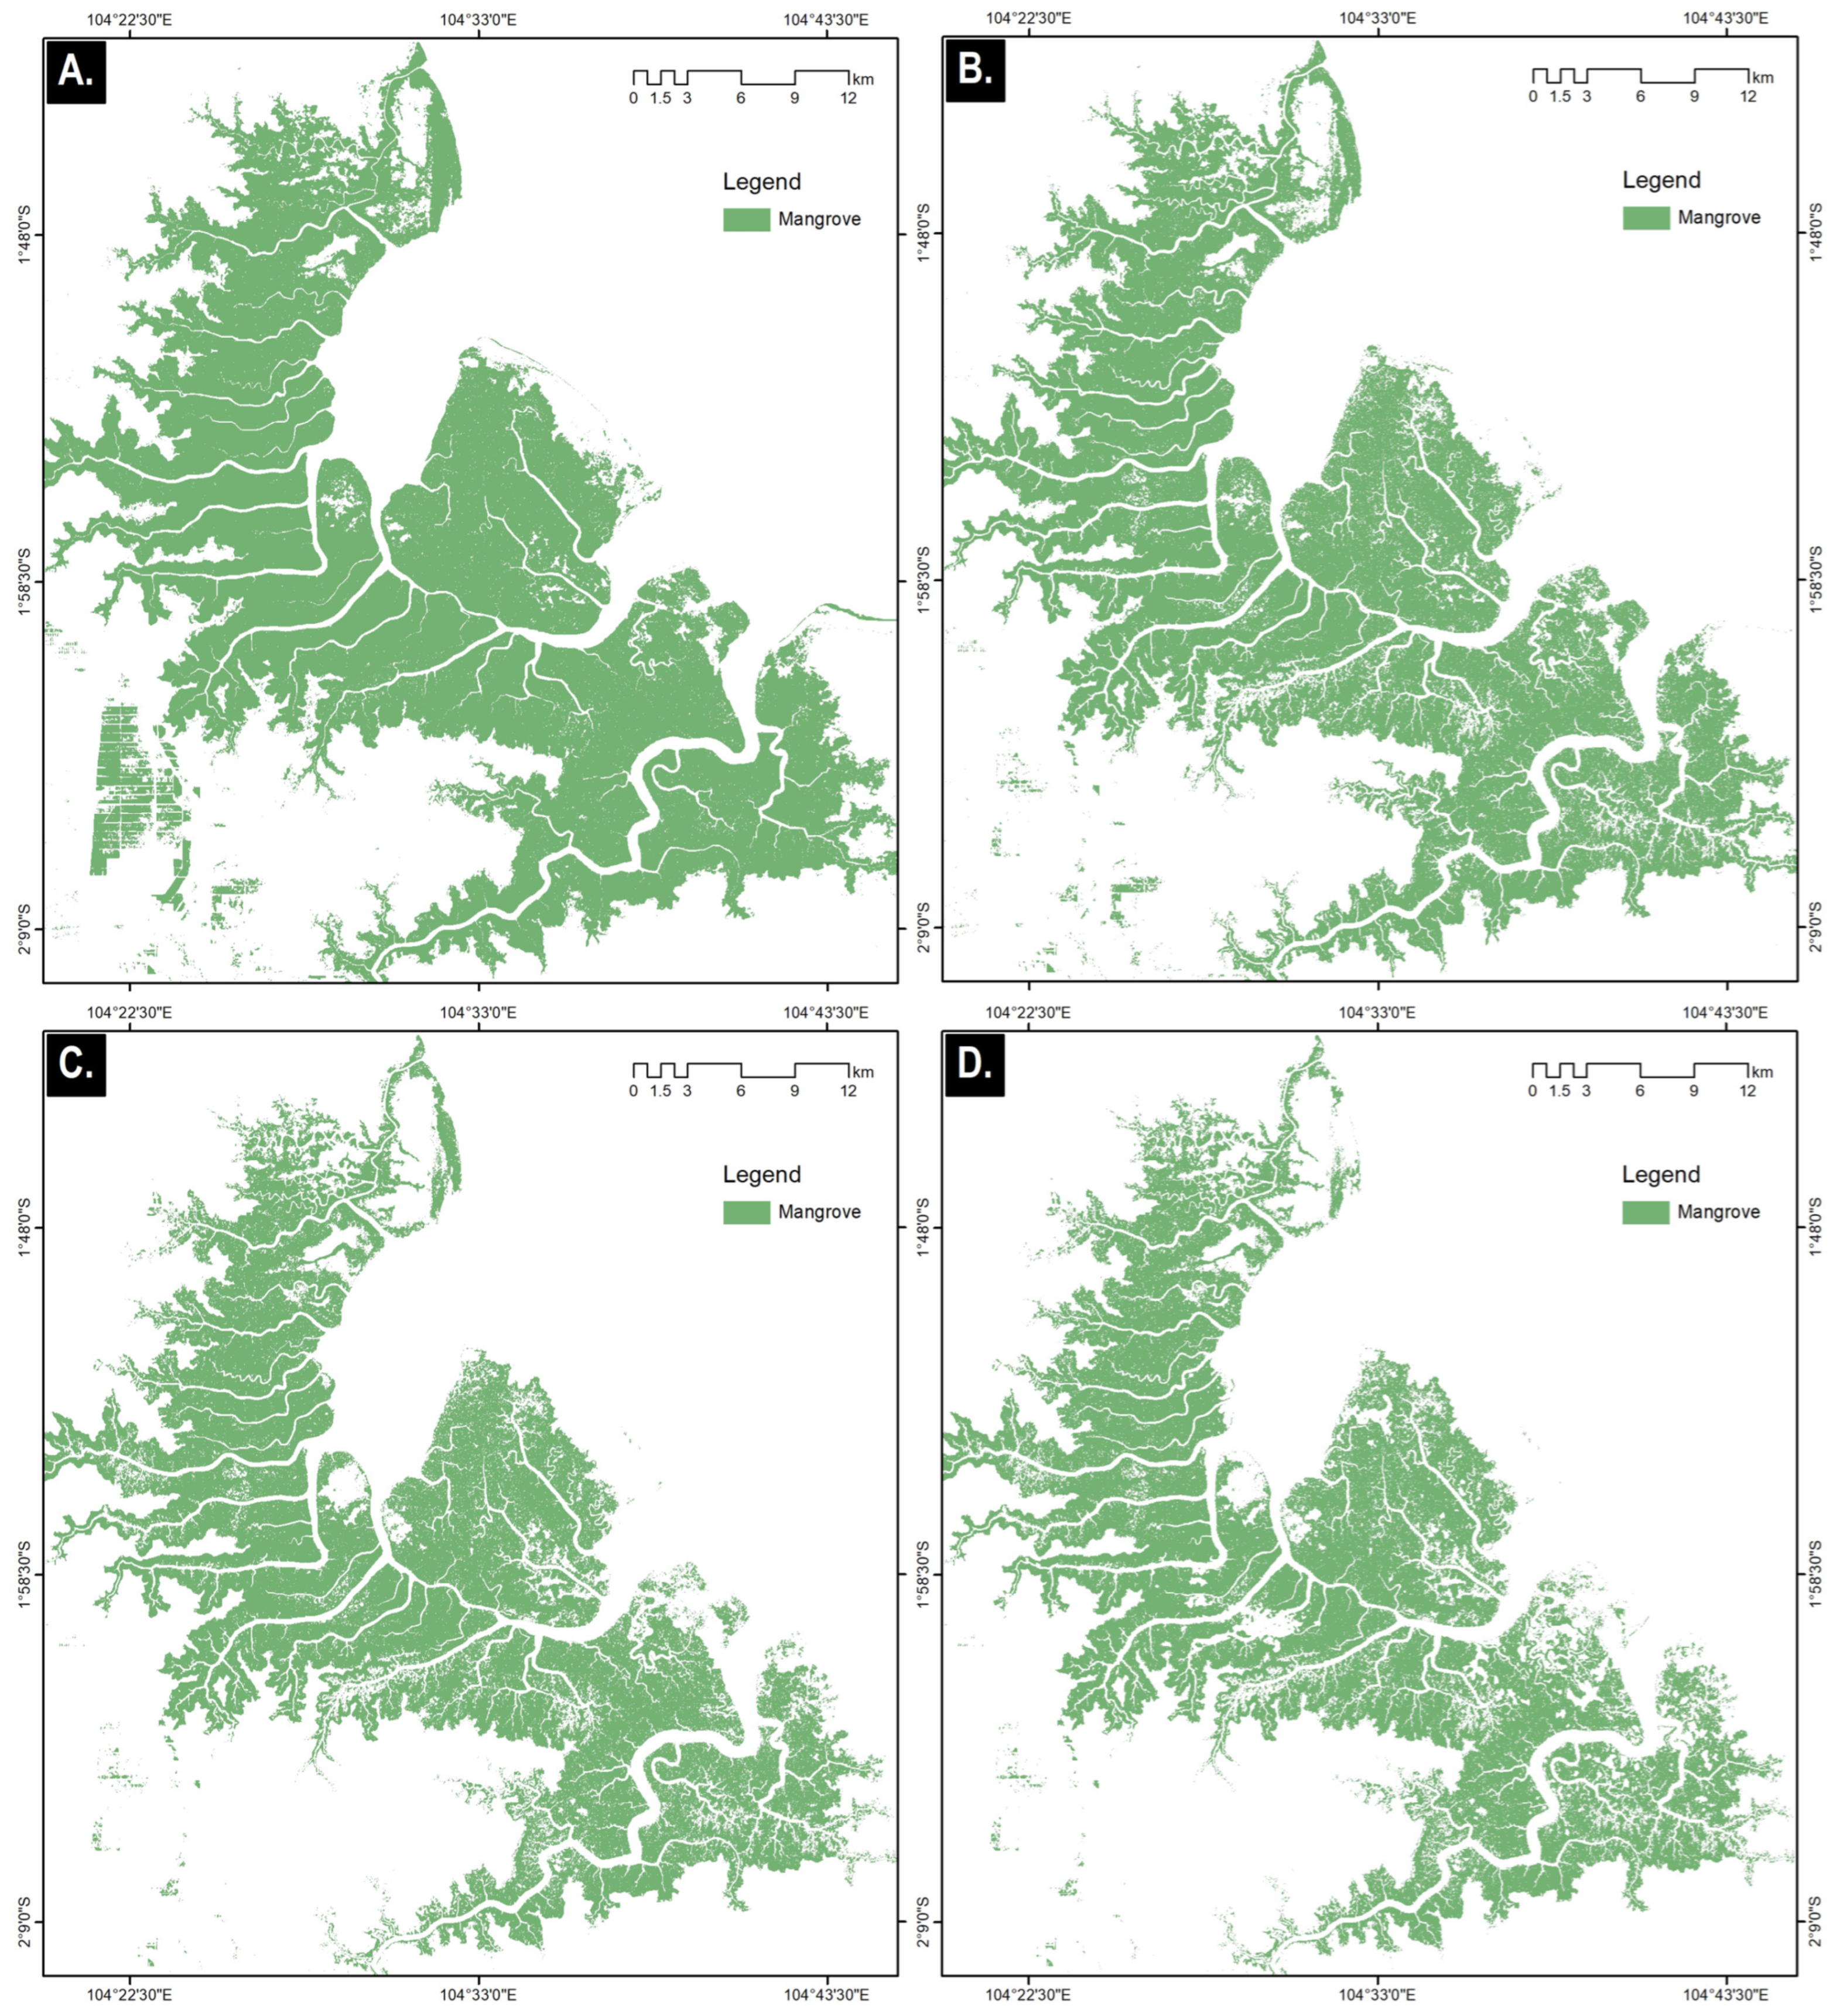
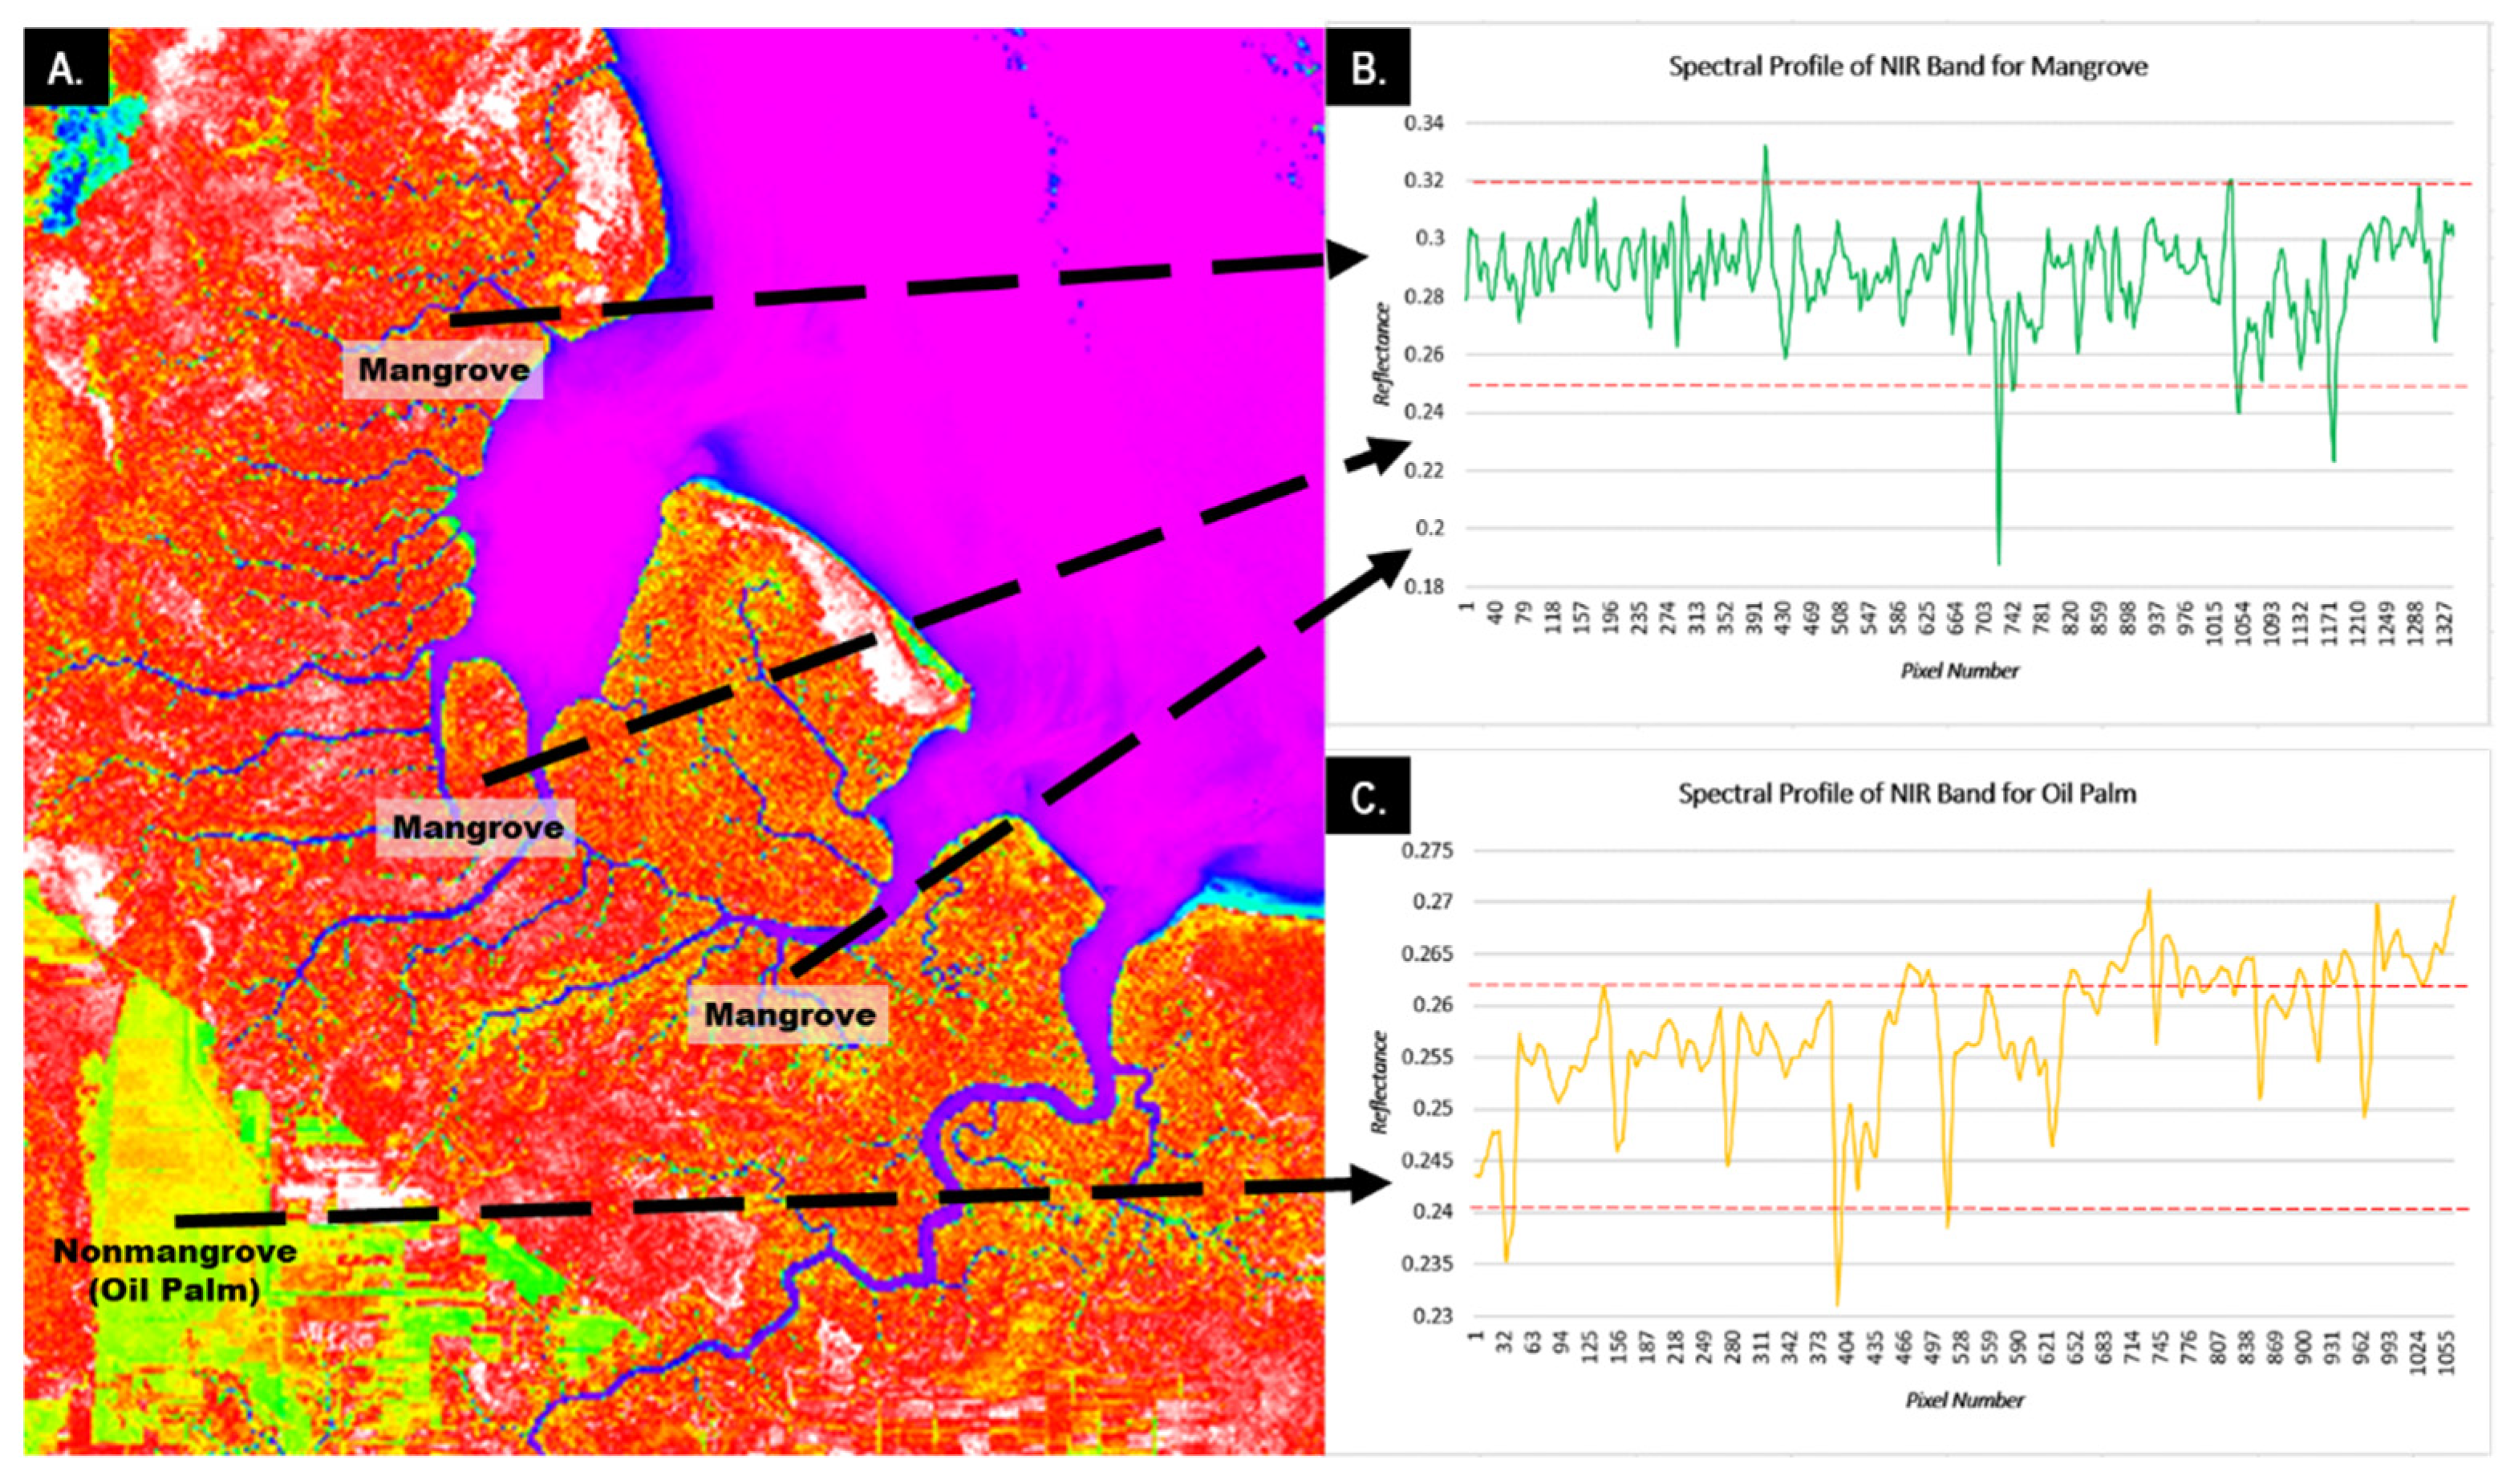
3.1. Decision Tree Algorithm for Identifying Mangrove Forests
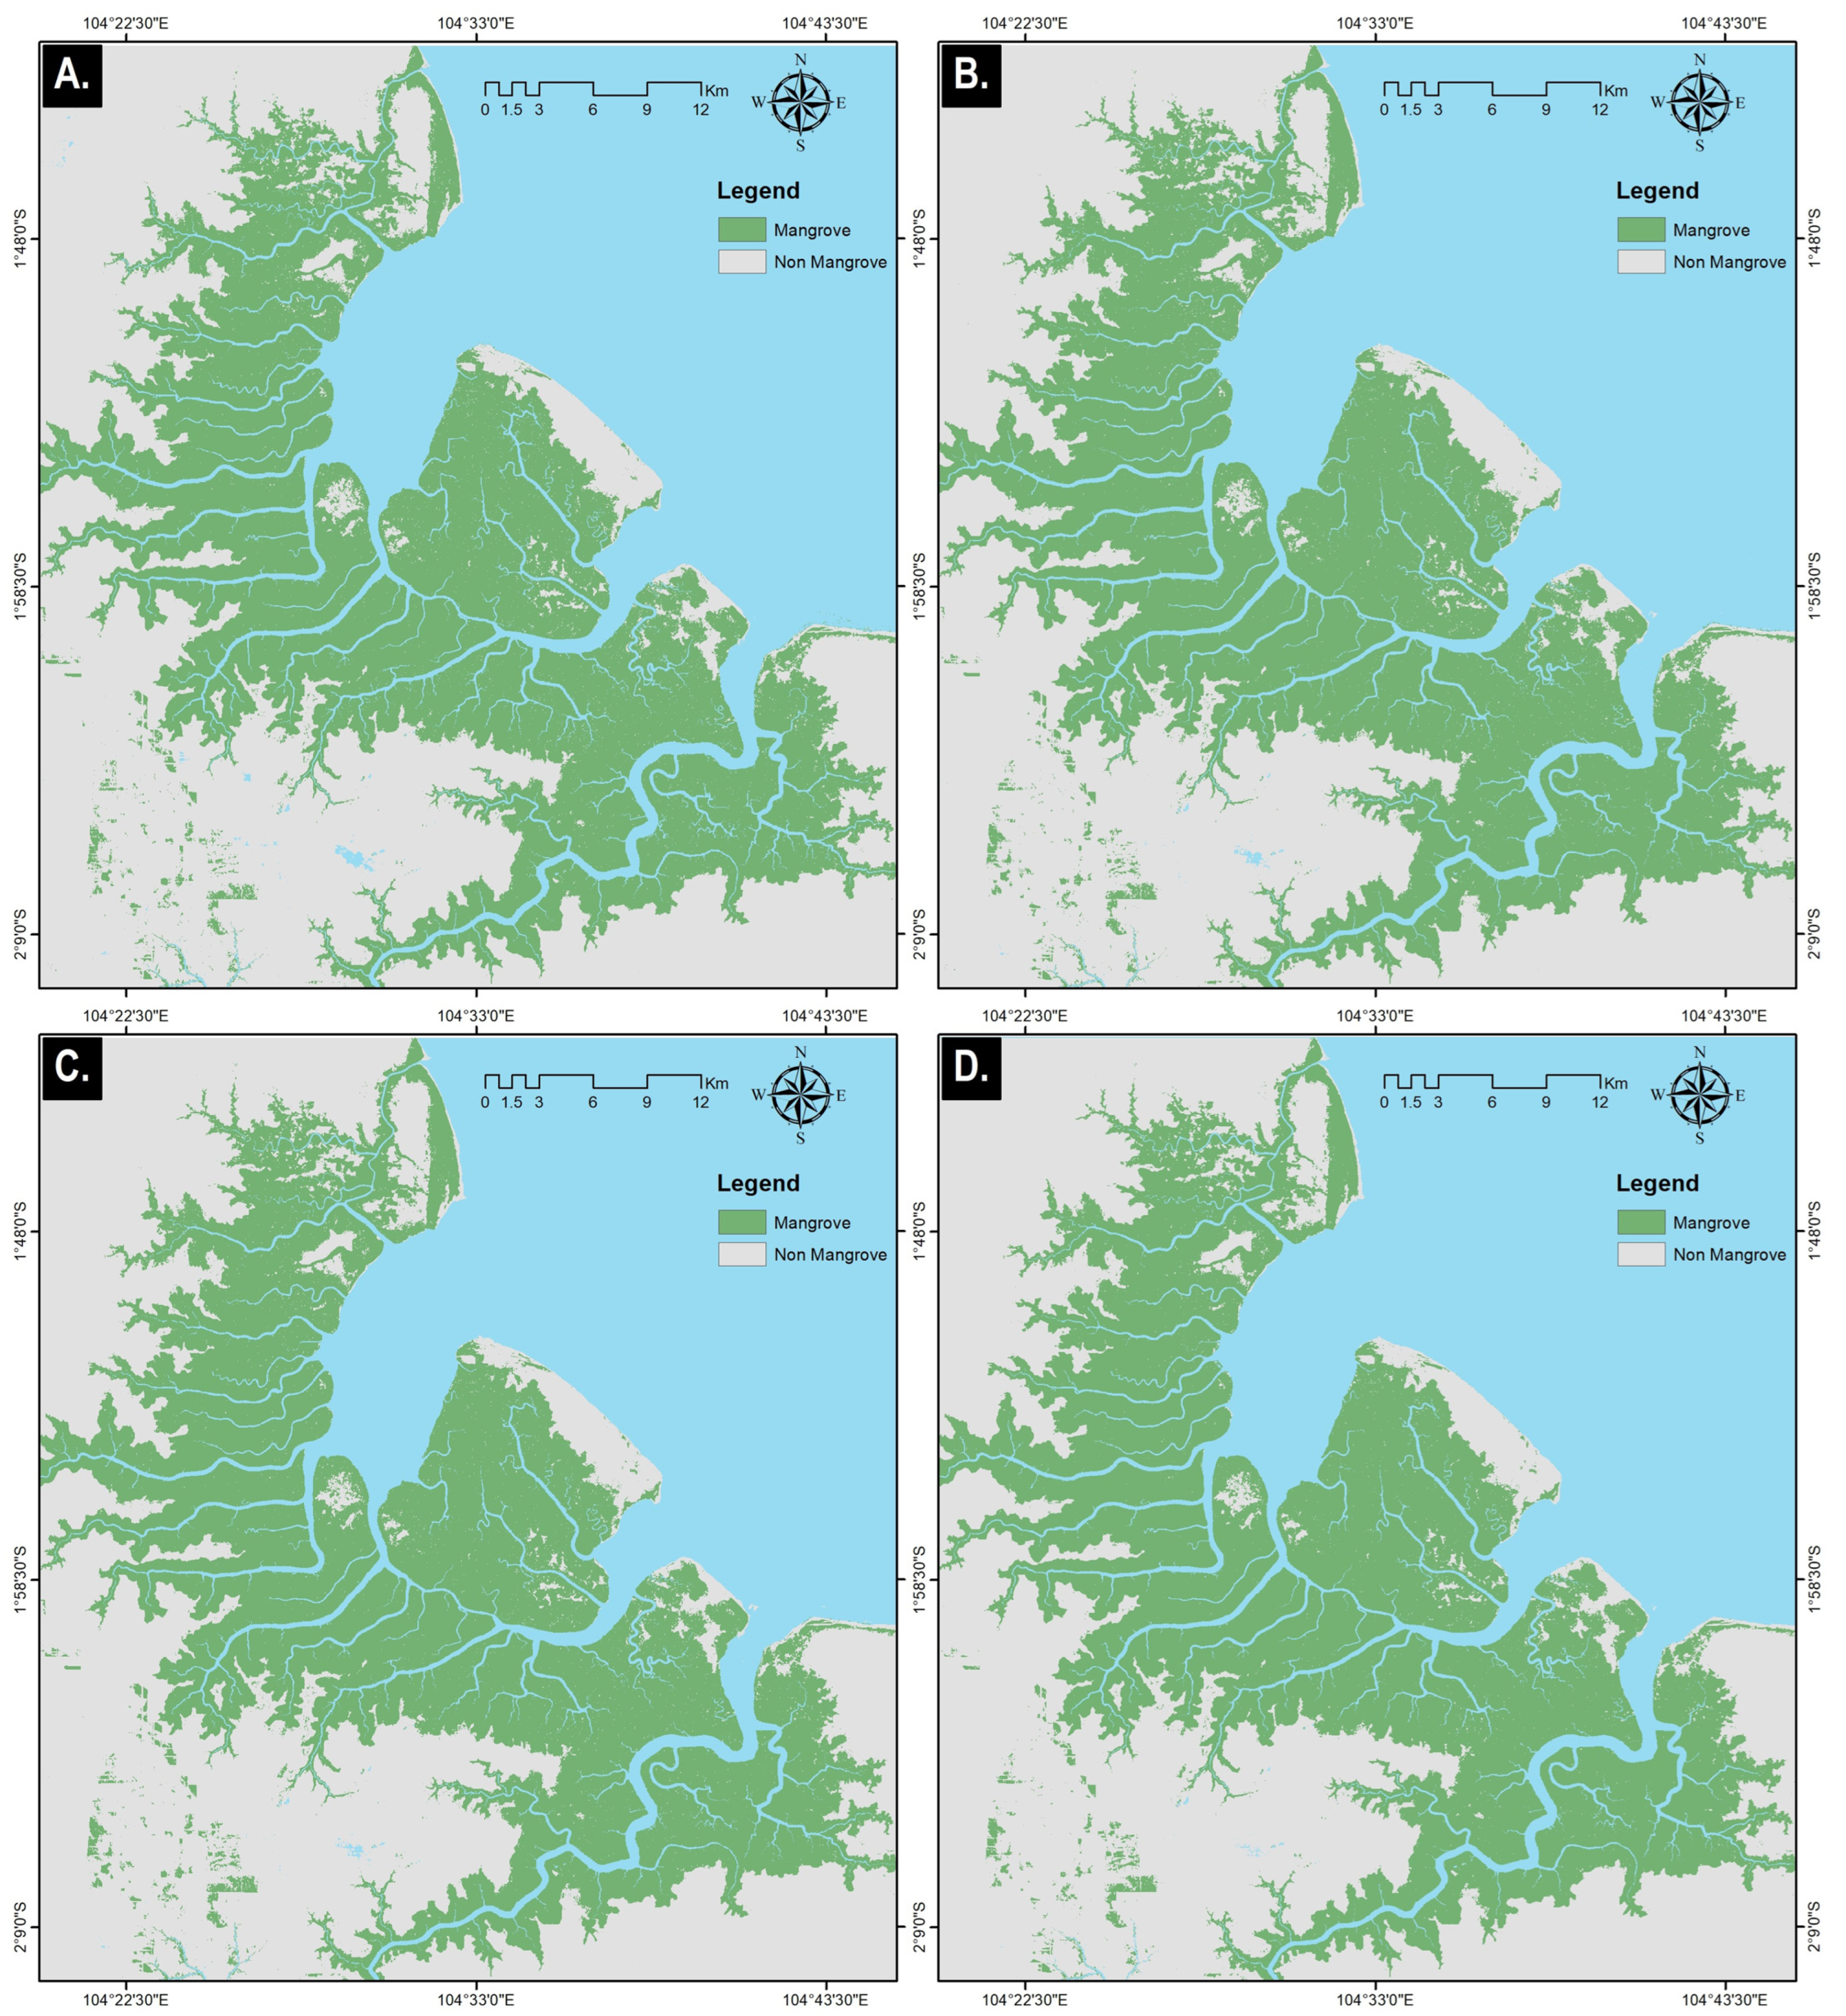
3.2. RF Algorithm for Identifying Mangrove Forests
4. Discussion
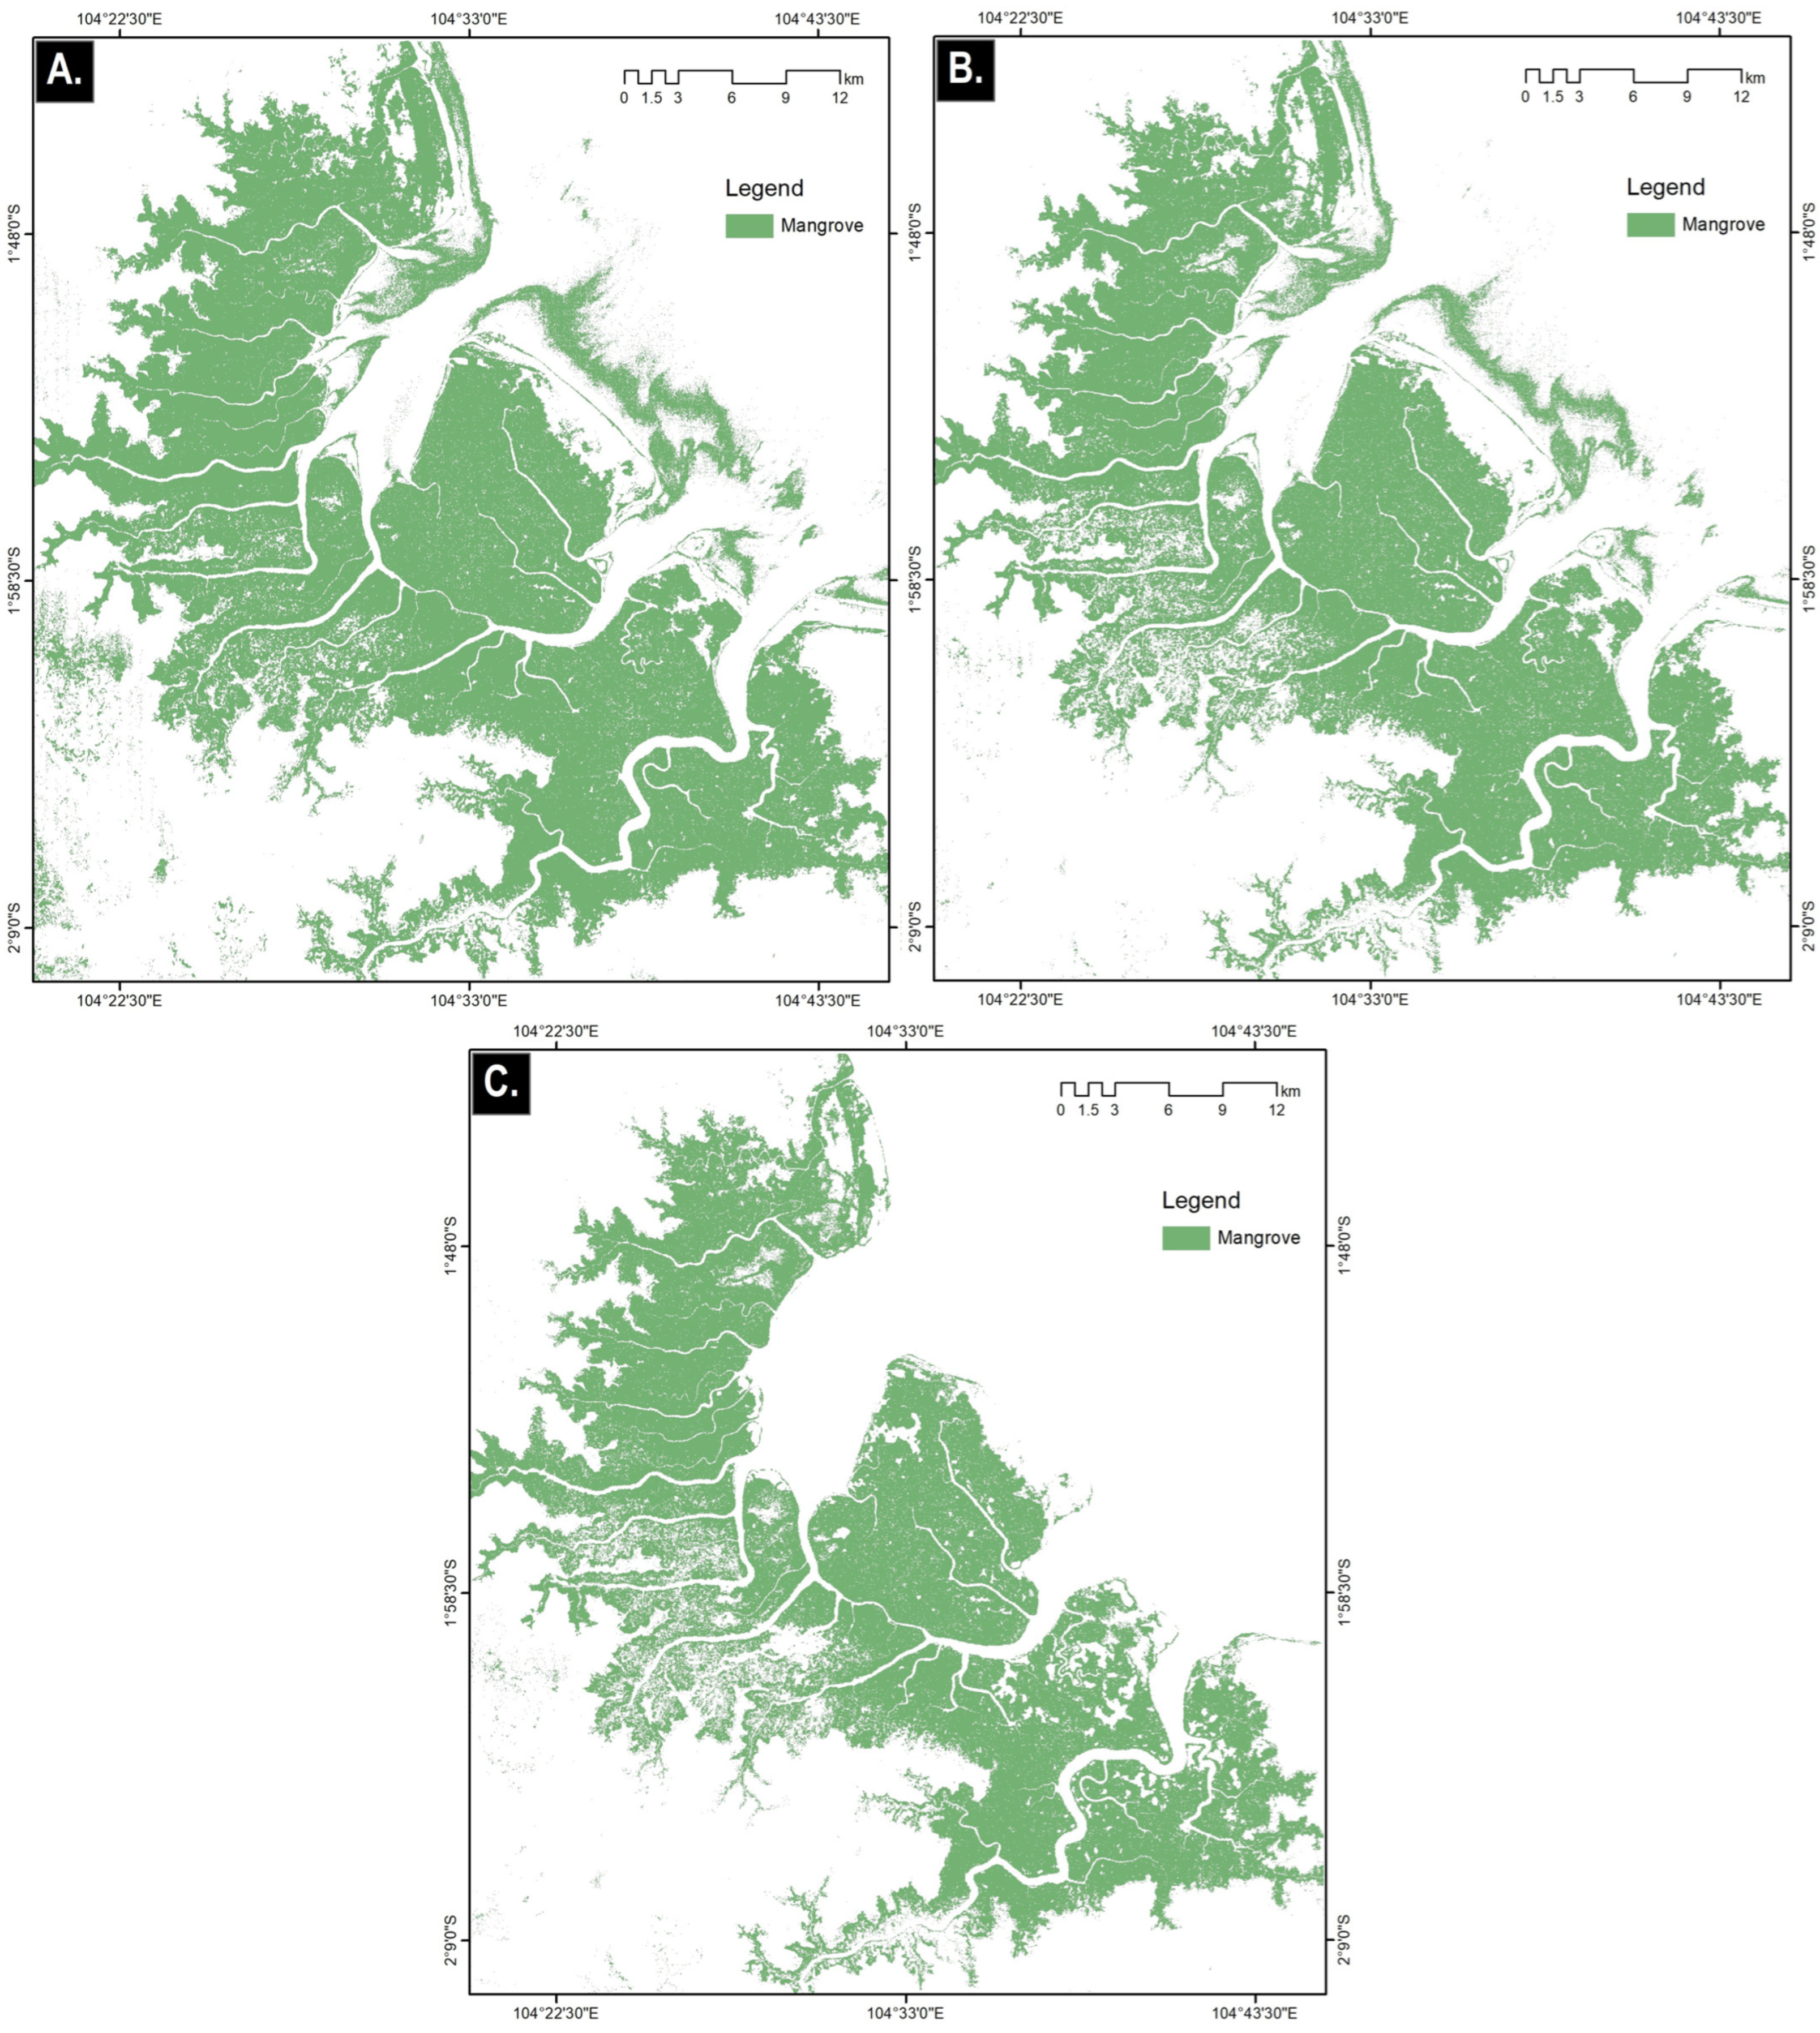
4.1. Distribution of Mangrove Forests in 2002
4.2. Distribution of Mangrove Forests in 2019
4.3. Comparison of Classification Results Using Decision Tree Learning and RF
5. Conclusions
Author Contributions
Funding
Acknowledgments
Conflicts of Interest
References
- Keim, A.P.; (National Research and Innovation Agency, Bogor, Indonesia). Personal communication, 2022.
- United Nations. The 17 Goals of SDGs, Department of Economic and Social Affairs. Available online: https://sdgs.un.org/goals/goal14 (accessed on 29 November 2021).
- Salampessy, M.L.; Febryano, I.G.; Martin, E.; Siahaya, M.E.; Papilaya, R. Cultural Capital of the Communities in the Mangrove Conservation in the Coastal Areas of Ambon Dalam Bay, Moluccas, Indonesia. Procedia Environ. Sci. 2015, 23, 222–229. [Google Scholar] [CrossRef]
- Giri, C.; Ochieng, E.; Tieszen, L.L.; Zhu, Z.; Singh, A.; Loveland, T.; Masek, J.; Duke, N. Status and Distribution of Mangrove Forests of the World Using Earth Observation Satellite Data: Status and Distributions of Global Mangroves. Glob. Ecol. Biogeogr. 2011, 20, 154–159. [Google Scholar] [CrossRef]
- Kuenzer, C.; Bluemel, A.; Gebhardt, S.; Quoc, T.V.; Dech, S. Remote Sensing of Mangrove Ecosystems: A Review. Remote Sens. 2011, 3, 878–928. [Google Scholar] [CrossRef]
- Damastuti, E.; de Groot, R.; Debrot, A.O.; Silvius, M.J. Effectiveness of Community-Based Mangrove Management for Biodiversity Conservation: A Case Study from Central Java, Indonesia. Trees For. People 2022, 7, 100202. [Google Scholar] [CrossRef]
- Murdiyarso, D.; Purbopuspito, J.; Kauffman, J.B.; Warren, M.W.; Sasmito, S.D.; Donato, D.C.; Manuri, S.; Krisnawati, H.; Taberima, S.; Kurnianto, S. The Potential of Indonesian Mangrove Forests for Global Climate Change Mitigation. Nat. Clim. Chang. 2015, 5, 1089–1092. [Google Scholar] [CrossRef]
- Ministry of Marine Affairs and Fisheries Republic of Indonesia. Manfaat Hutan Mangrove bagi Kehidupan Manusia. Available online: https://kkp.go.id/brsdm/bdasukamandi/page/541-mangrove-dan-manfaatnya (accessed on 11 January 2022).
- Ulqodry, T.Z.; Aprianto, A.E.; Agussalim, A.; Aryawati, R.; Absori, A. Analisis Tutupan Mangrove Taman Nasional Berbak–Sembilang melalui Citra Landsat-8 dan Pemantauan LAI. J. Kelaut. Trop. 2021, 24, 393–401. [Google Scholar] [CrossRef]
- Marlianingrum, P.R.; Kusumastanto, T.; Adrianto, L.; Fahrudin, A. Valuing Habitat Quality for Managing Mangrove Ecosystem Services in Coastal Tangerang District, Indonesia. Mar. Policy 2021, 133, 104747. [Google Scholar] [CrossRef]
- Noor, Y.R.; Khazali, M.; Suryadiputra, I.N.N. Panduan Pengenalan Mangrove di Indonesia; Ditjen PHKA, Wetlands International, Indonesia Programme: Bogor, Indonesia, 2006. [Google Scholar]
- Giesen, W. Indonesia’s Mangroves: An Update on Remaining Area and Main Management Issues. Available online: https://www.researchgate.net/publication/303143263_Indonesia’s_mangrove_an_update_on_remaining_area_and_main_management_issues (accessed on 12 May 2022).
- Darmawan, S.; Sari, D.K.; Wikantika, K.; Tridawati, A.; Hernawati, R.; Sedu, M.K. Identification Before-after Forest Fire and Prediction of Mangrove Forest Based on Markov-Cellular Automata in Part of Sembilang National Park, Banyuasin, South Sumatra, Indonesia. Remote Sens. 2020, 12, 3700. [Google Scholar] [CrossRef]
- Lee, S.Y.; Dunn, R.J.K.; Young, R.A.; Connolly, R.M.; Dale, P.E.R.; Dehayr, R.; Lemckert, C.J.; Mckinnon, S.; Powell, B.; Teasdale, P.R.; et al. Impact of Urbanization on Coastal Wetland Structure and Function. Austral Ecol. 2006, 31, 149–163. [Google Scholar] [CrossRef]
- Nagelkerken, I.; Blaber, S.J.M.; Bouillon, S.; Green, P.; Haywood, M.; Kirton, L.G.; Meynecke, J.-O.; Pawlik, J.; Penrose, H.M.; Sasekumar, A.; et al. The Habitat Function of Mangroves for Terrestrial and Marine Fauna: A Review. Aquat. Bot. 2008, 89, 155–185. [Google Scholar] [CrossRef]
- Fatoyinbo, T.E.; Simard, M.; Washington-Allen, R.A.; Shugart, H.H. Landscape-Scale Extent, Height, Biomass, and Carbon Estimation of Mozambique’s Mangrove Forests with Landsat ETM+ and Shuttle Radar Topography Mission Elevation Data: Mangrove Forest Structure Estimation. J. Geophys. Res. Biogeosci. 2008, 113, 1–13. [Google Scholar] [CrossRef]
- Eddy, S.; Milantara, N.; Sasmito, S.D.; Kajita, T.; Basyuni, M. Anthropogenic Drivers of Mangrove Loss and Associated Carbon Emissions in South Sumatra, Indonesia. Forests 2021, 12, 187. [Google Scholar] [CrossRef]
- Iqbal, M. Pemantauan Kawasan Sembilang No. 7, Juli/Agustus 2003. Laporan Teknis No. 74. Proyek Konservasi Terpadu Lahan Basah Pesisir Berbak Sembilang; Wetlands International—Asia Pacific Indonesia Programme: Bogor, Indonesia, 2003. [Google Scholar]
- Iqbal, M. Pemantauan Kawasan Sembilang No. 9, Februari 2004. Laporan Teknis No. 82 Proyek Konservasi Terpadu Lahan Basah Pesisir Berbak Sembilang; Wetland International Indonesia Programme: Bogor, Indonesia, 2004. [Google Scholar]
- Pemerintah Republik Indonesia. Undang-Undang Nomor 5 Tahun 1990 Tentang Konservasi Sumber Daya Alam Hayati Dan Ekosistemnya; Pemerintah Republik Indonesia: Jakarta, Indonesia, 1990; pp. 1–26.
- Zhang, X.; Treitz, P.M.; Chen, D.; Quan, C.; Shi, L.; Li, X. Mapping Mangrove Forests Using Multi-Tidal Remotely-Sensed Data and a Decision-Tree-Based Procedure. Int. J. Appl. Earth Obs. Geoinf. 2017, 62, 201–214. [Google Scholar] [CrossRef]
- Rahadian, A.; Prasetyo, L.B.; Setiawan, Y.; Wikantika, K. A Historical Review of Data and Information of Indonesian Mangroves Area. Media Konserv. 2019, 24, 163–178. [Google Scholar] [CrossRef]
- Lillesand, T.M.; Kiefer, R.W.; Chipman, J.W. Remote Sensing and Image Interpretation, 7th ed.; John Wiley & Sons, Inc.: Hoboken, NJ, USA, 2015. [Google Scholar]
- Heumann, B.W. An Object-Based Classification of Mangroves Using a Hybrid Decision Tree-Support Vector Machine Approach. Remote Sens. 2011, 3, 2440–2460. [Google Scholar] [CrossRef]
- Jamaluddin, I.; Chen, Y.-N.; Ridha, S.M.; Mahyatar, P.; Ayudyanti, A.G. Two Decades Mangroves Loss Monitoring Using Random Forest and Landsat Data in East Luwu, Indonesia (2000–2020). Geomatics 2022, 2, 282–296. [Google Scholar] [CrossRef]
- Liu, K.; Li, X.; Shi, X.; Wang, S. Monitoring Mangrove Forest Changes Using Remote Sensing and GIS Data with Decision-Tree Learning. Wetlands 2008, 28, 336–346. [Google Scholar] [CrossRef]
- Chen, C.-F.; Son, N.-T.; Chang, N.-B.; Chen, C.-R.; Chang, L.-Y.; Valdez, M.; Centeno, G.; Thompson, C.; Aceituno, J. Multi-Decadal Mangrove Forest Change Detection and Prediction in Honduras, Central America, with Landsat Imagery and a Markov Chain Model. Remote Sens. 2013, 5, 6408–6426. [Google Scholar] [CrossRef]
- Tran, H.; Tran, T.; Kervyn, M. Dynamics of Land Cover/Land Use Changes in the Mekong Delta, 1973–2011: A Remote Sensing Analysis of the Tran Van Thoi District, Ca Mau Province, Vietnam. Remote Sens. 2015, 7, 2899–2925. [Google Scholar] [CrossRef]
- Winarso, G.; Purwanto, A.D. Evaluation of Mangrove Damage Level Based on Landsat 8 Image. Int. J. Remote Sens. Earth Sci. 2017, 11, 105. [Google Scholar] [CrossRef][Green Version]
- Purwanto, A.D.; Asriningrum, W. Identification of Mangrove Forests Using Multispectral Satellite Imageries. Int. J. Remote Sens. Earth Sci. 2019, 16, 63. [Google Scholar] [CrossRef]
- Xiao, H.; Su, F.; Fu, D.; Lyne, V.; Liu, G.; Pan, T.; Teng, J. Optimal and Robust Vegetation Mapping in Complex Environments Using Multiple Satellite Imagery: Application to Mangroves in Southeast Asia. Int. J. Appl. Earth Obs. Geoinf. 2021, 99, 102320. [Google Scholar] [CrossRef]
- Yu, T.; Li, X.; Zhang, Y.; Zhao, F.; Gu, X.; Zhu, L.; Wang, P.; Min, X. Comparison of the Influence Factors on NDVI for CCD Camera and WFI Imager on CBERS-02. Sci. China Ser. E-Technol. Sci. 2005, 48 (Suppl. S2), 100–115. [Google Scholar]
- Chen, D.; Huang, J.; Jackson, T.J. Vegetation Water Content Estimation for Corn and Soybeans Using Spectral Indices Derived from MODIS Near- and Short-Wave Infrared Bands. Remote Sens. Environ. 2005, 98, 225–236. [Google Scholar] [CrossRef]
- Huang, J.; Chen, D.; Cosh, M.H. Sub-pixel Reflectance Unmixing in Estimating Vegetation Water Content and Dry Biomass of Corn and Soybeans Cropland Using Normalized Difference Water Index (NDWI) from Satellites. Int. J. Remote Sens. 2009, 30, 2075–2104. [Google Scholar] [CrossRef]
- Wilson, E.H.; Sader, S.A. Detection of Forest Harvest Type Using Multiple Dates of Landsat TM Imagery. Remote Sens. Environ. 2002, 80, 385–396. [Google Scholar] [CrossRef]
- Rogers, A.S.; Kearney, M.S. Reducing Signature Variability in Unmixing Coastal Marsh Thematic Mapper Scenes Using Spectral Indices. Int. J. Remote Sens. 2004, 25, 2317–2335. [Google Scholar] [CrossRef]
- Nguyen, C.T.; Chidthaisong, A.; Kieu Diem, P.; Huo, L.-Z. A Modified Bare Soil Index to Identify Bare Land Features during Agricultural Fallow-Period in Southeast Asia Using Landsat 8. Land 2021, 10, 231. [Google Scholar] [CrossRef]
- Jensen, J.R.; Lulla, K. Introductory Digital Image Processing: A Remote Sensing Perspective. Geocarto Int. 1987, 2, 659. [Google Scholar] [CrossRef]
- Li, H.T.; Gu, H.Y.; Han, Y.S.; Yang, J.H. Object-Oriented Classification of Polarimetric SAR Imagery Based on Statistical Region Merging and Support Vector Machine. In Proceedings of the 2008 International Workshop on Earth Observation and Remote Sensing Applications, Beijing, China, 30 June–2 July 2008; pp. 1–6. [Google Scholar]
- Sutanto, A.; Trisakti, B.; Arimurthy, A.M. Perbandingan Klasifikasi Berbasis Obyek Dan Klasifikasi Berbasis Piksel Pada Data Citra Satelit Synthetic Aperture Radar Untuk Pemetaan Lahan. J. Penginderaan Jauh. 2014, 11, 13. [Google Scholar]
- Hay, G.J.; Castilla, G. Object-Based Image Analysis: Strengths, Weaknesses, Opportunities and Threats (SWOT). Int. Arch. Photogramm. Remote Sens. Spat. Inf. Sci. 2006, 4–5. [Google Scholar]
- Madanguit, C.J.G.; Oñez, P.J.L.; Tan, H.G.; Villanueva, M.D.; Ordaneza, J.E.; Aurelio, R.M.; Novero, A.U. Application of Support Vector Machine (SVM) and Quick Unbiased Efficient Statistical Tree (QUEST) Algorithms on Mangrove and Agricultural Resource Mapping using LiDAR Data Sets. Int. J. Appl. Environ. Sci. 2017, 12, 973–6077. [Google Scholar]
- Firmansyah, S.; Gaol, J.L.; Susilo, S.B. Perbandingan Klasifikasi SVM dan Decision Tree untuk Pemetaan Mangrove Berbasis Objek Menggunakan Citra Satelit Sentinel-2B di Gili Sulat, Lombok Timur. J. Nat. Resour. Environ. Manag. 2019, 9, 746–757. [Google Scholar]
- Ma, C.; Ai, B.; Zhao, J.; Xu, X.; Huang, W. Change Detection of Mangrove Forests in Coastal Guangdong during the Past Three Decades Based on Remote Sensing Data. Remote Sens. 2019, 11, 921. [Google Scholar] [CrossRef]
- Breiman, L. Random Forests. Mach. Learn. 2001, 45, 5–32. [Google Scholar] [CrossRef]
- Jhonnerie, R. Klasifikasi Mangrove Berbasis Objek dan Piksel Menggunakan Citra Satelit Multispektral di Sungai Kembung, Bengkalis, Provinsi Riau; Institut Pertanian Bogor: Bogor, Indonesia, 2015. [Google Scholar] [CrossRef]
- Mondal, P.; Liu, X.; Fatoyinbo, T.E.; Lagomasino, D. Evaluating Combinations of Sentinel-2 Data and Machine-Learning Algorithms for Mangrove Mapping in West Africa. Remote Sens. 2019, 11, 2928. [Google Scholar] [CrossRef]
- Lubis, I.R.; Suryadiputra, I.N.N. Upaya Pengelolaan Terpadu Hutan Rawa Gambut Bekas Terbakar Diwilayah Berbak-Sembilang. Prosiding Semiloka; CIFOR: Bogor, Indonesia, 2004; pp. 105–119. [Google Scholar]
- Purwadhi, F.S.H. Interpretasi Citra Digital; Gramedia Widiasarana: Jakarta, Indonesia, 2001. [Google Scholar]
- Lu, D.; Weng, Q. A Survey of Image Classification Methods and Techniques for Improving Classification Performance. Int. J. Remote Sens. 2007, 28, 823–870. [Google Scholar] [CrossRef]
- Kamaruddin, N.A.; Fujii, S. Mangrove Forest Classification Using Decision Tree-Learning Method. World Appl. Sci. J. 2017, 35, 1821–1825. [Google Scholar] [CrossRef]
- Suwignyo, R.A.; Ulqodry, T.Z.; Miyakawa, H. Mangrove Plant Condition in the Greenbelt Area of Banyuasin Peninsula, Sembilang National Park, South Sumatra, Indonesia and Its Restoration Plan. Chiang Mai Univ. J. Nat. Sci. 2012, 11, 123–134. [Google Scholar]
- RSIS (Ramsar Sites Information Service). Ramsar Sites in Indonesia (Information Sheet on Ramsar Wetlands—Berbak National Park). 1991. Available online: https://rsis.ramsar.org/RISapp/files/RISrep/ID554RIS.pdf (accessed on 13 July 2021).
- RSIS (Ramsar Sites Information Service). Information Sheet on Ramsar Wetlands (RIS)—Sembilang National Park. 2012. Available online: https://rsis.ramsar.org/RISapp/files/RISrep/ID1945RIS.pdf (accessed on 13 July 2021).
- Nurhayat, O.D.; Yanto, D.H.Y.; Ardiati, F.C.; Ramadhan, K.P.; Anita, S.H.; Okano, H.; Watanabe, T. Bioprospecting Three Newly Isolated White-Rot Fungi from Berbak-Sembilang National Park, Indonesia for Biodecolorization of Anthraquinone and Azo Dyes. Biodivers. J. Biol. Divers. 2022, 23, 2. [Google Scholar] [CrossRef]
- Ulqodry, T.Z.; Suganda, A.; Agussalim, A.; Aryawati, R.; Absori, A. Estimasi Serapan Karbon Mangrove Melalui Proses Fotosintesis Di Taman Nasional Berbak-Sembilang. J. Kelaut. Nas. 2020, 15, 77–84. [Google Scholar] [CrossRef]
- Mongabay. Mangrove Yang Memberi Harapan Nelayan Sembilang. Available online: https://www.mongabay.co.id/2018/08/01/mangrove-yang-memberi-harapan-nelayan-sembilang (accessed on 30 October 2022).
- Theresia; Boer, M.; Pratiwi, N. Pengelolaan Ekosistem Mangrove Di Taman Nasional Sembilang Kabupaten Banyuasin Provinsi Sumatera Selatan. Master’s Thesis, Institut Pertanian Bogor, Bogor, Indonesia, 2016. [Google Scholar]
- Verheugt, W.J.M.; Purwoko, A.; Danielsen, F.; Skov, H.; Kadarisman, R. Integrating Mangrove and Swamp Forests Conservation with Coastal Lowland Development; the Banyuasin Sembilang Swamps Case Study, South Sumatra Province, Indonesia. Landsc. Urban Plan. 1991, 20, 85–94. [Google Scholar] [CrossRef]
- Statistics Indonesia. Banyuasin Regency in Figures 2022. 2020. Available online: https://banyuasinkab.bps.go.id (accessed on 15 July 2022).
- Pariwono, J.I. Australian Co-Operative Programmes in Marine Sciences: Tides and Tidal Phenomena in the ASEAN Region; Flinders University of South Australia: Queensland, Australia, 1985. [Google Scholar]
- Yamazaki, D.; Ikeshima, D.; Tawatari, R.; Yamaguchi, T.; O’Loughlin, F.; Neal, J.C.; Sampson, C.C.; Kanae, S.; Bates, P.D. A High-Accuracy Map of Global Terrain Elevations: Accurate Global Terrain Elevation Map. Geophys. Res. Lett. 2017, 44, 5844–5853. [Google Scholar] [CrossRef]
- Congedo, L. Semi-automatic classification plugin documentation. Release 2016, 4, 29. [Google Scholar]
- Congedo, L. Semi-Automatic Classification Plugin: A Python tool for the download and processing of remote sensing images in QGIS. J. Open Source Softw. 2021, 6, 3172. [Google Scholar] [CrossRef]
- Kustiyo; Dewanti, R.; Lolitasari, I. Pengembangan Metoda Koreksi Radiometrik Citra Spot 4 Multi-Spektral Dan Multi-Temporal Untuk Mosaik Citra. Pros. Semin. Nas. Penginderaan Jauh 2014, 1, 79–87. [Google Scholar]
- Kamal, M.; Muhammad, F.H.; Mahardhika, S.A. Effect of Image Radiometric Correction Levels of Landsat Images to the Land Cover Maps Resulted from Maximum Likelihood Classification. E3S Web Conf. 2020, 153, 02004. [Google Scholar] [CrossRef]
- Begeman, C.; Helder, D.; Leigh, L.; Pinkert, C. Relative Radiometric Correction of Pushbroom Satellites Using the Yaw Maneuver. Remote Sens. 2022, 14, 2820. [Google Scholar] [CrossRef]
- Doxani, G.; Vermote, E.; Roger, J.-C.; Gascon, F.; Adriaensen, S.; Frantz, D.; Hagolle, O.; Hollstein, A.; Kirches, G.; Li, F.; et al. Atmospheric Correction Inter-Comparison Exercise. Remote Sens. 2018, 10, 352. [Google Scholar] [CrossRef]
- Ilori, C.; Pahlevan, N.; Knudby, A. Analyzing Performances of Different Atmospheric Correction Techniques for Landsat 8: Application for Coastal Remote Sensing. Remote Sens. 2019, 11, 469. [Google Scholar] [CrossRef]
- Friedl, M.A.; Brodley, C.E. Decision Tree Classification of Land Cover from Remotely Sensed Data. Remote Sens. Environ. 1997, 61, 399–409. [Google Scholar] [CrossRef]
- Simard, M.; Saatchi, S.S.; De Grandi, G. The Use of Decision Tree and Multiscale Texture for Classification of JERS-1 SAR Data over Tropical Forest. IEEE Trans. Geosci. Remote Sens. 2000, 38, 2310–2321. [Google Scholar] [CrossRef]
- Miettinen, J.; Liew, S.C.; Kwoh, L.K. Usability of Sentinel-1 dual polarization C-band data for plantation detection in insular Southeast Asia. In Proceedings of the 36th Asian Conference on Remote Sensing (ACRS2015), Quezon City, Philippines, 24–28 October 2015. [Google Scholar]
- Sari, I.L.; Weston, C.J.; Newnham, G.J.; Volkova, L. Developing Multi-Source Indices to Discriminate between Native Tropical Forests, Oil Palm and Rubber Plantations in Indonesia. Remote Sens. 2021, 14, 3. [Google Scholar] [CrossRef]
- Loh, W.-Y. Fifty Years of Classification and Regression Trees: Fifty Years of Classification and Regression Trees. Int. Stat. Rev. 2014, 82, 329–348. [Google Scholar] [CrossRef]
- Battista, K.; Patte, K.A.; Diao, L.; Dubin, J.A.; Leatherdale, S.T. Using Decision Trees to Examine Environmental and Behavioural Factors Associated with Youth Anxiety, Depression, and Flourishing. Int. J. Environ. Res. Public. Health 2022, 19, 10873. [Google Scholar] [CrossRef] [PubMed]
- Hodgson, M.E.; Jensen, J.R.; Tullis, J.A.; Riordan, K.D.; Archer, C.M. Synergistic Use of Lidar and Color Aerial Photography for Mapping Urban Parcel Imperviousness. Photogramm. Eng. Remote Sens. 2003, 69, 973–980. [Google Scholar] [CrossRef]
- L3 Harris Geospatial Documentation Center. Profiles and Plots. Available online: https://www.l3harrisgeospatial.com/docs/profiles.htm (accessed on 14 May 2022).
- Madden, C.K. Contributions to Remote Sensing of Shallow Water Depth with the Worldview-2 Yellow Band. Master’s Thesis, Naval Postgraduate School, Monterey, CA, USA, March 2011. [Google Scholar]
- Diniz, C.; Cortinhas, L.; Nerino, G.; Rodrigues, J.; Sadeck, L.; Adami, M.; Souza-Filho, P. Brazilian Mangrove Status: Three Decades of Satellite Data Analysis. Remote Sens. 2019, 11, 808. [Google Scholar] [CrossRef]
- Cutler, D.R.; Edwards, T.C.; Beard, K.H.; Cutler, A.; Hess, K.T.; Gibson, J.; Lawler, J.J. RANDOM FORESTS FOR CLASSIFICATION IN ECOLOGY. Ecology 2007, 88, 2783–2792. [Google Scholar] [CrossRef]
- Beijma, S.; Comber, A.; Lamb, A. Random Forest Classification of Salt Marsh Vegetation Habitats Using Quad-Polarimetric Airborne SAR, Elevation and Optical RS Data. Remote Sens. Environ. 2014, 149, 118–129. [Google Scholar] [CrossRef]
- Kulkarni, A.D.; Lowe, B. Random Forest Algorithm for Land Cover Classification. Int. J. Recent Innov. Trends Comput. Commun. 2016, 4, 7. [Google Scholar]
- Phan, T.N.; Kuch, V.; Lehnert, L.W. Land Cover Classification Using Google Earth Engine and Random Forest Classifier—The Role of Image Composition. Remote Sens. 2020, 12, 2411. [Google Scholar] [CrossRef]
- Kustiyo. Machine Learning Technique Using Python for Remote Sensing Land Cover Classification. Available online: https://www.youtube.com/watch?v=eaKJEjYacdY. (accessed on 11 December 2021).
- Köthe, U. The VIGRA Image Analysis Library; University of Heidelberg: Heidelberg, Germany, 2012. [Google Scholar]
- Tridawati, A.; Wikantika, K.; Susantoro, T.M.; Harto, A.B.; Darmawan, S.; Yayusman, L.F.; Ghazali, M.F. Mapping the Distribution of Coffee Plantations from Multi-Resolution, Multi-Temporal, and Multi-Sensor Data Using a Random Forest Algorithm. Remote Sens. 2020, 12, 3933. [Google Scholar] [CrossRef]
- Immitzer, M.; Atzberger, C.; Koukal, T. Tree Species Classification with Random Forest Using Very High Spatial Resolution 8-Band WorldView-2 Satellite Data. Remote Sens. 2012, 4, 2661–2693. [Google Scholar] [CrossRef]
- Guan, H.; Li, J.; Chapman, M.; Deng, F.; Ji, Z.; Yang, X. Integration of Orthoimagery and Lidar Data for Object-Based Urban Thematic Mapping Using Random Forests. Int. J. Remote Sens. 2013, 34, 5166–5186. [Google Scholar] [CrossRef]
- Colditz, R. An Evaluation of Different Training Sample Allocation Schemes for Discrete and Continuous Land Cover Classification Using Decision Tree-Based Algorithms. Remote Sens. 2015, 7, 9655–9681. [Google Scholar] [CrossRef]
- Beckschäfer, P. Obtaining Rubber Plantation Age Information from Very Dense Landsat TM & ETM + Time Series Data and Pixel-Based Image Compositing. Remote Sens. Environ. 2017, 196, 89–100. [Google Scholar] [CrossRef]
- Foody, G.M. Status of Land Cover Classification Accuracy Assessment. Remote Sens. Environ. 2002, 80, 185–201. [Google Scholar] [CrossRef]


| Dataset | Number of Bands (Landsat-7 ETM+) | Number of Bands (Landsat-8 OLI) |
|---|---|---|
| Image | 6 (Blue, Green, Red, NIR, SWIR-1, and SWIR-2) | 7 (Coastal/Aerosol, Blue, Green, Red, NIR, SWIR-1, and SWIR-2) |
| Image + NDMI | 7 | 8 |
| Image + NDMI + NDSI | 8 | 9 |
| Image + NDMI + NDSI + DEM | 9 | 10 |
| Parameters | Mangrove Threshold | Non-Mangrove Threshold | ||
|---|---|---|---|---|
| Landsat-7 ETM+ | Landsat-8 OLI | Landsat-7 ETM+ | Landsat-8 OLI | |
| NDMI | 0.51–0.60 | 0.75–0.90 | <0.51 and >0.60 | <0.75 and >0.90 |
| NIR | - | 0.267–0.35 | - | <0.267 and >0.35 |
| NDSI | (−0.65)–(−0.475) | (−0.7)–(−0.525) | <(−0.65) and >(−0.475) | <(−0.7) and >(−0.525) |
| DEM | 0–12 | 0–12 | ≤0 and ≥12 | ≤0 and ≥12 |
| Models | OA (%) | Kappa | Mangrove PA (%) | Non-Mangrove PA (%) | Mangrove UA (%) | Non-Mangrove UA (%) |
|---|---|---|---|---|---|---|
| NDMI | 86.46% | 0.713 | 90.32% | 84.45% | 75.17% | 94.37% |
| NDMI + NDSI | 90.06% | 0.783 | 89.52% | 90.34% | 82.84% | 94.30% |
| NDMI + NDSI + DEM | 92.82% | 0.834 | 81.45% | 98.74% | 97.12% | 91.09% |
| Models | OA (%) | Kappa | Mangrove PA (%) | Non-Mangrove PA (%) | Mangrove UA (%) | Non-Mangrove UA (%) |
|---|---|---|---|---|---|---|
| NDMI | 96.69% | 0.928 | 100.00% | 94.96% | 97.12% | 100.00% |
| NDMI + NIR | 98.34% | 0.963 | 96.77% | 99.16% | 97.12% | 98.33% |
| NDMI + NIR + NDSI | 98.07% | 0.957 | 95.16% | 99.58% | 97.12% | 97.53% |
| NDMI + NIR + NDSI + DEM | 95.03% | 0.886 | 86.29 | 99.58% | 97.12% | 93.13% |
| Tree | Average Overall Accuracy (%) |
|---|---|
| 100 | 97.068% |
| 500 | 97.321% |
| 1000 | 97.323% |
| Models | OA (%) | Kappa | Mangrove PA (%) | Non-Mangrove PA (%) | Mangrove UA (%) | Non-Mangrove UA (%) |
|---|---|---|---|---|---|---|
| Image (Tree, 100; Mtry Square Root; Node, 6) | 97.95% | 0.972 | 98.31% | 90.38% | 96.67% | 100.00% |
| Image (Tree, 500; Mtry Square root; Node, 6) | 97.65% | 0.968 | 97.46% | 90.38% | 96.64% | 100.00% |
| Image (Tree, 1000; Mtry Square root; Node, 6) | 97.95% | 0.972 | 98.31% | 90.38% | 96.67% | 100.00% |
| Image + NDMI (Tree, 100; Mtry Square root; Node, 6) | 97.36% | 0.963 | 97.46% | 88.46% | 98.29% | 100.00% |
| Image + NDMI (Tree, 500; Mtry Square root; Node, 6) | 97.36% | 0.963 | 97.46% | 88.46% | 97.46% | 100.00% |
| Image + NDMI (Tree, 1000; Mtry Square root; Node, 6) | 97.65% | 0.967 | 98.31% | 88.46% | 97.48% | 100.00% |
| Image + NDMI + NDSI (Tree, 100; Mtry Square root; Node, 6) | 97.65% | 0.967 | 98.31% | 88.46% | 97.48% | 100.00% |
| Image + NDMI + NDSI (Tree, 500; Mtry Square root; Node, 6) | 97.65% | 0.967 | 98.31% | 88.46% | 97.48% | 100.00% |
| Image + NDMI + NDSI (Tree, 1000; Mtry Square root; Node, 6) | 97.65% | 0.967 | 98.31% | 88.46% | 97.48% | 100.00% |
| Image + NDMI + NDSI + DEM (Tree, 100; Mtry Square root; Node, 6) | 96.77% | 0.955 | 100.00% | 80.77% | 96.72% | 100.00% |
| Image + NDMI + NDSI + DEM (Tree, 500; Mtry Square root; Node, 6) | 96.77% | 0.955 | 100.00% | 80.77% | 96.72% | 100.00% |
| Image + NDMI + NDSI + DEM (Tree, 1000; Mtry Square root; Node, 6) | 96.77% | 0.955 | 100.00% | 80.77% | 96.72% | 100.00% |
| MODEL | OA (%) | Kappa | Mangrove PA (%) | Non-Mangrove PA (%) | Mangrove UA (%) | Non-Mangrove UA (%) |
|---|---|---|---|---|---|---|
| Image (Tree, 100; Mtry All Variables; Node, 6) | 96.89% | 0.955 | 100.00% | 92.90% | 93.94% | 100.00% |
| Image (Tree, 500; Mtry All Variables; Node, 6) | 96.89% | 0.955 | 100.00% | 92.90% | 93.94% | 100.00% |
| Image (Tree, 1000; Mtry All Variables; Node, 6) | 96.89% | 0.955 | 100.00% | 92.90% | 93.94% | 100.00% |
| Image + NDMI (Tree, 100; Mtry All Variables; Node, 6) | 96.37% | 0.947 | 99.19% | 93.55% | 93.18% | 99.32% |
| Image + NDMI (Tree, 500; Mtry All Variables; Node, 6) | 96.37% | 0.947 | 99.19% | 93.55% | 93.18% | 99.32% |
| Image + NDMI (Tree, 1000; Mtry All Variables; Node, 6) | 96.11% | 0.943 | 99.19% | 93.55% | 93.18% | 99.32% |
| Image + NDMI + NDSI (Tree, 100; Mtry All Variables; Node, 6) | 95.85% | 0.940 | 98.39% | 93.55% | 93.13% | 98.64% |
| Image + NDMI + NDSI (Tree, 500; Mtry All Variables; Node, 6) | 96.37% | 0.947 | 99.19% | 93.55% | 93.18% | 99.32% |
| Image + NDMI + NDSI (Tree, 1000; Mtry All Variables; Node, 6) | 96.37% | 0.947 | 99.19% | 93.55% | 93.18% | 99.32% |
| Image + NDMI + NDSI + DEM (Tree, 100; Mtry All Variables; Node, 6) | 97.41% | 0.943 | 100.00% | 94.19% | 94.66% | 100.00% |
| Image + NDMI + NDSI + DEM (Tree, 500; Mtry All Variables; Node, 6) | 97.15% | 0.959 | 100.00% | 94.19% | 93.23% | 100.00% |
| Image + NDMI + NDSI + DEM (Tree, 1000; Mtry All Variables; Node, 6) | 97.15% | 0.959 | 100.00% | 94.19% | 93.94% | 100.00% |
| Classes | Reference | ||||
|---|---|---|---|---|---|
| Mangrove | Non-Mangrove | Total | User Accuracy (%) | ||
| Mangrove | 101 | 3 | 104 | 97.12 | |
| Non-mangrove | 23 | 235 | 258 | 91.09 | |
| Total | 124 | 238 | 362 | ||
| Producer Accuracy (%) | 81.45 | 98.74 | Overall Accuracy | 92.82% | |
| Kappa | 0.83 | ||||
| Classes | Reference | |||||
|---|---|---|---|---|---|---|
| Mangrove | Non-Mangrove | Water | Total | User Accuracy (%) | ||
| Mangrove | 148 | 0 | 0 | 148 | 100.00 | |
| Non-mangrove | 4 | 132 | 0 | 136 | 97.06 | |
| Water | 0 | 0 | 78 | 78 | 100.00 | |
| Total | 152 | 132 | 78 | 362 | ||
| Producer Accuracy (%) | 97.37 | 100.00 | 100.00 | Overall Accuracy | 99.12% | |
| 1.3 | Kappa | 0.98 | ||||
| Classes | Reference | ||||
|---|---|---|---|---|---|
| Mangrove | Non-Mangrove | Total | User Accuracy (%) | ||
| Mangrove | 120 | 2 | 122 | 97.12 | |
| Non-mangrove | 4 | 236 | 240 | 98.33 | |
| Total | 124 | 238 | 362 | ||
| Producer Accuracy (%) | 96.77 | 99.16 | Overall Accuracy | 98.34% | |
| Kappa | 0.96 | ||||
| Classes | Reference | |||||
|---|---|---|---|---|---|---|
| Mangrove | Non-Mangrove | Water | Total | User Accuracy (%) | ||
| Mangrove | 124 | 7 | 0 | 131 | 94.66 | |
| Non-mangrove | 0 | 146 | 0 | 146 | 100.00 | |
| Water | 0 | 1 | 84 | 85 | 98.82 | |
| Total | 124 | 154 | 84 | 362 | ||
| Producer Accuracy (%) | 100.00 | 94.81 | 100.00 | Overall Accuracy | 97.79% | |
| Kappa | 0.97 | |||||
Disclaimer/Publisher’s Note: The statements, opinions and data contained in all publications are solely those of the individual author(s) and contributor(s) and not of MDPI and/or the editor(s). MDPI and/or the editor(s) disclaim responsibility for any injury to people or property resulting from any ideas, methods, instructions or products referred to in the content. |
© 2022 by the authors. Licensee MDPI, Basel, Switzerland. This article is an open access article distributed under the terms and conditions of the Creative Commons Attribution (CC BY) license (https://creativecommons.org/licenses/by/4.0/).
Share and Cite
Purwanto, A.D.; Wikantika, K.; Deliar, A.; Darmawan, S. Decision Tree and Random Forest Classification Algorithms for Mangrove Forest Mapping in Sembilang National Park, Indonesia. Remote Sens. 2023, 15, 16. https://doi.org/10.3390/rs15010016
Purwanto AD, Wikantika K, Deliar A, Darmawan S. Decision Tree and Random Forest Classification Algorithms for Mangrove Forest Mapping in Sembilang National Park, Indonesia. Remote Sensing. 2023; 15(1):16. https://doi.org/10.3390/rs15010016
Chicago/Turabian StylePurwanto, Anang Dwi, Ketut Wikantika, Albertus Deliar, and Soni Darmawan. 2023. "Decision Tree and Random Forest Classification Algorithms for Mangrove Forest Mapping in Sembilang National Park, Indonesia" Remote Sensing 15, no. 1: 16. https://doi.org/10.3390/rs15010016
APA StylePurwanto, A. D., Wikantika, K., Deliar, A., & Darmawan, S. (2023). Decision Tree and Random Forest Classification Algorithms for Mangrove Forest Mapping in Sembilang National Park, Indonesia. Remote Sensing, 15(1), 16. https://doi.org/10.3390/rs15010016