
Warming Has Accelerated the Melting of Glaciers on the Tibetan Plateau, but the Debris-Covered Glaciers Are Rapidly Expanding


 ,
,
Abstract
1. Introduction
2. Study Region and Data
2.1. Study Region
2.2. Data Sources
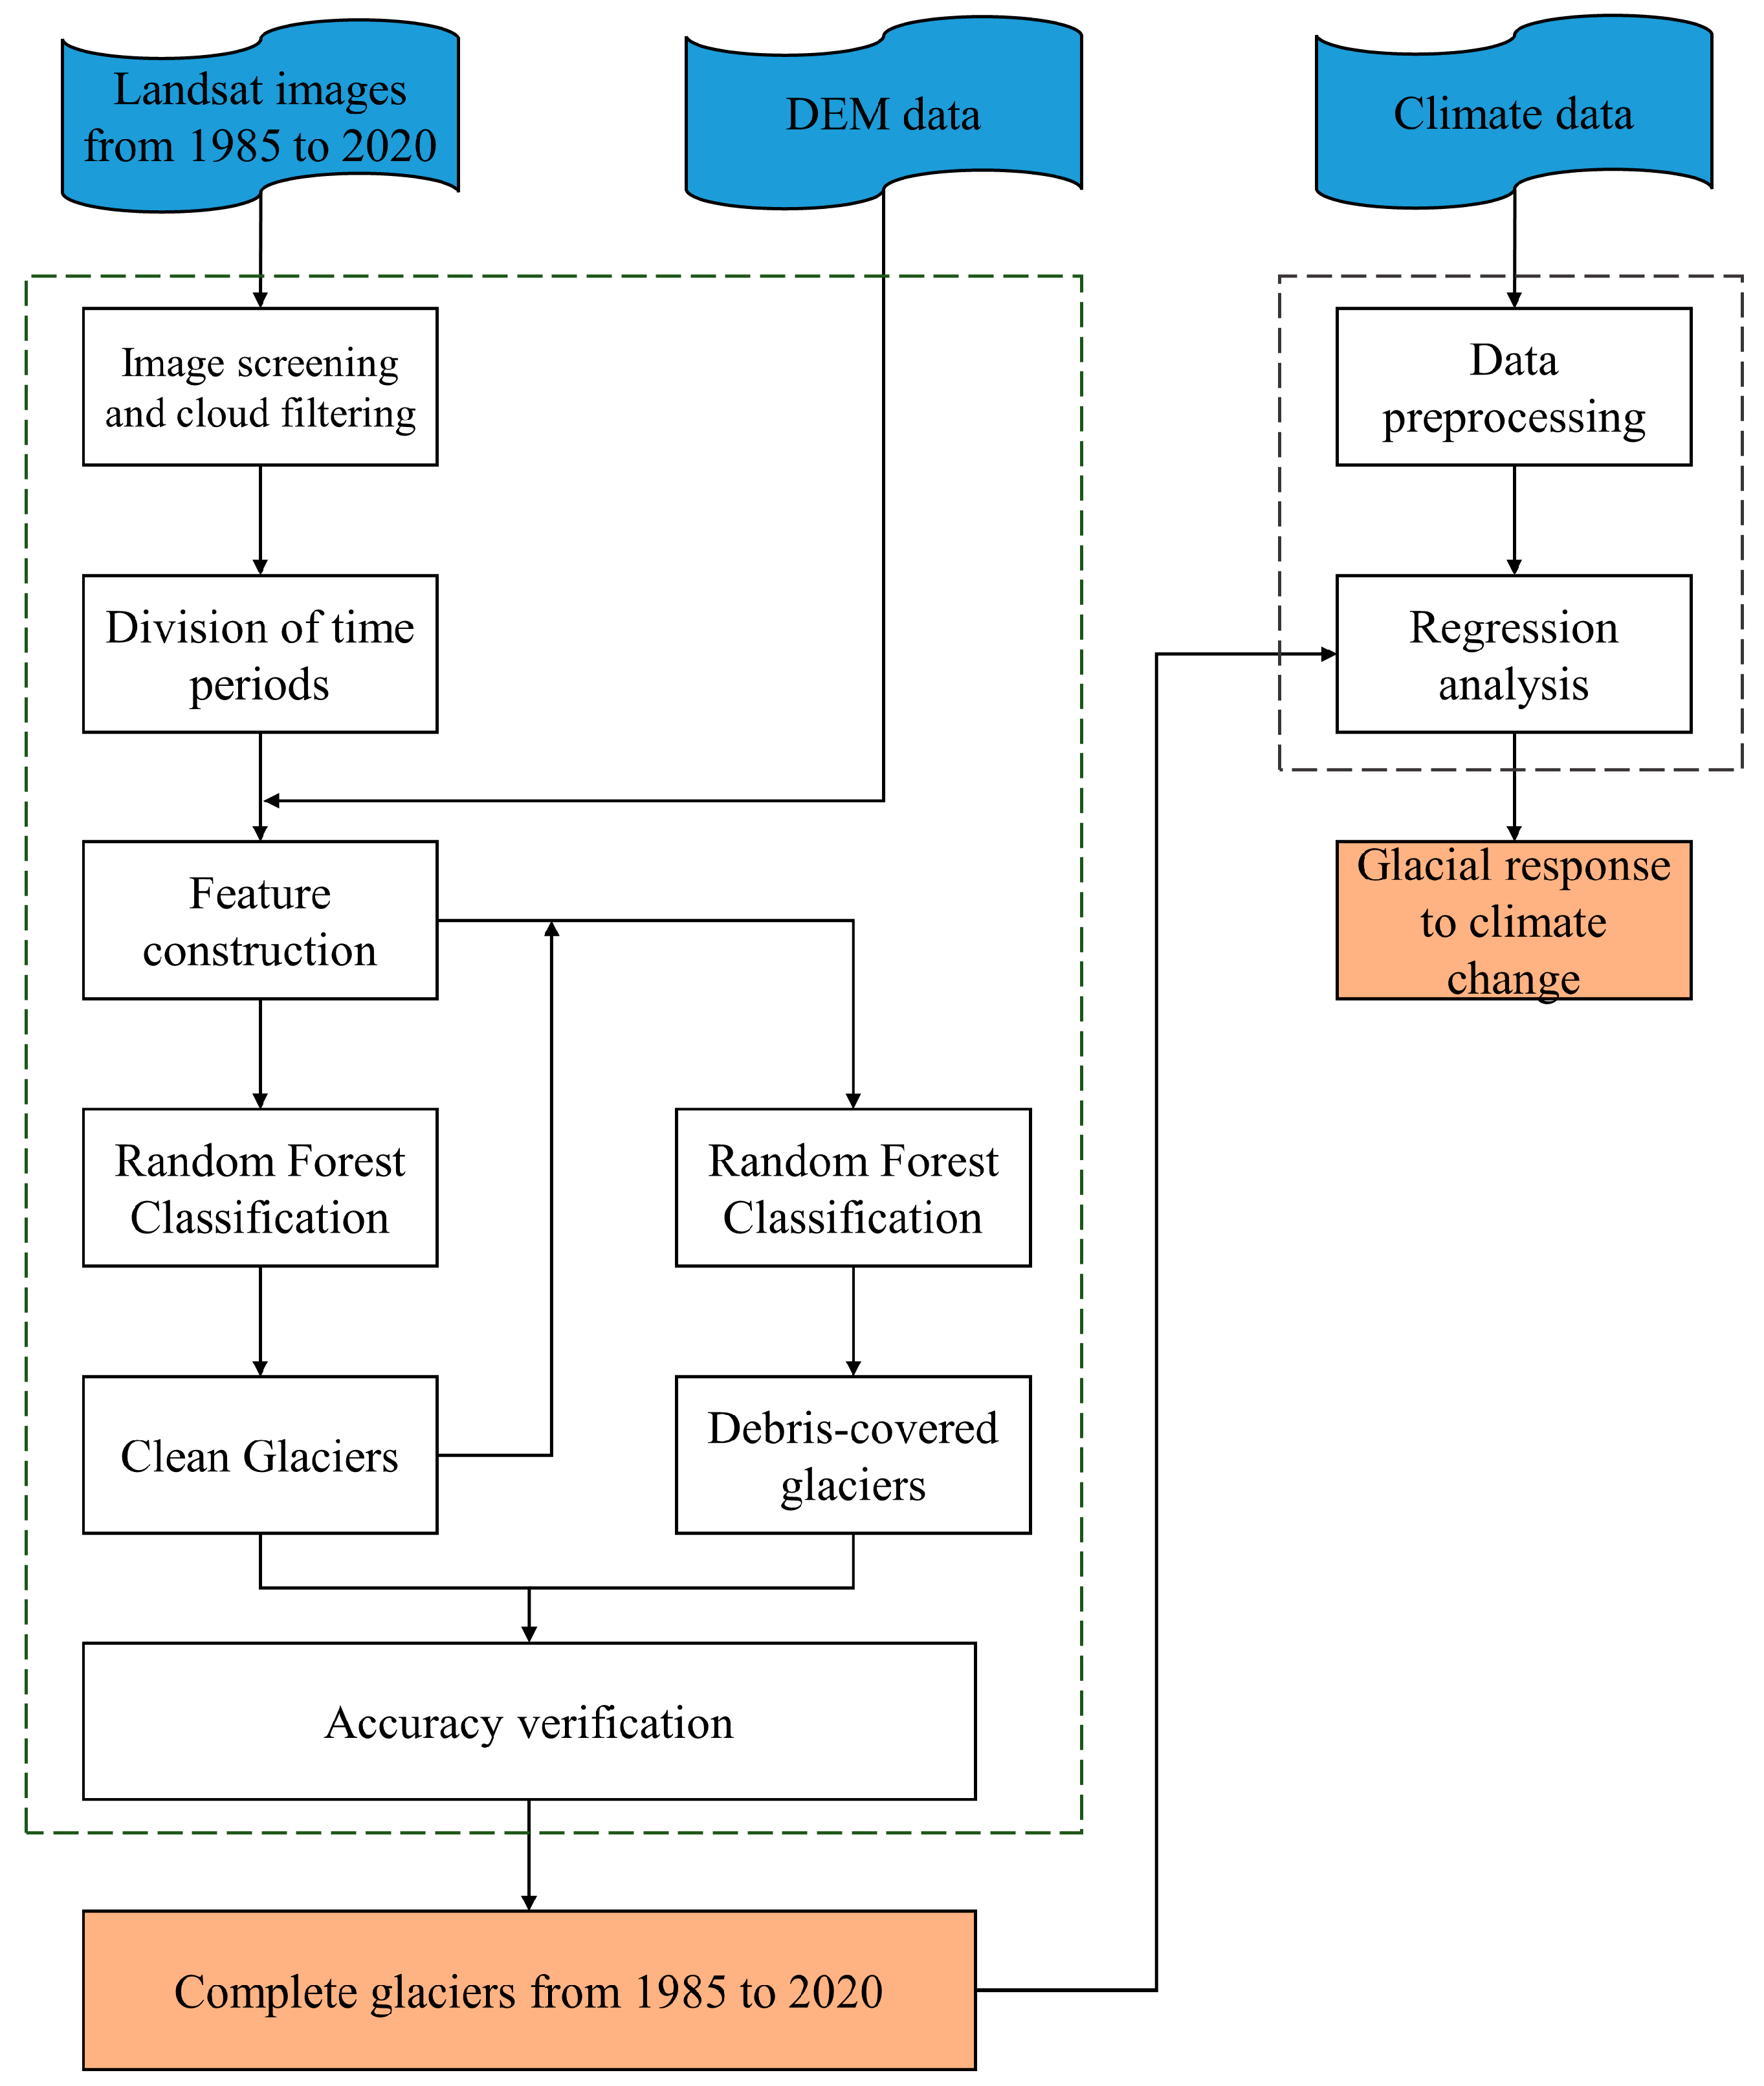
3. Method
3.1. Image Screening and Cloud Filtering
3.2. Division of Time Period
3.3. Feature Construction
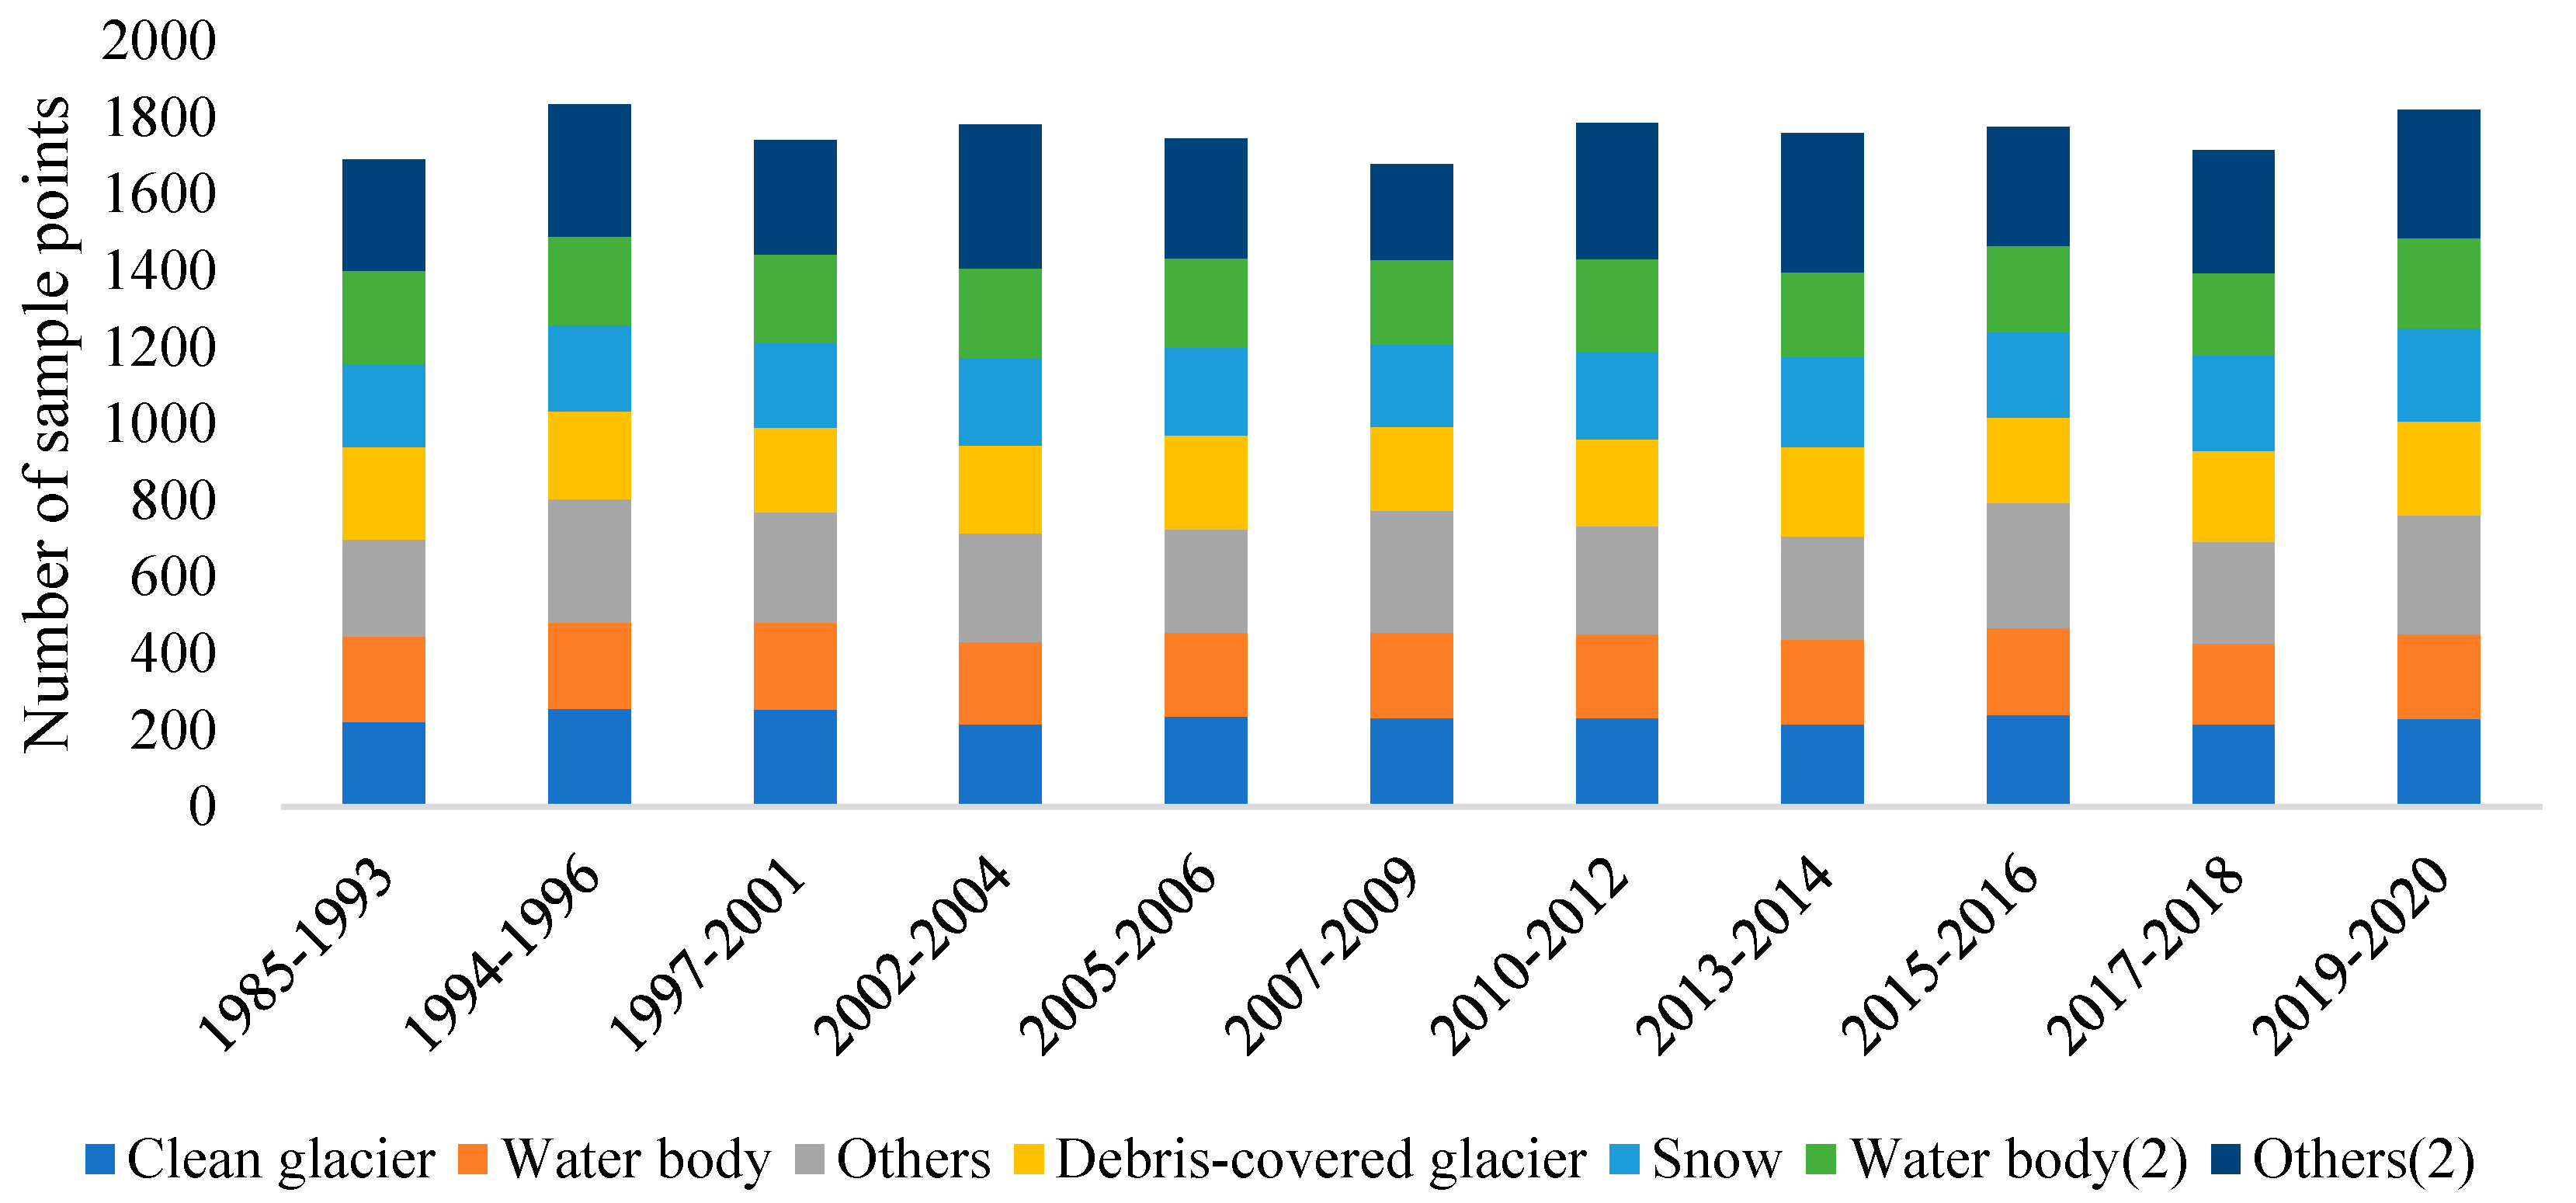
3.4. Sample Point Selection
3.5. Accuracy Validation
3.6. Post-Classification Processing
4. Results and Analysis
4.1. Accuracy Verification of Glacier Extraction
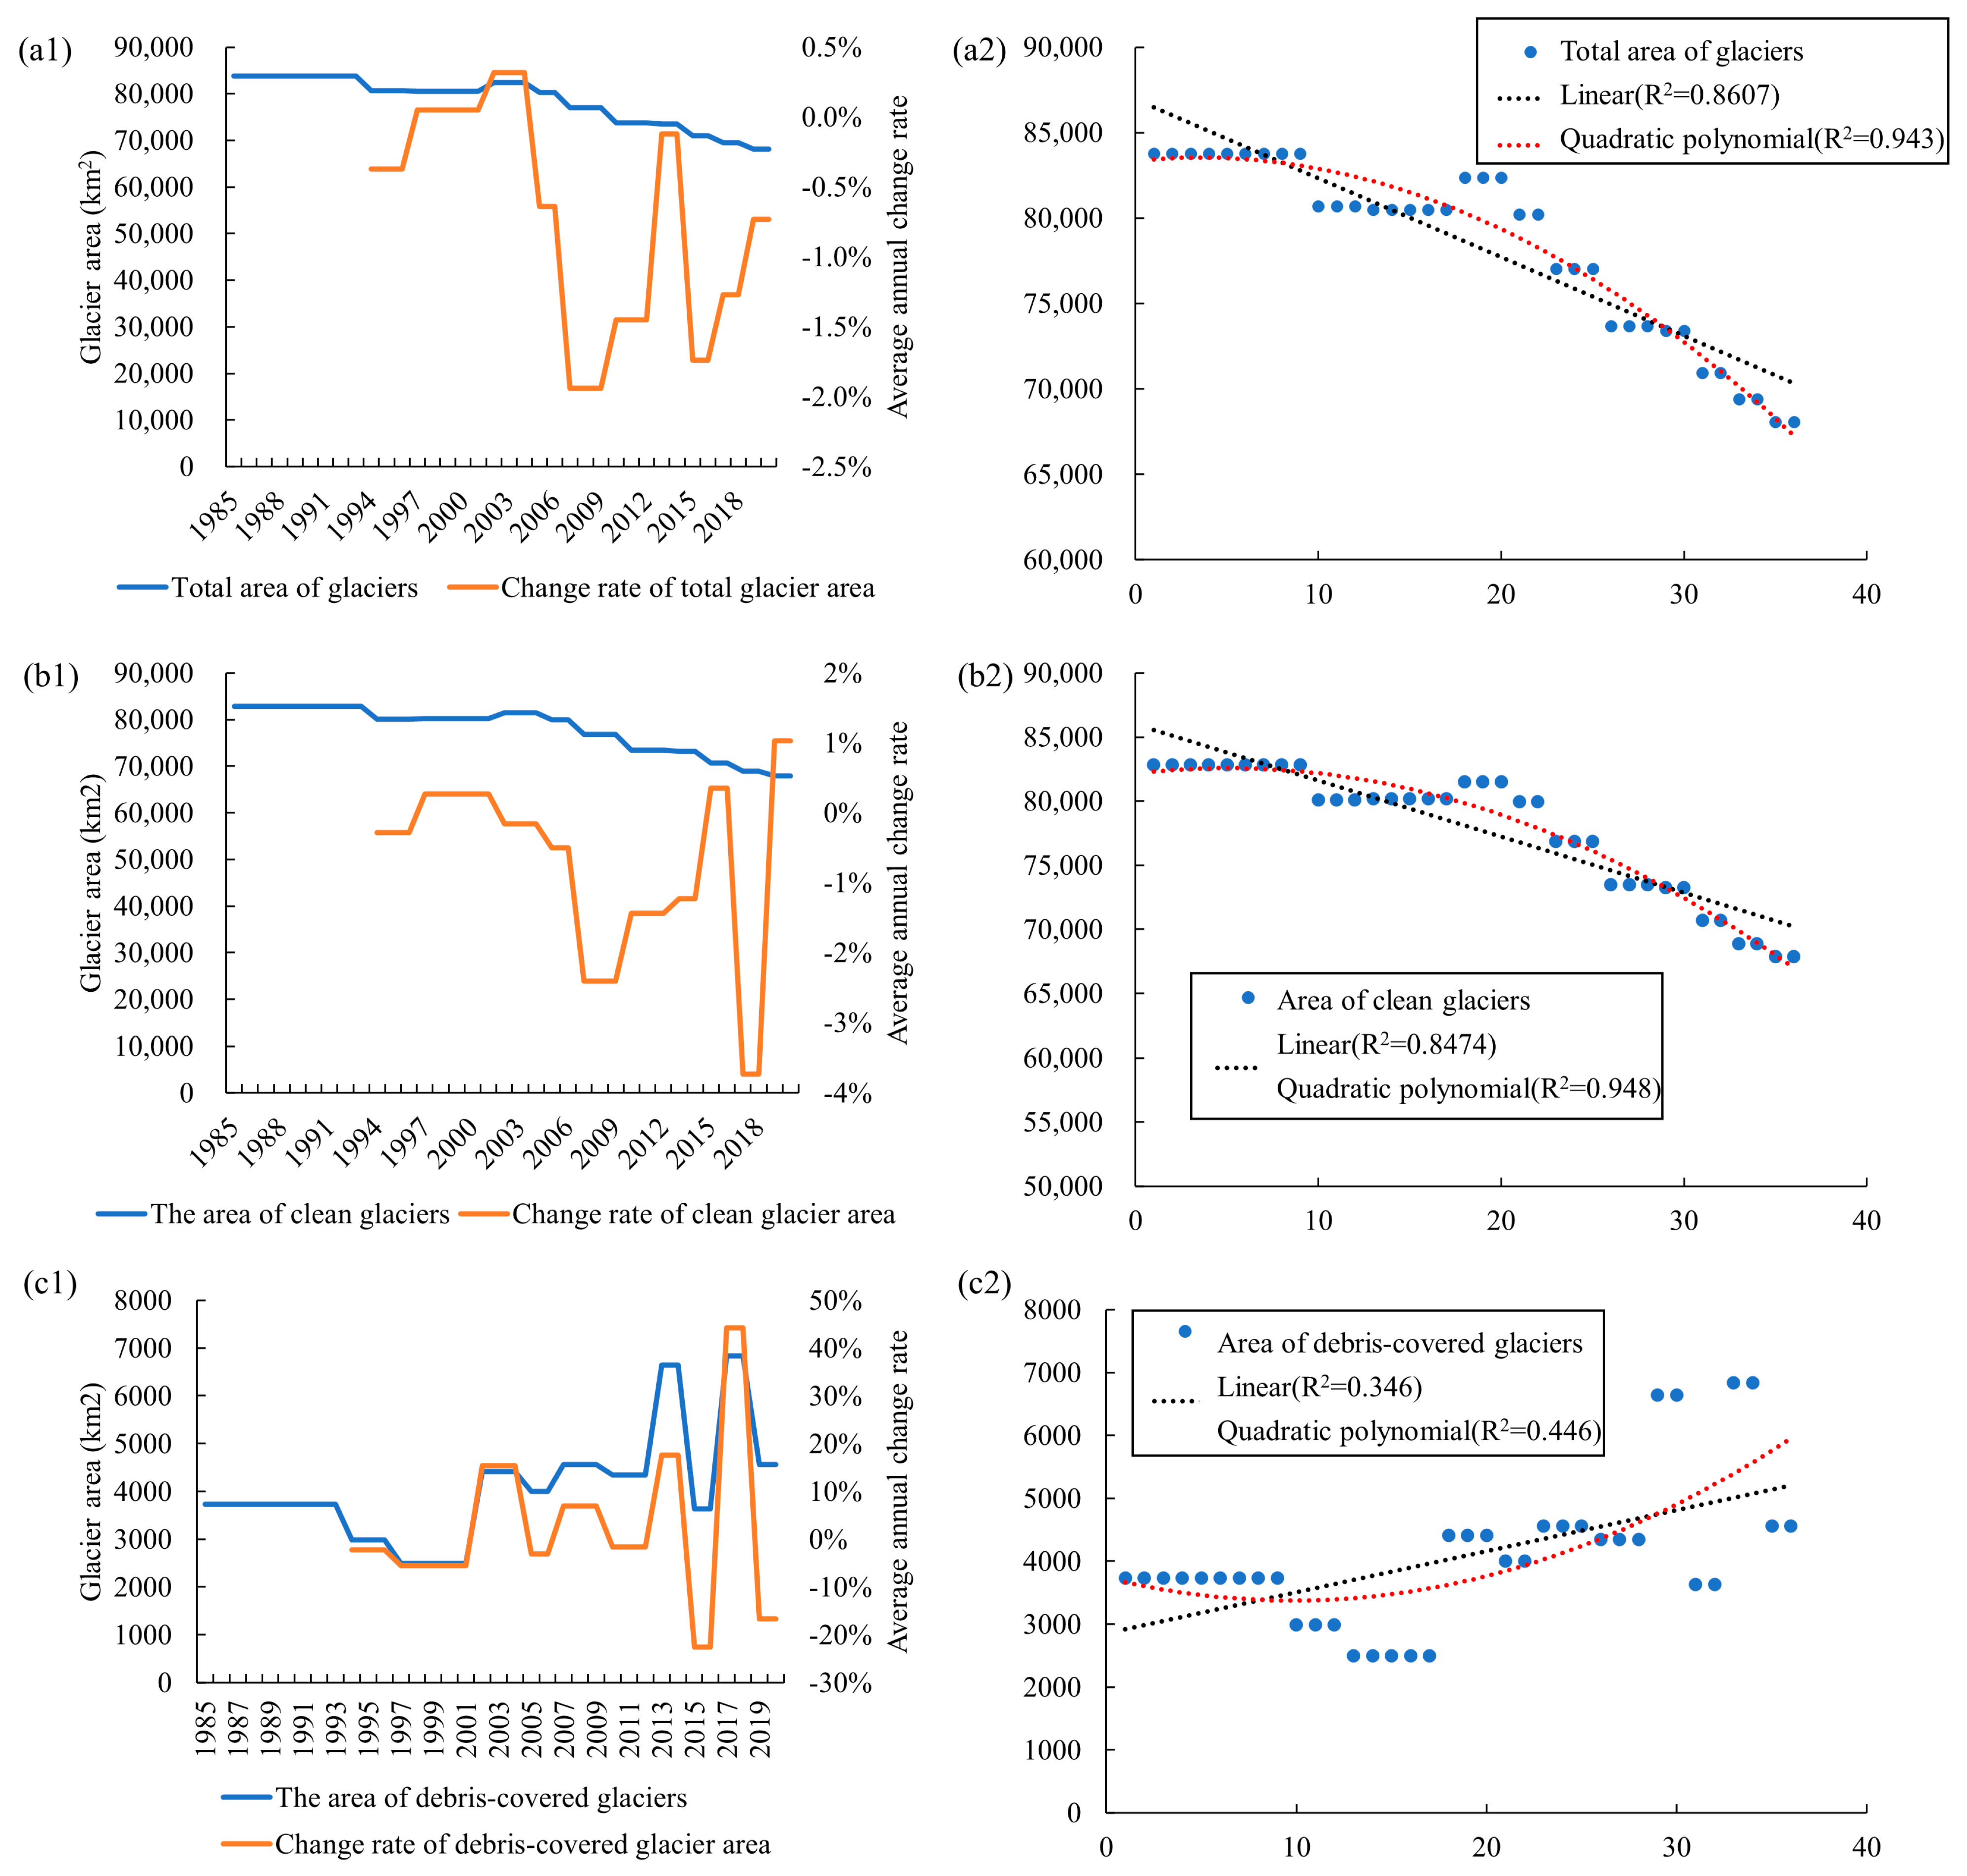
4.2. Spatial and Temporal Changes of Glaciers
4.3. Glacier Changes in Different Basins
4.4. Geographical Characteristics of Glacier Distribution
4.4.1. Glacier Distribution at Different Elevations
4.4.2. Glacier Distribution at Different Slopes
4.4.3. Glacier Distribution in Different Aspects
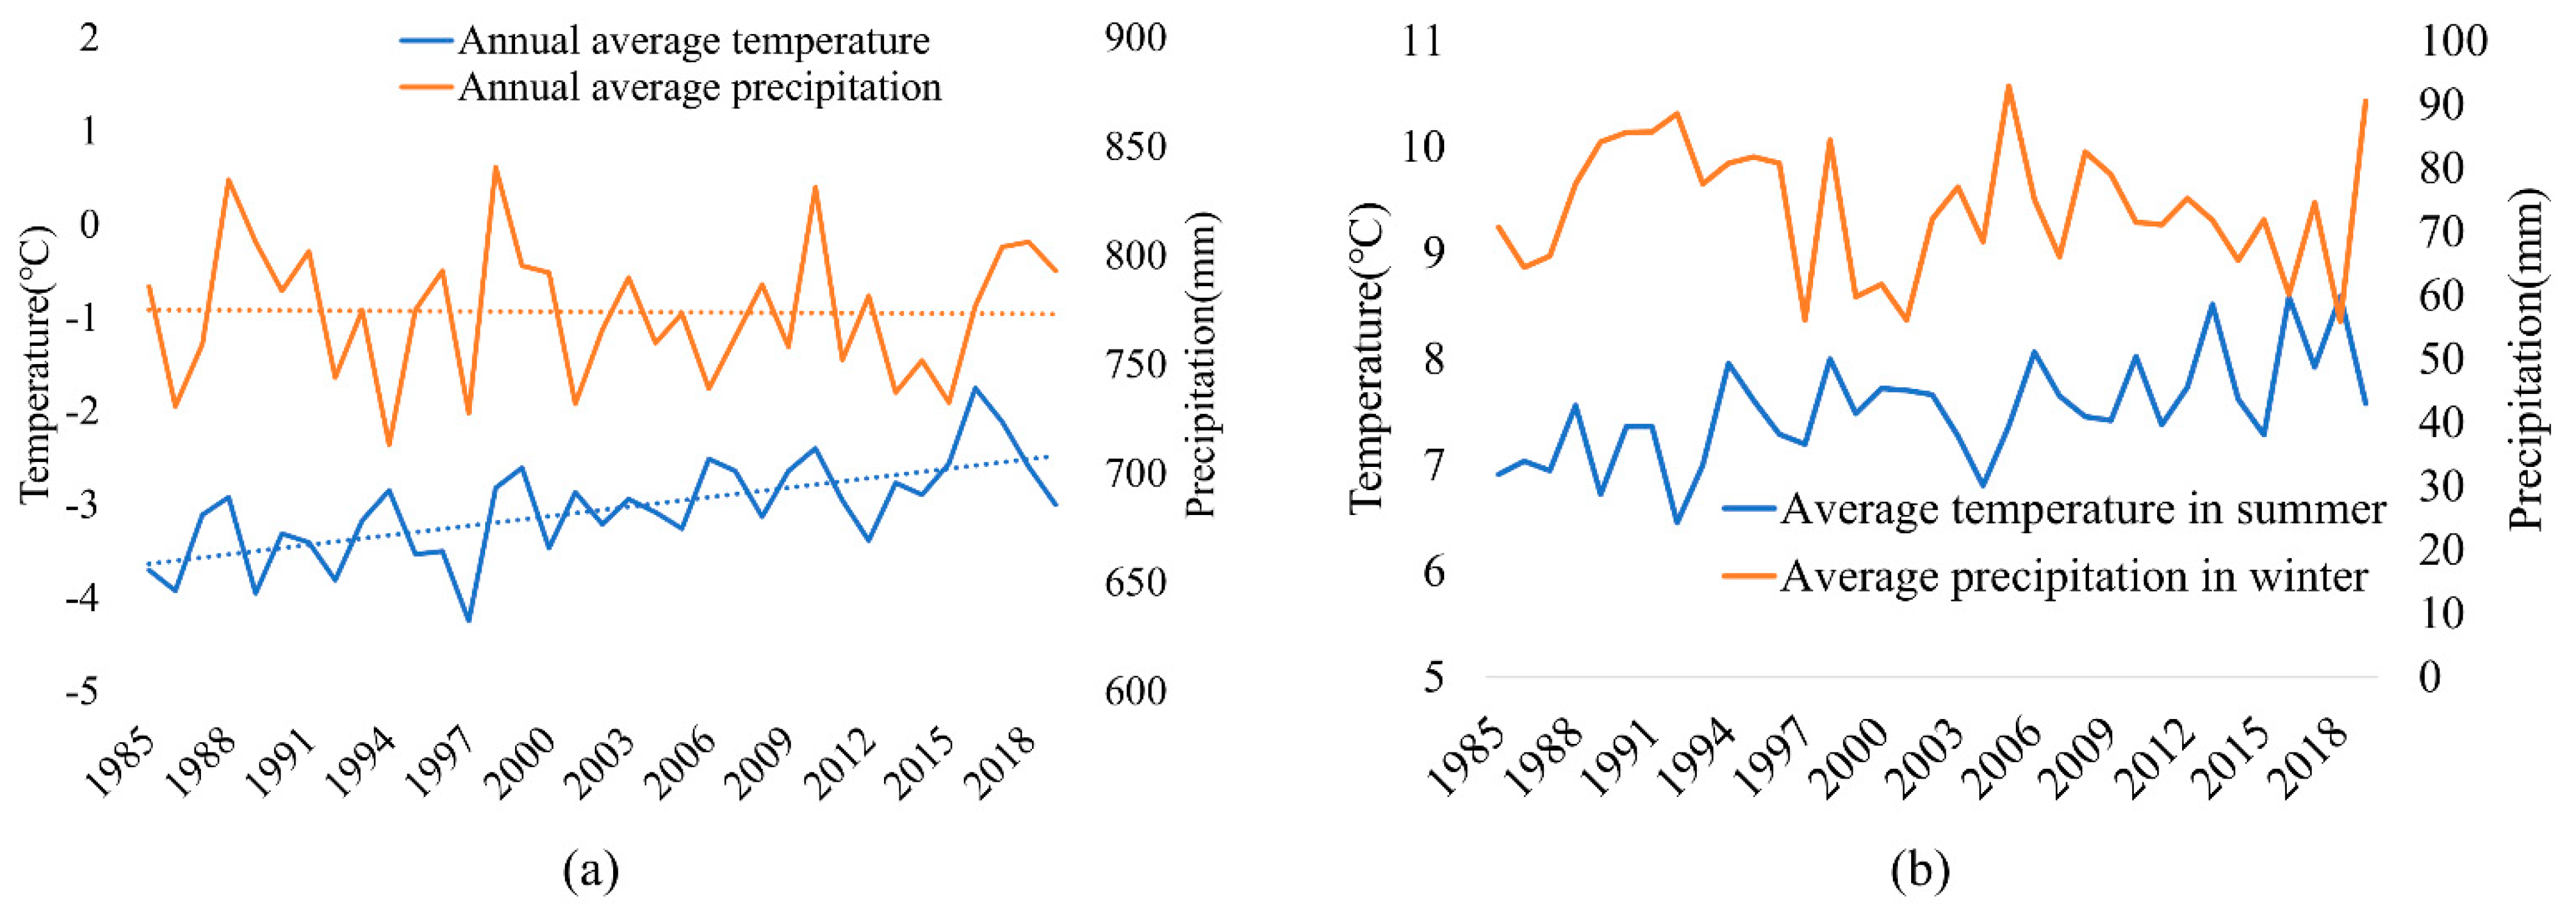
4.5. The Relationship of Glacier Changes with Climate
5. Discussion
5.1. Comparison of Glacier Extraction Results with Existing Studies
5.1.1. Glacier Extraction Results
5.1.2. Change Rate of Glaciers
5.2. Possible Causes of Glacier Changes
5.3. Limitations
5.3.1. Factors Affecting Glacier Identification
5.3.2. Relationship between Glacier Change and Climate
6. Conclusions
Author Contributions
Funding
Data Availability Statement
Acknowledgments
Conflicts of Interest
References
- Ruddiman, W.F.; Kutzbach, J.E. Plateau uplift and climatic change. Sci. Am. 1991, 264, 66–75. [Google Scholar] [CrossRef]
- Molnar, P.; England, P.; Martinod, J. Mantle dynamics, uplift of the Tibetan Plateau, and the Indian Monsoon. Rev. Geophys. 1993, 31, 357–396. [Google Scholar] [CrossRef]
- Asahi, K. Equilibrium-line altitudes of the present and Last Glacial Maximum in the eastern Nepal Himalayas and their implications for SW monsoon climate. Quat. Int. 2010, 212, 26–34. [Google Scholar] [CrossRef]
- Zemp, M.; Huss, M.; Thibert, E.; Eckert, N.; McNabb, R.; Huber, J.; Barandun, M.; Machguth, H.; Nussbaumer, S.U.; Gärtner-Roer, I. Global glacier mass changes and their contributions to sea-level rise from 1961 to 2016. Nature 2019, 568, 382–386. [Google Scholar] [CrossRef] [PubMed]
- Kääb, A.; Berthier, E.; Nuth, C.; Gardelle, J.; Arnaud, Y. Contrasting patterns of early twenty-first-century glacier mass change in the Himalayas. Nature 2012, 488, 495–498. [Google Scholar] [CrossRef]
- Yao, T.; Thompson, L.; Yang, W.; Yu, W.; Gao, Y.; Guo, X.; Yang, X.; Duan, K.; Zhao, H.; Xu, B. Different glacier status with atmospheric circulations in Tibetan Plateau and surroundings. Nat. Clim. Chang. 2012, 2, 663–667. [Google Scholar] [CrossRef]
- Gardner, A.S.; Moholdt, G.; Cogley, J.G.; Wouters, B.; Arendt, A.A.; Wahr, J.; Berthier, E.; Hock, R.; Pfeffer, W.T.; Kaser, G. A reconciled estimate of glacier contributions to sea level rise: 2003 to 2009. Science 2013, 340, 852–857. [Google Scholar] [CrossRef]
- Hugonnet, R.; McNabb, R.; Berthier, E.; Menounos, B.; Nuth, C.; Girod, L.; Farinotti, D.; Huss, M.; Dussaillant, I.; Brun, F. Accelerated global glacier mass loss in the early twenty-first century. Nature 2021, 592, 726–731. [Google Scholar] [CrossRef]
- Farinotti, D.; Longuevergne, L.; Moholdt, G.; Duethmann, D.; Mölg, T.; Bolch, T.; Vorogushyn, S.; Güntner, A. Substantial glacier mass loss in the Tien Shan over the past 50 years. Nat. Geosci. 2015, 8, 716–722. [Google Scholar] [CrossRef]
- Neckel, N.; Kropáček, J.; Bolch, T.; Hochschild, V. Glacier mass changes on the Tibetan Plateau 2003–2009 derived from ICESat laser altimetry measurements. Environ. Res. Lett. 2014, 9, 014009. [Google Scholar] [CrossRef]
- Kääb, A.; Treichler, D.; Nuth, C.; Berthier, E. Brief Communication: Contending estimates of 2003–2008 glacier mass balance over the Pamir–Karakoram–Himalaya. Cryosphere 2015, 9, 557–564. [Google Scholar] [CrossRef]
- Xie, F.; Liu, S.; Gao, Y.; Zhu, Y.; Bolch, T.; Kääb, A.; Duan, S.; Miao, W.; Kang, J.; Zhang, Y. Interdecadal glacier inventories in the Karakoram since the 1990s. Earth Syst. Sci. Data Discuss. 2022, 1–27. [Google Scholar] [CrossRef]
- Gardelle, J.; Berthier, E.; Arnaud, Y. Slight mass gain of Karakoram glaciers in the early twenty-first century. Nat. Geosci. 2012, 5, 322–325. [Google Scholar] [CrossRef]
- Hewitt, K. The Karakoram Anomaly? Glacier Expansion and the ‘Elevation Effect’, Karakoram Himalaya. Mt. Res. Dev. 2005, 25, 332–340. [Google Scholar] [CrossRef]
- Scherler, D.; Bookhagen, B.; Strecker, M.R. Spatially variable response of Himalayan glaciers to climate change affected by debris cover. Nat. Geosci. 2011, 4, 156–159. [Google Scholar] [CrossRef]
- Khan, A.; Naz, B.S.; Bowling, L.C. Separating snow, clean and debris covered ice in the Upper Indus Basin, Hindukush-Karakoram-Himalayas, using Landsat images between 1998 and 2002. J. Hydrol. 2015, 521, 46–64. [Google Scholar] [CrossRef]
- Zhang, J.; Jia, L.; Menenti, M.; Hu, G. Glacier facies mapping using a machine-learning algorithm: The Parlung Zangbo Basin case study. Remote Sens. 2019, 11, 452. [Google Scholar] [CrossRef]
- Scherler, D.; Wulf, H.; Gorelick, N. Global assessment of supraglacial debris—Cover extents. Geophys. Res. Lett. 2018, 45, 11798–711805. [Google Scholar] [CrossRef]
- Zhang, Z.; Liu, S.; Wei, J.; Xu, J.; Guo, W.; Bao, W.; Jiang, Z. Mass Change of Glaciers in Muztag Ata–Kongur Tagh, Eastern Pamir, China from 1971/76 to 2013/14 as Derived from Remote Sensing Data. PLoS ONE 2016, 11, e0147327. [Google Scholar] [CrossRef]
- Nicholson, L.; Benn, D.I. Calculating ice melt beneath a debris layer using meteorological data. J. Glaciol. 2006, 52, 463–470. [Google Scholar] [CrossRef]
- Istrem, G. Ice melting under a thin layer of moraine and the existence of ice cores in moraine ridge. Geogr. Ann. 1959, 41, 228–230. [Google Scholar]
- Kulkarni, A.; Srinivasulu, J.; Manjul, S.; Mathur, P. Field based spectral reflectance studies to develop NDSI method for snow cover monitoring. J. Indian Soc. Remote Sens. 2002, 30, 73–80. [Google Scholar] [CrossRef]
- Zhang, M.; Wang, X.; Shi, C.; Yan, D. Automated Glacier Extraction Index by Optimization of Red/SWIR and NIR/SWIR Ratio Index for Glacier Mapping Using Landsat Imagery. Water 2019, 11, 1223. [Google Scholar] [CrossRef]
- Bolch, T.; Menounos, B.; Wheate, R. Landsat-based inventory of glaciers in western Canada, 1985–2005. Remote Sens. Environ. 2010, 114, 127–137. [Google Scholar] [CrossRef]
- Khan, A.A.; Jamil, A.; Hussain, D.; Taj, M.; Jabeen, G.; Malik, M.K. Machine-learning algorithms for mapping debris-covered glaciers: The Hunza Basin case study. IEEE Access 2020, 8, 12725–12734. [Google Scholar] [CrossRef]
- Lu, Y.; Zhang, Z.; Huang, D. Glacier Mapping Based on Random Forest Algorithm: A Case Study over the Eastern Pamir. Water 2020, 12, 3231. [Google Scholar] [CrossRef]
- Robson, B.A.; Nuth, C.; Dahl, S.O.; Hölbling, D.; Strozzi, T.; Nielsen, P.R. Automated classification of debris-covered glaciers combining optical, SAR and topographic data in an object-based environment. Remote Sens. Environ. 2015, 170, 372–387. [Google Scholar] [CrossRef]
- Bennett, M.M.; Glasser, N.F. Glacial Geology: Ice Sheets and Landforms; John Wiley & Sons: Hoboken, NJ, USA, 2011. [Google Scholar]
- Paul, F.; Huggel, C.; Kääb, A. Combining satellite multispectral image data and a digital elevation model for mapping debris-covered glaciers. Remote Sens. Environ. 2004, 89, 510–518. [Google Scholar] [CrossRef]
- Frey, H.; Paul, F. On the suitability of the SRTM DEM and ASTER GDEM for the compilation of topographic parameters in glacier inventories. Int. J. Appl. Earth Obs. Geoinf. 2012, 18, 480–490. [Google Scholar] [CrossRef]
- Patel, A.; Prajapati, R.; Dharpure, J.K.; Mani, S.; Chauhan, D. Mapping and monitoring of glacier areal changes using multispectral and elevation data: A case study over Chhota-Shigri glacier. Earth Sci. Inform. 2019, 12, 489–499. [Google Scholar] [CrossRef]
- Bolch, T.; Buchroithner, M.F.; Kunert, A.; Kamp, U. Automated delineation of debris-covered glaciers based on ASTER data. In Proceedings of the Geoinformation in Europe, 27th EARSeL Symposium, Bolzano, Italy, 4–7 June 2007; pp. 4–6. [Google Scholar]
- Singh, V.; Goyal, M.K. An improved coupled framework for Glacier classification: An integration of optical and thermal infrared remote-sensing bands. Int. J. Remote Sens. 2018, 39, 6864–6892. [Google Scholar] [CrossRef]
- Taschner, S.; Ranzi, R. Comparing the opportunities of Landsat-TM and Aster data for monitoring a debris covered glacier in the Italian Alps within the GLIMS project. In Proceedings of the IEEE International Geoscience and Remote Sensing Symposium, Toronto, ON, Canada, 24–28 June 2002; pp. 1044–1046. [Google Scholar]
- Smith, T.; Bookhagen, B.; Cannon, F. Improving Semi-Automated Glacier Mapping with a Multi-Method Approach: Applications in Central Asia. Cryosphere 2015, 9, 1747–1759. [Google Scholar] [CrossRef]
- Janke, J.R.; Bellisario, A.C.; Ferrando, F.A. Classification of debris-covered glaciers and rock glaciers in the Andes of central Chile. Geomorphology 2015, 241, 98–121. [Google Scholar] [CrossRef]
- Lippl, S.; Vijay, S.; Braun, M. Automatic delineation of debris-covered glaciers using InSAR coherence derived from X-, C-and L-band radar data: A case study of Yazgyl Glacier. J. Glaciol. 2018, 64, 811–821. [Google Scholar] [CrossRef]
- Holobâcă, I.-H.; Tielidze, L.G.; Ivan, K.; Elizbarashvili, M.; Alexe, M.; Germain, D.; Petrescu, S.H.; Pop, O.T.; Gaprindashvili, G. Multi-sensor remote sensing to map glacier debris cover in the Greater Caucasus, Georgia. J. Glaciol. 2021, 67, 685–696. [Google Scholar] [CrossRef]
- Racoviteanu, A.; Williams, M.W. Decision tree and texture analysis for mapping debris-covered glaciers in the Kangchenjunga area, Eastern Himalaya. Remote Sens. 2012, 4, 3078–3109. [Google Scholar] [CrossRef]
- Hu, M.; Zhou, G.; Lv, X.; Zhou, L.; He, X.; Tian, Z. A New Automatic Extraction Method for Glaciers on the Tibetan Plateau under Clouds, Shadows and Snow Cover. Remote Sens. 2022, 14, 3084. [Google Scholar] [CrossRef]
- Gorelick, N.; Hancher, M.; Dixon, M.; Ilyushchenko, S.; Thau, D.; Moore, R. Google Earth Engine: Planetary-scale geospatial analysis for everyone. Remote Sens. Environ. 2017, 202, 18–27. [Google Scholar] [CrossRef]
- Hird, J.N.; Kariyeva, J.; McDermid, G.J. Satellite Time Series and Google Earth Engine Democratize the Process of Forest-Recovery Monitoring over Large Areas. Remote Sens. 2021, 13, 4745. [Google Scholar] [CrossRef]
- Zhang, Y.; Li, B.; Zheng, D. A discussion on the boundary and area of the Tibetan Plateau in China. Geogr. Res. 2002, 21, 1–8. [Google Scholar] [CrossRef]
- Bohner, J. General climatic controls and topoclimatic variations in Central and High Asia. Boreas 2006, 35, 279–295. [Google Scholar] [CrossRef]
- Zhang, G. Dataset of River Basins Map over the TP(2016); National Tibetan Plateau/Third Pole Environment Data Center: Beijing, China, 2019. [Google Scholar] [CrossRef]
- Scaramuzza, P.; Micijevic, E.; Chander, G. SLC gap-filled products phase one methodology. Landsat Tech. Notes 2004, 5, 1–5. [Google Scholar]
- Farr, T.G.; Rosen, P.A.; Caro, E.; Crippen, R.; Duren, R.; Hensley, S.; Kobrick, M.; Paller, M.; Rodriguez, E.; Roth, L. The shuttle radar topography mission. Rev. Geophys. 2007, 45, RG2004. [Google Scholar] [CrossRef]
- Defries, R.S.; Townshend, J.R.G. NDVI-derived land cover classifications at a global scale. Int. J. Remote Sens. 1994, 15, 3567–3586. [Google Scholar] [CrossRef]
- Hao, Z.; AghaKouchak, A. Multivariate standardized drought index: A parametric multi-index model. Adv. Water Resour. 2013, 57, 12–18. [Google Scholar] [CrossRef]
- Yan, D.; Huang, C.; Ma, N.; Zhang, Y. Improved landsat-based water and snow indices for extracting lake and snow cover/glacier in the tibetan plateau. Water 2020, 12, 1339. [Google Scholar] [CrossRef]
- Yarbrough, L.D.; Easson, G.; Kuszmaul, J.S. Proposed workflow for improved Kauth–Thomas transform derivations. Remote Sens. Environ. 2012, 124, 810–818. [Google Scholar] [CrossRef]
- Alazawi, S.A.; Shati, N.M.; Abbas, A.H. Texture features extraction based on GLCM for face retrieval system. Period. Eng. Nat. Sci. (PEN) 2019, 7, 1459–1467. [Google Scholar] [CrossRef]
- Zourarakis, D.P. Remote Sensing Handbook–Volume I: Remotely Sensed Data Characterization, Classification, and Accuracies. Photogramm. Eng. Remote Sens. 2018, 84, 481. [Google Scholar] [CrossRef]
- Huang, X.; Lu, Q.; Zhang, L.; Plaza, A. New postprocessing methods for remote sensing image classification: A systematic study. IEEE Trans. Geosci. Remote Sens. 2014, 52, 7140–7159. [Google Scholar] [CrossRef]
- Luo, K. Comparison of three realization methods of remote sensing image classification post-processing. For. Investig. Plan. 2008, 3, 24–26. [Google Scholar]
- Li, S.; Li, D.; Zhao, P.; Zhang, G. The climatic characteristics of vapor transportation in rainy season of the origin area of three rivers in Qinhai-Xizang Plateau. Acta Meteor. Sin. 2009, 67, 591–598. [Google Scholar]
- Siyang, D.; Xian, X.; Manhou, X. Influence of climate change on water environment in the Qinghai-Tibet Plateau. Arid Land Geogr. 2013, 36, 841–853. [Google Scholar]
- Raper, S.; Brown, O.; Braithwaite, R. A geometric glacier model for sea-level change calculations. J. Glaciol. 2000, 46, 357–368. [Google Scholar] [CrossRef]
- Oerlemans, J. Extracting a climate signal from 169 glacier records. Science 2005, 308, 675–677. [Google Scholar] [CrossRef]
- RGI Consortium. Randolph Glacier Inventory—A Dataset of Global Glacier Outlines, Version 6; NSIDC: National Snow and Ice Data Center: Boulder, CO, USA, 2017. [Google Scholar] [CrossRef]
- Liu, S.; Yao, X.; Guo, W.; Xu, J.; Shangguan, D.; Wei, J.; Bao, W.; Wu, L. The contemporary glaciers in China based on the Second Chinese Glacier Inventory. Acta Geogr. Sin. 2015, 70, 3–16. [Google Scholar]
- Ran, W.; Wang, X.; Guo, w.; Zhao, H.; Zhao, X.; Liu, S.; Wei, J.; Zhang, Y. A Dataset of Glacier Inventory in Western China during 2017–2018 (V1); Science Data Bank: Beijing, China, 2021. [Google Scholar] [CrossRef]
- Ye, Q.; Zong, J.; Tian, L.; Cogley, J.G.; Song, C.; Guo, W. Glacier changes on the Tibetan Plateau derived from Landsat imagery: Mid-1970s–2000–13. J. Glaciol. 2017, 63, 273–287. [Google Scholar] [CrossRef]
- Huang, L.; Li, Z.; Zhou, J.M.; Zhang, P. An automatic method for clean glacier and nonseasonal snow area change estimation in High Mountain Asia from 1990 to 2018. Remote Sens. Environ. 2021, 258, 112376. [Google Scholar] [CrossRef]
- Lv, H. Response of Glacier Variation to Climate Change in the Himalayan Mountains, during the Last 40 Year; Lanzhou University: Lanzhou, China, 2013. [Google Scholar]
- Ninglian, W.; Tandong, Y.; Baiqing, X.; An’an, C.; Weicai, W. Spatiotemporal pattern, trend, and influence of glacier change in Tibetan Plateau and surroundings under global warming. Bull. Chin. Acad. Sci. (Chin. Version) 2019, 34, 1220–1232. [Google Scholar]
- Sorg, A.; Bolch, T.; Stoffel, M.; Solomina, O.; Beniston, M. Climate change impacts on glaciers and runoff in Tien Shan (Central Asia). Nat. Clim. Chang. 2012, 2, 725–731. [Google Scholar] [CrossRef]
- Hambrey, M.J.; Quincey, D.J.; Glasser, N.F.; Reynolds, J.M.; Richardson, S.J.; Clemmens, S. Sedimentological, geomorphological and dynamic context of debris-mantled glaciers, Mount Everest (Sagarmatha) region, Nepal. Quat. Sci. Rev. 2008, 27, 2361–2389. [Google Scholar] [CrossRef]
- Xie, F.; Liu, S.; Wu, K.; Zhu, Y.; Gao, Y.; Qi, M.; Duan, S.; Saifullah, M.; Tahir, A.A. Upward Expansion of Supra-Glacial Debris Cover in the Hunza Valley, Karakoram, During 1990~2019. Front. Earth Sci. 2020, 8, 308. [Google Scholar] [CrossRef]


| Period of Time | Image | Number of Images | Empty Pixel Rate |
|---|---|---|---|
| 1985–1993 | Landsat 5 | 4346 | 1.20% |
| 1994–1996 | Landsat 5 | 2511 | 0.80% |
| 1997–2001 | Landsat 5 | 3692 | 0.40% |
| 2002–2004 | Landsat 7 | 2415 | 1.10% |
| 2005–2006 | Landsat 7 | 2117 | 0.40% |
| 2007–2009 | Landsat 7 | 2807 | 0.30% |
| 2010–2012 | Landsat 7 | 3134 | 0.30% |
| 2013–2014 | Landsat 8 | 2897 | 0.30% |
| 2015–2016 | Landsat 8 | 3084 | 0.40% |
| 2017–2018 | Landsat 8 | 3006 | 0.80% |
| 2019–2020 | Landsat 8 | 3019 | 0.30% |
| Features | |
|---|---|
| Spectral feature | B1~B7, B10, NDVI, NDWI, NDSI, band difference, greenness, brightness, humidity, multi-temporal minimum band ratio |
| Texture feature | Second moment, contrast, correlation, variance, inverse different moment, and entropy |
| Topographic features | Elevation, slope, aspect |
| Pearson Correlation Coefficients | |
|---|---|
| Annual average temperature | −0.418571359 |
| Average temperature in summer | −0.772825141 ** |
| Annual average precipitation | 0.01301384 |
| Average precipitation in winter | 0.288317186 |
| Clean Glacier | Debris-Covered Glacier | |||
|---|---|---|---|---|
| Non-Standardized Coefficients | Standardized Coefficients | Non-Standardized Coefficients | Standardized Coefficients | |
| Constant (C) | 122,679.427 | −10,993.306 | ||
| Average temperature in summer (T) | −6394.734 | −0.452 | 1905.323 | 0.54 |
| Average precipitation in winter (P) | 27.721 | 0.037 | 11.519 | 0.061 |
| Period of Time | Results of This Study (km2) | Existing Research Results (km2) | Gap | Data Source |
|---|---|---|---|---|
| 1985–1993 | 82,814.8 | 81,820.44 | 1.2% | [60] |
| 1997–2001 *# | 38,577.474 | 42,210 ± 1621 | 4.9%−11% | [63] |
| 2005–2006 * | 44,026.84 | 43,588.16 | 1.0% | [61] |
| 2017–2018 * | 39,505.14 | 39,049.07 | 1.16% | [62] |
| Basin | Corresponding Time to Existing Studies | A | B | Source |
|---|---|---|---|---|
| Salween | 1985–2014 | −0.62 | −0.36 | [63] |
| Mekong | 1985–2014 | −1.52 | −0.78 | [63] |
| Inner Plateau | 1985–2020 | −0.31 | −0.08 ± 0.25 | [64] |
| Indus | 1985–2014 | −0.47 | −0.31 | [63] |
| Hexi Corridor | 1985–2014 | −0.52 | −0.48 | [63] |
| Yellow | 1985–2013 | −0.24 | −0.24 | [63] |
| Ganges | 1985–2020 | −0.62 | −0.51 | [65] |
| Yangtze | 1985–2014 | −0.22 | −0.36 | [63] |
| Brahmaputra | 1985–2020 | −0.50 | −0.45 | [66] |
| Amu Darya | 1985–2018 | −0.99 | −0.59 ± 0.1 | [64] |
| Tarim | 1985–2020 | −0.17 | −0.2 | [66] |
| Qaidam | 1985–2014 | −0.69 | −0.54 | [63] |
Disclaimer/Publisher’s Note: The statements, opinions and data contained in all publications are solely those of the individual author(s) and contributor(s) and not of MDPI and/or the editor(s). MDPI and/or the editor(s) disclaim responsibility for any injury to people or property resulting from any ideas, methods, instructions or products referred to in the content. |
© 2022 by the authors. Licensee MDPI, Basel, Switzerland. This article is an open access article distributed under the terms and conditions of the Creative Commons Attribution (CC BY) license (https://creativecommons.org/licenses/by/4.0/).
Share and Cite
Hu, M.; Zhou, G.; Lv, X.; Zhou, L.; Wang, X.; He, X.; Tian, Z. Warming Has Accelerated the Melting of Glaciers on the Tibetan Plateau, but the Debris-Covered Glaciers Are Rapidly Expanding. Remote Sens. 2023, 15, 132. https://doi.org/10.3390/rs15010132
Hu M, Zhou G, Lv X, Zhou L, Wang X, He X, Tian Z. Warming Has Accelerated the Melting of Glaciers on the Tibetan Plateau, but the Debris-Covered Glaciers Are Rapidly Expanding. Remote Sensing. 2023; 15(1):132. https://doi.org/10.3390/rs15010132
Chicago/Turabian StyleHu, Mingcheng, Guangsheng Zhou, Xiaomin Lv, Li Zhou, Xiaoliang Wang, Xiaohui He, and Zhihui Tian. 2023. "Warming Has Accelerated the Melting of Glaciers on the Tibetan Plateau, but the Debris-Covered Glaciers Are Rapidly Expanding" Remote Sensing 15, no. 1: 132. https://doi.org/10.3390/rs15010132
APA StyleHu, M., Zhou, G., Lv, X., Zhou, L., Wang, X., He, X., & Tian, Z. (2023). Warming Has Accelerated the Melting of Glaciers on the Tibetan Plateau, but the Debris-Covered Glaciers Are Rapidly Expanding. Remote Sensing, 15(1), 132. https://doi.org/10.3390/rs15010132