
Extraction of Micro-Doppler Feature Using LMD Algorithm Combined Supplement Feature for UAVs and Birds Classification


Abstract
:1. Introduction
- (1)
- LMD is applied to perform m-DS analysis and feature extraction on a single frame sample in the spectrogram. Compared with the currently widely used EMD method, the proposed algorithm can achieve a better m-DS separation rate and higher decomposition efficiency;
- (2)
- An RATR algorithm of UAVs and interfering targets is proposed under a new system of L band staring radar. In this algorithm, the m-DS, movement, and energy aggregation features of the target are extracted from the spectrogram to make full use of the information in the radar echo spectrogram and supplement the information in special situations;
- (3)
- Singular value decomposition (SVD) is used to remove ground clutter and noise on the spectrogram for the first time and complete the signal preprocessing part.
2. Materials and Methods
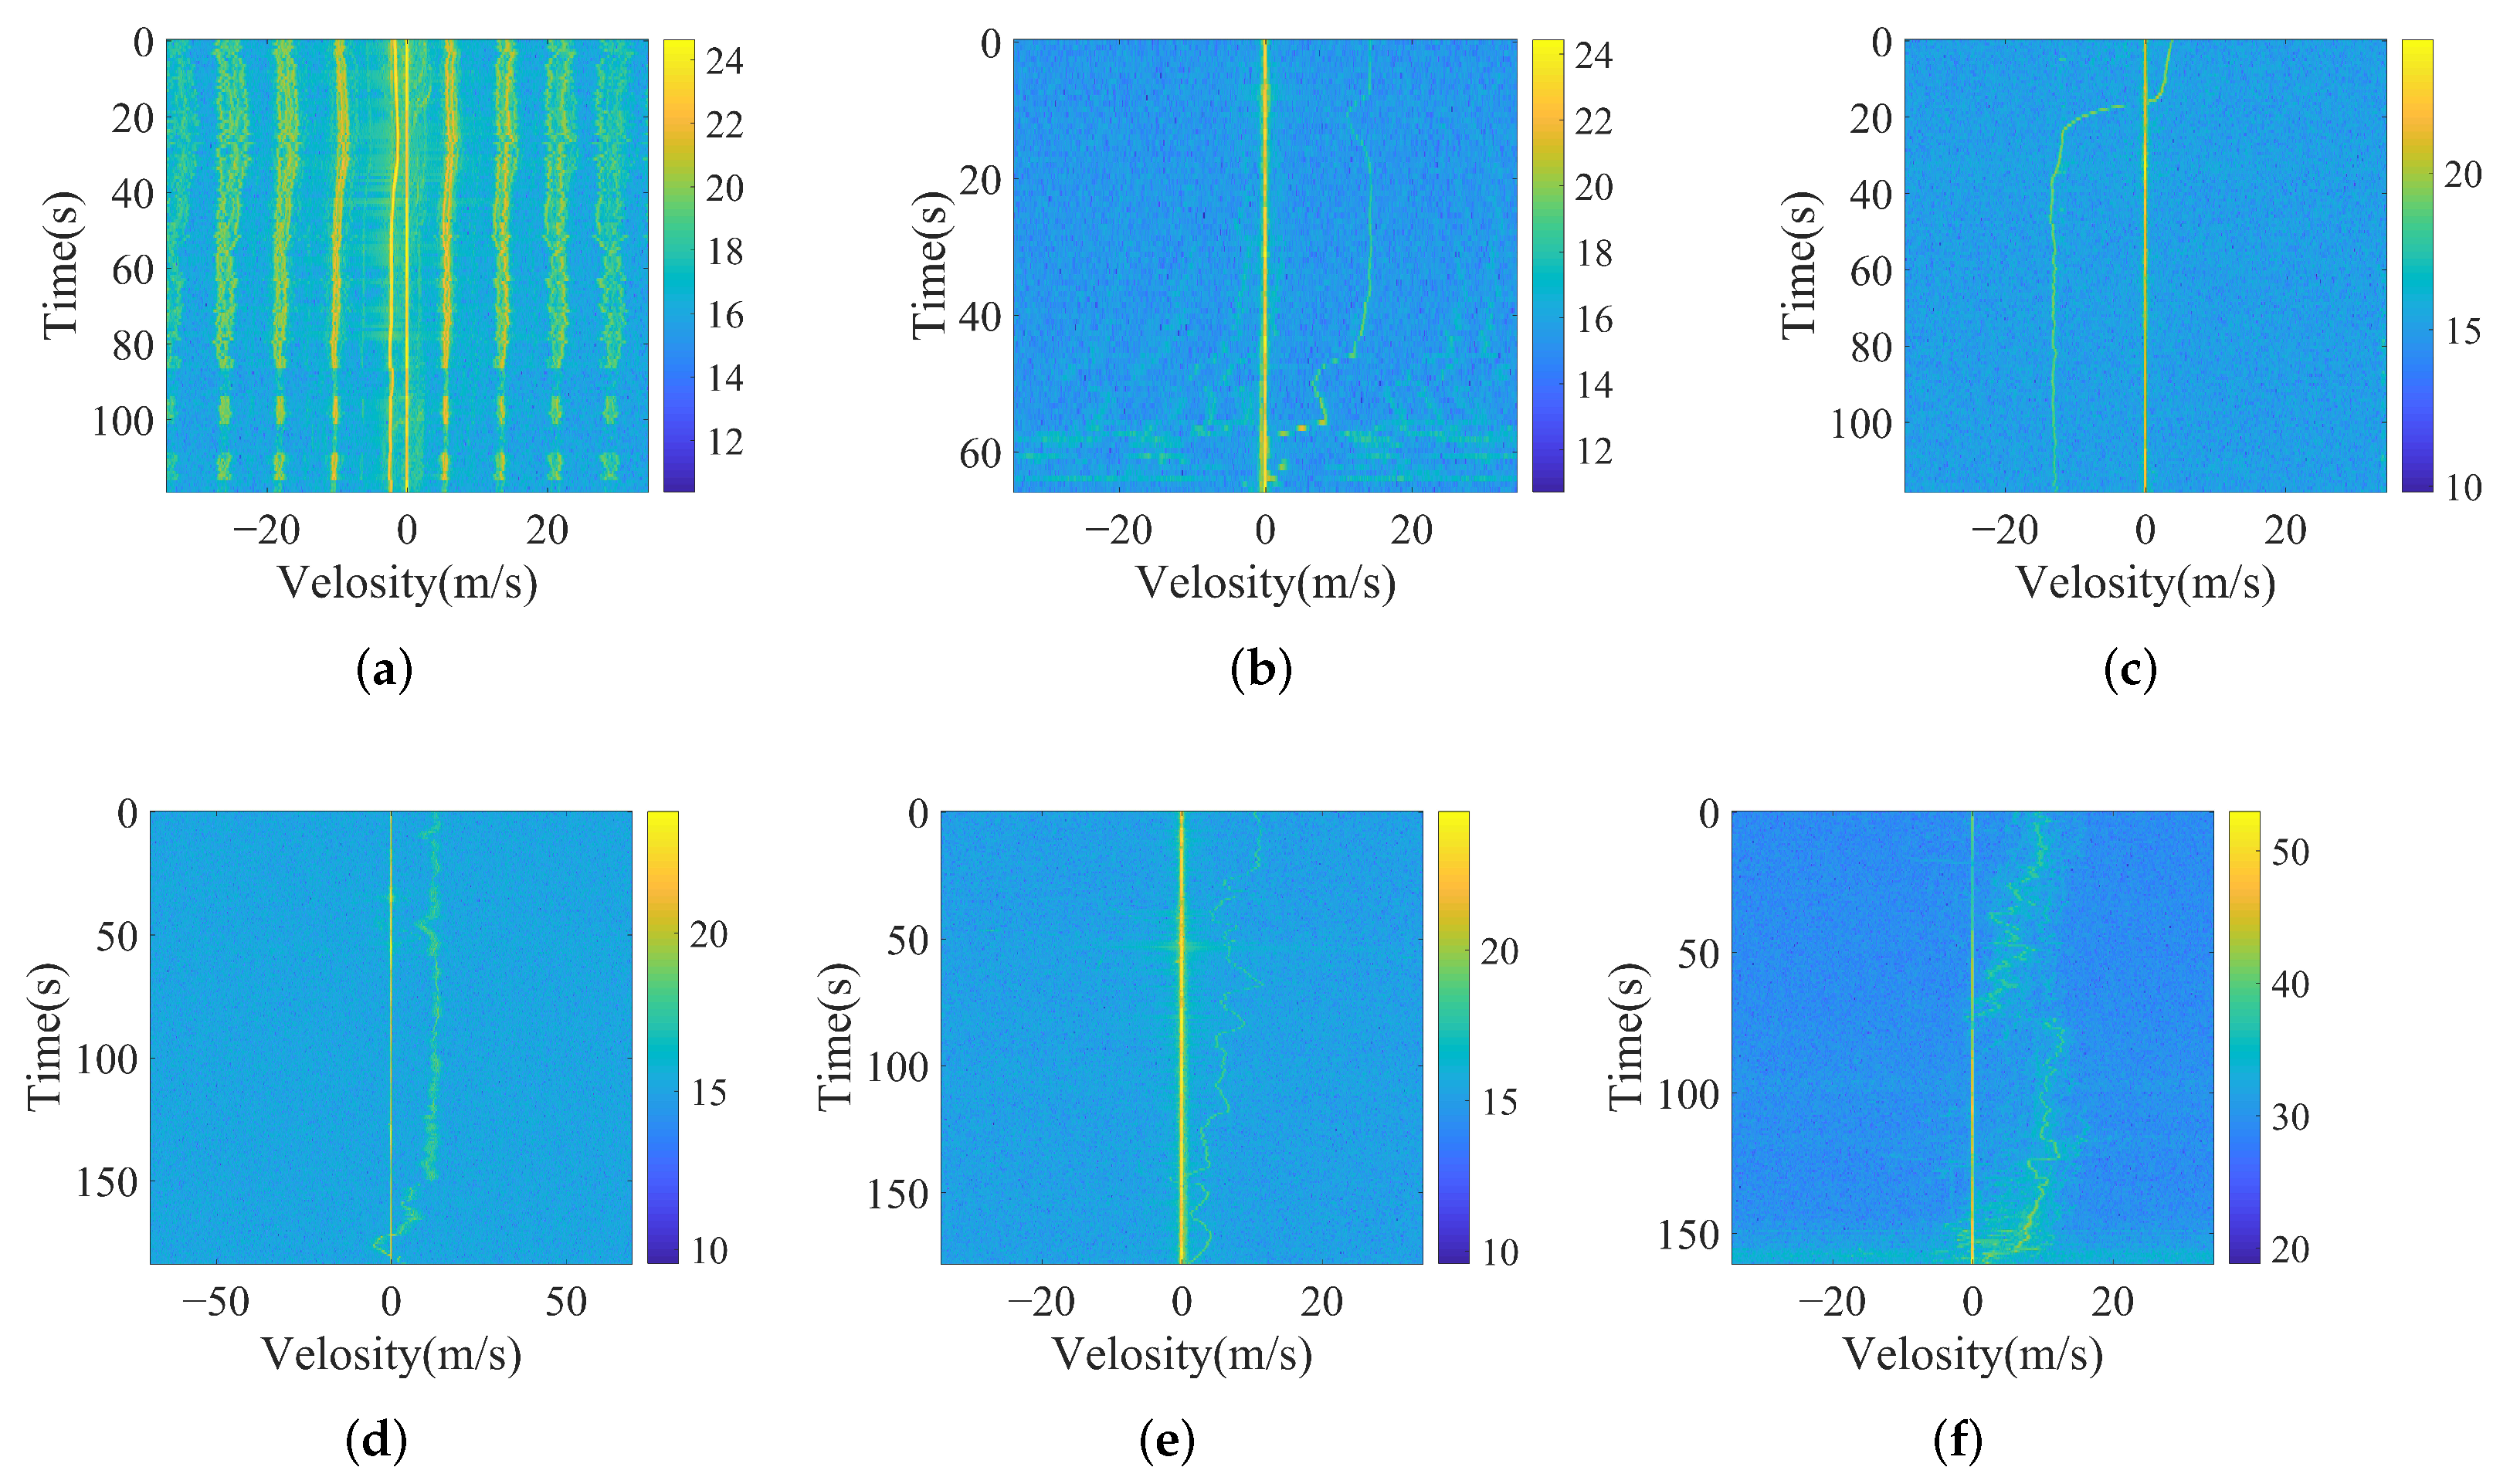
2.1. Spectrogram Characteristic Analysis of Measured Data
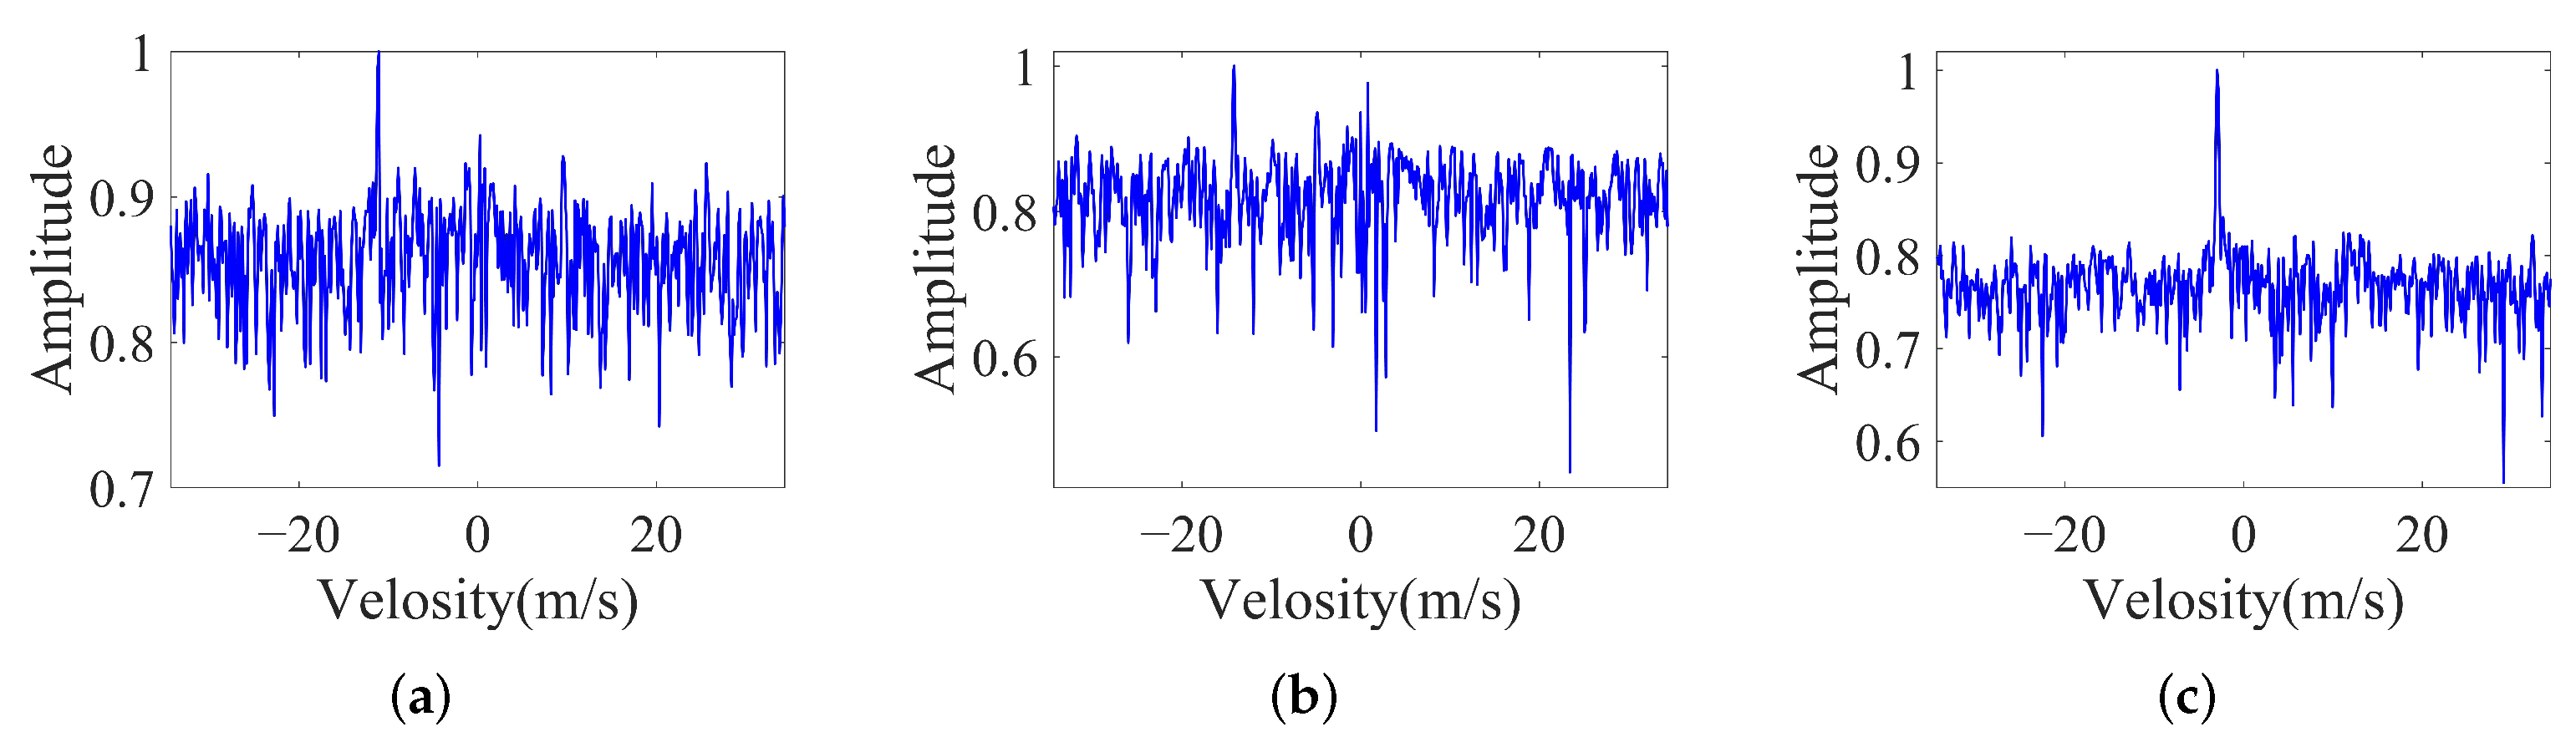
2.1.1. Characteristic 1: Micro-Doppler Signature
In the General Condition
In the Exceptional Condition
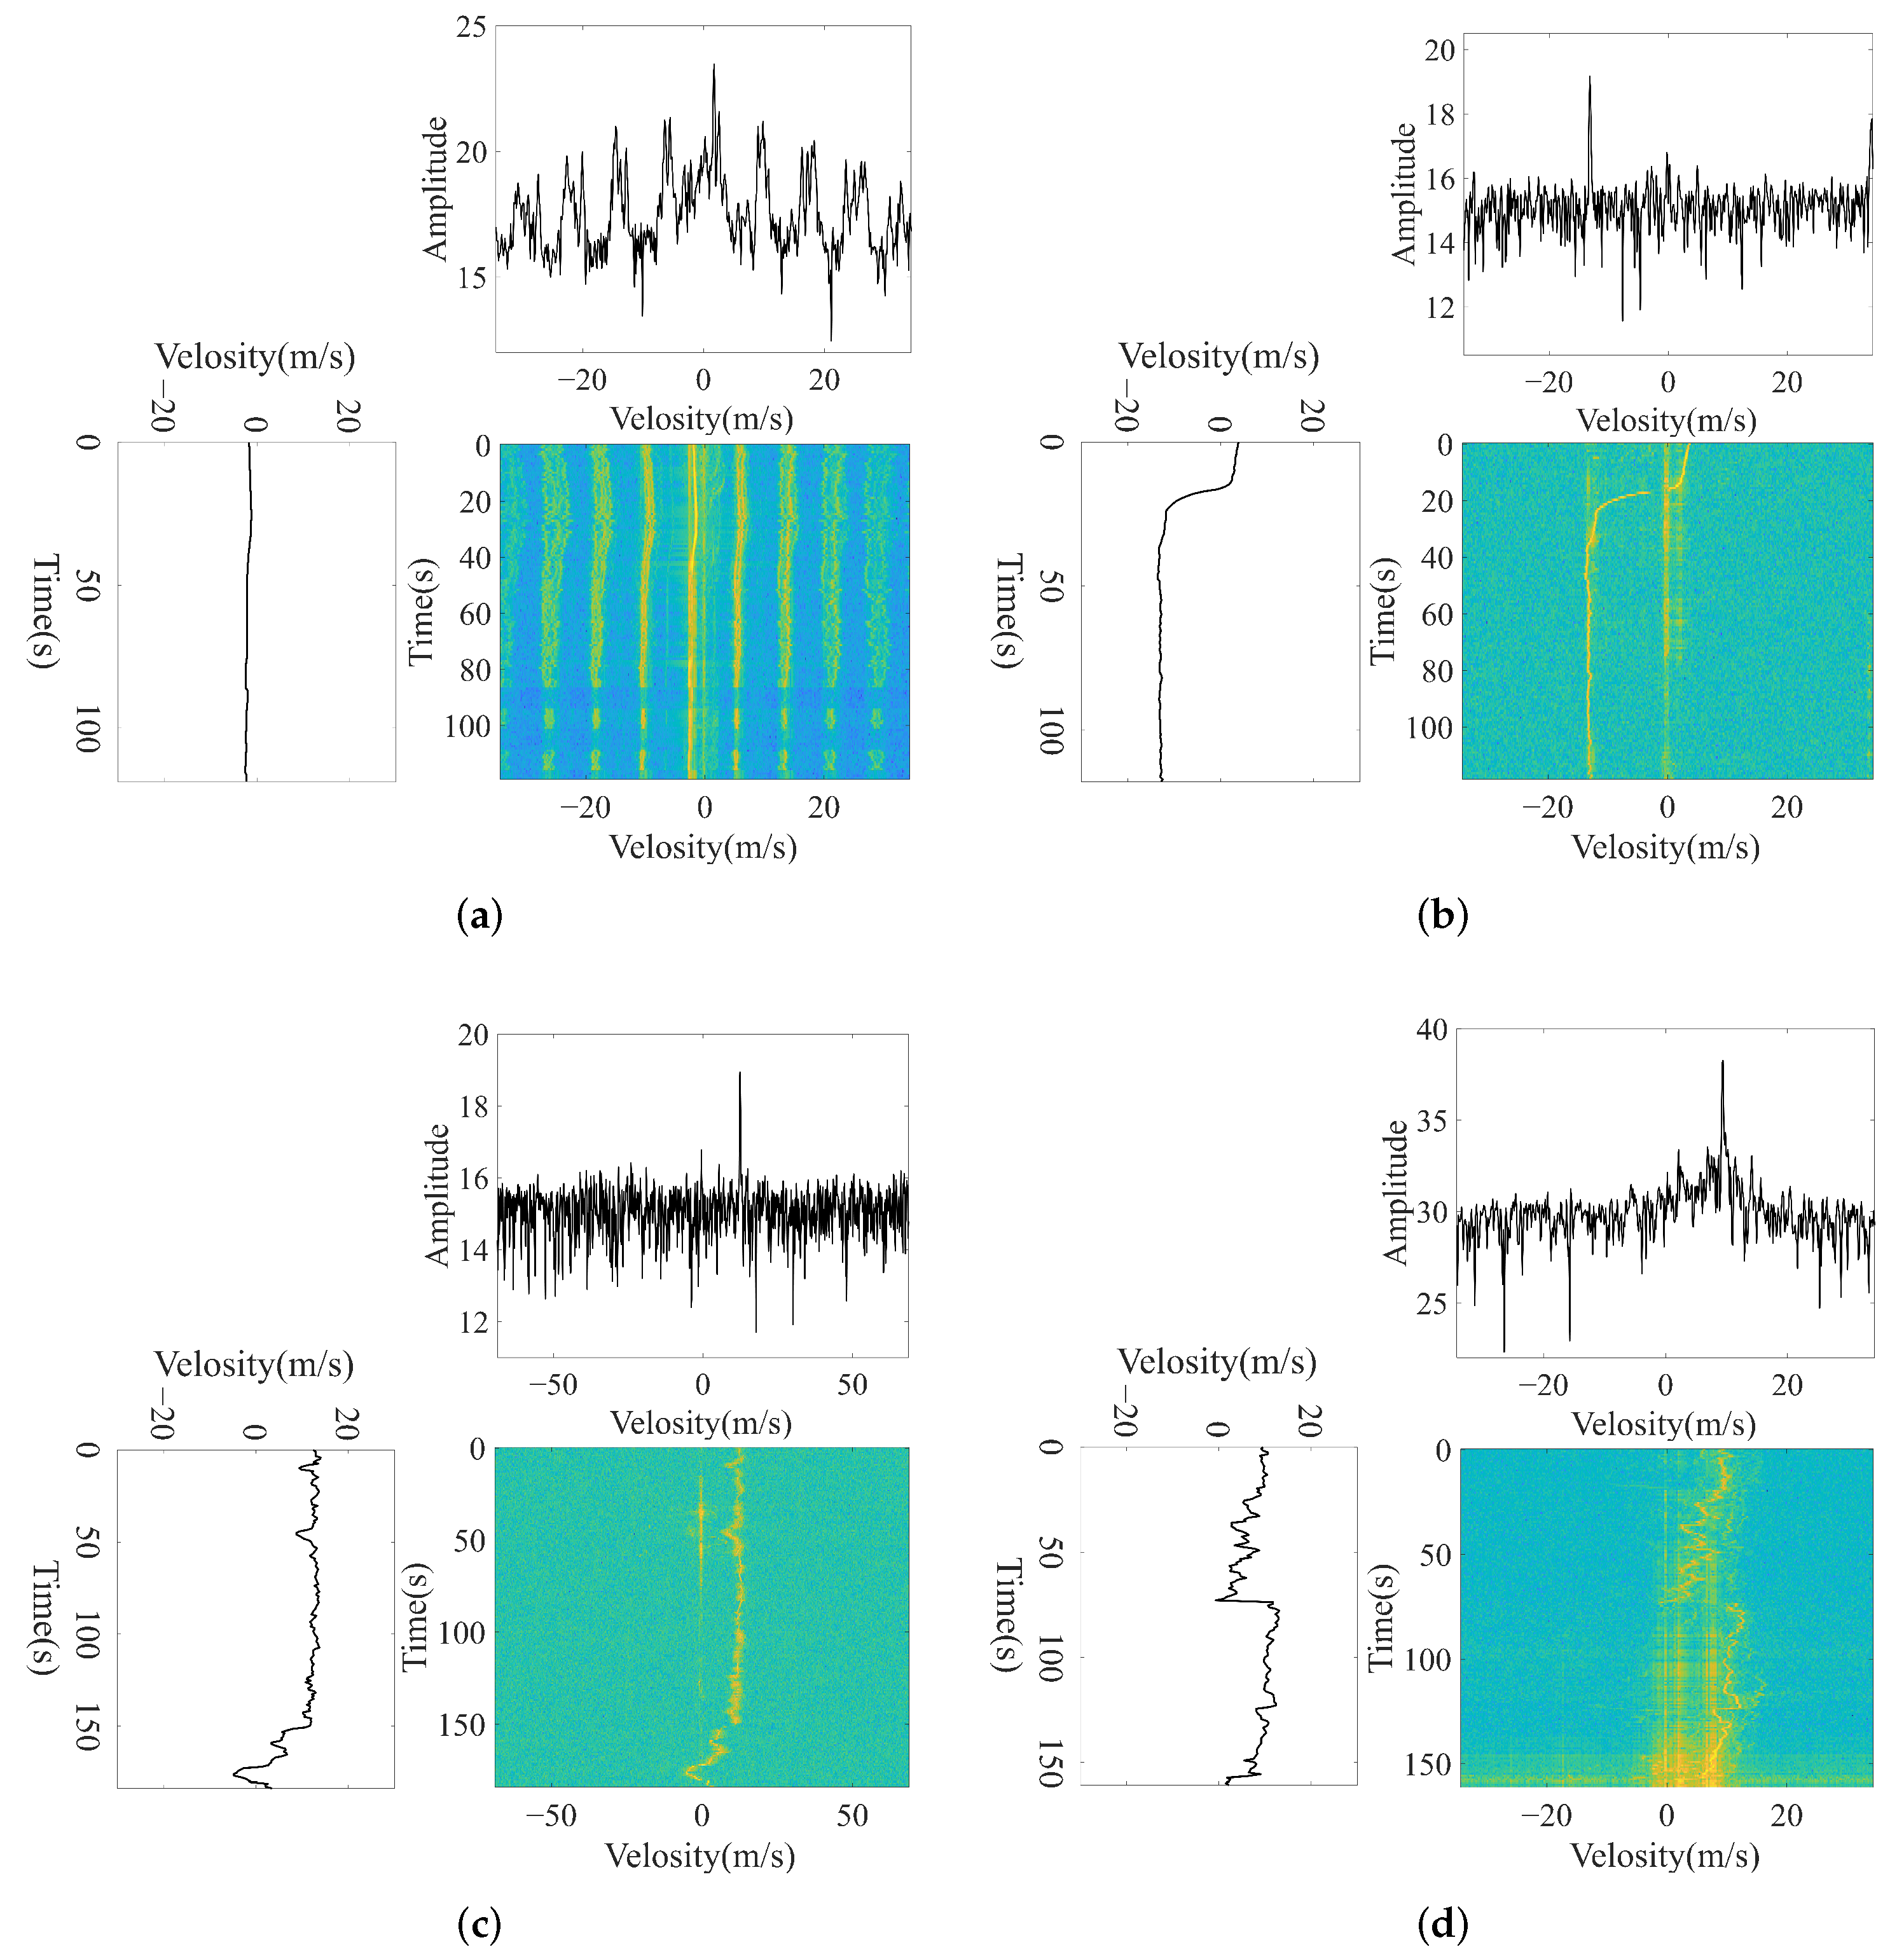
2.1.2. Characteristic 2: Movement Signature
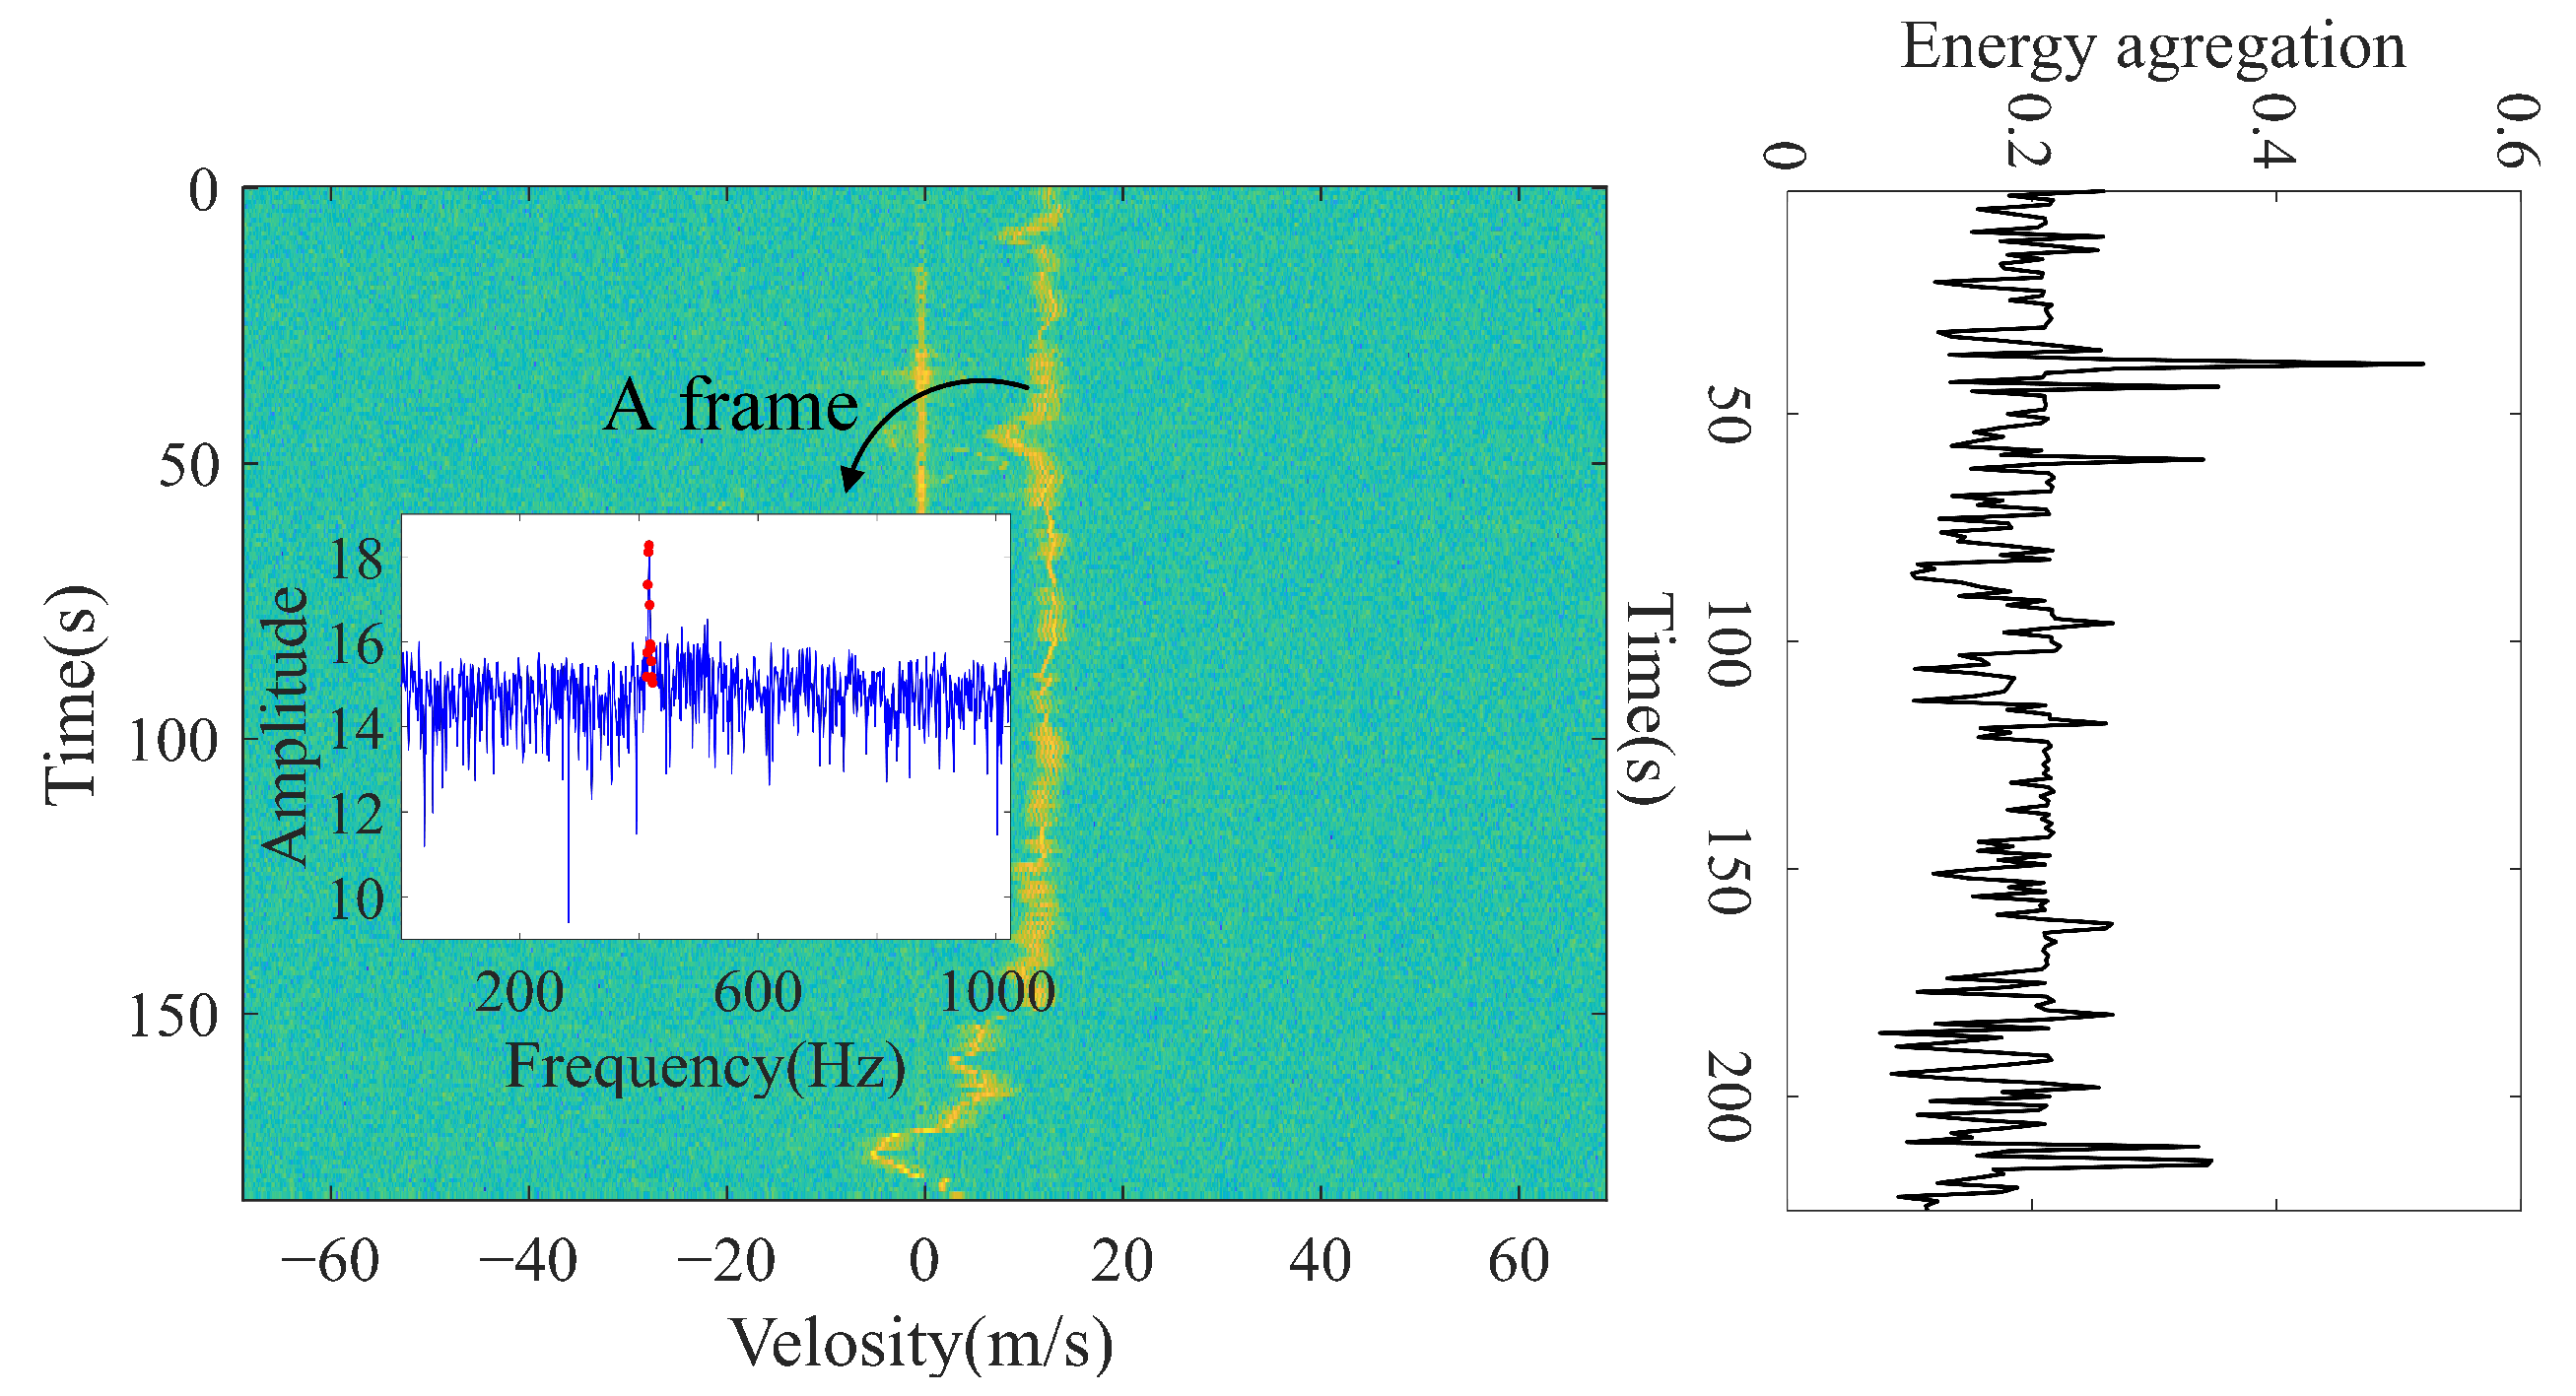
2.1.3. Characteristic 3: Energy Aggregation Signature
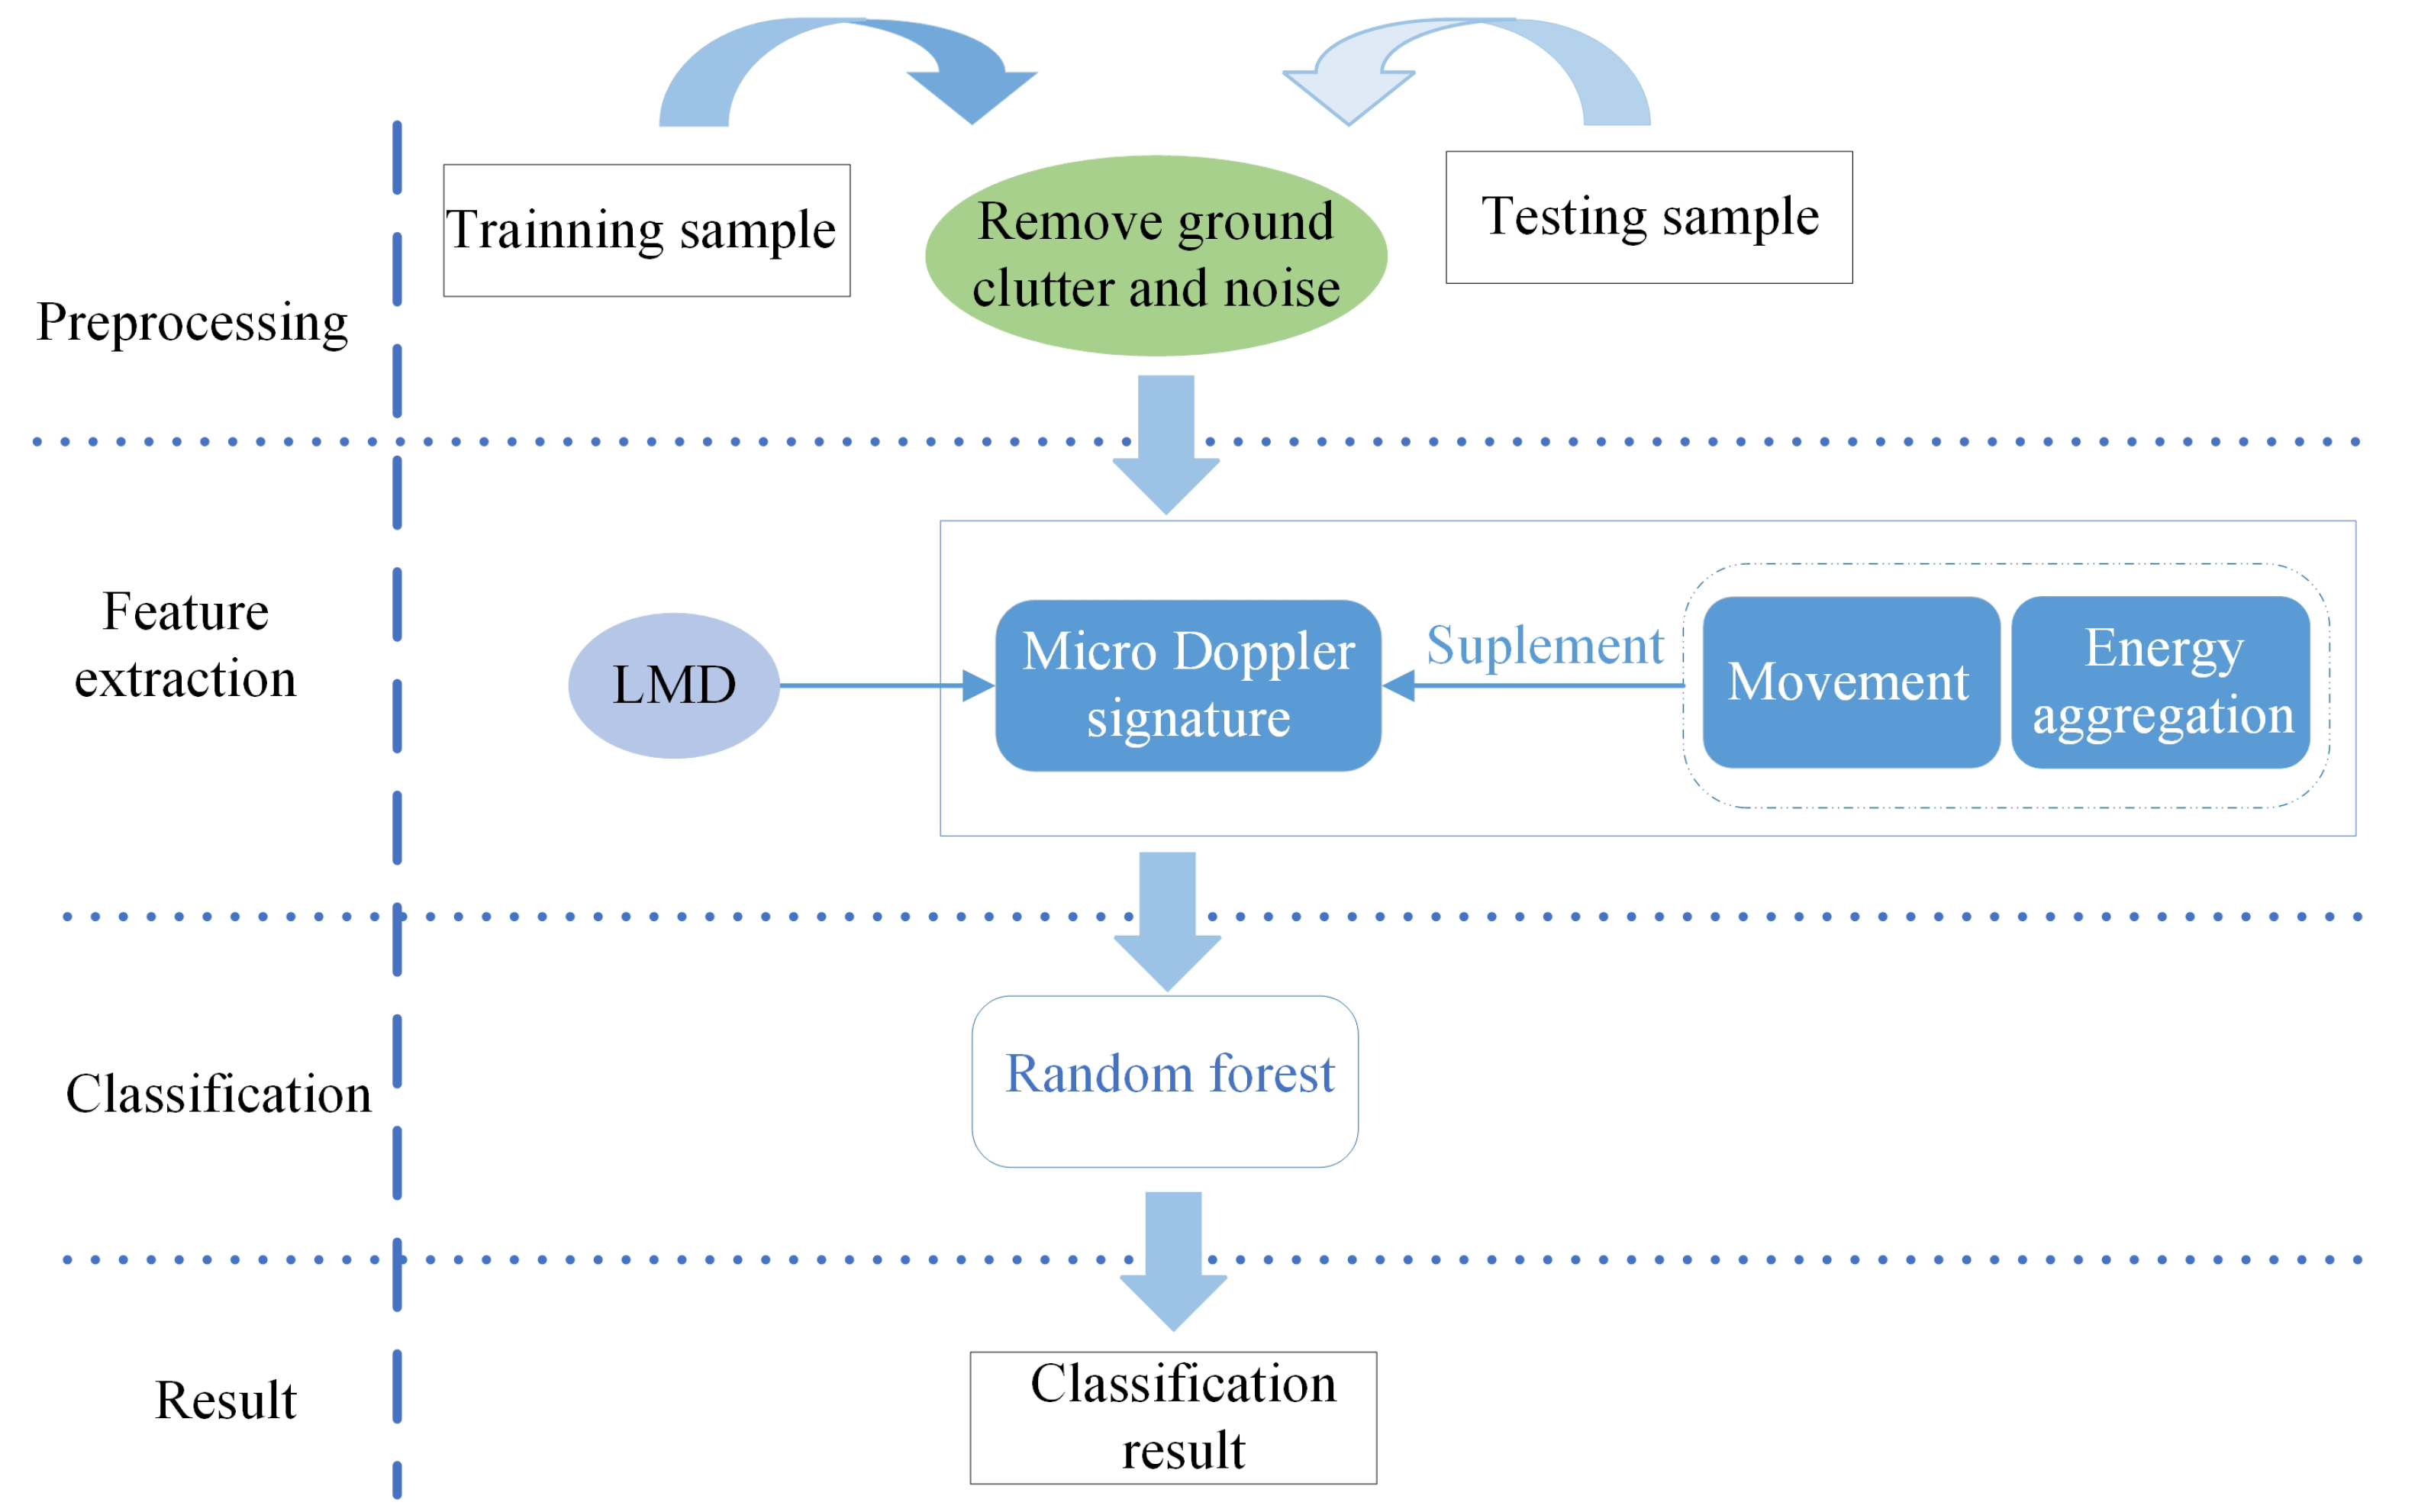
2.2. Proposed UAVs and Birds Classification System
2.2.1. Preprocessing of Ground Clutter and Enviroment Noise Removal
2.2.2. Extraction Features from Spectrogram
M-DS Feature Extraction
Movement Feature Extraction
Energy Aggregation Feature Extraction
2.2.3. Feature-Level Confusion
2.2.4. Random Forest Classification
3. Results
3.1. Collecting and Processing Data
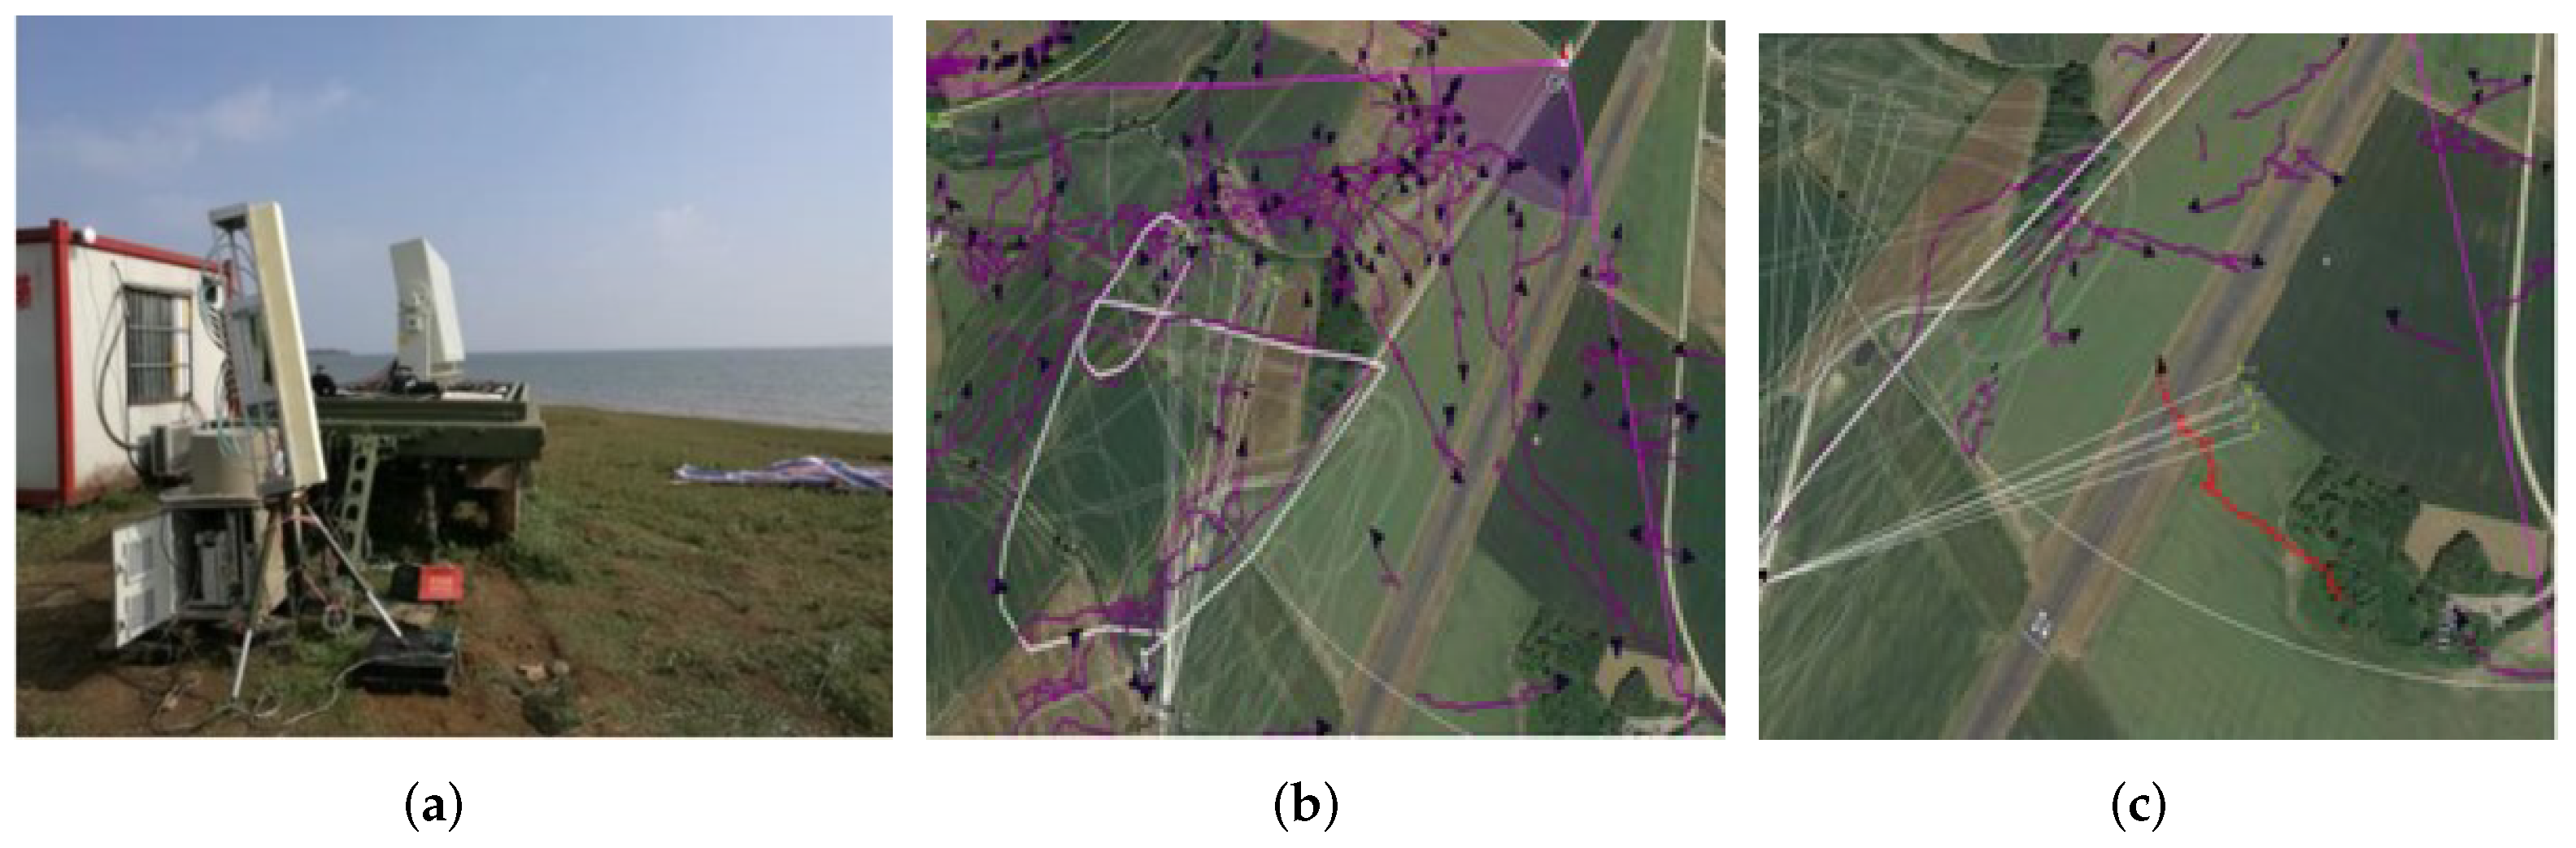
3.1.1. Review of the Staring Radar System
3.1.2. Collecting Staring Radar Data
3.1.3. Data Preprocessing and Partitioning
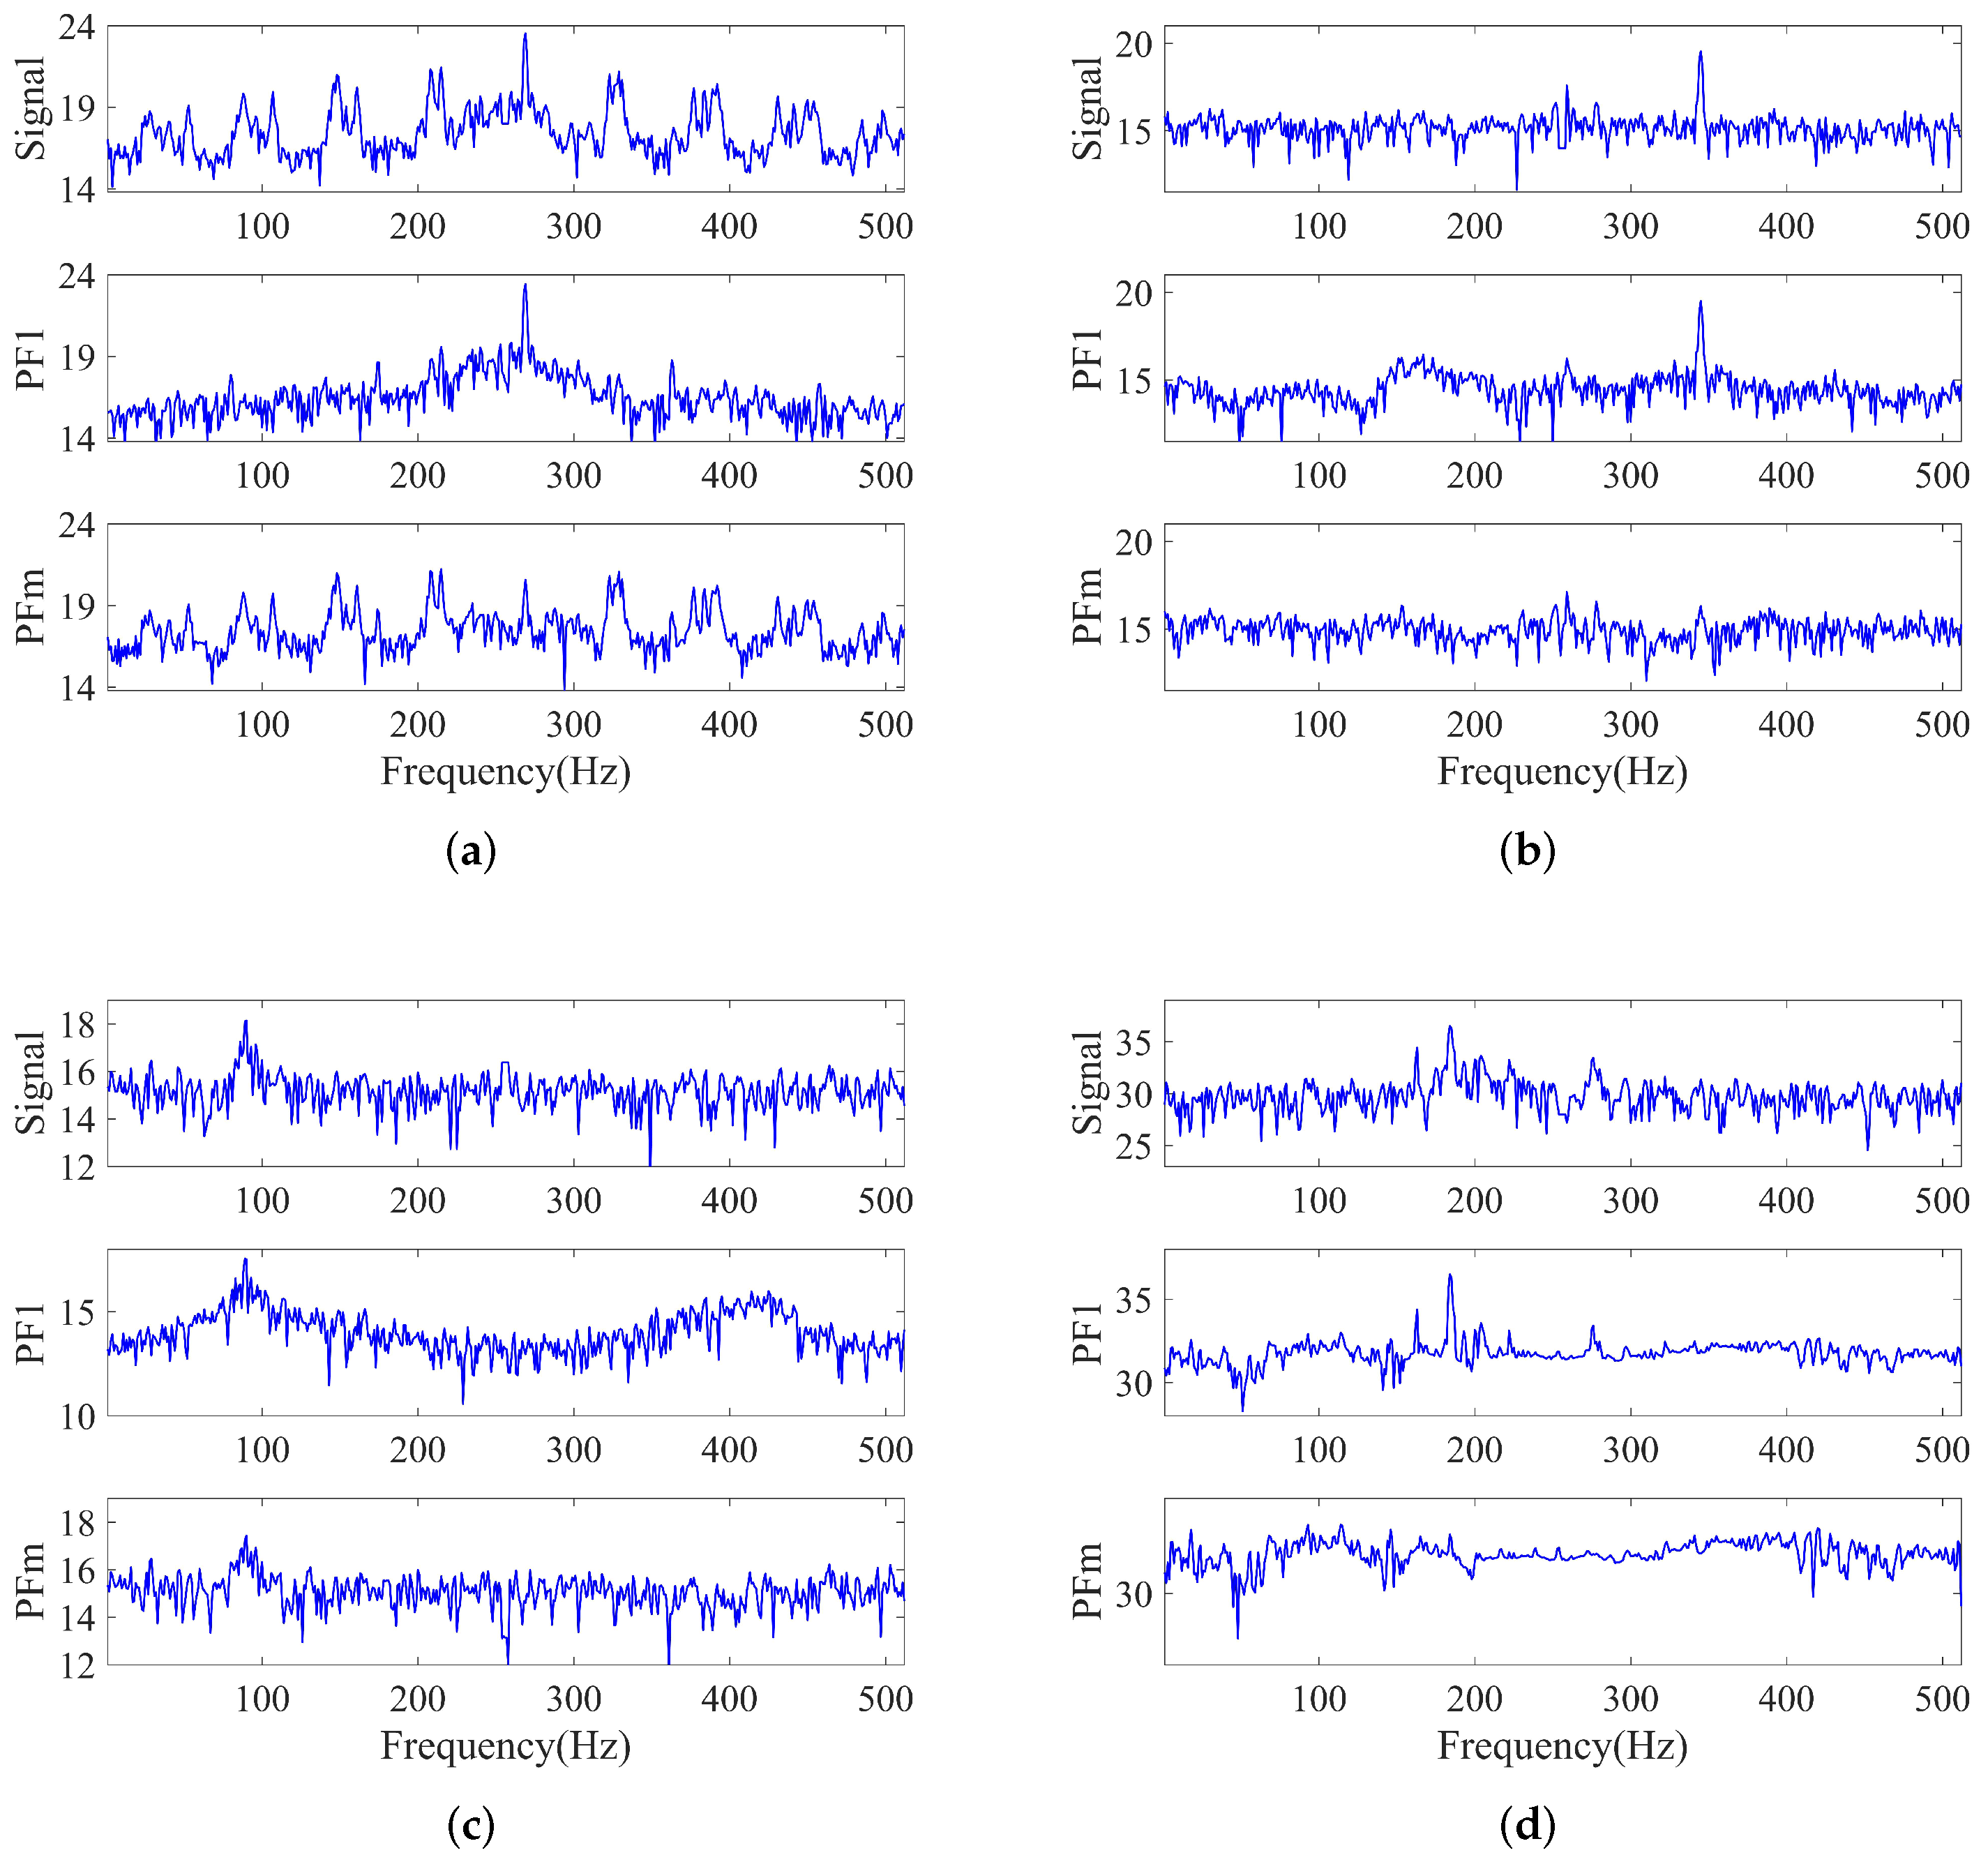
3.2. Performance Evaluation of the LMD Algorithm Applied in m-DS Components Separation
3.3. Performance Evaluation of the Proposed Classification System
3.3.1. In the General Condition
3.3.2. In the Exceptional Condition
3.4. Comparison with State-of-the-Arts
4. Discussion
4.1. Summary of the Experimental
- (1)
- LMD algorithm is proposed to perform m-DS analysis and feature extraction on a frame signal in the spectrogram. Compared with the currently widely used EMD, LMD can achieve a better m-DS separation ratio and higher decomposition efficiency;
- (2)
- The proposed algorithm has achieved promising classification performance, which extracted the movement and energy aggregation features to supplement the information of the m-DS features reflected in the spectrogram;
- (3)
- The classification algorithm by extraction m-DS features fails when the targets are far away from the radar or in the exceptional case of bird gliding, while the algorithm in this paper proposed can also extract movement and energy aggregation features and can achieve an outstanding classification performance;
- (4)
- Different from the current work, this paper is to use a new system of L band staring radar, which achieve long range and high precision classification of targets. According to the performance of the proposed model, it outperforms all other compared techniques in terms of classification accuracy.
4.2. Prospects
- (1)
- The refined processing of radar returns improves the detection and classification the prerequisites for performance. With the increasingly complex environment and targets, it is necessary to carry out refined analysis and processing from the targets and backgrounds faced by radar detection, and from the clutter interference suppression, detection, tracking and classification included in radar detection to improve the utilization of information, and then obtain the radar classification performance improve;
- (2)
- The fusion of signal and data features is an effective way to improve the classification accuracy. Fusion the signal and data features of UAVs and birds can expand the feature space and improve the classification probability;
- (3)
- Deep learning networks provide new means for intelligent target classification of UAVs and birds. Since the m-DS can be regarded as two dimensional characteristic time-frequency data, the target returns and movement trajectory reflected in the radar P display screen are also two dimensional images of distance, which is suitable for the intelligent classification and identification of targets;
- (4)
- The staring radar system has laid a hardware foundation for the integration of target refinement processing and identification. In a complex environment, the probability of target classification relying on a single radar detection device is low. It is necessary to comprehensively use the information of different sensors, such as photoelectric, acoustic, etc., to make up for the limitations of a single sensor and improve the classification efficiency and accuracy.
5. Conclusions
Author Contributions
Funding
Institutional Review Board Statement
Informed Consent Statement
Data Availability Statement
Acknowledgments
Conflicts of Interest
References
- Chen, V.C.; Ling, H. Time-Frequency Transforms for Radar Imaging and Signal Analysis; Artech House: Boston, MA, USA; London, UK, 2002. [Google Scholar]
- Chen, V.C.; Li, F.; Ho, S.S.; Wechsler, H. Micro-Doppler effect in radar: Phenomenon, model, and simulation study. IEEE Trans. Aerosp. Electron. Syst. 2006, 42, 2–21. [Google Scholar] [CrossRef]
- Ren, J.; Jiang, X. Regularized 2-D complex-log spectral analysis and subspace reliability analysis of micro-Doppler signature for UAV detection. Pattern Recognit. 2017, 69, 225–237. [Google Scholar] [CrossRef]
- Zhou, D.; Liu, G.; Wang, J. Spatio-temporal target identification method of high-range resolution radar. Pattern Recognit. 2000, 33, 1–7. [Google Scholar] [CrossRef]
- Sun, G.; Wang, J.; Qin, S.; Na, J. Radar target recognition based on the multi-resolution analysis theory and neural network. Pattern Recognit. Lett. 2008, 29, 2109–2115. [Google Scholar] [CrossRef]
- Zhou, D.; Shen, X.; Yang, W. Radar target recognition based on fuzzy optimal transformation using high-resolution range profile. Pattern Recognit. Lett. 2013, 34, 256–264. [Google Scholar] [CrossRef]
- Jiang, H.; Xu, L.; Zhan, K. Joint tracking and classification based on aerodynamic model and radar cross section. Pattern Recognit. 2014, 47, 3096–3105. [Google Scholar] [CrossRef]
- Du, L.; He, H.; Zhao, L.; Wang, P. Noise robust radar HRRP target recognition based on scatterer matching algorithm. IEEE Sens. J. 2015, 16, 1743–1753. [Google Scholar] [CrossRef]
- Feng, B.; Chen, B.; Liu, H. Radar HRRP target recognition with deep networks. Pattern Recognit. 2017, 61, 379–393. [Google Scholar] [CrossRef]
- Chen, X.; Guan, J.; Bao, Z.; He, Y. Detection and extraction of target with micromotion in spiky sea clutter via short-time fractional Fourier transform. IEEE Trans. Geosci. Remote Sens. 2013, 52, 1002–1018. [Google Scholar] [CrossRef]
- Wang, Y.; Liu, Q.; Fathy, A.E. CW and pulse–Doppler radar processing based on FPGA for human sensing applications. IEEE Trans. Geosci. Remote Sens. 2012, 51, 3097–3107. [Google Scholar] [CrossRef]
- Thayaparan, T.; Stanković, L.J.; Djurović, I. Micro-Doppler-based target detection and feature extraction in indoor and outdoor environments. J. Frankl. Inst. 2008, 345, 700–722. [Google Scholar] [CrossRef]
- Tahmoush, D.; Silvious, J. Radar micro-Doppler for long range front-view gait recognition. In Proceedings of the 2009 IEEE 3rd International Conference on Biometrics: Theory, Applications, and Systems, Washington, DC, USA, 28–30 September 2009; pp. 1–6. [Google Scholar]
- Raj, R.G.; Chen, V.C.; Lipps, R. Analysis of radar human gait signatures. IET Signal Process. 2010, 4, 234–244. [Google Scholar] [CrossRef]
- Park, J.; Johnson, J.T.; Majurec, N.; Frankford, M.; Stewart, K.; Smith, G.E.; Westbrook, L. Simulation and analysis of polarimetric radar signatures of human gaits. IEEE Trans. Aerosp. Electron. Syst. 2014, 50, 2164–2175. [Google Scholar] [CrossRef]
- Kim, Y.; Ling, H. Human activity classification based on micro-Doppler signatures using a support vector machine. IEEE Trans. Geosci. Remote Sens. 2009, 47, 1328–1337. [Google Scholar]
- Björklund, S.; Johansson, T.; Petersson, H. Evaluation of a micro-Doppler classification method on mm-wave data. In Proceedings of the 2012 IEEE Radar Conference, Atlanta, GA, USA, 7–11 May 2012; pp. 0934–0939. [Google Scholar]
- Zabalza, J.; Clemente, C.; Di Caterina, G.; Ren, J.; Soraghan, J.J.; Marshall, S. Robust PCA micro-Doppler classification using SVM on embedded systems. IEEE Trans. Aerosp. Electron. Syst. 2014, 50, 2304–2310. [Google Scholar] [CrossRef] [Green Version]
- Clemente, C.; Pallotta, L.; De Maio, A.; Soraghan, J.J.; Farina, A. A novel algorithm for radar classification based on Doppler characteristics exploiting orthogonal pseudo-Zernike polynomials. IEEE Trans. Aerosp. Electron. Syst. 2015, 51, 417–430. [Google Scholar] [CrossRef] [Green Version]
- Li, Y.; Du, L.; Liu, H. Hierarchical classification of moving vehicles based on empirical mode decomposition of micro-Doppler signatures. IEEE Trans. Geosci. Remote Sens. 2012, 51, 3001–3013. [Google Scholar] [CrossRef]
- Smith, G.E.; Woodbridge, K.; Baker, C.J. Naïve Bayesian radar micro-Doppler recognition. In Proceedings of the 2008 International Conference on Radar, Adelaide, Australia, 2–5 September 2008; pp. 111–116. [Google Scholar]
- Smith, G.E.; Woodbridge, K.; Baker, C.J. Radar micro-Doppler signature classification using dynamic time warping. IEEE Trans. Aerosp. Electron. Syst. 2010, 46, 1078–1096. [Google Scholar] [CrossRef]
- Novak, L.M.; Owirka, G.J.; Netishen, C.M. Radar target identification using spatial matched filters. Pattern Recognit. 1994, 27, 607–617. [Google Scholar] [CrossRef] [Green Version]
- Kim, K.T. Application of feature space trajectory classifier to identification of multi-aspect radar signals. Pattern Recognit. 2005, 38, 2159–2173. [Google Scholar] [CrossRef]
- Ritchie, M.; Fioranelli, F.; Griffiths, H. Monostatic and bistatic radar measurements of birds and micro-drone. In Proceedings of the 2016 IEEE Radar Conference (RadarConf), Philadelphia, PA, USA, 1–6 May 2016; pp. 1–5. [Google Scholar]
- Björklund, S. Target detection and classification of small drones by boosting on radar micro-Doppler. In Proceedings of the 2018 15th European Radar Conference (EuRAD), Madrid, Spain, 26–28 September 2018; pp. 182–185. [Google Scholar]
- Park, S.H.; Jung, J.H.; Cha, S.B.; Kim, S.; Youn, S.; Eo, I.; Koo, B. In-depth Analysis of the Micro-Doppler Features to Discriminate Drones and Birds. In Proceedings of the 2020 International Conference on Electronics, Information, and Communication (ICEIC), Barcelona, Spain, 19–22 January 2020; pp. 1–3. [Google Scholar]
- Farshchian, M.; Selesnick, I.; Parekh, A. Bird body and wing-beat radar Doppler signature separation using sparse optimization. In Proceedings of the 2016 4th International Workshop on Compressed Sensing Theory and Its Applications to Radar, Sonar and Remote Sensing (CoSeRa), Aachen, Germany, 19–22 September 2016; pp. 71–74. [Google Scholar]
- Rahman, S.; Robertson, D.A. Radar micro-Doppler signatures of drones and birds at K-band and W-band. Sci. Rep. 2018, 8, 17396. [Google Scholar] [CrossRef] [PubMed]
- Oh, B.S.; Guo, X.; Wan, F.; Toh, K.A.; Lin, Z. Micro-Doppler mini-UAV classification using empirical-mode decomposition features. IEEE Geosci. Remote Sens. Lett. 2017, 15, 227–231. [Google Scholar] [CrossRef]
- Harmanny, R.I.A.; De Wit, J.J.M.; Cabic, G.P. Radar micro-Doppler feature extraction using the spectrogram and the cepstrogram. In Proceedings of the 2014 11th European Radar Conference, Rome, Italy, 8–10 October 2014; pp. 165–168. [Google Scholar]
- Harmanny, R.I.A.; de Wit, J.J.M.; Premel-Cabic, G. Radar micro-Doppler mini-UAV classification using spectrograms and cepstrograms. Int. J. Microw. Wirel. Technol. 2015, 7, 469–477. [Google Scholar] [CrossRef]
- Smith, J.S. The local mean decomposition and its application to EEG perception data. J. R. Soc. Interface 2005, 2, 443–454. [Google Scholar] [CrossRef]
- Park, C.; Looney, D.; Van Hulle, M.M.; Mandic, D.P. The complex local mean decomposition. Neurocomputing 2011, 74, 867–875. [Google Scholar] [CrossRef]
- Yuan, B.; Chen, Z.; Xu, S. Micro-Doppler analysis and separation based on complex local mean decomposition for aircraft with fast-rotating parts in ISAR imaging. IEEE Trans. Geosci. Remote Sens. 2013, 52, 1285–1298. [Google Scholar] [CrossRef]
- Torvik, B.; Olsen, K.E.; Griffiths, H. Classification of birds and UAVs based on radar polarimetry. IEEE Geosci. Remote Sens. Lett. 2016, 13, 1305–1309. [Google Scholar] [CrossRef]
- Srigrarom, S.; Chew, K.H.; Da Lee, D.M.; Ratsamee, P. Drone versus bird flights: Classification by trajectories characterization. In Proceedings of the 2020 59th Annual Conference of the Society of Instrument and Control Engineers of Japan (SICE), Chiang Mai, Thailand, 23–26 September 2020; pp. 343–348. [Google Scholar]
- Zhang, X.; Mehta, V.; Bolic, M.; Mantegh, I. Hybrid AI-enabled Method for UAS and Bird Detection and Classification. In Proceedings of the 2020 IEEE International Conference on Systems, Man, and Cybernetics (SMC), Toronto, ON, Canada, 11–14 October 2020; pp. 2803–2807. [Google Scholar]
- Zhao, Y.; Su, Y. Sparse recovery on intrinsic mode functions for the micro-Doppler parameters estimation of small UAVs. IEEE Trans. Geosci. Remote Sens. 2019, 57, 7182–7193. [Google Scholar] [CrossRef]
- Zhao, Y.; Su, Y. The extraction of micro-Doppler signal with EMD algorithm for radar-based small UAVs’ detection. IEEE Trans. Instrum. Meas. 2019, 69, 929–940. [Google Scholar] [CrossRef]
- Fioranelli, F.; Ritchie, M.; Griffiths, H. Classification of unarmed/armed personnel using the NetRAD multistatic radar for micro-Doppler and singular value decomposition features. IEEE Geosci. Remote Sens. Lett. 2015, 12, 1933–1937. [Google Scholar] [CrossRef] [Green Version]
- Dale, H.; Baker, C.; Antoniou, M.; Jahangir, M. An Initial Investigation into Using Convolutional Neural Networks for Classification of Drones. In Proceedings of the 2020 IEEE International Radar Conference (RADAR), Washington, DC, USA, 27 April–27 May 2020; pp. 618–623. [Google Scholar]


| Parameter | Value |
|---|---|
| Frequency | L band |
| Bandwidth | 2 MHz |
| Transmit Power | 1 kW |
| Pulse Repetition Frequency | 5 kHz |
| Pulse length | s |
| Blind zone | 0.3 km |
| NO. | Target Name | Target Type | Num of Training Sample | Num of Testing Sample |
|---|---|---|---|---|
| 1 | Inspire2 UAV | UAVs | 689 | 460 |
| 2 | MAVIC Air2 UAV | 681 | 488 | |
| 3 | A bird | birds | 546 | 365 |
| 4 | A group of birds | 601 | 401 |
| Method | Separation Ratio | |||
|---|---|---|---|---|
| Inspire2 UAV | MAVIC Air2 UAV | A Bird | A Group of Birds | |
| LMD | 0.966 | 0.931 | 0.944 | 0.893 |
| EMD | 0.973 | 0.871 | 0.919 | 0.836 |
| Method | Consuming Time | |||
|---|---|---|---|---|
| Inspire2 UAV | MAVIC Air2 UAV | A Bird | A Group of Birds | |
| LMD | 0.16 s | 0.12 s | 0.17 s | 0.16 s |
| EMD | 4.45 s | 3.82 s | 4.35 s | 4.12 s |
| Predicted Classes | |||||
|---|---|---|---|---|---|
| Inspire2 UAV | MAVIC Air2 UAV | A Bird | A Group of Birds | ||
| True classes | Inspire2 UAV | 98.75 | 0.51 | 0 | 0 |
| MAVIC Air2 UAV | 0.42 | 98.21 | 0 | 2.30 | |
| A bird | 0 | 0 | 100 | 0 | |
| A group of birds | 0.83 | 1.28 | 0 | 97.70 | |
| Predicted Classes | |||||
|---|---|---|---|---|---|
| Inspire2 UAV | MAVIC Air2 UAV | A Bird | A Group of Birds | ||
| True classes | Inspire2 UAV | 92.52 | 8.42 | 0 | 2.65 |
| MAVIC Air2 UAV | 3.74 | 86.73 | 0 | 2.65 | |
| A bird | 0 | 0 | 100 | 0 | |
| A group of birds | 3.74 | 4.85 | 0 | 94.70 | |
Publisher’s Note: MDPI stays neutral with regard to jurisdictional claims in published maps and institutional affiliations. |
© 2022 by the authors. Licensee MDPI, Basel, Switzerland. This article is an open access article distributed under the terms and conditions of the Creative Commons Attribution (CC BY) license (https://creativecommons.org/licenses/by/4.0/).
Share and Cite
Dai, T.; Xu, S.; Tian, B.; Hu, J.; Zhang, Y.; Chen, Z. Extraction of Micro-Doppler Feature Using LMD Algorithm Combined Supplement Feature for UAVs and Birds Classification. Remote Sens. 2022, 14, 2196. https://doi.org/10.3390/rs14092196
Dai T, Xu S, Tian B, Hu J, Zhang Y, Chen Z. Extraction of Micro-Doppler Feature Using LMD Algorithm Combined Supplement Feature for UAVs and Birds Classification. Remote Sensing. 2022; 14(9):2196. https://doi.org/10.3390/rs14092196
Chicago/Turabian StyleDai, Ting, Shiyou Xu, Biao Tian, Jun Hu, Yue Zhang, and Zengping Chen. 2022. "Extraction of Micro-Doppler Feature Using LMD Algorithm Combined Supplement Feature for UAVs and Birds Classification" Remote Sensing 14, no. 9: 2196. https://doi.org/10.3390/rs14092196
APA StyleDai, T., Xu, S., Tian, B., Hu, J., Zhang, Y., & Chen, Z. (2022). Extraction of Micro-Doppler Feature Using LMD Algorithm Combined Supplement Feature for UAVs and Birds Classification. Remote Sensing, 14(9), 2196. https://doi.org/10.3390/rs14092196