Article

Full Convolution Neural Network Combined with Contextual Feature Representation for Cropland Extraction from High-Resolution Remote Sensing Images

1
College of Geo-Exploration Science and Technology, Jilin University, Changchun 130026, China
2
Jilin Province Land Survey & Planning Institute, Changchun 130061, China
3
Chang Guang Satellite Technology Co., Ltd., Changchun 130000, China
4
Beihang Hangzhou Innovation Institute Yuhang, Hangzhou 310023, China
*
Author to whom correspondence should be addressed.
Remote Sens. 2022, 14(9), 2157; https://doi.org/10.3390/rs14092157
Submission received: 17 February 2022 / Revised: 15 April 2022 / Accepted: 28 April 2022 / Published: 30 April 2022

Abstract

:
The quantity and quality of cropland are the key to ensuring the sustainable development of national agriculture. Remote sensing technology can accurately and timely detect the surface information, and objectively reflect the state and changes of the ground objects. Using high-resolution remote sensing images to accurately extract cropland is the basic task of precision agriculture. The traditional model of cropland semantic segmentation based on the deep learning network is to down-sample high-resolution feature maps to low resolution, and then restore from low-resolution feature maps to high-resolution ideas; that is, obtain low-resolution feature maps through a network, and then recover to high resolution by up-sampling or deconvolution. This will bring about the loss of features, and the segmented image will be more fragmented, without very clear and smooth boundaries. A new methodology for the effective and accurate semantic segmentation cropland of high spatial resolution remote sensing images is presented in this paper. First, a multi-temporal sub-meter cropland sample dataset is automatically constructed based on the prior result data. Then, a fully convolutional neural network combined with contextual feature representation (HRNet-CFR) is improved to complete the extraction of cropland. Finally, the initial semantic segmentation results are optimized by the morphological post-processing approach, and the broken spots are ablated to obtain the internal homogeneous cropland. The proposed method has been validated on the Jilin-1 data and Gaofen Image Dataset (GID) public datasets, and the experimental results demonstrate that it outperforms the state-of-the-art method in cropland extraction accuracy. We selected the comparison of Deeplabv3+ and UPerNet methods in GID. The overall accuracy of our approach is 92.03%, which is 3.4% higher than Deeplabv3+ and 5.12% higher than UperNet.

Graphical Abstract

1. Introduction

Timely and accurate agricultural mapping is an important basis for the country to formulate agricultural policies, and it is of great significance to ensure food security [1,2]. With the continuous improvement of the spatial resolution of satellite remote sensing images, the visual features of ground objects are more refined, which makes it possible to extract the cultivated land boundary more automatically. However, due to the influence of different satellite payloads, different imaging conditions, complex background features, and changeable time phase, it is still a challenge to obtain the boundaries of cropland with high precision and automation in high-resolution remote sensing images.
Although in recent years many researchers have made advancements in this area of R&D activities, it still remains a challenging task to achieve high-quality cropland segmentation results, mainly due to the following reasons. Seasonal: cropland targets are different from traditional objects such as building targets, and crops on cultivated land are growing with the change of time, and there is a strong time correlation. Regional: The regional distribution of cropland is quite different. The cropland in the north is relatively complete, but the cultivated land in the south is relatively broken. Therefore, it is difficult to obtain a universal model. Heterogeneity: In high-resolution semantic segmentation, there are rich texture features, but often fewer spectral features. Fallow land and bare soil will cause confusion in semantic segmentation.
Since high-resolution remote sensing images have the characteristics of massive data, scale dependence, and strong spatial correlation, the use of multi-scale convolutional neural networks combined with context information to extract cropland with higher accuracy has become the focus of this paper.
In this paper, we propose a new method for cropland semantic segmentation which considers high-resolution images of complex terrain and changeable phase. First, we construct a multi-temporal cropland sample dataset. Then, comprehensively considering the geographic relevance of remotely sensed features, a high-resolution network combined with contextual feature expression (HRNet-CFR) was improved to complete the extraction of cropland elements. It uses the neighborhood surrounding the pixel as the context feature of the pixel to fuse the backbone network features. We modify the input convolution kernel of the first layer of the backbone network, and the improved network can adapt to multi-band spectral data as input. After the backbone network features are fused, the contextual feature representation (CFR) module is connected to obtain the features of the fusion context for semantic segmentation, so as to improve the separability of cropland. In the model training process, in order to solve the imbalance in the frequency of cropland and non-cropland, the loss function of LovaszSoftmax [3] is used to improve the separability of target and background features. Finally, the initial semantic segmentation results are amended by the morphological post-processing algorithm, and the broken spots are ablated to obtain the internal homogeneous cropland.
In order to verify the effectiveness of the method, the Jilin-1 satellite data and public GID data [4] are selected for visual qualitative and quantitative evaluation. The average overall accuracy of cropland extraction in the central and western regions of Jilin Province, China, can reach 92.55%. Compared with the current popular Deeplabv3+ and UPerNet [5] semantic segmentation algorithms in the public GID data, the overall accuracy of HRNet-CFR is improved by about 3.4–5.12%. The experimental results show that the improved cropland extraction network model in this paper shows a more superior recognition performance.
In summary, the contributions of our approach are three-fold:
  • A fully convolution neural network combined with a multiple-scales framework is presented to extract cropland on a county or city scale from high-resolution remote sensing images.
  • In order to solve the heterogeneity of cropland objectives, we propose the CFR module, which is connected to obtain the features of the fusion context for semantic segmentation. It focuses on more high-level features and improves the separability of targets that are more easily confused with cropland.
  • The global optimization based on morphological post-processing algorithm obtains the cropland boundary closer to the real situation. It improves the overall accuracy of cropland segmentation.
The rest of this paper is organized as follows. Section 2 introduces the related works and analyzes their limitations. We demonstrate the detail of the proposed HRNet-CFR model and morphological post-processing in Section 3. Section 4 reports the high-resolution remote sensing image cropland dataset and experimental results. Section 5 discusses the potential and limitations of our approach. Section 6 provides the conclusions.

2. Related Work

The cropland segmentation can be divided into unsupervised and supervised methods. In the unsupervised methods, Xue et al. [6] applied the simulated immersion watershed method to merge the division unit of cultivated land. Their method is designed for merge objects which have been well-segmented from the high-resolution image beforehand. In [7,8], some object-based methods are presented to single-out croplands in high-resolution remote sensing imagery. In order to improve the discontinuity, preserving smoothing of segmented cropland, normal and uniform kernels are used to filter inner fields and boundary areas [7]. Graesser et al. [9] proposed an adaptive threshold method to extract cultivated land from temporal vegetation spectral features. Hong et al. [10] designed a set of mathematical methods for parcel-level boundary extraction from regular arranged agricultural areas. The boundaries of cultivated land extracted by these methods are relatively detailed. However, it is usually necessary to design features or parameters artificially in combination with prior knowledge of the size, shape, and texture of cultivated land in multi-source remote sensing images. For large-scale area cropland extraction, accurately classifying objects from them using the unsupervised approaches is a difficult task.
The supervised methods provide a promising way to distinguish the cropland objects in complex scenes containing many uncertainties and intricate relations among classes. For this reason, neural network [11], support vector machine [12,13], and other machine learning methods [14,15,16] are used to build a mapping model between the feature space and the segmentation target, which has become a new development trend. Csillik and Belgiu [17] evaluate how a time-weighted dynamic time-warping (TWDTW) method that uses Sentinel-2 time series performs when applied to pixel-based and object-based classifications of various crop types in three different study areas. From the experimental results, its classification accuracy is better than the random forest method. Using medium-resolution remote sensing images can evaluate the scale of agriculture on a large scale, but the boundaries of the extracted cultivated land are relatively rough, which is coarser than high-resolution image extraction.
With the rise of deep learning brings new opportunities to natural image applications, and some of the mature algorithms have already been applied in remote sensing [18,19,20,21]. Convolutional neural network is an important branch of deep learning since it does not require artificially designed feature engineering [22,23] and can learn local patterns and capture promising semantic information [24]. From the perspective of operational efficiency, it is also known to be efficient compared to other deep learning model types [25].
Shelhamer et al. [26] proposed a full convolutional network (FCN) based on convolutional neural network (CNN), and realized the pixel-level classification of images by replacing the last fully connected layer of the network with an up-sampling layer. Since then, many segmentation algorithms have expanded FCN, from the convolution neural network U-Net [27,28] at the beginning to the deep neural network models such as Pyramid Scene Parsing Network (PSPNet) [29,30] and Deeplabv3+ [31,32].
Some researchers have gradually applied it to the field of remote sensing, especially high-resolution remote sensing images [33,34,35]. Cao et al. [36] improved a U-Net network, solved the gradient attenuation problem to a certain extent by adding residual units, and improved the segmentation effect of remote sensing images. Shang et al. [37] proposed a multi-scale adaptive feature fusion network to improve the extraction effect of different scale targets in images. Wang et al. [38] used MFNet as the backbone network, combined with a pyramid pooling model to enhance spatial context information, and used a weighted cascaded loss function to enhance the learning process. Wang et al. [39] trained the U-Net segmentation network for cropland extraction through weakly supervised learning, and compared it with traditional logistic regression, support vector machine, random forest, and other pixel-level classification algorithms. The experiment showed that the neural network has better classification performance. Li et al. [40] and Xia et al. [41] proposed a method to detect the edge of cultivated land based on holistically nested edge detection with richer convolutional features. Compared with traditional image edge detection, such as the canny algorithm [42], it can extract the boundary more smoothly. However, the extracted edge image will have topology problems in subsequent applications, which makes it difficult to carry out subsequent applications. Masoud et al. [43] designed a multiple-dilation, fully convolutional network for field boundary detection from Sentinel-2 images. They merged results with a novel super-resolution semantic contour detection network using a transposed convolutional layer in the CNN architecture to enhance the spatial resolution of the field boundary detection output from 10 to 5 m resolution. The F1 score they have obtained from their model is 0.6. Zhang et al. [44] improved PSPNet and combined depth distance features with shadow local features to provide predictions with a higher level of detail. During the experiment, high-resolution satellite images were used to verify the extraction of cropland in four provincial research areas from northern to southern China. The overall accuracy of the extraction ranged from 89.99% to 92.31%.
The above approaches have provided convincing segmentation results, but have not been evaluated in complex terrain and changeable phase scenes. Without considering the scale characteristics of objects, the segmentation accuracy fluctuates greatly in different research areas. As a result, the cropland extraction performance achieved by using these approaches is typically compromised, reducing the practicality of the approaches.

3. Proposed Method

In this section, the main procedure for extracting cropland is first briefly illustrated, as shown in Figure 1. A sample increment based on image preprocessing algorithm is presented in Section 3.1. Then, Section 3.2 exhaustively describes the basic HRNet and the improvements to it, including the CFR module. Finally, the morphological post-processing module is illustrated in Section 3.3.

3.1. Sample Increment

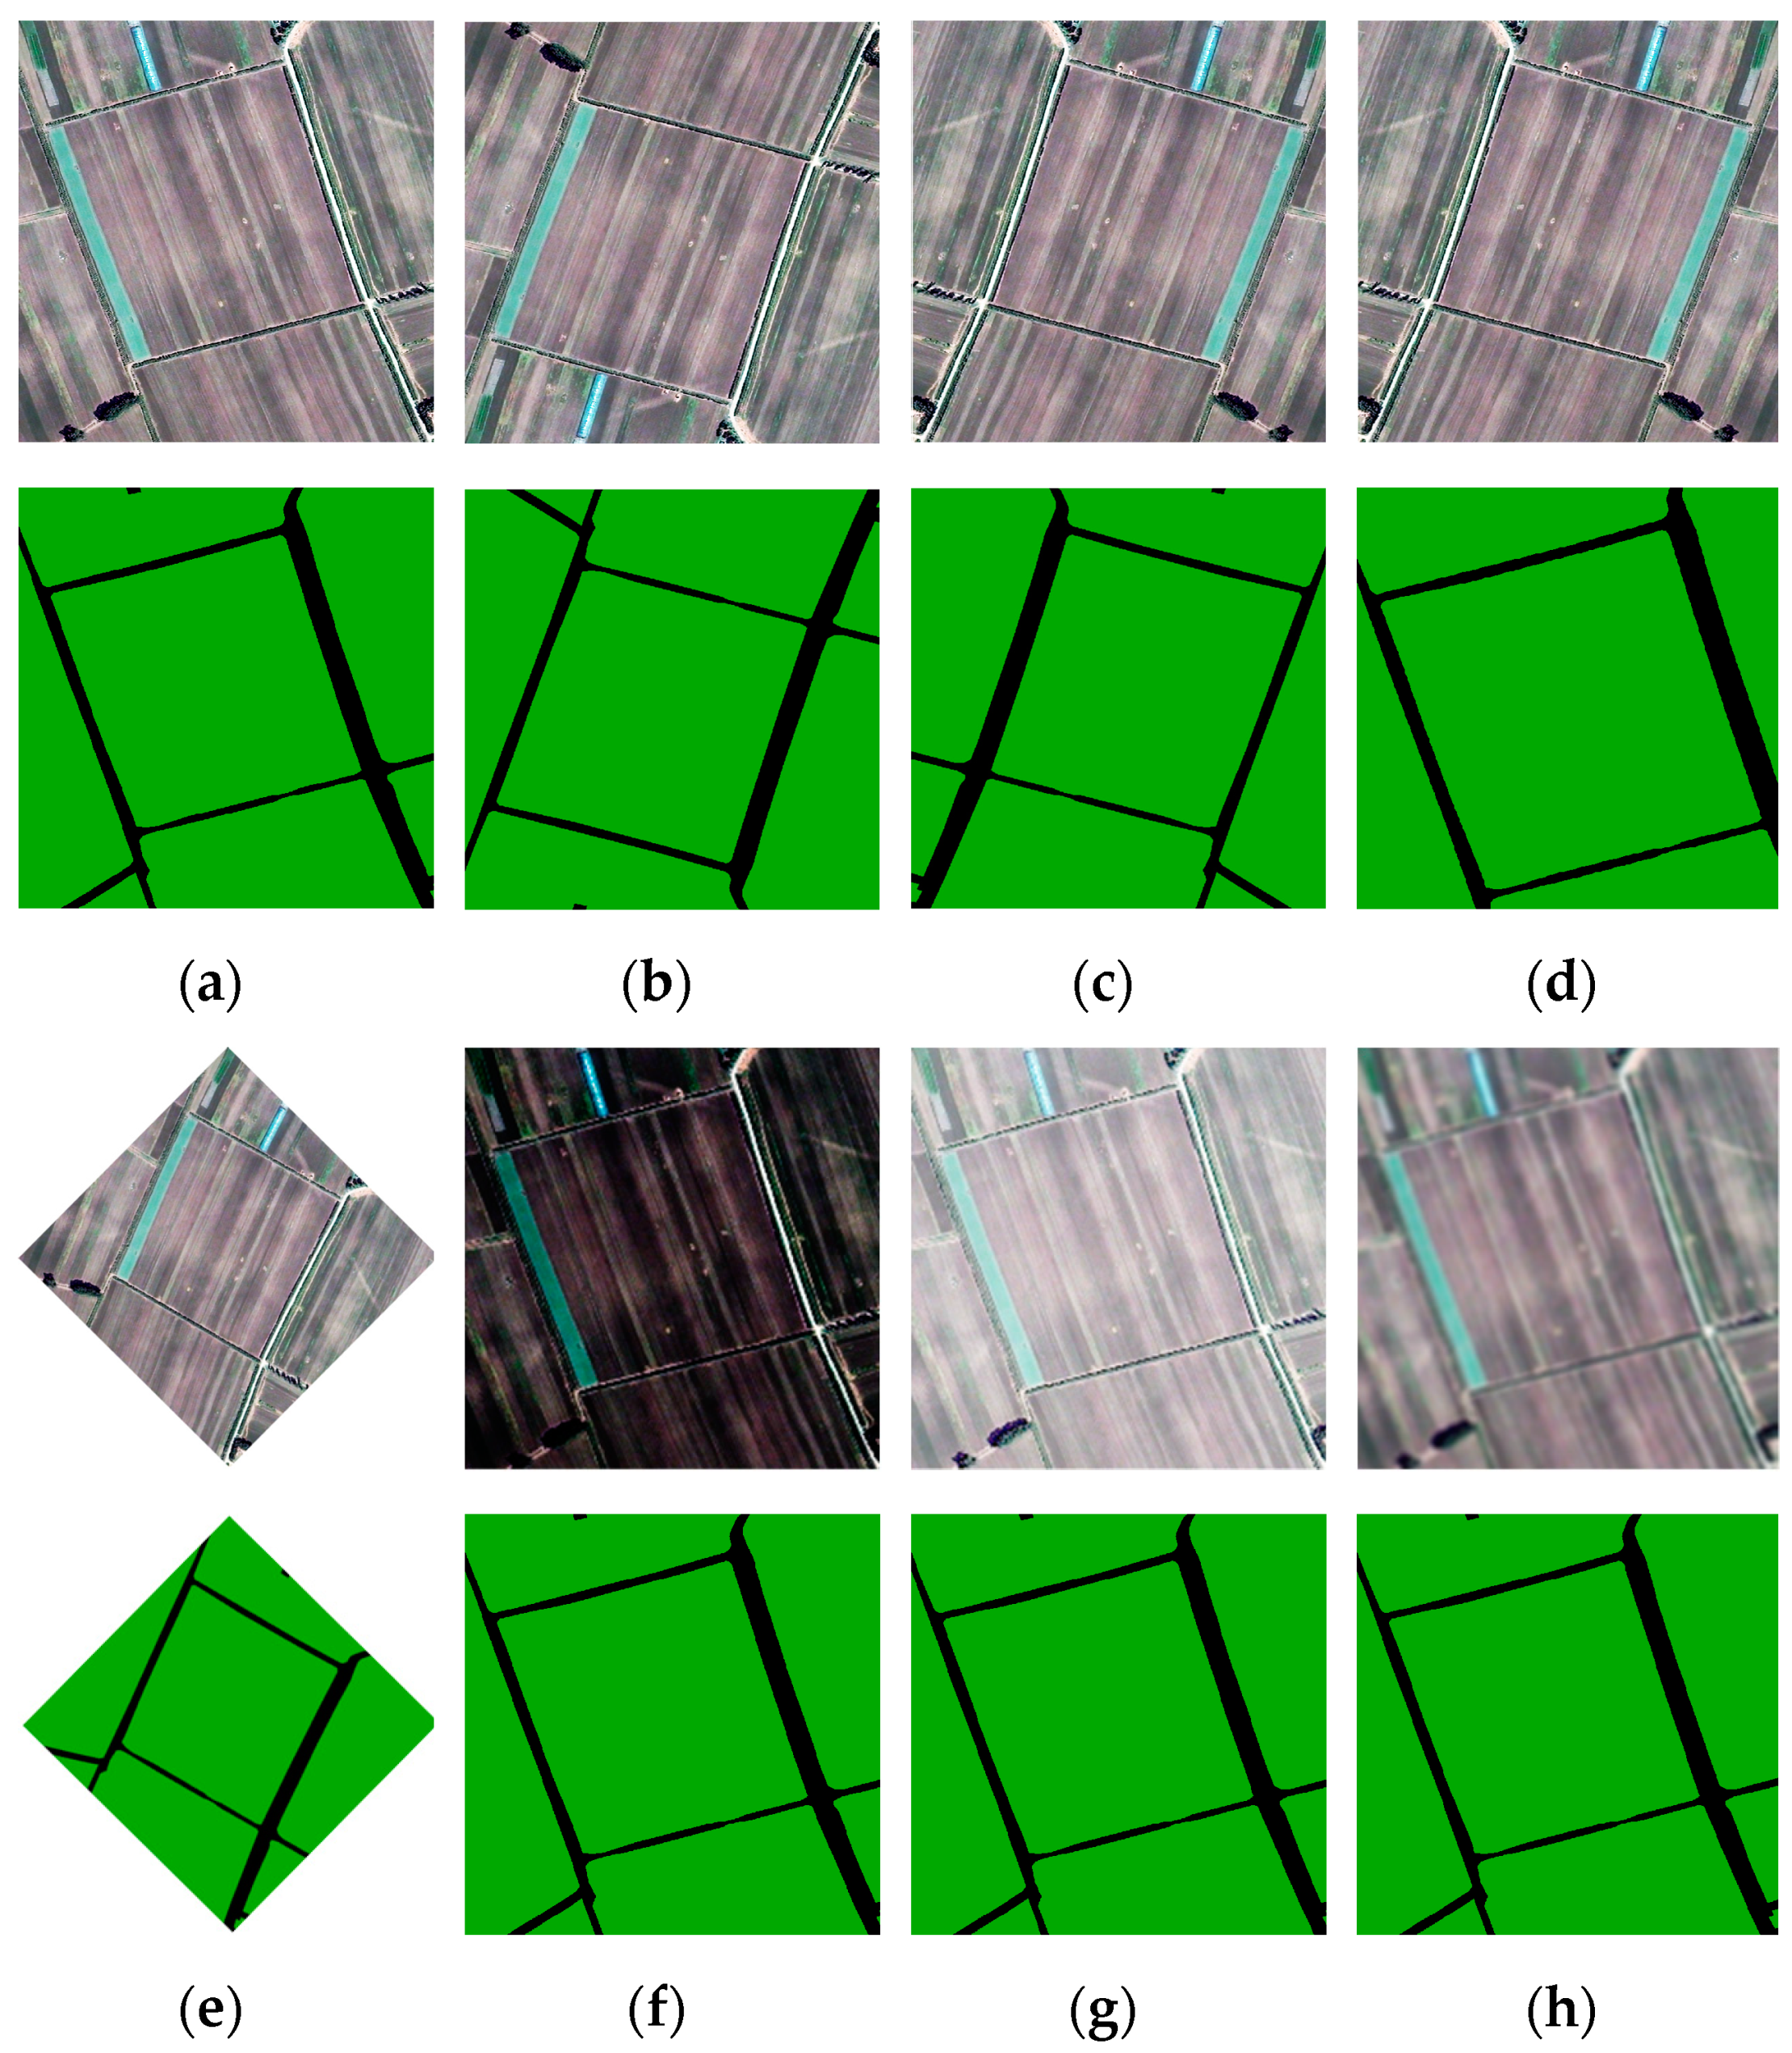
In order to avoid the problems of low generalization ability caused by insufficient samples and variable seasons, we used the sample increment method [45] to rotate, fold, translate, change color contrast, and blur the target in the sample. By simulating data under various conditions, the impact of seasonal changes on the accuracy of cropland segmentation can be reduced to a certain extent.
Figure 2 shows that during the incremental process, at least one incremental method is randomly selected to transform the original image to generate incremental data. Figure 3 shows the result of sample enhancement after the above six changes.
It is convenient for the gradient to drop smoothly during the training process, and the data input to the network is normalized in Equations (1)–(3). If there are n pieces of block training data, T = {x1, x2, …, xn}, we calculate the mean and mean square deviation within the effective range of the batch data, as shown in Equations (1) and (2):
μ T = 1 n i = 1 n x i
σ 2 T = 1 n i = 1 n ( x i μ T ) 2
x ^ i = x i μ T σ T
where xi represents the training sample block i. μ T and σ 2 T are the mean and mean square deviation of digital number (DN) values in the training data of T, respectively. x ^ i is the normalized training data for network input.

3.2. HRNet-CFR Model

In the traditional semantic segmentation of remote sensing images, on the one hand, due to the high resolution of remote sensing images, the Encoder–Decoder deep convolutional network has a down-sampling convolutional layer structure in the Encoder stage, which makes it difficult to recover the fine-edge information of the original label category through the up-sampling structure in the Decoder stage. On the other hand, the spectral reflectance characteristics of different objects may be the same in certain spectral bands. Similarly, it may be the same objects, in different states or environments, showing different spectral characteristics. This phenomenon is called “synonyms spectrum or foreign objects with the same spectrum”, which brings challenges to high-precision image segmentation.
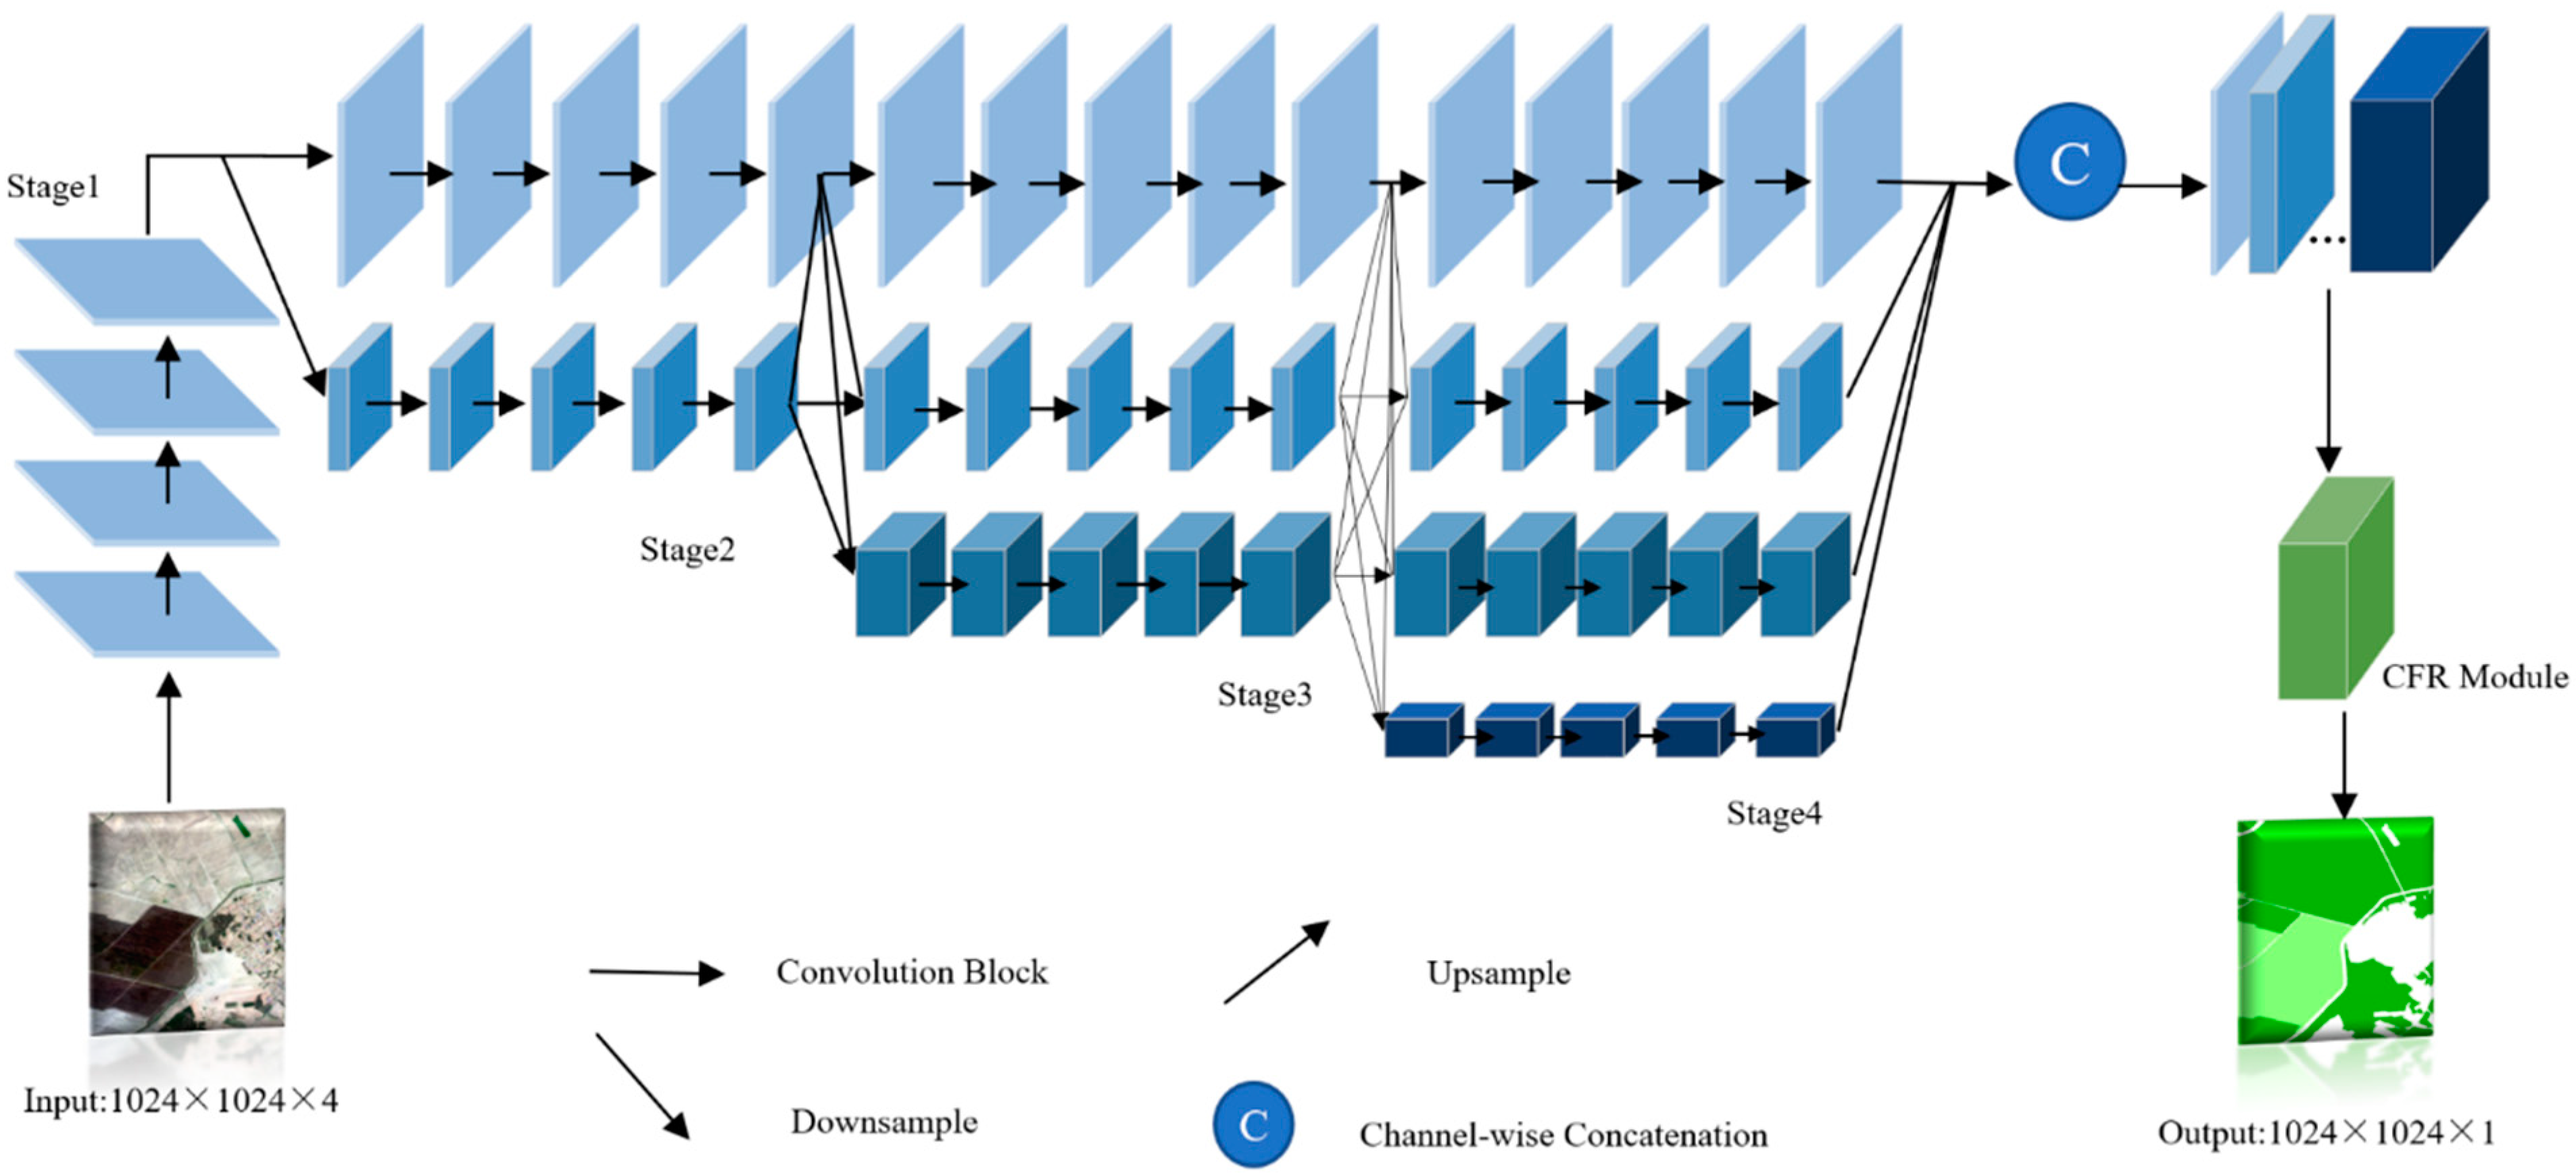
Figure 4 shows the improved high-resolution network of joint contextual feature expression HRNet-CFR in this paper. The network includes a backbone network module and a context feature enhancement representation module.

3.2.1. Backbone Network

Inspired by [46], we introduce a high-resolution network model to maintain high-resolution feature information by connecting high-resolution to low-resolution convolution features in parallel. Each high-resolution to low-resolution representation receives information repeatedly from other parallel representations, thereby obtaining rich high-resolution representations. In this way, the border of the segmented cropland will be smoother and closer to the edge of the real ground object.
In this paper, four-scale feature maps were used for parallel cross-level fusion, as shown in Figure 4 above. The size of the feature map of the four parallel branches is [ 1 4 , 1 8 , 1 16 , 1 32 ] of the original input size, respectively. When the features of each scale are fused, the high-resolution feature map will be down-sampled, the low-resolution feature map will be up-sampled, and the features will be copied at the same resolution to maintain the feature information of the ground features.

3.2.2. CFR Module

Due to the problem of “spatial homogeneity and heterogeneity” in remote sensing image features, it is inevitable to cause pixel mis-segmentation and produce noise similar to “salt and pepper” [47]. Since the semantic segmentation of remote sensing ground objects depends more on neighborhood information, the neighborhood around the pixel is considered as the context feature of the pixel at this time [48]. After the backbone network feature fusion was completed, we connected the CFR module to classify the features of the final fusion context to improve the accuracy of cropland extraction.
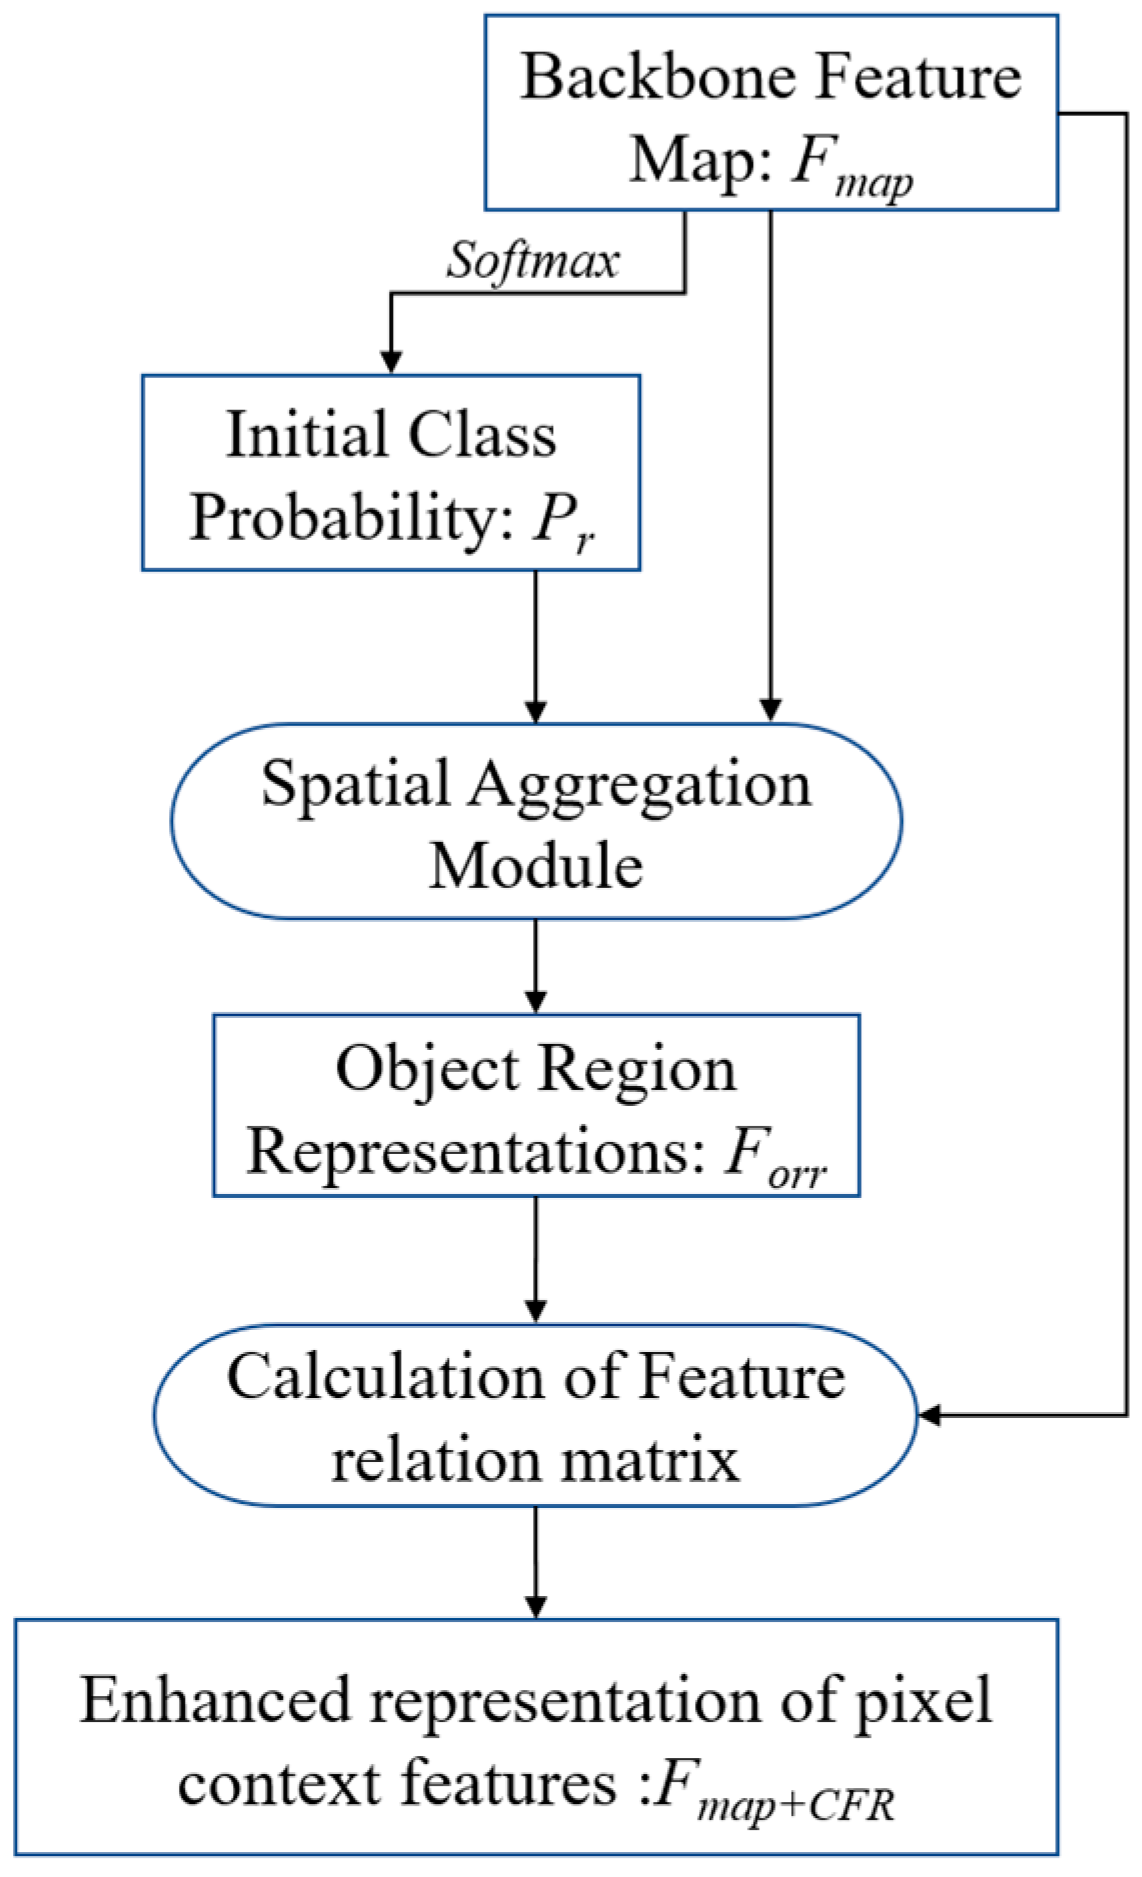
As shown in Figure 5, the main processing steps of the CFR module are as follows.
(1)
Generate an Initial Probability Map
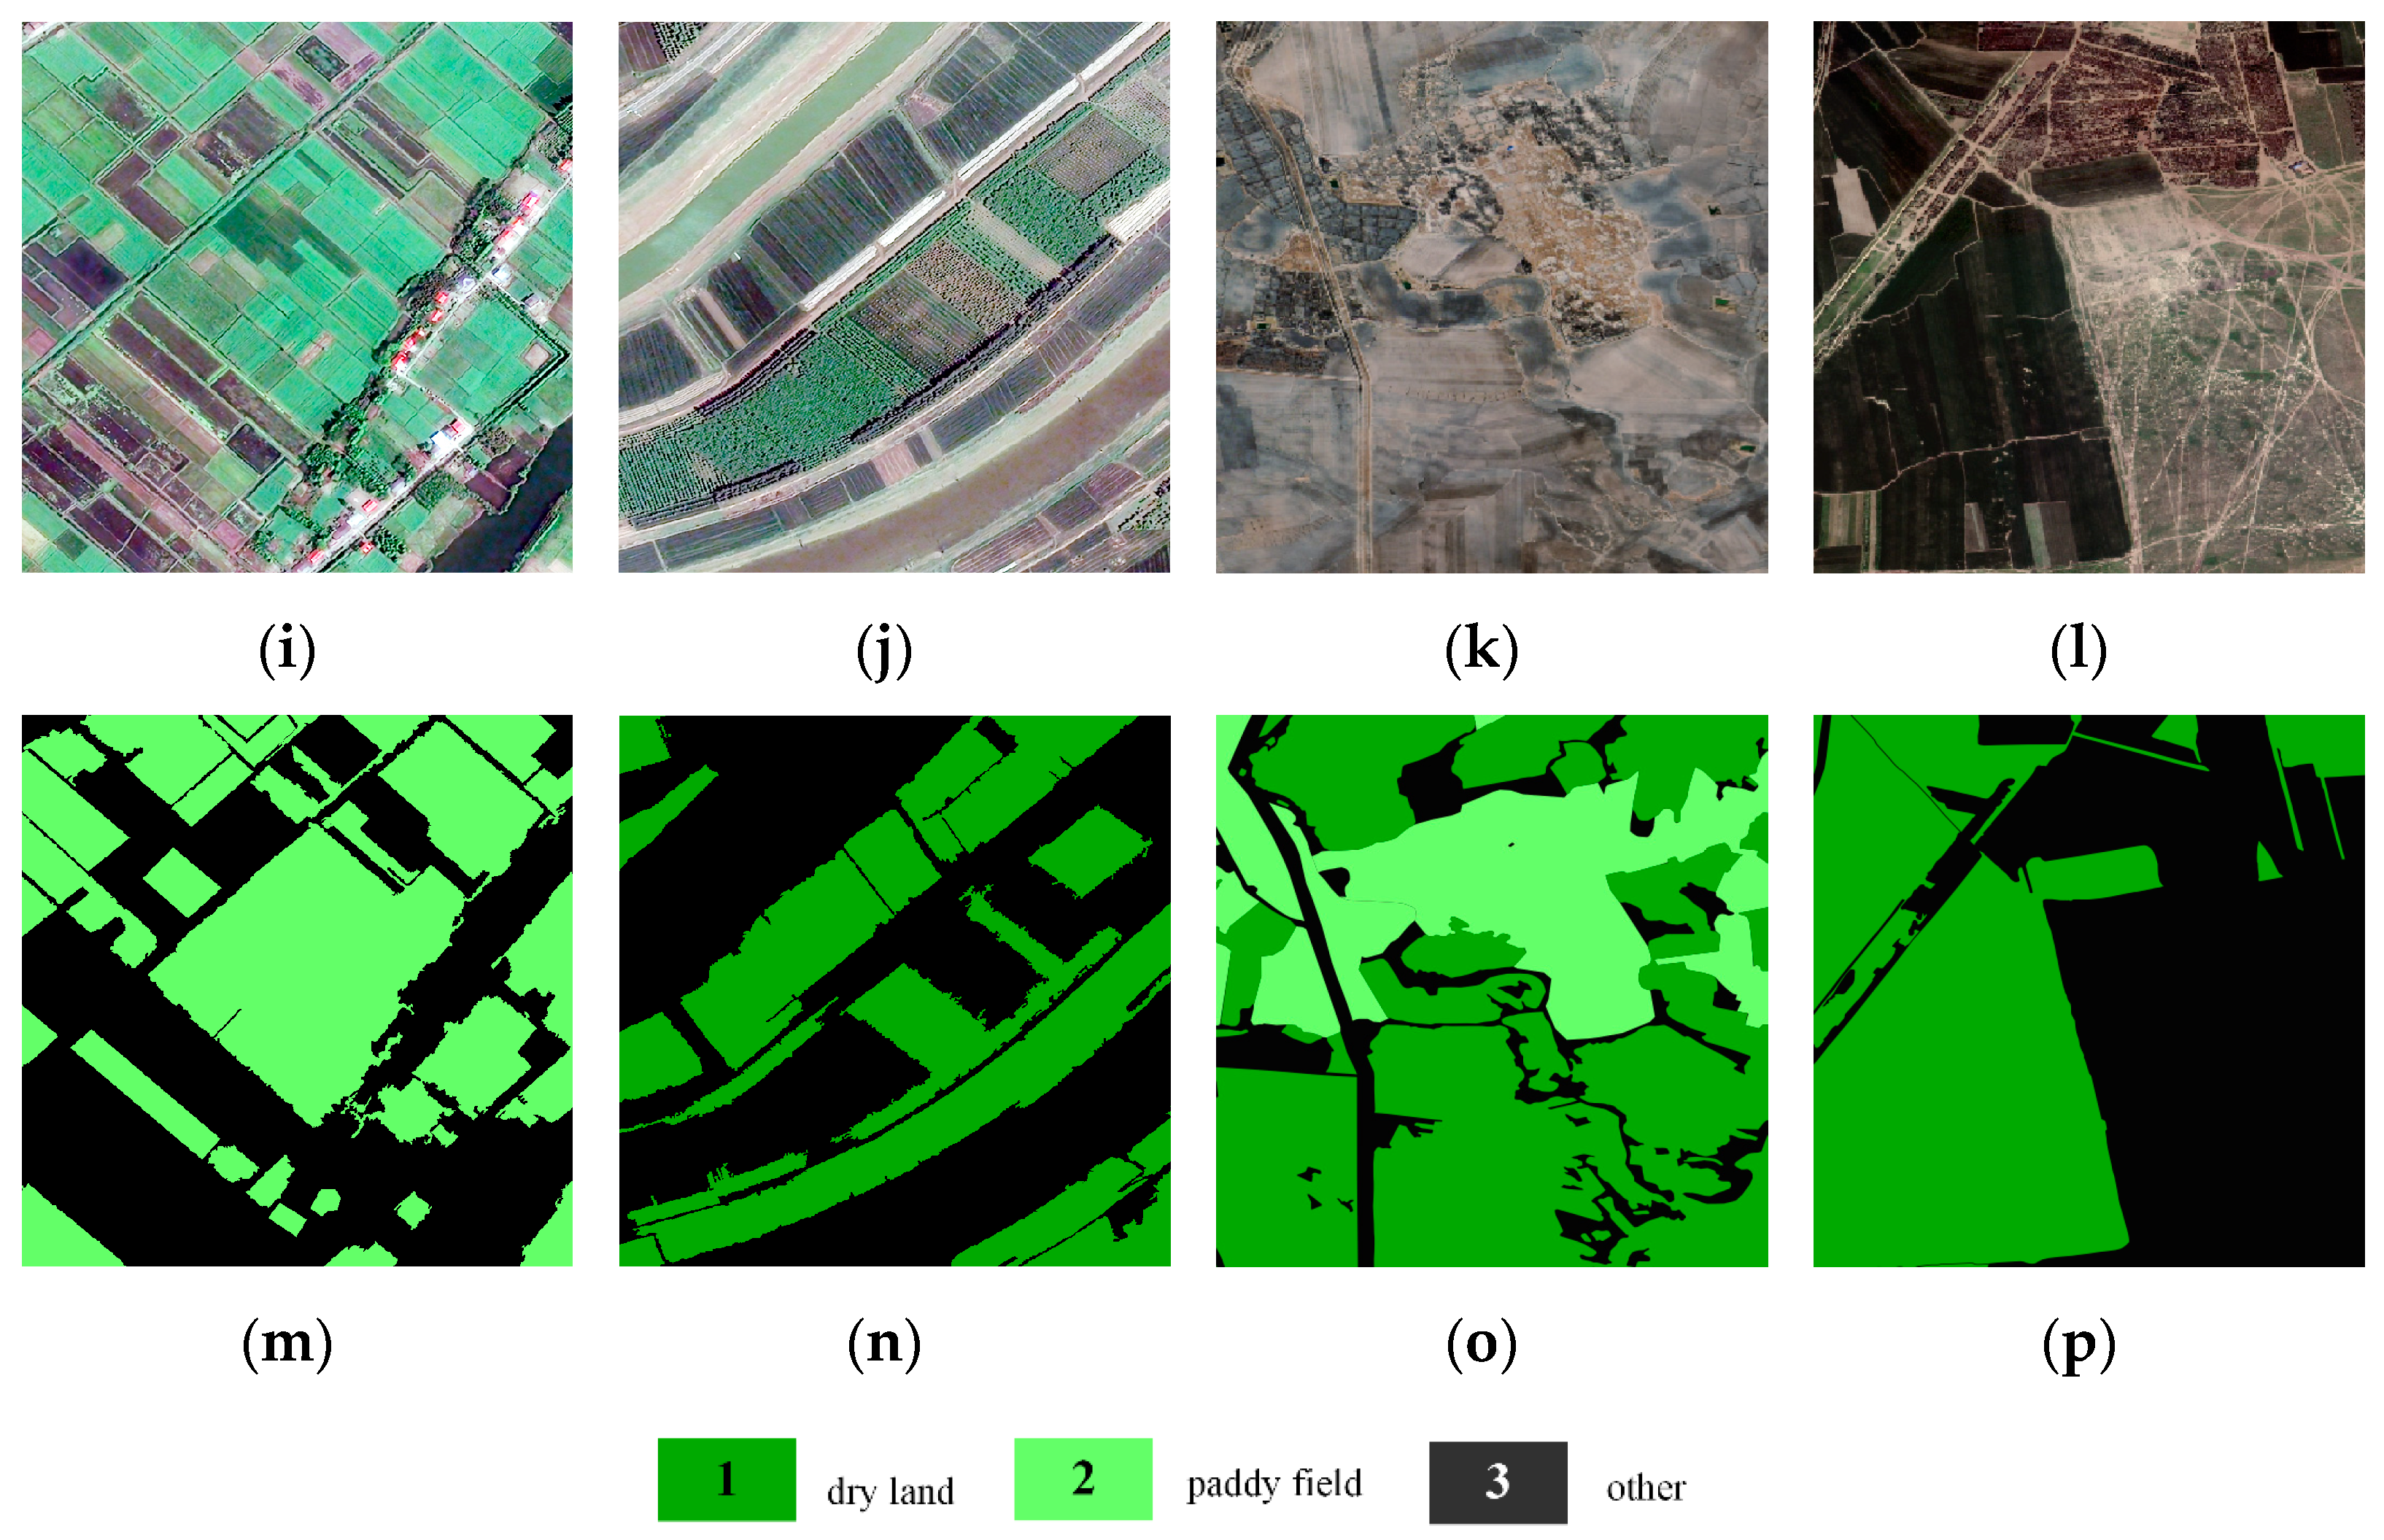
The multi-scale fusion feature map, Fmap, is obtained through the backbone network, and the feature size is C × 256 × 256 (the number of channels × height × width, the same below, in this paper C = 720). Then, connect the Softmax layer to obtain a rough semantic segmentation probability, Pr, with the size L × 256 × 256, where L is the number of categories (where L = 3 in this paper, it includes dry land, paddy field, and others, and where L = 2, it includes cropland and others).
(2)
Calculate Object Region Representations
F o r r = ϕ ( P r ) × φ ( F m a p )
According to the semantic segmentation probability map, Pr, and the multi-scale fusion feature map, Fmap, in the previous step, an L × 512 feature vector can be obtained by matrix operation through the spatial aggregation module in Equation (4). ϕ(∙) means to reshape the matrix Pr to size L × 65,536, φ(∙) means to reshape the matrix Fmap to size 65,536 × C, and the 65,536 is obtained by rearranging the height and width of the two-dimensional feature matrix into one-dimensional. That is, the object region feature represents Forr, in which each vector represents the feature of each category. It is the input reference information for the attention mechanism in the next step (3).
(3)
Obtain Context Feature Representations
F C F R = A t t e n t i o n ( Q , K , V ) = s o f t m a x ( Q T K c k ) V
As the above Equation (5) is the context information expression module, it is used to calculate the relationship matrix, FCFR, between the feature map, Fmap, and the object region feature, Forr. This process will mainly be fused through the attention mechanism. Make the final feature take into account both point-level features and object region representation features.
Q is the eigenvalue obtained by Fmap after two 1 × 1 convolutions and dimensionality reduction, and the feature size is ck × 65,536. K and V are obtained by Forr after 1 × 1 convolution and rearrangement. Both K and V are ck × L in size. ck represents the dimension of the current feature, and in this paper ck = 256. Then, use the softmax operation to normalize the   Q K T / c k into probability distribution, and then multiply it by matrix V to obtain the representation of weight summation, which is FCFR.
Finally, the contextual feature representation, FCFR, and the backbone feature, Fmap, are connected as contextual information-enhanced feature representation, Fmap+CFR (512 × 256 × 256), which can be used to predict the semantics of each pixel category.
Considering the possible imbalance of sample categories, we used an Intersection over Union (IoU)-based loss during the training process, namely the LovaszSoftmax method [3], to replace the more traditional cross-entropy loss.

3.3. Morphological Post-Processing

After the first extraction of cropland, the semantic segmentation results will have localized irregular spots, such as “salt and pepper” noise. Its existence will reduce the precision of cropland and affect the visual effect, which can be regarded as the noise part that needs to be dealt with. Next, morphological post-processing is performed to improve the accuracy of the overall extraction result. Determining the location of the spots and selecting the method to filter out is a key part of the post-processing algorithm.
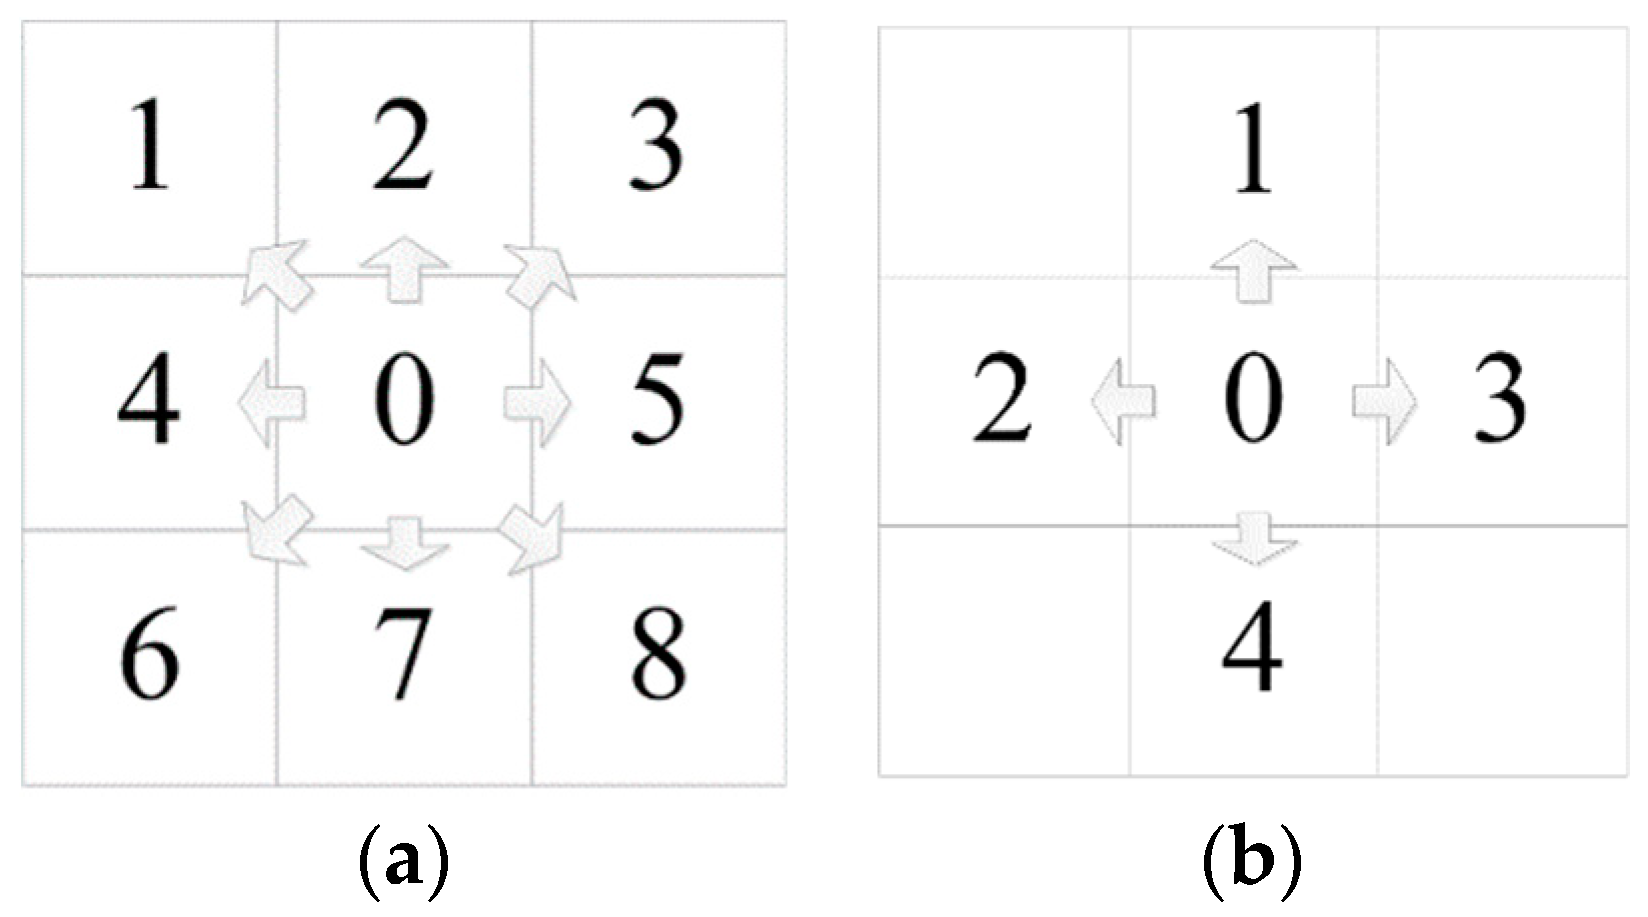
Spots appear irregularly distributed in the semantic segmentation result, and the number cannot be predicted. First, we select the 8-connected domain method to traverse the connected area of the semantic segmentation result, as shown in Figure 6a, and treat the blocks with pixels less than δ as broken spots (in this paper, δ = 50) for marking.
Each class in the semantic segmentation result is processed separately. After traversing all categories of broken spots, let the set of broken spots be S.
Traverse the set S, record 4-connected pixels at the edge of each spot, and count the categories of the pixels as shown in Figure 6b. Assign the value of the class with the largest number to the currently processed spots, Si. After processing, we can obtain the final cropland extraction result.

4. Experiment and Result

To evaluate the accuracy of our proposed HRNet-CFR, we conducted training and evaluation on two datasets, namely the Jilin-1 dataset and the GID dataset. Section 4.1 introduces the details of the cropland high-resolution remote sensing images dataset. Section 4.2 and Section 4.3 show the parameter settings and network training conditions, respectively. In addition, Section 4.4 presents the measurement of accuracy evaluation and results extracted by the model over large-area image data.

4.1. Data Description

  • Jilin-1 Dataset
The experiment used Jilin-1 KF satellite data from Jilin-1 series. The satellite can obtain the panchromatic resolution of 0.75 m, multispectral resolution of 3 m, and width of more than 136 km. It is the world’s largest submicron optical remote sensing satellite with high resolution and super-large amplitude, high-speed storage, high-speed data transmission, and other characteristics. Related scholars [49,50,51] have carried out some research work on remote sensing intelligent information extraction based on Jilin-1 data.
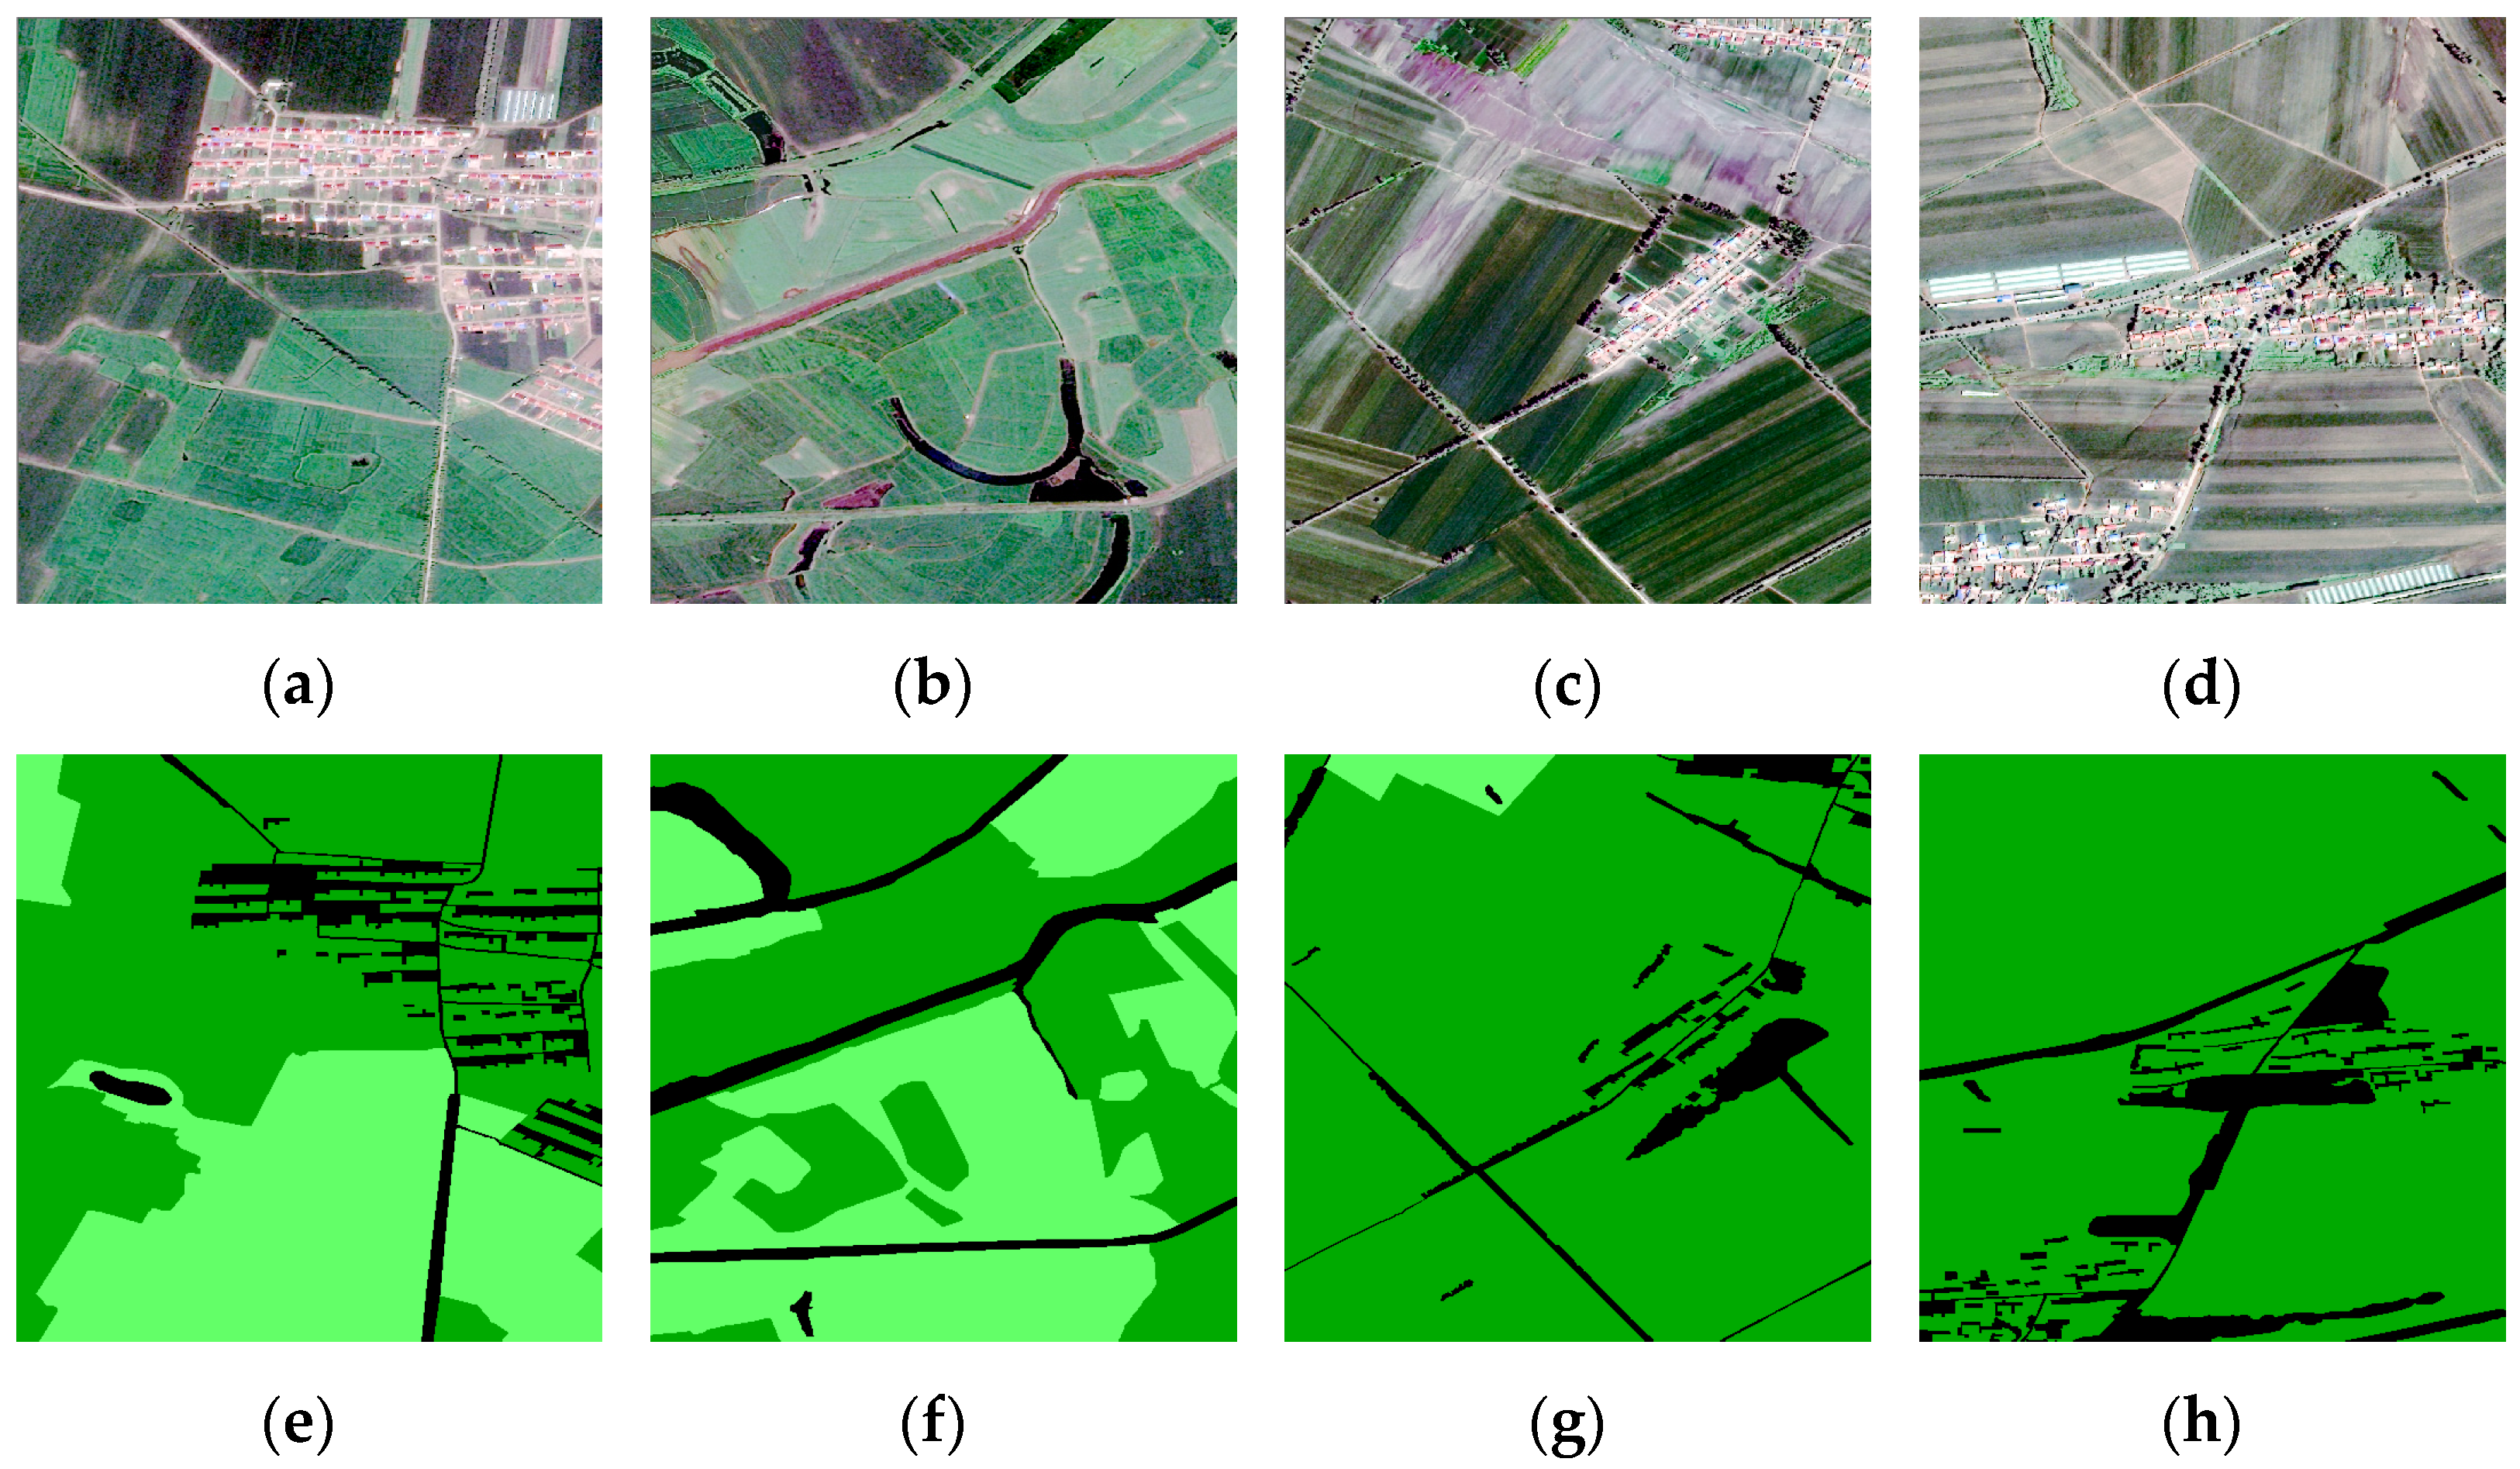
The Jilin-1 cropland dataset was mainly obtained from high-resolution remote sensing image data of Northeast China (Figure 7), and the timespan was from spring to autumn. The category labeling data were correspondingly cropped from the project vector results through a sliding window. The size of each image pair was 1024 × 1024, and there were three categories: dry land, paddy field, and others.

GID Dataset

The Gaofen Image Dataset (GID) [4] is a large dataset used for land use and land cover (LULC) classification. It contains 150 high-quality GF-2 images from more than 60 different cities in China, covering a geographic area of more than 50,000 square kilometers. GID images have high intra-class diversity and low inter-class separability. Some scholars [52,53,54] have started related research based on the GID dataset.
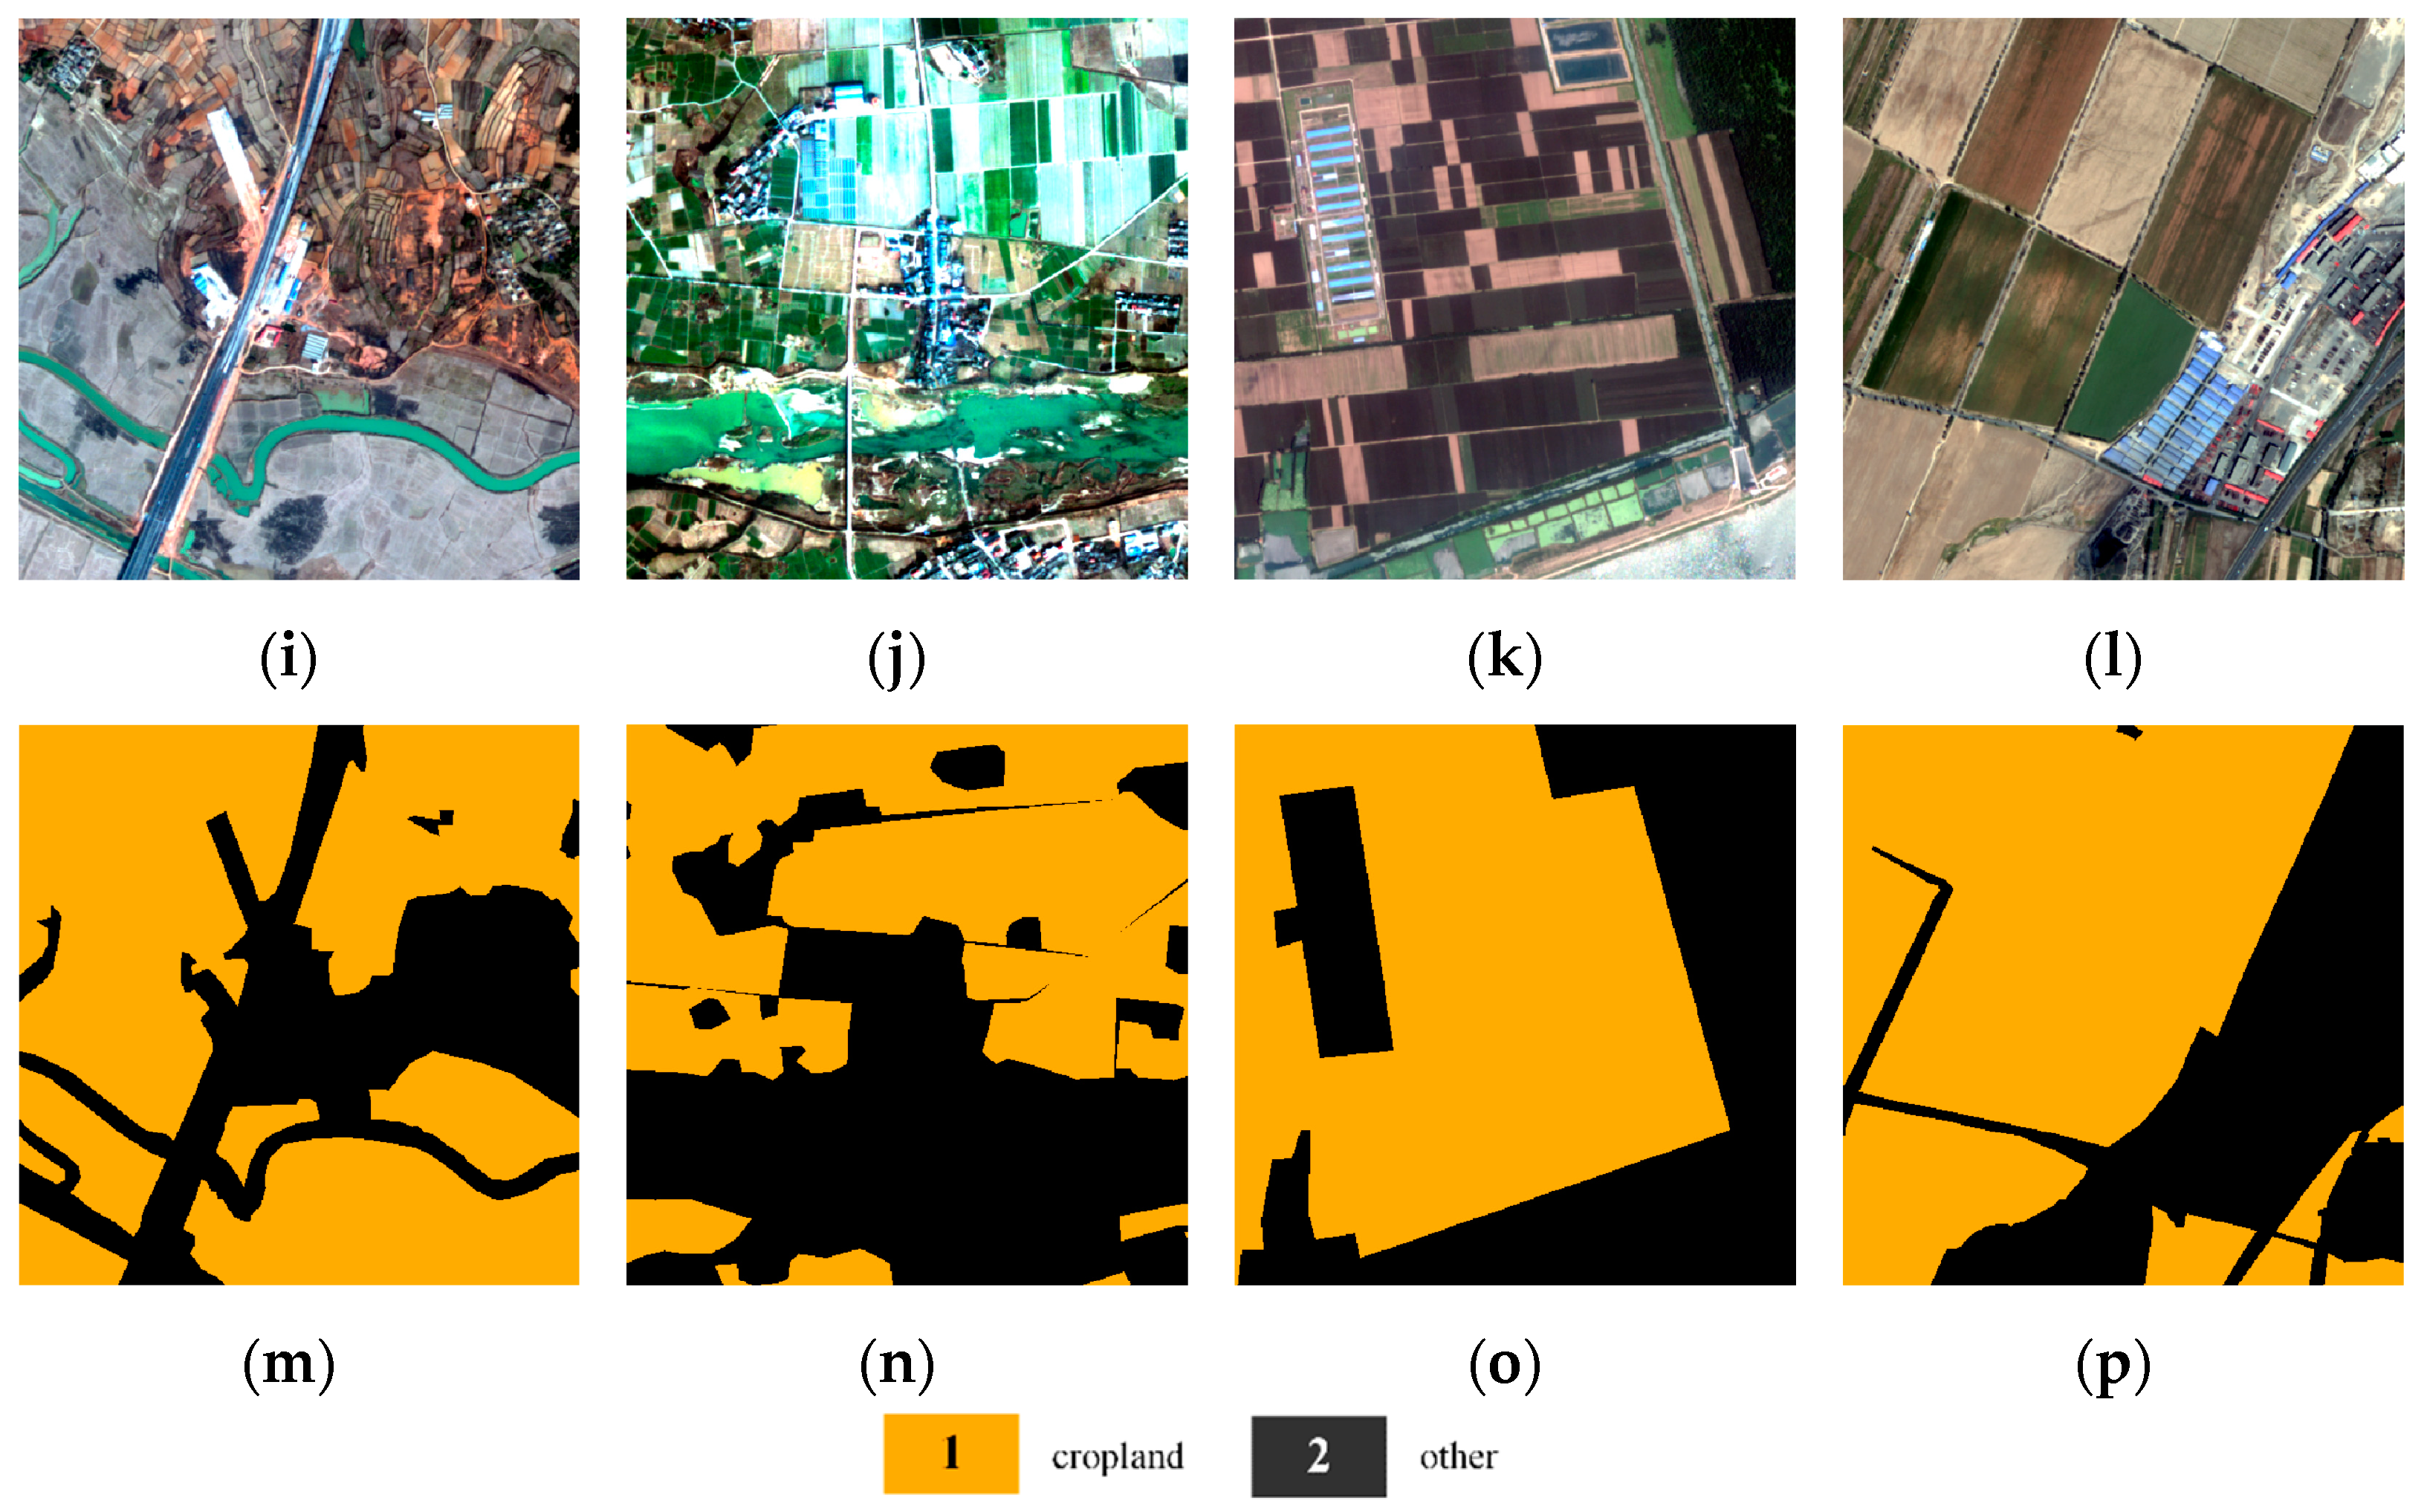
This experiment used five categories of datasets (Large-scale Classification_5classes), including built-up areas, cropland, forest land, grassland, and waters. As shown in Figure 8, this study extracted the cropland categories in the GID dataset separately, and assigned other categories to others.
For the objectivity of experimental comparison, the number of images in each part of the dataset were randomly selected. In order to ensure the reproducibility of the experiment, we fixed the random number seed. Through randomly selecting training samples for processing, the number of final training images was 1.5 times that of the original samples. All the generated image pairs were allocated to the final training set, validation set, and test set in a ratio of 5:3:2. The areas of the validation set of Jilin-1 and GID datasets were about 5530.7 and 6868.1 square kilometers, respectively. Table 1 introduces the cropland dataset in this study.

4.2. Experimental Settings

HRNet-CFR: The network gradient optimization function was the Stochastic Gradient Descent (SGD) algorithm, the basic learning rate was 1 × 10⁻², the momentum was 0.9, the weight attenuation coefficient was 5 × 10⁻⁴, and the iteration round was 60 epochs. During the training process, the learning rate decreased linearly. The image input size was designed to be 1024 × 1024 × 4, and the batch size of each GPU was 1.
Deeplabv3+: In the training process, the initial learning rate was 1 × 10⁻⁴, the decay rate was 1 × 10⁻⁵, the expansion rate list = (6, 12, 18), and iterative rounds were 60 epochs.
UPerNet: In the training process, the initial learning rates of the Encoder and Decoder were both 2 × 10⁻³, the decay rate was 1 × 10⁻⁴, the weight of deep supervision loss was 0.4, the power in poly to drop the learning rate was 0.9, and iterative rounds were 60 epochs.
The system of this experiment was Ubuntu 18.04, and the processor was Intel® Core™. The i7-6850k graphics processor (GPU) was the Nvidia GeForce Titan X GPU with 12 GB memory.

4.3. Network Training

The weight of the backbone network of feature extraction was initialized with the HRNet-W48 pre-training network of the Cityscapes street view dataset [55]. The number of convolution kernels of the convolution input of the first layer was modified to be consistent with the number of image bands, and the weights were randomized by the initialized Gaussian distribution function. The mean was 0 and the standard deviation was 0.01.
The figures below show the loss reduction curve, the learning rate decay curve, and the accuracy curve of the verification set during the training of the two datasets, respectively. It can be seen from Figure 9c that paddy field is more difficult to correctly extract than dry land in spring images, and the verification set curve was in a fluctuating state before 50 epochs. Figure 10 shows the GID training curve of the public dataset. From Figure 10c, it can be found that the accuracy was the best in the 16th epoch, because the data types were more diverse and it was easy to fall into the local optimal. The model was relatively stable after 40 epochs.

4.4. Evaluation of Results

4.4.1. Accuracy Assessment

In the subsection of quantitative evaluation of the accuracy of cropland extraction, the main indicators we use are IoU and overall accuracy (OA). Area(SegySeggt) refers to the intersection area of the plane space between the segmented cropland target and the manually marked cropland, and Area(SegySeggt) refers to the union area of the plane space between the segmented cropland target and the manually marked cropland. The IoU index can well-reflect the positioning accuracy of the detected edge.
IoU = A r e a ( S e g y S e g g t ) A r e a ( S e g y S e g g t )
OA = T P + T N T P + T N + F P + F N
where TP is the number of pixels that are correctly classified as cropland, FP is the number of pixels that are incorrectly classified as cropland, FN is the number of pixels that are incorrectly classified as other categories, and TN is the number of pixels correctly classified as other categories.

4.4.2. Results of Jilin-1 Dataset

This section is based on the images of the Jilin-1 dataset to evaluate the accuracy of cropland extraction in different regions, different time phases, and different bands in Jilin Province.
Figure 11 visually analyzes the results of cropland extraction in the central region of Jilin province with small geographic differences, and the western region with large differences. Figure 11a,d show the western regions with large geographic differences. From the visualization result, it can be seen that there is more saline-alkali land and fragmented land in the Baicheng research area, and there is a certain degree of omission and mis-segmentation. Figure 11i shows the model obtained through training in Changchun city during the period from April to May, and the result of extracting the cropland of Siping city by transferring the previously trained model. It can be seen from the results that the generalization ability of the HRNet-CFR model is relatively strong, and the dry land is basically correctly proposed. Due to the growth of crops in paddy fields with time difference, and since the time correlation is strong, part of dry land is mistakenly segmented as paddy field. Comparing Figure 11h,i, it can be found that the algorithm completely proposes roads that are not marked in the true data.
From Table 2, showing the results of the cropland extraction in the Changchun study area, it can be found that a four-band (B, G, R, NIR) image is more suitable for extracting cropland. Compared with the three-band (B, G, R) image extraction results, the overall accuracy of the comparison of different bands from March to April improved by 1.01%. Among different types of cropland extraction, June to July is more suitable for distinguishing dry land and paddy land. From the results extracted in March to April, the IoU of dryland and paddy field increased by 4.2% and 2.4%, respectively. The addition of contextual features is helpful for the extraction of cropland. Compared with HRNet, the HRNet-CFR method had a certain improvement in the extraction accuracy, and the overall accuracy increased by about 1.2%.
In the Baicheng area, due to the salinization of part of the land [56], there are certain geographical differences, which brings certain challenges to the extraction of cropland. In the extraction results from June to July, the overall accuracy of cropland extraction in Changchun city was about 0.97% higher than that in Baicheng.

4.4.3. Regional Cropland Extraction

Compared with natural images, the high-resolution mosaic image has huge data magnitudes. The size of an orthorectified Jilin-1 image is more than 30,000 × 30,000 pixels, which greatly exceeds the 512 × 512 or 1024 × 1024 size of patches used in the training process. As mentioned in the previous section, the sufficiency of contextual information affects segmentation performance, which suggests that pixels close to the edge cannot be classified as confidently as ones close to the center, because the lack of information outside the patch limits the contextual information of the edge region. There may appear to be stitching traces if a regular grid is adopted for cropping, predicting, and mosaicking.
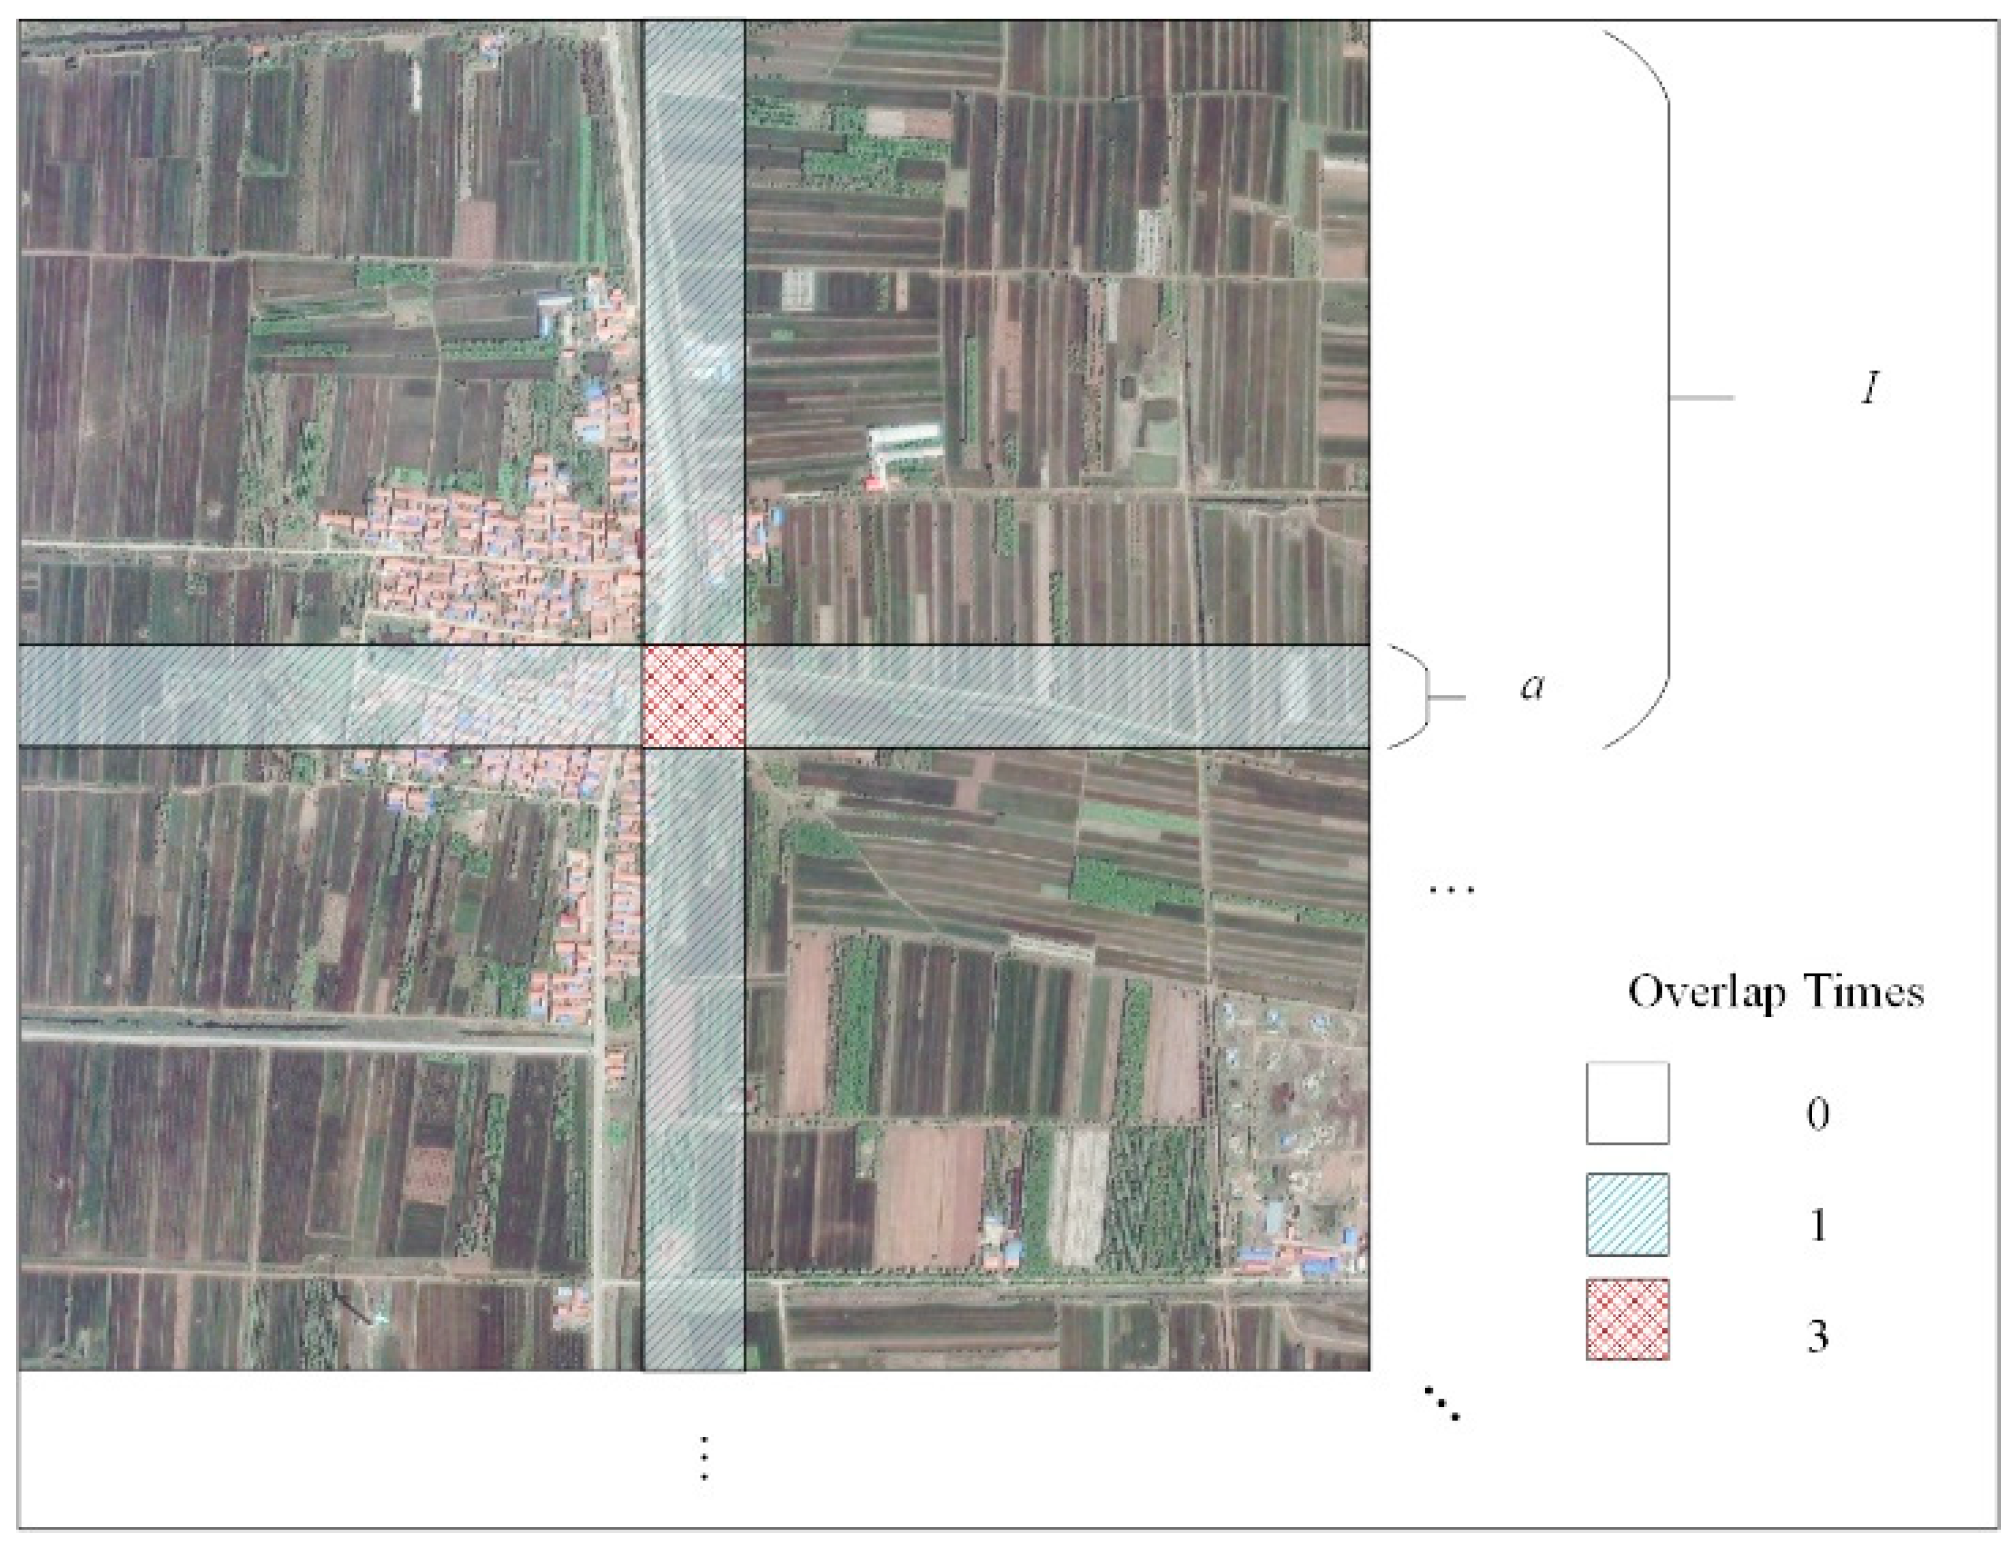
To further improve the segmentation performance and obtain smooth masks, we adopted a smoothing strategy with overlapping moving sliding windows, as in the following formula. We counted the number of overlaps in each block in the entire image, superimposed the predicted probability map, and divided by the number of overlaps to obtain the average category probability data of the overlapped part. The extracted result map of a mosaic image obtained in this way greatly reduces the edge effect caused by block division.
P f = i m 0 P i 0 + i m 1 P i 1 2 + i m 3 P i 3 4
where Pf is the probability of the entire image obtained according to our strategy, P i 0 , P i 1 , and P i 3 are cropped patch blocks with 0, 1, and 3 overlaps, respectively, and m0, m1, and m3 are the indexes of the cropped patch blocks whose overlap times are 0, 1, and 3, respectively.
As shown in Figure 12, the actual prediction result of the cropped patch has a size of I, and the overlap size is a, 1 8 of the I. We calculated the number of overlaps, where the white box is no overlapping area, the blue diagonal striped frame is the area overlapped 1 time, and the red striped box is the area overlapped 3 times.
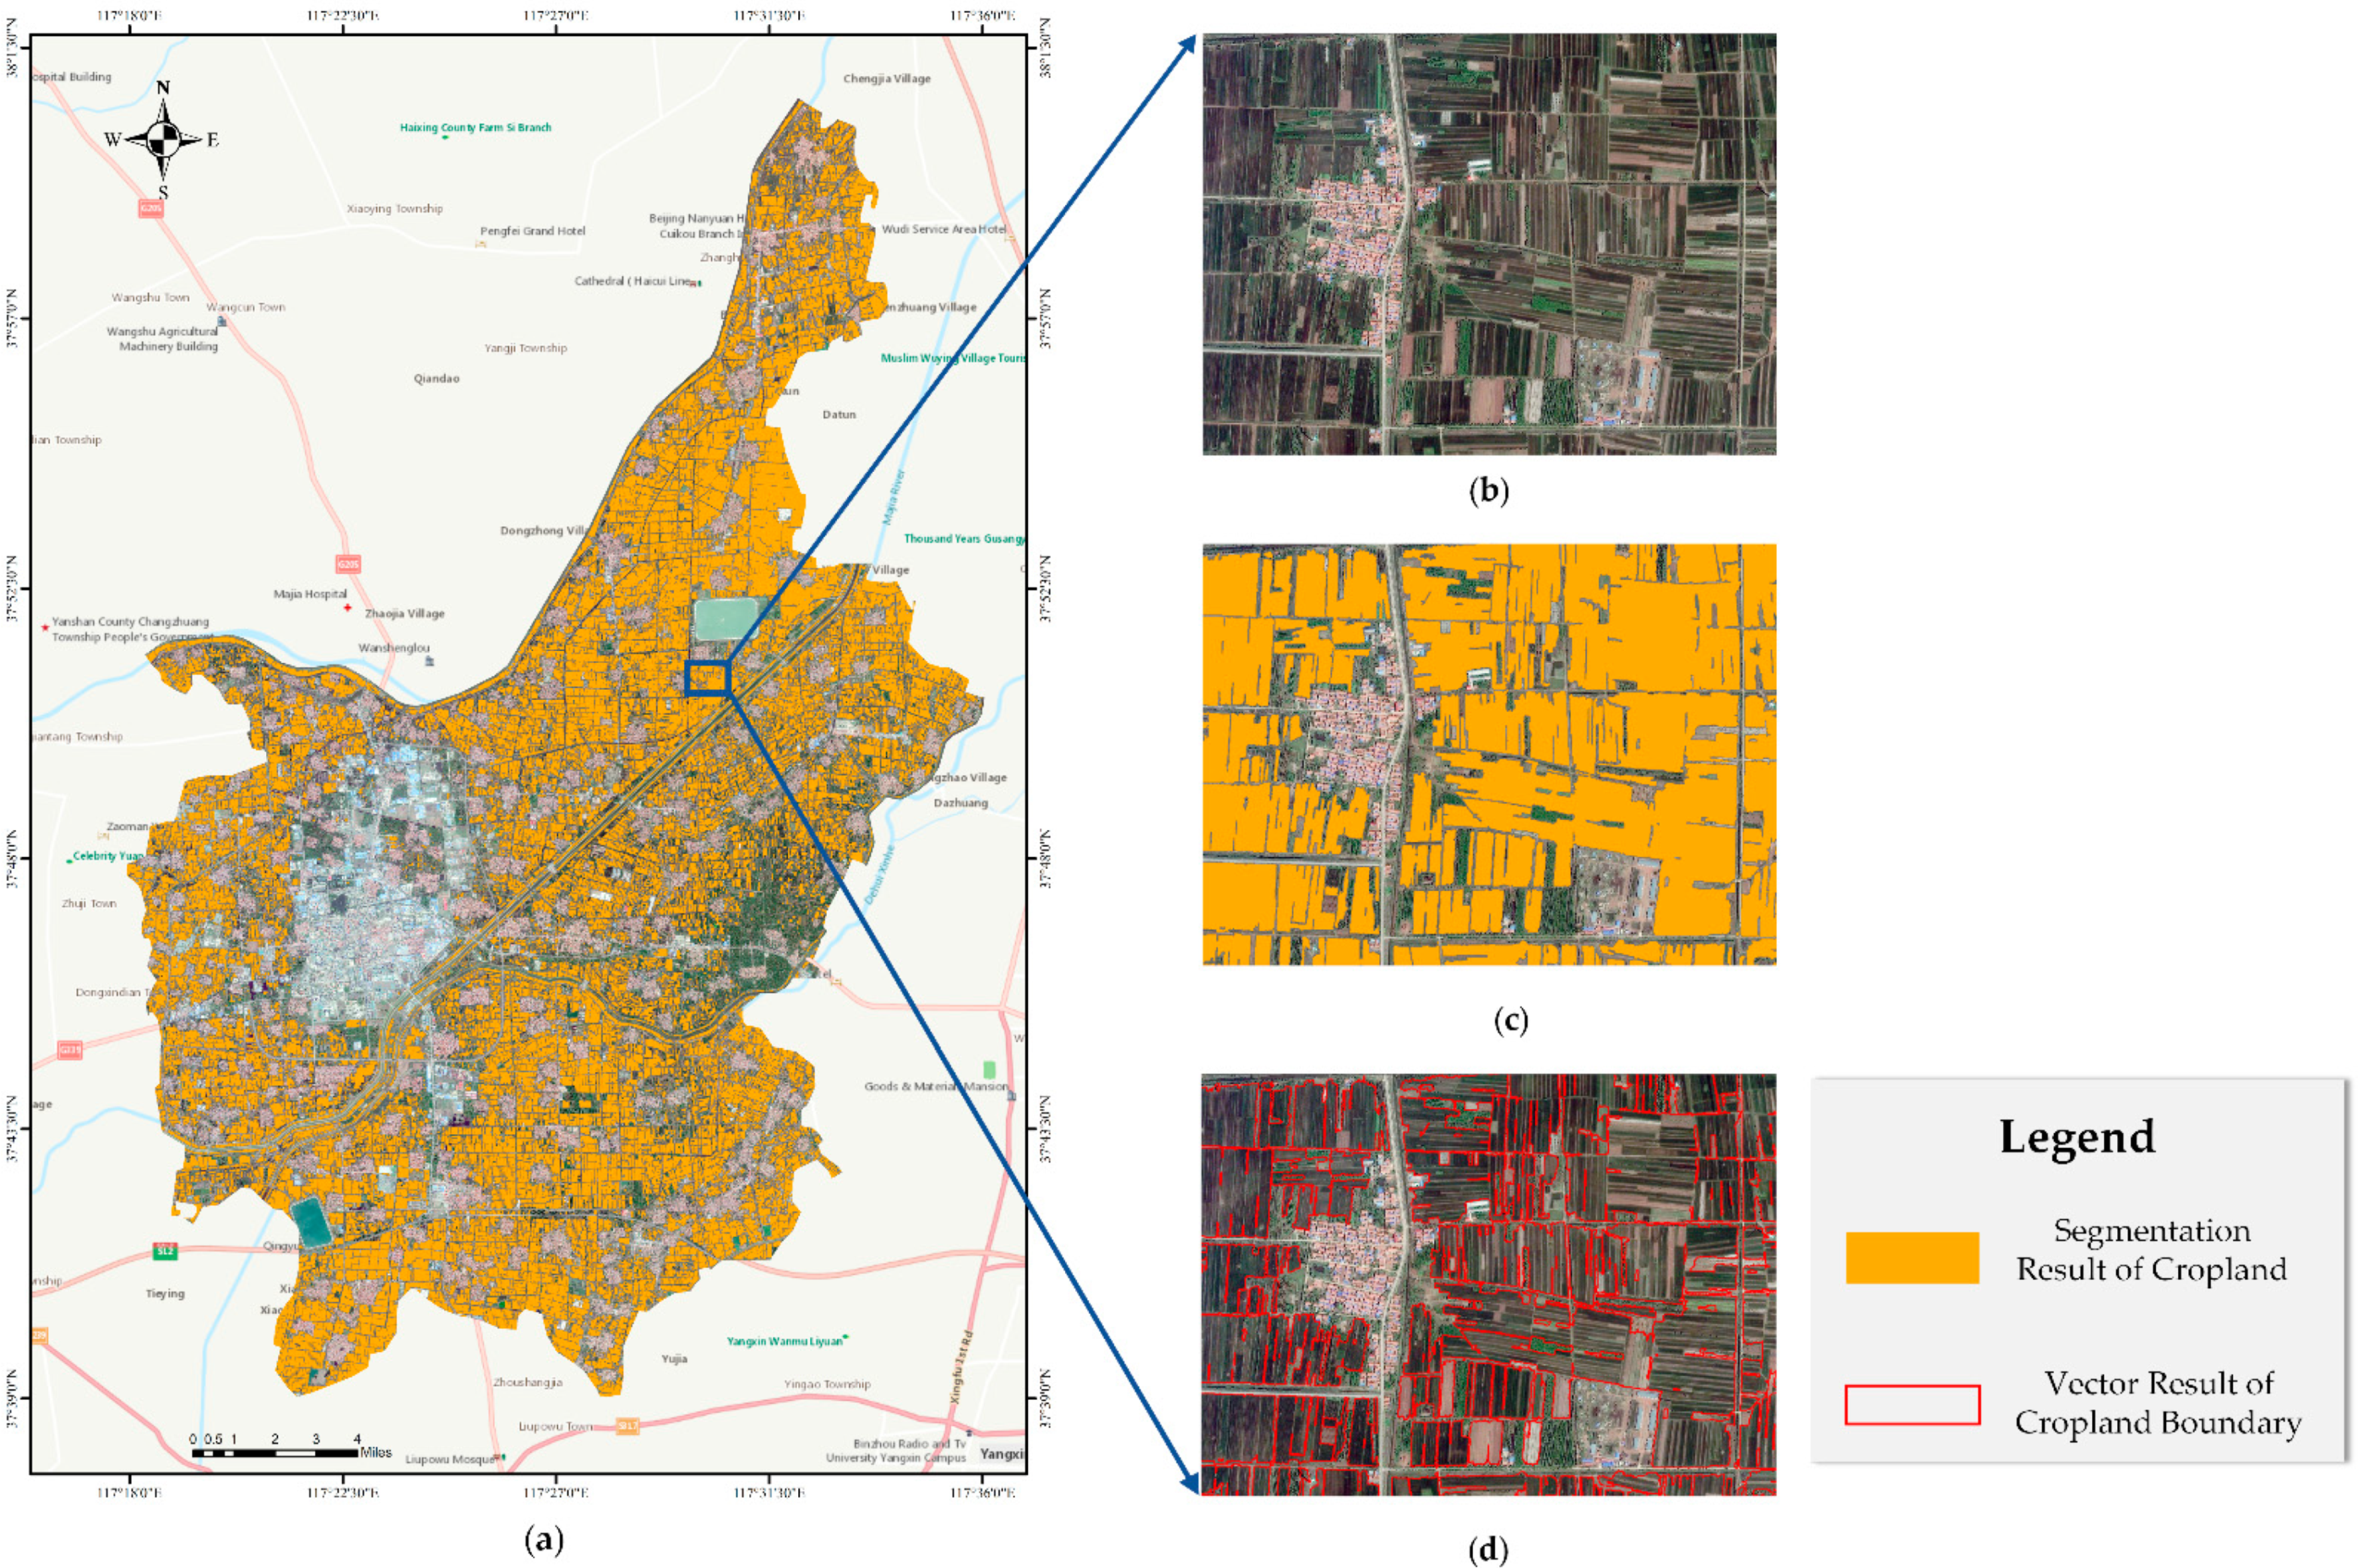
We used the HRNet-CFR model to conduct a regional cropland extraction experiment in Qingyun County, Dezhou City, Shandong Province, a city in northern of China. The image source is a Jilin-1KF image, the shooting date was 10 May 2020, and the size was 67,466 × 44,010 pixels. Its grain crops are mainly wheat and corn. Wheat was mainly sown around the beginning of October last year and harvested around the first ten days of June. Corn sowing is mainly in early April and harvested in early September. At this time, the cropland in the image is mainly wheat. As shown in Figure 13, the area is dominated by dry land. The forest land around the city and in the cropland can be better distinguished from Figure 13c. It can be seen from Figure 13d that the extracted results fit well with the actual cropland boundary, which can provide data support for agricultural growth and yield estimation in the future.
According to the extraction results, we can quickly calculate that the area of cropland extracted was 333,900 mu. Compared with the area data of 362,600 mu published by the Qingyun County Natural Resources Bureau [57], the error of the area extracted by our method was 7.9%.

5. Discussion

In this section, the structure of the network is analyzed, and the features extracted by the network are visualized. Finally, the comparison with other methods in the GID dataset and the potential and limitations of our approach are discussed.

5.1. Network Structure Analysis

The entire network of HRNet-CFR is divided into 6 modules: StemNet, Stage1, Stage2, Stage3, Stage4, and CFR. The function for generating low-resolution branches starts at Stage2, Stage3, and Stage4, and the repeated multi-scale fusion function ends at Stage1, Stage2, and Stage3. The network input size is 1024 × 1024 × 4. We used convolution kernel sizes of 3 × 3 and 1 × 1, and the Rectified Linear Unit (ReLU) activation function to reduce the nonlinearity in the convolution process and prevent overfitting.
Table 3 presents the structure of the HRNet-CFR, where k is the size of the convolution kernel, s is the convolution step size, and p is the image padding size before the convolution operation. Compared with ResNet50, the network has more layers, and it has a higher extraction efficiency than DenseNet and ResNet-101.
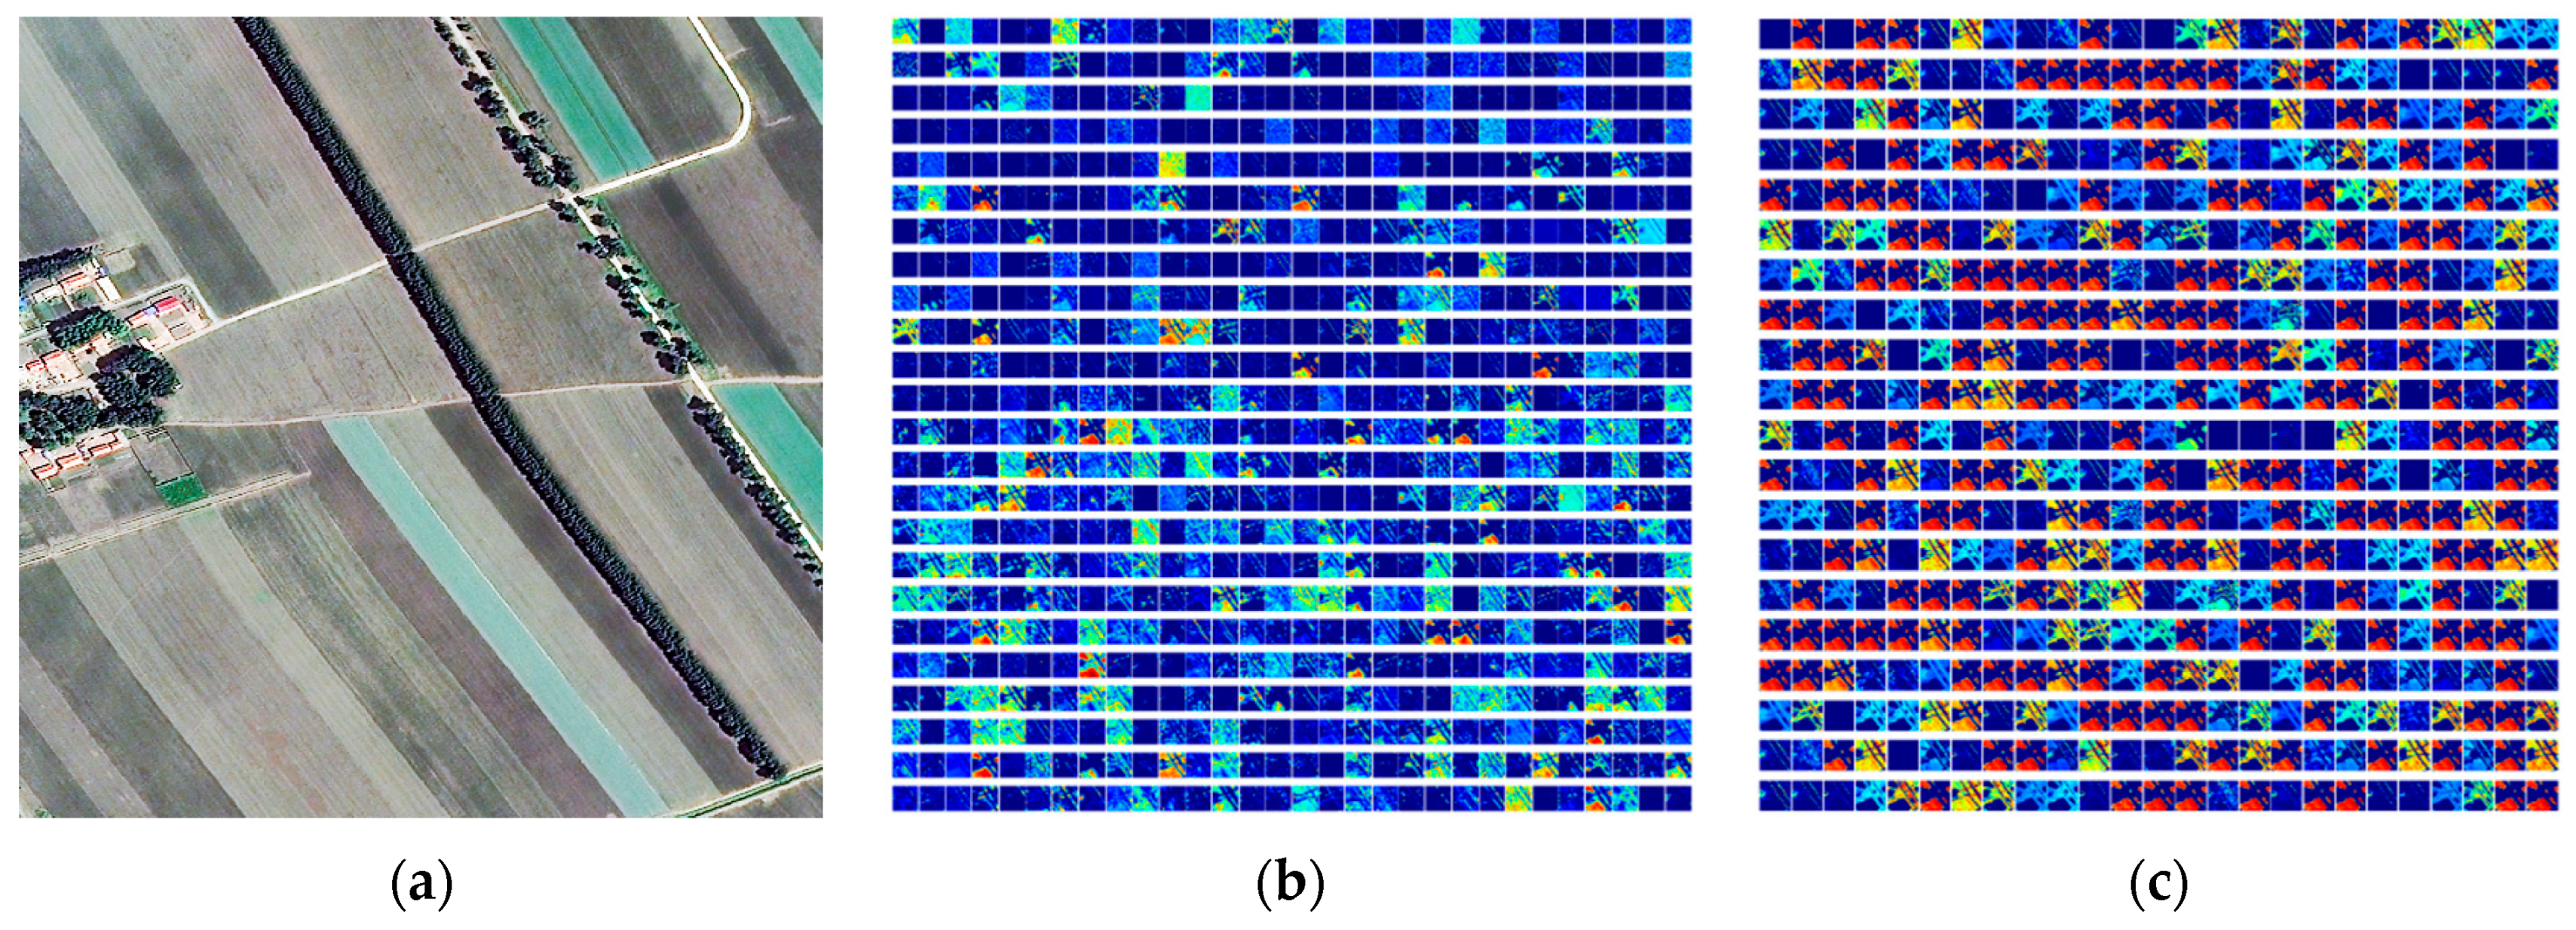
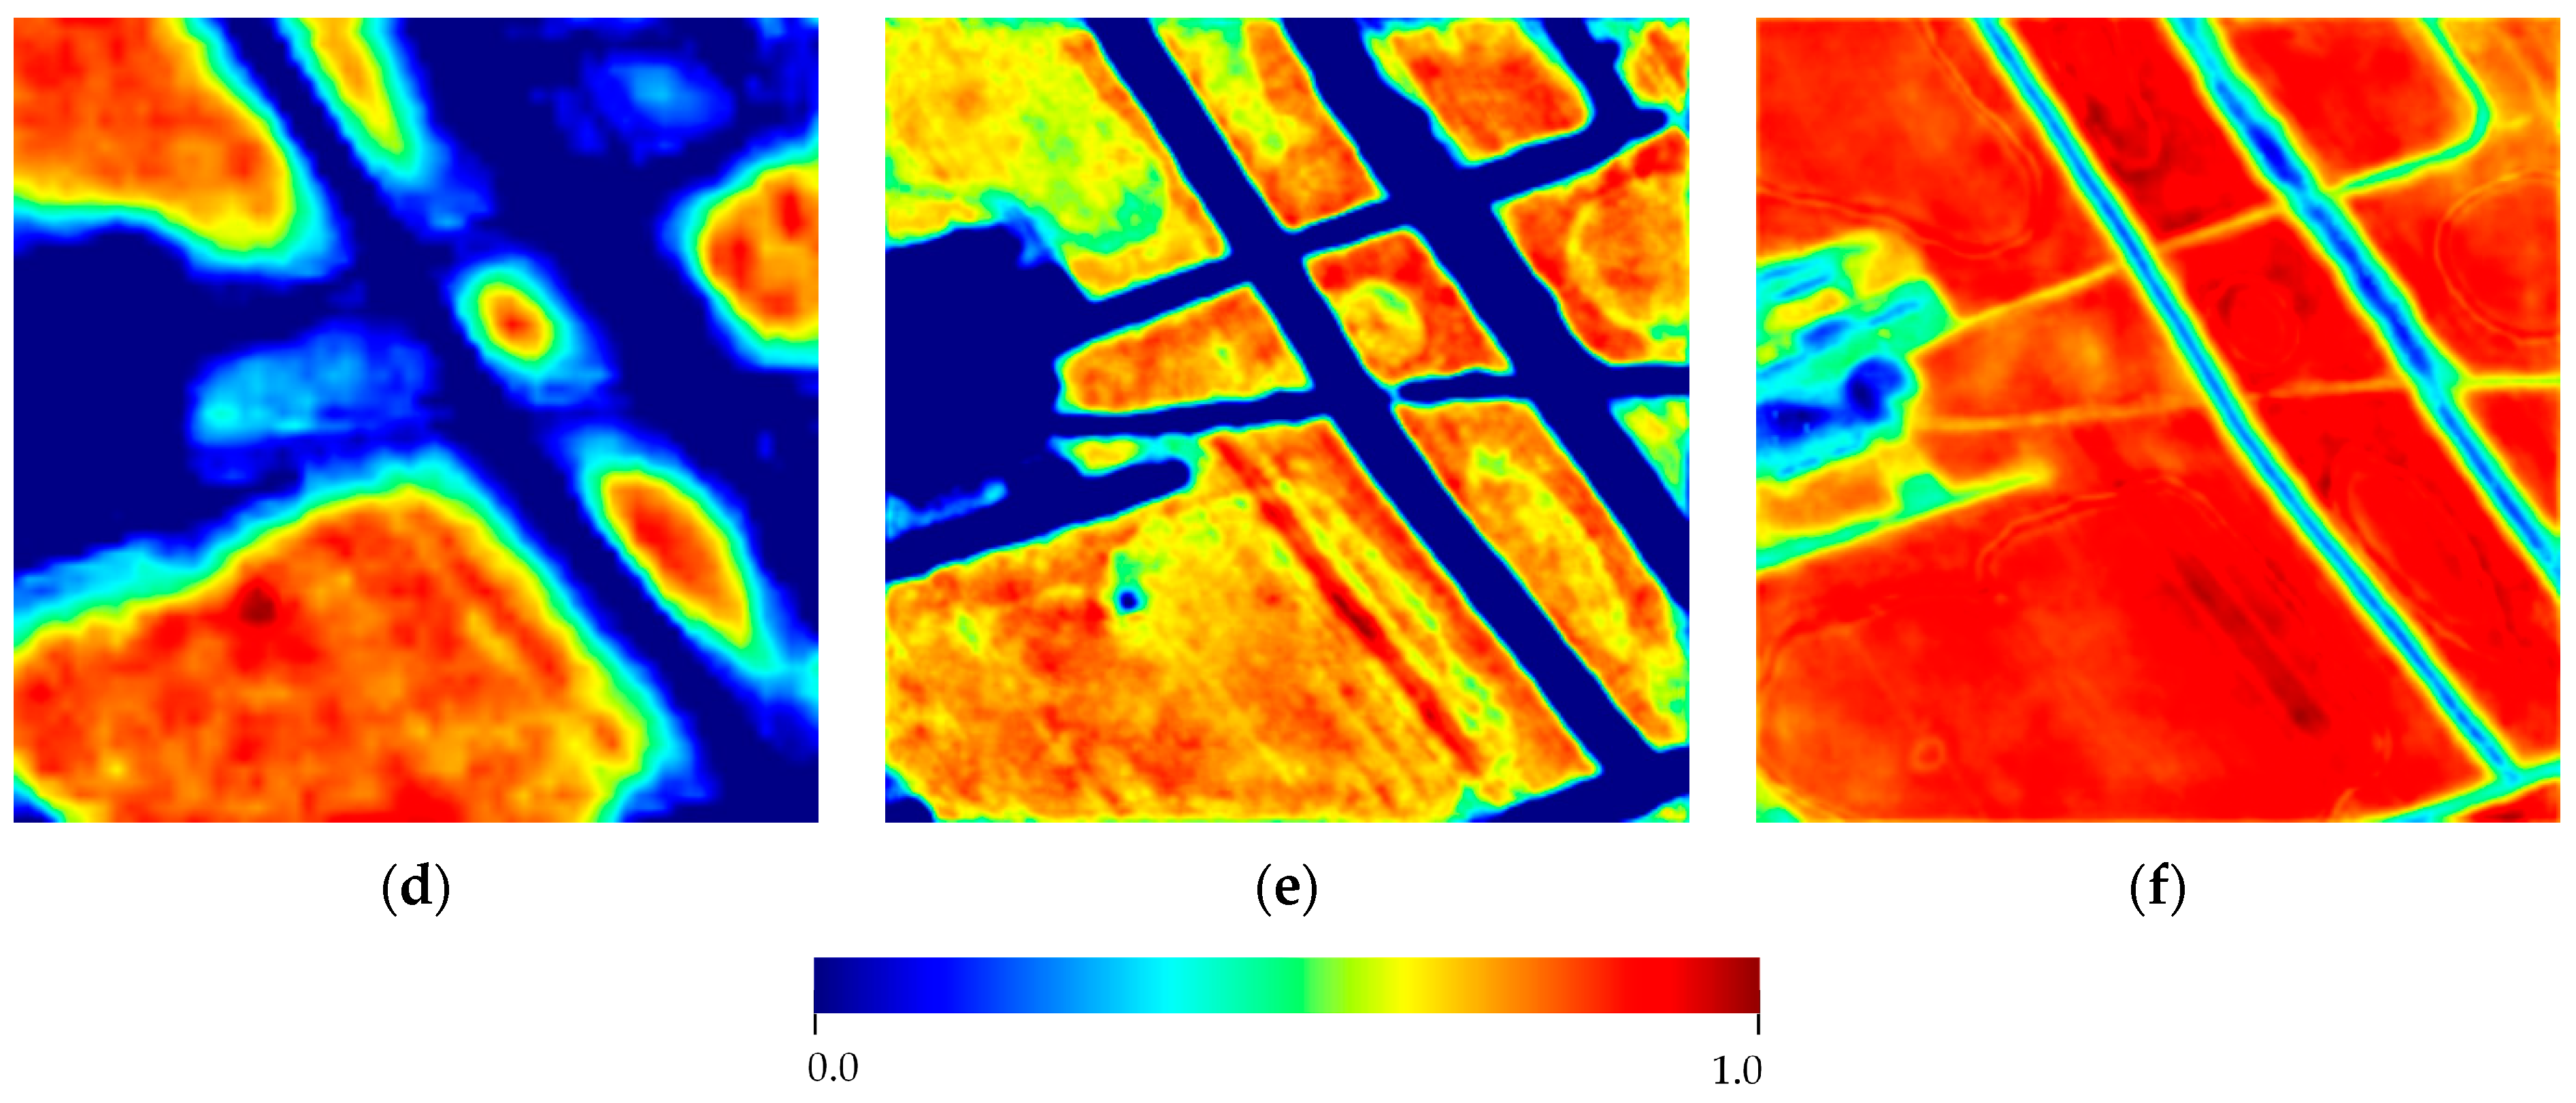
Figure 14 shows the visual description of the feature map extraction process of the cropland image to be extracted by the HRNet-CFR model. Figure 14a is a true-color image containing cropland objects in the middle of June, and Figure 14b is a 720-dimensional feature map obtained through the backbone network from Stage4. Figure 14c is a 512-dimensional feature map enhanced by the joint context information CFR. Figure 14f is the probability heat map of the cropland category. Since the CFR module pays more attention to the features of the context, the features of the pixel neighborhood were considered. Figure 14d,e compare the feature maps obtained before and after adding the CFR module, which are easier to capture linear features, such as the edges of roads. Our network uses different scales to extract features, can focus on local features at different resolutions, and can well-separate the boundaries of different types of objects. It can be seen that the network is highly sensitive to the spectrum and texture features of cropland parcels, and can be well-distinguished from the surrounding forest land.

5.2. Comparison with Other Methods

In order to compare the performance of different algorithms, the popular Deeplabv3+ and UPerNet were compared with the HRNet-CFR method based on the public GID dataset. Deeplabv3+ adopts the “encoding-decoding” mode. The main body of its encoding is DCNN with hole convolution. This experiment uses ResNet101, and then the spatial pyramid pooling module with hole convolution, mainly to introduce multi-scale information to improve the ability of small-target semantic segmentation. Compared with DeepLabv3, DeepLabv3+ introduces a decoding module, which further merges the low-level features with the high-level features to improve the accuracy of the semantic segmentation boundary.
UPerNet is a model based on the feature pyramid network and pyramid pooling module. It trains the strategy to learn and label the complex content of the scene and identify as many visual concepts as possible from it. In some studies [58] on the segmentation of urban scenes in higher-resolution aerial remote sensing images, it has shown a good segmentation effect.
Through the comparison, it was found that the overall accuracy of our approach can reach 92.03%, which is 3.39% higher than Deeplabv3+ and 5.12% higher than UperNet. The visualization results extracted by the two methods are shown in Figure 15.
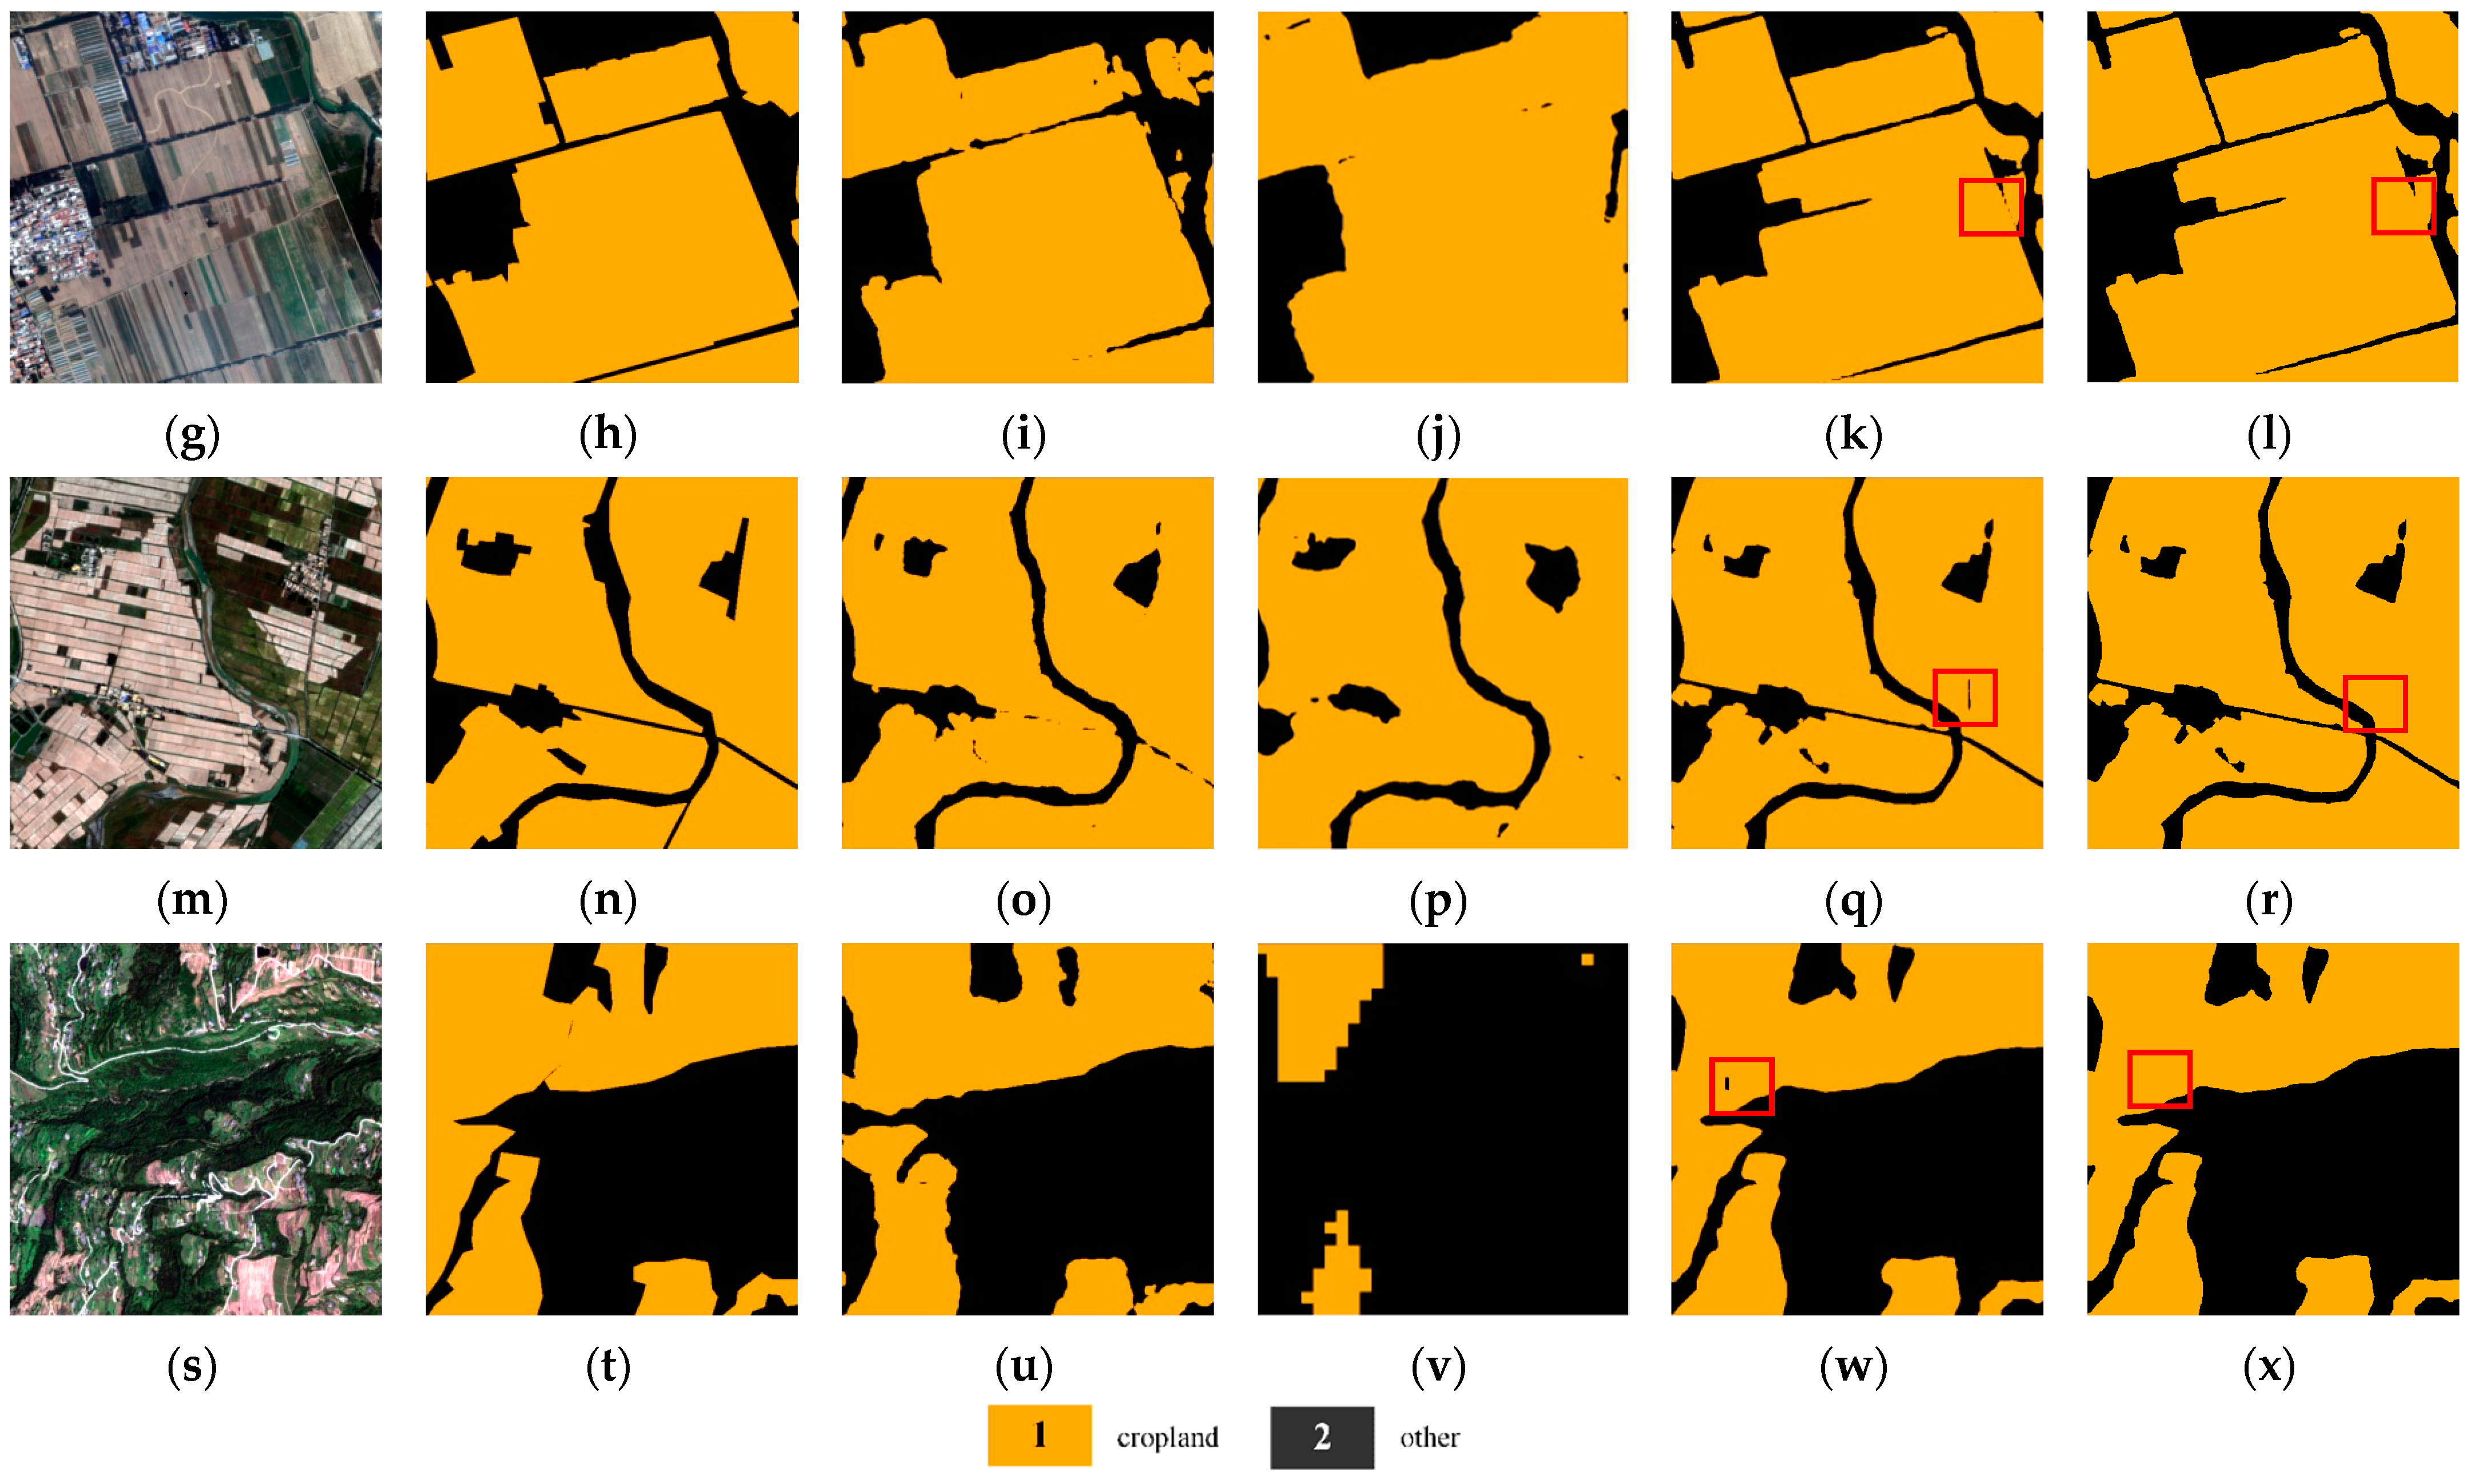
Figure 15 shows the comparison of the visual extraction results of Deeplabv3+, UPerNet, and the HRNet-CFR under different scenarios in the GID dataset. Among them, the first column of Figure 15 selects paddy fields, dry fields under different growth conditions, arable land with mulching film, and terraced fields, respectively.
Figure 15a selects paddy field areas with large heterogeneity. It can be seen from the visualization result in Figure 15e that our model was more sensitive to roads and can divide the cropland completely. The cropland that is not labeled in the ground truth (Figure 15b) could also be better identified. Figure 15c shows the result of Deeplabv3+ cropland extraction. It was observed that the boundary had obvious sawtooth traces, and the extracted boundary of Figure 15e was smoother.
Figure 15g,m show the texture and shape of cultivated land in different seasons, and it can be seen that these methods can segment well. In detail, our method segmented the plot more completely in Figure 15k.
Regarding regional comparisons, Figure 15u,w illustrate the extraction result that HRNet-CFR can better put forward terrace and distinguish it from the surrounding forest land in Southwest China. Compared with other methods, the UPerNet has poor network generalization and missing segmentation for the southern terrace, which is quite different from the northern cropland. As shown at the red boxes marked in the last two columns of Figure 15, it is noted that some sheds and trees contained in the cropland will have holes, which can be filled by our method to make the cropland more homogeneous inside.
Table 4 presents the performance comparison of different methods based on the GID dataset, in which HRNet-CFR+ is a method to increase morphological post-processing. Compared with no post-processing, the overall accuracy was increased by 1.81%. The overall accuracy of our approach can reach 92.03%, which is 3.39% higher than Deeplabv3+ and 5.12% higher than UperNet.
In Section 4 and Section 5, the Jilin-1 high-resolution remote sensing dataset and the public GID dataset with multiple time phases and multiple regions were selected for testing. The extraction results of cropland in the growing season were better than those in the non-growing season. Regions with large geographic differences need to re-add sample training, and the model transformation ability was not strong. The HRNet-CFR method had a certain improvement in the extraction accuracy, and the overall accuracy was improved by about 1.2%. Compared with the Deeplabv3+ and UPerNet algorithms, it was improved by 3.39–5.12%, and the overall accuracy can reach 92.03%. From the qualitative and quantitative evaluation, it shows the superiority of our method in high-resolution image cropland extraction.

5.3. Potential and Limitations for Cropland Extraction

From the evaluation results of the two datasets (Jilin-1 and GID), the HRNet-CFR framework provides a good direction to extract cropland, and there is still certain room for accuracy improvement. As mentioned in the Introduction Section, there are currently three main issues affecting the accuracy of automatic extraction of cropland from high-resolution remote sensing images, namely seasonal, heterogeneity, and regional.
To reduce the impact of seasonality, we selected remote sensing images of the growing season of crops. In addition to this, sample increments were used to simulate samples in various situations. In the analysis results of different seasons in the Jilin-1 dataset, our method still had advantages. Since the rice is mainly transplanted in water in spring, the features on the image are between water and vegetation. Inevitably, the accuracy also brings a certain decline, especially the accuracy of paddy fields, which dropped by 13% compared to dry land. Bazzi’s research [59] shows that the time series Sentinel-1 SAR backscattering coefficient feature analysis is very helpful for extracting paddy rice areas. The input of the HRNet-CFR has the potential of multiple data input. In order to improve the extraction accuracy of paddy field boundaries with strong time correlation, we will consider adding time series radar data as auxiliary features to the network to fuse our network.
The influence of heterogeneity mainly relies on the network to learn more features to improve the distinguishing ability of the classifier. Compared with other networks [60,61], our network considers more texture and context features of crops in the CFR module. In the network structure analysis, it can also be seen that the bare land or the forest land next to the road can be well-distinguished. To further improve the potential and capability of the network to separate different agricultural classes, the input side of our network considers that different data can be fused as additional features, such as vegetation index features as well as soil data, to assist in more refined crop information extraction. Meanwhile, we are planning to extend our method to automatically remove mislabeled samples from the training dataset with weak priors. Regarding the difficulty of learning with unbalanced crop sample categories, we will adjust the weight ratio of each class in the network loss function according to the distribution number of each class in the training set image, meaning complex crop samples and samples with less distribution will have more weight.
Due to the differences of cropland caused by regional geographical distribution, this is the main aspect to limit the large-scale (province or state) application of the model. The HRNet-CFR model was directly used in a county-sized area (Qingyun county, Shandong Province). From the official area statistics, our extraction error was about 7.9%. In order to make the model of this paper extend to a larger area, the selection of a reasonable target area sample dataset is a factor that has to be considered. Therefore, establishing a reasonable sampling method [62], small-sample learning [63], or a more advanced model transfer learning algorithm [64] can be used for a more in-depth exploration. Meanwhile, inspired by the idea that color differences between the source image and the target image will affect the segmentation result [65], we will study the color transfer preprocessing algorithm from the target domain image to the source domain image to improve the influence caused by the regional differences.

6. Conclusions

Effective and accurate extraction of the boundary of cropland is crucial to cultivated land resource monitoring and refined agricultural management. However, due to the diverse spectral features and rich texture features of cropland in very high-resolution remote sensing images, traditional semantic segmentation has limited accuracy and inaccurate boundary localization. For this purpose, we proposed a cropland extraction model based on the deep, full convolution network architecture, called HRNet-CFR, to produce agricultural fields from sub-meter remote sensing images. Considering the geographic relevance of remote sensing features, the method used the surrounding neighborhood of the pixel as the context feature to fuse the features of the backbone network. Experiments have been performed on two very high-resolution remote sensing datasets which have complex scenes and different time phases. The proposed model compares favorably against the popular models in terms of the accuracy of the IoU score and the overall accuracy. The overall accuracy of our approach was 92.3%, which is 3.4% higher than Deeplabv3+ and 5.12% higher than UPerNet. These results demonstrate that the HRNet-CFR could facilitate fast and accurate boundary extraction be that may be incorporated into an object-based cropland analysis service.

Author Contributions

Conceptualization, Z.L. and S.C.; Methodology, Z.L.; Software, Z.L.; Validation, X.M. and S.C.; Formal Analysis, Z.L.; Investigation, Z.L., X.M., R.Z., J.L., L.C., S.C. and P.L.; Resources, Z.L., L.C. and S.C.; Data Curation, Z.L., X.M., R.Z., J.L., L.C. and P.L.; Writing—Original Draft Preparation, Z.L.; Writing—Review and Editing, Z.L.; Visualization, Z.L., X.M., J.L. and S.C.; Supervision, S.C.; Project Administration, S.C.; Funding Acquisition, S.C. All authors have read and agreed to the published version of the manuscript.

Funding

This paper was supported by the National Key Research and Development Program of China, grant number 2020YFA0714103, the Key Scientific and Technological Research and Development Project of Jilin, grant number 20210201138GX, and the Key Scientific and Technological Research and Development Project of Jilin, grant number 20200401094GX.

Data Availability Statement

The Gaofen Image Dataset (GID) is available at https://x-ytong.github.io/project/GID.html (accessed on 18 October 2020).

Acknowledgments

In the experiment section, the Jilin-1 high-resolution remote sensing image data of some cities in Jilin Province were obtained with the help of Changguang Satellite Technology Co., Ltd. The authors also thank the anonymous reviewers and the editors for their insightful comments and helpful suggestions to improve our manuscript.

Conflicts of Interest

The authors declare no conflict of interest.

Abbreviations

The following abbreviations are used in this manuscript:
HRNetHigh-resolution network
CFRContextual feature representation
GID Gaofen Image Dataset
FCN Full convolution network
DCNNDeep convolutional neural network
PSPNet Pyramid scene parsing network
UPerNet Unified perceptual network
ORR Object region representation
IoU Intersection over Union
OA Overall accuracy
SGD Stochastic Gradient Descent
ReLU Rectified linear unit

References

  1. Debats, S.R.; Luo, D.; Estes, L.D.; Fuchs, T.J.; Caylor, K.K. A generalized computer vision approach to mapping crop fields in heterogeneous agricultural landscapes. Remote Sens. Environ. 2016, 179, 210–221. [Google Scholar] [CrossRef] [Green Version]
  2. Belgiu, M.; Csillik, O. Sentinel-2 cropland mapping using pixel-based and object-based time-weighted dynamic time warping analysis. Remote Sens. Environ. 2018, 204, 509–523. [Google Scholar] [CrossRef]
  3. Berman, M.; Triki, A.R.; Blaschko, M.B. The lovász-softmax loss: A tractable surrogate for the optimization of the intersection-over-union measure in neural networks. In Proceedings of the IEEE Conference on Computer Vision and Pattern Recognition (CVPR), Salt Lake City, UT, USA, 18–23 June 2018; pp. 4413–4421. [Google Scholar]
  4. Tong, X.-Y.; Xia, G.-S.; Lu, Q.; Shen, H.; Li, S.; You, S.; Zhang, L. Land-cover classification with high-resolution remote sensing images using transferable deep models. Remote Sens. Environ. 2020, 237, 111322. [Google Scholar] [CrossRef] [Green Version]
  5. Xiao, T.; Liu, Y.; Zhou, B.; Jiang, Y.; Sun, J. Unified perceptual parsing for scene understanding. In Proceedings of the European Conference on Computer Vision (ECCV), Munich, Germany, 8–14 September 2018. [Google Scholar]
  6. Xue, Y.; Zhao, J.; Zhang, M. A Watershed-Segmentation-Based Improved Algorithm for Extracting Cultivated Land Boundaries. Remote Sens. 2021, 13, 939. [Google Scholar] [CrossRef]
  7. Su, T.; Li, H.; Zhang, S.; Li, Y. Image segmentation using mean shift for extracting croplands from high-resolution remote sensing imagery. Remote Sens. Lett. 2015, 6, 952–961. [Google Scholar] [CrossRef]
  8. Rydberg, A.; Borgefors, G. Integrated method for boundary delineation of agricultural fields in multispectral satellite images. IEEE Trans. Geosci. Remote Sens. 2001, 39, 2514–2520. [Google Scholar] [CrossRef]
  9. Graesser, J.; Ramankutty, N. Detection of cropland field parcels from Landsat imagery. Remote Sens. Environ. 2017, 201, 165–180. [Google Scholar] [CrossRef] [Green Version]
  10. Hong, R.; Park, J.; Jang, S.; Shin, H.; Kim, H.; Song, I. Development of a Parcel-Level Land Boundary Extraction Algorithm for Aerial Imagery of Regularly Arranged Agricultural Areas. Remote Sens. 2021, 13, 1167. [Google Scholar] [CrossRef]
  11. Wei, S.; Hong, Q.; Hou, M. Automatic image segmentation based on PCNN with adaptive threshold time constant. Neurocomputing 2011, 74, 1485–1491. [Google Scholar] [CrossRef]
  12. Wu, J. Efficient HIK SVM learning for image classification. IEEE Trans. Image Process. 2012, 21, 4442–4453. [Google Scholar]
  13. Yao, Y.; Si, H.; Wang, D. Object oriented extraction of reserve resources area for cultivated land using RapidEye image data. In Proceedings of the 2014 3rd International Conference on Agro-Geoinformatics (Agro-Geoinformatics), Beijing, China, 11–14 August 2014; pp. 1–4. [Google Scholar]
  14. Xia, J.; Ghamisi, P.; Yokoya, N.; Iwasaki, A. Random forest ensembles and extended multiextinction profiles for hyperspectral image classification. IEEE Trans. Geosci. Remote Sens. 2017, 56, 202–216. [Google Scholar] [CrossRef] [Green Version]
  15. Dou, P.; Chen, Y.; Yue, H. Remote-sensing imagery classification using multiple classification algorithm-based AdaBoost. Int. J. Remote Sens. 2018, 39, 619–639. [Google Scholar] [CrossRef]
  16. Ruiz, P.; Mateos, J.; Camps-Valls, G.; Molina, R.; Katsaggelos, A.K. Bayesian active remote sensing image classification. IEEE Trans. Geosci. Remote Sens. 2013, 52, 2186–2196. [Google Scholar] [CrossRef]
  17. Csillik, O.; Belgiu, M. Cropland mapping from Sentinel-2 time series data using object-based image analysis. In Proceedings of the 20th AGILE International Conference on Geographic Information Science Societal Geo-Innovation Celebrating, Wageningen, The Netherlands, 9-12 May 2017; pp. 9–12. [Google Scholar]
  18. Zhang, Z.; Liu, S.; Zhang, Y.; Chen, W. RS-DARTS: A Convolutional Neural Architecture Search for Remote Sensing Image Scene Classification. Remote Sens. 2022, 14, 141. [Google Scholar] [CrossRef]
  19. Yuan, M.; Zhang, Q.; Li, Y.; Yan, Y.; Zhu, Y. A Suspicious Multi-Object Detection and Recognition Method for Millimeter Wave SAR Security Inspection Images Based on Multi-Path Extraction Network. Remote Sens. 2021, 13, 4978. [Google Scholar] [CrossRef]
  20. Chen, G.; Tan, X.; Guo, B.; Zhu, K.; Liao, P.; Wang, T.; Wang, Q.; Zhang, X. SDFCNv2: An Improved FCN Framework for Remote Sensing Images Semantic Segmentation. Remote Sens. 2021, 13, 4902. [Google Scholar] [CrossRef]
  21. Hua, Y.; Marcos, D.; Mou, L.; Zhu, X.X.; Tuia, D. Semantic segmentation of remote sensing images with sparse annotations. IEEE Geosci. Remote Sens. Lett. 2021, 19, 1–5. [Google Scholar] [CrossRef]
  22. Sharma, A.; Liu, X.; Yang, X.; Shi, D. A patch-based convolutional neural network for remote sensing image classification. Neural Netw. 2017, 95, 19–28. [Google Scholar] [CrossRef]
  23. Cao, X.; Zhou, F.; Xu, L.; Meng, D.; Xu, Z.; Paisley, J. Hyperspectral image classification with Markov random fields and a convolutional neural network. IEEE Trans. Image Process. 2018, 27, 2354–2367. [Google Scholar] [CrossRef] [Green Version]
  24. Jeon, M.; Jeong, Y.-S. Compact and Accurate Scene Text Detector. Appl. Sci. 2020, 10, 2096. [Google Scholar] [CrossRef] [Green Version]
  25. Vu, T.; Van Nguyen, C.; Pham, T.X.; Luu, T.M.; Yoo, C.D. Fast and efficient image quality enhancement via desubpixel convolutional neural networks. In Proceedings of the European Conference on Computer Vision (ECCV), Munich, Germany, 8–14 September 2018. [Google Scholar]
  26. Long, J.; Shelhamer, E.; Darrell, T. Fully convolutional networks for semantic segmentation. In Proceedings of the IEEE Conference on Computer Vision and Pattern Recognition (CVPR), Boston, MA, USA, 7–12 June 2015; pp. 3431–3440. [Google Scholar]
  27. Ronneberger, O.; Fischer, P.; Brox, T. U-net: Convolutional networks for biomedical image segmentation. In Proceedings of the International Conference on Medical Image Computing and Computer-Assisted Intervention, Munich, Germany, 5–9 October 2015; pp. 234–241. [Google Scholar]
  28. Alom, M.Z.; Yakopcic, C.; Hasan, M.; Taha, T.M.; Asari, V.K. Recurrent residual U-Net for medical image segmentation. J. Med. Imaging 2019, 6, 014006. [Google Scholar] [CrossRef] [PubMed]
  29. Zhao, H.; Shi, J.; Qi, X.; Wang, X.; Jia, J. Pyramid scene parsing network. In Proceedings of the IEEE Conference on Computer Vision and Pattern Recognition (CVPR), Honolulu, HI, USA, 21–26 July 2017; pp. 2881–2890. [Google Scholar]
  30. Yan, L.; Liu, D.; Xiang, Q.; Luo, Y.; Wang, T.; Wu, D.; Chen, H.; Zhang, Y.; Li, Q. PSP Net-based Automatic Segmentation Network Model for Prostate Magnetic Resonance Imaging. Comput. Methods Programs Biomed. 2021, 207, 106211. [Google Scholar] [CrossRef] [PubMed]
  31. Chen, L.-C.; Zhu, Y.; Papandreou, G.; Schroff, F.; Adam, H. Encoder-decoder with atrous separable convolution for semantic image segmentation. In Proceedings of the European Conference on Computer Vision (ECCV), Munich, Germany, 8–14 September 2018; pp. 801–818. [Google Scholar]
  32. Wang, C.; Du, P.; Wu, H.; Li, J.; Zhao, C.; Zhu, H. A cucumber leaf disease severity classification method based on the fusion of DeepLabV3+ and U-Net. Comput. Electron. Agric. 2021, 189, 106373. [Google Scholar] [CrossRef]
  33. Lu, J.; Jia, H.; Li, T.; Li, Z.; Ma, J.; Zhu, R. An Instance Segmentation-Based Framework for a Large-Sized High-Resolution Remote Sensing Image Registration. Remote Sens. 2021, 13, 1657. [Google Scholar] [CrossRef]
  34. Zhang, X.; Cheng, B.; Chen, J.; Liang, C. High-Resolution Boundary Refined Convolutional Neural Network for Automatic Agricultural Greenhouses Extraction from GaoFen-2 Satellite Imageries. Remote Sens. 2021, 13, 4237. [Google Scholar] [CrossRef]
  35. Zhou, N.; Yang, P.; Wei, C.; Shen, Z.; Yu, J.; Ma, X.; Luo, J. Accurate extraction method for cropland in mountainous areas based on field parcel. Trans. Chin. Agri. Eng. 2021, 36, 260–266. [Google Scholar]
  36. Cao, K.; Zhang, X. An improved res-unet model for tree species classification using airborne high-resolution images. Remote Sens. 2020, 12, 1128. [Google Scholar] [CrossRef] [Green Version]
  37. Shang, R.; Zhang, J.; Jiao, L.; Li, Y.; Marturi, N.; Stolkin, R. Multi-scale adaptive feature fusion network for semantic segmentation in remote sensing images. Remote Sens. 2020, 12, 872. [Google Scholar] [CrossRef] [Green Version]
  38. Wang, Y.; Chen, C.; Ding, M.; Li, J. Real-time dense semantic labeling with dual-Path framework for high-resolution remote sensing image. Remote Sens. 2019, 11, 3020. [Google Scholar] [CrossRef] [Green Version]
  39. Wang, S.; Chen, W.; Xie, S.M.; Azzari, G.; Lobell, D.B. Weakly supervised deep learning for segmentation of remote sensing imagery. Remote Sens. 2020, 12, 207. [Google Scholar] [CrossRef] [Green Version]
  40. Li, S.; Peng, L.; Hu, Y.; Chi, T. FD-RCF-based boundary delineation of agricultural fields in high resolution remote sensing images. J. U. Chin. Acad. Sci. 2020, 37, 483–489. [Google Scholar]
  41. Xia, L.; Luo, J.; Sun, Y.; Yang, H. Deep extraction of cropland parcels from very high-resolution remotely sensed imagery. In Proceedings of the 2018 7th International Conference on Agro-Geoinformatics (Agro-Geoinformatics), Hangzhou, China, 6–9 August 2018; pp. 1–5. [Google Scholar]
  42. Bao, P.; Zhang, L.; Wu, X. Canny edge detection enhancement by scale multiplication. IEEE Trans. Pattern Anal. Mach. Intell. 2005, 27, 1485–1490. [Google Scholar] [CrossRef] [PubMed] [Green Version]
  43. Masoud, K.M.; Persello, C.; Tolpekin, V.A. Delineation of agricultural field boundaries from Sentinel-2 images using a novel super-resolution contour detector based on fully convolutional networks. Remote Sens. 2019, 12, 59. [Google Scholar] [CrossRef] [Green Version]
  44. Zhang, D.; Pan, Y.; Zhang, J.; Hu, T.; Zhao, J.; Li, N.; Chen, Q. A generalized approach based on convolutional neural networks for large area cropland mapping at very high resolution. Remote Sens. Environ. 2020, 247, 111912. [Google Scholar] [CrossRef]
  45. Jung, A.B. Imgaug. Available online: https://imgaug.readthedocs.io/en/latest/index.html (accessed on 30 October 2018).
  46. Sun, K.; Xiao, B.; Liu, D.; Wang, J. Deep high-resolution representation learning for human pose estimation. In Proceedings of the IEEE Conference on Computer Vision and Pattern Recognition (CVPR), Long Beach, CA, USA, 15–20 June 2019; pp. 5693–5703. [Google Scholar]
  47. Hirayama, H.; Sharma, R.C.; Tomita, M.; Hara, K. Evaluating multiple classifier system for the reduction of salt-and-pepper noise in the classification of very-high-resolution satellite images. Int. J. Remote Sens. 2019, 40, 2542–2557. [Google Scholar] [CrossRef]
  48. Hossain, M.D.; Chen, D. Segmentation for Object-Based Image Analysis (OBIA): A review of algorithms and challenges from remote sensing perspective. ISPRS J. Photogramm. Remote Sens. 2019, 150, 115–134. [Google Scholar] [CrossRef]
  49. He, Z.; He, D.; Mei, X.; Hu, S. Wetland classification based on a new efficient generative adversarial network and Jilin-1 satellite image. Remote Sens. 2019, 11, 2455. [Google Scholar] [CrossRef] [Green Version]
  50. Zhu, R.; Ma, J.; Li, Z.; Meng, X.; Wang, D.; An, Y.; Zhong, X.; Gao, F.; Meng, X. Domestic multispectral image classification based on multilayer perception convolution neural network. Acta. Opt. Sin. 2020, 40, 1528003. [Google Scholar]
  51. Li, Z.; Zhu, R.; Ma, J.; Meng, X.; Wang, D.; Liu, S. Airport detection method combined with continuous learning of residual-based network on remote sensing image. Acta. Opt. Sin. 2020, 40, 1628005. [Google Scholar]
  52. Dang, B.; Li, Y. MSResNet: Multiscale Residual Network via Self-Supervised Learning for Water-Body Detection in Remote Sensing Imagery. Remote Sens. 2021, 13, 3122. [Google Scholar] [CrossRef]
  53. He, C.; Li, S.; Xiong, D.; Fang, P.; Liao, M. Remote sensing image semantic segmentation based on edge information guidance. Remote Sens. 2020, 12, 1501. [Google Scholar] [CrossRef]
  54. Li, J.; Xiu, J.; Yang, Z.; Liu, C. Dual Path Attention Net for Remote Sensing Semantic Image Segmentation. ISPRS Int. J. Geo-Inf. 2020, 9, 571. [Google Scholar] [CrossRef]
  55. Cordts, M.; Omran, M.; Ramos, S.; Rehfeld, T.; Enzweiler, M.; Benenson, R.; Franke, U.; Roth, S.; Schiele, B. The cityscapes dataset for semantic urban scene understanding. In Proceedings of the IEEE Conference on Computer Vision and Pattern Recognition (CVPR), Las Vegas, NV, USA, 26 June–1 July 2016; pp. 3213–3223. [Google Scholar]
  56. Zhang, Y.; Yang, J.; Wang, D.; Wang, J.; Yu, L.; Yan, F.; Chang, L.; Zhang, S. An Integrated CNN Model for Reconstructing and Predicting Land Use/Cover Change: A Case Study of the Baicheng Area, Northeast China. Remote Sens. 2021, 13, 4846. [Google Scholar] [CrossRef]
  57. Discussion on the “non-grain” problem of cultivated land in Qingyun County Natural Resources Bureau. Available online: http://www.qingyun.gov.cn/n31116548/n31119226/n31120576/c65422460/content.html (accessed on 18 October 2021).
  58. Li, X.; He, H.; Li, X.; Li, D.; Cheng, G.; Shi, J.; Weng, L.; Tong, Y.; Lin, Z. PointFlow: Flowing Semantics Through Points for Aerial Image Segmentation. In Proceedings of the IEEE Conference on Computer Vision and Pattern Recognition (CVPR), Place Virtually, 19–25 June 2021; pp. 4217–4226. [Google Scholar]
  59. Bazzi, H.; Baghdadi, N.; El Hajj, M.; Zribi, M.; Minh, D.H.T.; Ndikumana, E.; Courault, D.; Belhouchette, H. Mapping Paddy Rice Using Sentinel-1 SAR Time Series in Camargue, France. Remote Sens. 2019, 11, 887. [Google Scholar] [CrossRef] [Green Version]
  60. Li, N.; Huo, H.; Fang, T. A novel texture-preceded segmentation algorithm for high-resolution imagery. IEEE Trans. Geosci. Remote Sens. 2010, 48, 2818–2828. [Google Scholar]
  61. Li, J.; Shen, Y.; Yang, C. An Adversarial Generative Network for Crop Classification from Remote Sensing Timeseries Images. Remote Sens. 2021, 13, 65. [Google Scholar] [CrossRef]
  62. Olofsson, P.; Foody, G.M.; Herold, M.; Stehman, S.V.; Woodcock, C.E.; Wulder, M.A. Good practices for estimating area and assessing accuracy of land change. Remote Sens. Environ. 2014, 148, 42–57. [Google Scholar] [CrossRef]
  63. Wang, H.; Zhang, X.; Hu, Y.; Yang, Y.; Cao, X.; Zhen, X. Few-shot semantic segmentation with democratic attention networks. In Proceedings of the European Conference on Computer Vision (ECCV), online, 23–28 August 2020. [Google Scholar]
  64. Naushad, R.; Kaur, T.; Ghaderpour, E. Deep Transfer Learning for Land Use and Land Cover Classification: A Comparative Study. Sensors 2021, 21, 8083. [Google Scholar] [CrossRef]
  65. Zhu, J.-Y.; Park, T.; Isola, P.; Efros, A.A. Unpaired image-to-image translation using cycle-consistent adversarial networks. In Proceedings of the IEEE International Conference on Computer Vision (ICCV), Venice, Italy, 22–29 October 2017; pp. 2223–2232. [Google Scholar]
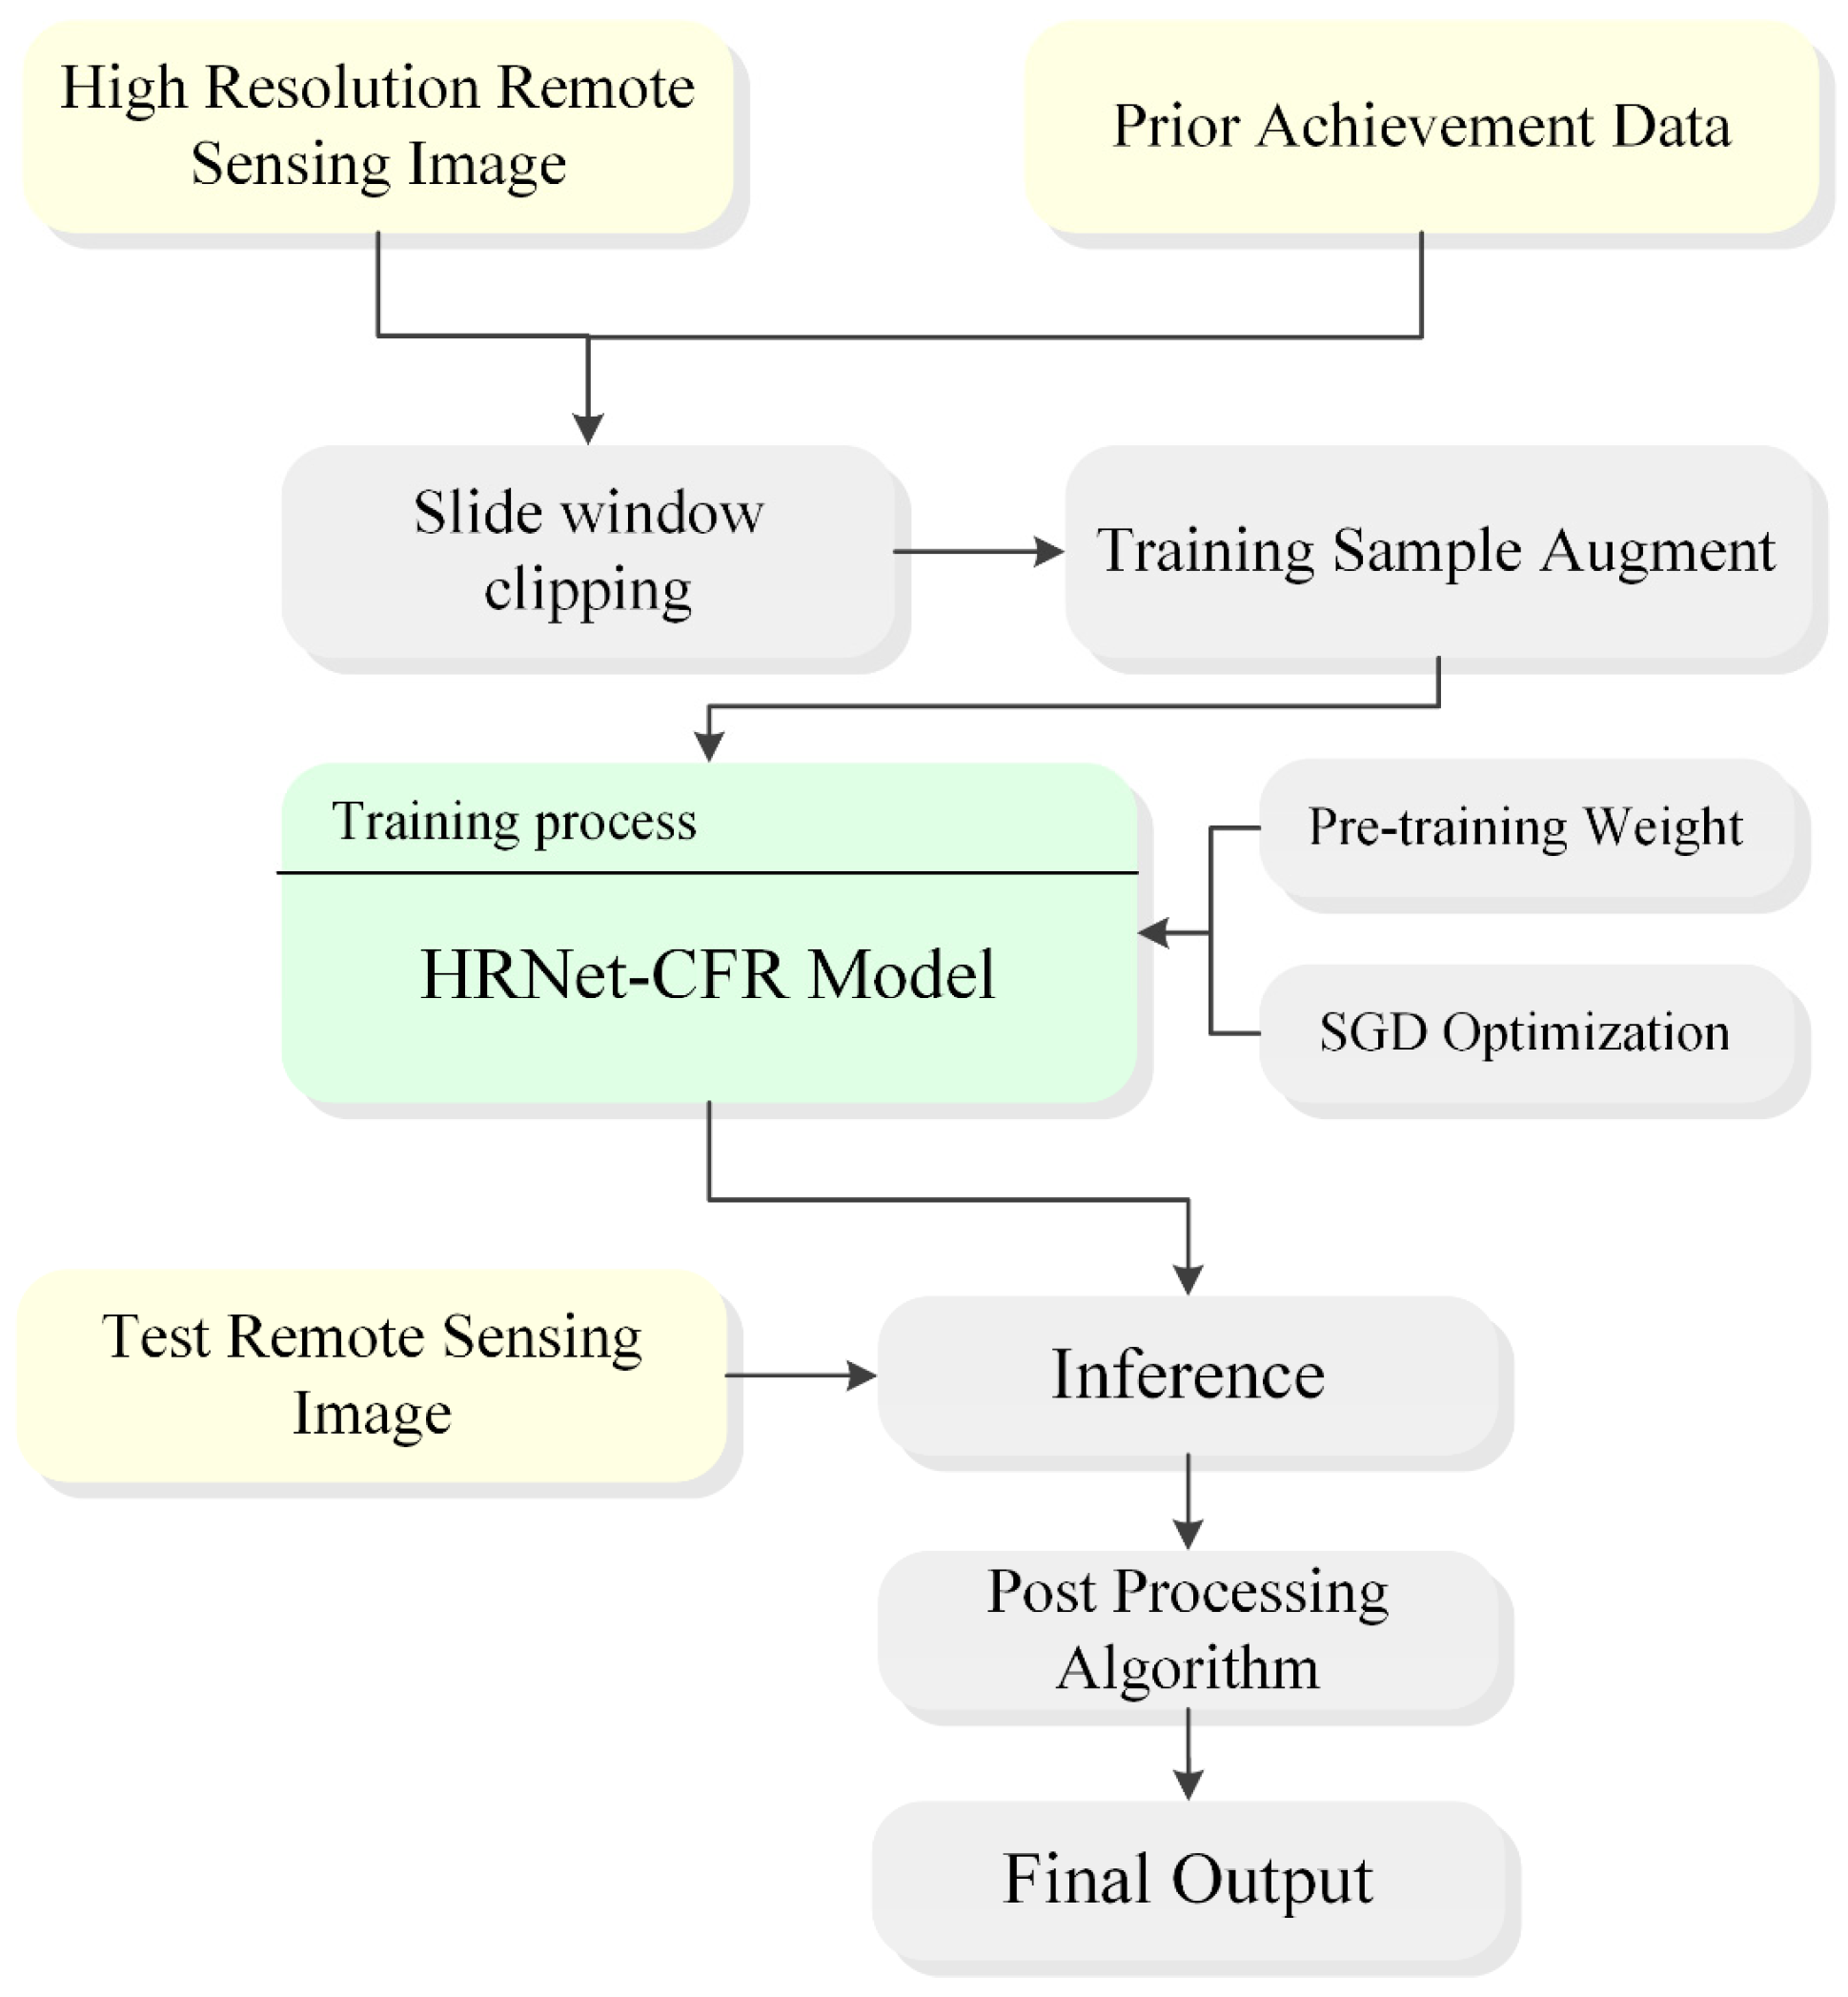
Figure 1. Methodology of cropland extraction with HRNet-CFR.
Remotesensing 14 02157 g001
Figure 2. Image increment method for the training dataset.
Remotesensing 14 02157 g002
Figure 3. Sample increment result. (a) Original data, (b) fold up, (c) fold to the right, (d) zoom in 125%, (e) rotate clockwise by 45°, (f) enhance color contrast (gamma = 3.0), (g) reduce color contrast, and (h) Gaussian blur (Gaussian kernel = 0.5).
Remotesensing 14 02157 g003
Figure 4. The network structure diagram of HRNet-CFR.
Remotesensing 14 02157 g004
Figure 5. The structure of the CFR module.
Remotesensing 14 02157 g005
Figure 6. Two connection methods of the connected domain: (a) 8-connected mode and (b) 4-connected mode. The number “0” represents the central pixel, the other numbers are its adjacent pixels, and the arrow represents its azimuth relationship.
Remotesensing 14 02157 g006
Figure 7. Jilin-1 high-resolution remote sensing cropland dataset: (ad) and (il) are true-color remote sensing images, and (eh) and (mp) are their corresponding labels.
Remotesensing 14 02157 g007aRemotesensing 14 02157 g007b
Figure 8. Cropland dataset based on the GID dataset: (ad) and (il) are true-color remote sensing images, and (eh) and (mp) are their corresponding labels.
Remotesensing 14 02157 g008aRemotesensing 14 02157 g008b
Figure 9. The training diagram of the cropland extraction network in Changchun city in the spring Jilin-1 data: (a) the decreasing curve of training loss, (b) the learning rate curve, and (c) the validation set accuracy curve.
Remotesensing 14 02157 g009
Figure 10. The training diagram of the cropland extraction network in GID data: (a) the decreasing curve of training loss, (b) the learning rate curve, and (c) the validation set accuracy curve.
Remotesensing 14 02157 g010
Figure 11. Visualization results of multi-region and multi-temporal cropland extraction in Jilin province: (a) true-color image of Songyuan research area in August, (d) true-color image of Baicheng research area in July, (g) true-color image of Sipin research area in May, (b,e,h) ground truth of cropland, and (c,f,i) semantic segmentation results of our method.
Remotesensing 14 02157 g011aRemotesensing 14 02157 g011b
Figure 12. The strategy of smooth overlap of moving sliding windows.
Remotesensing 14 02157 g012
Figure 13. Large-area cropland extraction result in Qingyun County, Dezhou City, Shandong Province. (a) The cropland result extracted from the mosaic image of Qingyun County, (b) the true-color image within the blue box in (a), (c) the cropland result of (b), and (d) the vector result of the cropland boundary.
Remotesensing 14 02157 g013
Figure 14. Visualization of the feature map of the target of interest in the image by the HRNet-CFR model. (a) Original true-color image, (b) visualization of the feature in Stage4, (c) visualization of the final fusion feature through CFR, (d) the visualization of one rich channel before CFR module processing, (e) the visualization of one rich channel of the CFR module, and (f) the probability heat map of cropland. Note: the features are normalized between 0–1. The redder the color, the more prominent the characteristics of cropland target. The bluer the color, the more prominent the other target features.
Remotesensing 14 02157 g014aRemotesensing 14 02157 g014b
Figure 15. Comparison of different semantic segmentation methods in the GID dataset for cropland extraction in different geographic scenarios. (a,g,m,s) True-color images of different geographic scenes, (b,h,n,t) ground truth labels, (c,i,o,u) semantic segmentation results of Deeplabv3+, (d,j,p,v) semantic segmentation results of UperNet, (e,k,q,w) semantic segmentation results of HRNet-CFR, and (f,l,r,x) the morphological post-processing results of HRNet-CFR (the red boxes marked in the last two columns are to better highlight the difference between before and after morphological post-processing).
Remotesensing 14 02157 g015aRemotesensing 14 02157 g015b
Table 1. Introduction of cropland dataset based on high-resolution remote sensing images for this experiment.
Data NameDateData SourceRegionResolution (m)Original Training ImagesFinal Training ImagesValidation ImagesTest Images
Jilin-12020/03-04Jilin-1KFChangChun0.75149022351341894
2020/06-07Jilin-1KFChangChun0.75149022351341894
2020/06-07Jilin-1KFBaiCheng0.75149022351341894
2020/07-08Jilin-1KFNongAn0.75149022351341894
GIDDifferent timesGF-2More than 60 different cities4.0112616901041676
Table 2. Accuracy evaluation of cropland extraction from multi-region and multi-temporal high-resolution remote sensing images by Jilin-1. Note: the best performance is marked as bold.
RegionMethodDateNumber of BandsIoUOA
Dry LandPaddy FieldOthersMean
ChangChunHRNetMarch–April40.8980.7460.5920.74691.15%
March–April30.8770.7630.6690.77090.14%
June–July40.9400.7700.6590.78994.49%
March–April30.8920.7840.7000.75891.34%
HRNet-CFRJune–July40.9410.8170.6270.79594.58%
BaiChengHRNet-CFRJune–July40.9260.8560.6860.82293.61%
Table 3. The structure table of the HRNet-CFR method.
ModuleConvolutionKernels’ NumberConvolution ParameterInputOutput
Stem NetConv164k: 3 × 3, s: 2, p: 11024 × 1024 × 4512 × 512 × 64
Conv264k: 3 × 3, s: 2, p: 1512 × 512 × 64256 × 256 × 256
Stage1Conv256k: 1 × 1, s: 1256 × 256 × 256256 × 256 × 256
Stage2Conv48k: 3 × 3, s: 1, p: 1256 × 256 × 256256 × 256 × 48
96k: 3 × 3, s: 2, p: 1256 × 256 × 48128 × 128 × 96
Stage3Conv48k: 3 × 3, s: 1, p: 1256 × 256 × 48256 × 256 × 48
96k: 3 × 3, s: 1, p: 1128 × 128 × 96128 × 128 × 96
192k: 3 × 3, s: 2, p: 1128 × 128 × 9664 × 64 × 192
Stage4Conv48k: 3 × 3, s: 1, p: 1256 × 256 × 48256 × 256 × 48
96k: 3 × 3, s: 1, p: 1128 × 128 × 96128 × 128 × 96
192k: 3 × 3, s: 1, p: 164 × 64 × 19264 × 64 × 192
384k: 3 × 3, s: 2, p: 164 × 64 × 19232 × 32 × 384
CFRSoftmax--256 × 256 × 720L × 256 × 256
Conv512k: 1 × 1, s: 1Stage4; L × 512256 × 256 × 512
Note: Where L is the number of categories.
Table 4. The performance of different methods compared in the GID dataset. Note: the records in bold represent the best on the GID dataset.
MethodImage Test SizeIoUOAInference Time/s
CroplandOtherMean
Deeplabv3+512 × 512 × 40.7770.8120.79588.64%1.27
UPerNet0.7530.8060.77986.91%1.12
HRNet-CFR0.8100.8330.82190.22%1.01
HRNet-CFR+0.8240.8520.83892.03%1.15
Publisher’s Note: MDPI stays neutral with regard to jurisdictional claims in published maps and institutional affiliations.