Article

Evaluation of Land Surface Phenology for Autumn Leaf Color Change Based on Citizen Reports across Japan

1
Geographic Information Science Laboratory, Department of Information and Computer Sciences, Graduate School of Science & Engineering, Saitama University, 255 Shimo-Okubo, Sakura Ward, Saitama 338-8570, Japan
2
Earth Surface System Research Center, Research Institute for Global Change, Japan Agency for Marine-Earth Science and Technology (JAMSTEC), 3173-25 Showa-machi, Kanazawa-ku, Yokohama 236-0001, Japan
3
Department of Natural Resources and Environmental Management, University of Hawai‘i at Mānoa, 1910 East-West Road, Honolulu, HI 96822, USA
*
Author to whom correspondence should be addressed.
Remote Sens. 2022, 14(9), 2017; https://doi.org/10.3390/rs14092017
Submission received: 23 March 2022 / Revised: 11 April 2022 / Accepted: 20 April 2022 / Published: 22 April 2022
(This article belongs to the Special Issue Advanced Phenology, and Land Cover and Land Use Change Studies)

Abstract

:
Autumn foliage color is an important phenological characteristic associated with climate and appeals to populations as a cultural ecosystem service (CES). Land surface phenology (LSP) analyzed using time-series remotely sensed imagery can facilitate the monitoring of autumn leaf color change (ALCC); however, the monitoring of autumn foliage by LSP approaches is still challenging because of complex spatio-temporal ALCC patterns and observational uncertainty associated with remote sensing sensors. Here, we evaluated the performance of several LSP analysis approaches in estimation of LSP-based ALCCs against the ground-level autumn foliage information obtained from 758 sightseeing (high CES) sites across Japan. The ground information uniquely collected by citizens represented ALCC stages of greening, early, peak, late, and defoliation collected on a daily basis. The ALCC was estimated using a second derivative approach, in which normalized difference vegetation index (NDVI), kernel normalized difference vegetation index (kNDVI), enhanced vegetation index (EVI), two-band enhanced vegetation index (EVI2), and green red vegetation index (GRVI) were applied based on MODerate resolution Imaging Spectroradiometer (MODIS) MOD09A1 with four (Beck, Elmore, Gu, and Zhang) double logistic smoothing methods in 2020. The results revealed inconsistency in the estimates obtained using different analytical methods; those obtained using EVI with the Beck model estimated the peak stage of the ALCC relatively well, while the estimates obtained using other indices and models had high discrepancies along with uncertainty. Our study provided insights on how the LSP approach can be improved toward mapping the CESs offered by autumn foliage.

Graphical Abstract

1. Introduction

Leaf senescence is a unique autumn phenological event in temperate ecosystems [1,2]. It is a process of decline in leaf function due to leaf aging, observed as leaf color change, ultimately resulting in the leaves dropping [1]. The ecological process is driven by a combination of temperature and photoperiod [3,4] as well as soil moisture factors [5,6,7]; however, a comprehensive understanding of the underlying factors driving the process is challenging, considering it is also influenced by biological and geographic conditions [8,9].
The spatio-temporal characteristics of leaf senescence events have been studied previously. Climate studies have focused on leaf senescence as an indicator of climate change [10]. Some studies have indicated that seasonal leaf senescence tends to be delayed by increasing temperatures [1,2,4,8,11]; however, some studies have indicated that leaf senescence can occur earlier because of increasing spring and summer productivity due to elevated carbon dioxide, temperature, or light levels [12]. Such leaf senescence patterns at the landscape scale are often monitored by satellite sensors. Satellite observation systems are regularly used to observe terrestrial surfaces on Earth and have been utilized for phenology studies [9,13,14]. The study of the spatio-temporal patterns and variations in vegetated land surfaces using remote sensing-based phenological measurements is referred to as land surface phenology (LSP) [13,14,15,16].
LSP has been used to infer the start and end of seasons, the length of the green season, and associated phenophases based on the seasonal trajectory of a vegetation index (VI) time-series, such as normalized vegetation difference index (NDVI) [13,14,17,18]. For the phenophase estimation, applying a global threshold to a VI (i.e., 0.2 of an annual NDVI trajectory) to extract phenophases may be inappropriate for LSP estimation because such thresholds highly depend on geographic and land cover characteristics [19,20]. The application of relative thresholds (i.e., 25% of the difference between the minimum and the maximum of an annual NDVI trajectory) and derivatives of a VI trajectory, which determine the date of the maximum increase and decrease in VI values, has also been proposed. Such extraction methods are applied to modeled VI trajectories to smooth missing observations and noise in the trajectory; for example, by double logistic function, asymmetric Gaussian function, and Savitzky–Golay algorithm [13,14,17,18].
The estimated phenophases of LSP are assessed based on in situ observations and near-surface remote sensing techniques. Previous studies on phenology have introduced near-surface remote sensing techniques that employ digital cameras, which enable the provision of a permanent and continuous visual record of the environment over the years, and in some cases, even decades [21]. Such sensors are currently widely used to capture environmental changes globally [21,22,23]. Using such data, Soudani et al. [24] and Rodriguez-Galiano et al. [25] suggested an overall agreement between ground and satellite measurements in homogeneous and internally consistent vegetation covers (such as pure deciduous forests) in Europe, whereas landscape heterogeneity can be a significant source of errors and uncertainties [26,27]. Regardless of the importance of ground-level data collection at various landscapes, such equipment tends to be installed in homogeneous land cover areas to avoid anthropogenic disturbance, such as at the center of a forest, because most phenological studies aim to understand natural environments without the influence of humans.
Citizen science approaches have been adopted in an attempt to address the limited ground phenological information available. For example, USA National Phenology Network involves volunteers in phenological observation activities and collection of ground-level information [28,29,30]. Taylor et al. [29] reported that citizen science data is applicable in phenology modeling. In Japan, the use of the most popular and reliable phenological observation system by Japan Meteorological Agency has shrunk due to lack of observations, particularly at urban sites, and inadequate funding [31]. Therefore, although the scientific quality of monitoring may not be sufficient, non-professional observation data including citizen science data with respect to autumn foliage has been explored. Recent studies focusing on autumn foliage in Japan have employed data collected from weather websites to acquire ground-level information and have successfully demonstrated ALCC in response to climate [9,32]. Regardless of the potential application of such online data to capture autumn foliage at the regional scale, studies are yet to integrate LSP.
Thus, to investigate the usefulness of the LSP-based autumn leaf color change (LSP-ALCC), this study evaluated the performance of several approaches of estimating LSP-ALCC against ground-level autumn foliage information. We explored popular but different approaches of estimating LSP-ALCC from several vegetation indices and fitting curves using the MODerate resolution Imaging Spectroradiometer (MODIS) MOD09A1 product for 2020. We then assessed the LSP-ALCC using ground-level autumn foliage information collected from a citizen reporting system provided by Weathernews across 758 popular sightseeing spots for autumn foliage in Japan in 2020 as reference.
The significance of this study is to progress the understanding of cultural ecosystem services (CESs) by ALCC. CESs are key ecosystem services (ESs) and indicate the recreation and ecotourism values of the ecosystem. Autumn foliage attracts populations when scenery spots in temperate ecosystems turn colorful and pleasant [32,33]. Autumn foliage has been long recognized as a component of the beautiful Japanese landscape [34] and is a part of aesthetic values of Japanese culture related to haiku, noh theatre, diets, and other aspects of life [32]. ALCC is a popular motivation for many tourists to visit sightseeing spots [32], which highlights the direct linkage with the CESs. Therefore, it is important to understand the CESs provided by ALCC; however, such studies have not yet been carried out due to the difficulty in the estimation of the ALCCs over space. The LSP-based approach was expected to estimate the ALCCs from a local to country scale and contribute to mapping the CESs. To the best of our knowledge, this was the first attempt to evaluate LSP-ALCC using data based on people’s perceptions, directly linking ALCC with CESs. The estimation of autumn foliage from LSP can facilitate the assessment of CESs effectively and continuously; thus, this study evaluated LSP-ALCC estimations by several vegetation indices and models for the development of a CES map in the future.

2. Materials and Methods

2.1. Data

We used the MODIS data product MOD09A1 (collection 6) covering Japan for 2020. The product includes calibrated surface reflectance data for seven spectral bands within the 400 nm to 2500 nm spectral region, at a spatial resolution of approximately 500 m. At every pixel, values are stored from the best possible observation taken every 8 days; thus, 46 observations were obtained.
We acquired ground-level data collected by Weathernews. Weathernews is a company that collects a wide range of weather information from ground-level data (from service member reports and live cameras) and meso-level data (from satellites) to provide as accurate weather information as possible to clients. As one of its services, Weathernews reports the autumn foliage condition at 758 popular destinations across Japan on a daily basis to promote sightseeing (Figure 1). Considering the geographic characteristics of Japan, autumn foliage is typically observed in regions that extend from Hokkaido to Kyushu and is best observed during October–December. The forest type in Japan changes from north to south. The deciduous forests are mainly dominant in the north and middle regions of Japan, while evergreen forests are typically found in the west and south. Deciduous and evergreen forests are often mixed near non-forest areas (mostly urban and agricultural areas), where many popular sightseeing spots are distributed. Such geographic characteristics pose challenges for LSP-ALCC estimation in high-potential CES areas, where people often visit to observe autumn foliage.
The daily Weathernews reports represent autumn leaf color conditions in five categories: none (greening), start of leaf coloring, peak of leaf coloring, fading of leaf coloring, and leaf fall. As expected, the levels vary spatio-temporally (Figure 2). Specifically, they exhibit latitudinal and altitudinal gradients [9]. Notably, the levels represent how people recognize autumn foliage at each site so that they are linked to CESs, although this unique dataset may not accurately represent the autumn foliage condition. It may lack the scientific robustness of observations because it is based on reports of non-scientific experts, and the comprehensive labeling scheme is not disclosed. Therefore, the data may be biased with respect to categorization of leaf color condition into five categories. However, such an observation-rich dataset for the ground-level autumn foliage is a unique reference data source found in high-potential CES areas in Japan and is a subjective modality for autumn foliage. Therefore, we used the dataset as a reference to assess the LSP-ALCC.

2.2. Methods

To test the sensitivity of the index selection for LSP-ALCC, we applied multiple combinations of vegetation index (VI) and fitting curve methods. In detail, we calculated five vegetation indices from the MOD09A1 time-series, namely, NDVI, kernel NDVI (kNDVI), enhanced vegetation index (EVI), two-band enhanced vegetation index (EVI2), and green red vegetation index (GRVI) (Equations (1)–(5)).
N D V I = ρ n i r ρ r e d ρ n i r + ρ r e d
k N D V I = t a n h ρ n i r ρ r e d ρ n i r + ρ r e d 2
E V I = 2.5 × ρ n i r ρ r e d ρ n i r + 6.0 × ρ r e d 7.5 × ρ b l u e + 1.0
E V I 2 = 2.5 × ρ n i r ρ r e d ρ n i r + 2.4 × ρ r e d + 1.0
G R V I = ρ g r e e n ρ r e d ρ g r e e n + ρ r e d
where ρ n i r , ρ r e d , ρ b l u e , and ρ g r e e n are the surface reflectances in the near-infrared, red, blue, and green bands, respectively. These preprocessing steps were implemented using the Google Earth Engine (GEE) platform [35].
The VI time-series were fitted to a double logistic curve to remove the outliers and missing values, similar to in previous studies [36,37,38,39]. We applied four curve fitting methods based on a conventional double logistic curve: Beck [36], Elmore [37], Gu [38], and Zhang [39] to the five VI time-series (Equations (6)–(9)).
Beck:
f t = m n + m x m n × 1 1 + e r s p × t s o s + 1 1 + e r a u × t e o s
Elmore:
f t = m n + m x m 7 × t × 1 1 + e r s p × s o s t 1 1 + e r a u × e o s t
Gu:
f t = y 0 + a 1 1 + e r s p × t s o s c 1 a 2 1 + e r a u × t e o s c 2
Zhang:
f t = m x m n 1 + e r s p × t s o s g r e e n i n g s t a g e m x m n 1 + e r a u × t e o s d o r m a n c y s t a g e
where m n , m x , r s p , r a u , s o s , e o s , m 7 , a 1 , a 2 , c 1 , c 2 , and y 0 are parameters that are fitted based on the data.
Finally, we extracted the LSP-ALCC using a derivative-based method. The method determines the estimated day of year (DOY) using the rate of change in the curvature of the modeled curves. Based on the findings of our preliminary investigations, we opted to use the second derivative [13]. Numerous other LSP studies have used the first derivative, which yields the local minima of the transition (the rate of change in curvature) in the fitted curve, to estimate the end of season (EOS) [39,40]. However, as seen in Figure 3, for example, the local minima of the first derivative tends to indicate an early estimate of the autumn foliage. Thus, the local maxima of the second derivative when the slope (the first derivative) is negative was used to determine the LSP-ALCC. Another popular approach for LSP-ALCC extraction is a threshold-based method; we did not employ this approach because the result is highly sensitive to the threshold value [14,20] and there is no standard for determining the threshold for the LSP-ALCC.
We applied these approaches using the R Phenofit package (version 0.2.7, https://github.com/kongdd/phenofit (accessed on 21 June 2021)). For preprocessing, we applied the weighting scheme according to the value of the state quality assessment (stateQA) layer. The weights were used when applying double logistic curves to the original time series. A weight of 1 was assigned to the data if no cloud, cloud shadow, aerosol, cirrus, and snow were found. A weight of 0.2 was assigned to the data if cloud was found, aerosol quantity was high, or snow was covered. A weight of 0.5 was assigned to all the other data excluding the conditions above. The process above functioned well compared to the quality masking approach (which extracts only the best quality pixel) to avoid a shortage in available data for the analysis.

3. Results

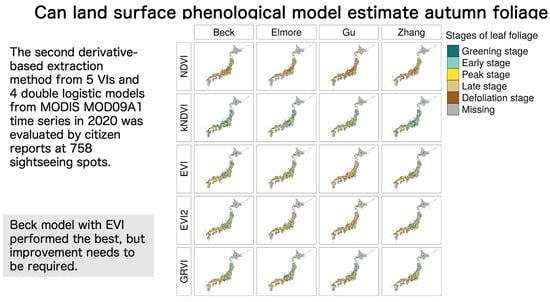
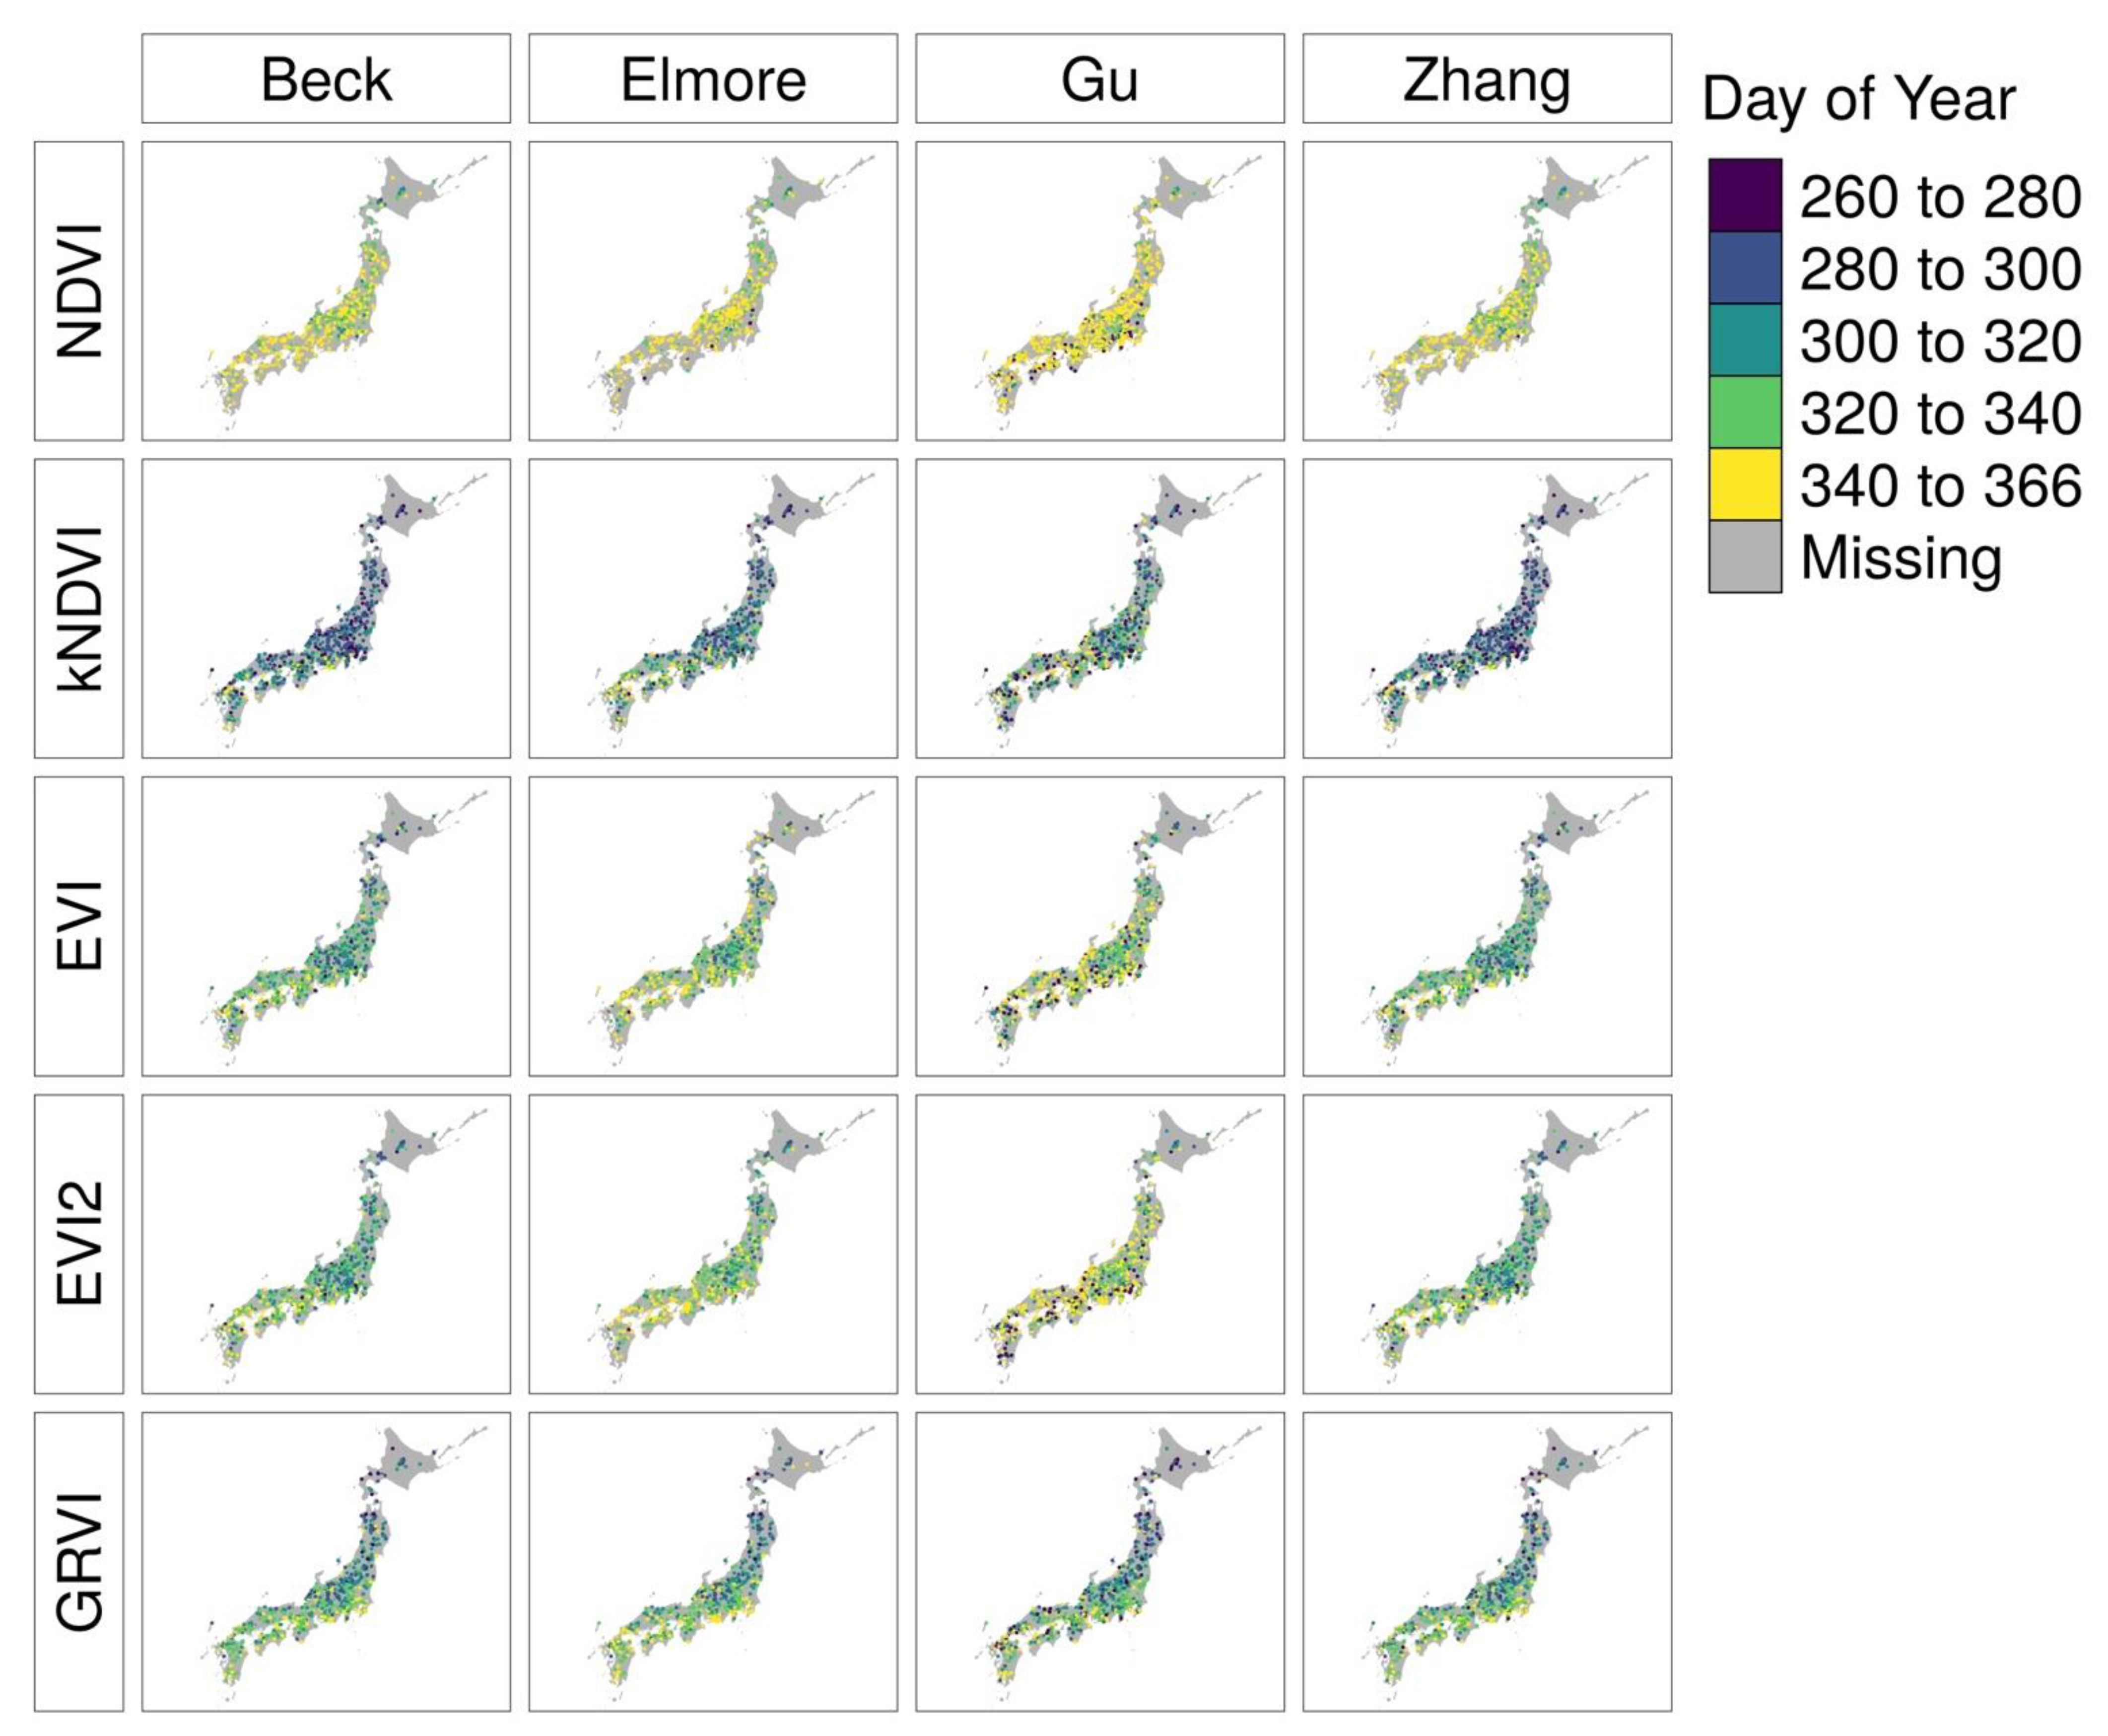
3.1. Estimation of Land Surface Phenology-Based Autumn Leaf Color Changes

The derivative-based LSP-ALCCs from the five VIs with respect to the four models mentioned above are shown in Figure 4. The LSP-ALCCs from NDVI were often saturated around the end of the year (DOY: 340 to 366), while those from kNDVI also showed such saturation around the end of summer in DOY: 260–280. The LSP-ALCCs from EVI and EVI2 represented relatively reasonable spatial distribution patterns, with gradients from north to south. The LSP-ALCCs from GRVI also represented spatial distribution patterns similar to EVI and EVI2, but those in northern Japan where deciduous forests are dominant tended to be earlier than those from EVI and EVI2. Compared to the four models, the Beck and Zhang models show similar trends, portraying a smooth gradient across space, while the Elmore and Gu models showed relatively spatially heterogeneous results. The Elmore and Gu model may be too complex for this case study, as the input MODIS time-series had only 46 observations for 2020.

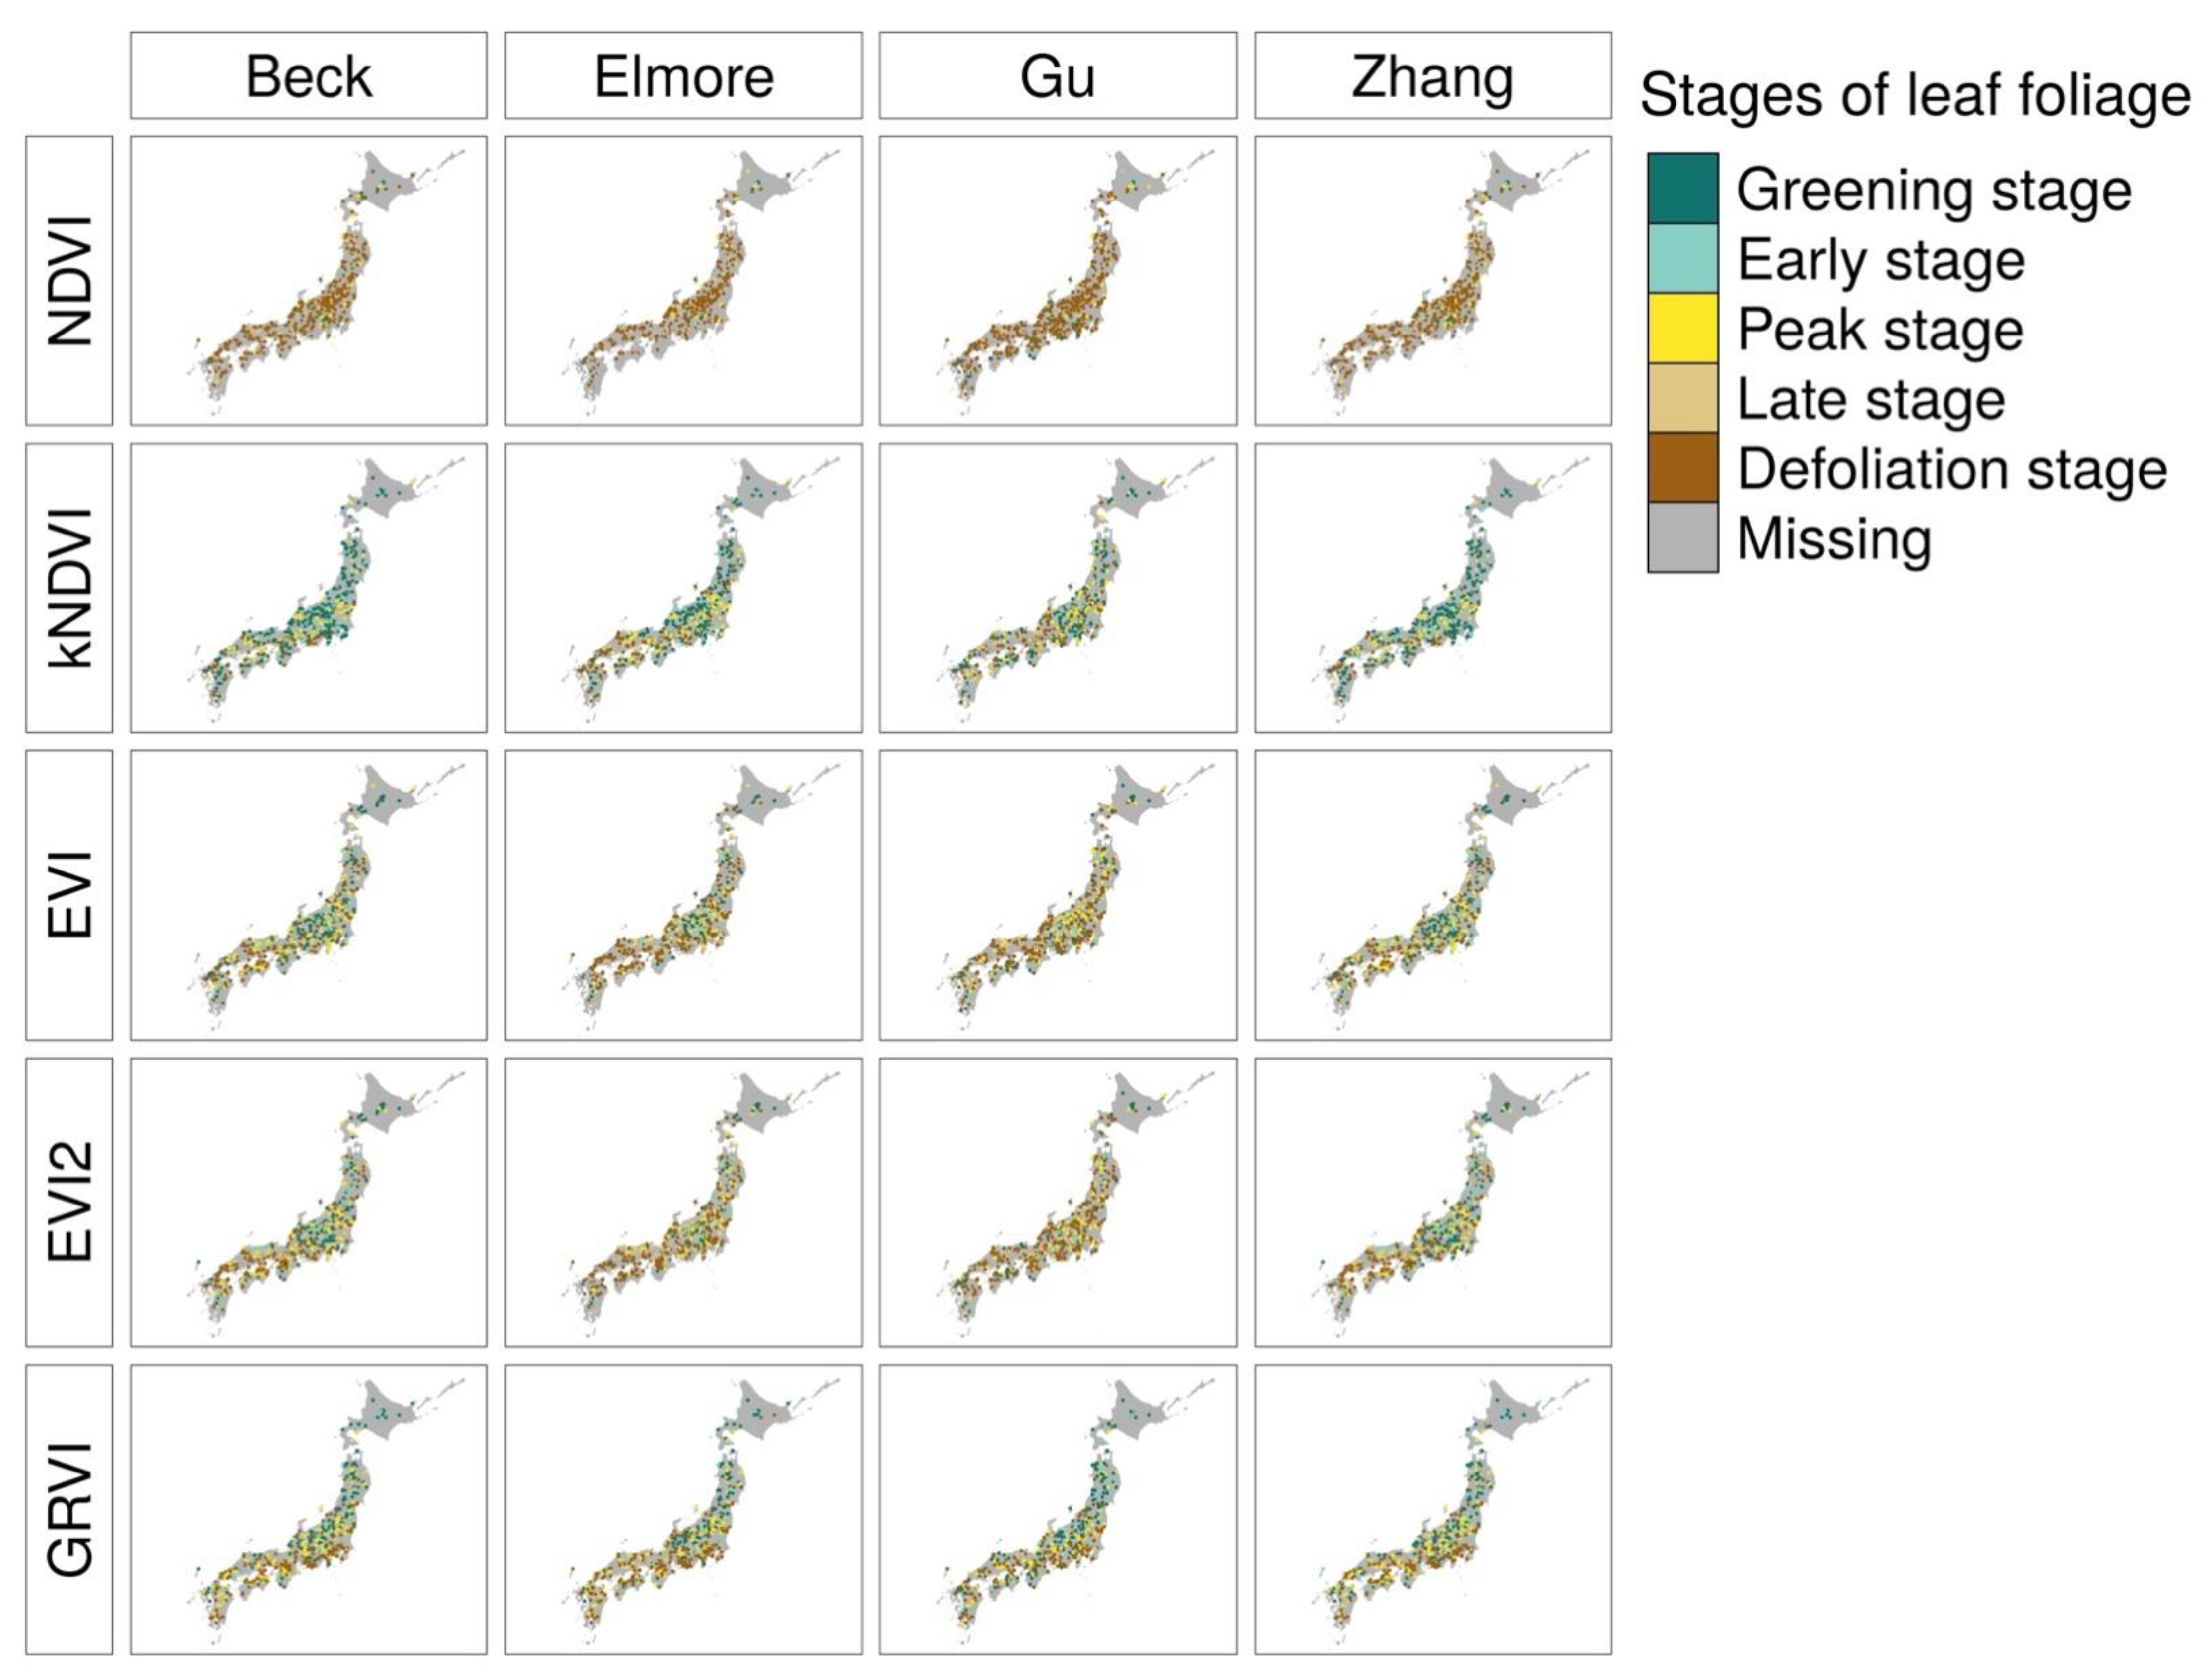
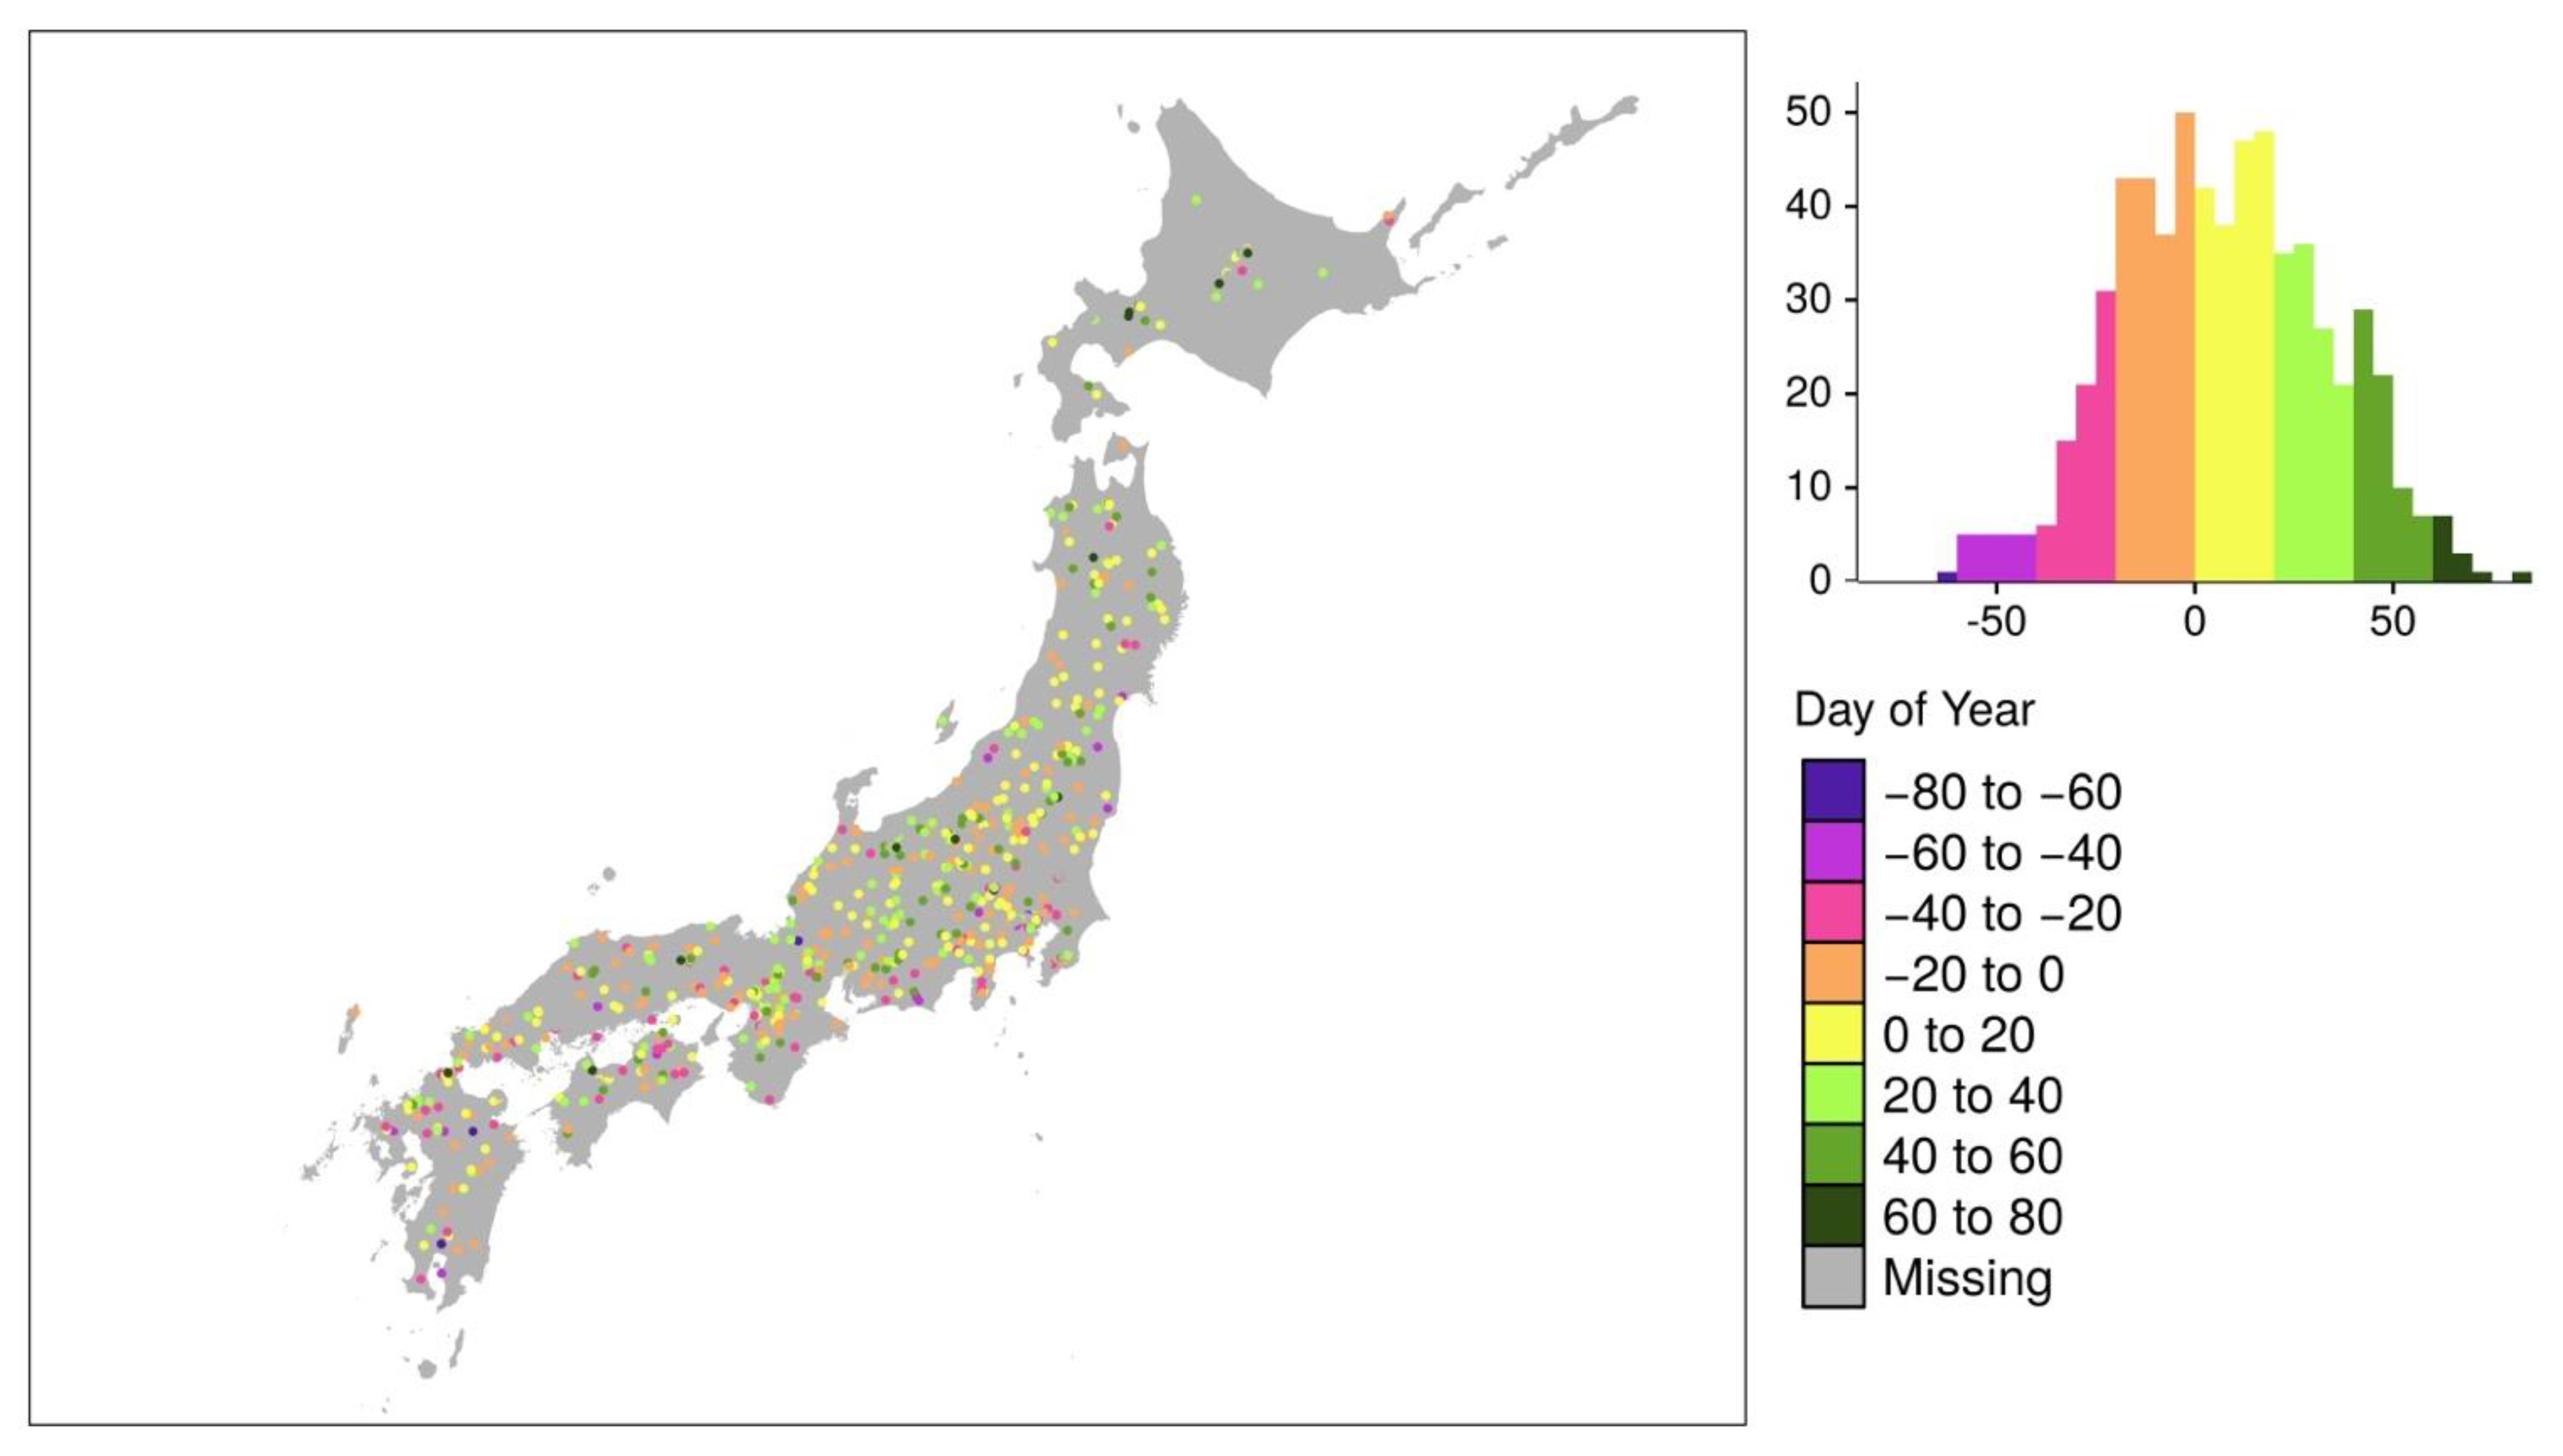
3.2. Comparison of Land Surface Phenology-Based Autumn Leaf Color Changes with Citizen Reports Data

Figure 5 shows a map of the LSP-ALCCs based on the four models with five VIs in five ALCC stages, based on the Weathernews database. Using labels defined by the Weathernews database, five ALCC stages were established: greening stage (the start of the year to the start of leaf coloring), early stage (the start to the peak of leaf coloring), peak stage (the peak to fading of leaf coloring), late stage (the fading of leaf coloring to the leaf fall), and defoliation stage (the leaf fall to the end of year). LSP-ALCC using NDVI in any model tended to be categorized as the defoliation stage in most observations, while those using kNDVI were categorized as the greening stage. LSP-ALCCs using EVI and EVI2 in the Beck and Zhang models tended to fit well: some fit in the defoliation stage in the southern part of Japan and some in the greening stage in the northern and the middle parts of Japan, while relatively many observations fit within early stage to late stage. LSP-ALCC using EVI and EVI2 by the Elmore and the Gu models tended to fit in the defoliation stage and such spatial distributions showed less geographic trends. LSP-ALCC based on GRVI with any model tended to show a relatively clear spatial distribution pattern, such that those fitting within the greening stage were observed in the northern part, while those fitting with the defoliation stage were observed in the southern part of Japan.
Table 1 shows a quantitative summary of how frequently LSP-ALCCs estimated from different models and vegetation indices fit in each category. To explore the fitness of whether LSP-ALCCs were within the autumn foliage stage or not, early to late stages were aggregated into the autumn foliage stage. NDVI models often estimated LSP-ALCC at the defoliation stage, while kNDVI models did at the greening stage. Models with EVI, EVI2, and GRVI estimated LSP-ALCC relatively well, and a large number of estimates were within the autumn foliage stage.
The Beck model with EVI yielded the highest fits in the peak stage (18.9%) and in the aggregated autumn foliage stage (40.6%). The Zhang model with EVI yielded the second-best fit in the peak stage (18.5%) and in the autumn foliage stage (40.4%). The estimates with EVI2 were slightly poorer than those with EVI in all models. GRVI was expected to represent autumn foliage reliably as the index considers differences in visible wavelength values; however, the estimates were not as reliable as those with EVI and EVI2. The Elmore and Gu models performed relatively poorly with all VIs, which could be attributed to the model’s complexity. Specifically, numerous parameters have to be fitted, whereas insufficient observations were available in the present study. Even though the results were explored based on the fitness within the peak stage or the autumn foliage stage, the correspondence rate was not adequately high, implying high uncertainty.

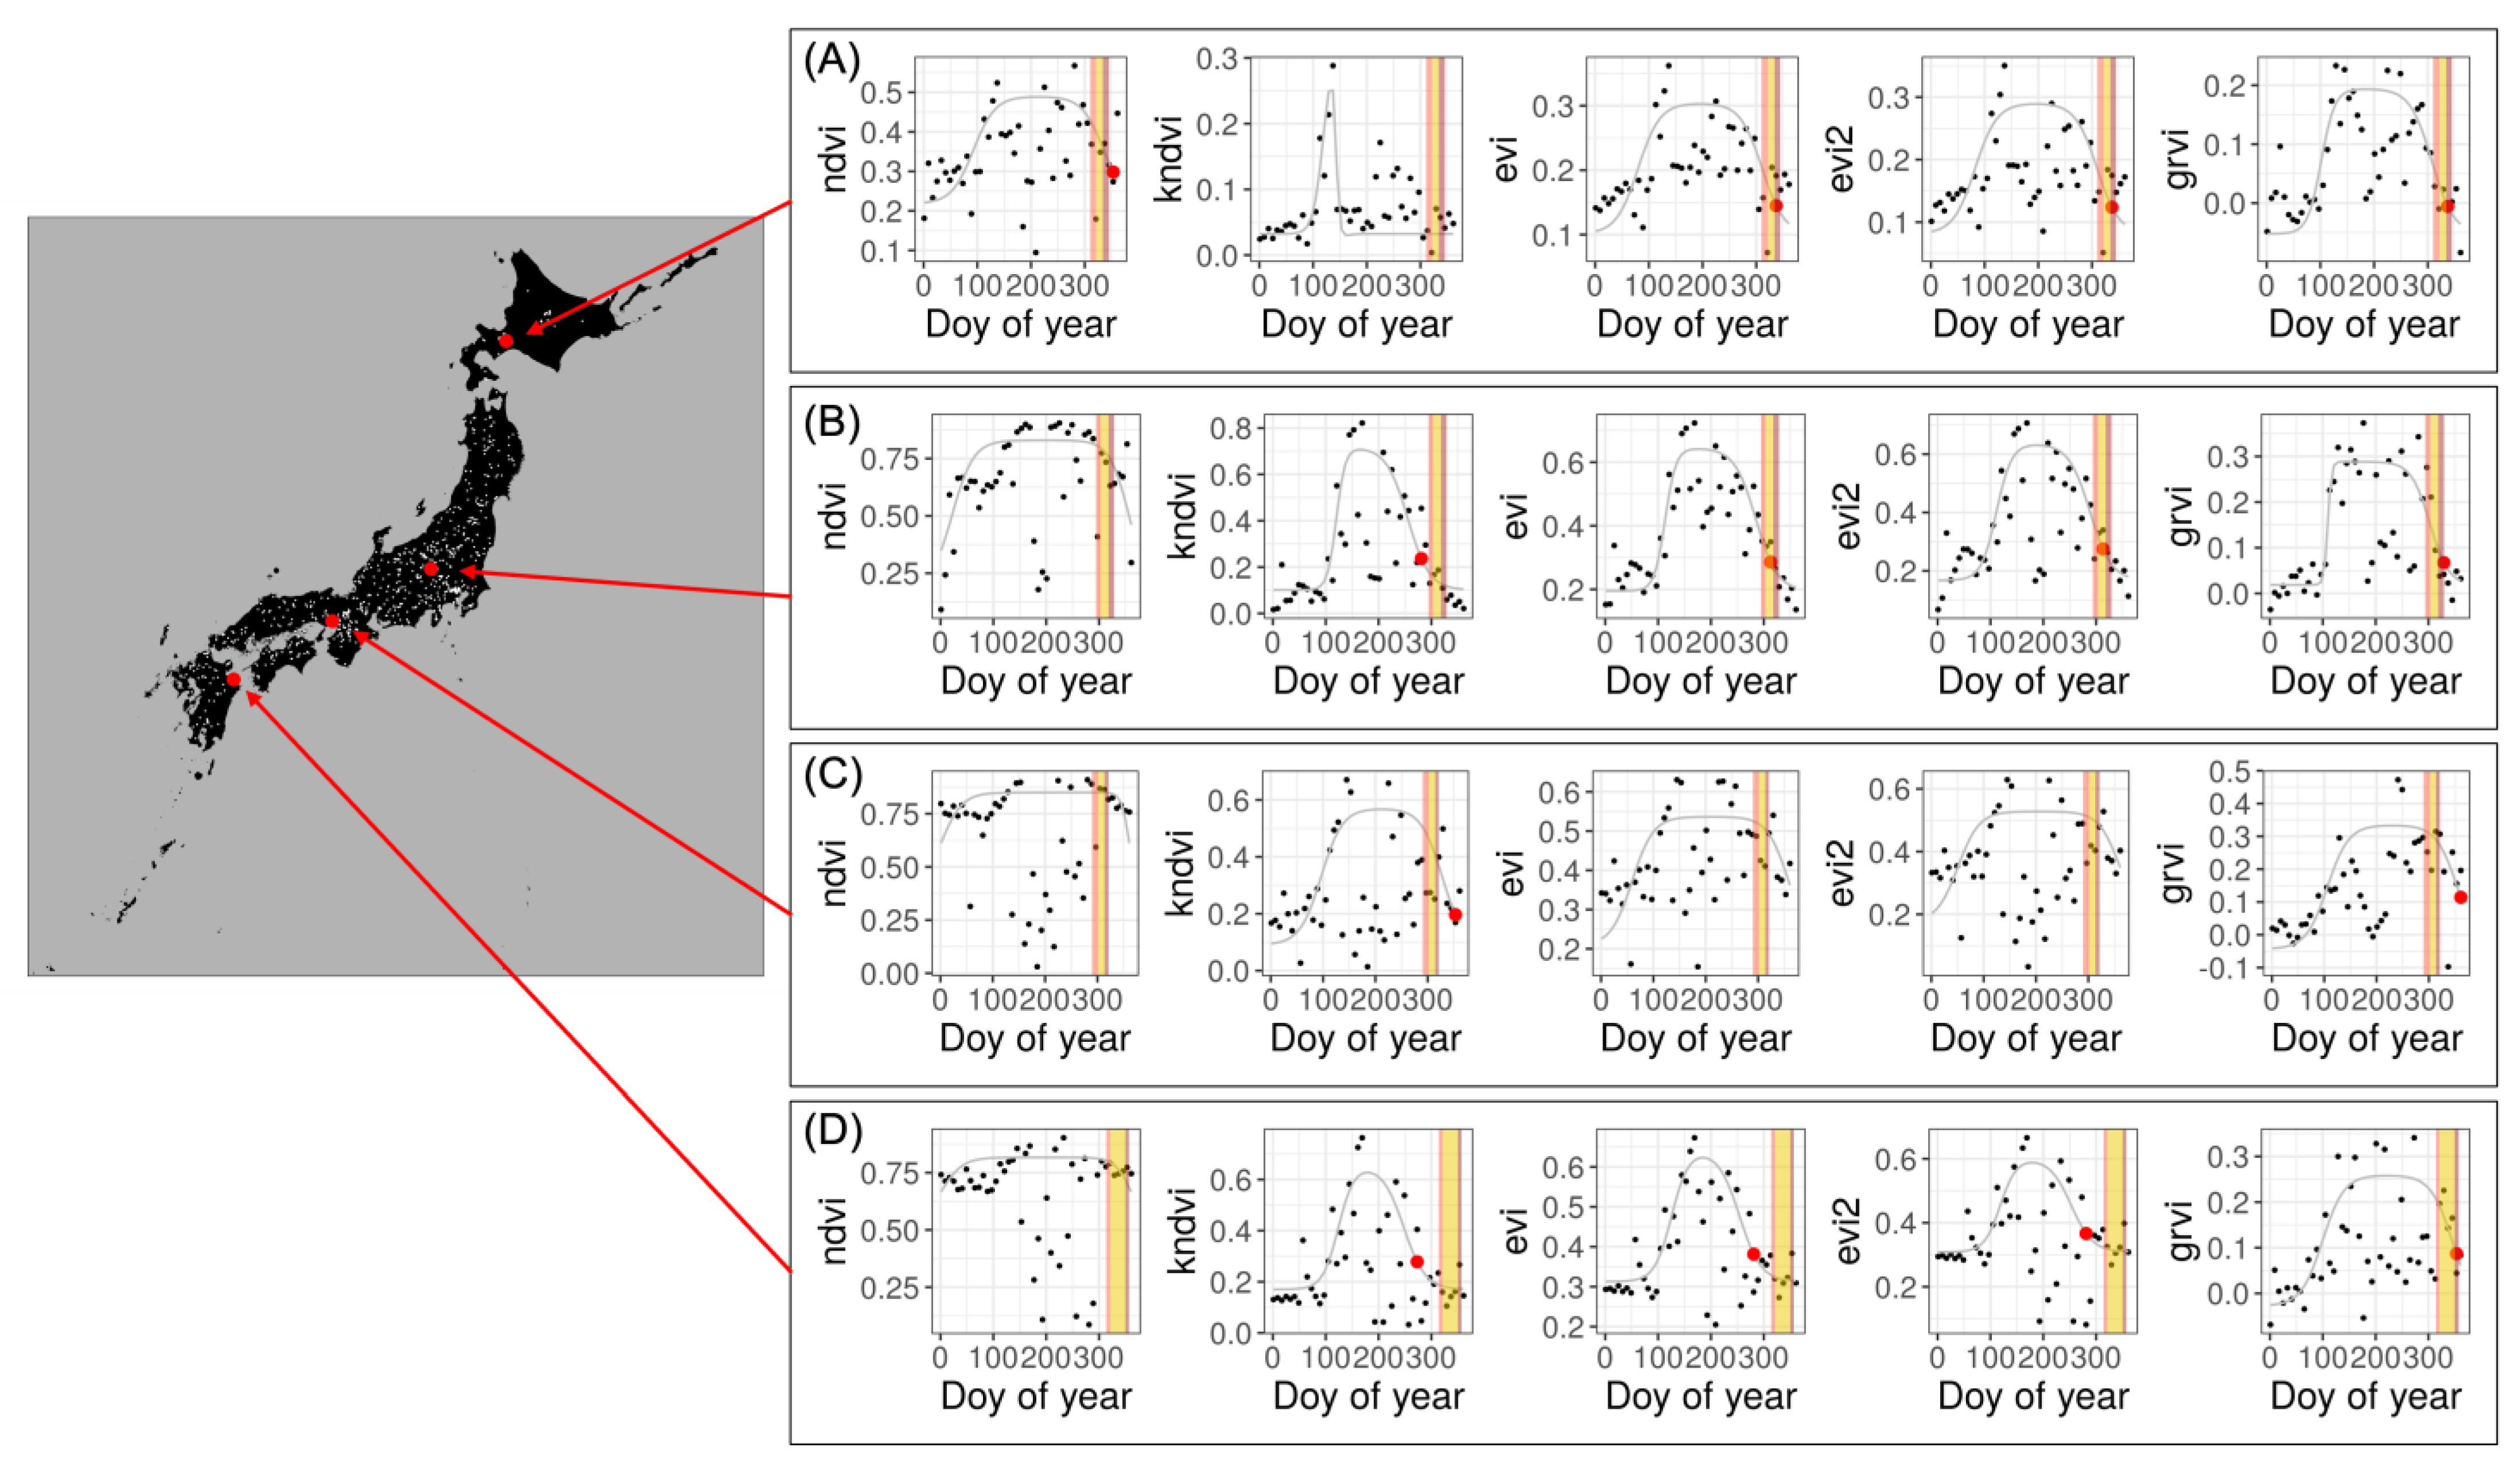
3.3. Validation at Example Sites

Figure 6 demonstrates how the Beck double logistic model was fitted to the five VIs (NDVI, kNDVI, EVI, EVI2, and GRVI) at example sites. In plots (A)–(D), the estimated LSP-ALCCs are shown as red points, and autumn foliage stages based on Weathernews data are shown as colored strips: early stage, peak stage, and late stage, are shown in red, yellow, and brown, respectively. The fitting and LSP-ALCCs were inconsistent across different VIs. Time-series plot indicated that the fitting for NDVI was likely to show less seasonality than others, which often causes failure of estimates of LSP-ALCC. At site A, the main campus of Hokkaido University, which is famous for its ginkgo trees, models based on NDVI, EVI, EVI2, and GRVI estimated the LSP-ALCC; however, the estimates were later than the peak stage on the ground. At site B, Mt. Asamakakushisan, a famous autumn foliage site for maple and beech trees, models by kNDVI, EVI, EVI2, and GRVI yielded good estimates. In particular, LSP-ALCC based on EVI and EVI2 fit within the peak stage. LSP-ALCC based on kNDVI was estimated at a relatively early period, and that based on GRVI was estimated at a relatively late period. At site C, Kobe Municipal Arboretum, where diverse types of trees are found, fittings showed relatively low seasonality and only models based on kNDVI and GRVI estimated LSP-ALCCs; however, the estimates were at the post-defoliation stage. At site D, Okajyoshi, a famous autumn foliage spot for maple trees, models based on kNDVI, EVI, and EVI2 estimated LSP-ALCCs much earlier than the autumn foliage stage, whereas the model based on GRVI estimated LSP-ALCCs at the defoliation stage. The results suggest that the validity of LSP-ALCC estimates was influenced by the seasonality of VI time-series.
Figure 7 shows the difference in estimated LSP-ALCCs from the Beck double logistic model with EVI against the middle day of the peak stage of ALCC according to the Weathernews data. As the peak period of the Weathernews data was 14.48 days on average with a standard deviation of 11.51 days, such a difference was expected. While the map shows the bias, the histogram represents the unimodal distribution with the mean as 6.28, suggesting the LSP-ALCCs tended to estimate the peak ALCC late. The spatial distribution of outliers of the difference is found in Figure 7, but it does not show a clear pattern. The difference could be caused by observations such as cloud cover and mixed land cover within a pixel or model fitting due to inexplicit seasonal patterns of EVI.

4. Discussion

4.1. Uncertainty of Land Surface Phenology-Based Autumn Leaf Color Change Estimates

Accurate estimation of ALCC using NDVI from MODIS MOD09A1 was difficult, especially in the west and south of Japan, where laurel forests are dominant. As laurel forests consist of a mixture of evergreen and deciduous trees, vegetation in evergreen forests is relatively active throughout the year in such areas (see Figure 6). Although NDVI is a popular index, its value is often saturated in dense vegetation [41], making it difficult to use NDVI to track seasonal changes in the vegetation in evergreen forests. However, considering deciduous forests are dominant in northern Japan, seasonal vegetation activities tend to be relatively clear, and the surface reflectance time-series enable characterization of leaf senescence. The saturation problem of NDVI may be critical, leading to difficulties in LSP-EOS estimation at low latitudes. kNDVI was expected to be a better choice for LSP-ALCC estimation, considering it is less sensitive to the saturation problem. However, the results were opposite to those obtained based on NDVI, such that LSP-ALCCs were in the greening stage at many sites (Figure 5 and Table 1). Consequently, EVI and EVI2 performed relatively well by avoiding the problem and capturing the changing signals of autumn foliage. Color-based VI of GRVI was expected to represent the seasonal color change of vegetation; however, the approach estimated autumn foliage events relatively late, which may be due to the mixed pixel problem, as the spatial resolution of MODIS MOD09A1 is coarse (500 m). Heterogenous land cover and/or tree species, especially in the west and south of Japan (see Figure 6C,D), would influence the result because the GRVI time-series directly represent signal change for color.
The extraction methods also influenced the results. The results imply that the Elmore and Gu models, which require more parameters, estimated the LSP-ALCC poorly compared to the simpler asymmetric double logistic curves of the Beck and Zhang models. This could be caused by the relatively small number of observations (with respect to the number of parameters). The Beck and Zhang models require six parameters to be fitted, whereas the Elmore and Gu models require seven and nine parameters, respectively. As the MODIS MOD09A1 time-series had 46 observations, models with fewer parameters were stable for fitting in this study. Future studies should examine this issue using frequent observation data, such as those obtained using Advanced Himawari Imager (AHI) 8, as seen in [42].
We only employed the derivative approach for LSP-ALCC extraction from the fitting curve. The popular threshold approach could also be applied, for example, with a threshold of 0.2 and 0.5 for all models (results are not presented). However, determining the appropriate threshold is not straightforward. The well-fitted threshold varies according to space and time, and such inconsistency can be a major obstacle in this approach. For example, we estimated the LSP-ALCCs with a threshold of 0.5, which tended to show earlier autumn foliage, whereas the 0.2 threshold tended to show later autumn foliage; therefore, the optimal threshold was between 0.2 and 0.5. However, such a threshold would be inconsistent across space and time.

4.2. Limitations

Although the derivative approach is the most reasonable method of extracting phenophases, sometimes, it cannot estimate phenophases in case of failure in finding the local maxima of the second derivative in time-series. Such an issue can be overcome by adding observation inputs in the pre- and post-target periods to the model for better fitting. The data-fitting approach used in our study has a technical limitation if the available data are insufficient. A logistic function curve fits well when the vegetation activity or the leaf color at a certain stage (e.g., greening in the summer) changes drastically to another stage in the dormancy stage, transitioning into the next stage (e.g., leaf fall in the winter) (see Figure 6B) as an example). If such dormancy is not found within the observation period because of the poor observation at a certain period or the seasonal change being inexplicit, the derivative method may fail to capture the ALCC. As the double logistic approach is a data-fitting approach, the development of a process-based model is crucial.
Our results suggest that the LSP-ALCC based on the second derivative method for EVI with Beck model yielded reliable results. However, improvements are still required because the percentage of the LSP-ALCC found in the peak stage was only 18.9%. In addition, other high-frequency observation data should be explored for better ALCC estimation in future studies.
We used the citizen report data as reference for the autumn foliage, and such data suffer from uncertainty with regard spatial resolution, which is different from that of remote sensing [43]. All citizen reports may not be georeferenced precisely; therefore, high spatial resolution remote sensing data, such as those obtained from Landsat-8 and Sentinel-2, were not used. It should also be considered that the landscape level of the sightseeing spots ranges from a natural scenery level to an architectural level. Such heterogeneous characteristics of spots may lead to uncertainty under remote sensing-based observation and LSP models. Such issues in the integration of citizen reports with remote sensing data should be investigated further in future studies.

4.3. Future Directions toward Mapping Cultural Ecosystem Services

The present study evaluated the uncertainty of LSP-ALCC in illustrating the CESs provided by autumn foliage. Not only developing a better LSP-ALCC model, but also mapping the CESs is a future research direction. The socioeconomic aspects of the CESs with respect to autumn foliage, including the accessibility and attractiveness of sites [44], should also be considered in future studies. Although CESs substantially contribute to human well-being [45], the sustainable management of CESs is key to quantifying their value. Additionally, landscape planning should be updated based on CES assessment for environmental sustainability [46].

5. Conclusions

We evaluated autumn leaf color change using a land surface phenology approach based on ground-level autumn leaf reports at spatially distributed 758 sightseeing sites across Japan. LSP-ALCCs were estimated using MODIS MOD09A1 time-series data for the year 2020. The estimated LSP-ALCCs by the second derivative-based extraction method with five VIs and four fitting curves were highly inconsistent, and most of them were not fitted well with the referenced information. Even though we determined that the optimal approach of estimating LSP-ALCC was using EVI with the Beck model, further investigations are required to improve the ALCC estimation for the use of mapping cultural ecosystem services based on both citizen reports and remote sensing.

Author Contributions

Conceptualization, N.T.; methodology, N.T.; formal analysis, N.T.; investigation, N.T.; resources, N.T.; writing—original draft preparation, N.T.; writing—review and editing, N.S. and T.M.; visualization, N.T.; supervision, T.M. and N.S.; funding acquisition, N.T. All authors have read and agreed to the published version of the manuscript.

Funding

This work was supported by the Ministry of Education, Culture, Sports, Science and Technology and Japan Society of the Promotion of Science (MEXT/JSPS KAKENHI; grant number: 20K20005) and a joint research program of Center for Environmental Remote Sensing (CEReS), Chiba University (2020 & 2021).

Institutional Review Board Statement

Not applicable.

Informed Consent Statement

Not applicable.

Data Availability Statement

Acknowledgments

We appreciate five anonymous reviewers for providing valuable comments on this manuscript. Ground information data for autumn leaf color change used in the present study were provided by Weathernews.

Conflicts of Interest

The authors declare no conflict of interest.

References

  1. Gallinat, A.S.; Primack, R.B.; Wagner, D.L. Autumn, the neglected season in climate change research. Trends Ecol. Evol. 2015, 30, 169–176. [Google Scholar] [CrossRef] [PubMed]
  2. Ibáñez, I.; Primack, R.B.; Miller-Rushing, A.J.; Ellwood, E.; Higuchi, H.; Lee, S.D.; Kobori, H.; Silander, J.A. Forecasting phenology under global warming. Philos. Trans. R. Soc. B Biol. Sci. 2010, 365, 3247–3260. [Google Scholar] [CrossRef] [PubMed]
  3. Gill, A.L.; Gallinat, A.S.; Sanders-DeMott, R.; Rigden, A.J.; Short Gianotti, D.J.; Mantooth, J.A.; Templer, P.H. Changes in autumn senescence in northern hemisphere deciduous trees: A meta-analysis of autumn phenology studies. Ann. Bot. 2015, 116, 875–888. [Google Scholar] [CrossRef] [PubMed] [Green Version]
  4. Doi, H.; Takahashi, M. Latitudinal patterns in the phenological responses of leaf colouring and leaf fall to climate change in Japan. Glob. Ecol. Biogeogr. 2008, 17, 556–561. [Google Scholar] [CrossRef]
  5. Delpierre, N.; Dufrêne, E.; Soudani, K.; Ulrich, E.; Cecchini, S.; Boé, J.; François, C. Modelling interannual and spatial variability of leaf senescence for three deciduous tree species in France. Agric. For. Meteorol. 2009, 149, 938–948. [Google Scholar] [CrossRef]
  6. Archetti, M.; Richardson, A.D.; O’Keefe, J.; Delpierre, N. Predicting climate change impacts on the amount and duration of autumn colors in a New England forest. PLoS ONE 2013, 8, e57373. [Google Scholar] [CrossRef] [PubMed]
  7. Xie, Y.; Wang, X.; Wilson, A.M.; Silander, J.A. Predicting autumn phenology: How deciduous tree species respond to weather stressors. Agric. For. Meteorol. 2018, 250–251, 127–137. [Google Scholar] [CrossRef]
  8. Tao, Z.; Wang, H.; Dai, J.; Alatalo, J.; Ge, Q. Modeling spatiotemporal variations in leaf coloring date of three tree species across China. Agric. For. Meteorol. 2018, 249, 310–318. [Google Scholar] [CrossRef]
  9. Nagai, S.; Saitoh, T.M.; Miura, T. Peak autumn leaf colouring along latitudinal and elevational gradients in Japan evaluated with online phenological data. Int. J. Biometeorol. 2020, 64, 1743–1754. [Google Scholar] [CrossRef]
  10. Rollinson, C.R. Surplus and stress control autumn timing. Science 2020, 370, 1030–1031. [Google Scholar] [CrossRef]
  11. Zhang, Q.; Kong, D.; Shi, P.; Singh, V.P.; Sun, P. Vegetation phenology on the Qinghai-Tibetan Plateau and its response to climate change (1982–2013). Agric. For. Meteorol. 2018, 248, 408–417. [Google Scholar] [CrossRef]
  12. Zani, D.; Crowther, T.W.; Mo, L.; Renner, S.S.; Zohner, C.M. Increased growing-season productivity drives earlier autumn leaf senescence in temperate trees. Science 2020, 370, 1066–1071. [Google Scholar] [CrossRef] [PubMed]
  13. Beurs, K.M.D.; Henebry, G.M. Phenological Research; Hudson, I.L., Keatley, M.R., Eds.; Springer: Dordrecht, The Netherlands, 2010; pp. 177–208. ISBN 978-90-481-3334-5. [Google Scholar] [CrossRef]
  14. Caparros-Santiago, J.A.; Rodriguez-Galiano, V.; Dash, J. Land surface phenology as indicator of global terrestrial ecosystem dynamics: A systematic review. ISPRS J. Photogramm. Remote Sens. 2021, 171, 330–347. [Google Scholar] [CrossRef]
  15. De Beurs, K.M.; Henebry, G.M. Land surface phenology and temperature variation in the International Geosphere-Biosphere Program high-latitude transects. Glob. Chang. Biol. 2005, 11, 779–790. [Google Scholar] [CrossRef]
  16. Weltzin, J.F.; Betancourt, J.L.; Cook, B.I.; Crimmins, T.M.; Enquist, C.A.F.; Gerst, M.D.; Gross, J.E.; Henebry, G.M.; Hufft, R.A.; Kenney, M.A.; et al. Seasonality of biological and physical systems as indicators of climatic variation and change. Clim. Chang. 2020, 163, 1755–1771. [Google Scholar] [CrossRef]
  17. Buitenwerf, R.; Rose, L.; Higgins, S.I. Three decades of multi-dimensional change in global leaf phenology. Nat. Clim. Chang. 2015, 5, 364–368. [Google Scholar] [CrossRef]
  18. Jönsson, P.; Eklundh, L. TIMESAT—A program for analyzing time-series of satellite sensor data. Comput. Geosci. 2004, 30, 833–845. [Google Scholar] [CrossRef] [Green Version]
  19. Berra, E.F.; Gaulton, R. Remote sensing of temperate and boreal forest phenology: A review of progress, challenges and opportunities in the intercomparison of in-situ and satellite phenological metrics. For. Ecol. Manag. 2021, 480, 118663. [Google Scholar] [CrossRef]
  20. White, M.A.; De Beurs, K.M.; Didan, K.; Inouye, D.W.; Richardson, A.D.; Jensen, O.P.; O’Keefe, J.; Zhang, G.; Nemani, R.R.; Van Leeuwen, W.J.D.; et al. Intercomparison, interpretation, and assessment of spring phenology in North America estimated from remote sensing for 1982–2006. Glob. Chang. Biol. 2009, 15, 2335–2359. [Google Scholar] [CrossRef]
  21. Brown, T.B.; Hultine, K.R.; Steltzer, H.; Denny, E.G.; Denslow, M.W.; Granados, J.; Henderson, S.; Moore, D.; Nagai, S.; Sanclements, M.; et al. Using phenocams to monitor our changing earth: Toward a global phenocam network. Front. Ecol. Environ. 2016, 14, 84–93. [Google Scholar] [CrossRef] [Green Version]
  22. Nasahara, K.N.; Nagai, S. Review: Development of an in situ observation network for terrestrial ecological remote sensing: The Phenological Eyes Network (PEN). Ecol. Res. 2015, 30, 211–223. [Google Scholar] [CrossRef]
  23. Nagai, S.; Akitsu, T.; Saitoh, T.M.; Busey, R.C.; Fukuzawa, K.; Honda, Y.; Ichie, T.; Ide, R.; Ikawa, H.; Iwasaki, A.; et al. 8 million phenological and sky images from 29 ecosystems from the Arctic to the tropics: The Phenological Eyes Network. Ecol. Res. 2018, 33, 1091–1092. [Google Scholar] [CrossRef]
  24. Soudani, K.; Le Maire, G.; Dufrêne, E.; François, C.; Delpierre, N.; Ulrich, E.; Cecchini, S. Evaluation of the onset of green-up in temperate deciduous broadleaf forests derived from Moderate Resolution Imaging Spectroradiometer (MODIS) data. Remote Sens. Environ. 2008, 112, 2643–2655. [Google Scholar] [CrossRef]
  25. Rodriguez-Galiano, V.F.; Dash, J.; Atkinson, P.M. Intercomparison of satellite sensor land surface phenology and ground phenology in Europe. Geophys. Res. Lett. 2015, 42, 2253–2260. [Google Scholar] [CrossRef] [Green Version]
  26. Doktor, D.; Bondeau, A.; Koslowski, D.; Badeck, F.W. Influence of heterogeneous landscapes on computed green-up dates based on daily AVHRR NDVI observations. Remote Sens. Environ. 2009, 113, 2618–2632. [Google Scholar] [CrossRef]
  27. Liang, L.; Schwartz, M.D.; Fei, S. Validating satellite phenology through intensive ground observation and landscape scaling in a mixed seasonal forest. Remote Sens. Environ. 2011, 115, 143–157. [Google Scholar] [CrossRef]
  28. Schwartz, M.D.; Betancourt, J.L.; Weltzin, J.F. From caprio’s lilacs to the USA National Phenology Network. Front. Ecol. Environ. 2012, 10, 324–327. [Google Scholar] [CrossRef]
  29. Taylor, S.D.; Meiners, J.M.; Riemer, K.; Orr, M.C.; White, E.P. Comparison of large-scale citizen science data and long-term study data for phenology modeling. Ecology 2019, 100, ecy.02568. [Google Scholar] [CrossRef] [Green Version]
  30. Fuccillo, K.K.; Crimmins, T.M.; De Rivera, C.E.; Elder, T.S. Assessing accuracy in citizen science-based plant phenology monitoring. Int. J. Biometeorol. 2015, 59, 917–926. [Google Scholar] [CrossRef]
  31. Doi, H.; Higuchi, H.; Kobori, H.; Lee, S.; Primack, R.B. Declining phenology observations by the Japan Meteorological Agency. Nat. Ecol. Evol. 2021, 5, 886–887. [Google Scholar] [CrossRef]
  32. Liu, J.; Cheng, H.; Jiang, D.; Huang, L. Impact of climate-related changes to the timing of autumn foliage colouration on tourism in Japan. Tour. Manag. 2019, 70, 262–272. [Google Scholar] [CrossRef]
  33. Vaz, A.S.; Gonçalves, J.F.; Pereira, P.; Santarém, F.; Vicente, J.R.; Honrado, J.P. Earth observation and social media: Evaluating the spatiotemporal contribution of non-native trees to cultural ecosystem services. Remote Sens. Environ. 2019, 230, 111193. [Google Scholar] [CrossRef]
  34. Juniper, A. Wabi Sabi: The Japanese Art of Impermanence; Tuttle Publishing: Clarendon, VT, USA, 2011. [Google Scholar]
  35. Gorelick, N.; Hancher, M.; Dixon, M.; Ilyushchenko, S.; Thau, D.; Moore, R. Remote Sensing of Environment Google Earth Engine: Planetary-scale geospatial analysis for everyone. Remote Sens. Environ. 2017, 202, 18–27. [Google Scholar] [CrossRef]
  36. Beck, P.S.A.; Atzberger, C.; Høgda, K.A.; Johansen, B.; Skidmore, A.K. Improved monitoring of vegetation dynamics at very high latitudes: A new method using MODIS NDVI. Remote Sens. Environ. 2006, 100, 321–334. [Google Scholar] [CrossRef]
  37. Elmore, A.J.; Guinn, S.M.; Minsley, B.J.; Richardson, A.D. Landscape controls on the timing of spring, autumn, and growing season length in mid-Atlantic forests. Glob. Change Biol. 2012, 18, 656–674. [Google Scholar] [CrossRef] [Green Version]
  38. Gu, L.; Post, W.M.; Baldocchi, D.D.; Black, T.A.; Suyker, A.E.; Verma, S.B.; Vesala, T.; Wofsy, S.C. Characterizing the seasonal dynamics of plant community photosynthesis across a range of vegetation types. In Phenology of Ecosystem Processes; Springer: New York, NY, USA, 2009; pp. 35–58. [Google Scholar] [CrossRef] [Green Version]
  39. Zhang, X.; Friedl, M.A.; Schaaf, C.B.; Strahler, A.H.; Hodges, J.C.F.; Gao, F.; Reed, B.C.; Huete, A. Monitoring vegetation phenology using MODIS. Remote Sens. Environ. 2003, 84, 471–475. [Google Scholar] [CrossRef]
  40. Zhang, X.; Wang, J.; Gao, F.; Liu, Y.; Schaaf, C.; Friedl, M.; Yu, Y.; Jayavelu, S.; Gray, J.; Liu, L.; et al. Exploration of scaling effects on coarse resolution land surface phenology. Remote Sens. Environ. 2017, 190, 318–330. [Google Scholar] [CrossRef] [Green Version]
  41. Camps-Valls, G.; Campos-Taberner, M.; Moreno-Martínez, Á.; Walther, S.; Duveiller, G.; Cescatti, A.; Mahecha, M.D.; Muñoz-marí, J.; García-Haro, F.J.; Guanter, L.; et al. A Unified Vegetation Index for Quantifying the Terrestrial Biosphere. Sci. Adv. 2021, 7, eabc7447. [Google Scholar] [CrossRef]
  42. Miura, T.; Nagai, S.; Takeuchi, M.; Ichii, K.; Yoshioka, H. Improved characterisation of vegetation and land surface seasonal dynamics in central Japan with Himawari-8 Hypertemporal Data. Sci. Rep. 2019, 9, 15692. [Google Scholar] [CrossRef] [Green Version]
  43. Liu, Y.; Liu, X.; Gao, S.; Gong, L.; Kang, C.; Zhi, Y.; Chi, G.; Shi, L. Social Sensing: A new approach to understanding our socioeconomic environments. Ann. Assoc. Am. Geogr. 2015, 105, 512–530. [Google Scholar] [CrossRef]
  44. Paracchini, M.L.; Zulian, G.; Kopperoinen, L.; Maes, J.; Schägner, J.P.; Termansen, M.; Zandersen, M.; Perez-Soba, M.; Scholefield, P.A.; Bidoglio, G. Mapping cultural ecosystem services: A framework to assess the potential for outdoor recreation across the EU. Ecol. Indic. 2014, 45, 371–385. [Google Scholar] [CrossRef] [Green Version]
  45. Pleasant, M.M.; Gray, S.A.; Lepczyk, C.; Fernandes, A.; Hunter, N.; Ford, D. Managing cultural ecosystem services. Ecosyst. Serv. 2014, 8, 141–147. [Google Scholar] [CrossRef]
  46. Plieninger, T.; Bieling, C.; Fagerholm, N.; Byg, A.; Hartel, T.; Hurley, P.; López-Santiago, C.A.; Nagabhatla, N.; Oteros-Rozas, E.; Raymond, C.M.; et al. The role of cultural ecosystem services in landscape management and planning. Curr. Opin. Environ. Sustain. 2015, 14, 28–33. [Google Scholar] [CrossRef] [Green Version]
Figure 1. Spatial distribution of 758 Weathernews data available at popular sightseeing spots for autumn foliage in Japan. Color represents the composition of deciduous forest, evergreen forest, and non-forest land. Land cover information was obtained from https://www.eorc.jaxa.jp/ALOS/en/dataset/lulc_e.htm (accessed on 1 October 2021).
Remotesensing 14 02017 g001
Figure 2. Four stages of autumn leaf color change at 758 sightseeing spots across Japan in 2020, reported by Weathernews. Each map represents the first day of year (DOY) of (a) start of leaf coloring, (b) peak of leaf coloring, (c) fading of leaf coloring, and (d) leaf fall.
Remotesensing 14 02017 g002
Figure 3. An example of vegetation index values of MODIS time series (black dots) and smoothed line by a double logistic curve (gray line) and estimated phenophase using by the first and the second derivative (gray points). Colors on plots represent categories (red: start to peak of leaf coloring, yellow: peak to fading of leaf coloring, brown: fading of leaf coloring to leaf fall), according to Weathernews data.
Remotesensing 14 02017 g003
Figure 4. Estimated autumn leaf color change by the derivative-based method from four different double logistic models (Beck, Elmore, Gu, and Zhang) for five vegetation indices (NDVI, kNDVI, EVI, EVI2, and GRVI).
Remotesensing 14 02017 g004
Figure 5. Maps of five stages of autumn foliage (greening stage, early stage, peak stage, late stage, and defoliation stage) corresponding to the autumn leaf color change estimates based on the derivative-based method from four double logistic models (Beck, Elmore, Gu, and Zhang) with five vegetation indices (NDVI, kNDVI, EVI, EVI2, and GRVI).
Remotesensing 14 02017 g005
Figure 6. Four examples of land surface phenology-based autumn leaf color changes (red points) from the Beck double logistic model fittings (gray lines) based on five vegetation indices, including NDVI, kNDVI, EVI, EVI2, and GRVI (black dots) at (A) Hokkaido University, (B) Mt. Asamakakushisan, (C) Kobe Municipal Arboretum, and (D) Okajyoshi. Colors on plots represent categories (red: early stage, yellow: peak stage, brown: late stage, according to Weathernews data).
Remotesensing 14 02017 g006
Figure 7. Map of differences in estimated land surface phenology-based autumn leaf color changes by the Beck double logistic model with EVI and the middle day of peak autumn leaf color period according to Weathernews data.
Remotesensing 14 02017 g007
Table 1. Proportions (%) of autumn leaf color change estimates categorized as greening, early, peak, late, and defoliation stages, based on citizen reported data in the Weathernews database. Autumn foliage is the aggregation of early to late stages. NA column represents the percentage of missing values.
GreeningEarlyPeakLateDefoliationNAAutumn Foliage
NDVIBeck2.92.64.95.957.925.713.5
Elmore2.02.03.65.047.540.010.6
Gu5.52.63.65.872.010.412.0
Zhang2.82.94.86.357.525.714.0
kNDVIBeck42.414.413.65.314.410.033.2
Elmore30.911.517.86.724.58.636.0
Gu23.711.214.96.228.115.832.3
Zhang41.814.513.24.914.011.632.6
EVIBeck17.113.818.97.939.03.240.6
Elmore9.69.111.39.047.213.729.4
Gu12.47.914.58.249.67.430.6
Zhang17.913.618.58.338.13.640.4
EVI2Beck16.413.317.98.739.54.240.0
Elmore7.18.411.98.449.115.028.8
Gu9.84.611.38.752.513.124.7
Zhang17.312.917.08.639.54.838.5
GRVIBeck19.911.616.29.036.86.536.8
Elmore17.010.614.17.039.611.731.7
Gu24.512.015.49.629.88.637.1
Zhang19.811.715.69.236.07.736.5
Publisher’s Note: MDPI stays neutral with regard to jurisdictional claims in published maps and institutional affiliations.

