Abstract
Understanding the responses of vegetation to climate extremes is important for revealing vegetation growth and guiding environmental management. Guangxi was selected as a case region in this study. This study investigated the spatial-temporal variations of the Normalized Difference Vegetation Index (NDVI), and quantitatively explored effects of climate extremes on vegetation on multiple time scales during 1982–2015 by applying the Pearson correlation and time-lag analyses. The annual NDVI significantly increased in most areas with a regional average rate of 0.00144 year−1, and the highest greening rate appeared in spring. On an annual scale, the strengthened vegetation activity was positively correlated with the increased temperature indices, whereas on a seasonal or monthly scale, this was the case only in spring and summer. The influence of precipitation extremes mainly occurred on a monthly scale. The vegetation was negatively correlated with both the decreased precipitation in February and the increased precipitation in summer months. Generally, the vegetation significantly responded to temperature extremes with a time lag of at least one month, whereas it responded to precipitation extremes with a time lag of two months. This study highlights the importance of accounting for vegetation-climate interactions.
1. Introduction
As an irreplaceable component of terrestrial ecosystems, vegetation is a pivotal link between the atmosphere and the land’s surface [1]. Vegetation shows a significant influence on the carbon cycle and the water balance, and changes in vegetation can alter the ecology balance and the water cycle [2,3]. Climate change, especially increased climate extremes [4,5,6], can have profound impacts on vegetation and ecosystems [7,8,9,10,11,12,13,14]. Therefore, analyzing the vegetation variation and the influence of climate extremes on vegetation dynamics can help evaluate ecological responses and guide environmental management.
The Normalized Difference Vegetation Index (NDVI) has been widely used to detect vegetation dynamics and the response of vegetation to climate extremes [13,14,15,16,17,18,19]. In the past decades, the regional average NDVI has showed an increasing trend in China on the national scale [20,21], but there was a significant spatial heterogeneity of NDVI trends [13,20,21,22]. Meanwhile, due to the uneven variation in the NDVI in each different growing period, the analyses focusing on the annual or longer scales were not sufficient to represent the variation details. Therefore, it is necessary to investigate the variation characteristics of vegetation dynamics by considering different temporal scales in each sensitive area.
The vegetation was greatly influenced by climate extremes, which varies by region, season and scale [7,15,18,23]. The degree of vegetation responses to climate extremes showed great spatial heterogeneity [13,14,18,24,25,26,27], and the impact of extreme climate indices varied among local, regional and national scales [18]. Extreme precipitation generally promotes vegetation growth in most dry areas but has a negative influence on vegetation in humid areas [18,20]. Nevertheless, extreme temperature is recognized to have a more extensive and complex effect on vegetation in China [12,18]. In addition, the influences of climate factors on vegetation often exhibit a time lag [28,29,30], and the time lag of vegetation responses is generally shorter than a quarter of a year on a monthly scale [30].
Regarding the vegetation responses to climate variables, many studies have respectively identified the temporal differences in the correlations between vegetation and extreme climate indices, and the different time-lag effects of climate extremes on vegetation growth in different spaces [12,20,21,28,31,32]. Exploring this relationship on a monthly scale can help better understand the main limiting factors for vegetation growth compared with those on a longer time scale [28]. An analysis of this correlation concentrating on only a single time scale may underestimate the effect of climate change and cannot accurately reflect the response mechanism of vegetation to climate variables [7,14,33]. Hence, it is of great significance to study the relationship between vegetation dynamics and climate extremes on different temporal scales. However, relatively little attention has been paid to the implications of climate extremes for vegetation under multiple temporal scales.
Guangxi, located in the subtropical humid monsoon climate zone, has complex and diverse landforms and mountains. It has widely distributed Karst landforms. Karst areas usually feature a thin soil layer, low soil fertility, and serious soil erosion with many exposed bedrocks highly vulnerable to climate extremes. Moreover, karst vegetation can provide a great carbon sink function [34]. Rocky desertification was identified as the most severe ecological problem threatening the productivity of agriculture, forestry, grassland and livestock husbandry in the karst areas of southwest China [35]. Karst ecosystems are characterized by low environmental capacity, high sensitivity, weak anti-interference ability and ecological vulnerability. Thus, the fragile ecological environment makes it extremely important to understand the responses of vegetation dynamics to extreme climate in this region. Multiple time-scale analysis is necessary for the vegetation variation and the assessment of climate extremes on vegetation over Guangxi. This kind of study can provide knowledge for vegetation conservation and restoration of fragile ecosystems in both Guangxi and other similar regions.
By taking Guangxi as a representative example of fragile regions, this study comprehensively investigated the spatial-temporal trends of NDVI and relations with climatic extremes on multiple time scales (annual, seasonal and monthly). With a focus on the differences in the effects of climate extremes on vegetation at different time scales, this study tried to explore whether the effects of extreme climate on vegetation can be disentangled from the baseline effect of climate on a time series. The layout of this paper is presented as follows: Section 2 introduces the materials and methods. Section 3 elaborates the spatial-temporal variations of NDVI and the correlations between NDVI and extreme climate indices on different time scales. Section 4 discusses the results and Section 5 summarizes the presented work.
2. Materials and Methods
2.1. Study Area and Data
Guangxi is located in the contiguous karst area of southwest China, with a Peak Cluster Depression, a Peak Forest Plain and non-karst landforms. The variety of vegetation is very comprehensive, such as coniferous forest, broadleaf forest, thicket, grass, and cultivated vegetation. Guangxi is a national key forest region and one of the world’s top sugar-producing areas. Crops mainly include double cropping rice, sugar cane, and corn. The vegetation ecosystem in Guangxi is highly fragile because of the widely distributed karst landform. Guangxi has a warm climate and abundant rainfall with annual total precipitation above 1500 mm. Figure 1 shows the geographic location of the study area.
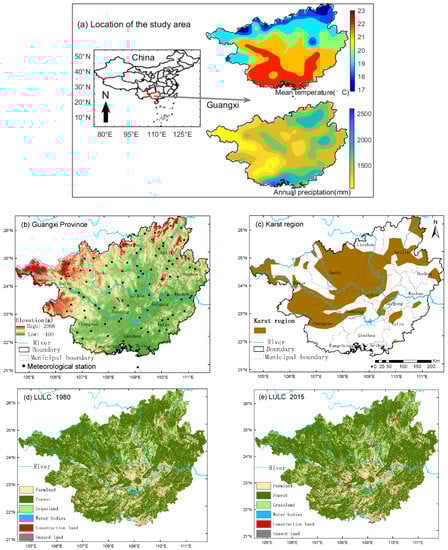
Figure 1.
Geographic location of the study area, and spatial distribution of meteorological stations and land use land cover classes (LULC) (for the year 1980 and 2015, respectively). Note: The LULC data and the digital elevation data were provided by the Resource and Environment Science and Data Center, Chinese Academy of Sciences (https://www.resdc.cn/, accessed on 10 October 2021); the karst boundary data were obtained from the World Map of Carbonate Rock Outcrops (http://web.env.auckland.ac.nz/our-research/karst/, accessed on 14 June 2017).
All data used in this study are described in Table 1. The daily data obtained from the China Meteorological Administration include daily mean temperature, daily maximum temperature, daily minimum temperature, and daily precipitation (http://data.cma.cn/, accessed on 15 October 2019). This study selected 88 meteorological stations, each with a 58-year good and qualified data record (from 1961 to 2018). The karst boundary data were obtained from the World Map of Carbonate Rock Outcrops (http://web.env.auckland.ac.nz/our-research/karst/, accessed on 14 June 2017). The land use and land cover (LULC) data with 1 km spatial resolution were provided by the Resource and Environment Science and Data Center, Chinese Academy of Sciences (https://www.resdc.cn/, accessed on 10 October 2021). The sub-regions of the three vegetation types (farmlands, forests and grasslands) were extracted from the LULC data. According to LULC maps of 1980 and 2015 (Figure 1d,e), the spatial patterns of farmlands, forests and grasslands did not change very much in the past decades. In addition, urban, water and barren areas show little vegetation cover, and therefore these areas were generally excluded from the spatial analysis to diminish some effects of anthropological activities.

Table 1.
Datasets used in this study.
At present, although a series of vegetation indices, such as the NDVI, the Soil adjusted Vegetation Index (SAVI), and the Enhanced Vegetation Index (EVI), have been developed to reflect changes in vegetation activities [36,37], the NDVI is still a good indicator when dealing with large-scale vegetation coverage and greenness [9,14,18,27,38,39]. Thus, the NDVI was employed as an indicator to monitor changes in vegetation activities in this study. A higher NDVI value implies a higher density of green vegetation, and vice versa.
This study used NDVI data from the Global Inventory Monitoring and Modeling Studies (GIMMS) NDVI3g dataset [40], which originated from the Advanced Very High Resolution Radiometer (AVHRR) sensors of the National Oceanic and Atmospheric Administration (NOAA) (https://www.nasa.gov/nex, accessed on 7 December 2020). The GIMMS NDVI3g dataset has been corrected for radiometric calibration, atmospheric attenuation, cloud cover, sensor degradation, inter-sensor differences, view and illumination geometry, orbital drift, volcanic aerosols, and other non-vegetation effects [41]. It has a spatial resolution of 1/12° (about 8 km) and a temporal interval of 15 days. Although the coarse spatial resolution of the dataset cannot be helpful to detect small scale changes, the GIMMS NDVI dataset has a sufficient quality and the longest time series in the period from 1982 to 2015.
The GIMMS NDVI dataset has been evaluated through comparisons with other NDVI products or ground-based validations [42,43,44]. For instance, Fensholt and Proud (2012) [43] compared the performances of a time series of GIMMS NDVI with MODIS NDVI data and found that the trends of the two datasets are basically consistent; the GIMMS NDVI dataset has a significant correlation with ground-based observations in Eastern China [42]. Thus, the dataset performs well in exploring the long-term trend in vegetation greenness and its relationship with climate factors, and its accuracy is relatively reliable [17,40,45,46]. This study could use the GIMMS NDVI data directly. The monthly NDVI values were obtained through the maximum-value composites (MVCs) method, which is the same as that employed in Cui et al. (2019) [17]. The seasonal or yearly NDVI data were calculated by averaging the monthly NDVI over the corresponding periods.
2.2. Methods
Figure 2 provides the flowchart of the approach of this study. The Expert Team on Climate Change Detection and Indices (ETCCDI) has developed a suite of extreme climate indices, including 16 temperature indices and 11 precipitation indices [47]. Guangxi has a typical subtropical and Asian monsoon climate with generally sufficient rainfall (Figure 1a), and the average temperature in the coldest mouth is above 10 °C. Based on these climate characteristics of Guangxi, this study selected the 16 most relevant indices to reflect the intensity and duration in climate extremes (Table 2). This study also analyzed the mean value of the daily mean temperature (Tm) to supplement the extremes. All climate indices were divided into three categories: annual indices, seasonal indices and monthly indices. All these indices can be calculated on an annual basis and used as annual indices. In addition, the 12 indices (Tm, TXm, TNm, DTR, TXx, TNx, TXn, TNn, Rx1day, Rx5day, SDII and PRCPTOT) can be calculated not only on an annual basis, but also on a seasonal or monthly basis. Thus, the 12 indices can also be used as seasonal and monthly indices by being calculated for corresponding time scales. The kriging method was used to resample the climate data of the meteorological stations to a spatial resolution of 8 km to spatially match the NDVI dataset.
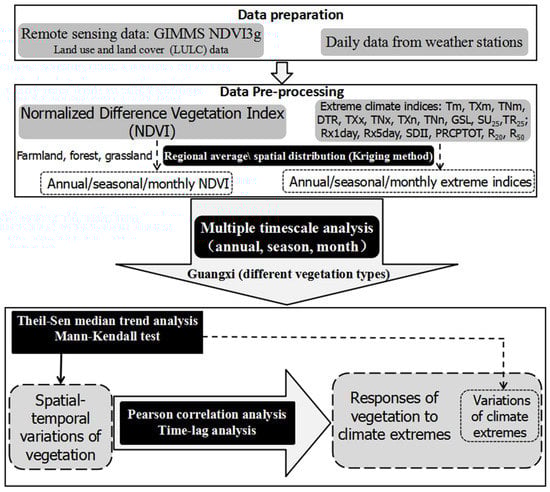
Figure 2.
Flowchart of monitoring changes in vegetation dynamics and relations with extreme climate.
Table 2.
Definitions of extreme temperature indices in this study.
The Theil–Sen (TS) median trend analysis method is less sensitive to observations of missing time series and outliers in the time series [48]. Thus, this work used the TS slope estimator to analyze the variation trends in NDVI and climate indices over large temporal scales. The calculation formula is as follows:
where 1 < j < i < n. β, the median of the slope of data combinations, indicates the variation rate within the time series; i and j are the ordinal numbers of years (one is held constant while the other is varied); xi and xj are the mean values within a certain time in the ith and jth year; and n is the number of monitoring years (equal to 34 in this study). A positive β-value indicates an increasing trend; a negative β-value indicates a decreasing trend; and β + 0 indicates no change. The unit of the NDVI values is 1, and the unit of the NDVI rate is year−1 in this study.
The Mann–Kendall (MK) test [49] does not require the data to be distributed normally or linearly. Thus, this study used the MK trend test to determine whether the trends were significant. In addition, this study utilized the MK abrupt test to detect abrupt changes and potential turning points. The MK abrupt test calculates two statistical measures, which are the sequential values of a reduced or standardized variable. A forward sequential statistic is estimated using the original time series, and a backward sequential statistic is estimated using the reversed time series. If the progressive series and the retrograde series intersect at a certain point, the intersection point is within the significance level, and if the sequence curve of the progressive or retrograde series exceeds the 0.05 significance level after the intersection point, then the intersection points of the two curves represent the potential turning points in the times series.
Pearson correlation analysis was applied to measure the strength of the correlations between vegetation dynamics and extreme indices at both regional average and pixel scales. As the whole time series covered 34 years, the sample size was 34 for the correlation analysis for each time scale. Significance levels of p = 0.05 and 0.01 were taken as the thresholds to distinguish significance. As for the analysis of time-lag effects, the time lag for a climate index was defined as the number of months after which the NDVI showed the highest significant correlation coefficient with this climate index [30,32,50,51]. The time lag is generally shorter than a quarter, and 6 months at most [10,30,51]. Therefore, this study only considered the time lags of 0–6 months. Spring includes the months from March to May, summer from June to August, autumn from September to November, and winter from December to February of the following year.
3. Results
3.1. Spatiotemporal Variability of Vegetation Dynamics
3.1.1. Trends of NDVI on an Annual Scale
Based on the GIMMS NDVI data during 1982–2015, this study summarized the temporal variations and spatial distributions of the annual NDVI in Guangxi (Figure 3). The multiyear mean of the annual NDVI was 0.6775 during the past 34 years. The maximum was found in 2015 with a value of 0.7193, whereas the minimum was found in 1984 with a value of 0.6418. The annual NDVI showed a significant increasing trend with a rate of 0.00144 year−1, and the trend exhibited several fluctuations (Figure 3a). According to the result of the MK abrupt test (Figure 3b), the annual NDVI had two significant transition points in 2004 and 2005. The annual NDVI was very low with a value of 0.659 in 2005. In order to explore the decadal difference of the NDVI, this study divided the time series (1982–2015) into two periods (1982–2004; 2005–2015) based on the turning point 2004. The multiyear average NDVI was 0.6688 for the years before 2004 and 0.6955 for the years after 2004. However, the regional averaged annual NDVI did not show any significant trend during each separate period.
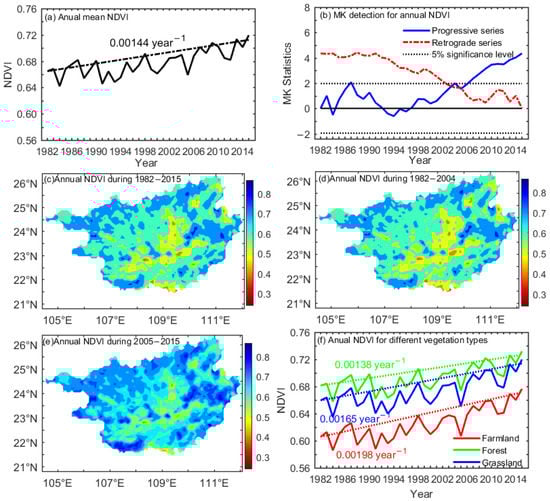
Figure 3.
Annual mean NDVI in Guangxi during 1982–2015 (a); the Mann–Kendall (MK) abrupt change detection for the annual NDVI during 1982–2015 (b); spatial distributions of the annual NDVI during 1982–2015, 1982–2004, and 2005–2015 (c–e); and annual mean NDVI for different vegetation types during 1982–2015 (f). Note: in (a,f), the solid line represents the observed NDVI, and the dotted line represents the fitted NDVI.
The spatial distributions of the NDVI were extremely heterogeneous (Figure 3c). Inevitably, they were partly affected by the remote sensing data sources and the calibration. The NDVI increased with altitude in some studied regions. The NDVI mostly ranged from 0.40 to 0.80, and the NDVI at around 0.60 occurred in most regions. The higher NDVI at 0.60 and above was basically distributed on the areas covered by forests and grasses. To further illustrate the change in spatial distributions, the spatial distributions of the NDVI were analyzed during each separate period. The spatial distributions of the NDVI during 1982–2004 (Figure 3d) and 2005–2015 (Figure 3e) were similar to those during the whole period. However, during the period 2005–2015, the NDVI in most regions was higher than that during the former period. The highest NDVI can reach 0.80 or above in some forest and grassland areas.
The regional averaged annual NDVI for the three vegetation types (farmlands, forests and grasslands) was demonstrated to further explore differences in the greenness in different vegetation areas (Figure 3f). Generally, the forest had the highest NDVI, whereas the farmland had the lowest in each year. The NDVI trends in the three vegetation areas showed several fluctuations, and they were similar to those of the whole Guangxi region. The annual NDVI of farmlands showed the highest increasing rate, whereas that of forests was the lowest. The MK abrupt test indicated that the annual NDVI also had two weak turning points (in 2004 and 2005) in forests and grasslands (Figure not shown). In addition, the annual NDVI in forests and grasslands also did not show any significant trend during each separate period.
Furthermore, the variation trend in NDVI values was extracted respectively in karst and non-karst areas (figure not shown). It was 0.00153 year−1 in karst areas, and 0.00150 year−1 in non-karst areas. It seems that there was a weak greening difference between karst and non-karst areas. However, the altitudes (including topographic configuration and atmospheric environment) can affect the NDVI values, which may weaken the influences on the NDVI trends originating from the karst landscape itself. The variation rate of the NDVI exhibited significant spatial differences (Figure 4). Overall, all vegetation mainly had greening trends during 1982–2015, and vegetation afforestation occurred in most areas of Guangxi (Figure 4a). In forests and grasslands, the greening rates were mostly around 0.0005–0.0015 year−1. The farmland showed higher greening rates, which were above 0.002 year−1 in some areas. About 83% of the experimental areas with vegetation afforestation passed the 0.05 significance test during 1982–2015 (Figure 4b).
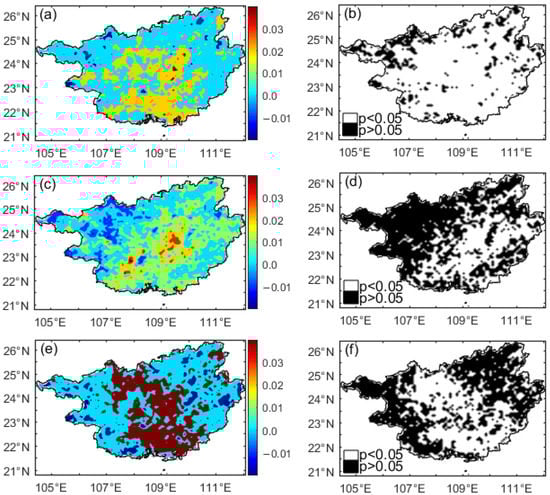
Figure 4.
Spatial distributions of the trend rates of the annual NDVI (unit: 10 × year−1) (a,c,e) and their significant tests (b,d,f) during 1982–2015, 1982–2004, and 2005–2015.
However, only about 40% of the total pixels passed the significance test during the first period of 1982–2004 (Figure 4d), and only about 50% passed the significance test during the second period of 2005–2015 (Figure 4f). In these two separate periods, the significant increasing rate of the NDVI only occurred in the central and southeast of Guangxi (Figure 4c,e). During the second period, the annual NDVI experienced a great increase in rate, as high as 0.003 year−1 in many of the central and eastern regions. The greening rate of the second period was higher than that in the first period, which indicated increased green vegetation in Guangxi after 2004. Since the NDVI variation rarely passed the significance test during each separate period, hereafter, this study focused on the analysis of the whole period of 1982–2015.
3.1.2. Trends of NDVI on a Seasonal Scale
The spatial distributions of the NDVI in each season were similar to those of the annual NDVI, with the NDVI mostly varying from 0.40 to 0.80 (Figure not shown). The winter NDVI was lower than that in other seasons over the whole study area. For the regional average, the highest NDVI appeared in autumn with a value of 0.738, whereas the lowest NDVI appeared in winter with a value of 0.618. The seasonal NDVI significantly increased in most regions during the past decades (Figure 5), and about 77% of the whole research area showed significant greening trends in spring, in contrast with around 50% of the area in other seasons. In spring, the trend rate of the NDVI showed the highest value and strongest spatial heterogeneity. It was as high as 0.0015 year−1 in most regions, especially farmland areas. In summer and winter, the trends showed relatively less inhomogeneity, with a greening rate of around 0.0005 year−1 in most areas. However, a remarkable greening rate occurred in some regions of central or eastern Guangxi, which was partly similar to that in spring. In contrast, the NDVI trends in autumn were uniformly distributed with a rate of mostly around 0.0005 year−1.
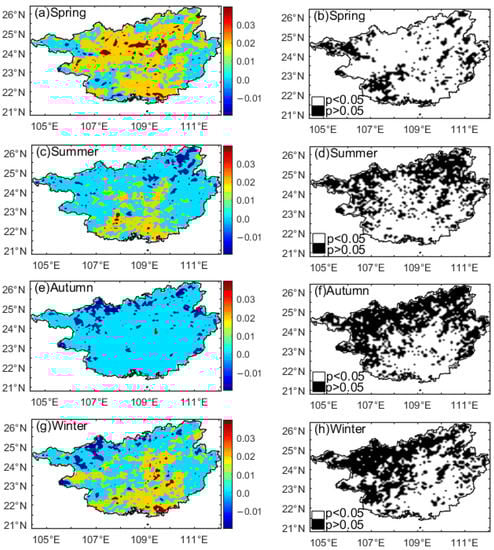
Figure 5.
Spatial distributions of the trend rates of the seasonal NDVI (unit: 10 × year−1) (a,c,e,g) and their significant test (b,d,f,h) during 1982–2015.
However, it is hard to distinguish the difference in the greening rate among the different vegetation types based on the above spatial distributions. Table 3 provides climate inclination rates of the regional averaged NDVI for the three vegetation types. The regional mean NDVI significantly increased in each season during the past decades. As for the whole Guangxi, the highest rate was 0.0021 year−1 in spring, followed by winter (0.0015 year−1), autumn (0.0011 year−1), and summer (0.0010 year−1). The farmland, forest and grassland generally showed similar trends to that of the whole Guangxi. The greening rate of farmlands was the highest in each season, whereas that of forests was the lowest.
Table 3.
Trend rates (unit: year−1) for the seasonal and monthly NDVI during 1982–2015.
3.1.3. Trends of NDVI in Each Month
The previous analysis provided an overall picture of the NDVI variations over Guangxi. This study further analyzed the NDVI on a monthly scale to represent the variation details. The monthly mean NDVI ranged from 0.57 to 0.75, with the highest value appearing in October and the lowest appearing in March. Generally, the mean NDVI showed an increasing trend from March to October and a decreasing trend after October, which clearly represents the general changes in vegetation dynamics. During the past few decades, the monthly NDVI also exhibited significant increasing trends in many months (Table 3). As for the whole Guangxi, the highest greening rate was 0.0030 year−1 in February, followed by 0.0023 year−1 in May, 0.0021 year−1 in April, and 0.0015 year−1 in July. In August, September, and November, the NDVI showed the same increasing rate of 0.0014 year−1, whereas it was relatively stable in other months. For the three vegetation types, the greening rates were also high in February, April, July, August and September. The greening rate of the farmland was relatively higher than that of the other two vegetation types in each month and, furthermore, peaked at a value of 0.0032 year−1 in February.
3.2. Correlations between NDVI and Climate Extremes
3.2.1. Correlations between Annual NDVI and Climate Extremes
In order to identify the main extreme indicators affecting vegetation in Guangxi, this study investigated potential connections between the annual NDVI and the extreme climatic indices by calculating the Pearson correlation coefficient (Table 4). On an annual scale, the NDVI was significantly and positively correlated with the extreme temperature indices, with the exclusion of TXn, DTR and GSL. Specifically, the correlation coefficient can be as high as 0.683, 0.641 and 0.705 for Tm, TXm and TNm, respectively. The coefficient was 0.630 for TNx, 0.605 for SU25 and 0.562 for TR25, whereas it was under 0.50 for TXx and TNn. The relationship between the annual NDVI and temperature extremes did not show much difference in farmlands, forests and grasslands. The correlation magnitudes were strong and comparable for the three vegetation types. However, the extreme precipitation indices, except SDII, did not show any significant connections with the NDVI in Guangxi. The correlation coefficient between SDII and NDVI was 0.472 in the whole Guangxi, and was a little higher in farmlands than in forests and grasslands. This finding indicates that the vegetation dynamics in Guangxi was not very sensitive to extreme precipitation on an annual scale.
Table 4.
Correlation coefficients between the regional mean NDVI and the extreme temperature (precipitation) indices on an annual scale during 1982–2015.
By choosing the six indices (Tm, TXm, TNm, SU25, TR25 and SDII) that possessed strong significant correlations with the regional average NDVI, this study further investigated the spatial patterns of the potential connections between the annual NDVI and climate extremes (Figure 6). For Tm, TXm, TNm and SU25, significant positive correlations with the annual NDVI were observed in more than 70% of the meteorological stations. As for Tm, TXm and TNm, the significant coefficient was 0.60 and above in many regions, whereas for SU25, high coefficients of 0.40 and above occurred in central Guangxi. However, for TR25 and SDII, only 50% of the meteorological stations showed the significant correlations with the NDVI. In regard to TR25, the significant coefficient was mostly scattered in some parts of western, eastern and southern Guangxi. With respect to SDII, only a few regions, mostly located in central-southern Guangxi, showed significant coefficients with a value around 0.40.
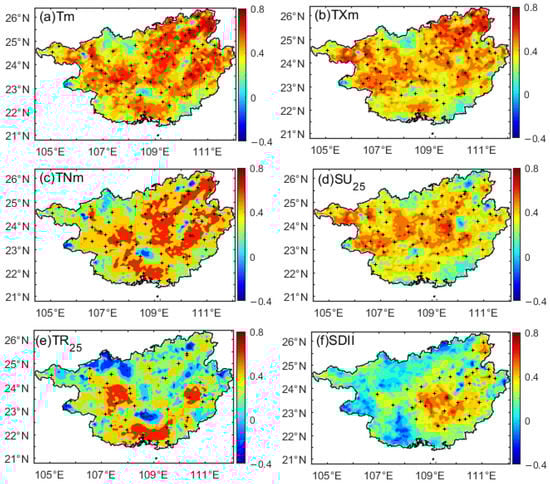
Figure 6.
Spatial distributions of the correlation coefficients between the annual NDVI and each temperature extreme index during 1982–2015: (a) Tm; (b) TXm; (c) TNm; (d) SU25; (e) TR25 and (f) SDII. Note: ‘+’ significant at p < 0.05.
3.2.2. Correlations between Seasonal/Monthly NDVI and Climate Extremes
The relationships between the regional mean NDVI and the extreme climatic indices were further calculated for different seasons and months (Table 5). The correlations for the three types of vegetation did not show much difference, and they were similar to those for the whole of Guangxi. Thus, the coefficients for the three vegetation types are not presented in Table 5. The relationships indicated strong temporal-scale differences. In both spring and summer, the NDVI was significantly and positively correlated with most of the extreme temperature indices, which was also similar to that on an annual scale. In winter, the NDVI was only significantly correlated with Tm, TXm and TNx. Some coefficients were above 0.50 in spring, whereas they were mostly around 0.35–0.45 in summer and winter. Nevertheless, the NDVI did not significantly correlate with any extreme index in autumn, and it did not have any significant connections with TXn and TNn in all seasons.
Table 5.
Correlation coefficients between the regional mean NDVI and the extreme temperature (precipitation) indices on a seasonal/ monthly scale during 1982–2015.
On a monthly scale, the NDVI was significantly correlated with some extreme temperature indices in some months, mainly including Tm, DTR and three extreme high-temperature indices (TXm, TXx and TNx). The significant and positive correlations were mainly distributed in January, February, March, June, July and August, whereas no significant relationship was observed in May, September, November or December. Additionally, among all the indices, the NDVI was only significantly correlated with TXm and DTR in April, and with DTR in October. The NDVI did not have any significant connections with TXn and TNn in each month, which was similar to that on a seasonal scale.
As for the extreme precipitation indices, the seasonal NDVI only displayed a significant and positive correlation with SDII in spring. The NDVI also rarely had a significant relationship with the precipitation indices in each month, with the exception of a few months. In June, the NDVI was negatively correlated with all the precipitation indices, and the correlation coefficients were around −0.40. It is worth noting that the NDVI was negatively correlated with PRCPTOT in all summer months (June, July and August). Additionally, the NDVI had a significant and negative correlation with precipitation extremes in February.
3.3. Time Lags of NDVI Responses to Climate Extremes
The climatic factors may have delayed effects on vegetation. This study further investigated the time lags of the NDVI responses to extreme climatic indices based on the lag correlation analysis (Table 6). The numbers 0, 1, 2 and 3 represent the number of lag months. The correlation coefficients were much weaker if the time lags were more than three months. Thus, the coefficients with time lags more than three months are not shown in Table 6. The time lags for the three vegetation types are not presented as they were also similar to those for the whole of Guangxi.
Table 6.
Correlation coefficients between the regional mean NDVI and the extreme temperature (precipitation) indices for different time lags during 1982–2015.
The coefficients were as high as 0.80 when the NDVI lagged the extreme temperature indices by 1–2 months, and they were mostly around 0.60 when the NDVI lagged the extreme precipitation indices by 2–3 months. For the extreme temperature indices, with the exclusion of DTR, TXx and TNx, the time lag of the NDVI responses was one month. However, the NDVI response to DTR did not have any time lags, and the NDVI response to TXx and TNx displayed a two-month time lag. These results partly suggest that there was an unequal time lag in the NDVI responses to the extreme high-temperature indices versus those to the low-temperature indices. For the precipitation extremes, the time lags of the NDVI responses were mostly two months. Therefore, the influence of the extreme temperature indices on vegetation lasted for a shorter period than that of the precipitation indices for one month.
Figure 7 and Figure 8 illustrate the spatial distributions of the time lag to further explore the spatial heterogeneity of the vegetation responses. For Tm, TXm, TNm, TXn and TNn (Figure 7), the vegetation responses showed a lag of one month in the most regions of Guangxi (50.0–73.0% of the total area), and sometimes showed a lag of two months in parts of the western and eastern regions (23.0–47.0% of the global grids). The delayed responses of the NDVI to DTR only occurred in a small area. With regard to the vegetation responses to the two high-temperature indices (TXx and TNx), the areas covered by a two-month delay (60.6% and 51.0%, respectively) accounted for a larger proportion than those covered by a one-month delay (37.3% and 47.3%, respectively). As for the time-lag effects of TXx and TNx, their spatial distributions were different from those of other indices, which was similar to the corresponding result on a regional mean. The unequal lagged effects of high-temperature and low-temperature extremes on terrestrial vegetation growth particularity occurred in some western and eastern regions. Nevertheless, the asymmetric responses of vegetation to the high and low temperatures were not very distinguished in Guangxi.
Figure 7.
Spatial distributions of the time-lagged response of the NDVI to the temperature extremes: (a) Tm; (b) TXm; (c) TNm; (d) DTR; (e) TXx; (f) TNx; (g) TXn and (h) TNn. Note: ‘0’ NDVI and extreme climate indices were collected over the same period; ‘1–3’ NDVI lagged the extreme indices by 1–3 months. This study conducted four correlation analyses (namely, no lag, 1 month, 2 months, and 3 months), and the results of the four times were then superimposed to take the maximum value.
Figure 8.
Spatial distributions of the time-lagged response of the NDVI to the precipitation extremes: (a) Rx1day; (b) Rx5day; (c) SDII; and (d) PRCPTOT. Note: ‘0’ NDVI and extreme climate indices were collected over the same period; ‘1–3’ NDVI lagged the extreme indices by 1–3 months. This study conducted four correlation analyses (namely, no lag, 1 month, 2 months, and 3 months), and then superimposed the results of the four times to take the maximum value.
The delayed responses of vegetation to the precipitation indices were also spatially heterogeneous in Guangxi (Figure 8). The time lag of the NDVI responses to precipitation extremes was mostly one month in some parts of western Guangxi, whereas the lags were two or three months in the central-eastern region. For Rx1day, the grids with a lag of two months accounted for 41.9% of the global grid, those with a lag of three months accounted for 34.0%, and those with a lag of one month constituted 23.5%. For SDII, the grids with a lag of one month accounted for 40.4% of the global grid and those with a lag of two months accounted for 38.8%. For Rx5day and PRCPTOT, the grids covered by a three-month lag accounted for about 50.0% of the global grid, and those covered by a two-month lag accounted for around 35.0%. Generally speaking, most terrestrial vegetation growth was inclined to respond to Rx1day, Rx5day and PRCPTOT with time-lag effects up to 2–3 months, but to SDII with 1–2 month time-lag effects. By comparing the distributions of land use and land cover classes (Figure 1) with those of the above lag results (Figure 7 and Figure 8), this study did not find a very obvious dependence of the time lag on land types.
4. Discussion
4.1. Variations in Vegetation Dynamics
During 1982–2015, a significant increasing trend in vegetation greenness was detected in Guangxi not only on an annual scale, but also on seasonal and monthly scales. The trends in the variation of terrestrial vegetation indicated obvious spatial heterogeneity, but all types of vegetation mainly had greening trends in Guangxi, with farmland showing the highest rate and forest showing the lowest. By comparing the spatial distributions of land types (Figure 1) with these of the annual NDVI (Figure 9a,b) for the two key moments, it is also clear that most vegetation areas witnessed a greening trend, especially in farming areas. As for the annual NDVI in Guangxi, our results revealed that the increasing rate was 0.00144 year−1 from 1982 to 2015. The greening rate in Guangxi was much higher than that in all of China (0.0006 year−1) [20,21]. It also exceeded the increases in the Yangtze River Basin (0.001 year−1) [14,17] and Xinjiang (0.0003 year−1) [22]. Conversely, the greening rate in Guangxi was much lower than that on the Loess Plateau (0.0025 year−1) [13]. The diverse greening rate of vegetation over different regions further suggested the spatial heterogeneity of the vegetation variation.
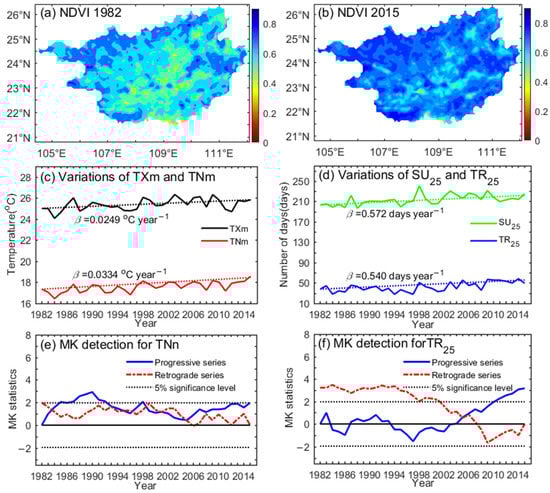
Figure 9.
Spatial distributions of the annual NDVI in 1982 (a); spatial distributions of the annual NDVI in 2015 (b); inter-annual variations of TXm and TNm (c); inter-annual variations of SU25 and TR25 (e); the Mann–Kendall (MK) abrupt change detection for TNn (e); and the Mann–Kendall (MK) abrupt change detection for TR25 (f). Note: in (c,d), the solid line represents the observed data, and the dotted line represents the fitted data.
In Guangxi, the regional temperature indices generally had the similar increasing trend as that of the regional averaged NDVI on an annual scale (Figure 9c,d). The MK abrupt test for the climate indices found that many temperature indices also had turning points around the year 2005 (Figure 9e,f: taking the minimum temperature and tropical nights as the two examples), which was similar to the case of annual NDVI. Thus, the extremely low NDVI in 2005 may be attributed to the negative effects of the great warming. The regional mean NDVI showed increasing trends in each season over Guangxi. However, according to Cui et al. (2018) [46], the NDVI showed different trends in different seasons over some other parts of China during previous decades. This may indicate the dependence of the NDVI variation on geographical location and spatial-scale effects. In Guangxi, the vegetation in spring had a greater greening rate than in the other seasons, which is similar to the result on the national scale [21]. However, the spring NDVI in Guangxi showed a much higher increasing rate, compared with that in all of China [21]. The long-term variation in the monthly NDVI was also highly uneven. Therefore, our work focusing on a multiple time scale analysis is extremely helpful for understanding the time inhomogeneity of the vegetation variations.
4.2. Correlations between Vegetation and Climate Extremes
The vegetation–climate interactions are highly heterogeneous [7,26]. Knowledge of the relationship between vegetation and climate extremes would be useful for evaluating the vulnerability and resilience of vegetation to climate extremes [31,52]. From 1982 to 2015, the annual NDVI in Guangxi generally showed strong and positive correlations with most of the extreme temperature indices, which was consistent with many previous results [12,28,30,31]. Figure 10 illustrates the trend rates of some of the representative annual indices during 1982–2015. In most areas of Guangxi, the maximum and minimum temperatures increased with a rate above 0.02 °C year−1, and summer days increased with a rate around 0.50 days year−1 (Figure 10). Wang et al. (2021) [6] found that the most recent 20-year period (after 2000) experienced greater warming than previous periods, and low-temperature extreme warming was usually greater than high-temperature extreme warming during the past 58 years. Furthermore, by comparing Figure 6 with Figure 10, it is obvious that the strong correlations between the temperature indices and vegetation mostly occurred in the areas where the warming rate was high. These indicate that the increasing extreme temperature mostly exerted a positive effect on plant growth in Guangxi.
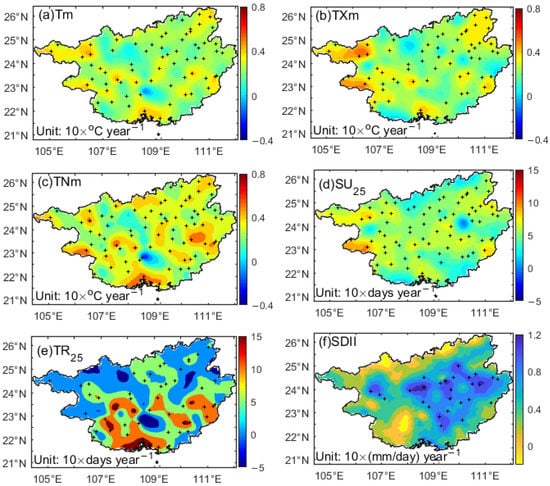
Figure 10.
Spatial distributions of the trend rates of the annual climate indices during 1982–2015: (a) TXm, (b) TNm, (c) TXx (unit: 10 × °C year−1); (d) SU25, (e) TR25 (unit: 10 × days year−1) and (f) SDII (unit: 10 × (mm/day) year−1). Note: ‘+’ significant at p < 0.05.
Having a large area and vegetation diversity, China presented large northwest–southeast differences in its vegetation greenness (Figure 11). The multiyear mean of the annual NDVI was mostly around or above 0.5 in southeastern regions in China, such as Guangxi, whereas it was mostly under 0.3 in northwestern China, which has a low vegetation cover rate. As vegetation is a pivotal link between the atmosphere and the land’s surface, the inhomogeneity of vegetation activity can enhance the spatial heterogeneity of the vegetation responses to different climate extremes. Extreme temperature mostly has a very extensive and complex effect on vegetation in China [12,18,25]. High temperature can enhance the evaporation [53] and reduce soil moisture [25,31], which increases the soil drought conditions. Thus, the increasing high temperature may tend to preclude vegetation growth in the north of China [12,18]. Nevertheless, there are relatively flourishing vegetation and abundant precipitation resources in Guangxi, and the abundant precipitation would mitigate the negative effects of increasing high-temperature indices to a certain degree.
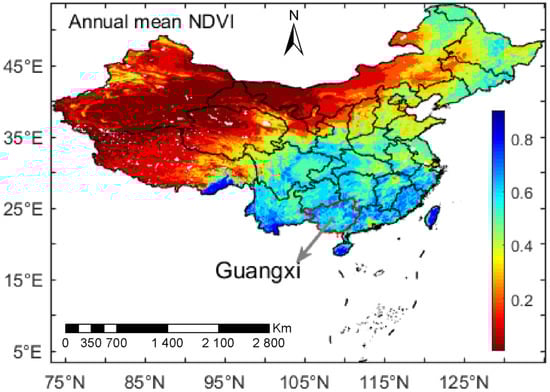
Figure 11.
The mean of the annual NDVI in China during 1982–2015.
Vegetation has different mechanisms in responding to the low-temperature and high-temperature indices [25,31]. Low temperatures elongate the plant growing season [54] and enrich the soil nutrients [55]. These mechanisms might partly explain the positive correlations between the annual NDVI and the low-temperature indices over Guangxi. In addition, with obvious differences from the high-temperature indices, some low-temperature indices did not have any significant relations with the NDVI in each season and month, which further indicated the non-uniform responses of terrestrial vegetation growth to the high-temperature and low-temperature indices at the local scale. Furthermore, the correlations between the NDVI and the extreme temperature indices varied seasonally and monthly in Guangxi. The positive correlations between the NDVI and the high-temperature indices were strongest in spring, followed by summer and winter, but they were not significant at all in autumn. This seasonal distinction of the correlations in Guangxi is highly different from that at the northern hemisphere scale, where the strongest negative correlations between the mean maximum temperature and NDVI were observed in the summer of temperate dry regions [23].
At the seasonal and monthly scales, the temperature indices showed increasing trends in many months, with remarkable seasonal and monthly differences (Figure 12: taking February and June as the two representative months). This study found that February witnessed the greatest warming rate. In February, the increasing rates of the mean temperature, maximum temperature and minimum temperature were 0.0935, 0.120 and 0.0765 °C year−1, respectively, whereas they were generally under 0.050 °C year−1 in other months. High temperatures in spring provide suitable temperatures for vegetation growth. Conversely, extreme high temperatures in summer may exceed ideal growing conditions of vegetation, and lead to increased evaporation and decreased soil moisture [25,31]. All of these factors may sometimes restrain the vegetation photosynthesis to a certain degree [55], and therefore weaken the positive effects of high temperatures on the NDVI in summer. In winter, the coverage of vegetation may decrease partly due to its phenological characteristics rather than climate change. Therefore, the correlations were relatively weaker in winter. By comparing the correlation coefficients between temperature extremes and vegetation at different temporal scales, we can find that the correlations were relatively strongest on an annual scale, and were weakest on a monthly scale.
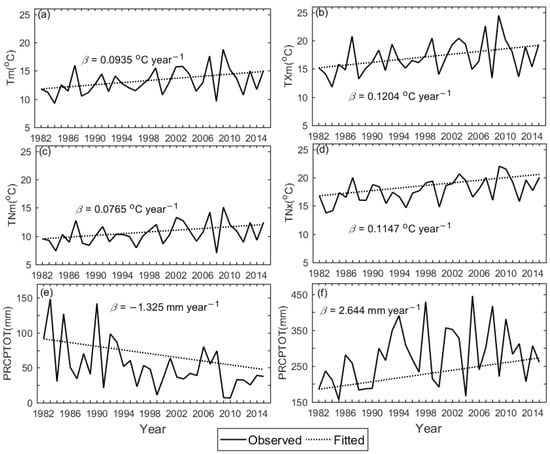
Figure 12.
The interannual variation in the monthly climate indices during1982–2015: (a) Tm in February, (b) TXm in February, (c) TNm in February, (d) TNx in February, (e) PRCPTOT in February and (f) PRCPTOT in June. Note: the solid line represents the observed data, and the dotted line represents the fitted data.
Located in southern China and close to the South Sea, Guangxi has an annual precipitation of above 1500 mm based on the multiyear mean. The extreme precipitation indices rarely changed significantly over previous decades, with the exception of the simple daily intensity index. The simple daily intensity only significantly increased in some southeastern regions accounting for 32% of Guangxi (Figure 10f). Among all the precipitation indices, the NDVI only displayed a significantly and positively weak correlation with the simple daily intensity on an annual scale, and in spring on a seasonal scale. By comparing Figure 6f with Figure 10f and Figure 1, it can be found that the weak positive correlations mainly occurred in the area with low elevation and significant increases in precipitation. This is probably because low elevation is less prone to cause water loss and soil erosion, further promoting vegetation growth. Generally speaking, the greening vegetation was relatively non-sensitive to the extreme precipitation indices. This finding of the precipitation effects on vegetation in Guangxi differs significantly from those in northern arid and semi-arid regions where precipitation is limited and drought is a great threat to vegetation [18,21,27,56].
Analyzing the vegetation responses on a monthly scale helps to better understand the main limiting factors for vegetation growth in different growth periods [28]. The NDVI was negatively correlated with all the precipitation indices in June and with the two indices in February. Additionally, the NDVI was negatively correlated with the total wet-day precipitation in all summer months (June, July and August). This phenomenon on a monthly scale indicates that extreme precipitation will restrain vegetation growth in February and summer months, which cannot be reflected at annual and seasonal scales. Based on the analysis at a monthly scale, this study further found that the total wet-day precipitation significantly decreased at a rate of 1.325 mm year−1 in February, whereas it significantly increased at a rate of 2.644 mm year−1 in June from 1982 to 2015 (Figure 12e,f). Thus, the plant’s growth in February was prevented by lack of water in addition to low soil moisture. Karst areas have low water-soil retaining ability, so the short-term precipitation increase in summer months can cause soil and water losses, further stunting plant growth. The influences of extreme indices on vegetation in different growing periods are better reflected at a monthly scale, which further suggests time-scale effects on the relationship between precipitation extremes and vegetation dynamics.
The above results indicate that the variations in vegetation dynamics were mostly determined by temperature extremes rather than precipitation extremes, and the strengthened vegetation activities can be associated with enhanced extreme temperatures in Guangxi. Regarding the intensity and range of the extreme climate effects on vegetation dynamics in China, Li et al. (2021) [18] categorized these impacts into five types: the humidity-promoting type, the cold-promoting and drought-inhibiting compound type, the drought-inhibiting type, the heat-promoting and humidity-promoting compound type, and the heat-promoting and drought-inhibiting compound type. However, most of Guangxi belongs only to the heat-promoting type. Overall, although the vegetation responses to climate extremes showed great temporal heterogeneity at the different time scales, the effects of extreme climate on vegetation cannot be totally disentangled from the baseline effect of climate on a time series.
4.3. Lagged Responses of Vegetation to Extreme Climates
The influences of climate factors on vegetation often show a time lag because of lags in the adjustment of the soil moisture content and biological processes [29,30]. Many studies have shown that the antecedent ambient temperature has remarkable impacts on vegetation growth [20,30,52], which was confirmed in the present study. The lagged responses of vegetation to the extreme climatic indices differed in different regions and at different scales over Guangxi.
Generally speaking, the responses of vegetation to most temperature extremes lagged for at least one month, whereas the responses to precipitation extremes lagged for at least two months. The lagged responses of vegetation to the extreme temperature indices were generally around one month earlier than those to the precipitation indices. This result is similar to that in the Poyang Lake Basin [31], but different those in some other areas or large regions [12,28]. For example, on the Inner Mongolian Plateau, the vegetation dynamics are connected with extreme temperature indices by a time lag of at least three months, and with extreme precipitation indices by a two-month lag [12]. The impact of extreme temperatures on vegetation showed a time lag of at least one month, but the responses of maximum NDVI to extreme precipitation parameters indicated no lags in Central Asia [28]. There is a lag of approximately one month in the vegetation dynamic response to soil moisture [57], which explains the particular lag in the vegetation responses to most extreme temperature variations in Guangxi and Central Asia. The vegetation responses to some high-temperature indices displayed a two-month time lag, and had a longer time lag of one month compared to the responses to the extreme low-temperature indices. Thus, the same vegetation type sometimes showed asymmetric lag responses to the high-temperature indices versus the low-temperature indices in Guangxi, which is partly similar to the result from Wen et al. (2019) [32].
In addition, Guangxi witnessed the spatial heterogeneities in the vegetation responses to different extreme climate indices. The impacts of most of the extreme temperature indices on vegetation indicated a lag of one month in most of Guangxi, and sometimes exhibited a lag of two months. The time lag from the extreme precipitation indices were spatially more uneven, varying between one month and three months. Many studies have indicated that the effects of climate change on vegetation dynamics are spatially heterogeneous [7,13,14,17,58], and the driving factors are the geographical location, vegetation types, topography, etc. [26]. Vegetation type is an important factor in determining the time-lag effects and the strength of the correlations between vegetation dynamics and extreme climate indices in many regions [12,18,28,30,31,42,58]. However, by comparing the spatial patterns of the correlations and time lags under the different land cover types, this study found that there were no obvious differences in the correlations and time lags among farmlands, forests and grasslands, suggesting that the vegetation type itself may not have made a big difference in the vegetation responses to climate extremes in Guangxi. This is partly consistent with the results in China at a national scale [21].
Past studies were frequently performed only on one time scale. Instead, multi-time scale analysis is an effective approach to understanding how vegetation will respond to global climate change. This study can help find effective preventive measures to preserve the ecosystem in Guangxi. Local authorities should pay attention to taking adaptive mitigation measures in advance to prevent the potential negative effects of temperature extremes, as the future temperature may often exceed ideal growth conditions for vegetation if extreme temperatures continue to rise significantly. Local authorities also should formulate appropriate measures to reduce the negative effects caused by drought in February and by flood in summer months (especially in June). Drought-resistant and water-resistant vegetation should be introduced in a timely manner. With regard to agriculture, adequate irrigation and film-mulching treatments are necessary for drought control and resistance, and timely water drainage is necessary for flood resistance.
4.4. Limitations and Uncertainties
Many previous studies have validated the GIMMS NDVI data [42,43,44], and have pointed out that the GIMMS NDVI data are reliable for sensing the green vegetation and monitoring its long-term trends and activities [17,40,45,46]. Thus, the GIMMS NDVI data were directly used in this study without being calibrated with other independent NDVI datasets. Although the results obtained from this study were thought to be reliable, there were limitations to and uncertainties in the approach. Firstly, the GIMMS NDVI data are indirect remote sensing data simulated by the model. Their accuracy is limited to the satellite sensor sensitivity [59]. The remote sensing NDVI is susceptible to clouds, water vapor and dust aerosol pollution, and is easily saturated in areas of high-density vegetation when the vegetation cover reaches a certain high level [36,60]. This over-saturated problem leads to underestimating the greenness of vegetation in some study regions. Furthermore, despite the GIMMS NDVI data being corrected to minimize non-vegetation effects, the NDVI index itself cannot provide enough information on the vegetation and species composition [35]. There may be some errors in the modeled NDVI in karst areas dominated by hills, especially the highly fragmentized terrain with bare soil and rock outcrops. These will result in further uncertainties in the relationship between the NDVI and climatic variables.
Secondly, some uncertainties in the correlations existed because of the coarse spatial resolution of the NDVI and climate data. There were uncertainties when the climatic parameters of the meteorological stations were resampled based on the spatial resolution of the GIMMS NDVI data. The uncertainties can be minimized by field studies combined with the temporal remote sensing data of higher resolution imagery in follow-up work. In addition, the aim of this study was to systematically evaluate the influence characteristics of extreme climate on vegetation, and therefore a discussion of human influence was not included. However, in order to reduce soil erosion and improve ecological conditions, China has implemented several vegetation restoration and reforestation projects (e.g., the Natural Forest Protection Project, the Grain for Green project, and Karst Rocky Desertification Comprehensive Control and Restoration Project) initiated around 2000 [34]. These afforestation plans that have been carried out can result in a vegetation increase in some karst areas.
Long periods of time exposure to climate extremes may lead to vegetation vulnerability. Admittedly, the present study did not take into account the interaction between different climate extremes and other factors or the occurrence of different effects. Furthermore, some vegetation will become weaker or even die, whereas other vegetation may adapt to extreme climate by changing its own physiological and biochemical reactions or by modifying its own living conditions [61], and it can have feedback to the climate system [17]. This study did not strictly consider the environmental effect of the vegetation dynamics, which should be enhanced in the future for better understanding of this influence on our results. Therefore, examination of the vegetation–climate interactions still faces many challenges, and will require continued in-depth research in the future.
5. Conclusions
By means of the Normalized Difference Vegetation Index (NDVI) to capture vegetation activities, the study tried to use a multi-time scale (annual, seasonal and monthly) analysis to investigate the effects of climate extremes on vegetation from 1982 to 2015 in Guangxi. The main findings are listed as follows:
- (1)
- The variation rates of NDVI highly differed at different time scales. The annual NDVI significantly increased at a rate of 0.00144 year−1. The greening trend was strongest in spring, followed by winter, autumn and summer. On a monthly scale, the remarkable greening trends occurred in February, May and April.
- (2)
- The effects of extreme climate on vegetation cannot be disentangled from the baseline effect of climate on a time series. The enhanced temperature extremes had positive and strong correlations with green vegetation on an annual scale. With a great seasonal and monthly heterogeneity, the significant positive correlations mostly occurred only in January, February, March, and summer months. Precipitation extremes only had significant and negative relations with vegetation in February and summer months.
- (3)
- The responses of vegetation to climate extremes showed a great spatial heterogeneity, but they showed no significant differences among farmlands, forests and grasslands. The vegetation generally responded to temperature extremes with a time lag of at least one month, and there was mostly a two-month lag relative to precipitation extremes.
Nevertheless, it is essential to realize the limitations of the satellite NDVI data and the resolution gap between the NDVI and climate data. This study highlights the necessity to use a multi-time scale analysis. The detailed analysis can help better understand the response mechanism of vegetation dynamics to extreme climate and improve the investigation of vegetation–climate interactions. This study can help decision makers identify the practical issues facing regional management systems in Guangxi. Local authorities should take adaptive mitigation measures in advance to prevent the negative effects caused by enhanced temperature extremes in the future. Local authorities and farmers also should be alert to both the adverse effects of drought in February and those of flood in summer months. For example, it would be helpful to introduce drought-resistant and water-resistant vegetation in a timely manner.
Author Contributions
Conceptualization, L.W. and F.H.; methodology, L.W. and F.H.; validation, Y.M. and C.Z.; formal analysis, L.Z.; investigation, Y.M. and C.Z.; data curation, L.W. and F.H.; writing—original draft preparation, L.W. and F.H.; writing—review and editing, Y.M., C.Z., L.Z. and M.L.; visualization, F.H.; supervision, L.W.; project administration, L.W.; funding acquisition, L.W. All authors have read and agreed to the published version of the manuscript.
Funding
This research was funded by the National Natural Science Foundation of China (Grant No. 42005142).
Institutional Review Board Statement
Not applicable.
Informed Consent Statement
Not applicable.
Data Availability Statement
All the data are available in the public domain at the links provided in the texts.
Acknowledgments
Thanks to the China Meteorological Administration (CMA) for providing the meteorological data. Thanks to all editors and commenters.
Conflicts of Interest
The authors declare no conflict of interest.
References
- Wang, X.; Piao, S.; Ciais, P.; Li, J.; Friedlingstein, P.; Koven, C.; Chen, A. Spring temperature change and its implication in the change of vegetation growth in North America from 1982 to 2006. Proc. Natl. Acad. Sci. USA 2011, 108, 1240–1245. [Google Scholar] [CrossRef] [Green Version]
- Schlesinger, W.H.; Jasechko, S. Transpiration in the global water cycle. Agric. For. Meteorol. 2014, 189, 115–117. [Google Scholar] [CrossRef]
- Yin, Z.; Dekker, S.; van den Hurk, B.; Dijkstra, H. Effects of vegetation structure on biomass accumulation in a Balanced Optimality Structure Vegetation Model (BOSVM v1. 0). Geosci. Model Dev. 2014, 7, 821–845. [Google Scholar] [CrossRef] [Green Version]
- Sun, Y.; Zhang, X.B.; Zwiers, F.W.; Song, L.C.; Wan, H.; Hu, T.; Yin, H.; Ren, G. Rapid increase in the risk of extreme summer heat in eastern China. Nat. Clim. Chang. 2014, 4, 1082–1085. [Google Scholar] [CrossRef]
- Shi, J.; Cui, L.; Wen, K.; Tian, Z.; Wei, P.; Zhang, B. Trends in the consecutive days of temperature and precipitation extremes in China during 1961–2015. Environ. Res. 2018, 161, 381–391. [Google Scholar] [CrossRef]
- Wang, L.; Hu, F.; Hu, J.; Chen, C.; Liu, X.; Zhang, D.; Chen, T.; Miao, Y.; Zhang, L. Multistage spatiotemporal variability of temperature extremes over South China from 1961 to 2018. Theor. Appl. Climatol. 2021, 146, 243–256. [Google Scholar] [CrossRef]
- Vicente-Serrano, S.M.; Gouveia, C.; Camarero, J.J.; Beguería, S.; Trigo, R.; Lópezmoreno, J.I.; Azorínmolina, C.; Pasho, E.; Lorenzolacruz, J.; Revuelto, J. Response of vegetation to drought time-scales across global land biomes. Proc. Natl. Acad. Sci. USA 2013, 110, 52–57. [Google Scholar] [CrossRef] [Green Version]
- Rammig, A.; Wiedermann, M.; Donges, J.F.; Babst, F.; Von Bloh, W.; Frank, D.; Thonicke, K.; Mahecha, M.D. Coincidences of climate extremes and anomalous vegetation responses: Comparing tree ring patterns to simulated productivity. Biogeosciences 2015, 12, 373–385. [Google Scholar] [CrossRef] [Green Version]
- Dubovyk, O.; Landmann, T.; Dietz, A.; Menz, G. Quantifying the impacts of environmental factors on vegetation dynamics over climatic and management gradients of Central Asia. Remote Sens. 2016, 8, 600. [Google Scholar] [CrossRef] [Green Version]
- Wen, Z.; Wu, S.; Chen, J.; Lü, M. NDVI indicated long-term interannual changes in vegetation activities and their responses to climatic and anthropogenic factors in the Three Gorges Reservoir Region, China. Sci. Total Environ. 2017, 574, 947–959. [Google Scholar] [CrossRef]
- Li, C.; Leal Filho, W.; Wang, J.; Yin, J.; Fedoruk, M.; Bao, G.; Bao, Y.; Yin, S.; Yu, S.; Hu, R. An assessment of the impacts of climate extremes on the vegetation in Mongolian Plateau: Using a scenarios-based analysis to support regional adaptation and mitigation options. Ecol. Indic. 2018, 95, 805–814. [Google Scholar] [CrossRef]
- Li, C.; Wang, J.; Hu, R.; Yin, S.; Bao, Y.; Ayal, D.Y. Relationship between vegetation change and extreme climate indices on the Inner Mongolia Plateau, China, from 1982 to 2013. Ecol. Indic. 2018, 89, 101–109. [Google Scholar] [CrossRef]
- Zhao, L.; Dai, A.; Dong, B. Changes in global vegetation activity and its driving factors during 1982–2013. Agric. For. Meteorol. 2018, 249, 198–209. [Google Scholar] [CrossRef]
- Zhang, W.; Wang, L.; Xiang, F.; Qin, W.; Jiang, W. Vegetation dynamics and the relations with climate change at multiple time scales in the Yangtze River and Yellow River Basin, China. Ecol. Indic. 2020, 110, 105892. [Google Scholar] [CrossRef]
- Piao, S.L.; Nan, H.J.; Huntingford, C. Evidence for a weakening relationship between interannual temperature variability and northern vegetation activity. Nat. Commun. 2014, 5, 5058. [Google Scholar] [CrossRef] [Green Version]
- Liu, Y.; Liu, X.; Hu, Y.; Li, S.; Peng, J.; Wang, Y. Analyzing nonlinear variations in terrestrial vegetation in China during 1982–2012. Environ. Monit. Assess. 2015, 187, 722. [Google Scholar] [CrossRef]
- Cui, L.; Wang, L.; Qu, S.; Singh, R.P.; Lai, Z.; Yao, R. Spatiotemporal extremes of temperature and precipitation during 1960–2015 in the Yangtze River Basin (China) and impacts on vegetation dynamics. Theor. Appl. Climatol. 2019, 136, 675–692. [Google Scholar] [CrossRef]
- Li, S.; Wei, F.; Wang, Z.; Shen, J.; Liang, Z.; Wang, H.; Li, S. Spatial heterogeneity and complexity of the impact of extreme climate on vegetation in China. Sustainability 2021, 13, 5748. [Google Scholar] [CrossRef]
- Schuldt, B.; Buras, A.; Arend, M.; Vitasse, Y.; Beierkuhnlein, C.; Damm, A.; Gharun, M.; Grams, T.E.; Hauck, M.; Hajek, P.; et al. A first assessment of the impact of the extreme 2018 summer drought on Central European forests. Basic Appl. Ecol. 2020, 45, 86–103. [Google Scholar] [CrossRef]
- Xu, G.; Zhang, H.; Chen, B.; Zhang, H.; Innes, J.L.; Wang, G.; Yan, J.; Zheng, Y.; Zhu, Z.; Myneni, R.B. Changes in vegetation growth dynamics and relations with climate over China landmass from 1982 to 2011. Remote Sens. 2014, 6, 3263–3283. [Google Scholar] [CrossRef] [Green Version]
- Liu, Y.; Lei, H. Responses of natural vegetation dynamics to climate drivers in China from 1982 to 2011. Remote Sens. 2015, 7, 10243–10268. [Google Scholar] [CrossRef] [Green Version]
- Du, J.; Shu, J.; Yin, J.; Yuan, X.; Jiaerheng, A.; Xiong, S.; He, P.; Liu, W. Analysis on spatio-temporal trends and drivers in vegetation growth during recent decades in Xinjiang, China. Int. J. Appl. Earth Obs. 2015, 38, 216–228. [Google Scholar] [CrossRef]
- Tan, J.; Piao, S.; Chen, A.; Zeng, Z.; Ciais, P.; Janssens, I.A.; Mao, J.; Myneni, R.; Peng, S.; Peñuelas, J.; et al. Seasonally different response of photosynthetic activity to daytime and night-time warming in the Northern Hemisphere. Glob. Chang. Biol. 2014, 21, 377. [Google Scholar] [CrossRef]
- John, R.; Chen, J.; Ou-Yang, Z.-T.; Xiao, J.; Becker, R.; Samanta, A.; Ganguly, S.; Yuan, W.; Batkhishig, O. Vegetation response to extreme climate events on the Mongolian Plateau from 2000 to 2010. Environ. Res. Lett. 2013, 8, 035033. [Google Scholar] [CrossRef]
- Peng, S.; Piao, S.; Ciais, P.; Myneni, R.; Chen, A.; Chevallier, F.; Dolman, A.J.; Janssens, I.A.; Peñuelas, J.; Zhang, G.; et al. Asymmetric effects of daytime and night-time warming on Northern Hemisphere vegetation. Nature 2013, 501, 88–94. [Google Scholar] [CrossRef]
- Hua, W.; Chen, H.; Zhou, L.; Xie, Z.; Qin, M.; Li, X.; Ma, H.; Huang, Q.; Sun, S. Observational Quantification of Climatic and Human Influences on Vegetation Greening in China. Remote Sens. 2017, 9, 425. [Google Scholar] [CrossRef] [Green Version]
- Zhang, Q.; Kong, D.D.; Singh, V.P.; Shi, P.J. Response of vegetation to different time-scales drought across China: Spatiotemporal patterns, causes and implications. Global Planet. Chang. 2017, 152, 1–11. [Google Scholar] [CrossRef] [Green Version]
- Luo, M.; Sa, C.; Meng, F.; Duan, Y.; Liu, T.; Bao, Y. Assessing extreme climatic changes on a monthly scale and their implications for vegetation in Central Asia. J. Clean. Prod. 2020, 271, 122396. [Google Scholar] [CrossRef]
- Piao, S.; Mohammat, A.; Fang, J.; Cai, Q.; Feng, J. NDVI-based increase in growth of temperate grasslands and its responses to climate changes in China. Glob. Environ. Chang. 2006, 16, 340–348. [Google Scholar] [CrossRef]
- Wu, D.; Zhao, X.; Liang, S.; Zhou, T.; Huang, K.; Tang, B.; Zhao, W. Time-lag effects of global vegetation responses to climate change. Glob. Chang. Biol. 2015, 21, 3520–3531. [Google Scholar] [CrossRef]
- Tan, Z.Q.; Tao, H.; Jiang, J.H.; Zhang, Q. Influence of climate extremes on NDVI (Normalized Difference Vegetation Index) in the poyang lake basin, China. Wetlands 2015, 35, 1033–1042. [Google Scholar] [CrossRef]
- Wen, Y.; Liu, X.; Yang, J.; Lin, K.; Du, G. NDVI indicated inter-seasonal non-uniform time-lag responses of terrestrial vegetation growth to daily maximum and minimum temperature. Global Planet. Chang. 2019, 177, 27–38. [Google Scholar] [CrossRef]
- Pan, N.; Feng, X.; Fu, B.; Wang, S.; Ji, F.; Pan, S. Increasing global vegetation browning hidden in overall vegetation greening: Insights from time-varying trends. Remote Sens. Environ. 2018, 214, 59–72. [Google Scholar] [CrossRef]
- Wu, L.; Wang, S.; Bai, X.; Tian, Y.; Luo, G.; Wang, J.; Li, Q.; Chen, F.; Deng, Y.; Yang, Y.; et al. Climate change weakens the positive effect of human activities on karst vegetation productivity restoration in southern China. Ecol. Indic. 2020, 115, 106392. [Google Scholar] [CrossRef]
- Tong, X.; Wang, K.; Yue, Y.; Brandt, M.; Liu, B.; Zhang, C.; Liao, C.; Fensholt, R. Quantifying the effectiveness of ecological restoration projects on long-term vegetation dynamics in the karst regions of Southwest China. Int. J. Appl. Earth Obs. Geoinf. 2017, 54, 105–113. [Google Scholar] [CrossRef] [Green Version]
- Richardson, A.J. Distinguishing vegetation from soil background information. Photogramm. Eng. Remote Sens. 1977, 43, 1541–1552. [Google Scholar]
- Tucker, C.J. Red and photographic infrared linear combinations for monitoring vegetation. Remote Sens. Environ. 1979, 8, 127–150. [Google Scholar] [CrossRef] [Green Version]
- Zhang, C.; Lu, D.; Chen, X.; Zhang, Y.; Maisupova, B.; Tao, Y. The spatiotemporal patterns of vegetation coverage and biomass of the temperate deserts in Central Asia and their relationships with climate controls. Remote Sens. Environ. 2016, 175, 271–281. [Google Scholar] [CrossRef]
- Barichivich, J.; Bria, K.R.; Myneni, R.B.; Osborn, T.J.; Melvin, T.M.; Philippe, C.; Shilong, P.; Compton, T. Large-scale variations in the vegetation growing season and annual cycle of atmospheric CO2 at high northern latitudes from 1950 to 2011. Glob. Chang. Biol. 2013, 19, 3167–3183. [Google Scholar] [CrossRef]
- Zhu, Z.; Bi, J.; Pan, Y.; Ganguly, S.; Anav, A.; Xu, L.; Samanta, A.; Piao, S.; Nemani, R.R.; Myneni, R.B. Global Data Sets of Vegetation Leaf Area Index (LAI)3g and Fraction of Photosynthetically Active Radiation (FPAR)3g Derived from Global Inventory Modeling and Mapping Studies (GIMMS) Normalized Difference Vegetation Index (NDVI3g) for the Period 1981 to 2011. Remote Sens. 2013, 5, 927–948. [Google Scholar]
- Tucker, C.J.; Pinzon, J.E.; Brown, M.E.; Slayback, D.A.; Pak, E.W.; Mahoney, R.; Vermote, E.; Saleous, N.E. An extended AVHRR 8-km NDVDI dataset compatible with MODIS and SPOT vegetation NDVI data. Int. J. Remote Sens. 2005, 26, 4485–4498. [Google Scholar] [CrossRef]
- Zhou, Y.; Fengsong, P.; Yan, X.; Wu, C.; Zhong, R.; Wang, K.; Wang, H.; Cao, Y. Assessing the Impacts of Extreme Climate Events on Vegetation Activity in the North South Transect of Eastern China (NSTEC). Water 2019, 11, 2291. [Google Scholar] [CrossRef] [Green Version]
- Fensholt, R.; Proud, S.R. Evaluation of Earth Observation based global long term vegetation Trends-Comparing GIMMS and MODIS global NDVI time series. Remote Sens. Environ. 2012, 119, 131–147. [Google Scholar] [CrossRef]
- Sarmah, S.; Jia, G.; Zhang, A.; Singha, M. Assessing seasonal trends and variability of vegetation growth from NDVI3g, MODIS NDVI and EVI over South Asia. Remote Sens. Lett. 2018, 9, 1195–1204. [Google Scholar] [CrossRef]
- Zeng, F.W.; Collatz, G.J.; Pinzon, J.E.; Ivanoff, A. Evaluating and quantifying the climate-driven interannual variability in Global Inventory Modeling and Mapping Studies (GIMMS) Normalized Difference Vegetation Index (NDVI3g) at Global Scales. Remote Sens. 2013, 5, 3918–3950. [Google Scholar] [CrossRef] [Green Version]
- Cui, L.; Wang, L.; Singh, R.P.; Lai, Z.; Jiang, L.; Yao, R. Association analysis between spatiotemporal variation of vegetation greenness and precipitation/temperature in the Yangtze River Basin (China). Environ. Sci. Pollut. Res. 2018, 25, 21867–21878. [Google Scholar] [CrossRef]
- Easterling, D.R.; Alexander, L.V.; Mokssit, A.; Detemmerman, V. CCI/CLIVAR workshop to develop priority climate indices. Bull. Amer. Meteor. Soc. 2003, 84, 1403–1407. [Google Scholar]
- Sen, P.K. Estimates of the regression coefficient based on Kendall’s tau. J. Am. Stat. Assoc. 1968, 63, 1379–1389. [Google Scholar] [CrossRef]
- Mann, H.B. Nonparametric tests against trend. Econom. J. Econom. Soc. 1945, 13, 245–259. [Google Scholar] [CrossRef]
- Zhou, Y.; Zhang, L.; Fensholt, R.; Wang, K.; Vitkovskaya, I.; Tian, F. Climate contributions to vegetation variations in Central Asian drylands: Pre- and post-USSR collapse. Remote Sens. 2015, 7, 2449–2470. [Google Scholar] [CrossRef] [Green Version]
- Zhao, J.; Huang, S.; Huang, Q.; Wang, H.; Leng, G.; Fang, W. Time-lagged response of vegetation dynamics to climatic and teleconnection factors. Catena 2020, 189, 104474. [Google Scholar] [CrossRef]
- Mulder, C.P.H.; Iles, D.T.; Rockwell, R.F. Increased variance in temperature and lag effects alter phenological responses to rapid warming in a subarctic plant community. Glob. Chang. Biol. 2016, 23, 801–814. [Google Scholar] [CrossRef] [PubMed]
- Yan, H.; Yu, Q.; Zhu, Z.; Myneni, R.B.; Yan, H.; Wang, S.; Shugart, H.H. Diagnostic analysis of interannual variation of global land evapotranspiration over 1982–2011: Assessing the impact of ENSO. J. Geophys. Res. Atmos. 2013, 118, 8969–8983. [Google Scholar] [CrossRef]
- Piao, S.; Friedlingstein, P.; Ciais, P.; Viovy, N.; Demarty, J. Growing season extension and its impact on terrestrial carbon cycle in the Northern Hemisphere over the past 2 decades. Glob. Biogeochem. Cycles 2007, 21, GB3018. [Google Scholar] [CrossRef]
- Zhang, T.; Yang, S.; Guo, R.; Guo, J. Correction: Warming and nitrogen addition alter photosynthetic pigments, sugars and nutrients in a temperate meadow ecosystem. PLoS ONE 2016, 11, e0158249. [Google Scholar] [CrossRef] [PubMed] [Green Version]
- Zhang, Q.Y.; Wu, S.H.; Zhao, D.S.; Dai, E.F. Responses of growing season vegetation changes to climatic factors in inner mongolia grassland. J. Nat. Res. 2013, 28, 754–764. [Google Scholar]
- Chen, T.; De Jeu, R.; Liu, Y.; Van der Werf, G.; Dolman, A. Using satellite based soil moisture to quantify the water driven variability in NDVI: A case study over mainland Australia. Remote Sens. Environ. 2014, 140, 330–338. [Google Scholar] [CrossRef]
- Dong, Y.; Yin, D.; Li, X.; Huang, J.; Su, W.; Li, X.; Wang, H. Spatial-temporal evolution of vegetation NDVI in association with climatic, environmental and anthropogenic factors in the Loess Plateau, China during 2000–2015: Quantitative analysis based on Geographical Detector Model. Remote Sens. 2021, 13, 4380. [Google Scholar] [CrossRef]
- Julien, Y.; Sobrino, J.A. Comparison of cloud-reconstruction methods for time series of composite NDVI data. Remote Sens. Environ. 2010, 114, 618–625. [Google Scholar] [CrossRef]
- Brantley, S.T.; Zinnert, J.C.; Young, D.R. Application of hyperspectral vegetation indices to detect variations in high leaf area index temperate shrub thicket canopies. Remote Sens. Environ. 2011, 115, 514–523. [Google Scholar] [CrossRef] [Green Version]
- Lloret, F.; Escudero, A.; Lriondo, J.M.; Martínez-Vilalta, J.; Valladares, F. Extreme climate events and vegetation: The role of stabilizing processes. Glob. Chang. Biol. 2012, 18, 797–805. [Google Scholar] [CrossRef]
Publisher’s Note: MDPI stays neutral with regard to jurisdictional claims in published maps and institutional affiliations. |
© 2022 by the authors. Licensee MDPI, Basel, Switzerland. This article is an open access article distributed under the terms and conditions of the Creative Commons Attribution (CC BY) license (https://creativecommons.org/licenses/by/4.0/).