Abstract
The Fengyun-4A (FY-4A) geostationary satellite carries the Lightning Mapping Imager that measures total lightning rate of convective systems from space at high spatial and temporal resolutions. In this study, the performance of FY-4A lightning data assimilation (LDA) on the forecast of non-typhoon oceanic mesoscale convective systems (MCSs) is investigated by using an LDA method implemented in the Weather Research and Forecasting-Four Dimensional Data Assimilation (WRF-FDDA). With the LDA scheme, three-dimensional graupel mixing ratio fields retrieved from the FY-4A lightning data and the corresponding latent heating rates are assimilated into the Weather Research and Forecasting model via nudging terms. Two oceanic MCS cases over the South China Sea were selected to perform the study. The subjective evaluation results demonstrate that most of the oceanic convective cells missed by the control experiments are recovered in the analysis period by assimilating FY-4A lightning data, due to the promoted updrafts by latent-heat nudging, the more accurate and faster simulations of the cold pools, and the associated gust-fronts at the observed lightning locations. The cold pools and gust-fronts generated during the analysis period helped to maintain the development of the MCSs, and reduced the morphology and displacement errors of the simulations in the short-term forecast periods. The quantitative evaluation indicates that the most effective periods of the LDA for simulation enhancement were at the analysis time and the nowcasting (0–2 h forecast) periods.
1. Introduction
Severe convective weather accounts for substantial property losses and casualties worldwide [1,2,3]. In modern meteorological services, numerical weather prediction (NWP) is one of the effective means for severe convection forecasting and warning. Previous studies have demonstrated the ability of convective-allowing NWP models to improve the forecasts of severe convective weather [4,5].
High quality initialization, i.e., high-resolution data assimilation, can further improve the performance of convection-allowing simulation [6,7,8]. Numerous studies have indicated that the assimilation of weather radar data has positive effects on optimizing the initial fields of mesoscale convective systems (MCSs) and improving the forecasts of precipitation location and intensity [9,10,11,12,13,14,15,16,17]. Lightning data is another type of data with high resolution. Previous studies have found that the total lightning rates are strongly correlated with graupel contents and updrafts in convective storms [18,19,20,21,22,23,24,25,26,27], signifying that total lightning data can be used to retrieve the microphysical and dynamical characteristics of convective clouds.
With the development of electromagnetic signal detection technology, many lightning detection networks have been made available around the world. The ground-based lightning detection platforms, such as the Lightning Mapping Arrays (LMA) [28,29,30], the Earth Network Total Lightning Network (ENTLN) [31,32], the World Wide Lightning Location Network (WWLLN) [33,34], the U.S. National Lightning Detection Network (NLDN) [35], and China’s Advanced Time of Arrival and Direction System (ADTD) [36,37] are increasingly being used in NWP.
Fierro and Reisner [38] and Fierro et al. [31] developed a method to assimilate total lightning data at convection-allowing scales, wherein incremental increases in water vapor mass are applied in the mixed-phase region to locally enhance thermal buoyancy, which, ultimately, promoted the development of updrafts at observed lightning locations. The results show that the lightning data assimilation (LDA) improved the simulation of the convection and the associated precipitation. Additionally, the performance of the LDA scheme was compared with a radar data assimilation method on the short-term forecasts of a derecho event. The results indicated that the lightning assimilation was better able to capture the placement and intensity of the derecho, particularly with a relatively lower computational cost [39]. Marchand and Fuelberg [40] used a temperature nudging method to promote the development of convection where lightning flashes are observed. Qie et al. [41] developed an LDA method, which adjusts ice-phase hydrometeor mass where lightning was observed. Wang et al. [32] developed a method to retrieve graupel mixing ratio (qg) and the corresponding latent heat releases using total lightning rates, and then nudge the simulated graupel contents and potential temperature toward the retrieved values. Their study shows that precipitation and cold pool were generated faster using the LDA method developed in their study compared to the LDA methods developed by Fierro et al. [31] and Marchand and Fuelberg [40], as the graupel, which was directly assimilated into the model, could affect the cold-cloud precipitation microphysics (i.e., graupel melts into raindrop).
In addition to the LDA method using nudging methods, the variational and ensemble techniques have also been applied to the LDA method in recent years [30,36,42,43,44,45]. Such methods are able to promote the development of convection at lightning observed locations and suppress spurious convection developed in the model.
Since both radar and ground-based lightning detection systems are limited by detection range, satellite radiance data and satellite-based retrieval data are important data sources for the data assimilation of oceanic MCSs forecast [46,47,48,49,50]. In recent years, the lightning detection instruments mounted onboard the geostationary satellites have become available, e.g., the Geostationary Lightning Mapper (GLM) mounted onboard Geostationary Operational Environmental Satellite (GOES) -16 and -17 [51,52,53] and the Lightning Mapping Imager (LMI) mounted onboard Fengyun-4A (FY-4A) [54,55]. Some studies have demonstrated the benefits of assimilating geostationary satellite-based lightning data for the simulation and forecast of MCSs [44,56,57,58]. However, the geostationary satellite-based lightning data have not been applied to the data assimilation for non-typhoon oceanic convection, despite its potential benefits.
The South China Sea is one of the most frequently affected regions in the world to be devastated by oceanic MCSs [59,60,61]. The accuracy of oceanic convection forecasts is essential for many sea-based activities, e.g., mariculture, navigation, and coastal tourism. An improved forecast can provide more time for preparation and better mitigate property losses and casualties. In this study, two non-typhoon oceanic convection cases which occurred over the South China Sea were selected for geostationary satellite-based LDA experiments to evaluate the potential benefits of assimilating FY-4A geostationary satellite lightning data on the simulation and forecast of severe non-typhoon oceanic convection.
2. Data and Methodology
2.1. Data for Assimilation and Evaluation
The data used for assimilation in this study are the total lightning data from LMI [62,63,64], which is mounted onboard the geostationary meteorological satellite FY-4A. LMI is composed of two 400 × 600 charge-coupled devices (CCDs) that locate lightning by receiving 2-ms energy integrations of the radiation generated by the sudden heating of the lightning channel. LMI uses ultra-narrow bandpass filters with a central wavelength of 777.4 nm and a bandwidth of 1 nm to ensure that the radiation energy is not affected by scattering in clouds [18]. The resolution of LMI is 7.8 km at nadir and 24.2 km at the edge of the full disk.
After being received, the lightning signals are preprocessed in a real-time event processor. Lightning signals are filtered by removing the background noise which is estimated from the radiance of adjacent frames. Similar to the Geostationary Lightning Mapper [65], LMI has a dynamic filtering threshold due to the large difference in the average background noise between the day and night periods. After filtering, possible lightning events are extracted, and Level 2 product datasets are generated after calibration and false signal elimination. In this study, the Level 2 flash data, which were generated from the Level 2 event data using the lightning clustering algorithm [65,66], were employed for data assimilation. The FY-4A LMI lightning data were interpolated onto the convection-allowing model grid (3 km × 3 km in this study) from the original latitude and longitude coordinates and accumulated over 15-min intervals (similar to the procedures in Wang et al. [32]).
The S-band radar composite reflectivity data from Haikou Meteorological Bureau (20.0° N, 110.25° E), with a detection range of 460 km, was utilized for model performance evaluation. Before the evaluation, a fuzzy logic approach was employed to identify and remove the ground clutters of composite reflectivity data by applying three features (the standard deviation of reflectivity, the vertical gradient of reflectivity, and the absolute value of radial velocity) to the membership functions. The detail of the approach is described in Cho et al. [67]. Afterwards, the radar composite reflectivity were interpolated into the respective domain grids of the model. In this study, only the region within the coverage (dotted circle in Figure 1) of the weather radar was analyzed.
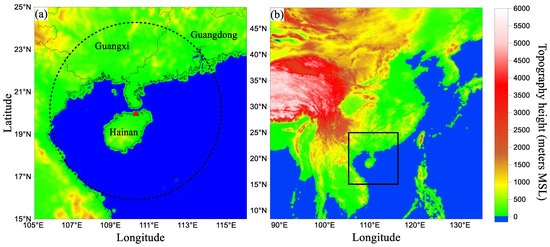
Figure 1.
(a) The coverage of the SA-band radar (dotted circle), and the red triangle represents the radar position of Haikou Meteorological Bureau. (b) The location of the study region (black box) in East Asia.
2.2. Data Assimilation Scheme
A nudging-based LDA scheme implemented in the Weather Research and Forecasting Four-Dimensional Data Assimilation (WRF-FDDA) system was utilized to assimilate the LMI lightning data [32]. In this scheme, the lightning rates derived graupel mixing ratio and latent heating rates are nudged toward the observations by adding tendency terms to the model prognostic equations [32,68,69,70], as expressed by Equation (1):
where fg is the model state variables, P(fg, t) is the original dynamical and physical terms of the WRF model prognostic equations, Gf is the relaxation time scale that is used to prevent the occurrence of unrealistic noise wave due to the instantaneous change of model variable, Wf is a spatial weight function, Tf is a time weight representing a function of the time lags of the observation and the model state, and Og is the observation or analysis value on the model grids.
The empirical formula between total lightning flash rate and graupel mass derived by Carey et al. [71] was utilized to convert lightning flash rate into column-integrated graupel mass, as expressed by Equation (2):
where FR is the total flash rate, and Mg is the column-integrated graupel mass between the −10 °C and −40 °C isothermal layers.
Since the column-integrated graupel mass is determined by the graupel mixing ratio (qg) of each grid within the model-column, the climatological profiles of qg for different bins of the column-integrated graupel masses were used to retrieve the three-dimensional qg fields. In this study, the climatological profiles of qg for different column-integrated graupel mass bins were obtained by the retrospective simulations of 10 summer severe convective events over the South China Sea. The physics and parameterization schemes used in the retrospective simulations were the same as those used in the experiments of this study (introduced in Section 2.3). The qg profiles of the retrospective simulation outputs were extracted hourly to construct the database of qg profiles. In the database, the column-integrated graupel mass of each qg profile was calculated, and the qg profiles were divided into different groups according to the column-integrated graupel mass bins. The climatological profile of qg for each bin of column-integrated graupel mass was calculated by averaging all the qg profiles within the corresponding group.
To consider the graupel in the adjacent regions of observed lightning locations [72], a distance-weighting function-based spread method [32] is employed to account for the qg in such regions, as expressed by Equation (3):
where qg(x) is the qg value with zero lightning observation on the grid x, qg(xi) is the qg value with nonzero lightning observation around the grid x within the influence radius R, N is the number of grids with nonzero lightning observations around grid-box x within the distance of R, and Wi is the spatial-weight function proposed by Cressman et al. [73], which is expressed as:
where ri is the horizontal distance between grid x and xi. Since the resolutions of FY-4A LMI lightning data are relatively lower than the typical ground-based lightning detection systems (e.g., the Earth Networks Total Lightning Network), the influence radius R is increased to 15 km (6 km was used in Wang et al. [32]). Figure 2 shows the examples of retrieved qg fields (Figure 2a,c) and the corresponding FY-4A lightning flash rates of two oceanic MCSs (Figure 2b,d).
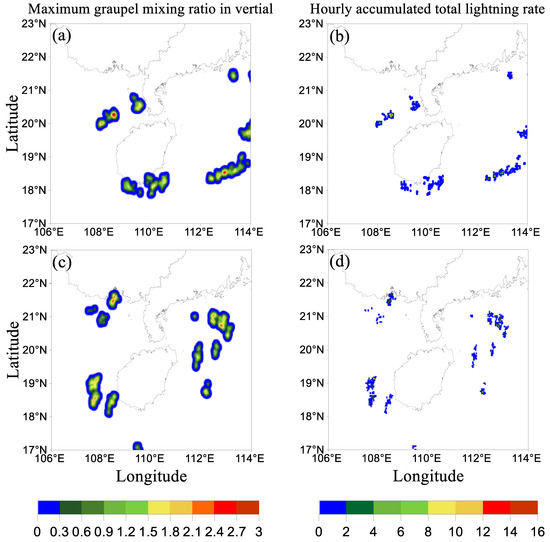
Figure 2.
(a,c) The qg fields retrieved from the observed flash rates (the maximum values in vertical; g kg−1). (b,d) The corresponding total flash rates from the two severe oceanic MCSs interpolated into 3 km grid with 15 min accumulated interval.
The latent heating rates associated with the formation of the graupel are computed by using an empirical relationship between qg increments and latent heating rates as in the following equation:
where ΔT is the temperature increments added to the tendency term, Δqg is the increments of qg, Lc is the latent heat of condensation at the preexisting temperature T0, Lf is the latent heat of freezing at 0 °C, and Cp is the specific heat of air at constant pressure.
2.3. Case Descriptions and Model Configuration
Two severe oceanic convective weather cases that occurred over the South China Sea were selected for FY-4A LDA experiments in this study.
Case 1. This case includes the development, merging, and dissipation of three MCSs formed over the South China Sea. These systems initiated and developed at 16:00 UTC on 19 August 2019. One of the three systems moved northeastward and created a landfall in Guangdong and Guangxi provinces, then dissipated at about 05:00 UTC 20 August. The other two were merged into a squall line and moved southeast by 22:00 UTC 19 August. Low-level potential instability was observed according to the sounding data, and the convective available potential energy (CAPE) was higher than 3700 J kg−1. Subsequently, the squall line dissipated at around 08:00 UTC 20 August.
Case 2. This case was composed by two mesoscale MCSs and one multi-cell convective system. They initiated at 17:00 UTC on 21 August 2019, and developed over several hours. The near-surface ambient temperature was approximately 29 ℃ and the sea-level pressure was approximately 1015 hPa at the night of 21 August. By 04:00 UTC on 22 August, the three convective systems were gradually merged into a larger MCS and the CAPE reached 2000 J kg−1. Afterward, the system moved northward and dissipated over a period of in 5 h.
Although both examples are typical of oceanic MCSs, the MCSs in Case 1 are relatively linear, while the MCSs in Case 2 are relatively scattered.
The numerical model used for this study is the three-dimensional compressible nonhydrostatic Weather Research and Forecasting model version 4.1.2 (WRF4.1.2) [74]. A double-nested scheme was adopted in this experiment. The horizontal grid spacings of the inner and outer grids were 3 and 9 km, respectively (Figure 3). It is noted that the outer domains of the two oceanic convective cases are the same while the inner domains are different. This is because the convective cells are preferred to be covered in the inner domain in the whole simulation period, and the positions and development directions of convective cells are different in the two cases. Therefore, the coverage of the inner domains in the two cases is slightly different. The number of vertical layers of the inner and outer grids was 34, and the top layer was at 50 hPa. The National Centers for Environmental Protection Final Operational Global Analysis (NCEP-FNL) data with a resolution of 0.25° × 0.25° were used for the initial and lateral boundary conditions, and the Mercator projection was employed for the model area.
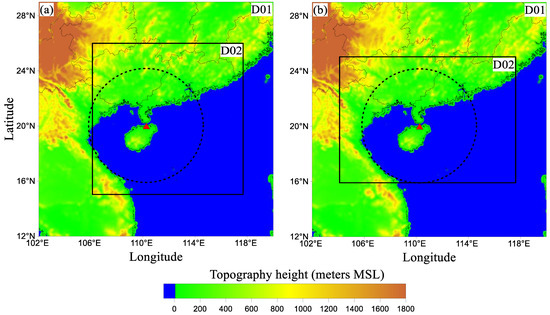
Figure 3.
Double-nested grids (D01, 9 km × 9 km; D02, 3 km × 3 km) used for the (a) Case 1 and (b) Case 2 simulations. The shading represents the terrain height (km). The red triangles and dotted ellipses represent the radar position and detection ranges.
The physical parameterization schemes employed in this study include the Thompson scheme [75] for the microphysics, the RRTMG (Rapid Radiative Transfer Model for General Circulation Models) [76] for the shortwave and longwave radiation transfer, the Mellor–Yamada–Janjic scheme [77] for the planetary boundary layer, and the Noah scheme [78] for the land surface. The Grell–Freitas cumulus parameterization scheme [79] was utilized in the outer domain, while no cumulus parameterization scheme was activated in the inner domain with cloud-permitting resolution.
Lightning data were assimilated only into the inner domain. Two-way nesting between parent and inner nests was used, so the impact of data assimilation can feedback from the inner-most cloud-resolving domain to its parent domains. The flow diagrams for the experiments are shown in Figure 4. In the experiments with the LDA (ASML), the lightning data were assimilated during the first 3 h with a time interval of 15 min, thereafter, a 6-h forecast was made. For each case, a control experiment (CTRL, without the LDA) was conducted for comparison.
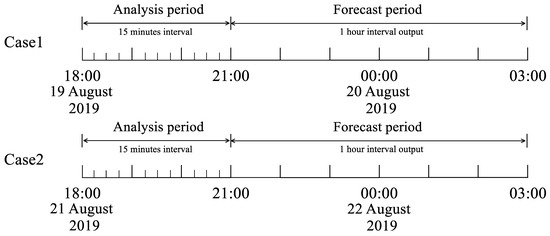
Figure 4.
Flow diagrams of the experiments for the two cases.
2.4. Quantitative Evaluation Scheme
To evaluate the performances of the two sets of experiments, a neighborhood spatial verification scheme called the fractions skill score (FSS) is used in this study [80]. The FSS provides a reliable assessment of displacement errors and avoids the “double-penalty” problem caused by the small displacement both in space and time. Therefore, this scheme is more suitable for the evaluation of the simulation with fine scale grids, and it has been widely used to evaluate the performance of fine-scale forecasts of severe MCSs [32,36,43]. The FSS is calculated from fraction brier score divided by the sum of the mean squared observed and forecast fractions, as expressed by Equation (6):
where N is the number of grid points in the verification domain, CRs and CRo is the fractional coverage of the studied elementary area by composite reflectivity that exceeds a given threshold value in forecast and observation, respectively. A perfect forecast has an FSS of 1, and a “no skill” forecast has a FSS of 0. For more details on the algorithm of the FSS, the reader is directed to Roberts and Lean [80]. FSSs for the different neighborhood radii (18 km, 24 km, and 36 km) at the different thresholds (25 dBZ, 35 dBZ, and 40 dBZ) were calculated in the study.
3. Results
3.1. Case 1 19 August 2019
3.1.1. Performance in the Analysis Period
To evaluate the improvement of the LDA on the analysis and forecast fields of the oceanic convective weather case, the radar composite reflectivity simulated by ASML and CTRL were compared with the observations, respectively, as shown in Figure 5. At 21:00 UTC, the convective cells of Convection 1, 2, and 3, which formed over the sea were better captured by ASML than CTRL (Figure 5a,j,m). ASML was capable of simulating the morphology of the oceanic MCSs, especially for areas with radar composite reflectivity greater than 35 dBZ (represented by black contour lines in Figure 5). The locations of MCSs simulated in ASML were consistent with the observations. However, these oceanic MCSs were not well simulated by CTRL (Figure 5j).
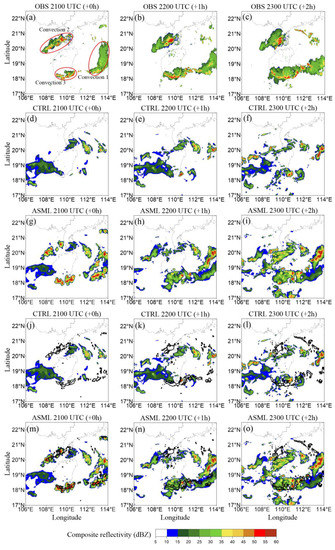
Figure 5.
Radar composite reflectivity (dBZ) for the case of 19 August 2019. (a–c) The observations; (d–f) CTRL; (g–i) ASML. To compare the observations with the simulations more clearly, (j–l) CTRL and (m–o) ASML with the 35 dBZ contours of observations are also be shown. The time and valid forecast time (in the brackets) are marked above each panel; +0 h is the end of analysis period. The images only show the areas covered by radar in the inner domain, and different oceanic MCSs are distinguished by red ellipses.
The maximum updrafts, relative humidities, surface potential temperatures, and surface horizontal winds of ASML and CTRL were analyzed in Figure 6 to demonstrate the impact of the LDA on thermodynamic and dynamical environments. After the ingestion of latent heating rates, strong updrafts were promoted in the middle-upper levels. The averaged updrafts of Convection 1, 2, and 3 (black boxes in Figure 6b) in ASML were greater than 4.5 m/s (the maximum updraft reached 10.2 m/s in Convection 1, not shown), while CTRL only simulated a weak updraft region in the location of Convection 1.
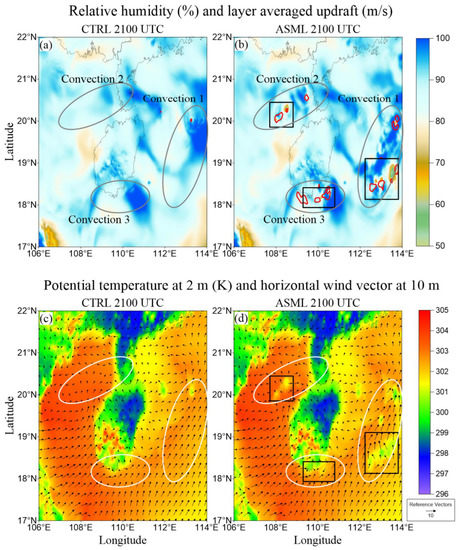
Figure 6.
Averaged updrafts between 3- and 10-km MSL (red contours; contour of 1.5 m/s) and the 850-hPa relative humidity (shading; %) for (a) CTRL and (b) ASML at 21:00 UTC on 19 August 2019. The 2-m potential temperature (shading; K) overlaid with the 10-m horizontal wind field (wind arrows; m/s) for (c) CTRL and (d) ASML. The areas of updrafts in black boxes are discussed in the text. Different oceanic MCSs are distinguished by (a,b) gray and (c,d) white ellipses.
The positive qg increments in ASML could affect the cold-cloud precipitation microphysics (i.e., graupel melts into raindrops), enabling ASML to simulate the locations of the cold pools and the associated gust-fronts more accurately and faster (black boxes in Figure 6d) compared to CTRL. At 21:00 UTC, the cold pools of the Convection 2 and 3 have formed, and the cold pool of the Convection 1 has expanded further in ASML. The northeast cold-air outflow boundary of Convection 1 promoted the development of convection. Conversely, convergence regions of the observed MCSs were not accurately simulated by CTRL partly contributing to the poor simulations of these systems in this simulation.
3.1.2. Performance in the Forecast Period
During the forecast period, Convection 3 was gradually merged with Convection 1 in the following hours (Figure 5b). The merging process was well captured in ASML, and the simulation of merged MCS was consistent with the radar observation (Figure 5n). At 23:00 UTC, similar forecast improvements to those at 22:00 UTC were seen in ASML. On the contrary, only a few scattered, small convective cells near (18.2° N, 110.7° E) and spurious stratiform clouds near (18.7° N, 108° E) were simulated in CTRL (Figure 5k,l). This indicates that the cold pools and gust-fronts generated during the analysis period in Convection 1 and 3 helped maintain the development of the MCSs, and reduced the morphology and displacement errors. Conversely, deviations in the locations of the initially simulated MCSs and the associated deviations in the locations and strength of cold pools led to errors in the forecast of the MCSs. However, ASML had a poor performance on the forecast of Convection 2 after the data assimilation period, which could be partly explained by the weak cold pools and gust-fronts of Convection 2 in the analysis period. In addition, both ASML and CTRL simulated spurious convection near (20° N, 110.3° E) and (20.3° N, 112° E) because the LDA scheme used in this study is not designed to suppress spurious convection.
3.2. Case 2 21 August 2019
3.2.1. Performance in the Analysis Period
Figure 7 shows the observed radar composite reflectivity and the corresponding simulation results of ASML and CTRL. At 21:00 UTC, the morphology of the three oceanic MCSs were simulated more accurately by ASML than CTRL (Figure 7a,j,m). In addition, ASML effectively captured the observed convective cells near (21.4° N, 108.4° E), (21.0° N, 112.0° E) and (20° N, 112.2° E), which were missed by CTRL. The simulated area of convective cell near (18.2° N, 108.0° E) was larger in ASML than CTRL, which was more consistent with the radar observation.
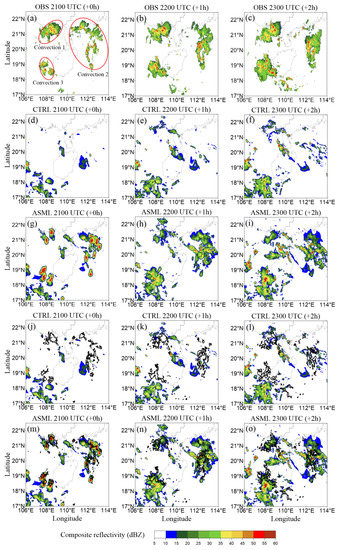
Figure 7.
Radar composite reflectivity (dBZ) for the case of 21 August 2019. (a–c) The observations; (d–f) CTRL; (g–i) ASML. To compare the observations with the simulations more clearly, (j–l) CTRL and (m–o) ASML with the 35 dBZ contours of observations are also be shown. The time and valid forecast time (in the brackets) are marked above each panel; +0 h is the end of analysis period. The images only show the areas covered by radar in the inner domain, and different oceanic MCSs are distinguished by red ellipses.
The impacts of the LDA scheme on the thermodynamic and dynamic environments were evaluated in Figure 8. In the locations of the observed MCSs, the temperature increments promoted the updrafts in the middle–upper levels, causing the averaged updrafts of Convection 1, 2, and 3 (black boxes in Figure 8b) in ASML were greater than 3 m/s (the maximum updraft to be around 7.9 m/s in Convection 2, not shown).. However, these updrafts failed to be simulated in CTRL (Figure 8a). Moreover, much stronger cold pools and the associated gust-fronts near (21.4° N, 108.4° E) and (21° N, 112.3° E) were simulated in ASML than CTRL, partly due to the qg increments-introduced cold-cloud precipitation processes (Figure 8c,d). Since the poor simulations of the initial convergence in the regions of observed MCSs, the corresponding MCSs and cold pools are not well simulated in CTRL.
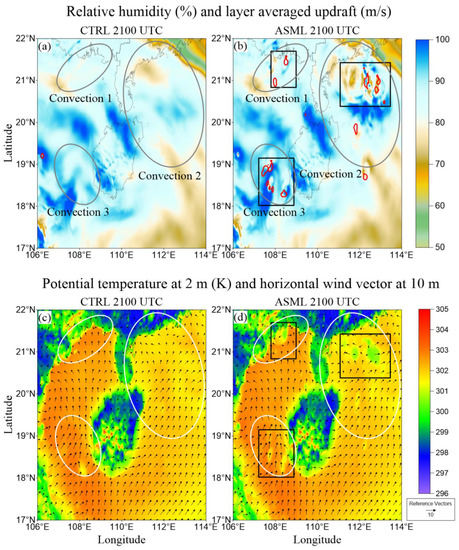
Figure 8.
Averaged updrafts between 3- and 10-km MSL (red contours; contour of 1.5 m/s) and the 850-hPa relative humidity (shading; %) for (a) CTRL and (b) ASML at 21:00 UTC on 21 August 2019. The 2-m potential temperature (shading; K) overlaid with the 10-m horizontal wind field (wind arrows; m/s) for (c) CTRL and (d) ASML. The areas of updrafts in black boxes are discussed in the text. Different oceanic MCSs are distinguished by (a,b) gray and (c,d) white ellipses.
3.2.2. Performance in the Forecast Period
At 22:00 UTC, CTRL failed to simulate Convection 1 and 2. The convective cells of Convection 3 in CTRL exhibit an obvious positional shift relative to the observations (Figure 7b,k). Owing to the contribution of the cold pools and gust-fronts generated in the data assimilation period, the morphology and locations of the MCSs in ASML matched well with the radar observations (Figure 7b,n). At 23:00 UTC, ASML still outperformed CTRL in forecasting the morphology and locations of the MCSs (Figure 7c,l,o). Since the LDA mostly corrected the storm-scale background fields and had little impact on large-scale environments, simulation errors (e.g., location errors and spurious convection errors) were also presented in the forecast results of ASML.
3.3. Vertical Cross Sections of Radar Reflectivity Fields
The vertical cross sections of radar reflectivity through convective cores in Convection 3 of Case 1 and Convection 3 of Case 2 at the analysis time are shown in Figure 9 and Figure 10. It is indicated that the simulated convective cells in ASML and the observed convective cells showed similar vertical reflectivity structure. For example, for the cross section shown in Figure 9, the heights of three convective cores were at ~4.0 km in ASML, which were consistent with the observations and the cloud top heights simulated by ASML (~12.0 km, ~14.3 km, and ~13.5 km) were also close to the observation. However, the vertical ranges of the maximum reflectivity region showed differences between the observed and simulated results, especially for the cross section shown in Figure 10. It should be noted that the displacement errors in the simulation partly account for the differences.
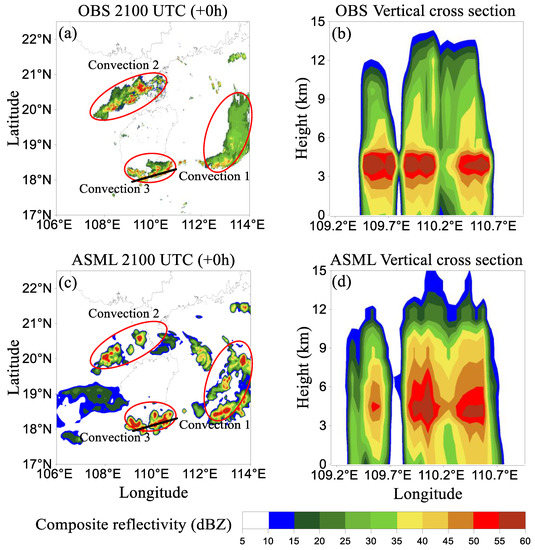
Figure 9.
Vertical cross section of radar reflectivity for the case of 19 August 2019. The location (black bold line) of vertical cross section in (a) OBS and (c) ASML; the reflectivity vertical cross sections of Convection 3 in (b) OBS and (d) ASML.
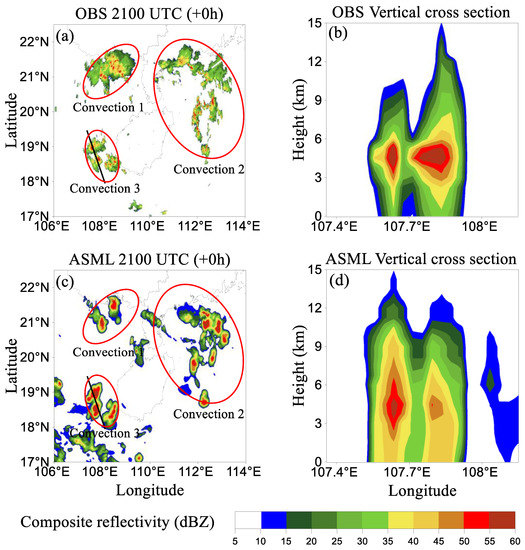
Figure 10.
Vertical cross section of radar reflectivity for the case of 21 August 2019. The location (black bold line) of vertical cross section in (a) OBS and (c) ASML; the reflectivity vertical cross sections of Convection 3 in (b) OBS and (d) ASML.
3.4. Quantitative Evaluation of Composite Reflectivity Forecasts
Figure 11 and Figure 12 show that ASML produced larger FSSs than CTRL at the analysis time and most of the forecast period, indicating an overall effective improvement of assimilating FY-4A lightning data. At the end of analysis time and the nowcasting period (1–2 h forecast), FSSs of CTRL were very small, due to the existence of the large intensity and displacement errors of the initially simulated MCSs. After the LDA, these errors were alleviated in ASML. In the late stage of forecasts, the differences between the two experiments gradually decreased, which was due to the LDA corrected only the convective-scale model states and had little impact on the large-scale environments, and the role of the large-scale environments became increasingly influential over time [36,81].
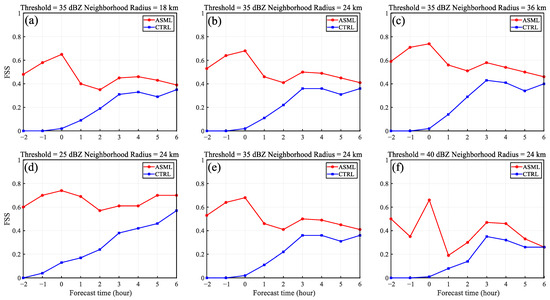
Figure 11.
The fraction skill scores (FSSs) of the composite radar reflectivity simulated by CTRL and ASML. The FSSs for the (a) 18 km, (b) 24 km, and (c) 36 km neighborhood radii at the threshold of 35 dBZ, and the FSSs for the 24 km neighborhood radius at the threshold of (d) 25 dBZ, (e) 35 dBZ, and (f) 40 dBZ for Case 1. Negative times indicate times prior to the forecast period.
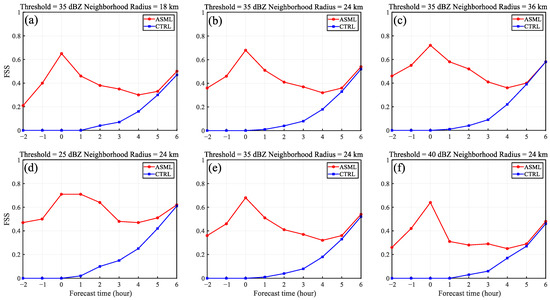
Figure 12.
The fraction skill scores (FSSs) of the composite radar reflectivity simulated by CTRL and ASML. The FSSs for the (a) 18 km, (b) 24 km, and (c) 36 km neighborhood radii at the threshold of 35 dBZ, and the FSSs for the 24 km neighborhood radius at the threshold of (d) 25 dBZ, (e) 35 dBZ, and (f) 40 dBZ for Case 2. Negative times indicate times prior to the forecast period.
For a more comprehensive quantitative evaluation of simulation results, we computed the FSSs for more neighborhood radii and radar reflectivity thresholds. The results are shown in Figure 11 and Figure 12. In Roberts and Lean [80], a FSS greater than 0.5 is deemed “useful”. For the threshold of 35 dBZ, the FSSs of CTRL hardly exceeded 0.5 when neighborhood radii were less than 36 km, while ASML increased the FSSs by 0.1–0.6 and exceeded 0.5 in forecast time when neighborhood radius was 36 km. The ASML showed improvement for all three radar reflectivity thresholds, indicating that the assimilation of FY-4A lightning data has a positive effect on the forecast of both convective and stratiform regions of MCSs.
4. Summary and Conclusions
In this study, the potential benefit of assimilating FY-4A lightning data on the forecast of non-typhoon oceanic convection was assessed with two oceanic convective case studies. To accomplish this work, an LDA scheme implemented in the WRF-FDDA was employed. With this LDA scheme, the process involves the calculation of the column-integrated graupel mass of each grid-column from the observed lightning rates from FY-4A LMI using an empirical formula between total flash rate and graupel mass [71]. Afterwards, three-dimensional qg fields are retrieved from the column-integrated graupel mass by using climatological profiles of qg for different integrated graupel mass bins. A distance-weighting spread method [73] is employed for the retrieved qg fields to consider the graupel contents in the adjacent regions of lightning observed points. The temperature increments are then derived from the latent heating rates which are proportional to the qg increments. The temperature and qg increments are then ingested into the model via the nudging terms.
Two oceanic convective weather cases over the South China Sea were selected to perform the study, and the simulations were compared subjectively and quantitatively with the radar observations to assess the performance of the LDA. The verification results demonstrated that the assimilation of FY-4A lightning data improves the performances on the analyses and forecasts of the oceanic MCSs. Most of the convective cells missed by the control experiments were recovered by using the LDA, due to the promoted updrafts by the temperature increments, and the more accurate and faster simulations of the cold pools and the associated gust-fronts.
The experiments with the LDA outperformed the control experiments in the forecast period because the cold pools and gust-fronts generated during the analysis period helped maintain the development of the MCSs, and reduced the morphology and displacement errors. The poor performance of the control experiments can be partly explained by the deviations in the initial convergence in the regions of observed MCSs, and the associated deviations in the locations and strength of cold pools and gust-fronts. The quantitative evaluation indicates that the most effective periods of the LDA for simulation enhancement were at the analysis time and the nowcasting (0–2 h forecast) periods.
The spatial resolution of LMI (7.8 km at nadir) was found to be lower than that of the cloud-allowing inner domain (3 km). Previous studies have found that the lower resolution of satellite-based lightning detection may lead to a larger spatial extent of MCSs compared to the observations [30,44]. However, benefits will still be obtained by assimilating such data, especially for marine areas not covered by high-resolution radar detection as indicated by the results of this study.
With the availability of lightning data with high spatial and temporal resolution from geostationary satellites, lightning data assimilation could provide a promising avenue to improve the short-term forecasts of oceanic MCSs. To make better use of the satellite-observed lightning data, future work should consider assimilating satellite-observed lightning data in combination with other observations and/or retrievals from geostationary satellites. Additionally, performance of assimilating FY-4A lightning data on the forecasts of oceanic MCSs with more advanced data assimilation methods (e.g., the ensemble Kalman filter or the hybrid ensemble variational method) is also subject to further study.
Author Contributions
Conceptualization, H.S. and H.W.; formal analysis, H.S. and H.W.; investigation, H.S. and H.W.; methodology, H.S. and H.W.; software, H.S., H.W., J.Y., Y.Z. and Y.L.; supervision, H.W., J.Y., Q.Z. and Y.L.; validation, H.S. and H.W.; visualization, H.S., J.G. and S.H.; writing—original draft, H.S.; writing—review and editing, H.S., H.W., J.Y., Y.Z., Q.Z., Y.L., J.G. and S.H. All authors have read and agreed to the published version of the manuscript.
Funding
This work is supported by the National Natural Science Foundation of China (Grant No. 41905097, 41775006, 41905124, 42005064); the National Key Research and Development Program of China (Grant No. 2019YFC0214604); the Natural Science Foundation of the Jiangsu Higher Education Institution of China (Grant No. 19KJB170005); the Natural Science Foundation of Jiangsu Province, China (Grant No. BK20190778, BK20190777).
Acknowledgments
The authors thank the National Satellite Meteorological Center (NSMC) of China Meteorological Administration for providing FY-4A lightning data (http://satellite.nsmc.org.cn/PortalSite/Data/Satellite.aspx, accessed on 20 July 2021) and the Haikou Meteorological Bureau for providing radar data. The NCEP FNL analysis data are available from the NCAR Research Data Archive (https://rda.ucar.edu/datasets/ds083.2, accessed on 8 July 2021).
Conflicts of Interest
The authors declare no conflict of interest.
Abbreviations
This part provides the full names of the abbreviations used in this paper.
| ADTD | China’s Advanced Time of Arrival and Direction System |
| ASML | Assimilation Experiments |
| CAPE | Convective Available Potential Energy |
| CCDs | Charge-Coupled Devices |
| CTRL | Control Experiments |
| ENTLN | Earth Network Total Lightning Network |
| FNL | Final Operational Global Analysis |
| FSS | Fractions Skill Score |
| FY-4A | Fengyun-4A |
| GLM | Geostationary Lightning Mapper |
| GOES | Geostationary Operational Environmental Satellite |
| LDA | Lightning Data Assimilation |
| LMA | Lightning Mapping Arrays |
| LMI | Lightning Mapping Imager |
| MCS | Mesoscale Convective System |
| NCEP | National Centers for Environmental Protection |
| NLDN | U.S. National Lightning Detection Network |
| NWP | Numerical Weather Prediction |
| qg | Graupel Mixing Ratio |
| RRTMG | Rapid Radiative Transfer Model for General Circulation Models |
| FDDA | Four-Dimensional Data Assimilation |
| WRF | Weather Research and Forecasting |
| WWLLN | World Wide Lightning Location Network |
References
- Johnson, R.H.; Mapes, B.E. Mesoscale Processes and Severe Convective Weather. Meteorol. Monogr. 2001, 28, 71–122. [Google Scholar] [CrossRef]
- Koshak, W.J.; Cummins, K.L.; Buechler, D.E.; Vant-Hull, B.; Blakeslee, R.J.; Williams, E.R.; Peterson, H.S. Variability of CONUS lightning in 2003–12 and associated impacts. J. Appl. Meteorol. Climatol. 2015, 54, 15–41. [Google Scholar] [CrossRef]
- Zhang, X.; Sun, J.; Zheng, Y.; Zhang, Y.; Ma, R.; Yang, X.; Zhou, K.; Han, X. Progress in Severe Convective Weather Forecasting in China since the 1950s. J. Meteorol. Res. 2020, 34, 21. [Google Scholar] [CrossRef]
- Dowell, D.C.; Wicker, L.J.; Snyder, C. Ensemble Kalman filter assimilation of radar observations of the 8 May 2003 Oklahoma City supercell: Influences of reflectivity observations on storm-scale analyses. Mon. Weather Rev. 2011, 139, 272–294. [Google Scholar] [CrossRef]
- Weisman, M.L.; Evans, C.; Bosart, L. The 8 May 2009 superderecho: Analysis of a real-time explicit convective forecast. Weather Forecast. 2013, 28, 863–892. [Google Scholar] [CrossRef]
- Navon, I.M. Data assimilation for numerical weather prediction: A review. In Data Assimilation for Atmospheric, Oceanic and Hydrologic Applications; Springer: Berlin/Heidelberg, Germany, 2009; pp. 21–65. [Google Scholar]
- Lilly, D.K. Numerical prediction of thunderstorms—Has its time come? Q. J. R. Meteorol. Soc. 1990, 116, 779–798. [Google Scholar]
- Sun, J.; Xue, M.; Wilson, J.W.; Zawadzki, I.; Ballard, S.P.; Onvlee-Hooimeyer, J.; Joen, P.; Barker, D.M.; Li, P.; Golding, B.; et al. Use of NWP for nowcasting convective precipitation: Recent progress and challenges. Bull. Am. Meteorol. Soc. 2014, 95, 409–426. [Google Scholar] [CrossRef]
- Gao, J.; Xue, M.; Brewster, K.; Droegemeier, K.K. A three-dimensional variational data analysis method with recursive filter for Doppler radars. J. Atmos. Ocean. Technol. 2004, 21, 457–469. [Google Scholar] [CrossRef]
- Gao, J.; Stensrud, D.J. Assimilation of reflectivity data in a convective-scale, cycled 3DVAR framework with hydrometeor classification. J. Atmos. Sci. 2012, 69, 1054–1065. [Google Scholar] [CrossRef]
- Caya, A.; Sun, J.; Snyder, C. A comparison between the 4DVAR and the ensemble Kalman filter techniques for radar data assimilation. Mon. Weather Rev. 2005, 133, 3081–3094. [Google Scholar] [CrossRef]
- Hu, M.; Xue, M.; Brewster, K. 3DVAR and cloud analysis with WSR-88D level-II data for the prediction of the Fort Worth, Texas, tornadic thunderstorms. Part I: Cloud analysis and its impact. Mon. Weather Rev. 2006, 134, 675–698. [Google Scholar] [CrossRef]
- Kain, J.S.; Xue, M.; Coniglio, M.C.; Weiss, S.J.; Kong, F.Y.; Jensen, T.L.; Brown, B.G.; Gao, J.D.; Brewster, K.; Thomas, K.W.; et al. Assessing advances in the assimilation of radar data and other mesoscale observations within a collaborative forecasting–research environment. Weather Forecast. 2010, 25, 1510–1521. [Google Scholar] [CrossRef]
- Craig, G.C.; Keil, C.; Leuenberger, D. Constraints on the impact of radar rainfall data assimilation on forecasts of cumulus convection. Q. J. R. Meteorol. Soc. 2012, 138, 340–352. [Google Scholar] [CrossRef]
- Wang, S.; Xue, M.; Schenkman, A.D.; Min, J.Z. An iterative ensemble square root filter and tests with simulated radar data for storm-scale data assimilation. Q. J. R. Meteorol. Soc. 2013, 139, 1888–1903. [Google Scholar] [CrossRef]
- Bachmann, K.; Keil, C.; Weissmann, M. Impact of radar data assimilation and orography on predictability of deep convection. Q. J. R. Meteorol. Soc. 2019, 145, 117–130. [Google Scholar] [CrossRef]
- Ikuta, Y.; Okamoto, K.; Kubota, T. One-Dimensional maximum-likelihood estimation for spaceborne precipitation radar data assimilation. Q. J. R. Meteorol. Soc. 2021, 147, 858–875. [Google Scholar] [CrossRef]
- Goodman, S.J.; Buechler, D.E.; Wright, P.D.; Rust, W.D. Lightning and precipitation history of a microburstproducing storm. Geophys. Res. Lett. 1988, 15, 1185–1188. [Google Scholar] [CrossRef]
- Petersen, W.A.; Rutledge, S.A. On the relationship between cloud-to-ground lightning and convective rainfall. J. Geophys. Res. 1998, 103, 14025–14040. [Google Scholar] [CrossRef]
- Wiens, K.C.; Rutledge, S.A.; Tessendorf, S.A. The 29 June 2000 supercell observed during STEPS. Part II: Lightning and charge structure. J. Atmos. Sci. 2005, 62, 4151–4177. [Google Scholar] [CrossRef]
- Fierro, A.O.; Gilmore, M.S.; Mansell, E.R.; Wicker, L.J.; Straka, J.M. Electrification and lightning in an idealized boundarycrossing supercell simulation of 2 June 1995. Mon. Weather Rev. 2006, 134, 3149–3172. [Google Scholar] [CrossRef][Green Version]
- Fierro, A.O.; Mansell, E.R.; Ziegler, C.L.; MacGorman, D.R. Explicitly simulated electrification and lightning within a tropical cyclone based on the environment of Hurricane Isaac (2012). J. Atmos. Sci. 2015, 72, 4167–4193. [Google Scholar] [CrossRef]
- Fierro, A.O.; Mansell, E.R. Relationships between electrification and storm-scale properties based on idealized simulations of an intensifying hurricane-like vortex. J. Atmos. Sci. 2018, 75, 657–674. [Google Scholar] [CrossRef]
- Mansell, E.R.; Ziegler, C.L.; MacGorman, D.R. A lightning data assimilation technique for mesoscale forecast models. Mon. Weather Rev. 2007, 135, 1732–1748. [Google Scholar] [CrossRef]
- Deierling, W.; Petersen, W.A. Total lightning activity as an indicator of updraft characteristics. J. Geophys. Res. 2008, 113, D16210. [Google Scholar] [CrossRef]
- Chen, Z.; Qie, X.; Liu, D. Lightning data assimilation with comprehensively nudging water contents at cloud-resolving scale using WRF model. Atmos. Res. 2019, 221, 72–87. [Google Scholar] [CrossRef]
- Torcasio, R.C.; Federico, S.; Comellas Prat, A.; Panegrossi, G.; D’Adderio, L.P.; Dietrich, S. Impact of Lightning Data Assimilation on the Short-Term Precipitation Forecast over the Central Mediterranean Sea. Remote Sens. 2021, 13, 682. [Google Scholar] [CrossRef]
- Rison, W.; Thomas, R.J.; Krehbiel, P.R.; Hamlin, T.; Harlin, J.A. GPS-based three-dimensional lightning mapping system: Initial observations in central New Mexico. Geophys. Res. Lett. 1999, 26, 3573–3576. [Google Scholar] [CrossRef]
- Thomas, R.J.; Krehbiel, P.R.; Rison, W.; Hunyady, S.J.; Winn, W.P.; Hamlin, T.; Harlin, J. Accuracy of the lightning mapping array. J. Geophys. Res. 2004, 109, D14207. [Google Scholar] [CrossRef]
- Allen, B.J.; Mansell, E.R.; Dowell, D.C.; Deierling, W. Assimilation of pseudo-GLM data using the ensemble Kalman filter. Mon. Weather Rev. 2016, 144, 3465–3486. [Google Scholar] [CrossRef]
- Fierro, A.O.; Mansell, E.R.; Ziegler, C.L.; MacGorman, D.R. Application of a lightning data assimilation technique in the WRF-ARW model at cloud-resolving scales for the tornado outbreak of 24 May 2011. Mon. Weather Rev. 2012, 140, 2609–2627. [Google Scholar] [CrossRef]
- Wang, H.; Liu, Y.; Cheng, W.; Zhao, T.; Xu, M.; Liu, Y.; Shen, S.; Kristin, M.C.; Fierro, A.O. Improving lightning and precipitation prediction of severe convection using lightning data assimilation with NCAR WRF-RTFDDA. J. Geophys. Res. Atmos. 2017, 122, 12296–12316. [Google Scholar] [CrossRef]
- Apodaca, K.; Zupanski, M.; DeMaria, M.; Knaff, J.A.; Grasso, L.D. Development of a hybrid variational-ensemble data assimilation technique for observed lightning tested in a mesoscale model. Nonlinear Process. Geophys. 2014, 21, 1027–1041. [Google Scholar] [CrossRef]
- Dixon, K.; Mass, C.F.; Hakim, G.J.; Holzworth, R.H. The impact of lightning data assimilation on deterministic and ensemble forecasts of convective events. J. Atmos. Ocean. Technol. 2016, 33, 1801–1823. [Google Scholar] [CrossRef]
- Nag, A.; Rakov, V.A. Parameters of electric field waveforms produced by positive lightning return strokes. IEEE Trans. Electromagn. Compat. 2014, 56, 932–939. [Google Scholar] [CrossRef]
- Wang, H.; Liu, Y.; Zhao, T.; Liu, Y.; Xu, M.; Shen, S.; Jiang, Y.; Yang, H.; Feng, S. Continuous assimilation of lightning data using time-lagged ensembles for a convection-allowing numerical weather prediction model. J. Geophys. Res. Atmos. 2018, 123, 9652–9673. [Google Scholar] [CrossRef]
- Liu, P.; Yang, Y.; Xin, Y.; Wang, C. Impact of lightning data assimilation on forecasts of a leeward slope precipitation event in the western margin of the junggar basin. Remote Sens. 2021, 13, 3584. [Google Scholar] [CrossRef]
- Fierro, A.O.; Reisner, J.M. High-resolution simulation of the electrification and lightning of hurricane Rita during the period of rapid intensification. J. Atmos. Sci. 2011, 68, 477–494. [Google Scholar] [CrossRef]
- Fierro, A.O.; Gao, J.; Ziegler, C.L.; Mansell, E.R.; MacGorman, D.R.; Dembek, S.R. Evaluation of a cloud-scale lightning data assimilation technique and a 3DVAR method for the analysis and short-term forecast of the 29 June 2012 Derecho event. Mon. Weather Rev. 2014, 142, 183–202. [Google Scholar] [CrossRef]
- Marchand, M.; Fuelberg, H. Assimilation of lightning data using a nudging method involving low-level warming. Mon. Weather Rev. 2014, 142, 4850–4871. [Google Scholar] [CrossRef]
- Qie, X.; Zhu, R.; Yuan, T.; Wu, X.; Li, W.; Liu, D. Application of total-lightning data assimilation in a mesoscale convective system based on the WRF model. Atmos. Res. 2014, 145–146, 255–266. [Google Scholar] [CrossRef]
- Mansell, E.R. Storm-scale ensemble Kalman filter assimilation of total lightning extent data. Mon. Weather Rev. 2014, 142, 3683–3695. [Google Scholar] [CrossRef]
- Fierro, A.O.; Gao, J.; Ziegler, C.L.; Calhoun, K.M.; Mansell, E.R.; Macgorman, D.R. Assimilation of flash extent data in the Variational framework at convection-allowing scales: Proof-of-concept and evaluation for the short-term forecast of the 24 May 2011 tornado outbreak. Mon. Weather Rev. 2016, 144, 4373–4393. [Google Scholar] [CrossRef]
- Kong, R.; Xue, M.; Fierro, A.O.; Jung, Y.; Liu, C.; Mansell, E.R.; Macgorman, D.R. Assimilation of GOES-R Geostationary Lightning Mapper flash extent density data in GSI EnKF for the analysis and short-term forecast of a mesoscale convective system. Mon. Weather Rev. 2020, 148, 2111–2133. [Google Scholar] [CrossRef]
- Xiao, X.; Sun, J.; Qie, X.; Ying, Z.M.; Zhang, L. Lightning Data Assimilation Scheme in a 4DVAR System and Its Impact on Very Short-Term Convective Forecasting. Mon. Weather Rev. 2021, 149, 353–373. [Google Scholar] [CrossRef]
- Xu, D.; Min, J.; Shen, F. Assimilation of MWHS radiance data from the FY-3B satellite with the WRF Hybrid-3DVAR system for the forecasting of binary typhoons. J. Adv. Model. Earth Syst. 2016, 8, 1014–1028. [Google Scholar] [CrossRef]
- Xiao, H.; Han, W.; Wang, H.; Wang, J.; Liu, G.; Xu, C. Impact of FY-3D MWRI radiance assimilation in GRAPES 4DVar on forecasts of Typhoon Shanshan. J. Meteorol. Res. 2020, 34, 836–850. [Google Scholar] [CrossRef]
- Shen, F.; Xu, D.; Li, H.; Min, J.; Liu, R. Assimilation of GPM Microwave Imager Radiance data with the WRF hybrid 3DEnVar system for the prediction of Typhoon Chan-hom (2015). Atmos. Res. 2021, 251, 105422. [Google Scholar] [CrossRef]
- Xu, D.; Shen, F.; Min, J.; Shu, A. Assimilation of GPM Microwave Imager radiance for track prediction of typhoon cases with the WRF Hybrid En3DVAR System. Adv. Atmos. Sci. 2021, 38, 983–993. [Google Scholar] [CrossRef]
- Rysman, J.F.; Claud, C.; Chaboureau, J.P.; Delanoë, J.; Funatsu, B.M. Severe convection in the Mediterranean from microwave observations and a convection-permitting model. Q. J. R. Meteorol. Soc. 2016, 142 (Suppl. 1), 43–55. [Google Scholar] [CrossRef]
- Goodman, S.J.; Blakeslee, R.J.; Koshak, W.J.; Mach, D.; Bailey, J.; Buechler, D.; Carey, L.; Schultz, C.; Bateman, M.; McCaul, E. The GOES-R Geostationary Lightning Mapper (GLM). Atmos. Res. 2013, 125–126, 34–49. [Google Scholar] [CrossRef]
- Rudlosky, S.D.; Goodman, S.J.; Koshak, W.J.; Blakeslee, R.J.; Buechler, D.E.; Mach, D.M.; Bateman, M. Characterizing the GOES-R (GOES-16) Geostationary Lightning Mapper (GLM) on-orbit performance. In Proceedings of the 2017 IEEE International Geoscience and Remote Sensing Symposium, Fort Worth, TX, USA, 23–28 July 2017; pp. 279–282. [Google Scholar]
- Rudlosky, S.D.; Goodman, S.J.; Virts, K.S.; Bruning, E.C. Initial Geostationary Lightning Mapper Observations. Geophys. Res. Lett. 2019, 46, 1097–1104. [Google Scholar] [CrossRef]
- Yang, J.; Zhang, Z.; Wei, C.; Lu, F.; Guo, Q. Introducing the New Generation of Chinese Geostationary Weather Satellites, Fengyun-4. Bull. Am. Meteorol. Soc. 2017, 98, 1637–1658. [Google Scholar] [CrossRef]
- Chan, Y.W.; So, C.K. The applications of Feng Yun 4 A satellite products for weather monitoring over the asian regions. In Proceedings of the 99th American Meteorological Society Annual Meeting, Phoenix, AZ, USA, 6–10 January 2019. [Google Scholar]
- Chen, Y.; Yu, Z.; Han, W.; He, J.; Chen, M. Case Study of a Retrieval Method of 3D Proxy Reflectivity from FY-4A Lightning Data and Its Impact on the Assimilation and Forecasting for Severe Rainfall Storms. Remote Sens. 2020, 12, 1165. [Google Scholar] [CrossRef]
- Chen, Z.; Sun, J.; Qie, X.; Zhang, Y.; Ying, Z.; Xiao, X.; Cao, D. A method to update model kinematic states by assimilating satellite-observed total lightning data to improve convective analysis and forecasting. J. Geophys. Res. Atmos. 2020, 125, e2020JD033330. [Google Scholar] [CrossRef]
- Liu, P.; Yang, Y.; Lai, A.; Wang, Y.; Wang, C. Assimilating FY-4A Lightning and Radar Data for Improving Short-Term Forecasts of a High-Impact Convective Event with a Dual-Resolution Hybrid 3DEnVAR Method. Remote Sens. 2021, 13, 3090. [Google Scholar] [CrossRef]
- Feng, Q.; Wang, A.; Li, J. The Variation of precipitation in time and space and heavy-rain flood disaster in China. J. Nat. Disasters 1998, 7, 87–93. (In Chinese) [Google Scholar]
- Chen, X.; Gao, L.; Chen, Y.; Deng, H.; Liu, M.; Lin, B. Study on the classification of typhoon and non-typhoon related rainstorm flood. China Flood Drought Manag. 2019, 29, 18–21. (In Chinese) [Google Scholar]
- Jou, B.J. Non-typhoon heavy rain research in Taiwan for the past 30 years: A review. Torrential Rain Disasters 2020, 39, 109–116. (In Chinese) [Google Scholar]
- Liu, R.; Lu, Q.; Min, C.; Zhang, Y.; Li, X.Q. Quality Assessment of FY-4A Lightning Data in Inland China. J. Trop. Meteorol. 2020, 26, 286–299. (In Chinese) [Google Scholar]
- Hui, W.; Zhang, W.; Lyu, W.; Li, P. Preliminary Observations from the China Fengyun-4A Lightning Mapping Imager and Its Optical Radiation Characteristics. Remote Sens. 2020, 12, 2622. [Google Scholar] [CrossRef]
- Sun, H.; Yang, J.; Zhang, Q.; Song, L.; Gao, H.; Jing, X.; Lin, G.; Yang, K. Effects of Day/Night Factor on the Detection Performance of FY4A Lightning Mapping Imager in Hainan, China. Remote Sens. 2021, 13, 2200. [Google Scholar] [CrossRef]
- Mach, D.M.; Bateman, M.G.; Blakeslee, R.J.; Boldi, R.A.; Buechler, D.E.; Carey, L.D.; Goodman, S.J.; Koshak, W.J.; McCaul, E.W.; Peterson, W.A. GOESR Geostationary Lightning Mapper performance specifications and algorithms. In Proceedings of the 2008 NOAA STAR GOES-R AWG Review, Madison, WI, USA, 24 August 2008. [Google Scholar]
- Boccippio, D.J.; Driscoll, K.; Hall, J.; Buechler, D. LIS/OTD Software Guide; Technical Report; NASA: Washington, DC, USA, 1998.
- Cho, Y.H.; Lee, G.W.; Kim, K.E.; Zawadzki, I. Identification and Removal of Ground Echoes and Anomalous Propagation Using the Characteristics of Radar Echoes. J. Atmos. Ocean. Technol. 2006, 23, 1206–1222. [Google Scholar] [CrossRef]
- Liu, Y.; Warner, T.T.; Astling, E.G.; Bowers, J.F.; Davis, C.A.; Halvorson, S.F.; Rife, D.L.; Sheu, R.S.; Swerdlin, S.P.; Xu, M. The operational mesogamma-scale analysis and forecast system of the U.S. Army test and evaluation command. Part II: Interrange comparison of the accuracy of model analyses and forecasts. J. Appl. Meteorol. Climatol. 2008, 47, 1093–1104. [Google Scholar] [CrossRef][Green Version]
- Sharman, R.D.; Liu, Y.; Sheu, R.S.; Warner, T.T.; Rife, D.L.; Bowers, J.F.; Clough, C.A.; Ellison, E.E. The operational mesogamma-scale analysis and forecast system of the U.S. army test and evaluation command, part III: Forecasting with secondary-applications models. J. Appl. Meteorol. Climatol. 2008, 47, 1105–1122. [Google Scholar] [CrossRef]
- Pan, L.; Liu, Y.; Liu, Y.; Li, L.; Jiang, Y.; Cheng, W.; Roux, G. Impact of four-dimensional data assimilation (FDDA) on urban climate analysis. J. Adv. Model. Earth Syst. 2015, 7, 1997–2011. [Google Scholar] [CrossRef]
- Carey, L.D.; Bain, A.L.; Retha, M. Kinematic and microphysical control of lightning in multicell convection over Alabama during DC3. In Proceedings of the 23rd International Lightning Detection Conference, Tucson, AZ, USA, 18–19 March 2014. [Google Scholar]
- Lund, N.R.; MacGorman, D.R.; Schuur, T.J.; Biggerstaff, M.I.; Rust, W.D. Relationships between lightning location and polarimetric radar signatures in a small mesoscale convective system. Mon. Weather Rev. 2009, 137, 4151–4170. [Google Scholar] [CrossRef]
- Cressman, G.P. An operational objective analysis system. Mon. Weather Rev. 1959, 87, 367–374. [Google Scholar] [CrossRef]
- Skamarock, W.C.; Klemp, J.B.; Dudhia, J.; Gill, D.O.; Barker, D.M.; Duda, M.G.; David, O.G.; Jordan, G.P. A Description of the Advanced Research WRF Version 3; (No. NCAR/TN-475+STR); University Corporation for Atmospheric Research; NCAR: Orlando, FL, USA, 2008. [Google Scholar]
- Thompson, G.; Field, P.R.; Rasmussen, R.M.; Hall, W.D. Explicit forecasts of winter precipitation using an improved bulk microphysics scheme. Part II: Implementation of a new snow parameterization. Mon. Weather Rev. 2008, 136, 5095–5115. [Google Scholar] [CrossRef]
- Iacono, M.J.; Delamere, J.S.; Mlawer, E.J.; Shephard, M.W.; Clough, S.A.; Collins, W.D. Radiative forcing by long-lived greenhouse gases: Calculations with the AER radiative transfer models. J. Geophys. Res. 2008, 113, D13103. [Google Scholar] [CrossRef]
- Janjić, Z.I. The Step-Mountain eta coordinate model: Further developments of the convection, viscous sublayer, and turbulence closure schemes. Mon. Weather Rev. 1994, 122, 927–945. [Google Scholar] [CrossRef]
- Chen, F.; Dudhia, J. Coupling an advanced land surface–hydrology model with the Penn State–NCAR MM5 modeling system, part I: Model implementation and sensitivity. Mon. Weather Rev. 2001, 129, 569–585. [Google Scholar] [CrossRef]
- Grell, G.A.; Freitas, S.R. A scale and aerosol aware stochastic convective parameterization for weather and air quality modeling. Atmos. Chem. Phys. 2013, 13, 23845–23893. [Google Scholar] [CrossRef]
- Roberts, N.M.; Lean, H.W. Scale-selective verification of rainfall accumulations from high-resolution forecasts of convective events. Mon. Weather Rev. 2008, 136, 78–97. [Google Scholar] [CrossRef]
- Johnson, A.; Wang, X.; Carley, J.R.; Wicker, L.J.; Karstens, C. A comparison of multi-scale GSI-based EnKF and 3DVar data assimilation using radar and conventional observations for mid-latitude convective-scale precipitation forecasts. Mon. Weather Rev. 2015, 143, 3087–3108. [Google Scholar] [CrossRef]
Publisher’s Note: MDPI stays neutral with regard to jurisdictional claims in published maps and institutional affiliations. |
© 2022 by the authors. Licensee MDPI, Basel, Switzerland. This article is an open access article distributed under the terms and conditions of the Creative Commons Attribution (CC BY) license (https://creativecommons.org/licenses/by/4.0/).