Article

Spatial-Temporal Neural Network for Rice Field Classification from SAR Images

1
Department of Electrical Engineering, National Taipei University of Technology, Taipei 10608, Taiwan
2
Department of Electrical Engineering, Faculty of Engineering, University of Malaya, Kuala Lumpur 50603, Malaysia
3
Department of Communications, Navigation and Control Engineering, National Taiwan Ocean University, Keelung 202301, Taiwan
4
National Space Organization, National Applied Research Laboratories, Hsinchu 30078, Taiwan
*
Author to whom correspondence should be addressed.
Remote Sens. 2022, 14(8), 1929; https://doi.org/10.3390/rs14081929
Submission received: 26 February 2022 / Revised: 6 April 2022 / Accepted: 14 April 2022 / Published: 16 April 2022

Abstract

:
Agriculture is an important regional economic industry in Asian regions. Ensuring food security and stabilizing the food supply are a priority. In response to the frequent occurrence of natural disasters caused by global warming in recent years, the Agriculture and Food Agency (AFA) in Taiwan has conducted agricultural and food surveys to address those issues. To improve the accuracy of agricultural and food surveys, AFA uses remote sensing technology to conduct surveys on the planting area of agricultural crops. Unlike optical images that are easily disturbed by rainfall and cloud cover, synthetic aperture radar (SAR) images will not be affected by climatic factors, which makes them more suitable for the forecast of crops production. This research proposes a novel spatial-temporal neural network called a convolutional long short-term memory rice field classifier (ConvLSTM-RFC) for rice field classification from Sentinel-1A SAR images of Yunlin and Chiayi counties in Taiwan. The proposed model ConvLSTM-RFC is implemented with multiple convolutional long short-term memory attentions blocks (ConvLSTM Att Block) and a bi-tempered logistic loss function (BiTLL). Moreover, a convolutional block attention module (CBAM) was added to the residual structure of the ConvLSTM Att Block to focus on rice detection in different periods on SAR images. The experimental results of the proposed model ConvLSTM-RFC have achieved the highest accuracy of 98.08% and the rice false positive is as low as 15.08%. The results indicate that the proposed ConvLSTM-RFC produces the highest area under curve (AUC) value of 88% compared with other related models.

1. Introduction

In Asian regions, rice is a staple food for the general public [1,2,3]. It provides employment and also livelihoods for the people. Especially in Taiwan, rice agriculture is also considered an industry for a number of farmers. Most of the land area of Taiwan is covered by mountains, only one-third of the land area is used for agriculture, and producing 1.4 million tonnes of grains annually [4]. The number of natural disasters, flash floods, cyclones, changes in temperature, and rainfall has been reported to continue to increase due to the impacts of global warming. These impacts are the factors that have been led to the reduction of rice yield [5,6,7,8].
Taiwan is located in a subtropical region. Typhoons flourish during the summer season. In winter, cold and low temperatures damage the yield. Strong winds and heavy rainfall brought by Typhoons are one of the main natural disasters affecting rice yield and quality. In recent years, the frequency and intensity of natural disasters have become more frequent due to the impact of global warming. In a pivotal position, ensuring the stability of the domestic rice supply and sustaining the regional economy is one of the top priorities. To establish the sustainable development of Taiwan’s agriculture and for accurate assessment of rice production, The Council of Agriculture of Executive Yuan began to conduct precision surveys in 1974. Earlier, the surveys were conducted through field investigators, farmer’s interviews, and reviewers [9] which is a time-consuming and laborious process. The use of remote sensing technology to conduct agricultural and grain surveys has been in practice for many years. In the past, it was manually judged whether or not rice was planted in each area, and then the cultivated land data was superimposed to calculate the rice planting area and yield. It combines remotely measured multi-time images and GIS data to identify rice mounds. The applied data includes the boundaries of cultivated land mounds, the spectral information of the whole growth period of rice, and the remotely measured multi-time images. The rice fields on this island are small and fragmented. It has become a challenge to estimate the mapping of the rice fields in Taiwan accurately.
At present, most of Taiwan’s telemetry aerial photos are acquired by optical sensors that have high imaging resolution and sensitivity, becoming a low-cost tool and an expeditious solution for rice field mapping. Many research studies were conducted for rice field classification using the optical, microwave, and both images data. The phenological analysis based on optical or radar time series [10] became an essential approach to classifying rice fields from other crops. In recent years, a number of research studies are carried out to map the crop classification using SPOT-VEGETATION [11], Proba-V [12], Landsat [13], NOAA AVHRR [14], MODIS multi-temporal, and coarse resolution data [15,16,17,18,19,20,21,22]. Pan et al. [23] developed a pixel and phenology-based method to identify planting areas of double-season paddy rice from high-resolution images. These high-resolution data expose limitations because rice fields are small and fragmented, which leads to the misidentification of rice fields. These issues can be addressed by using spatial features of the rice. However, the biggest challenge with optical sensors is climate conditions, such as clouds and fog. These factors will produce inaccurate images of rice crops. In addition, using unmanned aerial vehicles with optical sensors to acquire the images, the range of area that can be taken is limited.
Synthetic aperture radar (SAR) is an active microwave imaging radar. It has the characteristics of being immune to weather such as sunlight, clouds, and water. SAR data allows the construction of continuous time-series data. It has been proved that SAR data is an effective tool for mapping rice fields [24]. In the past, different studies used SAR time series data in X-band, C-band, and L-band for rice field classification [25,26]. At different locations around the world, research studies have been using Sentinel-1A time-series images for mapping and monitoring rice crops. Earlier, maximum likelihood [27] and threshold-based segmentation [28,29] techniques were used for rice crop mapping. Image recognition technology continues to evolve and innovate with the times. Furthermore, machine learning (ML) methods such as decision tree (DT) [30,31], random forest (RF) [32,33], support vector machine (SVM) [34], artificial bee colony (ABC) [35], quadratic discriminant analysis [36], and artificial neural network (ANN) [37] have been proposed for crop characterization. The accuracy of these methods strongly depends on the number of training samples, which are difficult to obtain and update on a large scale [38,39]. The traditional ML techniques have the advantages of good stability, fewer control parameters, simple calculations, and easy implementation. However, these techniques have poor precision and convergence prematurely.
Recently, deep learning (DL) techniques have proved to be state-of-the-art in the field of computer vision. DL techniques outperform the traditional ML algorithms due to their ability to learn and represent data at various abstraction levels. In remote sensing, DL algorithms gained popularity by producing better rice field classification results. Several DL algorithms have been proposed to classify the rice fields from SAR images based on phenological and spatial-temporal profile analysis. Such algorithms are unidimensional convolutional neural networks (1D CNN) [40], gated recurrent unit (GRU) [41], 3D convolutional neural networks (3D CNN) [42], recurrent neural network (RNN) [43], long short-term memory (LSTM), and bi-directional LSTM (Bi-LSTM) [44]. Wu et al. [41] implemented a gated recurrent unit (GRU) to detect and classify rice fields in Taiwan from SAR images. The GRU is a modified version of LSTM in which forget gate and input gate were combined as a single update gate and has an additional reset gate. This network can extract temporal features from time-series SAR images to perform pixel-wise classification. This model produces satisfactory results in terms of overall accuracy and performance. Another recent work [42] proposed a 3D convolutional neural network (3D CNN) for rice crop yield estimation from Sentinel-2 images in Nepal. This model is constructed with a series of convolutional and pooling layers to classify each pixel of an image by extracting spatial features from SAR images. Additionally, the authors studied the impact of the multi-temporal, climate, and soil data on the rice crop classification accuracy. The model validated the effectiveness of the model with respect to other regression and deep learning crop yield prediction techniques. Wang et al. [45] proposed a combination of convolutional neural network and long short-term memory (ConvLSTM) to estimate winter wheat yield in the major producing regions of China. The LSTM is a main module of the ConvLSTM network, which can extract short-term or long-term dependencies from time-series SAR images. The ConvLSTM model first extracts spatial features and then temporal features afterward for crop classification.
Convolutional neural networks (CNN) are one of the most widely used models in deep learning, allowing different convolution kernels by sliding the input image and performing certain calculations to find out the features in the image. The dimension of convolutional kernels and the number of convolutional layers are the challenging issues to extract features using CNN. RNN is popularly used for sequential data modeling and feature extraction. However, RNNs are not suitable to map rice fields from SAR images due to the parameters being determined by the length of the time series.
This study combines the characteristics of the RNN and CNN models to perform rice field classification from SAR time-series images. The major contributions of this study include:
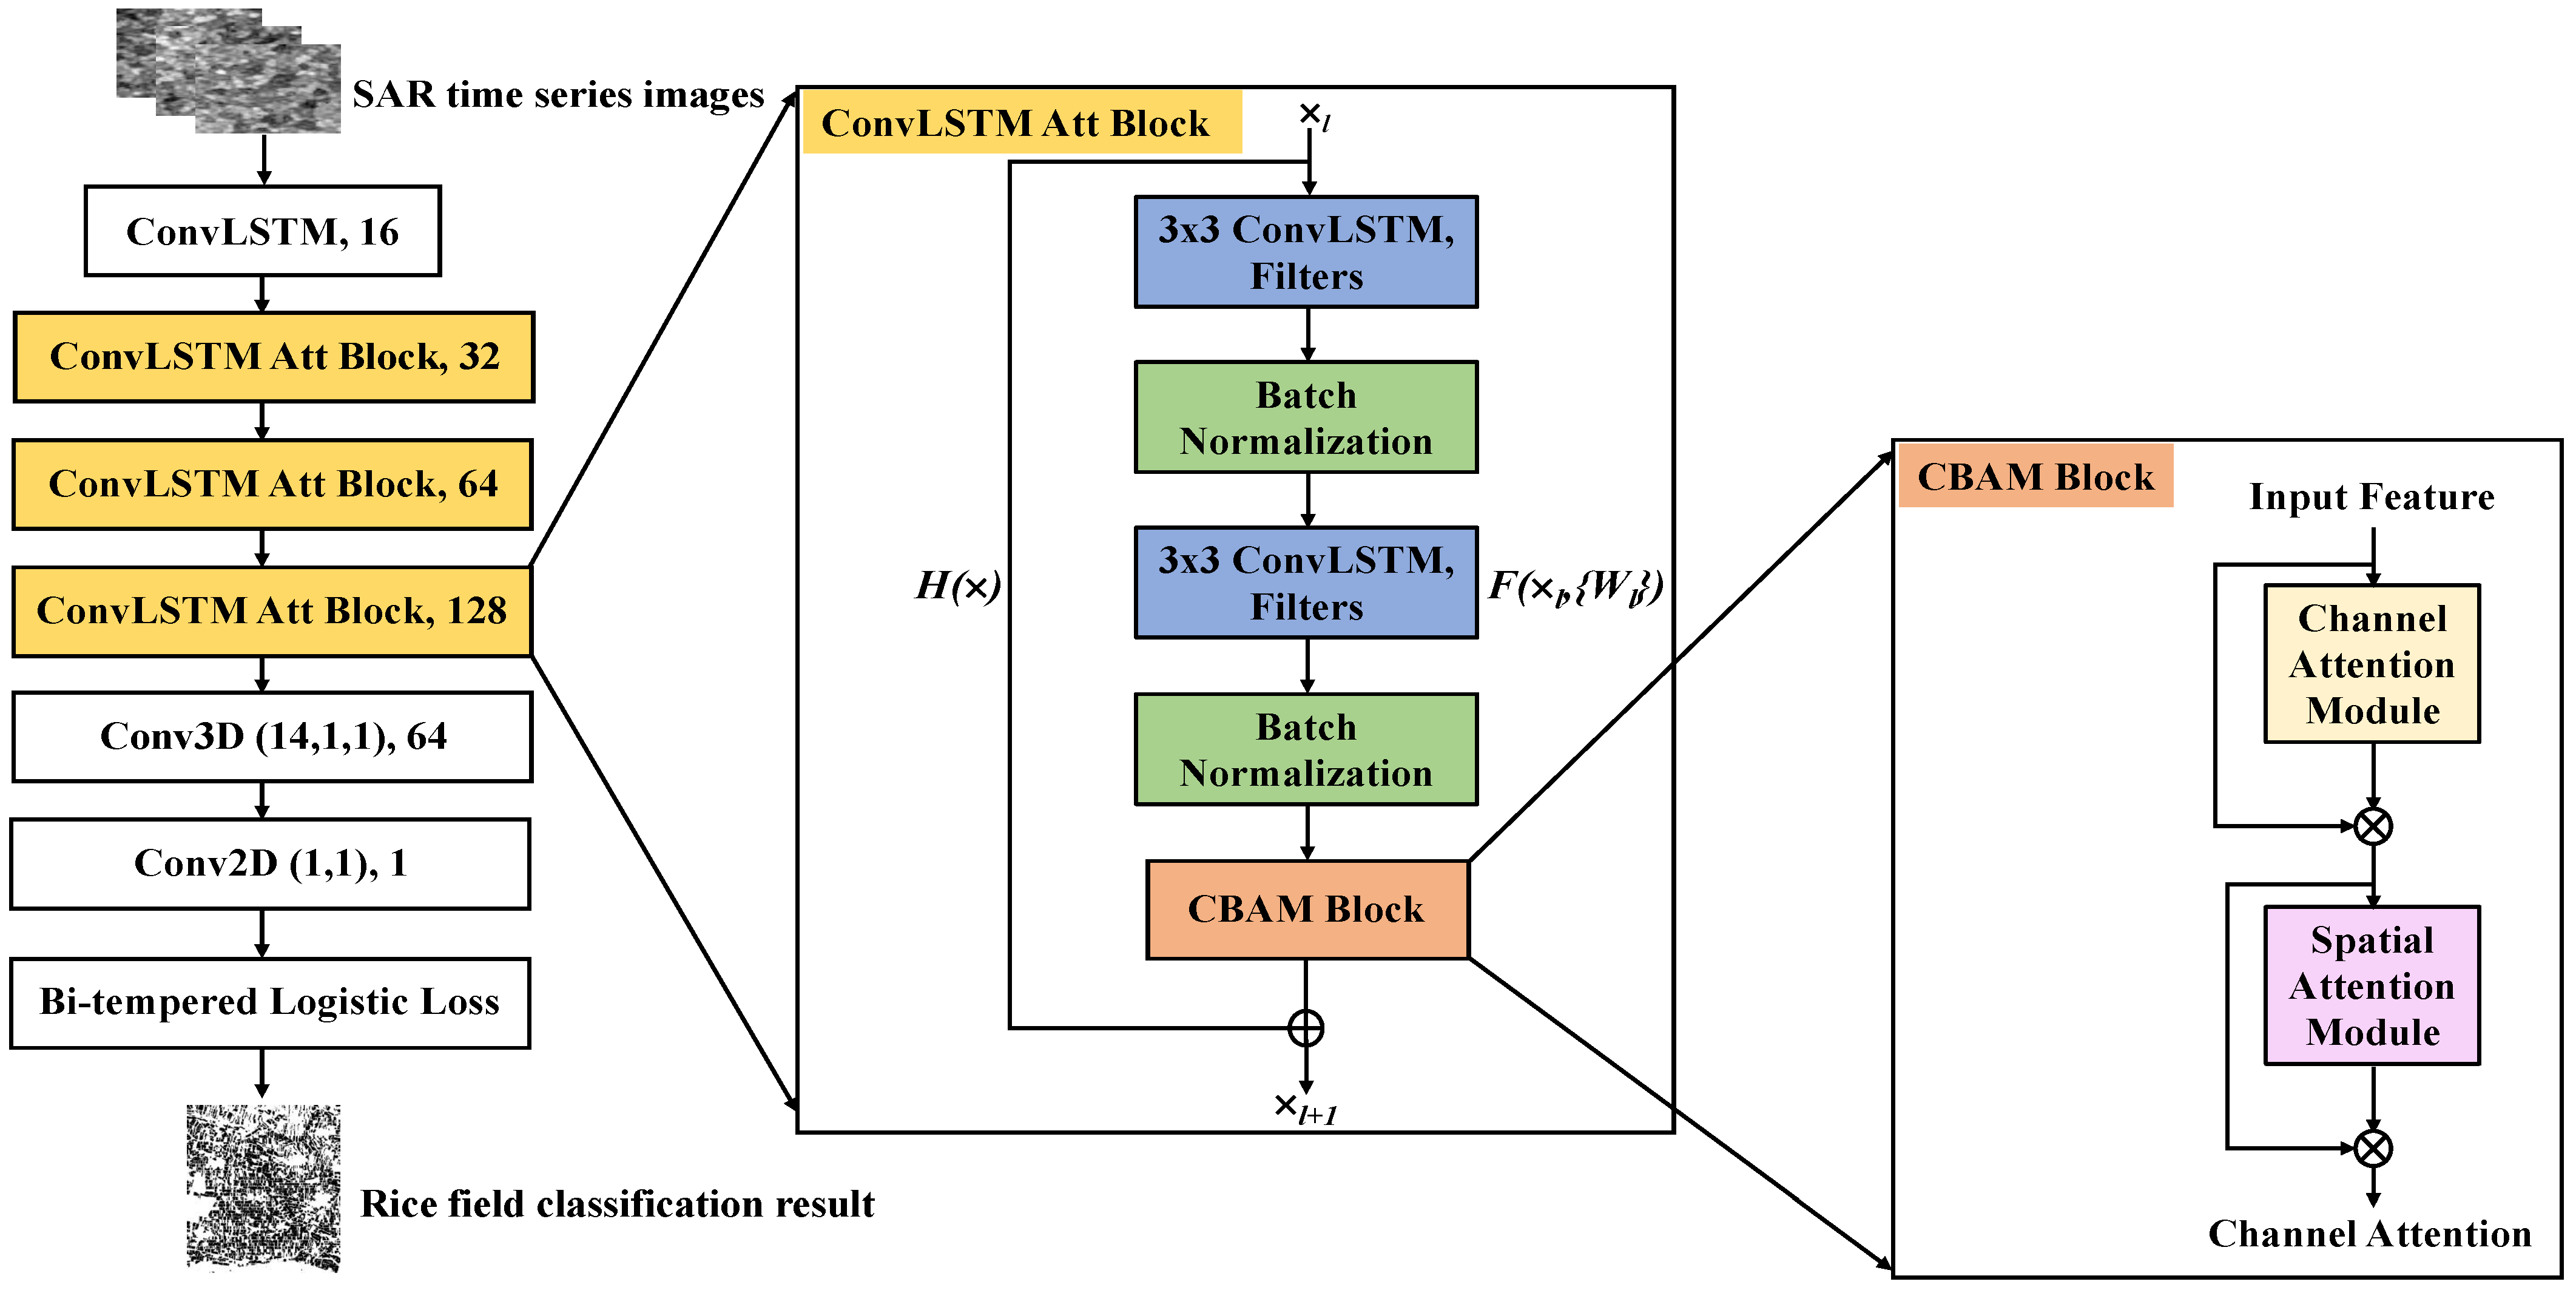
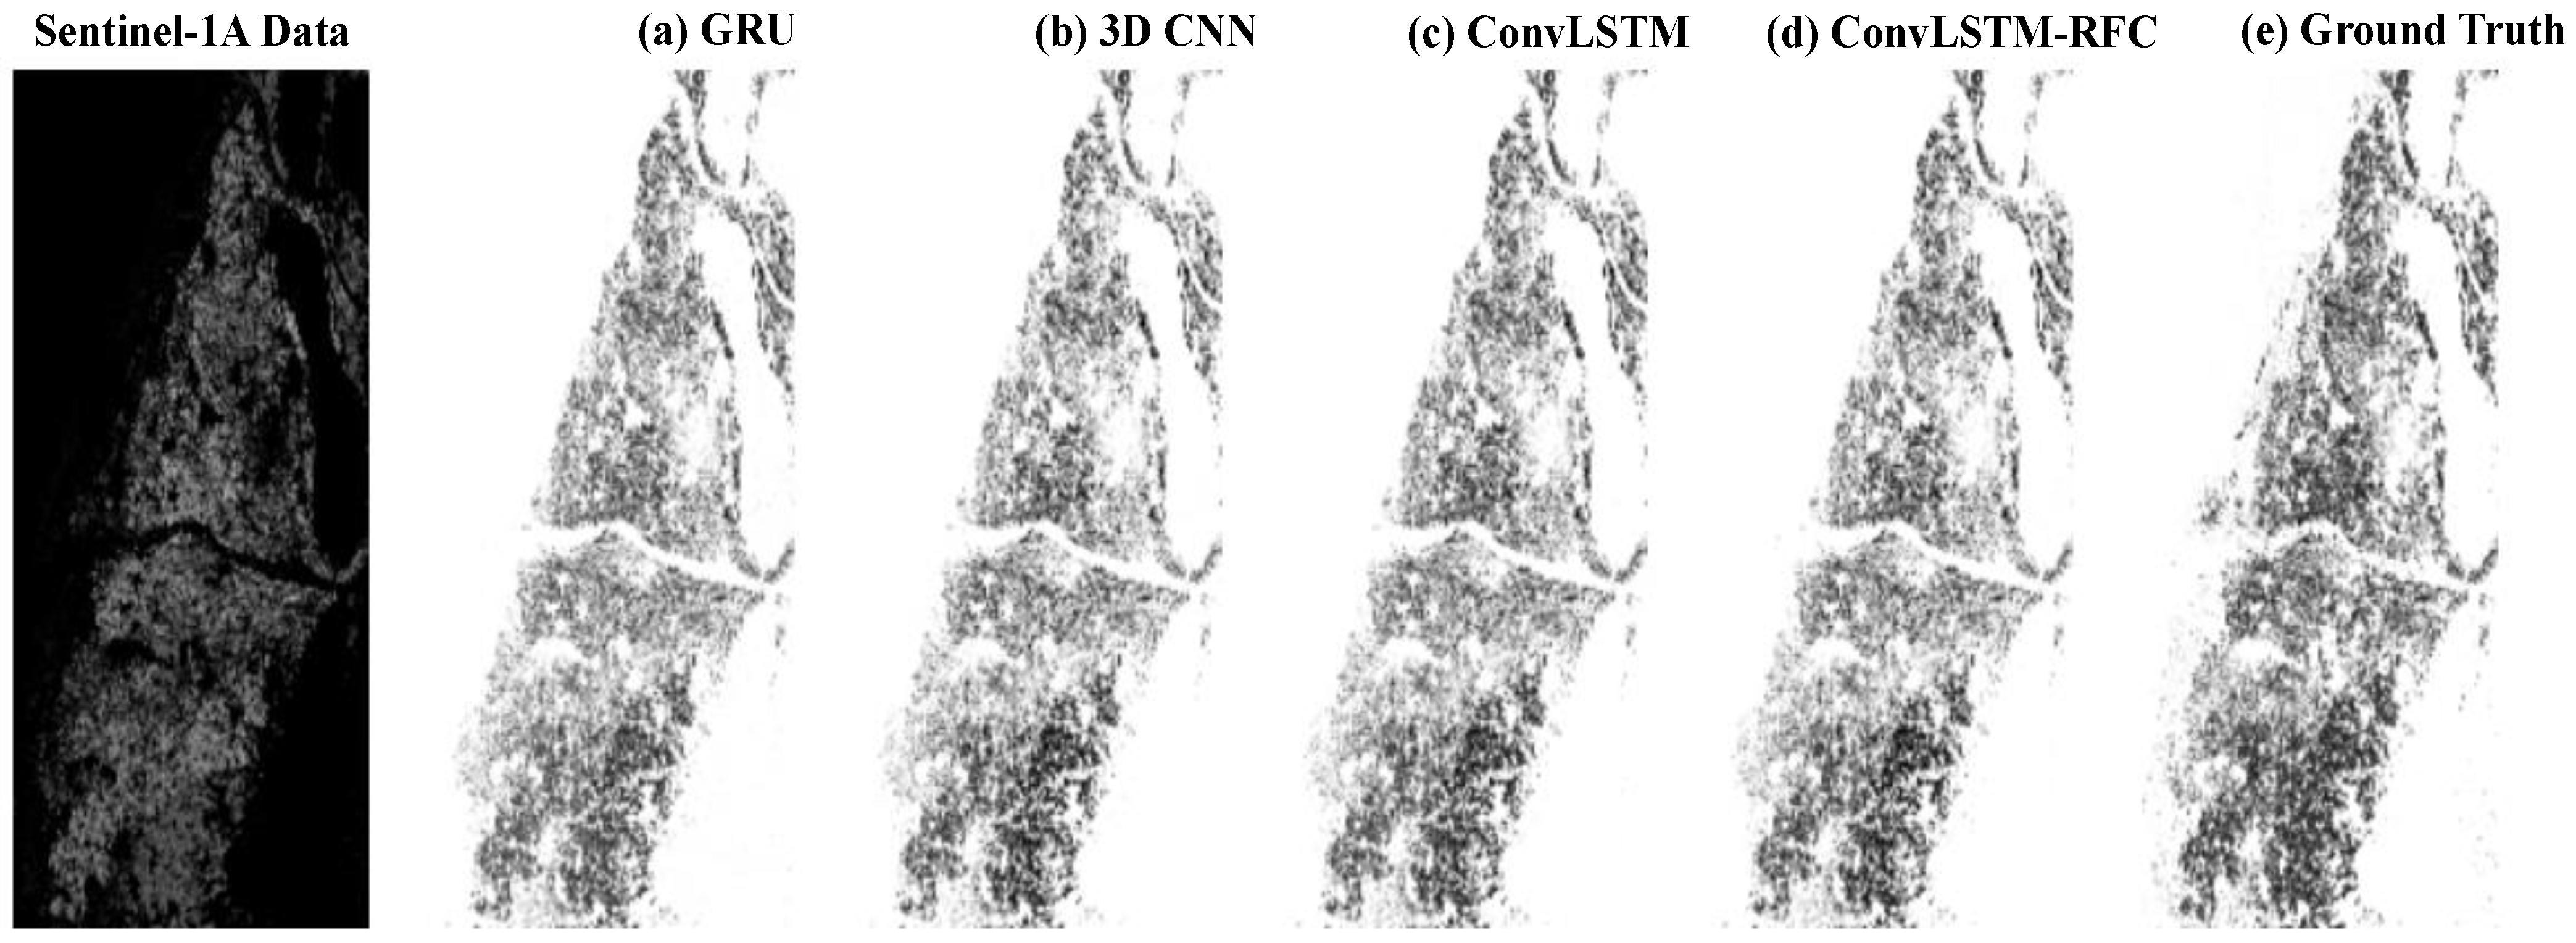
  • This study proposes an original rice field classifier based on a spatial-temporal neural network called a convolutional long short-term memory rice field classifier (ConvLSTM-RFC) to classify rice fields in study areas from Sentinel-1A SAR images.
  • The proposed model ConvLSTM-RFC is designed with multiple convolutional long short-term memory attentions blocks (ConvLSTM Att Block) to predict spatial-temporal features from the SAR images.
  • The binary cross entropy loss function has been replaced by the bi-tempered logistic loss function (BiTLL) to make the proposed model more robust to noise in data during the training process [46].
  • A convolutional block attention module (CBAM) was embedded in the residual structure of the ConvLSTM Att Block to extract refined features from the intermediate feature maps.
The rest of this paper is organized as follows: Section 2 describes the study area and ground truth, and the architectural details of the proposed method. Section 3 presents the experimental results. Section 4 discusses the merit of this study. Finally, the article is concluded with its primary findings in Section 5.

2. Materials and Methods
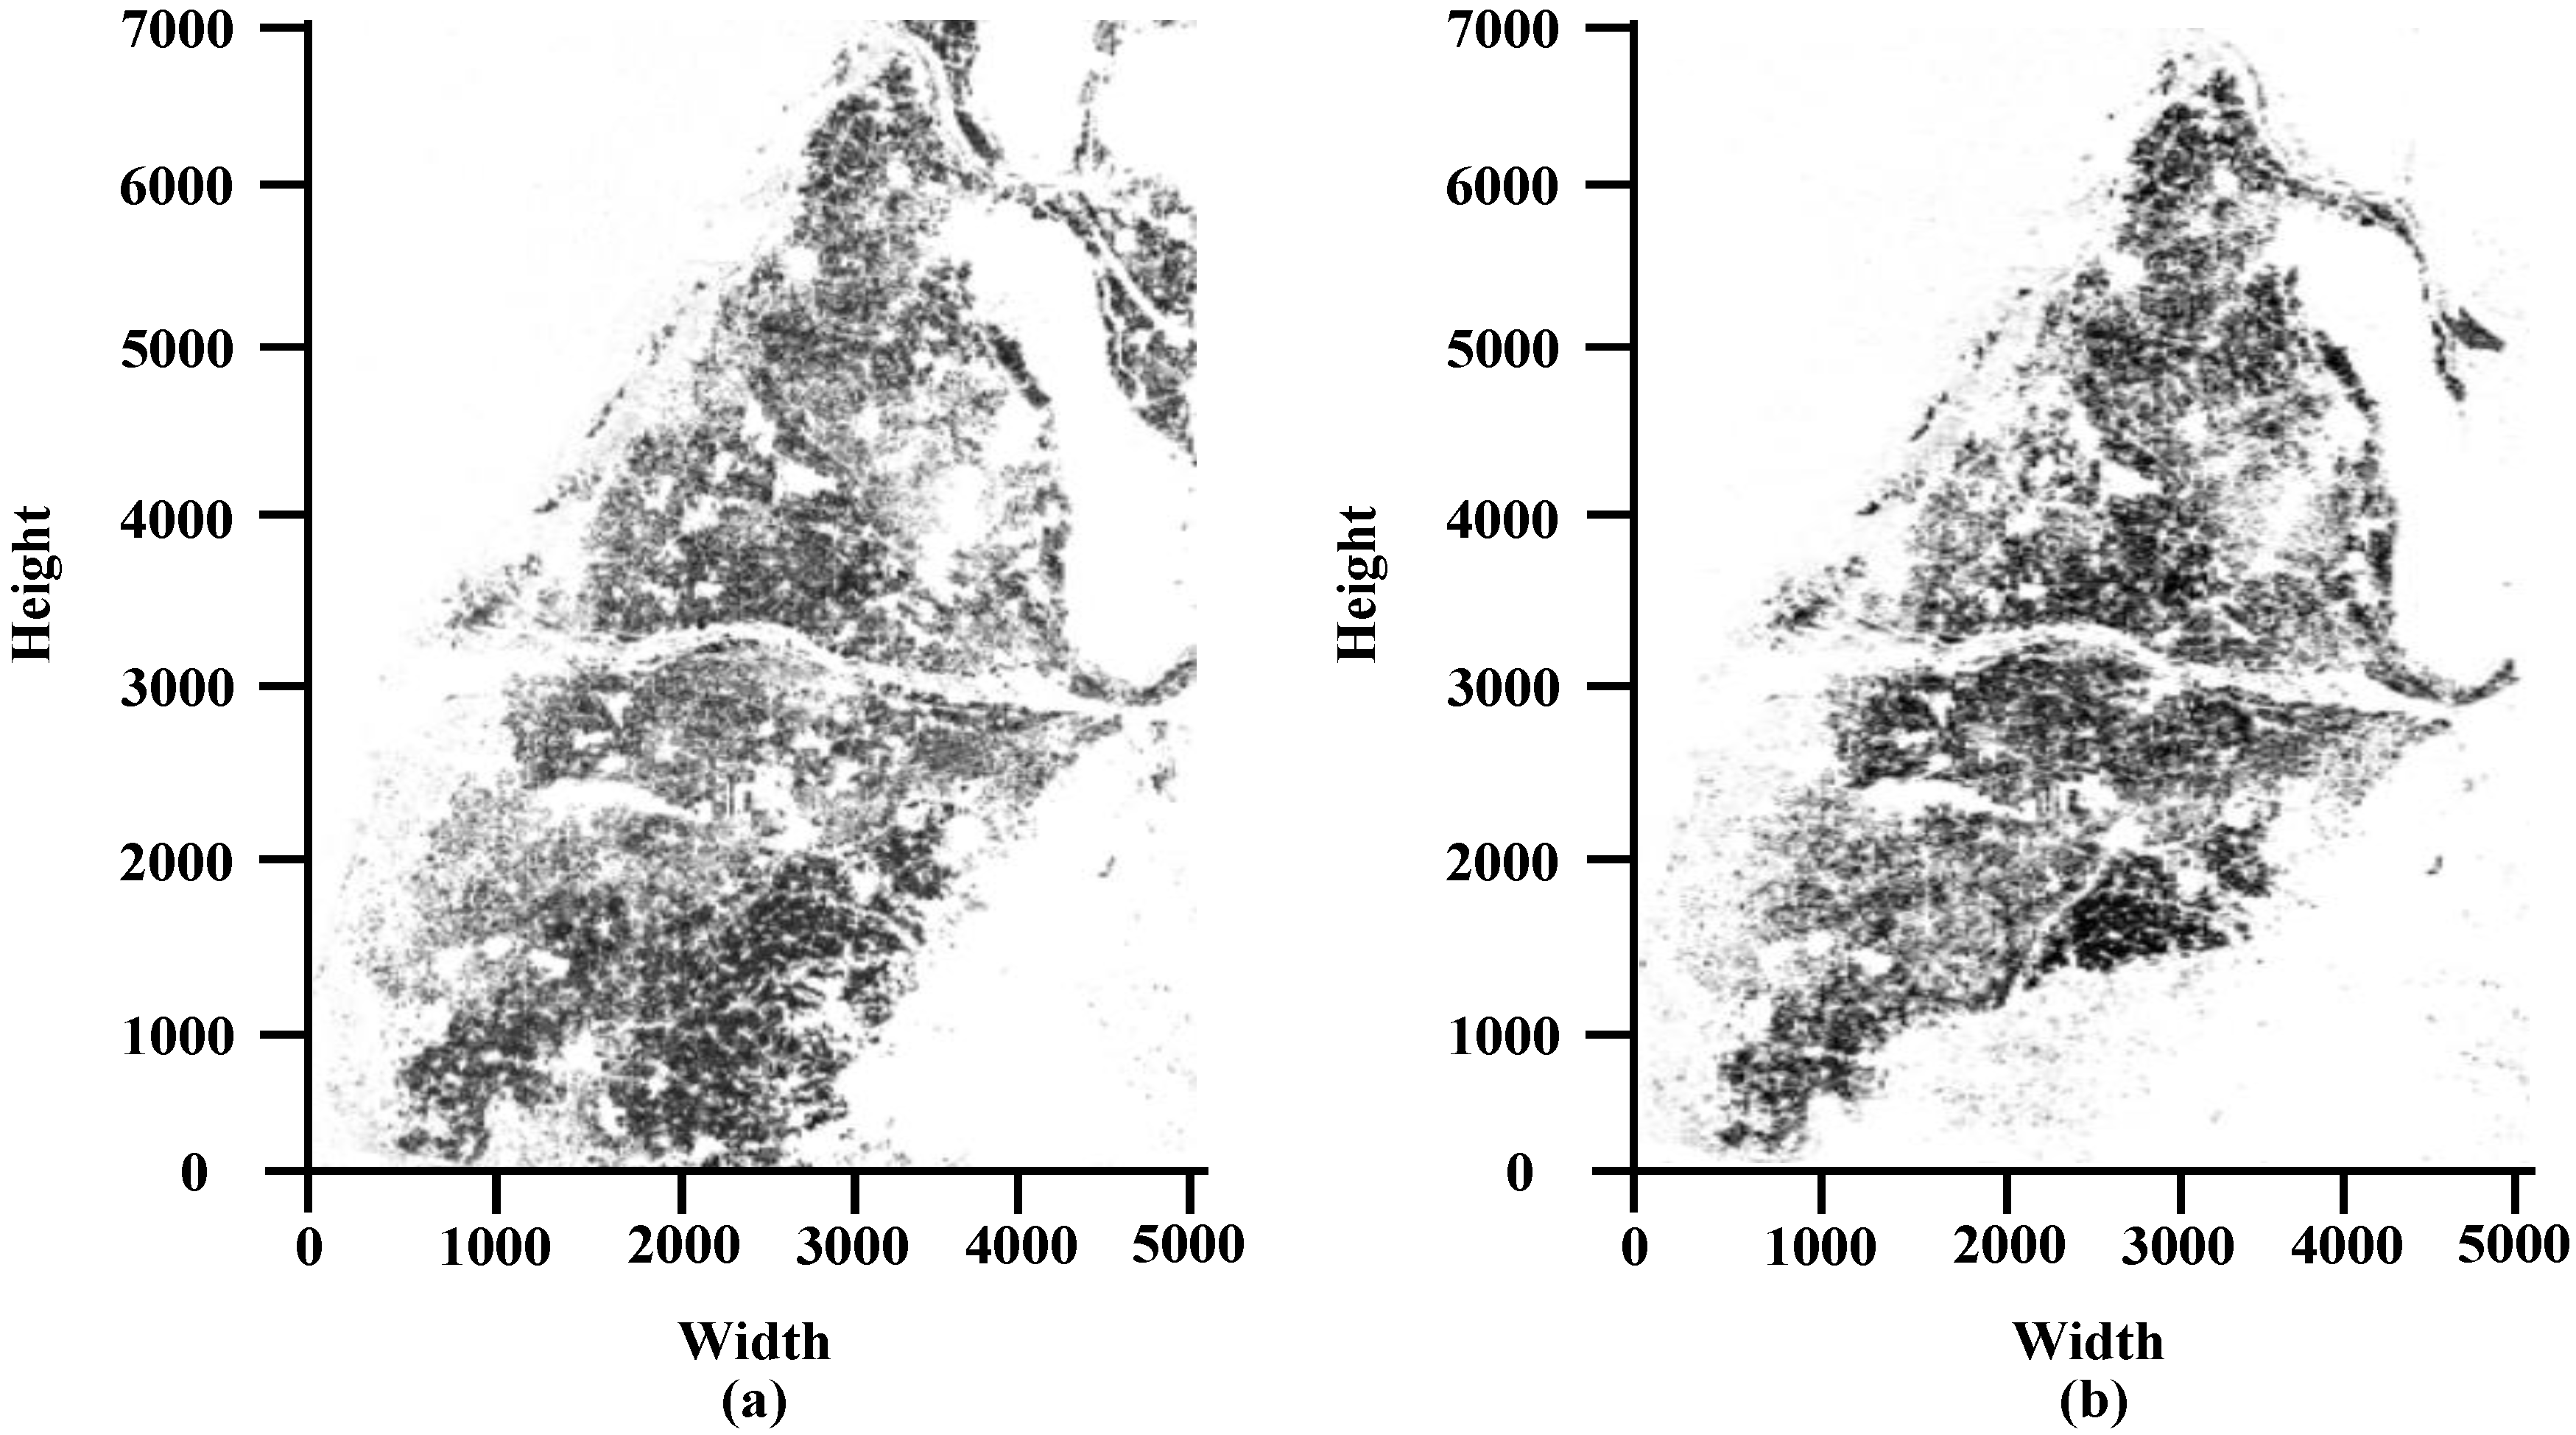
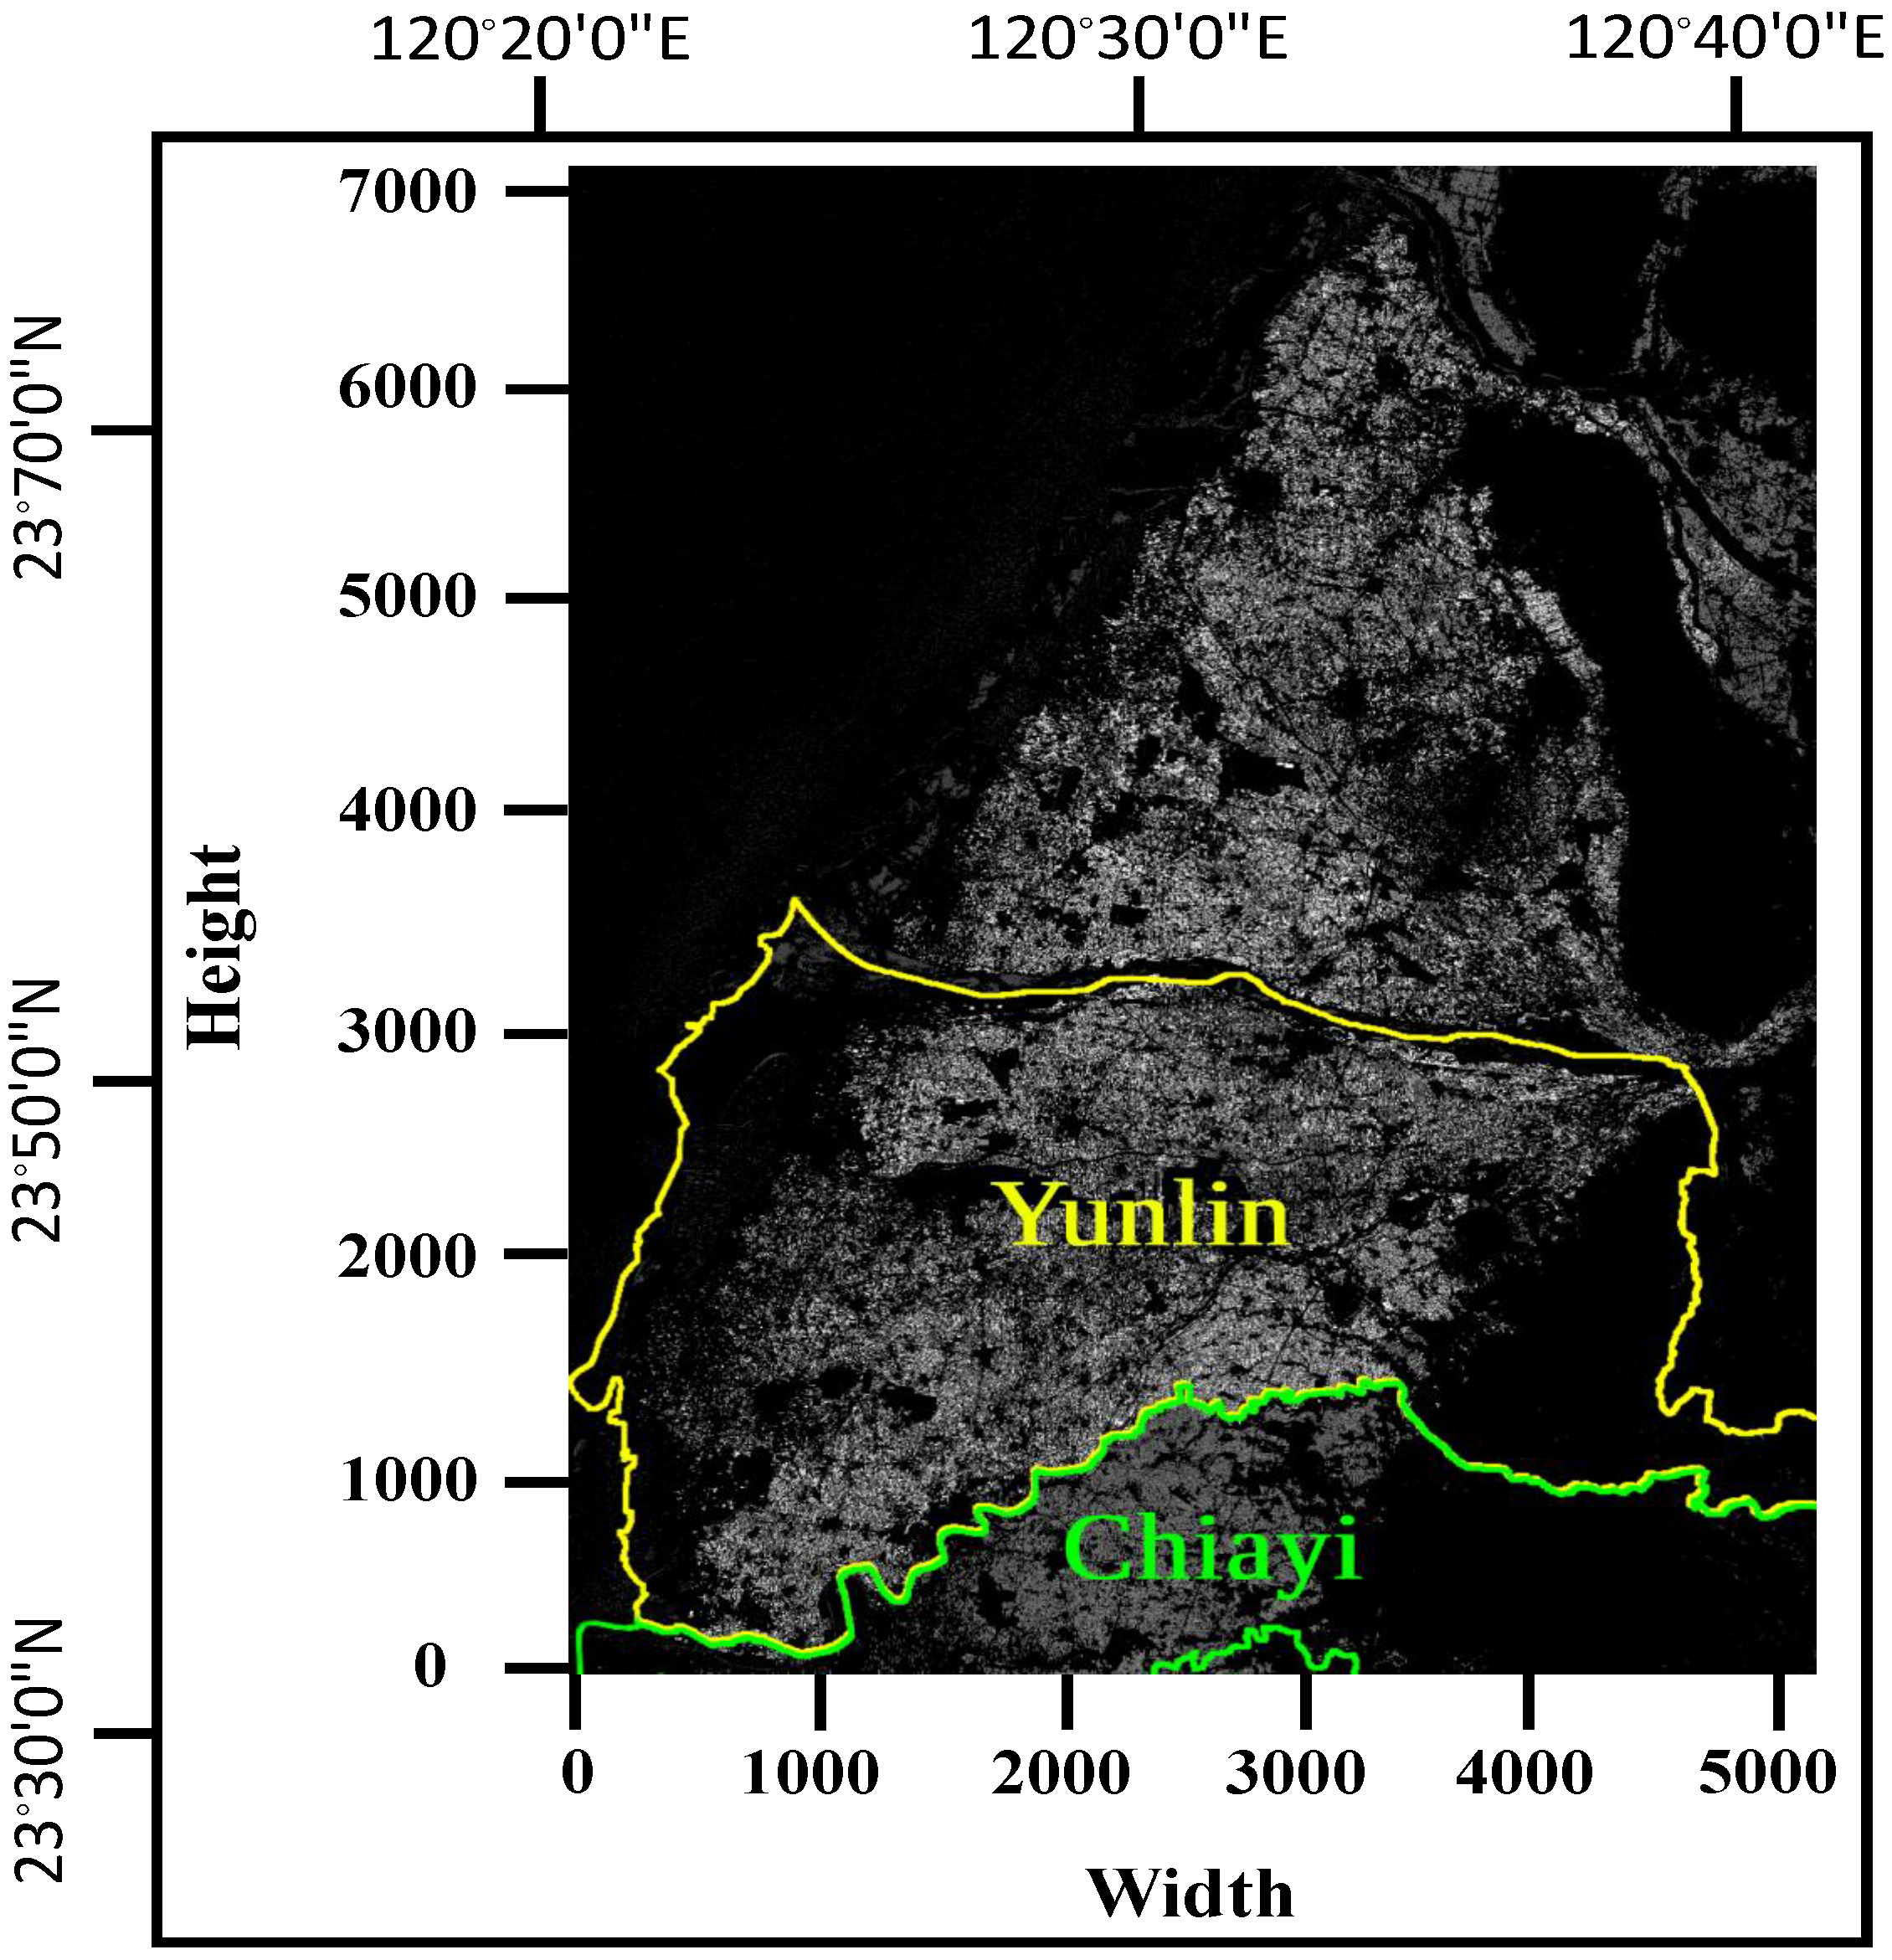
2.1. Study Area

Yunlin and Chiayi regions are used as a study area in this research, as shown in Figure 1. The study areas span about 1290.8 km2 and 1903 km2 respectively. The latitude and longitude information of Yunlin and Chiayi counties is 23 ° 42 18 N 120 ° 28 34 E and 23 ° 29 46.34 N 120 ° 38 30.75 E respectively. These two counties are ranked as the top two rice-growing regions in Taiwan. These regions’ climate belongs to the sub-tropical monsoon with an annual average temperature of 22.6 °C and rainfall of 1028.9 mm. Although rice is a dominant crop, other crash crops such as maize, peanut, wheat, sweet potato, corn, and soybeans are cultivated in these regions. Most of the agricultural land is scattered with non-rice crops among rice fields. According to rice phenology, rice cultivation in a year can be divided into two seasons. The first season is from February to June and the second season is from July to December. Rice cultivation greatly depends on weather and water availability. Therefore the rice cultivation period takes about 130 days for the first season and is about 110 days for the second season. In the second season, farmers might not be cultivated in some areas due to the climate and irrigation factors.

2.2. Ground Truth Data

Agriculture and Food Agency (AFA) and Taiwan Agriculture Research Institute (TARI) carry out the duties of developing the food industry and addressing the challenges in the agricultural sector in the Taiwan region. The ground truth data provided by these organizations are acquired with multiple periods and different spatial resolutions through aerial photos, Landsat-8, and Rapideye satellites. These organizations have been collecting agricultural land maps, aerial photos, and satellite images every year on a regular basis. First, agricultural lands are identified by using field investigators and ground surveys. Then, aerial photos and satellite images are applied in distinguishing agricultural land and mapping the ground truth data of crops. In 2017, the study area’s rice distribution areas were 31,054.26 ha and 18,380.44 ha, respectively. The experimental results of the proposed ConvLSTM-RFC were compared with the ground truth data provided by AFA and TARI to assess the accuracy of the rice field classification. The ground truth data of the rice field distribution of the two study areas in 2017 are shown in Figure 2. The ground truth data used in this experiment consists of rice fields and non-rice fields. In Figure 2a,b white indicates the non-rice and black indicates the rice fields.

2.3. Data Preprocessing and Smoothing Processes

The dataset used in this paper is the acquired imagery of the Sentinel-1A satellite. Sentinel-1A was launched in April 2014 to support operational applications in the areas of marine monitoring, land monitoring, and emergency management services. This satellite acquires spatial resolution images once every 12 days. Sentinel-1A operates at C-band, enabling them to acquire high-resolution images regardless of the light and weather. It comprises vertical-vertical (VV) and horizontal-vertical (VH) polarizations with a spatial resolution of 20 m × 22 m in the range and azimuth directions. The Sentinel-1A data used in this study was acquired with a swath width of 250 km in the interferometric wide swath (IW) acquisition mode. Level-1 ground range detected (GRD) SAR data with a pixel spacing of 10 m × 10 m format is utilized. The acquired SAR data are open access and were available free from the website. This research mainly focused on classifying rice fields in the first season; therefore, we downloaded the data from February to July in 2017. The complete details of the SAR data are listed in Table 1.
The SAR data preprocessing steps, including radiation correction, geometric correction, and speckle noise removal, are performed using sentinel application platform software (SNAP). However, ConvLSTM neural network layers were stacked to increase the computational complexity of the model to extract more features. The residual architecture is used in the neural network to avoid features loss by increasing the number of layers. The ConvLSTM attention block (ConvLSTM Att Block) is created to extract the features of SAR time-series images. The bi-tempered logic loss function is used in the proposed model to prevent the deep neural network of the model from false noise data. This loss function also controls the training of the model. The methodology of this study is shown in Figure 3.

2.4. Architecture and Strategy

In this study, 14 time-series images of the first season rice are combined as the time axis, extracted the VV and VH polarization images as the two characteristic channels of the model input, and the size of 7800 × 2800 SAR image is divided into a size of 78 × 28 small images. This research adopts the time series spatial-temporal neural network model ConvLSTM to perform rice field classification from SAR time-series images. This section will introduce the network architecture and optimization strategies used in this study. The overall network architecture of the proposed model convolutional LSTM network for rice field classification from SAR images (ConvLSTM-RFC) is shown in Figure 4.
The ConvLSTM-RFC is a combination of Conv2D, Conv3D, ConvLSTM, and ConvLSTM Att Block. A series of SAR images are firstly input to the model. Then, they are passed through the ConvLSTM-RFC model to generate rice field maps finally. Next, the ConvLSTM Att Block design, the strategy used to modify the optimizer, and the loss function will be introduced.

2.4.1. Convlstm Attention Block

In this study, referring to the architecture of ResNet [47], the network is deepened and the convLSTM attention block (ConvLSTM Att Block) is designed as shown in Figure 4. In 2018, Woo et al. [48] proposed a new attention-based CNN, named as convolutional block attention module (CBAM), to protect the attention mechanism and feature-map exploitation of the network. CBAM is simple in design and uses the spatial location of the object in object detection. As shown in Figure 4, CBAM first applies channel attention and then spatial attention sequentially to extract the refined feature maps. This serial learning process generates the 3D attention map and reduces the parameters as well as computational cost. The simple design of CBAM can be integrated easily with any CNN architecture.
ConvLSTM Att Block consists of two ConvLSTM neural network layers, two batch normalization, and one CBAM block, as shown in Figure 4. To improve the performance of the CNN model, the depth, width, and cardinality of the model occupy an important part. While deepening the network, the residual structure is used to avoid the divergence of the gradient in the forward pass. In Figure 4, x 1 is the input feature data, x ( l + 1 ) is the enhanced feature generated after this structure, which can be described by the following formula:
x ( l + 1 ) = C B A M ( F ( x l , { W l } ) ) + H ( x l )
where C B A M ( F ( x l , { W l } ) ) is the convolutional attention module function and H ( x l ) is a potential mapping function.
F ( x l , { W l } ) = B N ( o l t a n h ( c l ) )
The function F ( x l , { W l } ) represents the mapping function corresponding to each ConvLSTM Att Block. Where o l and C l are the output gates and cell units passing through the ConvLSTM network layer, and B N ( o l t a n h ( c l ) ) represents the optimized neural network method for batch normalization operations. In this study, to make the feature fusion, H ( x l ) is designed as follows:
H ( x l ) = W s x l
where ∗ represents convolution which is used for dimension matching operation. For any depth L and each ConvLSTM Att Block l, the combined ConvLSTM Att Block neural network can be taken as the following:
x L = H ( x l ) + i = l L 1 C B A M ( F ( x i , { W i } ) ) + H ( x i )

2.4.2. Incorrect Labeled Data

The ground truth data provided by Agriculture and Food Agency (AFA) and Taiwan Agriculture Research Institute (TARI) is shown in Figure 2. After comparing the real data of the rice fields of AFA and TARI, it was found that the real data presented by the two parties are mismatched. Hence, this study selected the ground truth data from AFA with more rice fields in the same area for training and testing labels.
In addition, in a binary classification problem, particularly the traditional logic loss function is sensitive to abnormal values. These incorrectly labeled data are often far away from the decision boundary, which will cause the model decision boundary to be pulled and may sacrifice other correct values. To avoid the adverse effects of noise data on model training, this research replaced the traditional logistic loss function with the bi-tempered logistic loss function. Bi-tempered logistic loss function uses its temperature and tail weight parameters to constrain the outliers.

2.4.3. Bi-Tempered Logistic Loss

Amid et al. [46] introduced the bi-tempered logistic loss function to address the issue of noise presented in the dataset. This noise can affect the quality of a segmentation output disproportionately. The authors propose two modifications to overcome this issue. First, the softmax output is replaced with a heavy tailed softmax function is given by the following equation:
y i ^ = e x p t 2 ( a i ^ λ t 2 ( a ^ ) ) , w h e r e λ t 2 ( a ^ ) R
such that j C e x p t 2 ( a i ^ λ t 2 ( a ^ ) ) = 1 . Second, the entropy function is replaced with a tempered version, given by the following equation:
l o s s = i C ( y i ( l o g t 1 y i l o g t 1 y i ^ ) 1 2 t 1 ( y i 2 t 1 y i ^ 2 t 1 ) )
The two parameters are temperature t 1 and tail-heaviness t 2 determine how heavy-tailed the functions become. When both t 1 and t 2 are 1, the bi-stable logic loss function is an ordinary logic loss function. The temperature parameter t 1 is a parameter between 0 and 1, and the smaller its value, the more restrictive it is to the bounds of the logistic loss function. The tail weight t 2 is defined as a parameter greater than or equal to 1. The larger the value, the thicker the tail will be, and the slower the decay will be compared to the exponential function.

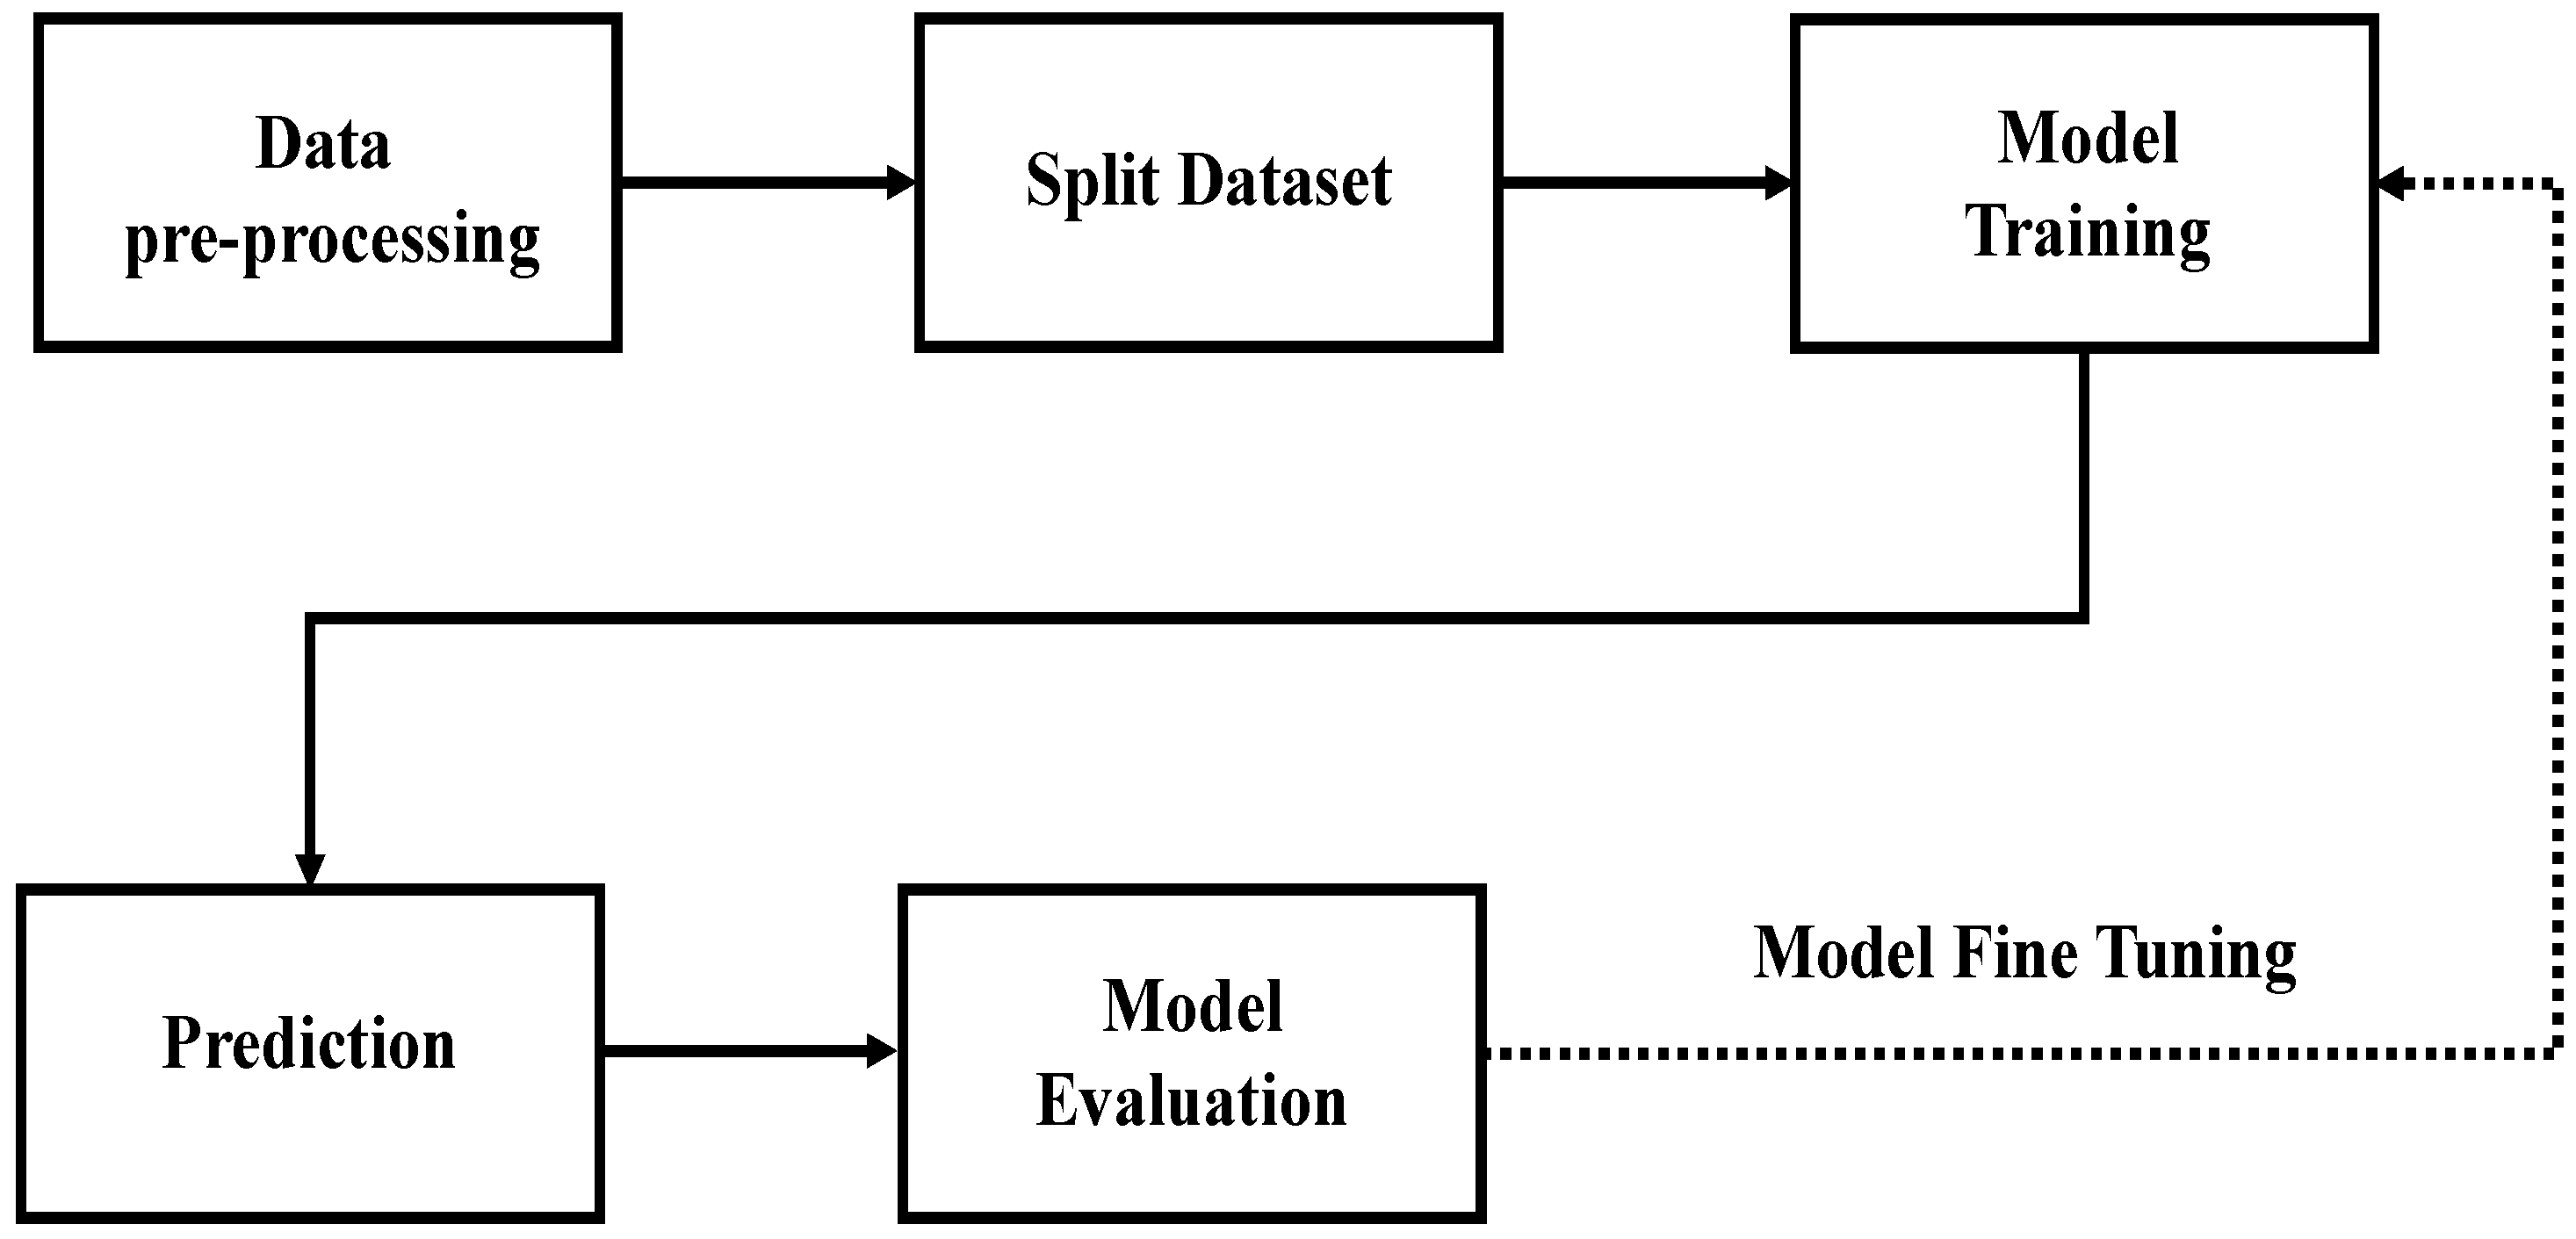
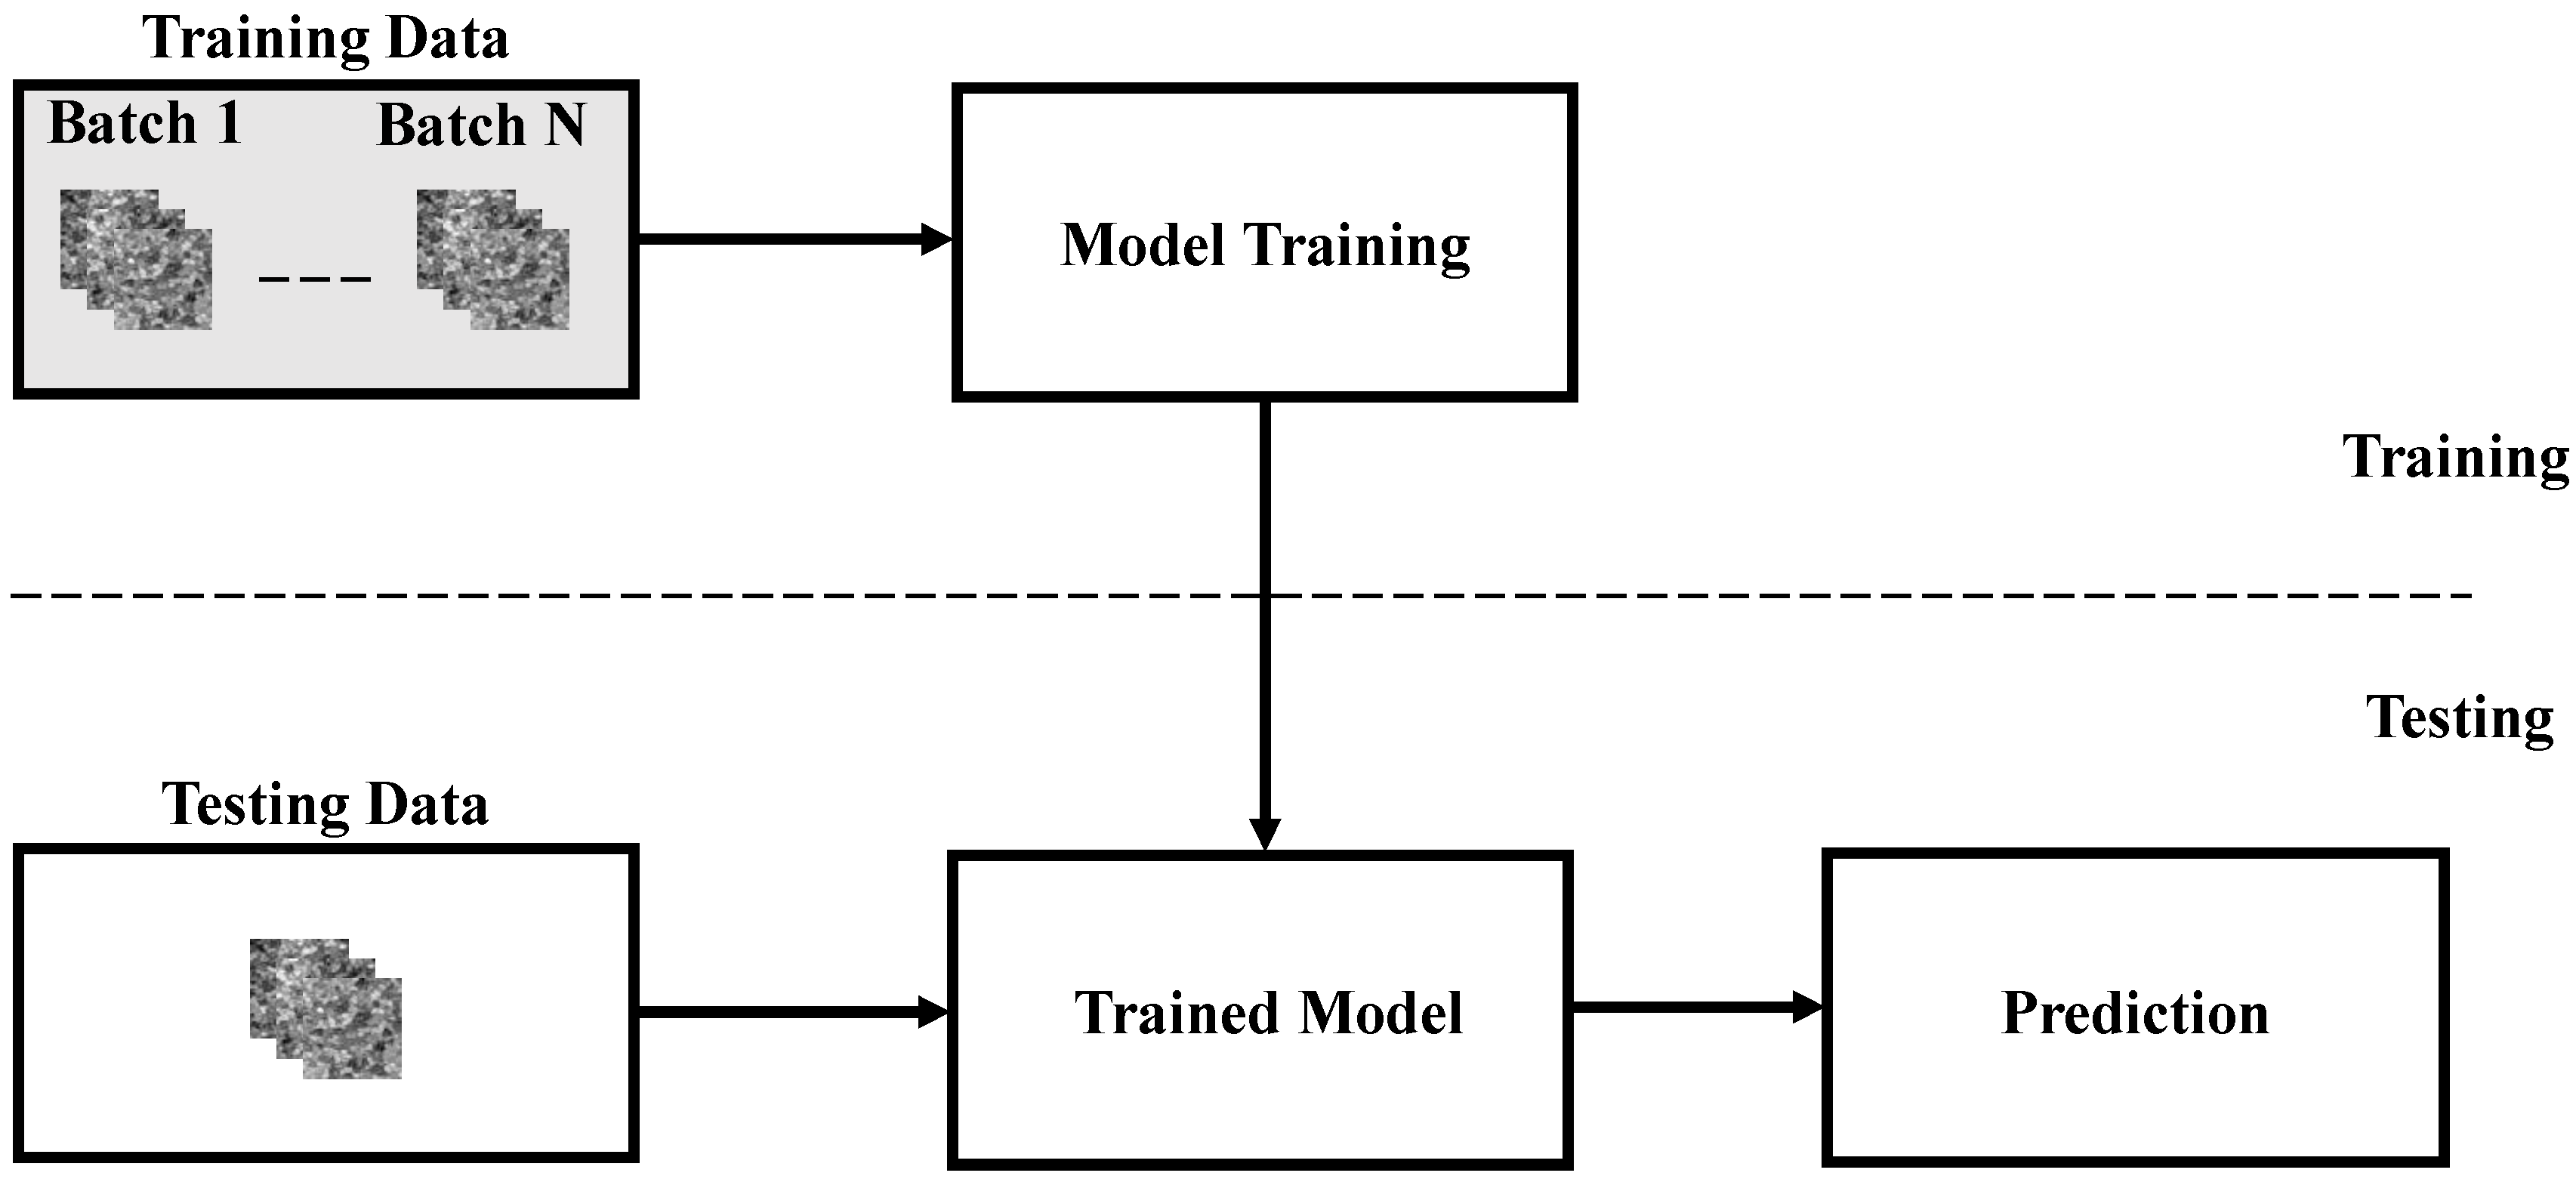
2.5. Training and Testing Process

This experiment used Sentinel-1A SAR time-series images for the training and testing of all the models. Initially, the data was preprocessed and smoothened, then a total number of 10,000 images with a height × width of 78 × 58 pixels were generated. The total data is split into training and testing. Therefore, in the experiment, 8000 images are allocated for training (80%) and 2000 images for testing (20%). The data has been randomly scrambled to avoid the uneven distributions happening during the training and testing, and the random number seed is set to 42.
The training and testing process of the study is shown in Figure 5. The training and testing datasets were randomly divided. When the training process was completed, the models were tested using the testing data. The goal of the proposed model is to generate a rice distribution map in the selected area by classifying whether each pixel belongs to rice or non-rice.

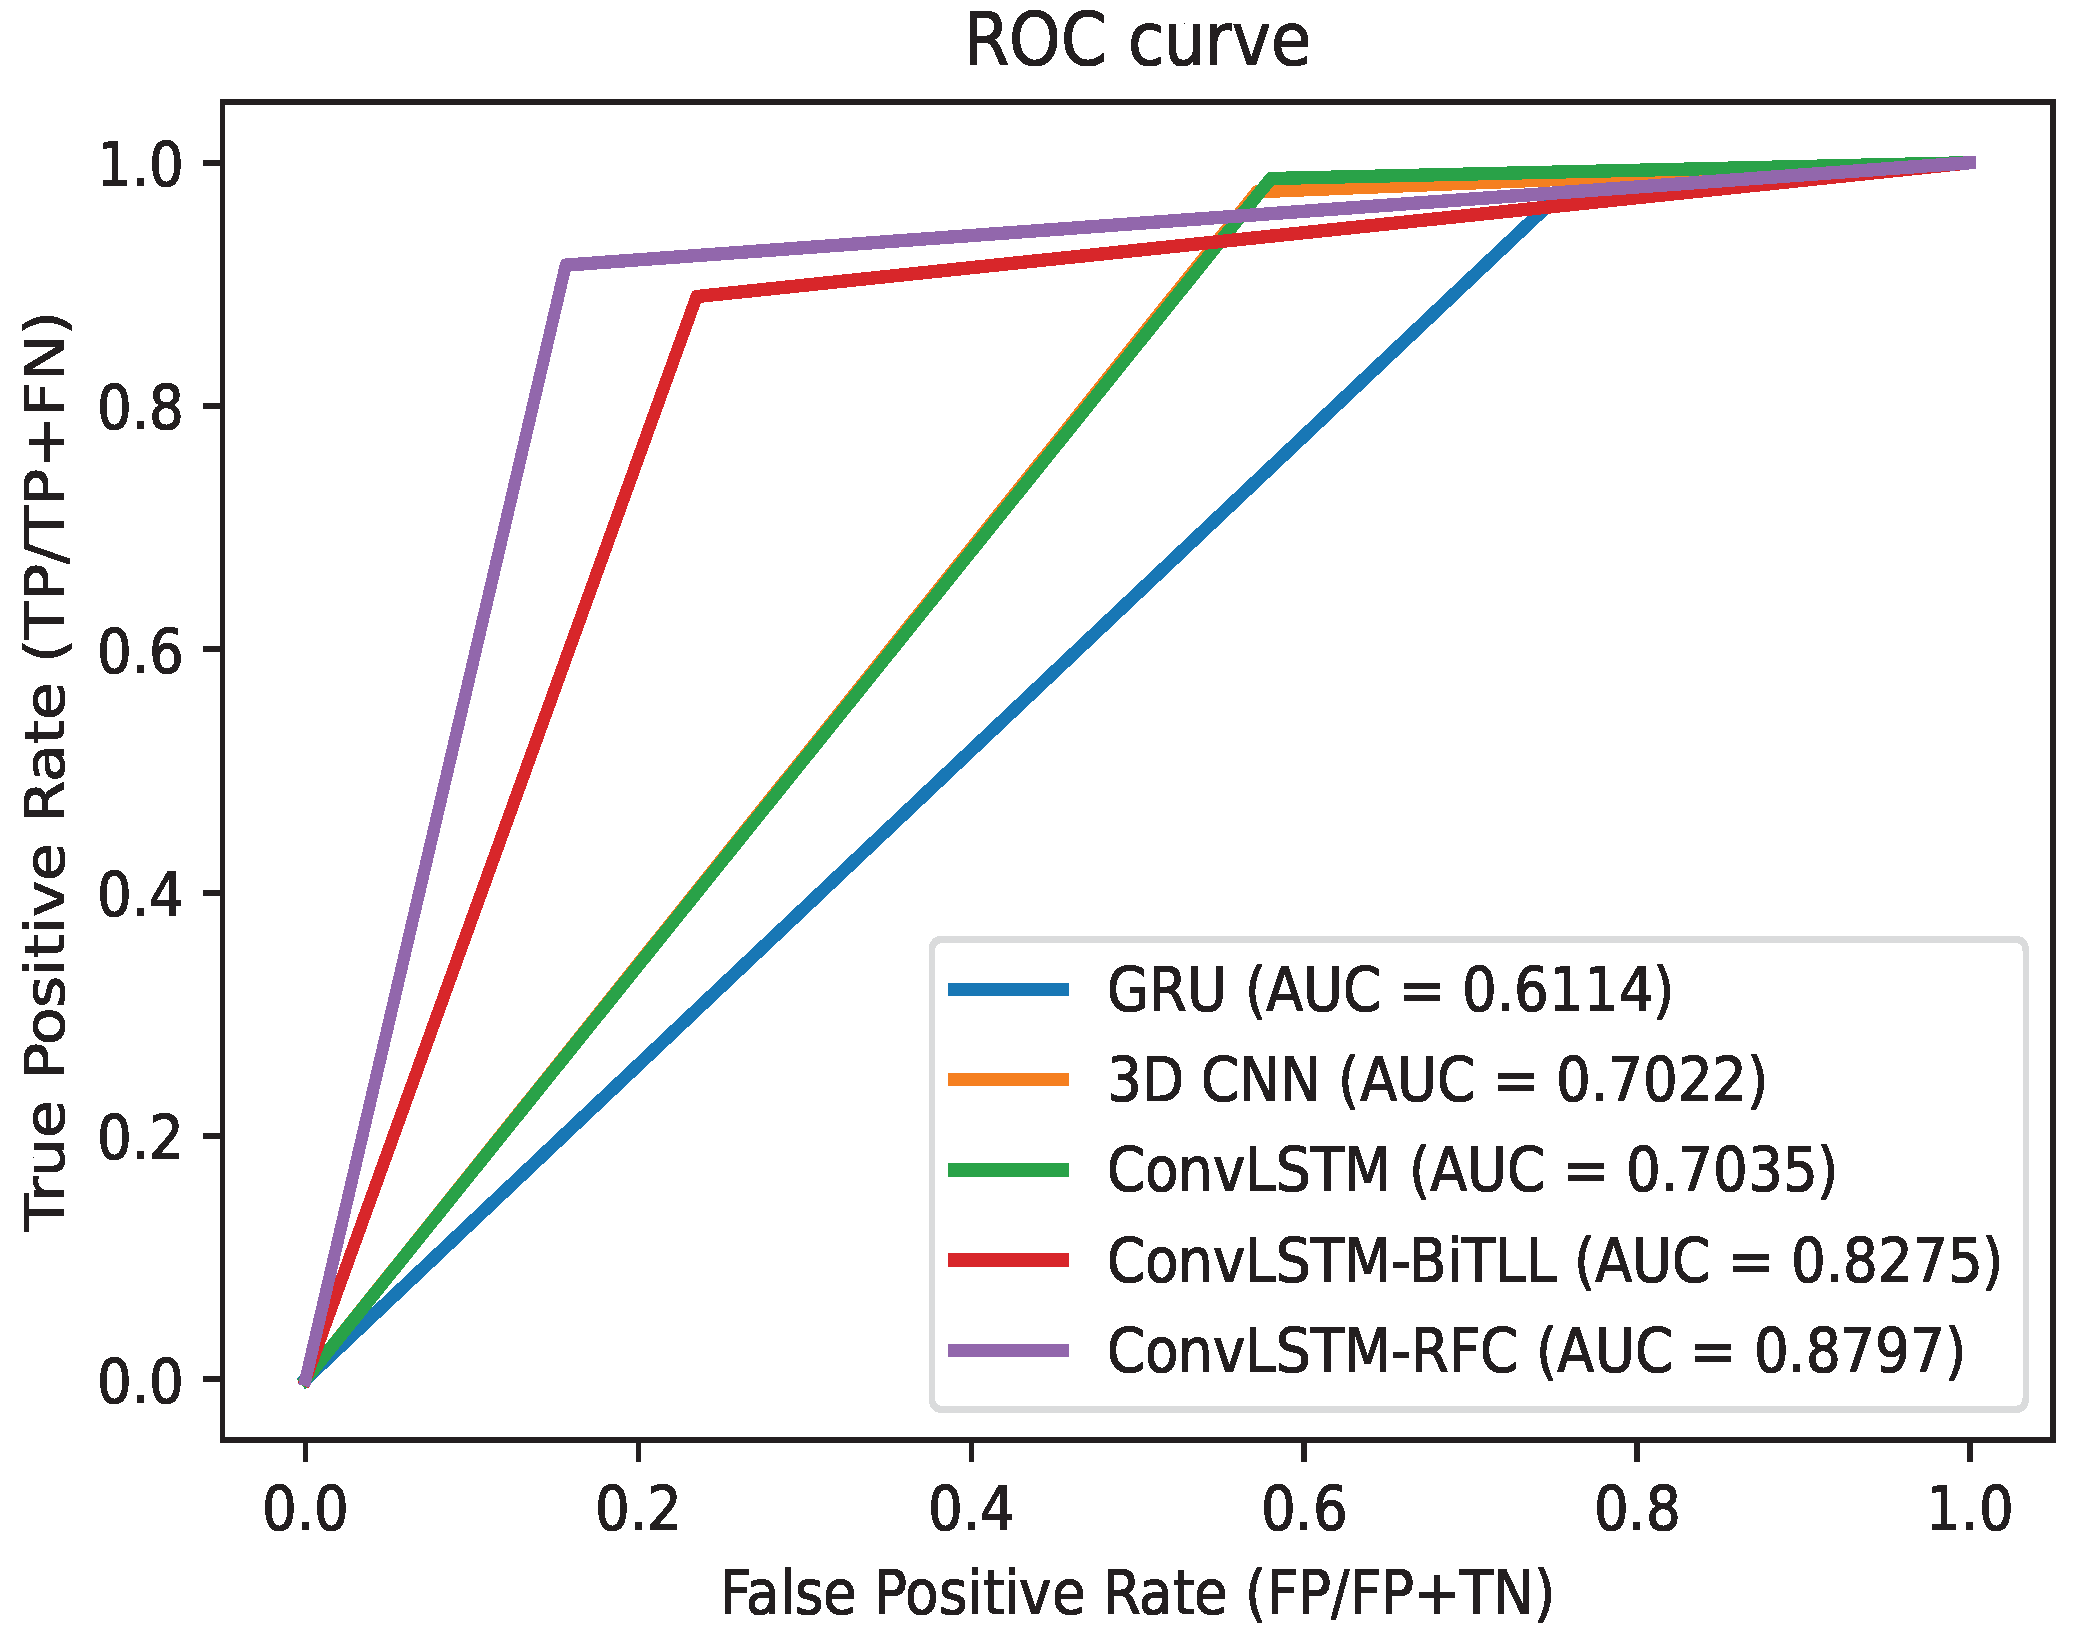
2.6. Model Evaluation

The most common performance evaluation metrics in computer vision and image processing were used to evaluate the performance of the proposed model. The metrics are confusion matrix, precision, recall, F1-score, accuracy, and receiver operating characteristic curve (ROC). The values of precision, recall, F1-score, and accuracy are formally given by the following equations:
P r e c i s i o n = T P T P + F P
R e c a l l = T P T P + F N
F 1 s c o r e = 2 × P r e c i s i o n × R e c a l l P r e c i s i o n + R e c a l l
A c c u r a c y = T N + T P T N + T P + F P + F N
where TP, TN, FP, and FN are the number of true positive, true negative, false positive, and false-negative observations, respectively, in a classification with a probability threshold of 0.5.

2.7. Execution Environment

All the experiments were performed using a PC with Intel(R) Xeon(R), CPU E5-2630 v4@ 2.20 GHz, and 64 GB of RAM. Two NVIDIA RTX2080Ti GPU with 11 GB of memory. Python 3.7 with CUDA 10.1 and cuDNN 7.6. The operating system is 64-bit Ubuntu 20.04.

3. Results

In this study, experiments were carried out to assess the rice field classification efficiency of the ConvLSTM-RFC model. The efficiency of the ConvLSTM-RFC model is compared with three different neural network models. These three models are GRU representing the temporal model, 3D CNN representing the spatial model, and ConvLSTM representing the spatial-temporal model, respectively. All the models used in this study were trained and tested using the time series data obtained from the Sentinel-1A satellite. After data preprocessing and smoothing processes, a total number of 10,000 images with a height × width of 78 × 58 pixels are generated. The train/test had 8000 images for training (80%), and 2000 images for testing (20%). Table 2 listed the respective training parameter settings of all the deep learning models.
The experimental results are compared with the model evaluation indicators and the hyperparameters in the model. Yunlin and Chiayi regions are used as the study area. The rice field classification results of all models were compared with the ground truth data from Agriculture and Food Agency (AFA), as shown in Figure 6.

3.1. Influence of Spatial-Temporal Model

The identification results of all models are listed in Table 3. From Table 3, it is observed that the proportion of rice that is actually not rice but was incorrectly identified as rice (false positive) in GRU is 74.24%, 3D CNN is 51.80%, and ConvLSTM is 51.16%.
From Table 4, it can be seen that the overall model constructed by the ConvLSTM spatial-temporal neural network has the highest F1 score of 96.48% and an accuracy of 95.70%. From the current results, it can be seen that although the overall accuracy is satisfactory, the ConvLSTM is more effective in recognizing non-rice. In the next section, the model will be optimized and adjusted for this problem.

3.2. Influence of Different Optimized Strategy

In this paper, three methods were used to improve the ConvLSTM-RFC efficiency. The first method is modifying the loss function from binary cross-entropy to bi-tempered logistic loss, which is less sensitive to noisy labels. The second method is to deepen the network architecture and ConvLSTM is used as the residual architecture. The last method combines the above two methods and uses the attention mechanism for the features in the residual architecture to output more important features in space and timing. Table 2 lists the hyperparameter setting of this optimization method.
As shown in the Table 3 and Table 4, after modifying the loss function to bi-tempered logistic loss, each evaluation index has risen substantially. In the case of non-rice but incorrectly identified as rice (false positive), among the proportions classified as rice, nearly half of the non-rice. In the original model, architecture without modification of the loss function was incorrectly marked as rice. In the second method, ConvLSTM was deepened as a residual error. The structure can still make the evaluation indicators of the model have a slight increase. Finally, the CBAM attention mechanism strengthens the features in each time sequence and space. The overall final optimization result has an accuracy of 98.08% and an F1 score of 94.77%. However, the proportion of rice that is actually non-rice but was incorrectly identified as rice (false positive) is as low as 15.08%.
Finally, the ROC curve is used to evaluate the performance of all the models used in the experiment and present the area under the curve (AUC) by applying threshold values across the interval [0, 1]. For each threshold, two values are calculated, the true positive rate ratio and the false positive rate ratio. Figure 7 shows the ROC curve, which plots the true positive rate ratio versus false-positive rate ratio with the threshold as a parameter for GRU, Conv3D, ConvLSTM, ConvLSTM-BiTLL, and ConvLSTM-RFC models.

4. Discussion

There are few DL models that have been developed and applied for classification over large-scale rice fields. The traditional ML methods such as DT, RF, and SVM extract features of rice from SAR images either manually or through data mining techniques before the rice classification is performed. Moreover, the RF algorithm with an oversampling technique has been used to classify rice phenology from Landsat-8 satellite images [49]. Furthermore, weighted nearest neighbors (WNN) and quadratic support vector machines (QSVM) were used to detect rice false smut in a complex planting environment [50]. The performance results of these classifiers are better than the actual investigation results.
In recent years, a series of state-of-the-art DL models have been developed and applied for crop mapping. These DL models have achieved higher rice field classification results than the traditional ML models. The CNNs have demonstrated better crop classification performance than the traditional classification methods by learning spatial features from time-series satellite images. In addition, RNNs have shown their potential to perform rice classification by learning temporal features automatically from time-series satellite images.
In this research, the main goal of the proposed ConvLSTM-RFC model is to achieve high classification efficiency. Hence, the characteristics of RNN and CNN models are combined to construct the proposed ConvLSTM-RFC model. The proposed model first extracts spatial features and then temporal features afterward for rice field classification. To achieve the goal, different optimization techniques have been implemented in the proposed model. These techniques include modifying the loss function from binary cross-entropy to a bi-tempered logistic loss function (BiTLL), deepening the architecture with several convolutional long short-term memory attentions blocks (ConvLSTM Att Block), and integrating a convolutional block attention module (CBAM). Figure 6 illustrates the classification results of GRU, 3D CNN, ConvLSTM, and the proposed model ConvLSTM-RFC in the selected study areas. The classification results of the ConvLSTM-RFC model are closer to the ground truth data than those of the GRU, 3D CNN, and ConvLSTM models.
Three reasons led to the best performance of the proposed model over the other models. First, the ConvLSTM-RFC model contains ConvLSTM Att Block to obtain spatial information and temporal features of rice from SAR images. Second, the BiTLL loss function led to the ConvLSTM-RFC model being more robust to noise. Third, ConvLSTM Att Block employs a CBAM block that is capable of recognizing rice pixels using spatial information of rice, which could produce complete rice fields in the classification result. The most noticeable improvement is shown in Table 3, where the ConvLSTM-RFC model has reduced the false positive rate of rice to 15.08%. The ConvLSTM-RFC model has produced the highest accuracy of 98.08%, as shown in Table 4. Meanwhile, the ConvLSTM-BiTLL model has achieved the second-highest accuracy, slightly higher than the 3D CNN model and much higher than that of the GRU model. This indicates that the combined use of spatial and temporal features of rice can improve the accuracy of rice detection. Moreover, Figure 7 shows that the ConvLSTM-RFC model outperformed GRU, 3D CNN, ConvLSTM, and ConvLSTM-BiTLL models in terms of AUC value. The ConvLSTM-RFC model has produced the highest AUC value of 88%. It implies that there has been a significant increase in the AUC value of the ConvLSTM-RFC model after the optimization strategies have been applied. The results show that the proposed model ConvLSTM-RFC has the best performance in classification accuracy, which is more suitable for large-scale rice field mapping.

5. Conclusions

This research proposed a spatial-temporal neural network called a convolutional long short-term memory rice field classifier (ConvLSTM-RFC) for rice field classification from Sentinel-1A SAR images. Unlike the traditional deep learning methods that only use a temporal or spatial neural network for crops classification from SAR images, this research combines both spatial and temporal neural networks in one main network of the proposed model ConvLSTM-RFC. Additionally, ConvLSTM-RFC is constructed with several convolutional long short-term memory attentions blocks (ConvLSTM Att Block) and a bi-tempered logistic loss function (BiTLL). In the ConvLSTM Att Block design, a convolutional block attention module (CBAM) was integrated into the ConvLSTM Att Block to enhance the representation of rice fields in different periods on SAR images. The binary cross-entropy loss function has been replaced by the BiTLL function to make the proposed model more robust to the incorrectly labeled data. The experimental results demonstrated that the ConvLSTM-RFC model had reached the highest accuracy of 98.08% and the false-positive rate of rice is as low as 15.08%. On the other hand, the ConvLSTM-RFC produced the highest AUC value of 88%. Compared with temporal and spatial deep learning models, ConvLSTM-RFC greatly reduced the proportion of model false positives and achieved higher accuracy. While vegetation indices could have an impact on the classification result of rice fields. Future work will study the rice fields classification using the combination of vegetation indices and spatial-temporal features.

Author Contributions

Conceptualization, M.A.; Data curation, T.-H.C.; Formal analysis, Y.-L.C., J.H.C., L.C. and M.A.; Funding acquisition, M.-C.W.; Investigation, T.-H.C., N.B.T. and S.-C.M.; Methodology, Y.-L.C. and T.-H.C.; Resources, Y.-L.C. and T.-H.T.; Software, T.-H.C.; Supervision, J.H.C. and M.A.; Validation, T.-H.T., L.C. and N.B.T.; Visualization, J.H.C.; Writing—original draft, N.B.T.; Writing—review & editing, Y.-L.C. and M.A. All authors have read and agreed to the published version of the manuscript.

Funding

This work was funded by the Ministry of Science and Technology, Taiwan, Grant No. MOST 110-2622-E-027-025, 110-2119-M-027-001, 110-2221-E-027-101, 109-2116-M-027-004; and National Space Organization, Grant No. NSPO-S-110244; and National Science and Technology Center for Disaster Reduction, Grant No. NCDR-S-110096.

Data Availability Statement

Not applicable.

Conflicts of Interest

The authors declare no conflict of interest.

References

  1. Elert, E. Rice by the numbers: A good grain. Nature 2014, 514, S50. [Google Scholar] [CrossRef] [PubMed] [Green Version]
  2. Mohanty, S.; Wassmann, R.; Nelson, A.; Moya, P.; Jagadish, S. Rice and climate change: Significance for food security and vulnerability. Int. Rice Res. Inst. 2013, 14, 1–14. [Google Scholar]
  3. Sekhar, C. Climate change and rice economy in Asia: Implications for trade policy. he State of Agricultural Commodity Markets (SOCO) (Rome, FAO); Food and Agriculture Organization of the United Nations: Rome, Italy, 2018. [Google Scholar]
  4. Son, N.T.; Chen, C.F.; Chen, C.R.; Guo, H.Y. Classification of multitemporal Sentinel-2 data for field-level monitoring of rice cropping practices in Taiwan. Adv. Space Res. 2020, 65, 1910–1921. [Google Scholar] [CrossRef]
  5. Stuecker, M.F.; Tigchelaar, M.; Kantar, M.B. Climate variability impacts on rice production in the Philippines. PLoS ONE 2018, 13, e0201426. [Google Scholar] [CrossRef]
  6. Jiang, Y.; Carrijo, D.; Huang, S.; Chen, J.; Balaine, N.; Zhang, W.; van Groenigen, K.J.; Linquist, B. Water management to mitigate the global warming potential of rice systems: A global meta-analysis. Field Crop. Res. 2019, 234, 47–54. [Google Scholar] [CrossRef]
  7. Chen, C.; van Groenigen, K.J.; Yang, H.; Hungate, B.A.; Yang, B.; Tian, Y.; Chen, J.; Dong, W.; Huang, S.; Deng, A.; et al. Global warming and shifts in cropping systems together reduce China’s rice production. Glob. Food Secur. 2020, 24, 100359. [Google Scholar] [CrossRef]
  8. Mandal, A.C.; Singh, O.P. Climate Change and Practices of Farmers’ to maintain rice yield: A case study. Int. J. Biol. Innov. 2020, 2, 42–51. [Google Scholar] [CrossRef]
  9. Sahajpal, R.; Fontana, L.; Lafluf, P.; Leale, G.; Puricelli, E.; O’Neill, D.; Hosseini, M.; Varela, M.; Reshef, I. Using machine-learning models for field-scale crop yield and condition modeling in Argentina. In Proceedings of the XII Congreso de AgroInformática (CAI 2020)-JAIIO 49 (Modalidad Virtual); 2020; pp. 238–241. [Google Scholar]
  10. Zhao, R.; Li, Y.; Ma, M. Mapping paddy rice with satellite remote sensing: A review. Sustainability 2021, 13, 503. [Google Scholar] [CrossRef]
  11. Verbeiren, S.; Eerens, H.; Piccard, I.; Bauwens, I.; Van Orshoven, J. Sub-pixel classification of SPOT-VEGETATION time series for the assessment of regional crop areas in Belgium. Int. J. Appl. Earth Obs. Geoinf. 2008, 10, 486–497. [Google Scholar] [CrossRef]
  12. Atzberger, C.; Formaggio, A.; Shimabukuro, Y.; Udelhoven, T.; Mattiuzzi, M.; Sanchez, G.; Arai, E. Obtaining crop-specific time profiles of NDVI: The use of unmixing approaches for serving the continuity between SPOT-VGT and PROBA-V time series. Int. J. Remote Sens. 2014, 35, 2615–2638. [Google Scholar] [CrossRef]
  13. Kontgis, C.; Schneider, A.; Ozdogan, M. Mapping rice paddy extent and intensification in the Vietnamese Mekong River Delta with dense time stacks of Landsat data. Remote Sens. Environ. 2015, 169, 255–269. [Google Scholar] [CrossRef]
  14. Huang, J.; Wang, X.; Li, X.; Tian, H.; Pan, Z. Remotely sensed rice yield prediction using multi-temporal NDVI data derived from NOAA’s-AVHRR. PLoS ONE 2013, 8, e70816. [Google Scholar] [CrossRef] [PubMed]
  15. Kwak, Y.; Arifuzzanman, B.; Iwami, Y. Prompt proxy mapping of flood damaged rice fields using MODIS-derived indices. Remote Sens. 2015, 7, 15969–15988. [Google Scholar] [CrossRef] [Green Version]
  16. Muhammad, S.; Zhan, Y.; Wang, L.; Hao, P.; Niu, Z. Major crops classification using time series MODIS EVI with adjacent years of ground reference data in the US state of Kansas. Optik 2016, 127, 1071–1077. [Google Scholar] [CrossRef]
  17. Shao, Y.; Lunetta, R.S.; Wheeler, B.; Iiames, J.S.; Campbell, J.B. An evaluation of time-series smoothing algorithms for land-cover classifications using MODIS-NDVI multi-temporal data. Remote Sens. Environ. 2016, 174, 258–265. [Google Scholar] [CrossRef]
  18. Gumma, M.K.; Thenkabail, P.S.; Teluguntla, P.; Rao, M.N.; Mohammed, I.A.; Whitbread, A.M. Mapping rice-fallow cropland areas for short-season grain legumes intensification in South Asia using MODIS 250 m time-series data. Int. J. Digit. Earth 2016, 9, 981–1003. [Google Scholar] [CrossRef] [Green Version]
  19. Ranghetti, L.; Busetto, L.; Crema, A.; Fasola, M.; Cardarelli, E.; Boschetti, M. Testing estimation of water surface in Italian rice district from MODIS satellite data. Int. J. Appl. Earth Obs. Geoinf. 2016, 52, 284–295. [Google Scholar] [CrossRef]
  20. Singha, M.; Wu, B.; Zhang, M. Object-based paddy rice mapping using HJ-1A/B data and temporal features extracted from time series MODIS NDVI data. Sensors 2017, 17, 10. [Google Scholar] [CrossRef] [Green Version]
  21. Chen, Y.; Lu, D.; Moran, E.; Batistella, M.; Dutra, L.V.; Sanches, I.D.; da Silva, R.F.B.; Huang, J.; Luiz, A.J.B.; de Oliveira, M.A.F. Mapping croplands, cropping patterns, and crop types using MODIS time-series data. Int. J. Appl. Earth Obs. Geoinf. 2018, 69, 133–147. [Google Scholar] [CrossRef]
  22. Busetto, L.; Zwart, S.J.; Boschetti, M. Analysing spatial–temporal changes in rice cultivation practices in the Senegal River Valley using MODIS time-series and the PhenoRice algorithm. Int. J. Appl. Earth Obs. Geoinf. 2019, 75, 15–28. [Google Scholar] [CrossRef]
  23. Pan, B.; Zheng, Y.; Shen, R.; Ye, T.; Zhao, W.; Dong, J.; Ma, H.; Yuan, W. High Resolution Distribution Dataset of Double-Season Paddy Rice in China. Remote Sens. 2021, 13, 4609. [Google Scholar] [CrossRef]
  24. Zhu, Z.; Woodcock, C.E.; Rogan, J.; Kellndorfer, J. Assessment of spectral, polarimetric, temporal, and spatial dimensions for urban and peri-urban land cover classification using Landsat and SAR data. Remote Sens. Environ. 2012, 117, 72–82. [Google Scholar] [CrossRef]
  25. Nguyen, D.B.; Gruber, A.; Wagner, W. Mapping rice extent and cropping scheme in the Mekong Delta using Sentinel-1A data. Remote Sens. Lett. 2016, 7, 1209–1218. [Google Scholar] [CrossRef]
  26. Lopez-Sanchez, J.M.; Vicente-Guijalba, F.; Erten, E.; Campos-Taberner, M.; Garcia-Haro, F.J. Retrieval of vegetation height in rice fields using polarimetric SAR interferometry with TanDEM-X data. Remote Sens. Environ. 2017, 192, 30–44. [Google Scholar] [CrossRef] [Green Version]
  27. Choudhury, I.; Chakraborty, M. Analysis of temporal SAR and optical data for rice mapping. J. Indian Soc. Remote Sens. 2004, 32, 373–385. [Google Scholar] [CrossRef]
  28. Yang, S.; Shen, S.; Li, B.; Le Toan, T.; He, W. Rice mapping and monitoring using ENVISAT ASAR data. IEEE Geosci. Remote Sens. Lett. 2008, 5, 108–112. [Google Scholar] [CrossRef]
  29. Bouvet, A.; Le Toan, T. Use of ENVISAT/ASAR wide-swath data for timely rice fields mapping in the Mekong River Delta. Remote Sens. Environ. 2011, 115, 1090–1101. [Google Scholar] [CrossRef] [Green Version]
  30. He, Z.; Li, S.; Wang, Y.; Dai, L.; Lin, S. Monitoring rice phenology based on backscattering characteristics of multi-temporal RADARSAT-2 datasets. Remote Sens. 2018, 10, 340. [Google Scholar] [CrossRef] [Green Version]
  31. Bazzi, H.; Baghdadi, N.; El Hajj, M.; Zribi, M.; Minh, D.H.T.; Ndikumana, E.; Courault, D.; Belhouchette, H. Mapping paddy rice using Sentinel-1 SAR time series in Camargue, France. Remote Sens. 2019, 11, 887. [Google Scholar] [CrossRef] [Green Version]
  32. Xie, Y.; Peng, F.; Tao, Z.; Shao, W.; Dai, Q. Multielement Classification of a Small Fragmented Planting Farm Using Hyperspectral Unmanned Aerial Vehicle Image. IEEE Geosci. Remote Sens. Lett. 2021, 19, 1–5. [Google Scholar] [CrossRef]
  33. Mansaray, L.R.; Wang, F.; Huang, J.; Yang, L.; Kanu, A.S. Accuracies of support vector machine and random forest in rice mapping with Sentinel-1A, Landsat-8 and Sentinel-2A datasets. Geocarto Int. 2020, 35, 1088–1108. [Google Scholar] [CrossRef]
  34. Minh, H.V.T.; Avtar, R.; Mohan, G.; Misra, P.; Kurasaki, M. Monitoring and mapping of rice cropping pattern in flooding area in the Vietnamese Mekong delta using Sentinel-1A data: A case of an Giang province. ISPRS Int. J. Geo-Inf. 2019, 8, 211. [Google Scholar] [CrossRef] [Green Version]
  35. Karaboga, D.; Basturk, B. On the performance of artificial bee colony (ABC) algorithm. Appl. Soft Comput. 2008, 8, 687–697. [Google Scholar] [CrossRef]
  36. Chang, L.; Chen, Y.T.; Wang, J.H.; Chang, Y.L. Rice-Field Mapping with Sentinel-1A SAR Time-Series Data. Remote Sens. 2021, 13, 103. [Google Scholar] [CrossRef]
  37. Bahrami, H.; Homayouni, S.; McNairn, H.; Hosseini, M.; Mahdianpari, M. Regional Crop Characterization Using Multi-Temporal Optical and Synthetic Aperture Radar Earth Observations Data. Can. J. Remote Sens. 2021, 1–20. [Google Scholar] [CrossRef]
  38. Dong, J.; Fu, Y.; Wang, J.; Tian, H.; Fu, S.; Niu, Z.; Han, W.; Zheng, Y.; Huang, J.; Yuan, W. Early-season mapping of winter wheat in China based on Landsat and Sentinel images. Earth Syst. Sci. Data 2020, 12, 3081–3095. [Google Scholar] [CrossRef]
  39. Yang, L.; Huang, R.; Huang, J.; Lin, T.; Wang, L.; Mijiti, R.; Wei, P.; Tang, C.; Shao, J.; Li, Q.; et al. Semantic Segmentation Based on Temporal Features: Learning of Temporal-Spatial Information from Time-Series SAR Images for Paddy Rice Mapping. IEEE Trans. Geosci. Remote Sens. 2021, 60. [Google Scholar] [CrossRef]
  40. Zhong, L.; Hu, L.; Zhou, H. Deep learning based multi-temporal crop classification. Remote Sens. Environ. 2019, 221, 430–443. [Google Scholar] [CrossRef]
  41. Wu, M.C.; Alkhaleefah, M.; Chang, L.; Chang, Y.L.; Shie, M.H.; Liu, S.J.; Chang, W.Y. Recurrent Deep Learning for Rice Fields Detection from SAR Images. In Proceedings of the IGARSS 2020—2020 IEEE International Geoscience and Remote Sensing Symposium, Waikoloa, HI, USA, 26 September–2 October 2020; IEEE: Piscataway, NJ, USA, 2020; pp. 1548–1551. [Google Scholar]
  42. Fernandez-Beltran, R.; Baidar, T.; Kang, J.; Pla, F. Rice-yield prediction with multi-temporal sentinel-2 data and 3D CNN: A case study in Nepal. Remote Sens. 2021, 13, 1391. [Google Scholar] [CrossRef]
  43. Yuan, Q.; Shen, H.; Li, T.; Li, Z.; Li, S.; Jiang, Y.; Xu, H.; Tan, W.; Yang, Q.; Wang, J.; et al. Deep learning in environmental remote sensing: Achievements and challenges. Remote Sens. Environ. 2020, 241, 111716. [Google Scholar] [CrossRef]
  44. Crisóstomo de Castro Filho, H.; Abílio de Carvalho Júnior, O.; Ferreira de Carvalho, O.L.; Pozzobon de Bem, P.; dos Santos de Moura, R.; Olino de Albuquerque, A.; Rosa Silva, C.; Guimarães Ferreira, P.H.; Fontes Guimarães, R.; Trancoso Gomes, R.A. Rice crop detection using LSTM, Bi-LSTM, and machine learning models from sentinel-1 time series. Remote Sens. 2020, 12, 2655. [Google Scholar] [CrossRef]
  45. Wang, X.; Huang, J.; Feng, Q.; Yin, D. Winter wheat yield prediction at county level and uncertainty analysis in main wheat-producing regions of China with deep learning approaches. Remote Sens. 2020, 12, 1744. [Google Scholar] [CrossRef]
  46. Amid, E.; Warmuth, M.K.; Anil, R.; Koren, T. Robust bi-tempered logistic loss based on bregman divergences. arXiv 2019, arXiv:1906.03361. [Google Scholar]
  47. He, K.; Zhang, X.; Ren, S.; Sun, J. Deep residual learning for image recognition. In Proceedings of the IEEE Conference on Computer Vision and Pattern Recognition, Las Vegas, NV, USA, 26 June–1 July 2016; pp. 770–778. [Google Scholar]
  48. Woo, S.; Park, J.; Lee, J.Y.; Kweon, I.S. Cbam: Convolutional block attention module. In Proceedings of the European conference on computer vision (ECCV), Munich, Germany, 8–14 September 2018; pp. 3–19. [Google Scholar]
  49. Suryono, H.; Kuswanto, H.; Iriawan, N. Rice phenology classification based on random forest algorithm for data imbalance using Google Earth engine. Procedia Comput. Sci. 2022, 197, 668–676. [Google Scholar] [CrossRef]
  50. Chen, F.; Zhang, Y.; Zhang, J.; Liu, L.; Wu, K. Rice False Smut Detection and Prescription Map Generation in a Complex Planting Environment, with Mixed Methods, Based on Near Earth Remote Sensing. Remote Sens. 2022, 14, 945. [Google Scholar] [CrossRef]
Figure 1. Yunlin and Chiayi counties’ data was received from Sentinel-1A in February 2017, where the height and width represent the number of pixels. White indicates the distribution of rice fields.
Remotesensing 14 01929 g001
Figure 2. (a) The ground truth data of study areas from the Agriculture and Food Agency (AFA). (b) The ground truth data of study areas from the Taiwan Agriculture Research Institute (TARI). White indicates the non-rice and black indicates the rice fields, where the height and width represent the number of pixels.
Remotesensing 14 01929 g002
Figure 3. Flowchart of this study.
Remotesensing 14 01929 g003
Figure 4. The architectural framework of the proposed ConvLSTM-RFC.
Remotesensing 14 01929 g004
Figure 5. A flowchart of the training and testing process.
Remotesensing 14 01929 g005
Figure 6. Sentinel-1A image and the rice field classification results of all the models. (a) Predicted result of GRU. (b) Predicted result of 3D CNN. (c) Predicted result of ConvLSTM. (d) Predicted result of ConvLSTM-RFC model. (e) Ground truth data from Agriculture and Food Agency (AFA).
Remotesensing 14 01929 g006
Figure 7. ROC curve of all the models.
Remotesensing 14 01929 g007
Table 1. The complete sensing dates of the Sentinel-1A SAR data used in this study.
Time SeriesYearMonthDay
12017February08
22017February20
32017March04
42017March16
52017March28
62017April09
72017April21
82017May03
92017May15
102017May27
112017June08
122017July02
132017July14
142017July26
Table 2. Hyperparameter settings of all the models used in the experiment.
HyperparameterGRU Configuration3D CNN ConfigurationConLSTM ConfigurationConvLSTM-RFC Configuration
OptimizerAdamAdamAdamRanger
Batch size4096161616
Epoch35606060
Learning rate0.0010.0010.0010.002
Loss functionBinary cross entropyBinary cross entropyBinary cross entropyBiTLL 1
1 BiTLL: Bi-tempered logistic loss (t1 = 0.8, t2 = 1.4, label smooth = 0.1, number of iteration = 5).
Table 3. Confusion matrices results of all models.
GRU
Ground truth
Rice fieldNonrice field
PredictionRice field25.75%74.24%
Nonrice field1.72%98.27%
3D CNN
Ground truth
Rice fieldNonrice field
PredictionRice field48.29%51.80%
Nonrice field2.81%97.18%
ConvLSTM
Ground truth
Rice fieldNonrice field
PredictionRice field48.83%51.16%
Nonrice field2.83%97.16%
ConvLSTM+Bi-tempered logistic loss (ConvLSTM-BiTLL)
Ground truth
Rice fieldNonrice field
PredictionRice field74.19%25.80%
Nonrice field10.41%89.58%
ConvLSTM+Bi-tempered logistic loss+CBAM (ConvLSTM-RFC)
Ground truth
Rice fieldNonrice field
PredictionRice field84.91%15.08%
Nonrice field8.79%91.20%
Table 4. Performance metrics results for all the models.
Neural NetworkAccuracyPrecisionRecallF1-Score
GRU [41]94.03%93.26%97.21%95.19%
3D CNN [42]95.32%95.39%97.51%96.44%
ConvLSTM [45]95.70%95.80%97.16%96.48%
ConvLSTM-BiTLL97.10%98.03%92.51%95.19%
ConvLSTM-RFC98.08%98.64%91.20%94.77%
Publisher’s Note: MDPI stays neutral with regard to jurisdictional claims in published maps and institutional affiliations.

