
Earth Observation to Investigate Occurrence, Characteristics and Changes of Glaciers, Glacial Lakes and Rock Glaciers in the Poiqu River Basin (Central Himalaya)

 ,
,  , ,
, ,  , , and
Abstract
:1. Introduction
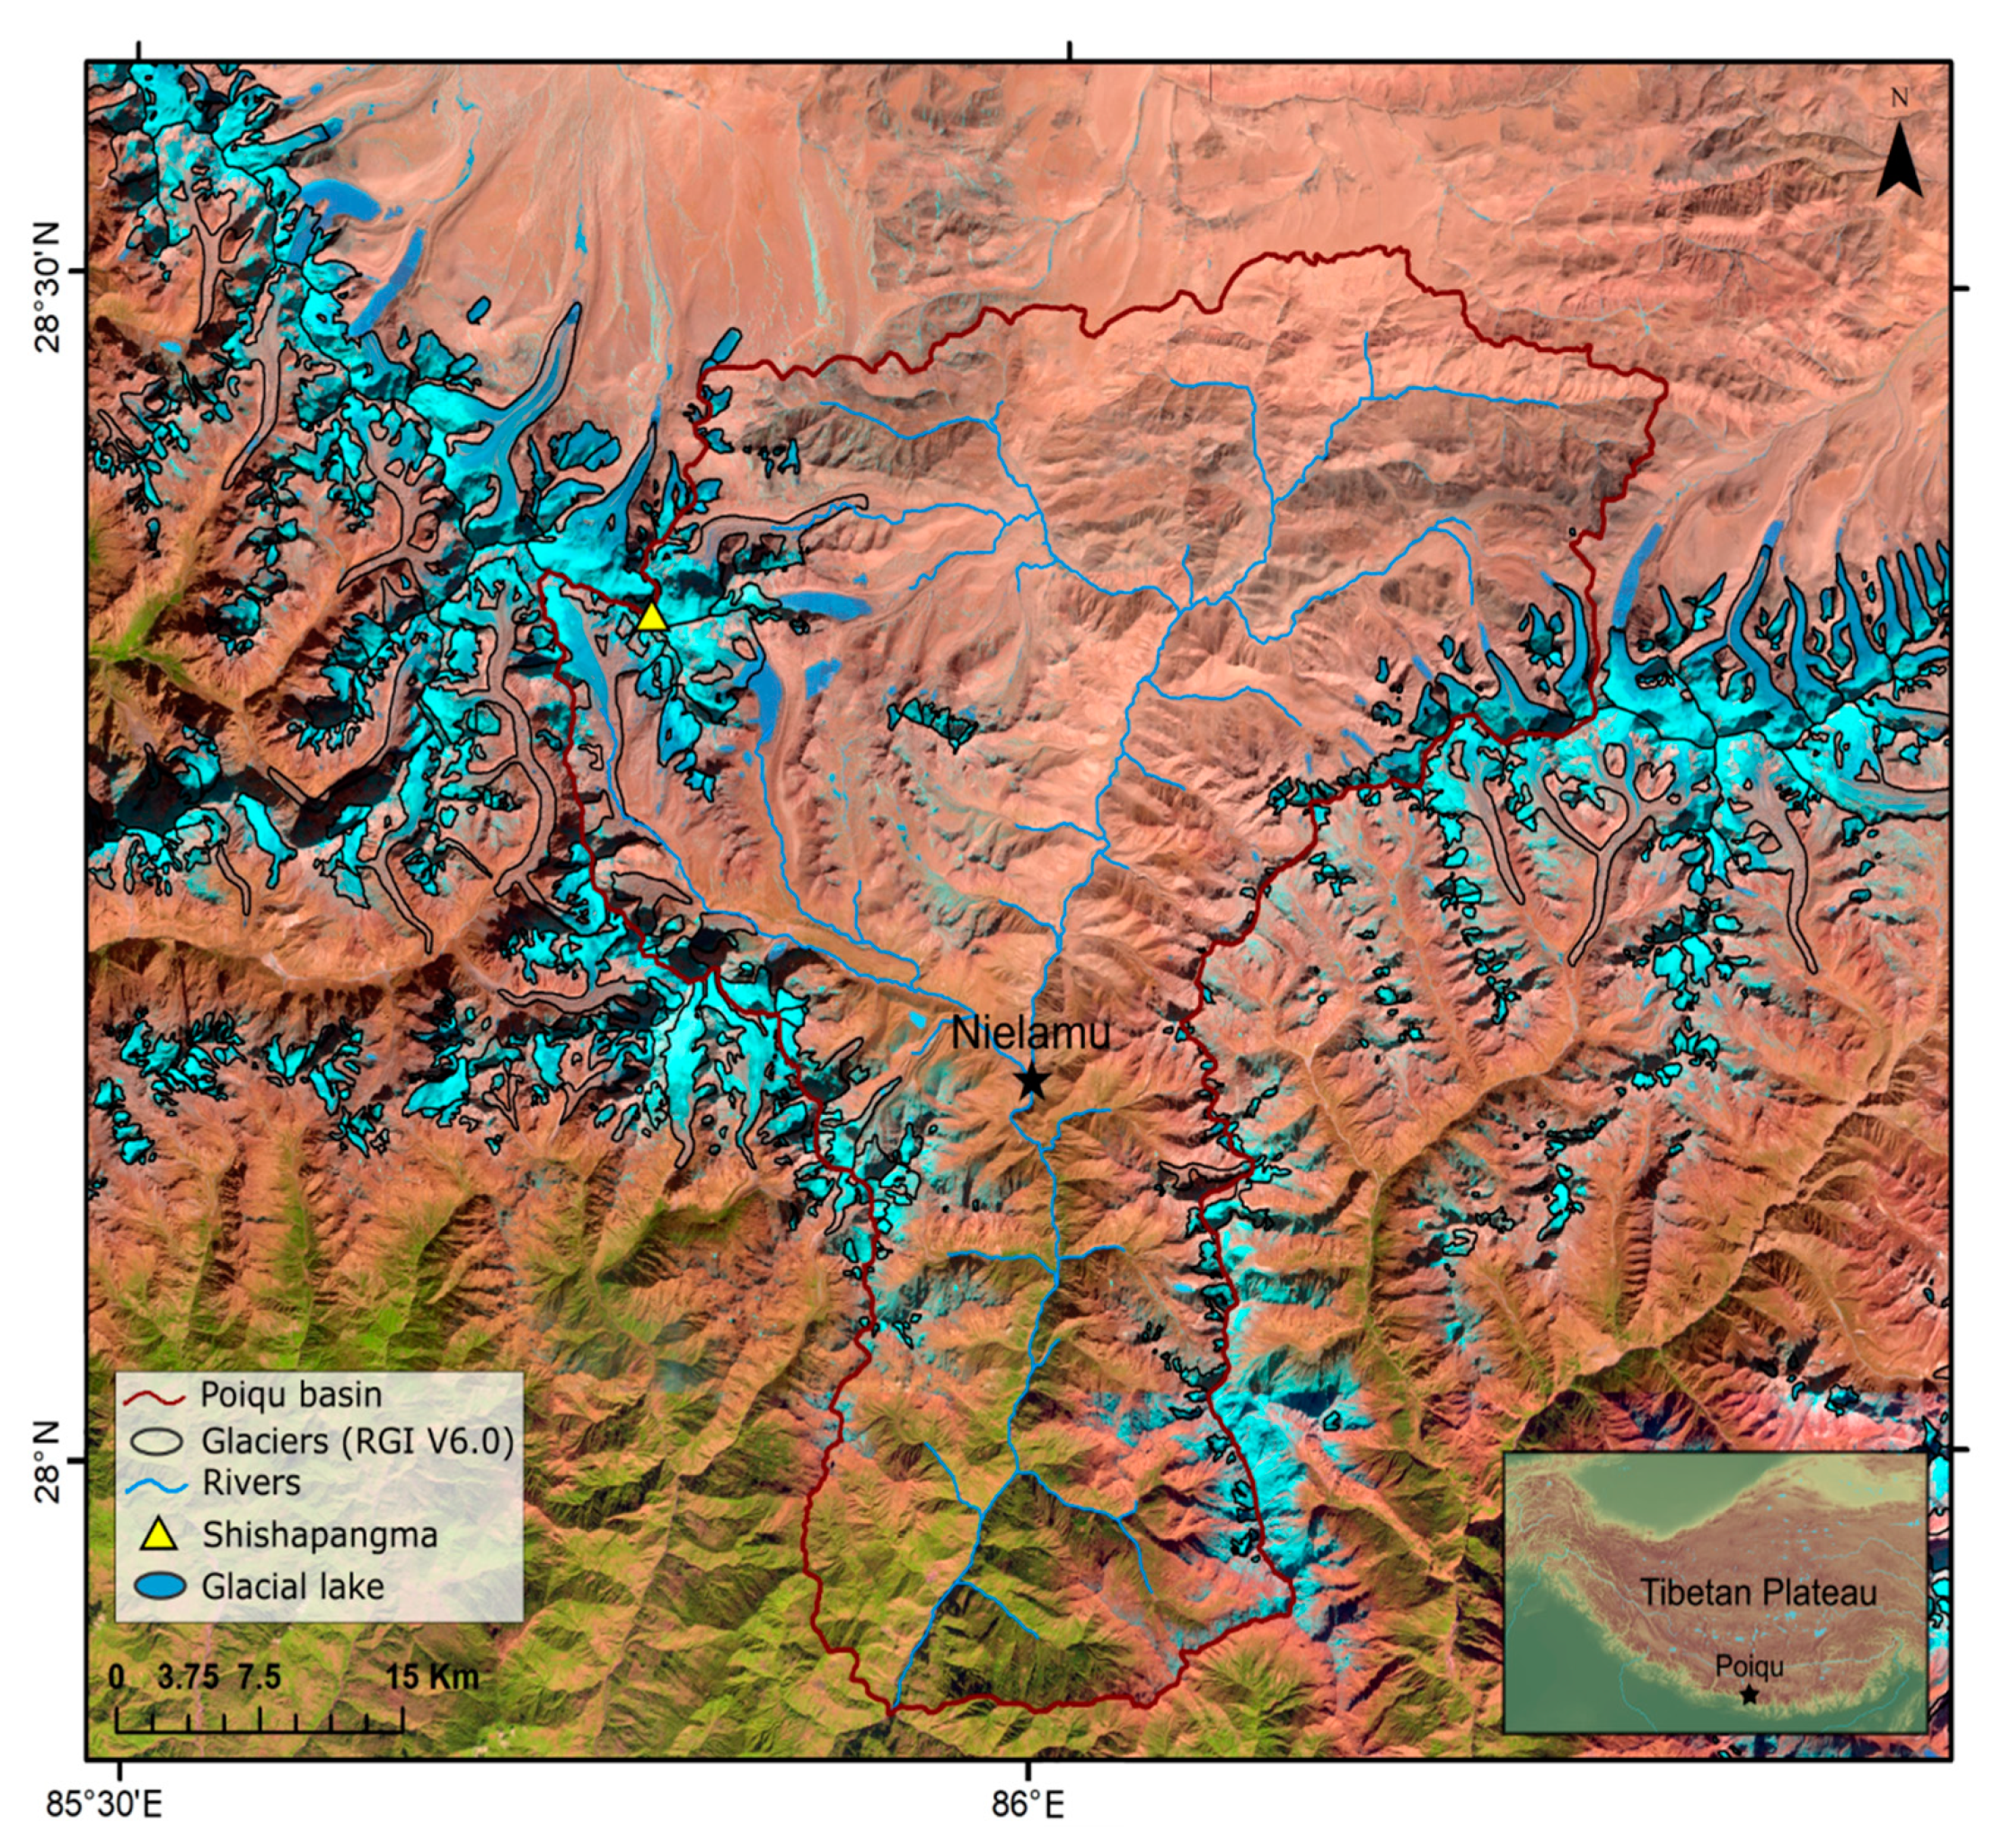
2. Project, Sub-Projects, EO and Other Data Utilisation
2.1. List of Sub-Projects and Teaming
2.2. Description and Summary Table of Earth Observation and Other Data Utilized
3. Background, Research and Approach for the Different Topics
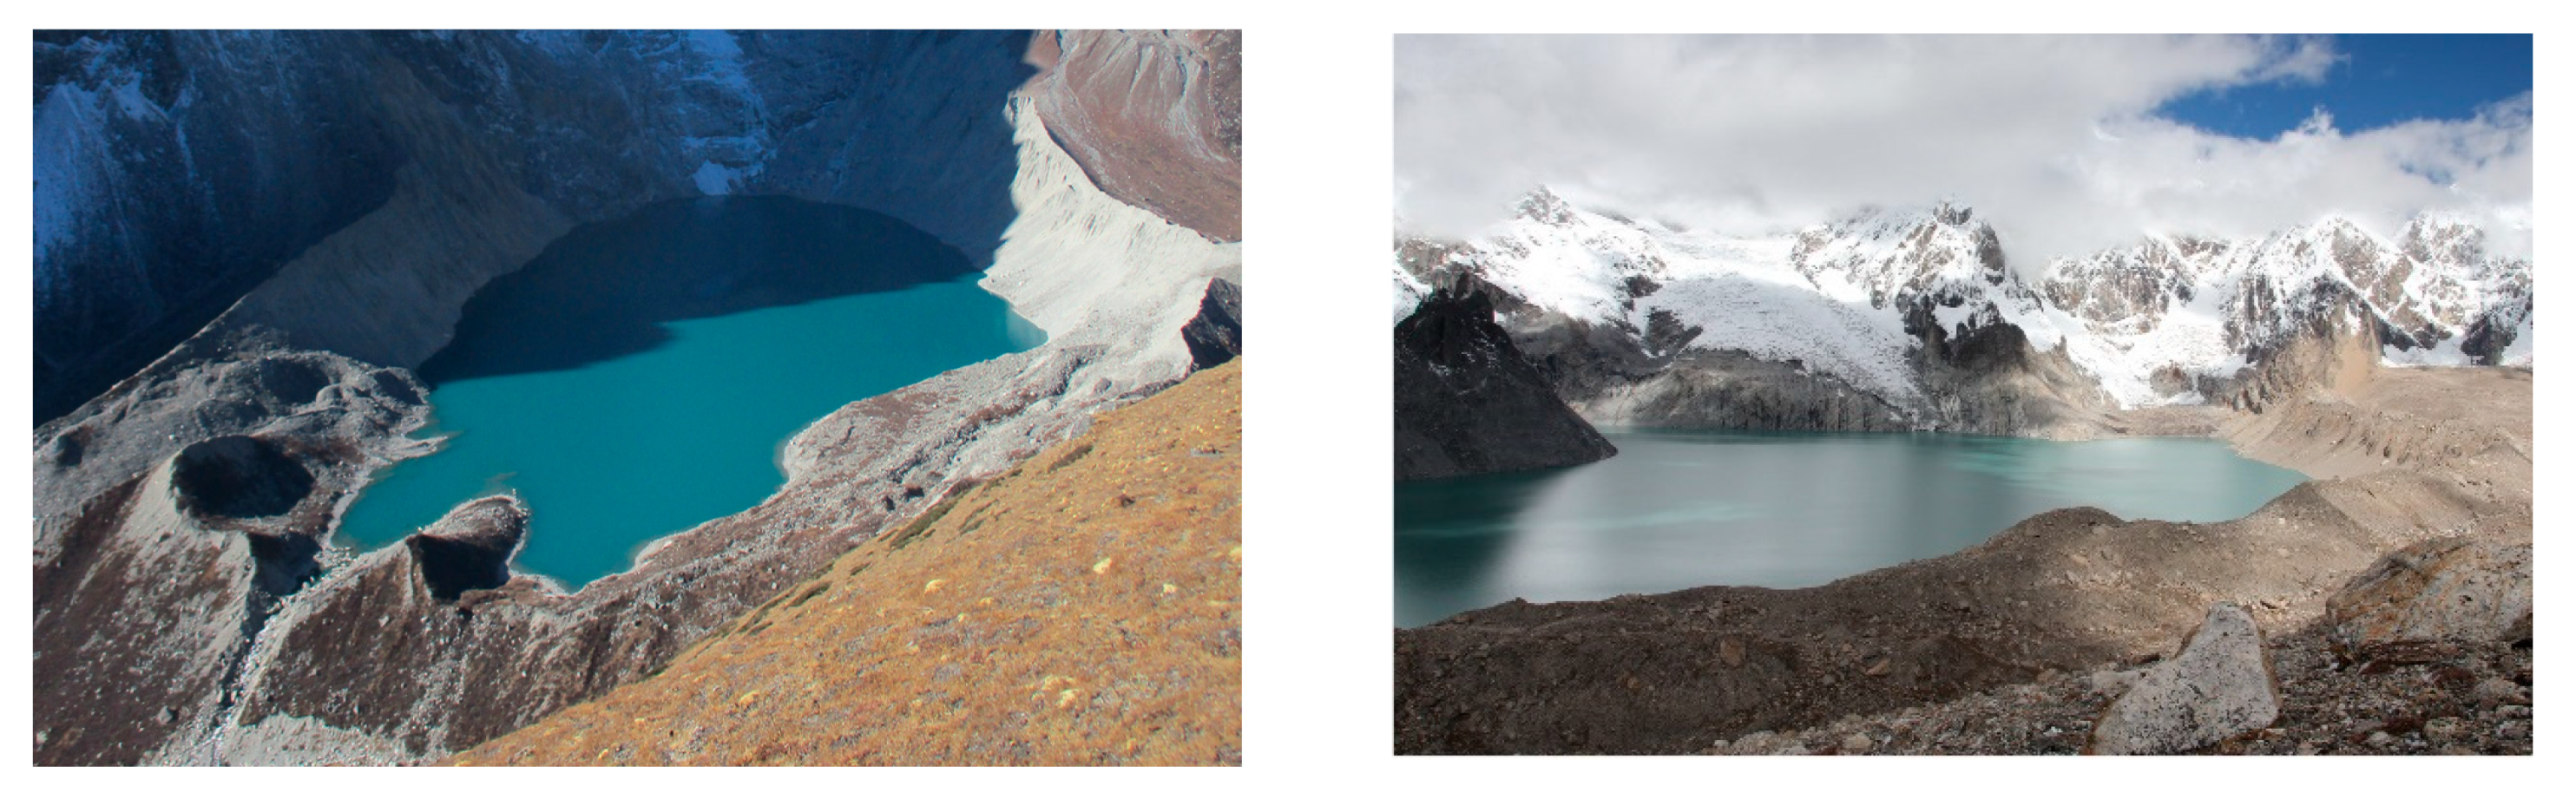
3.1. Glacial Lakes
3.1.1. Background and Research Aims
3.1.2. Research Approach
3.2. Glaciers: Mass Changes
3.2.1. Background and Research Aims
3.2.2. Research Approach
3.3. Glacier Velocity
3.3.1. Background and Research Aims
3.3.2. Research Approach
3.4. Rock Glaciers: Occurrence, Characteristics and Mapping Challenges
3.4.1. Background and Research Aims
3.4.2. Research Approach
4. Research Results
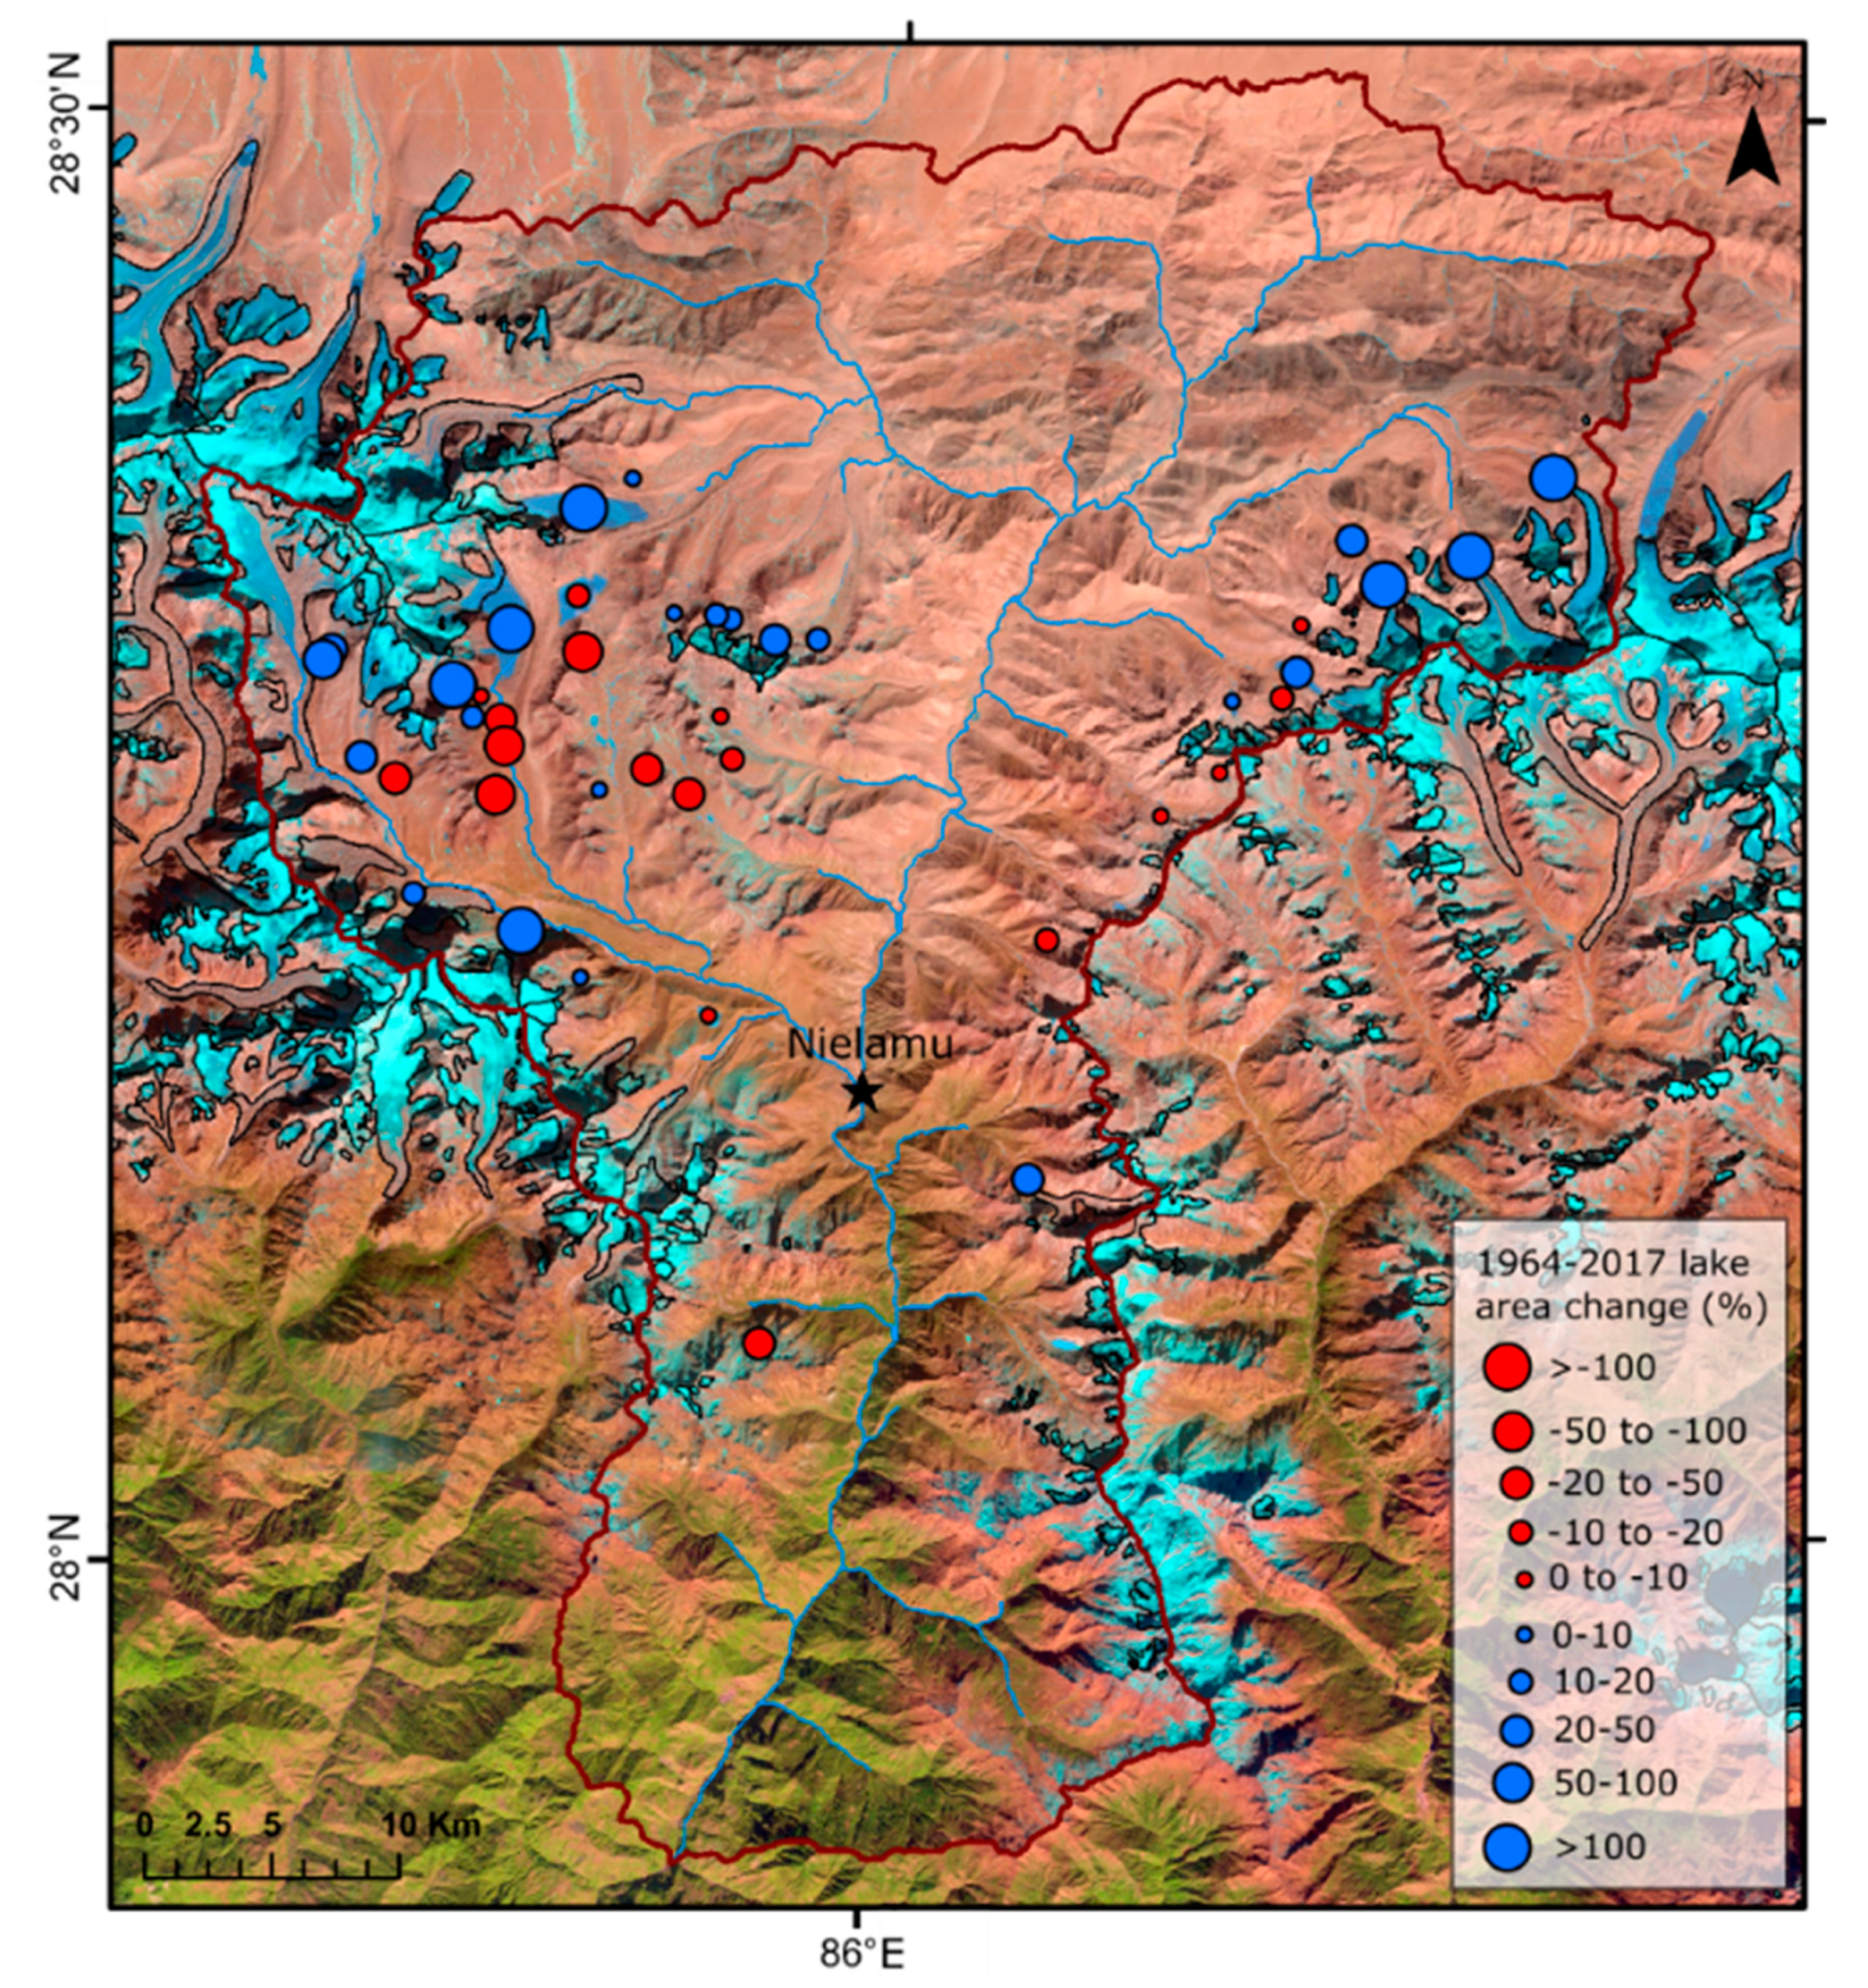
4.1. Glacial Lakes
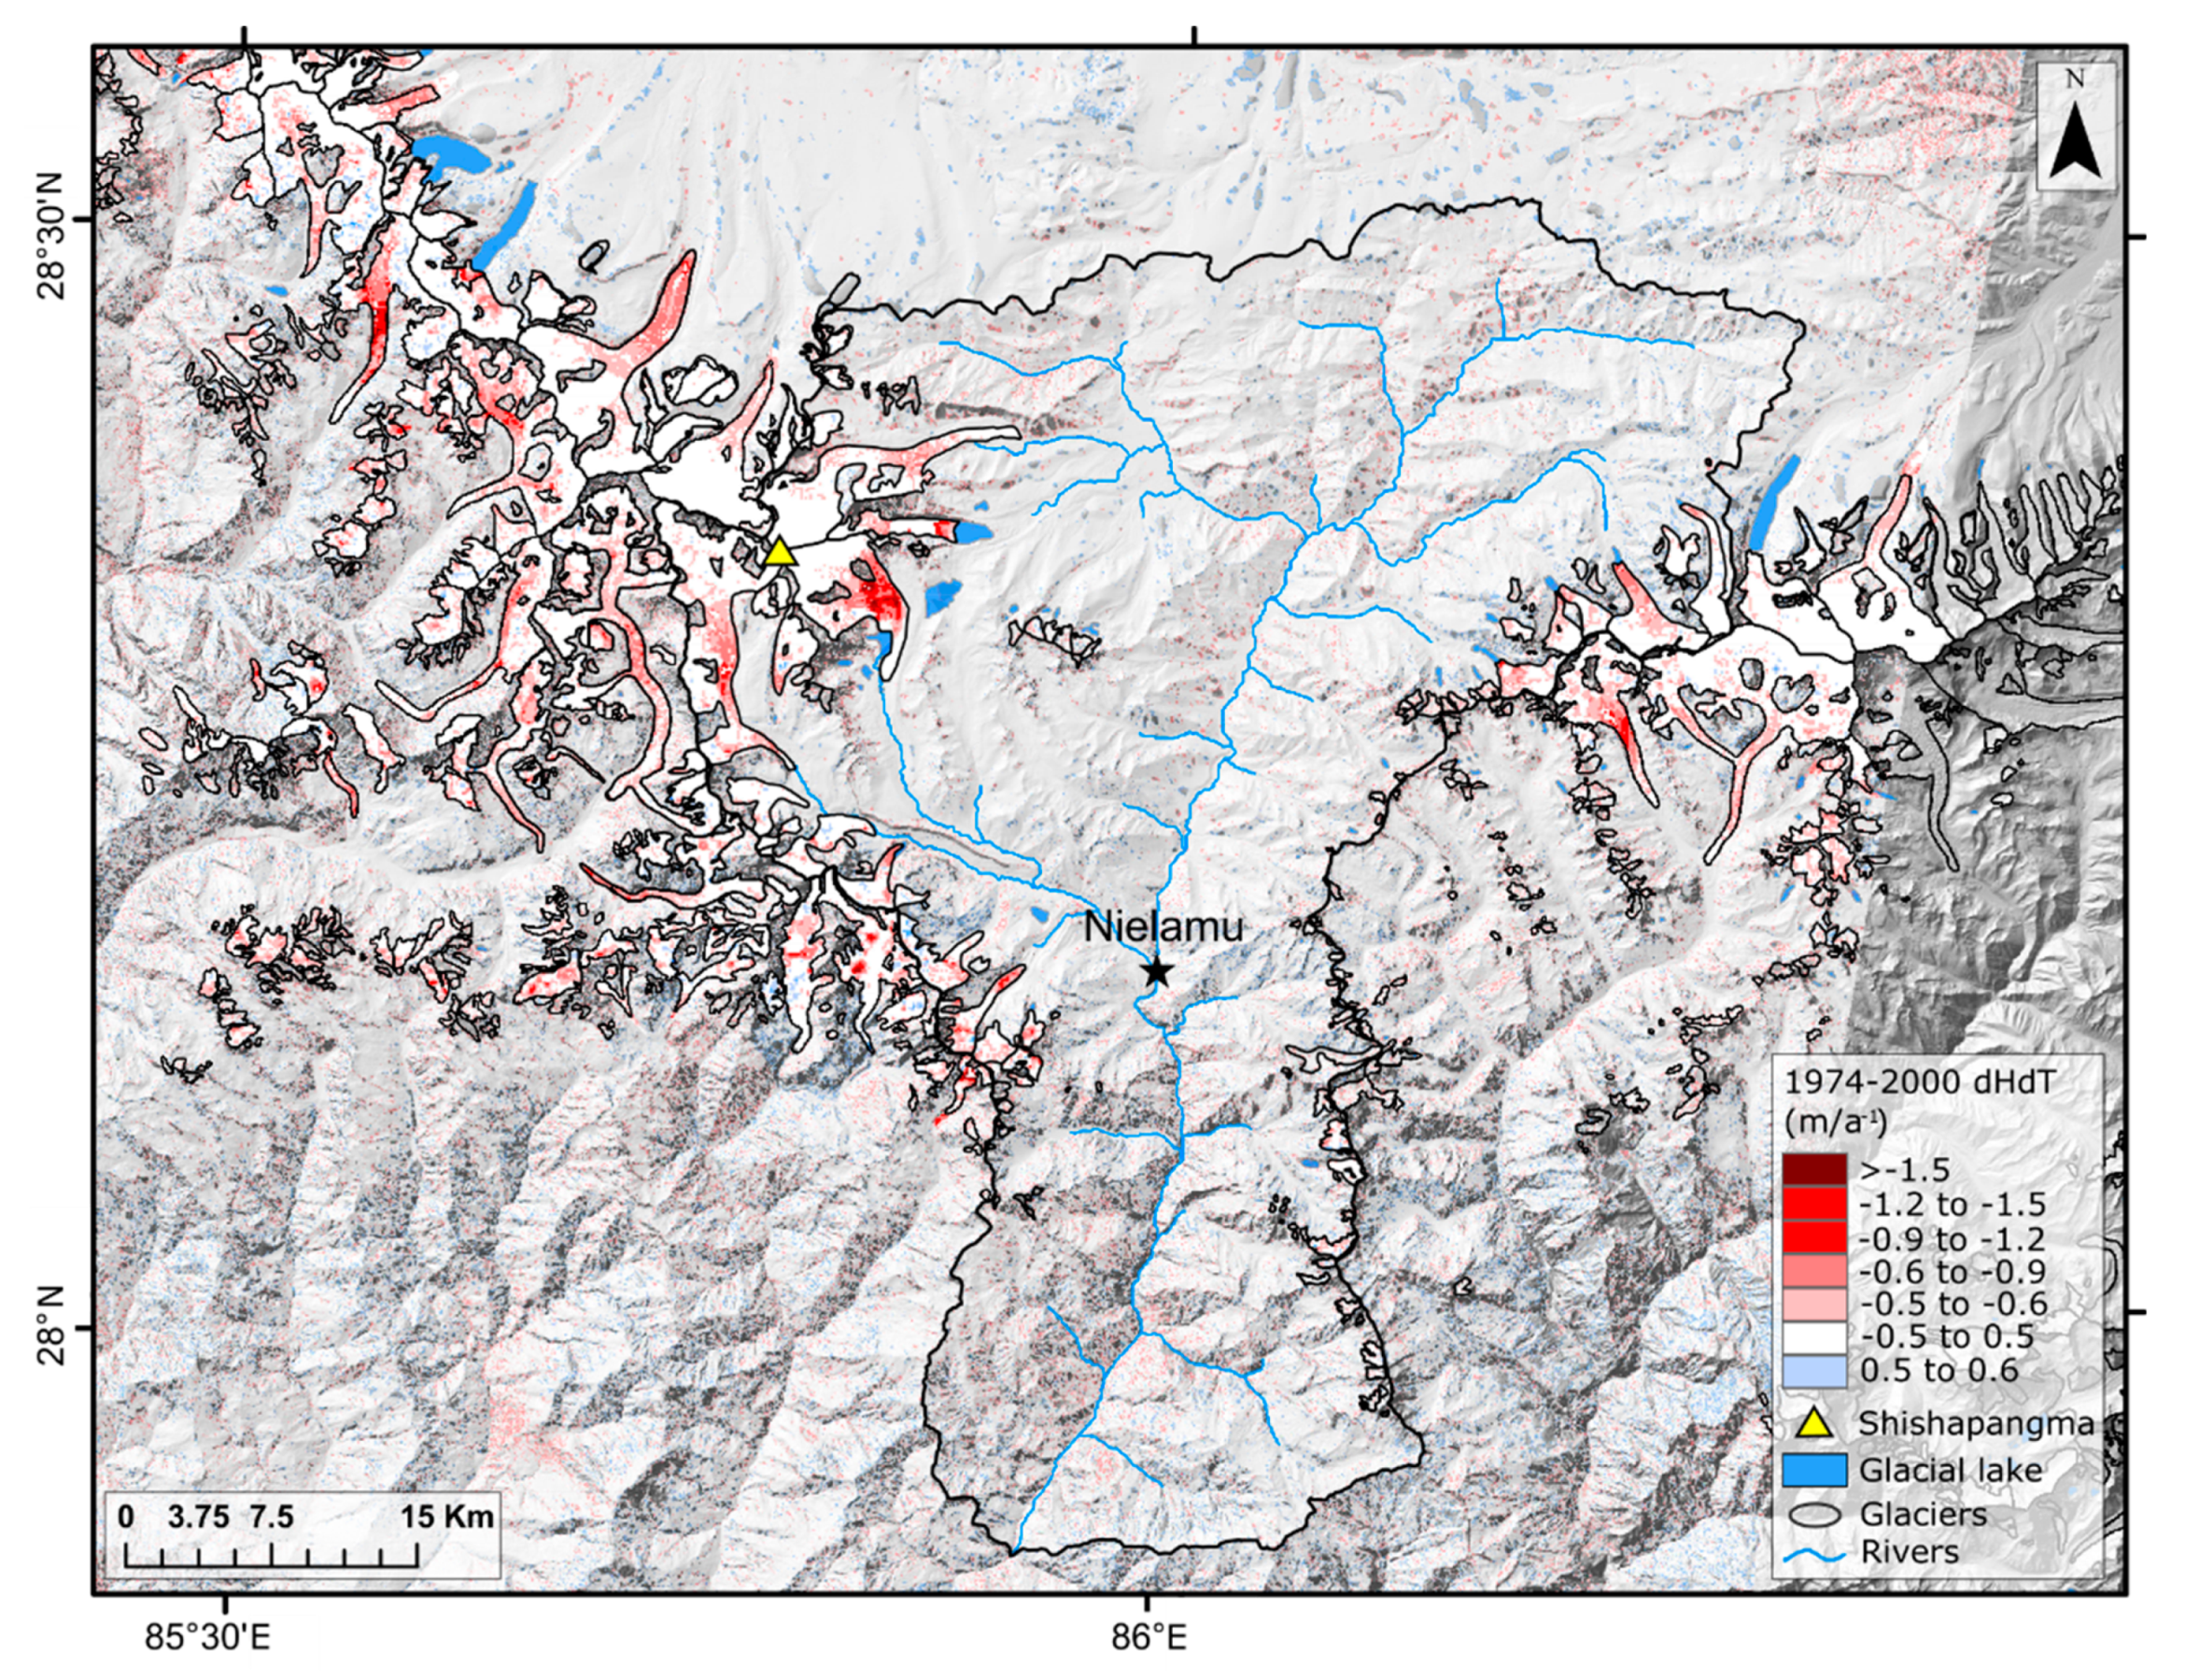
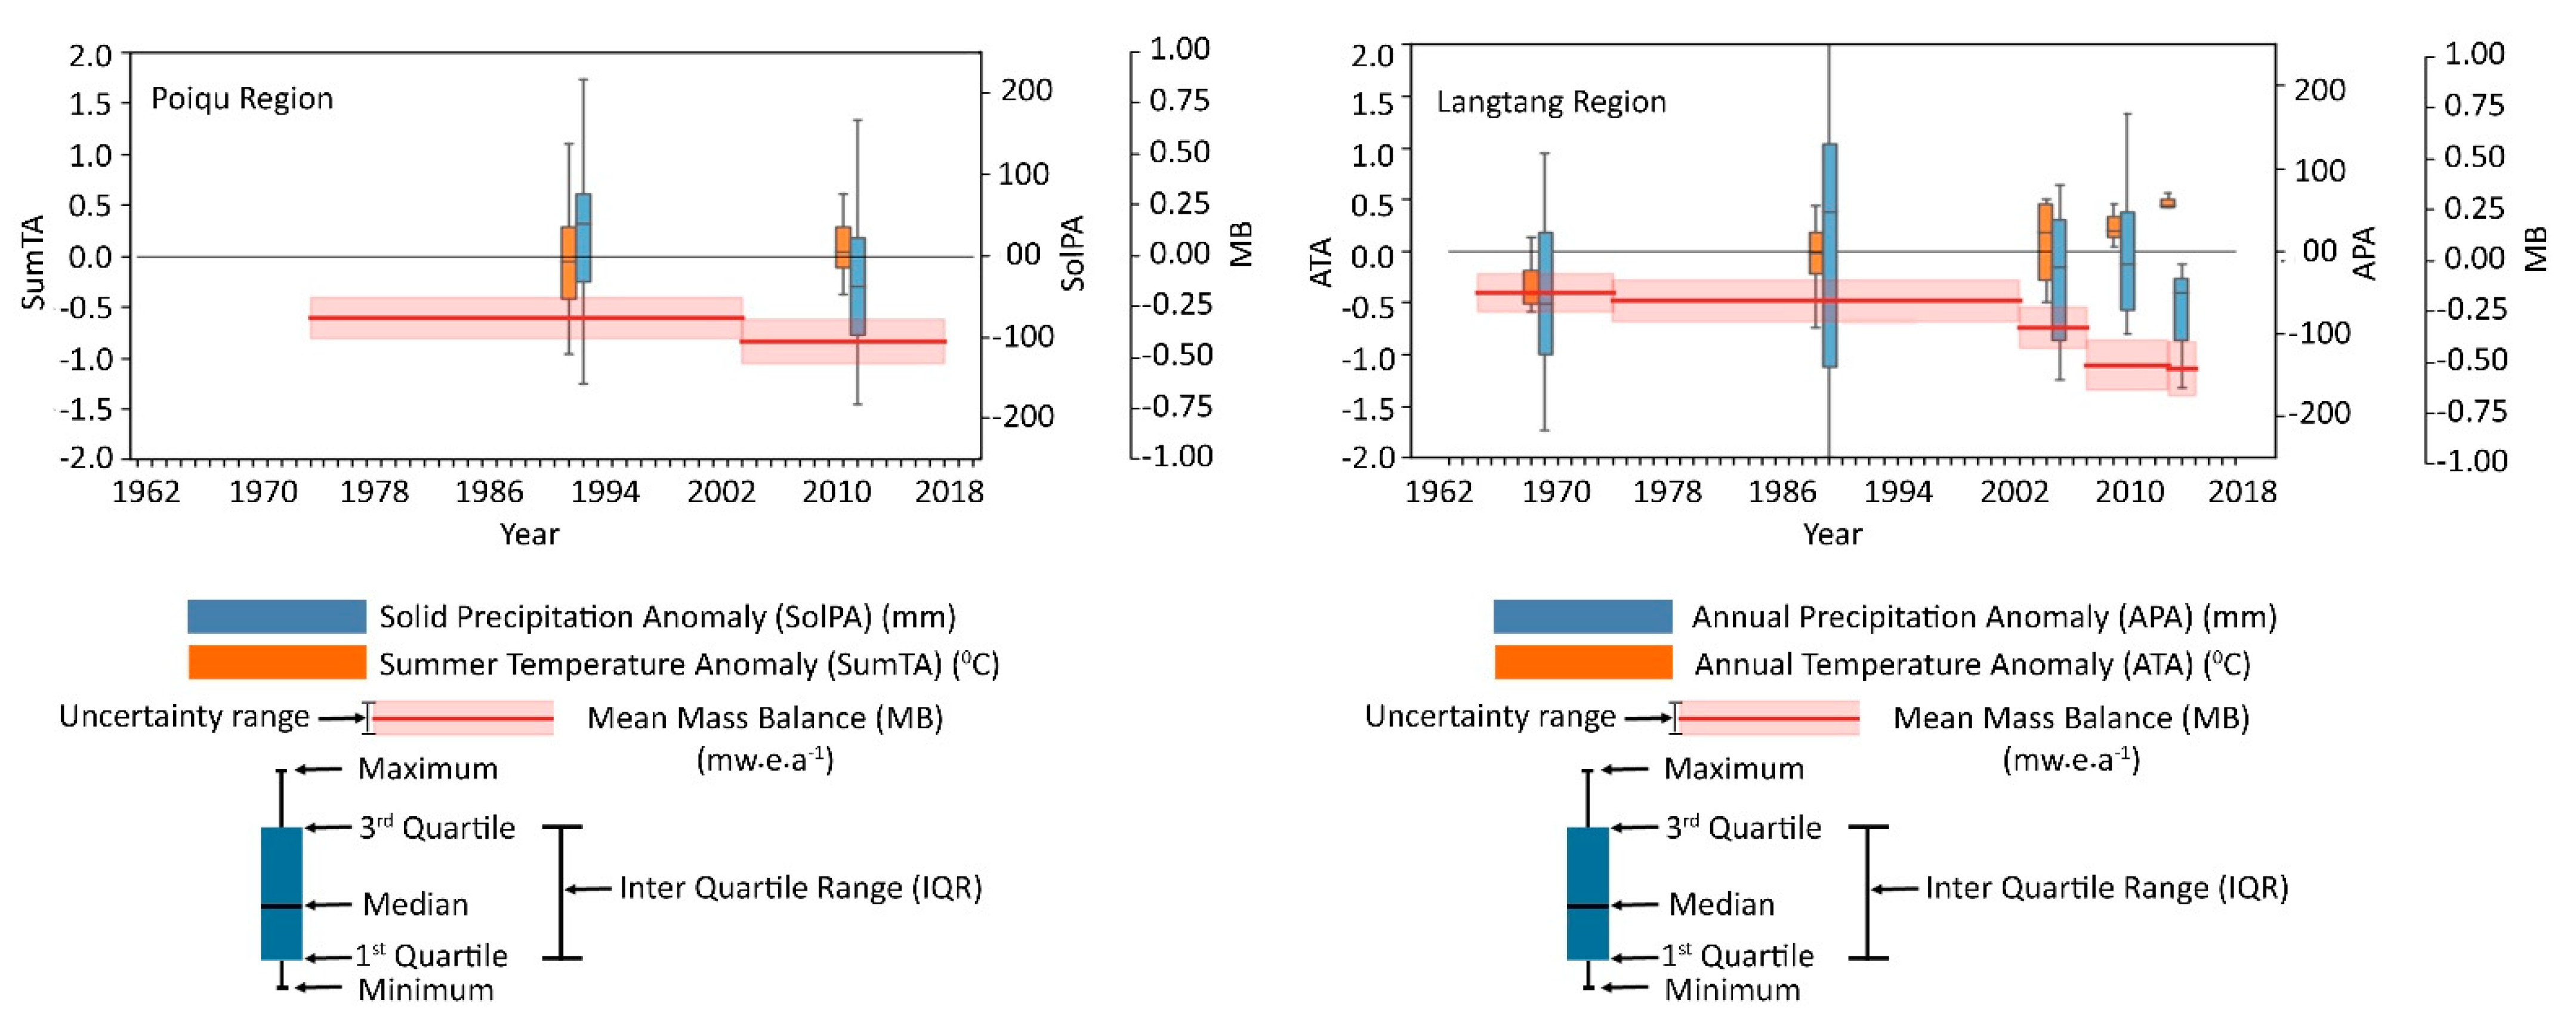
4.2. Glacier Mass Changes
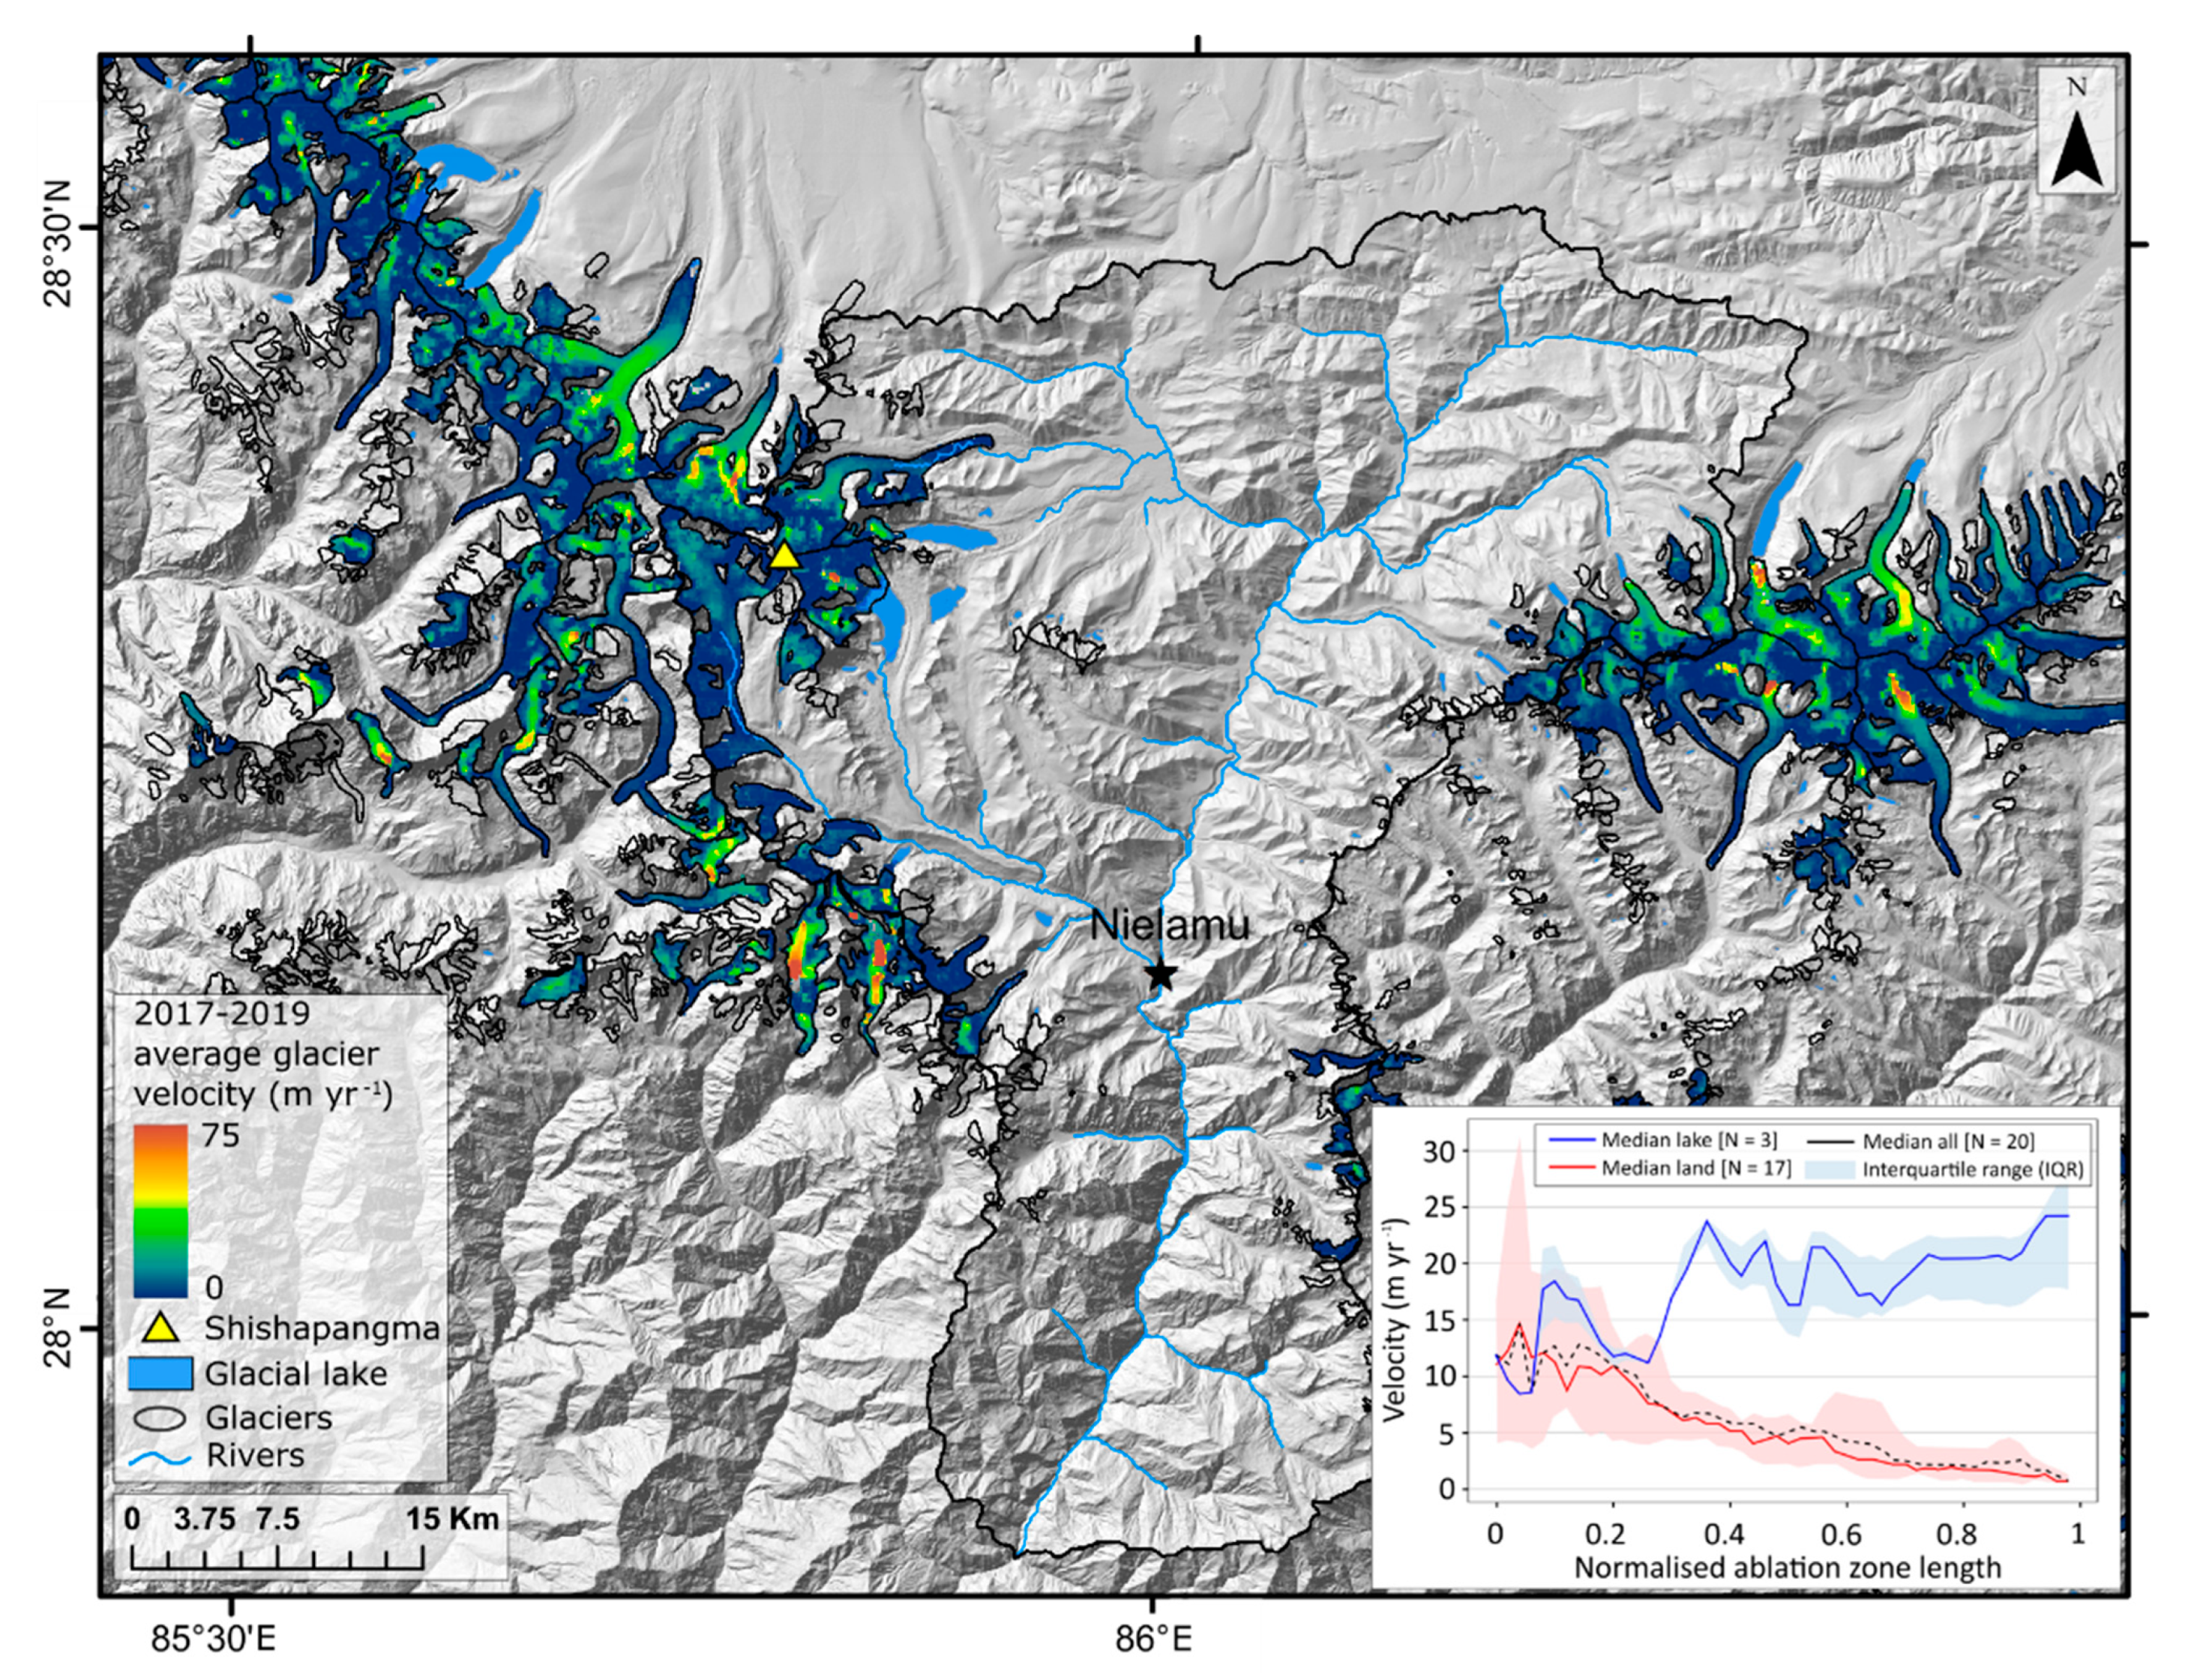
4.3. Glacier Velocity
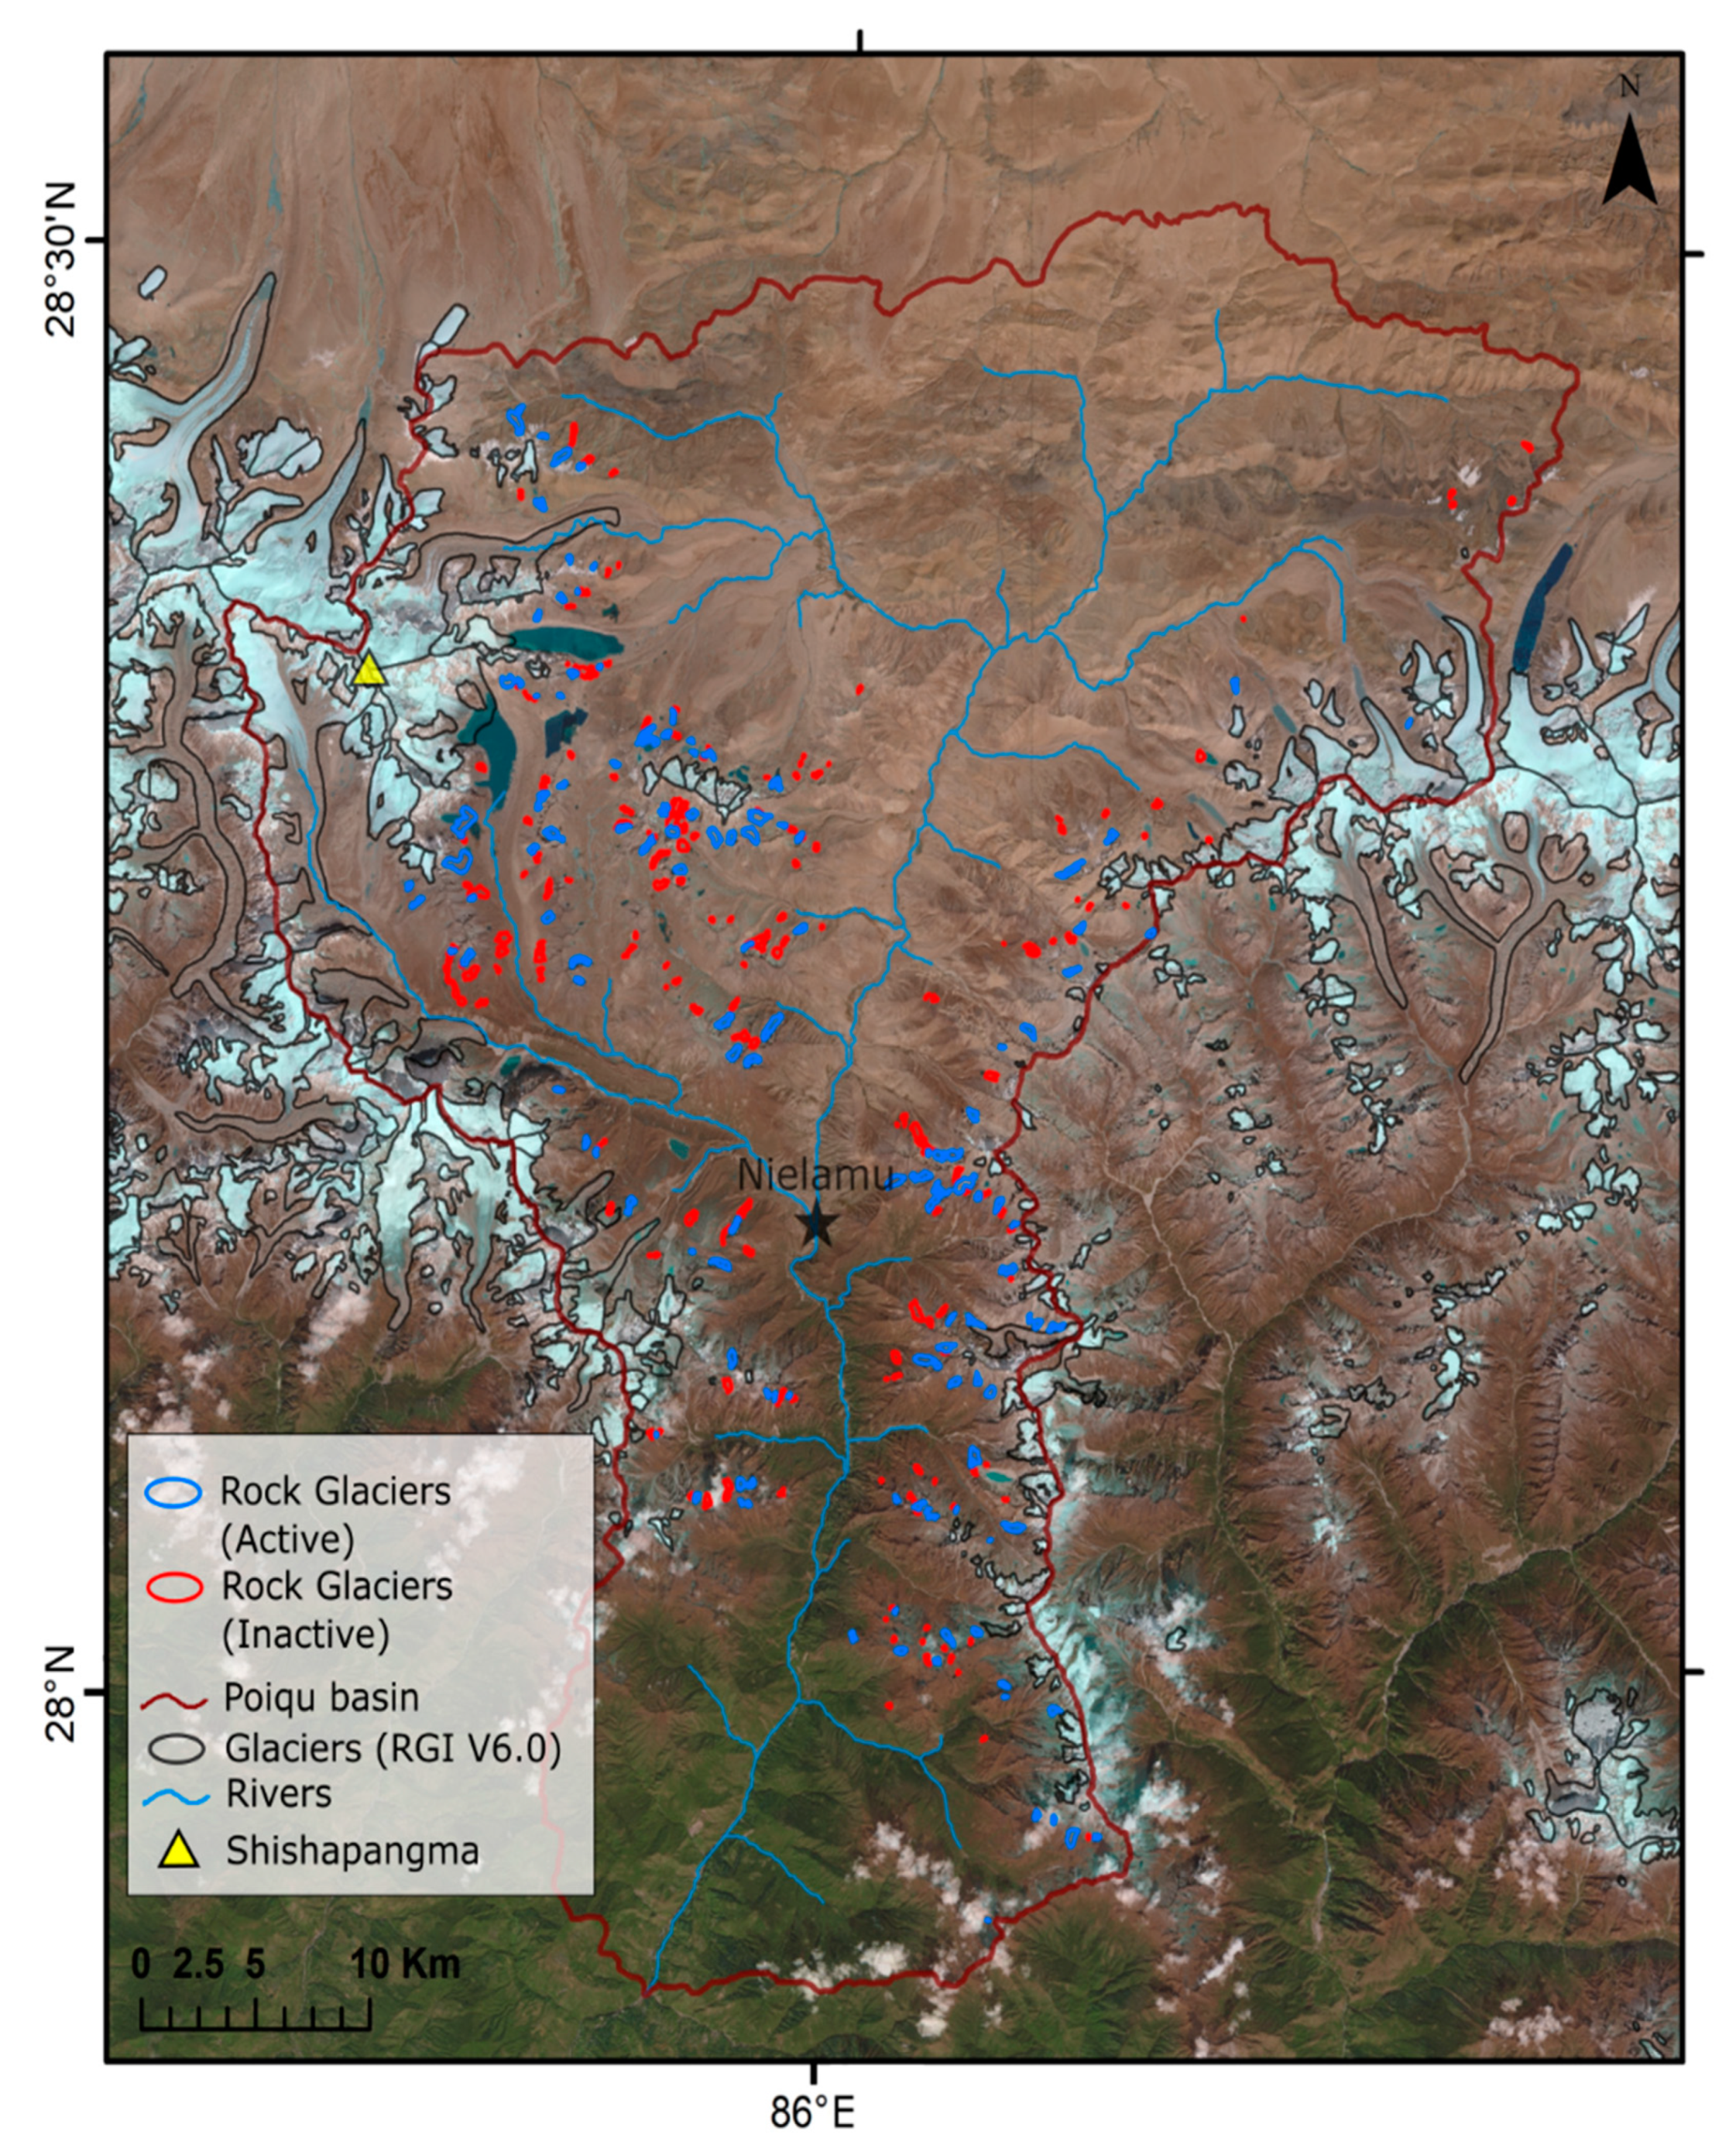
4.4. Rock Glaciers
5. Discussion and Conclusions
Author Contributions
Funding
Institutional Review Board Statement
Informed Consent Statement
Data Availability Statement
Acknowledgments
Conflicts of Interest
References
- Immerzeel, W.W.; Lutz, A.F.; Andrade, M.; Bahl, A.; Biemans, H.; Bolch, T.; Hyde, S.; Brumby, S.; Davies, B.J.; Elmore, A.C.; et al. Importance and vulnerability of the world’s water towers. Nature 2020, 577, 364–369. [Google Scholar] [CrossRef] [PubMed]
- Bolch, T.; Shea, J.M.; Liu, S.; Azam, F.M.; Gao, Y.; Gruber, S.; Immerzeel, W.W.; Kulkarni, A.; Li, H.; Tahir, A.A.; et al. Status and change of the cryosphere in the extended Hindu Kush Himalaya region. In The Hindu Kush Himalaya Assessment: Mountains, Climate Change, Sustainability and People; Wester, P., Mishra, A., Mukherji, A., Shrestha, A.B., Eds.; Springer International Publishing: Cham, Switzerland, 2019; pp. 209–255. ISBN 978-3-319-92288-1. [Google Scholar] [CrossRef] [Green Version]
- Hock, R.; Rasul, G.; Adler, C.; Cáceres, B.; Gruber, S.; Hirabayashi, Y.; Jackson, M.; Kääb, A.; Kang, S.; Kutuzov, S.; et al. High Mountain Areas. In IPCC Special Report on the Ocean and Cryosphere in a Changing Climate; Pörtner, H.-O., Roberts, D.C., Masson-Delmotte, V., Thai, P., Tignor, M., Poloczanska, E., Mintenbeck, K., Alegría, A., Nicolai, M., Okem, A., et al., Eds.; University Press: Cambridge, UK; New York, NY, USA, 2019; pp. 131–202. [Google Scholar] [CrossRef]
- Rounce, D.R.; Hock, R.; Shean, D.E. Glacier mass change in High Mountain Asia through 2100 using the open-source python glacier evolution model (PyGEM). Front. Earth Sci. 2020, 7, 331. [Google Scholar] [CrossRef] [Green Version]
- Bolch, T. Asian glaciers are a reliable water source. Nature 2017, 545, 161–162. [Google Scholar] [CrossRef] [PubMed] [Green Version]
- King, O.; Bhattacharya, A.; Bhambri, R.; Bolch, T. Glacial lakes exacerbate Himalayan glacier mass loss. Sci. Rep. 2019, 9, 18145. [Google Scholar] [CrossRef] [Green Version]
- Sutherland, J.L.; Carrivick, J.L.; Gandy, N.; Shulmeister, J.; Quincey, D.J.; Cornford, S.L. Proglacial lakes control glacier geometry and behavior during recession. Geophys. Res. Lett. 2020, 47, e2020GL088865. [Google Scholar] [CrossRef]
- Allen, S.K.; Zhang, G.; Wang, W.; Yao, T.; Bolch, T. Potentially dangerous glacial lakes across the Tibetan Plateau revealed using a large-scale automated assessment approach. Sci. Bull. 2019, 64, 435–445. [Google Scholar] [CrossRef]
- Carrivick, J.L.; Tweed, F. A global assessment of the societal impacts of glacier outburst floods. Glob. Planet. Change 2016, 144, 1–16. [Google Scholar] [CrossRef]
- Benn, D.I.; Bolch, T.; Hands, K.; Gulley, J.; Luckman, A.; Nicholson, L.I.; Quincey, D.; Thompson, S.; Toumi, R.; Wiseman, S. Response of debris-covered glaciers in the Mount Everest region to recent warming, and implications for outburst flood hazards. Earth Sci. Rev. 2012, 114, 156–174. [Google Scholar] [CrossRef] [Green Version]
- Bolch, T.; Kulkarni, A.; Kääb, A.; Huggel, C.; Paul, F.; Cogley, J.G.; Frey, H.; Kargel, J.S.; Fujita, K.; Scheel, M.; et al. The state and fate of Himalayan glaciers. Science 2012, 336, 310–314. [Google Scholar] [CrossRef] [Green Version]
- Herreid, S.; Pellicciotti, F. The state of rock debris covering Earth’s glaciers. Nat. Geosci. 2020, 13, 621–627. [Google Scholar] [CrossRef]
- Gardelle, J.; Berthier, E.; Arnaud, Y.; Kääb, A. Region-wide glacier mass balances over the Pamir–Karakoram–Himalaya during 1999–2011. Cryosphere 2013, 7, 1263–1286. [Google Scholar] [CrossRef] [Green Version]
- Brun, F.; Wagnon, P.; Berthier, E.; Jomelli, V.; Maharjan, S.B.; Shrestha, F.; Kraaijenbrink, P.D.A. Heterogeneous influence of glacier morphology on the mass balance variability in High Mountain Asia. J. Geophys. Res. 2019, 124, 1331–1345. [Google Scholar] [CrossRef]
- Jones, D.B.; Harrison, S.; Anderson, K.; Betts, R.A. Mountain rock glaciers contain globally significant water stores. Sci. Rep. 2018, 8, 2834. [Google Scholar] [CrossRef] [PubMed] [Green Version]
- Jones, D.B.; Harrison, S.; Anderson, K.; Selley, H.L.; Wood, J.L.; Betts, R.A. The distribution and hydrological significance of rock glaciers in the Nepalese Himalaya. Glob. Planet. Chang. 2018, 160, 123–142. [Google Scholar] [CrossRef] [Green Version]
- Janke, J.R.; Bolch, T. Rock glaciers. In Treatise on Geomorphology, 2nd ed.; Haritashya, U.K., Ed.; Elsevier: Amsterdam, The Netherlands, 2022. [Google Scholar] [CrossRef]
- Haeberli, W.; Hallet, B.; Arenson, L.U.; Elconin, R.; Humlum, O.; Kääb, A.; Kaufmann, V.; Ladanyi, B.; Matsuoka, N.; Springman, S.; et al. Permafrost creep and rock glacier dynamics. Permafr. Periglac. Process. 2006, 17, 189–214. [Google Scholar] [CrossRef]
- Paul, F.; Bolch, T.; Briggs, K.H.; Kääb, A.; McMillan, M.; McNabb, R.; Nagler, T.; Nuth, C.; Rastner, P.; Strozzi, T.; et al. Error sources and guidelines for quality assessment of glacier area, elevation change, and velocity products derived from satellite data in the Glaciers_cci project. Remote Sens. Environ. 2017, 203, 256–275. [Google Scholar] [CrossRef] [Green Version]
- Westermann, S.; Duguay, C.R.; Grosse, G.; Kääb, A. Remote sensing of permafrost and frozen ground. In Remote Sensing of the Cryosphere; Tedesco, M., Ed.; Wiley: Hoboken, NJ, USA, 2015; pp. 307–344. [Google Scholar]
- Wangchuk, S.; Bolch, T. Mapping of glacial lakes using Sentinel-1 and Sentinel-2 data and a random forest classifier: Strengths and challenges. Sci. Remote Sens. 2020, 2, 100008. [Google Scholar] [CrossRef]
- Bolch, T.; Buchroithner, M.F.; Peters, J.; Baessler, M.; Bajracharya, S.R. Identification of glacier motion and potentially dangerous glacier lakes at Mt. Everest area/Nepal using spaceborne imagery. Nat. Hazards Earth Syst. Sci. 2008, 8, 1329–1340. [Google Scholar] [CrossRef] [Green Version]
- Huggel, C.; Kääb, A.; Haeberli, W.; Teysseire, P.; Paul, F. Remote sensing-based assessment of hazards from glacier lake outbursts: A case study in the Swiss Alps. Can. Geotech. J. 2002, 39, 316–330. [Google Scholar] [CrossRef] [Green Version]
- Paul, F. Changes in glacier area in Tyrol, Austria, between 1969 and 1992 derived from Landsat 5 TM and Austrian Glacier Inventory data. Int. J. Remote Sens. 2002, 23, 787–799. [Google Scholar] [CrossRef]
- Bolch, T. Climate change and glacier retreat in northern Tien Shan (Kazakhstan/Kyrgyzstan) using remote sensing data. Glob. Planet. Chang. 2007, 56, 1–12. [Google Scholar] [CrossRef]
- Zhang, G.; Yao, T.; Xie, H.; Wang, W.; Yang, W. An inventory of glacial lakes in the Third Pole region and their changes in response to global warming. Glob. Planet. Chang. 2015, 131, 148–157. [Google Scholar] [CrossRef]
- Wang, X.; Guo, X.; Yang, C.; Liu, Q.; Wei, J.; Zhang, Y.; Liu, S.; Jiang, Z.; Tang, Z. Glacial lake inventory of high-mountain Asia in 1990 and 2018 derived from Landsat images. Earth Syst. Sci. Data 2020, 12, 2169–2182. [Google Scholar] [CrossRef]
- Bolch, T.; Menounos, B.; Wheate, R.D. Landsat-based inventory of glaciers in western Canada, 1985–2005. Remote Sens. Environ. 2010, 114, 127–137. [Google Scholar] [CrossRef]
- Shugar, D.H.; Burr, A.; Haritashya, U.K.; Kargel, J.S.; Watson, C.S.; Kennedy, M.C.; Bevington, A.R.; Betts, R.A.; Harrison, S.; Strattman, K. Rapid worldwide growth of glacial lakes since 1990. Nat. Clim. Chang. 2020, 10, 939–945. [Google Scholar] [CrossRef]
- Pfeffer, W.T.; Arendt, A.A.; Bliss, A.; Bolch, T.; Cogley, J.G.; Gardner, A.S.; Hagen, J.-O.; Hock, R.; Kaser, G.; Kienholz, C.; et al. The Randolph Glacier Inventory: A globally complete inventory of glaciers. J. Glaciol. 2014, 60, 537–552. [Google Scholar] [CrossRef] [Green Version]
- Dehecq, A.; Gourmelen, N.; Trouve, E. Deriving large-scale glacier velocities from a complete satellite archive: Application to the Pamir–Karakoram–Himalaya. Remote Sens. Environ. 2015, 162, 55–66. [Google Scholar] [CrossRef] [Green Version]
- Scherler, D.; Leprince, S.; Strecker, M.R. Glacier-surface velocities in alpine terrain from optical satellite imagery—Accuracy improvement and quality assessment. Remote Sens. Environ. 2008, 112, 3806–3819. [Google Scholar] [CrossRef]
- Heid, T.; Kääb, A. Evaluation of existing image matching methods for deriving glacier surface displacements globally from optical satellite imagery. Remote Sens. Environ. 2012, 118, 339–355. [Google Scholar] [CrossRef]
- Paul, F.; Winsvold, H.S.; Kääb, A.; Nagler, T.; Schwaizer, G. Glacier remote sensing using Sentinel-2. Part II: Mapping glacier extents and surface facies, and comparison to Landsat 8. Remote Sens. 2016, 8, 575. [Google Scholar] [CrossRef] [Green Version]
- Kääb, A.; Winsvold, H.S.; Altena, B.; Nuth, C.; Nagler, T.; Wuite, J. Glacier Remote Sensing Using Sentinel-2. Part I: Radiometric and Geometric Performance, and Application to Ice Velocity. Remote Sens. 2016, 8, 598. [Google Scholar] [CrossRef] [Green Version]
- Bolch, T.; Pieczonka, T.; Benn, D.I. Multi-decadal mass loss of glaciers in the Everest area (Nepal, Himalaya) derived from stereo imagery. Cryosphere 2011, 5, 349–358. [Google Scholar] [CrossRef] [Green Version]
- Berthier, E.; Cabot, V.; Vincent, C.; Six, D. Decadal region-wide and glacier-wide mass balances derived from multi-temporal ASTER satellite digital elevation models. Validation over the Mont-Blanc area. Front. Earth Sci. 2016, 4, 63. [Google Scholar] [CrossRef]
- Dussaillant, I.; Berthier, E.; Brun, F.; Masiokas, M.; Hugonnet, R.; Favier, V.; Rabatel, A.; Pitte, P.; Ruiz, L. Two decades of glacier mass loss along the Andes. Nat. Geosci. 2019, 12, 802–808. [Google Scholar] [CrossRef]
- Shean, D.E.; Bhushan, S.; Montesano, P.; Rounce, D.R.; Arendt, A.; Osmanoglu, B. A systematic, regional assessment of High Mountain Asia glacier mass balance. Front. Earth Sci. 2020, 7, 363. [Google Scholar] [CrossRef] [Green Version]
- Sommer, C.; Malz, P.; Seehaus, T.C.; Lippl, S.; Zemp, M.; Braun, M.H. Rapid glacier retreat and downwasting throughout the European Alps in the early 21st century. Nat. Commun. 2020, 11, 3209. [Google Scholar] [CrossRef]
- Hugonnet, R.; McNabb, R.; Berthier, E.; Menounos, B.; Nuth, C.; Girod, L.; Farinotti, D.; Huss, M.; Dussaillant, I.; Brun, F.; et al. Accelerated global glacier mass loss in the early twenty-first century. Nature 2021, 592, 726–731. [Google Scholar] [CrossRef]
- Farr, T.G.; Rosen, P.A.; Caro, E.; Crippen, R.; Duren, R.; Hensley, S.; Kobrick, M.; Paller, M.; Rodriguez, E.; Roth, L.; et al. The Shuttle Radar Topography Mission. Rev. Geophys. 2007, 45, RG2004. [Google Scholar] [CrossRef] [Green Version]
- Bolch, T.; Buchroithner, M.F.; Pieczonka, T.; Kunert, A. Planimetric and volumetric glacier changes in Khumbu Himalaya since 1962 using Corona, Landsat TM and ASTER data. J. Glaciol. 2008, 54, 592–600. [Google Scholar] [CrossRef] [Green Version]
- Bhattacharya, A.; Bolch, T.; Mukherjee, K.; Pieczonka, T.; Kropáček, J.; Buchroithner, M.F. Overall recession and mass budget of Gangotri Glacier, Garhwal Himalayas, from 1965 to 2015 using remote sensing data. J. Glaciol. 2016, 62, 1115–1133. [Google Scholar] [CrossRef] [Green Version]
- Pieczonka, T.; Bolch, T.; Wei, J.; Liu, S. Heterogeneous mass loss of glaciers in the Aksu-Tarim Catchment (Central Tien Shan) revealed by 1976 KH-9 Hexagon and 2009 SPOT-5 stereo imagery. Remote Sens. Environ. 2013, 130, 233–244. [Google Scholar] [CrossRef] [Green Version]
- Maurer, J.M.; Schaefer, J.M.; Rupper, S.; Corley, A. Acceleration of ice loss across the Himalayas over the past 40 years. Sci. Adv. 2019, 5, eaav7266. [Google Scholar] [CrossRef] [PubMed] [Green Version]
- Bhattacharya, A.; Bolch, T.; Mukherjee, K.; King, O.; Menounos, B.; Kapitsa, V.; Neckel, N.; Yang, W.; Yao, T. High Mountain Asian glacier response to climate revealed by multi-temporal satellite observations since the 1960s. Nat. Commun. 2021, 12, 4133. [Google Scholar] [CrossRef] [PubMed]
- King, O.; Bhattacharya, A.; Ghuffar, S.; Tait, A.; Guilford, S.; Elmore, A.C.; Bolch, T. Six Decades of Glacier Mass Changes around Mt. Everest Are Revealed by Historical and Contemporary Images. One Earth 2020, 3, 608–620. [Google Scholar] [CrossRef]
- Zhang, G.; Bolch, T.; Allen, S.; Linsbauer, A.; Chen, W.; Wang, W. Glacial lake evolution and glacier–lake interactions in the Poiqu River basin, central Himalaya, 1964–2017. J. Glaciol. 2019, 65, 347–365. [Google Scholar] [CrossRef] [Green Version]
- Yao, T.; Thompson, L.G.; Yang, W.; Yu, W.; Gao, Y.; Guol, X.; Yang, X.; Duan, K.; Zhao, H.; Xu, B.; et al. Different glacier status with atmospheric circulations in Tibetan Plateau and surroundings. Nat. Clim. Chang. 2012, 2, 663–667. [Google Scholar] [CrossRef]
- Rastner, P.; Bolch, T.; Hu, Y.; Liu, L.; Bhattacharya, A.; Zhang, G.; Yao, T. Occurrence and characteristics of rock glaciers in the Poiqu River basin—Central Himalaya. Geogr. Ann. A 2021. in review. Available online: http://hdl.handle.net/10023/23838 (accessed on 4 December 2021).
- Pronk, J.B.; Bolch, T.; King, O.; Wouters, B.; Benn, D.I. Contrasting surface velocities between lake- and land-terminating glaciers in the Himalayan region. Cryosphere 2021, 15, 5577–5599. [Google Scholar] [CrossRef]
- Richardson, S.D.; Reynolds, J.M. An overview of glacial hazards in the Himalayas. Quat. Int. 2000, 65–66, 31–47. [Google Scholar] [CrossRef]
- Wang, W.; Gao, Y.; Anacona, P.I.; Lei, Y.; Xiang, Y.; Zhang, G.; Li, S.; Lu, A. Integrated hazard assessment of Cirenmaco glacial lake in Zhangzangbo valley, Central Himalayas. Geomorphology 2018, 306, 292–305. [Google Scholar] [CrossRef]
- Chen, X.; Cui, P.; Yang, Z.; Qi, Y. Risk assessment of glacial lake outburst in the Poiqu River basin of Tibet Autonomous region. J. Glaciol. Geocryol. 2007, 29, 509–516. [Google Scholar]
- Zheng, G.; Allen, S.K.; Bao, A.; Ballesteros-Cánovas, J.A.; Huss, M.; Zhang, G.; Li, J.; Yuan, Y.; Jiang, L.; Yu, T.; et al. Increasing risk of glacial lake outburst floods from future Third Pole deglaciation. Nat. Clim. Chang. 2021, 11, 411–417. [Google Scholar] [CrossRef]
- McFeeters, S.K. The use of the Normalized Difference Water Index (NDWI) in the delineation of open water features. Int. J. Remote Sens. 1996, 17, 1425–1432. [Google Scholar] [CrossRef]
- Gardelle, J.; Arnaud, Y.; Berthier, E. Contrasted evolution of glacial lakes along the Hindu Kush Himalaya Mountain range between 1990 and 2009. Glob. Planet. Change 2011, 75, 47–55. [Google Scholar] [CrossRef] [Green Version]
- Bolch, T.; Duethmann, D.; Wortmann, M.; Liu, S.; Disse, M. Declining glaciers endanger sustainable development of the oases along the Aksu-Tarim River (Central Asia). Int. J. Sustain. Dev. World Ecol. 2021, 29, 1–10. [Google Scholar] [CrossRef]
- Pritchard, H.D. Asia’s shrinking glaciers protect large populations from drought stress. Nature 2019, 569, 649–654. [Google Scholar] [CrossRef]
- Thayyen, R.J.; Gergan, J.T. Role of glaciers in watershed hydrology: A preliminary study of a Himalayan catchment. Cryosphere 2010, 4, 115–128. [Google Scholar] [CrossRef] [Green Version]
- Huss, M.; Hock, R. Global-scale hydrological response to future glacier mass loss. Nat. Clim. Chang. 2018, 8, 135–140. [Google Scholar] [CrossRef] [Green Version]
- Nuth, C.; Kääb, A. Co-registration and bias corrections of satellite elevation data sets for quantifying glacier thickness change. Cryosphere 2011, 5, 271–290. [Google Scholar] [CrossRef] [Green Version]
- McNabb, R.; Nuth, C.; Kääb, A.; Girod, L. Sensitivity of glacier volume change estimation to DEM void interpolation. Cryosphere 2019, 13, 895–910. [Google Scholar] [CrossRef] [Green Version]
- Huss, M. Density assumptions for converting geodetic glacier volume change to mass change. Cryosphere 2013, 7, 877–887. [Google Scholar] [CrossRef] [Green Version]
- Pieczonka, T.; Bolch, T. Region-wide glacier mass budgets and area changes for the Central Tien Shan between ~1975 and 1999 using Hexagon KH-9 imagery. Glob. Planet. Chang. 2015, 128, 1–13. [Google Scholar] [CrossRef]
- Ragettli, S.; Bolch, T.; Pellicciotti, F. Heterogeneous glacier thinning patterns over the last 40 years in Langtang Himal, Nepal. Cryosphere 2016, 10, 2075–2097. [Google Scholar] [CrossRef] [Green Version]
- Leprince, S.; Barbot, S.; Ayoub, F. Automatic and precise orthorectification, coregistration, and subpixel correlation of satellite images, application to ground deformation measurements. IEEE Trans. Geosci. Remote Sens. 2007, 45, 1529–1558. [Google Scholar] [CrossRef] [Green Version]
- Heid, T.; Kääb, A. Repeat optical satellite images reveal widespread and long term decrease in land-terminating glacier speeds. Cryosphere 2012, 6, 467–478. [Google Scholar] [CrossRef] [Green Version]
- Dehecq, A.; Gourmelen, N.; Gardner, A.S.; Brun, F.; Goldberg, D.; Nienow, P.W.; Berthier, E.; Vincent, C.; Wagnon, P.; Trouvé, E. Twenty-first century glacier slowdown driven by mass loss in High Mountain Asia. Nat. Geosci. 2019, 12, 22–27. [Google Scholar] [CrossRef]
- Willis, M.J.; Melkonian, A.K.; Pritchard, M.E.; Ramage, J.M. Ice loss rates at the Northern Patagonian Icefield derived using a decade of satellite remote sensing. Landsat Sci. Results 2012, 117, 184–198. [Google Scholar] [CrossRef]
- Guizar-Sicairos, M.; Thurman, S.T.; Fienup, J.R. Efficient subpixel image registration algorithms. Opt. Lett. 2008, 33, 156–158. [Google Scholar] [CrossRef] [Green Version]
- Barsch, D. Rockglaciers: Indicators for the Present and Former Geoecology in High Mountain Environments; Springer: Berlin/Heidelberg, Germany, 1996; ISBN 3-540-60742-0. [Google Scholar]
- Berthling, I. Beyond confusion: Rock glaciers as cryo-conditioned landforms. Geomorphology 2011, 131, 98–106. [Google Scholar] [CrossRef]
- Brighenti, S.; Tolotti, M.; Bruno, M.C.; Engel, M.; Wharton, G.; Cerasino, L.; Mair, V.; Bertoldi, W. After the peak water: The increasing influence of rock glaciers on alpine river systems. Hydrol. Process. 2019, 33, 2804–2823. [Google Scholar] [CrossRef]
- Reinosch, E.; Gerke, M.; Riedel, B.; Schwalb, A.; Ye, Q.; Buckel, J. Rock glacier inventory of the western Nyainqêntanglha Range, Tibetan Plateau, supported by InSAR time series and automated classification. Permafr. Periglac. Process. 2021, 32, 657–672. [Google Scholar] [CrossRef]
- Blöthe, J.H.; Rosenwinkel, S.; Höser, T.; Korup, O. Rock-glacier dams in High Asia. Earth Surf. Process. Landf. 2019, 44, 808–824. [Google Scholar] [CrossRef]
- Bolch, T.; Rohrbach, N.; Kutuzov, S.; Robson, B.A.; Osmonov, A. Occurrence, evolution and ice content of ice-debris complexes in the Ak-Shiirak, Central Tien Shan revealed by geophysical and remotely-sensed investigations. Earth Surf. Process. Landf. 2019, 44, 129–143. [Google Scholar] [CrossRef] [Green Version]
- Brardinoni, F.; Scotti, R.; Sailer, R.; Mair, V. Evaluating sources of uncertainty and variability in rock glacier inventories. Earth Surf. Process. Landf. 2019, 44, 2450–2466. [Google Scholar] [CrossRef]
- Robson, B.A.; Bolch, T.; MacDonell, S.; Hölbling, D.; Rastner, P.; Schaffer, N. Automated detection of rock glaciers using deep learning and object-based image analysis. Remote Sens. Environ. 2020, 250, 112033. [Google Scholar] [CrossRef]
- Nie, Y.; Sheng, Y.; Liu, Q.; Liu, L.; Liu, S.; Zhang, Y.; Song, C. A regional-scale assessment of Himalayan glacial lake changes using satellite observations from 1990 to 2015. Remote Sens. Environ. 2017, 189, 1–13. [Google Scholar] [CrossRef] [Green Version]
- Brun, F.; Berthier, E.; Wagnon, P.; Kääb, A.; Treichler, D. A spatially resolved estimate of High MountainAsia glacier mass balances from 2000 to 2016. Nat. Geosci. 2017, 10, 668–673. [Google Scholar] [CrossRef]
- Zemp, M.; Huss, M.; Thibert, E.; Eckert, N.; McNabb, R.; Huber, J.; Barandun, M.; Machguth, H.; Nussbaumer, S.U.; Gärtner-Roer, I.; et al. Global glacier mass changes and their contributions to sea-level rise from 1961 to 2016. Nature 2019, 568, 382–386. [Google Scholar] [CrossRef]
- Azam, M.F.; Wagnon, P.; Berthier, E.; Vincent, C.; Fujita, K.; Kargel, J.S. Review of the status and mass changes of Himalayan-Karakoram glaciers. J. Glaciol. 2018, 64, 61–74. [Google Scholar] [CrossRef] [Green Version]
- Pelto, M.; Panday, P.; Matthews, T.; Maurer, J.; Perry, L.B. Observations of winter ablation on glaciers in the mount everest region in 2020–2021. Remote Sens. 2021, 13, 2692. [Google Scholar] [CrossRef]
- Potocki, M.; Mayewski, P.A.; Matthews, T.; Perry, L.B.; Schwikowski, M.; Tait, A.M.; Korotkikh, E.; Clifford, H.; Kang, S.; Sherpa, T.C.; et al. Mt. Everest’s highest glacier is a sentinel for accelerating ice loss. npj Clim. Atmos. Sci. 2022, 5, 7. [Google Scholar] [CrossRef]
- Tsutaki, S.; Fujita, K.; Nuimura, T.; Sakai, A.; Sugiyama, S.; Komori, J.; Tshering, P. Contrasting thinning patterns between lake- and land-terminating glaciers in the Bhutanese Himalaya. Cryosphere 2019, 13, 2733–2750. [Google Scholar] [CrossRef] [Green Version]
- Carrivick, J.L.; Tweed, F.S.; Sutherland, J.L.; Mallalieu, J. Toward numerical modeling of interactions between ice-marginal proglacial lakes and glaciers. Front. Earth Sci. 2020, 8, 577068. [Google Scholar] [CrossRef]
- Anderson, L.S.; Anderson, R.S. Modeling debris-covered glaciers: Response to steady debris deposition. Cryosphere 2016, 10, 1105–1124. [Google Scholar] [CrossRef] [Green Version]
- Mölg, N.; Fergusson, J.; Bolch, T.; Vieli, A. On the influence of debris cover on glacier morphology: How high-relief structures evolve from smooth surfaces. Geomorphology 2020, 357, 107092. [Google Scholar] [CrossRef]
- Miles, E.S.; Pellicciotti, F.; Willis, I.C.; Steiner, J.F.; Buri, P.; Arnold, N.S. Refined energy-balance modelling of a supraglacial pond, Langtang Khola, Nepal. Ann. Glaciol. 2016, 57, 29–40. [Google Scholar] [CrossRef] [Green Version]
- Linsbauer, A.; Frey, H.; Haeberli, W.; Machguth, H.; Azam, M.F.; Allen, S. Modelling glacier-bed overdeepenings and possible future lakes for the glaciers in the Himalaya–Karakoram region. Ann. Glaciol. 2016, 57, 117–130. [Google Scholar] [CrossRef] [Green Version]
- Harrison, S.; Jones, D.; Anderson, K.; Shannon, S.; Betts, R.A. Is ice in the Himalayas more resilient to climate change than we thought? Geogr. Ann. A 2021, 103, 1–7. [Google Scholar] [CrossRef]


| Satellite | Sensor | No. of Scenes | Date | Scene IDs | Usage |
|---|---|---|---|---|---|
| Corona KH-4A | 7 | 26/11/1964 | DS1014-2118DA188 | Glacial lakes, DEM 1, GMB 2 | |
| DS1014-2118DA189 | |||||
| DS1014-2118DA190 | |||||
| DS1014-2118DA191 | |||||
| DS1014-2118DF187 | |||||
| DS1014-2118DF188 | |||||
| DS1014-2118DF189 | |||||
| Hexagon | KH9 MC | 2 | 23/11/1974 | DZB1209-500101L006001 | Glacial lakes, DEM 1, GMB 2 |
| DZB1209-500101L007001 | |||||
| Terra | ASTER | 8 | 23/09/2004 | AST_L1A_00309232004045839_20191216041641_19157 | DEM 1, GMB 2 |
| AST_L1A_00309232004045848_20191216041641_19161 | |||||
| 16/10/2004 | AST_L1A_00310162004050426_20191216041651_19216 | ||||
| AST_L1A_00310162004050435_20191216041651_19218 | |||||
| 23/10/2009 | AST_L1A#00310232009045933_10262009104316 | ||||
| AST_L1A#00310232009045924_10262009104307 | |||||
| 20/10/2017 | AST_L1A#00310202017050548_10212017083708 | ||||
| 26/10/2019 | AST_L1A#00310262019050517_10272019083336 | ||||
| ALOS | PALSAR | 7 | 16/07/2007 | ALPSRP078570550 | Rock glacier activity |
| 31/08/2007 | ALPSRP085280550 | ||||
| 16/10/2007 | ALPSRP091990550 | ||||
| 16/01/2008 | ALPSRP105410550 | ||||
| 02/03/2008 | ALPSRP112120550 | ||||
| 02/06/2008 | ALPSRP125540550 | ||||
| 18/07/2008 | ALPSRP132250550 | ||||
| Landsat | TM/ETM+/OLI | 107 | 1988–2017 | For details see [49] | Glaciers, glacier velocity, glacial lakes |
| Pléiades | 1A/1B | 10 | 25/09/2018 | DS_PHR1A_201809250511185_FR1_PX_E085N28_1110_03316 | DEM 1, GMB 2 rock glacier mapping |
| 26/09/2018 | DS_PHR1B_201809260504010_FR1_PX_E086N28_0105_05430 | ||||
| 27/09/2018 | DS_PHR1A_201809270456239_FR1_PX_E086N28_0510_01804 | ||||
| 03/10/2018 | DS_PHR1B_201810030500231_FR1_PX_E086N28_0309_02182 | ||||
| 15/10/2018 | DS_PHR1B_201810150507481_FR1_PX_E085N28_1103_02921 | ||||
| 15/10/2018 | DS_PHR1B_201810150507593_FR1_PX_E086N27_0123_00862 | ||||
| 02/10/2018 | DS_PHR1B_201810220504174_FR1_PX_E086N28_0102_01804 | ||||
| 03/11/2018 | DS_PHR1B_201811030511344_FR1_PX_E085N28_0715_03053 | ||||
| 04/11/2018 | DS_PHR1A_201811040503518_FR1_PX_E085N28_1108_01768 | ||||
| 02/10/2018 | DS_PHR1A_201810020508169_FR1_PX_E085N28_0911_05204 | ||||
| SPOT-7 | HRVIR | 1 | 06/10/2015 | DS_SPOT7_201510060438227_FR1_FR1_SE1_SE1_E086N28_01303 | DEM 1, GMB 2 |
| Sentinel 2 | MSI | 149 | Nov 2016–Nov 2019 | For details see [52] | Glacier velocity |
Publisher’s Note: MDPI stays neutral with regard to jurisdictional claims in published maps and institutional affiliations. |
© 2022 by the authors. Licensee MDPI, Basel, Switzerland. This article is an open access article distributed under the terms and conditions of the Creative Commons Attribution (CC BY) license (https://creativecommons.org/licenses/by/4.0/).
Share and Cite
Bolch, T.; Yao, T.; Bhattacharya, A.; Hu, Y.; King, O.; Liu, L.; Pronk, J.B.; Rastner, P.; Zhang, G. Earth Observation to Investigate Occurrence, Characteristics and Changes of Glaciers, Glacial Lakes and Rock Glaciers in the Poiqu River Basin (Central Himalaya). Remote Sens. 2022, 14, 1927. https://doi.org/10.3390/rs14081927
Bolch T, Yao T, Bhattacharya A, Hu Y, King O, Liu L, Pronk JB, Rastner P, Zhang G. Earth Observation to Investigate Occurrence, Characteristics and Changes of Glaciers, Glacial Lakes and Rock Glaciers in the Poiqu River Basin (Central Himalaya). Remote Sensing. 2022; 14(8):1927. https://doi.org/10.3390/rs14081927
Chicago/Turabian StyleBolch, Tobias, Tandong Yao, Atanu Bhattacharya, Yan Hu, Owen King, Lin Liu, Jan B. Pronk, Philipp Rastner, and Guoqing Zhang. 2022. "Earth Observation to Investigate Occurrence, Characteristics and Changes of Glaciers, Glacial Lakes and Rock Glaciers in the Poiqu River Basin (Central Himalaya)" Remote Sensing 14, no. 8: 1927. https://doi.org/10.3390/rs14081927
APA StyleBolch, T., Yao, T., Bhattacharya, A., Hu, Y., King, O., Liu, L., Pronk, J. B., Rastner, P., & Zhang, G. (2022). Earth Observation to Investigate Occurrence, Characteristics and Changes of Glaciers, Glacial Lakes and Rock Glaciers in the Poiqu River Basin (Central Himalaya). Remote Sensing, 14(8), 1927. https://doi.org/10.3390/rs14081927