
Multi-Source Hydrological Data Products to Monitor High Asian River Basins and Regional Water Security

 ,
, 
 , , , , , , ,
  ,
,  ,
,  ,
,  , ,
, ,  ,
,  ,
,  , ,
, ,  ,
, 
 , , and
Abstract
:1. Introduction
- (a)
- The cryosphere in high elevation regions is a sensitive indicator of climate change;
- (b)
- Meltwater from glaciers, permafrost and snow is a significant fraction, and a critical one at times, of freshwater resources in many parts of the world, particularly in China and in the countries receiving waters from the Qinghai–Tibet Plateau (Figure 1).
- ➢
- To generate hydrological data products taking advantage of the synergies of European and Chinese data assets and space-borne observation systems, taking advantage of the improved accessibility and standardization of Chinese data products;
- ➢
- To develop an energy-budget-based glacier mass balance model driven by satellite observations and linked with a distributed river basin model to describe glacier-melt contribution to river flow;
- ➢
- To use satellite hydrological data products for forcing, calibration, validation and data assimilation in basin scale hydrological models;
- ➢
- To develop synergies between Synthetic Aperture Radar (SAR) polarimetry and SAR altimetry to map flooded areas and to delineate water bodies extent as well as to estimate their water level.
2. Project, Sub-Projects, EO and Other Data Utilization
2.1. List of Sub-Projects and Teaming
2.2. Description and Summary Table of EO and Other Data Utilized
3. Subprojects Research and Approach
3.1. Satellite Data Products on Each Component of the Terrestrial Water Cycle at the Land–Atmosphere Interface
3.1.1. Research Aims
3.1.2. Research Approach
WP1 Retrieval of Precipitation and Data Products
WP2 Retrieval of Evaporation, Transpiration and Sublimation; Data Products
- Rainfall interception and evaporation;
- Root zone soil moisture;
- Snow and ice sublimation;
- Open water evaporation.
WP3 Retrieval of Biophysical Variables and Data Products
WP4 Retrieval of Snow, Ice and Frozen Ground Variables and Data Products
WP5 Retrieval of Extent of Water Bodies
WP6 Validation of Data Products
3.2. Observation and Modeling of High Elevation Hydrological Processes, including Accumulation and Ablation in Glaciers
3.2.1. Research Aims
- Advance our understanding of climate dynamics at high altitude and of precipitation patterns in particular;
- Understand snow contribution to glacier mass balance and runoff and the main mechanisms of its redistribution and variability at the catchment scale;
- Investigate the role played by debris cover on the mass balance of glaciers, thus contributing to solving the so-called debris-cover “anomaly” that has suggested high rates of mass loss for these glaciers despite the assumed insulating effect of debris;
- Understand the energy and mass balance of glaciers in the TP and their changes in different climate regions, through development of a physically based mass balance model;
- Quantify snow and glacier contribution to total catchment runoff and assess regional differences in catchment hydrology by incorporating knowledge of physical processes into an integrated modeling approach that includes all relevant processes responsible for runoff generation, their interconnection and their spatial and temporal variability.
3.2.2. Research Approach
3.3. Forcing, Calibration, Validation and Data Assimilation in Basin Scale Hydrological Models Using Satellite Data Products
3.3.1. Research Aims
3.3.2. Research Approach
WP1: Satellite Data on Land Surface Properties for Hydrological Modeling
WP2: Database of Hydro Meteorological Forcings
WP3: Hydrological Modeling: Calibration/Validation
WP4: Operational Hydrological Data Products
3.4. Monitoring Water Resources in Red River Basin Using Microwave Remote Sensing
3.4.1. Research Aims
- Determining the water balance of a region;
- Determining the agricultural water balance;
- Mitigating and predicting flood, landslide and drought risk;
- Designing irrigation schemes and managing agricultural productivity;
- Predicting geomorphological changes, such as erosion or sedimentation;
- Assessing the impacts of natural and anthropogenic environmental change on water resources.
3.4.2. Research Approach
4. Research Results and Conclusions
4.1. Satellite Data Products on Each Component of the Terrestrial Water Cycle at the Land–Atmosphere Interface
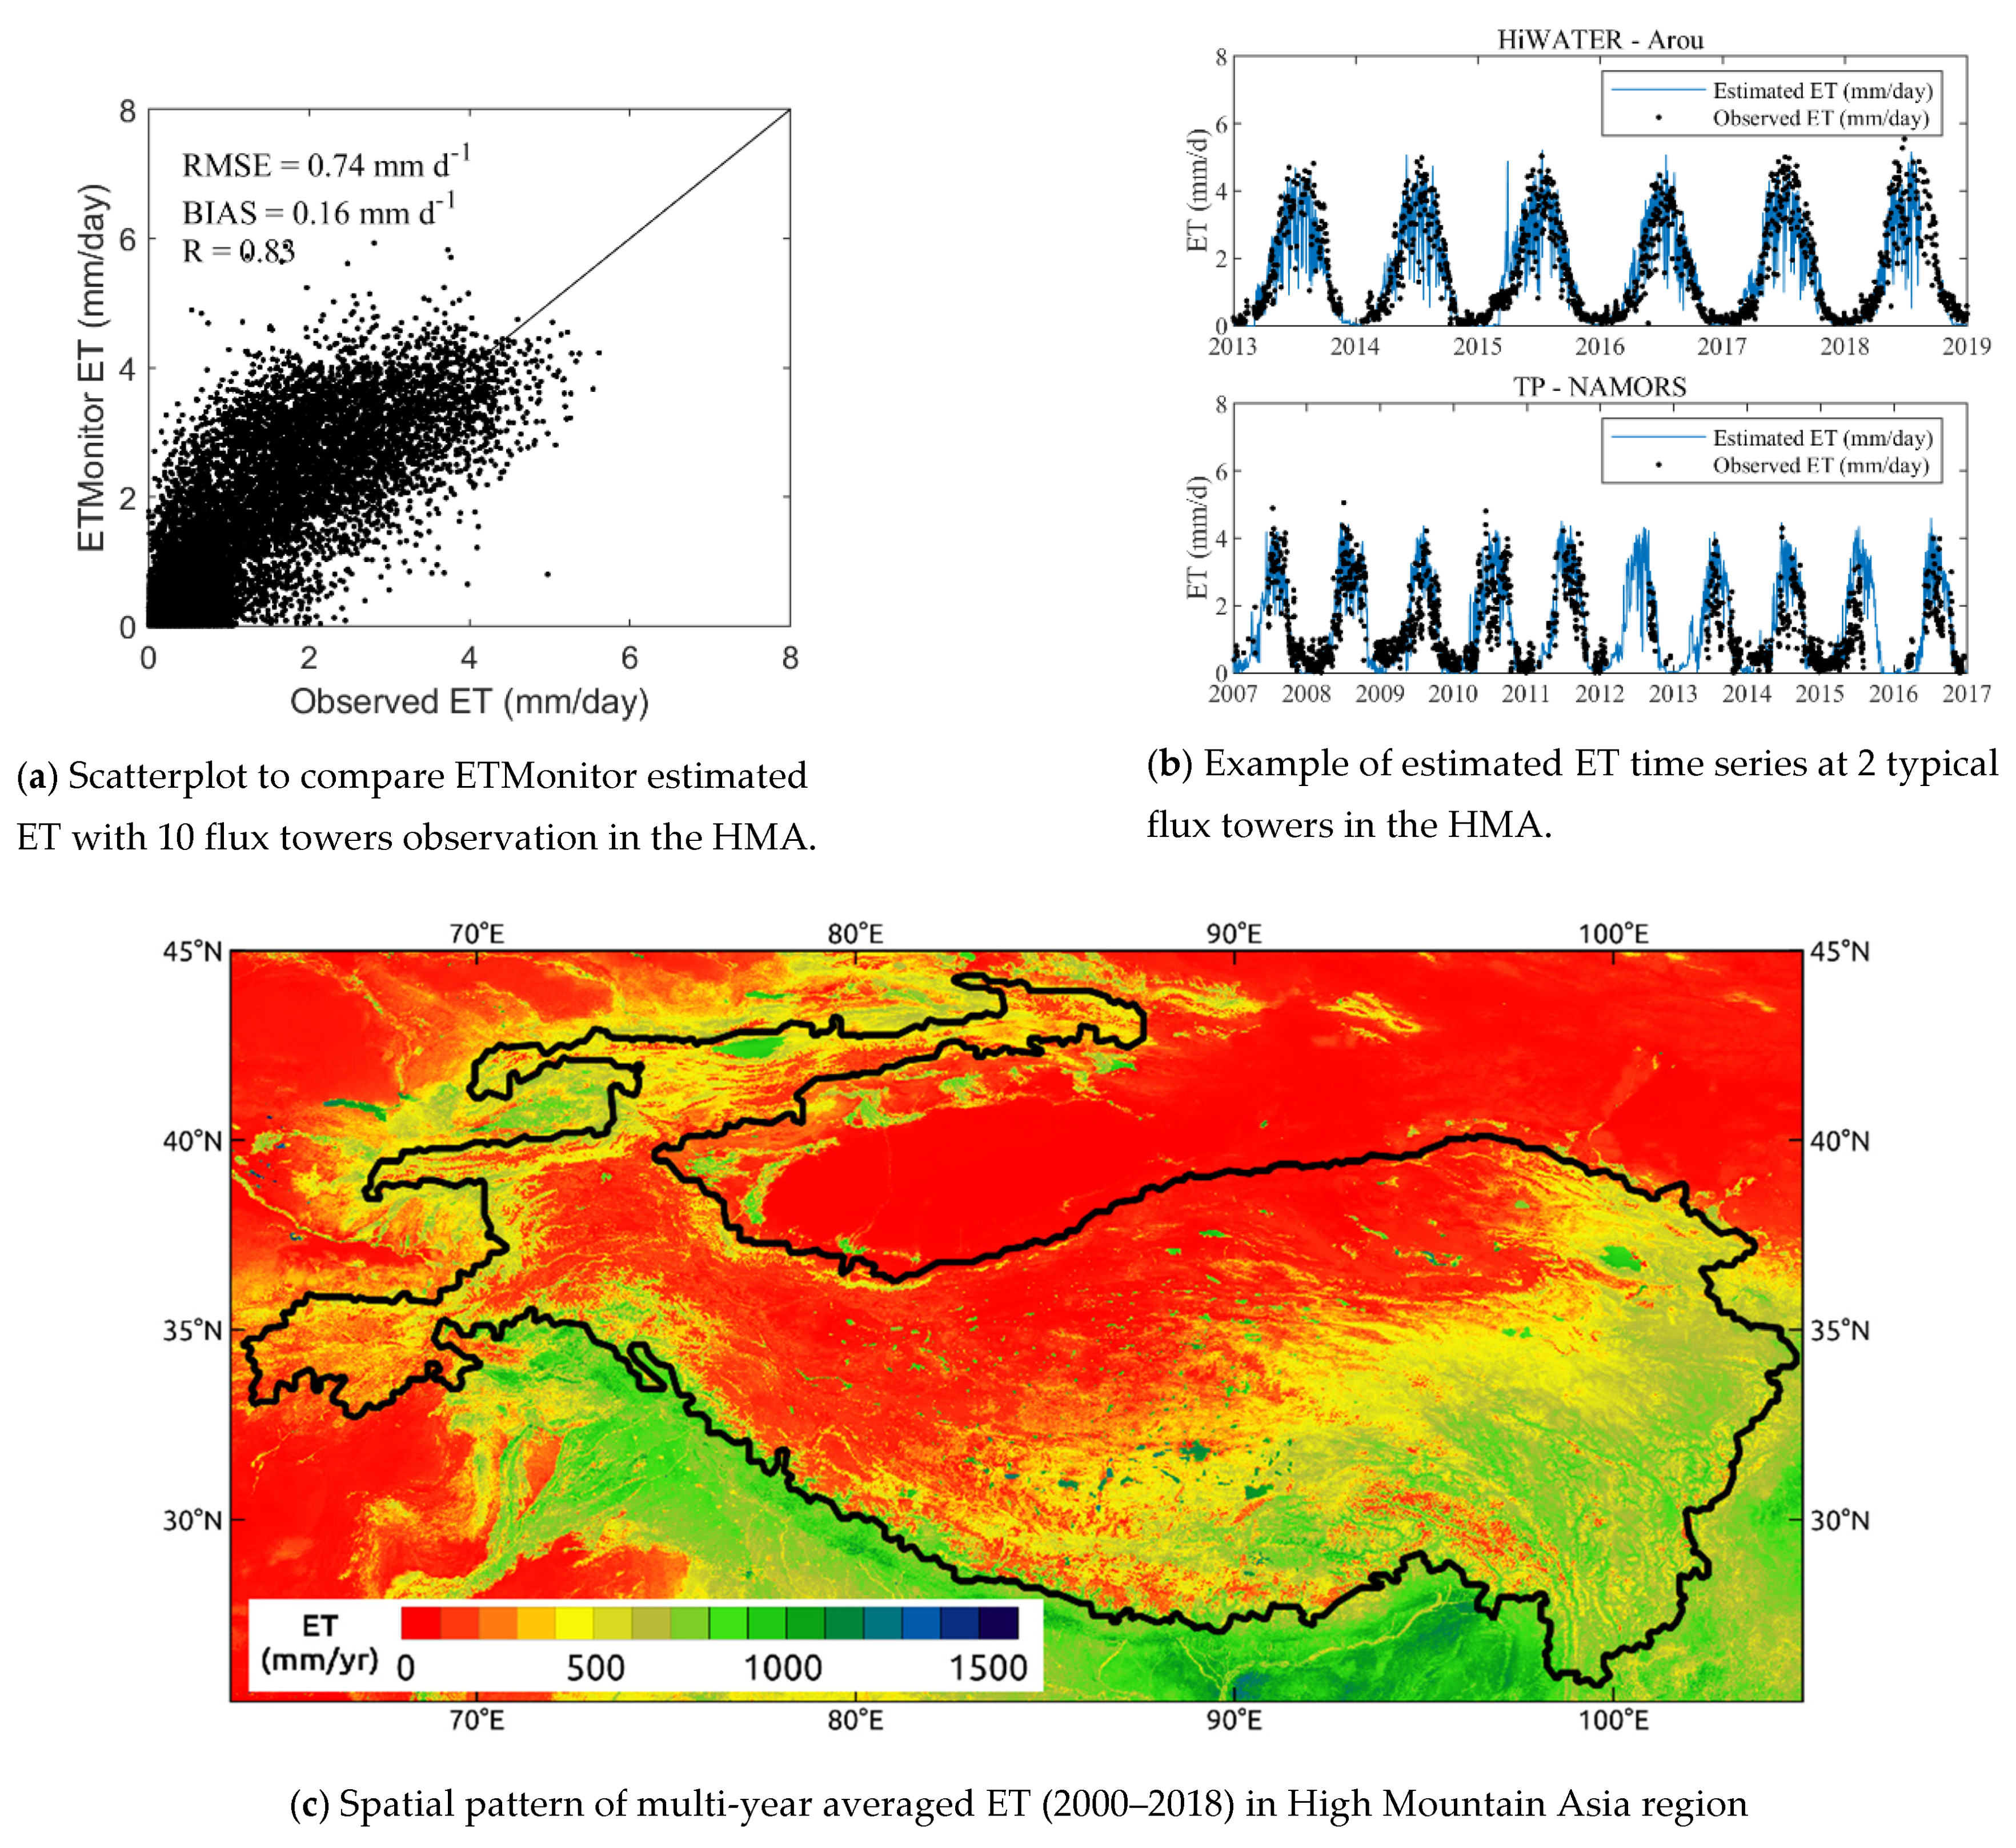
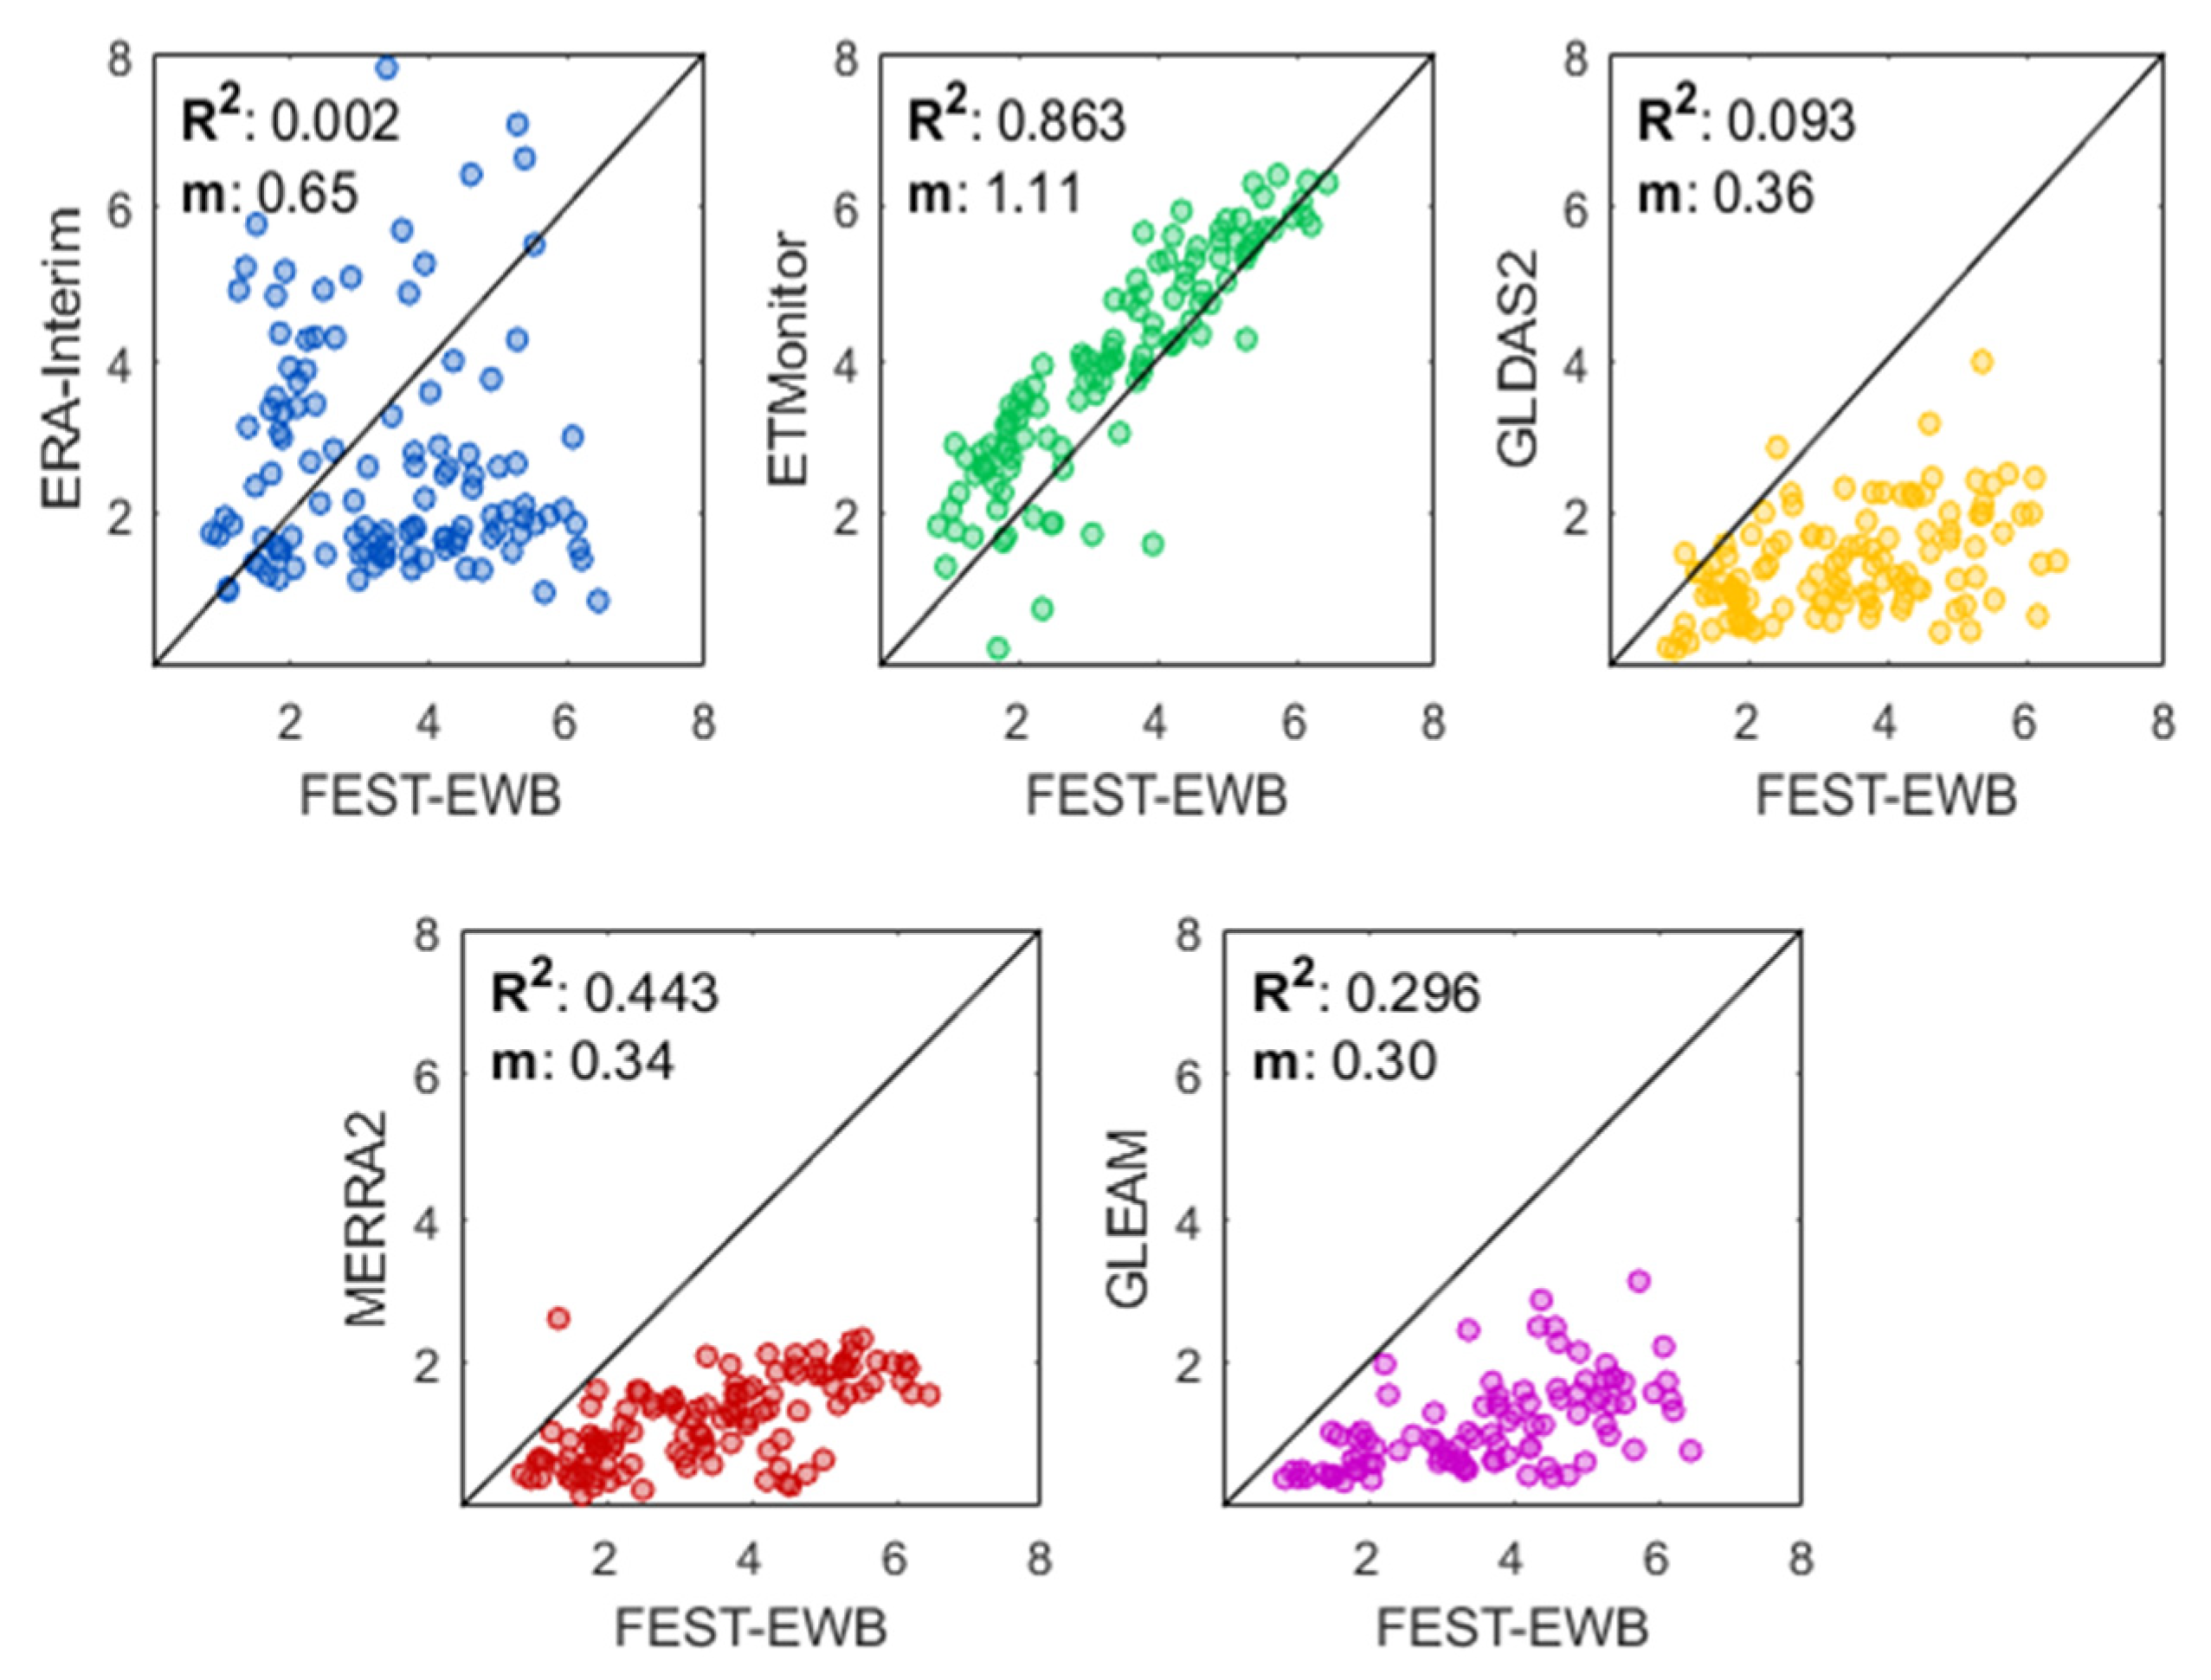
4.1.1. Results
4.1.2. Conclusions
4.2. Observation and Modeling of High Elevation Hydrological Processes, including Accumulation and Ablation in Glaciers
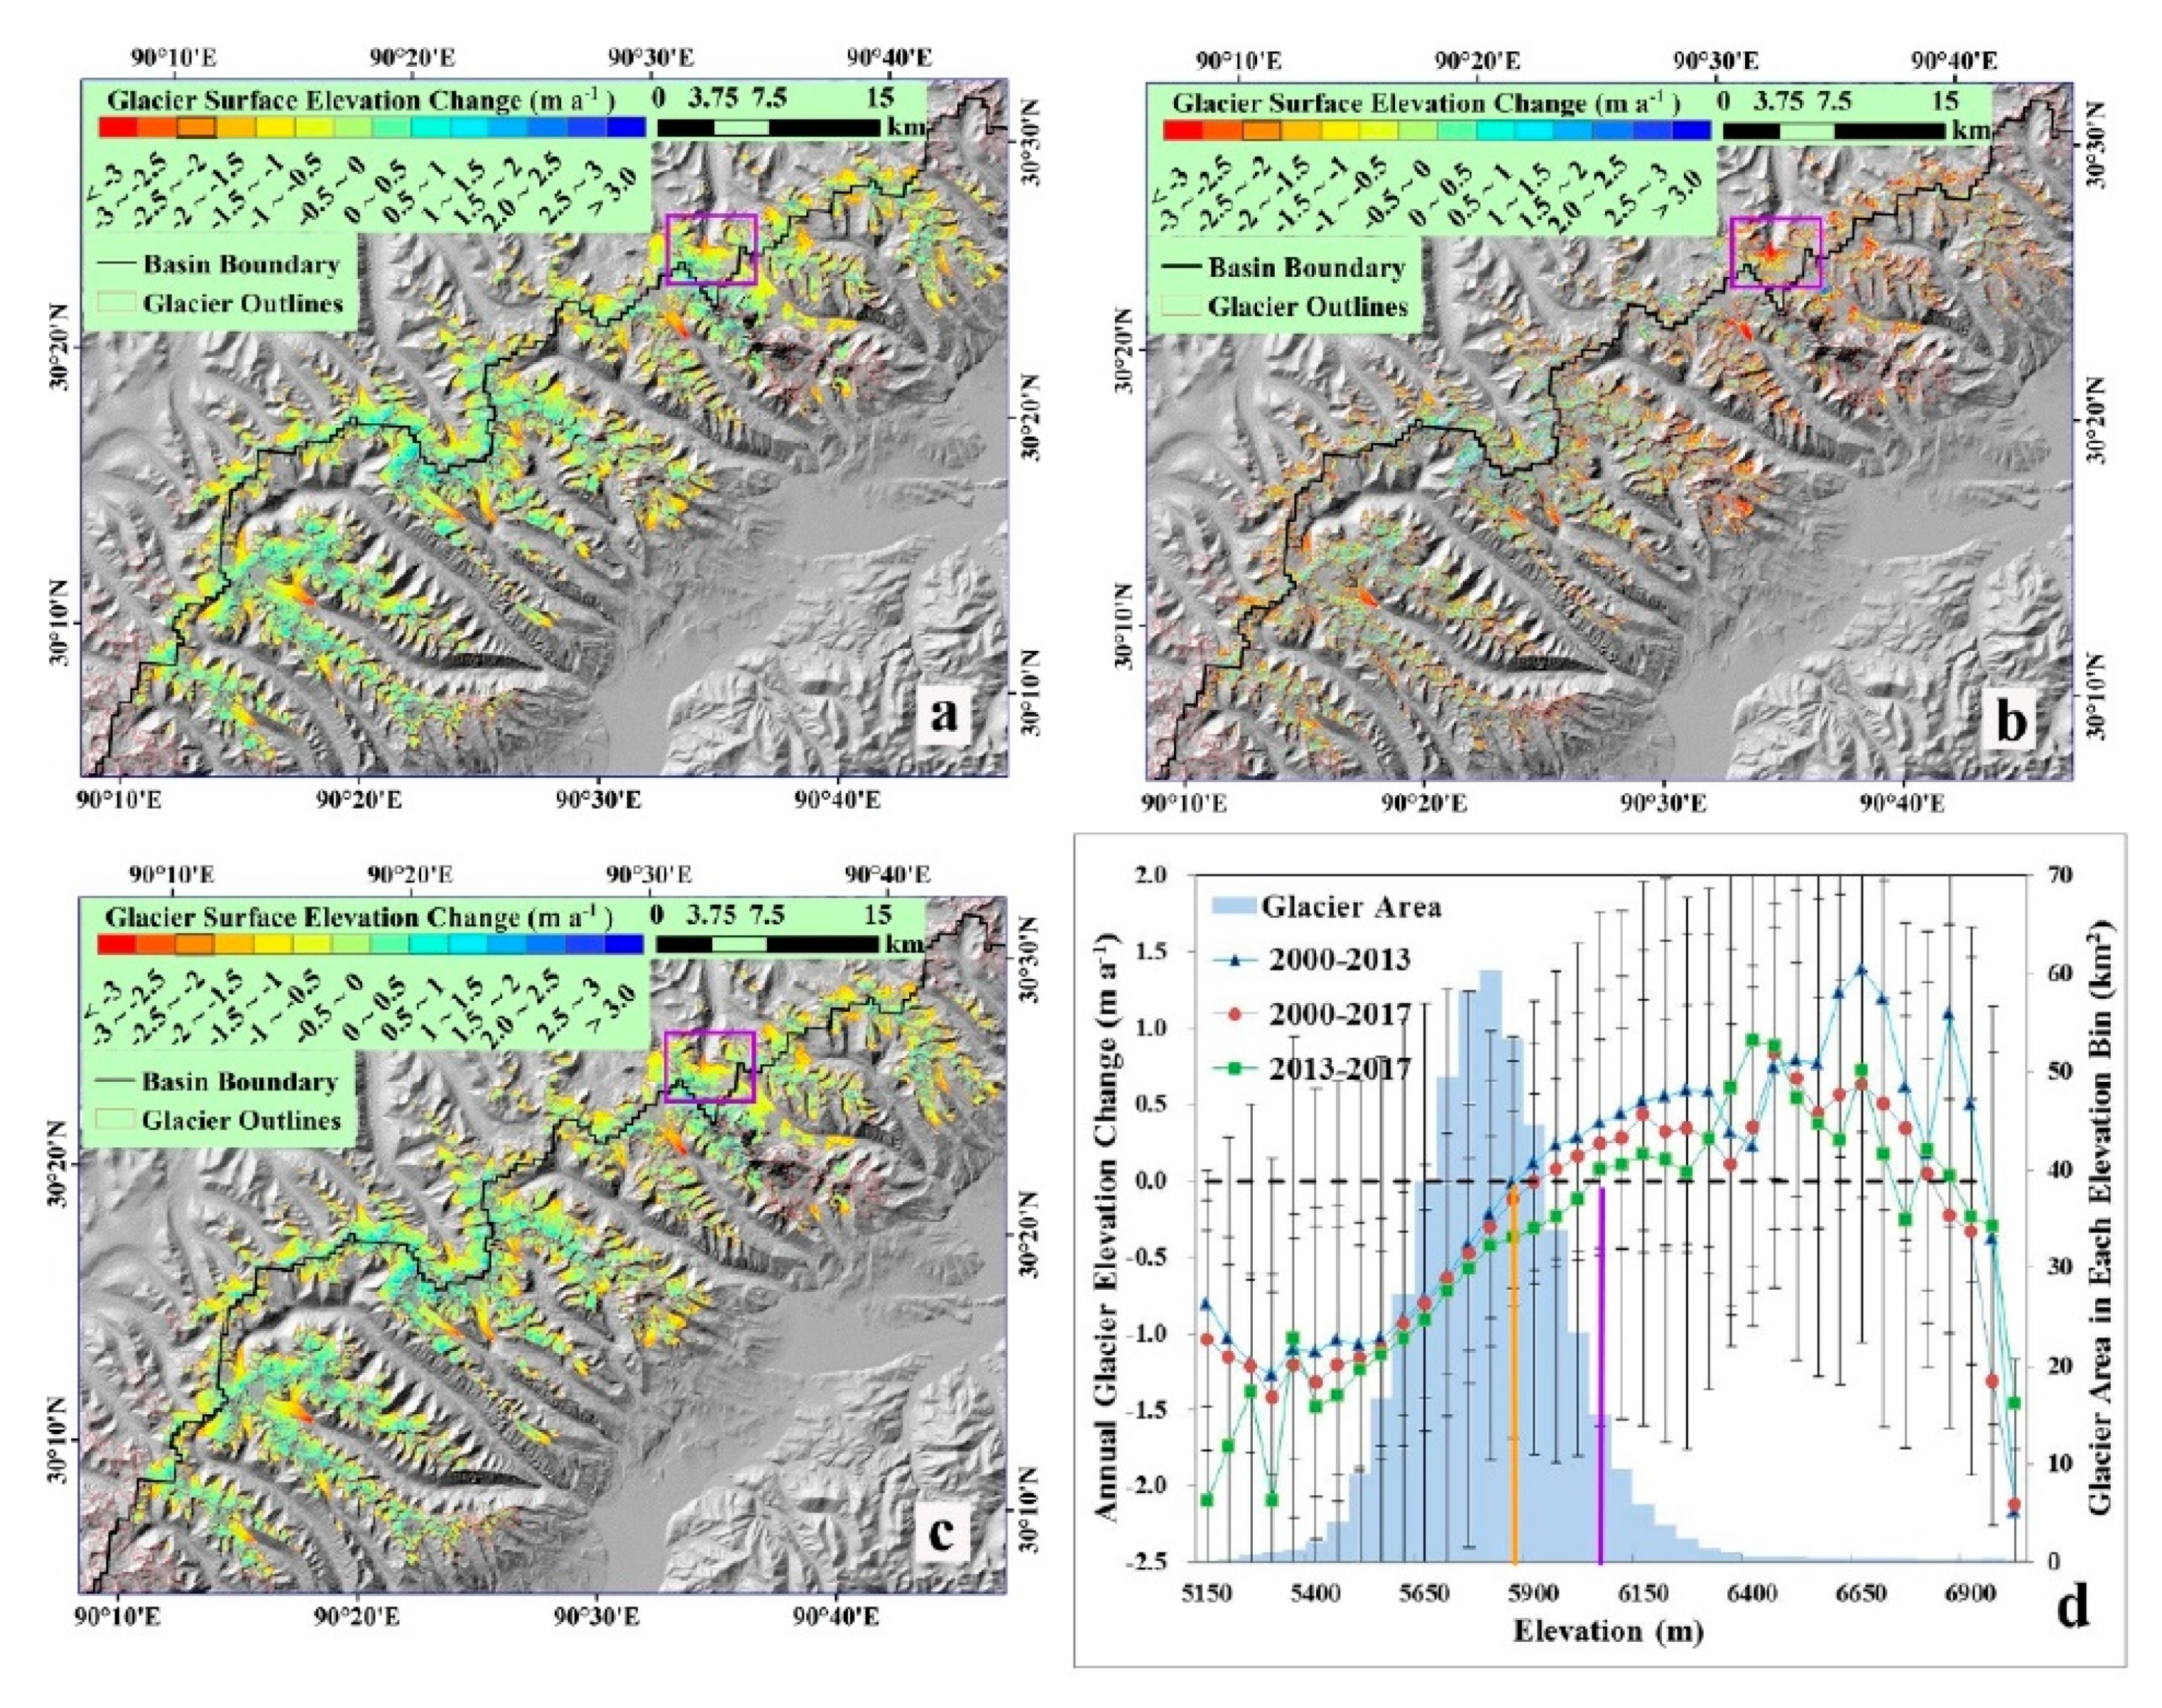
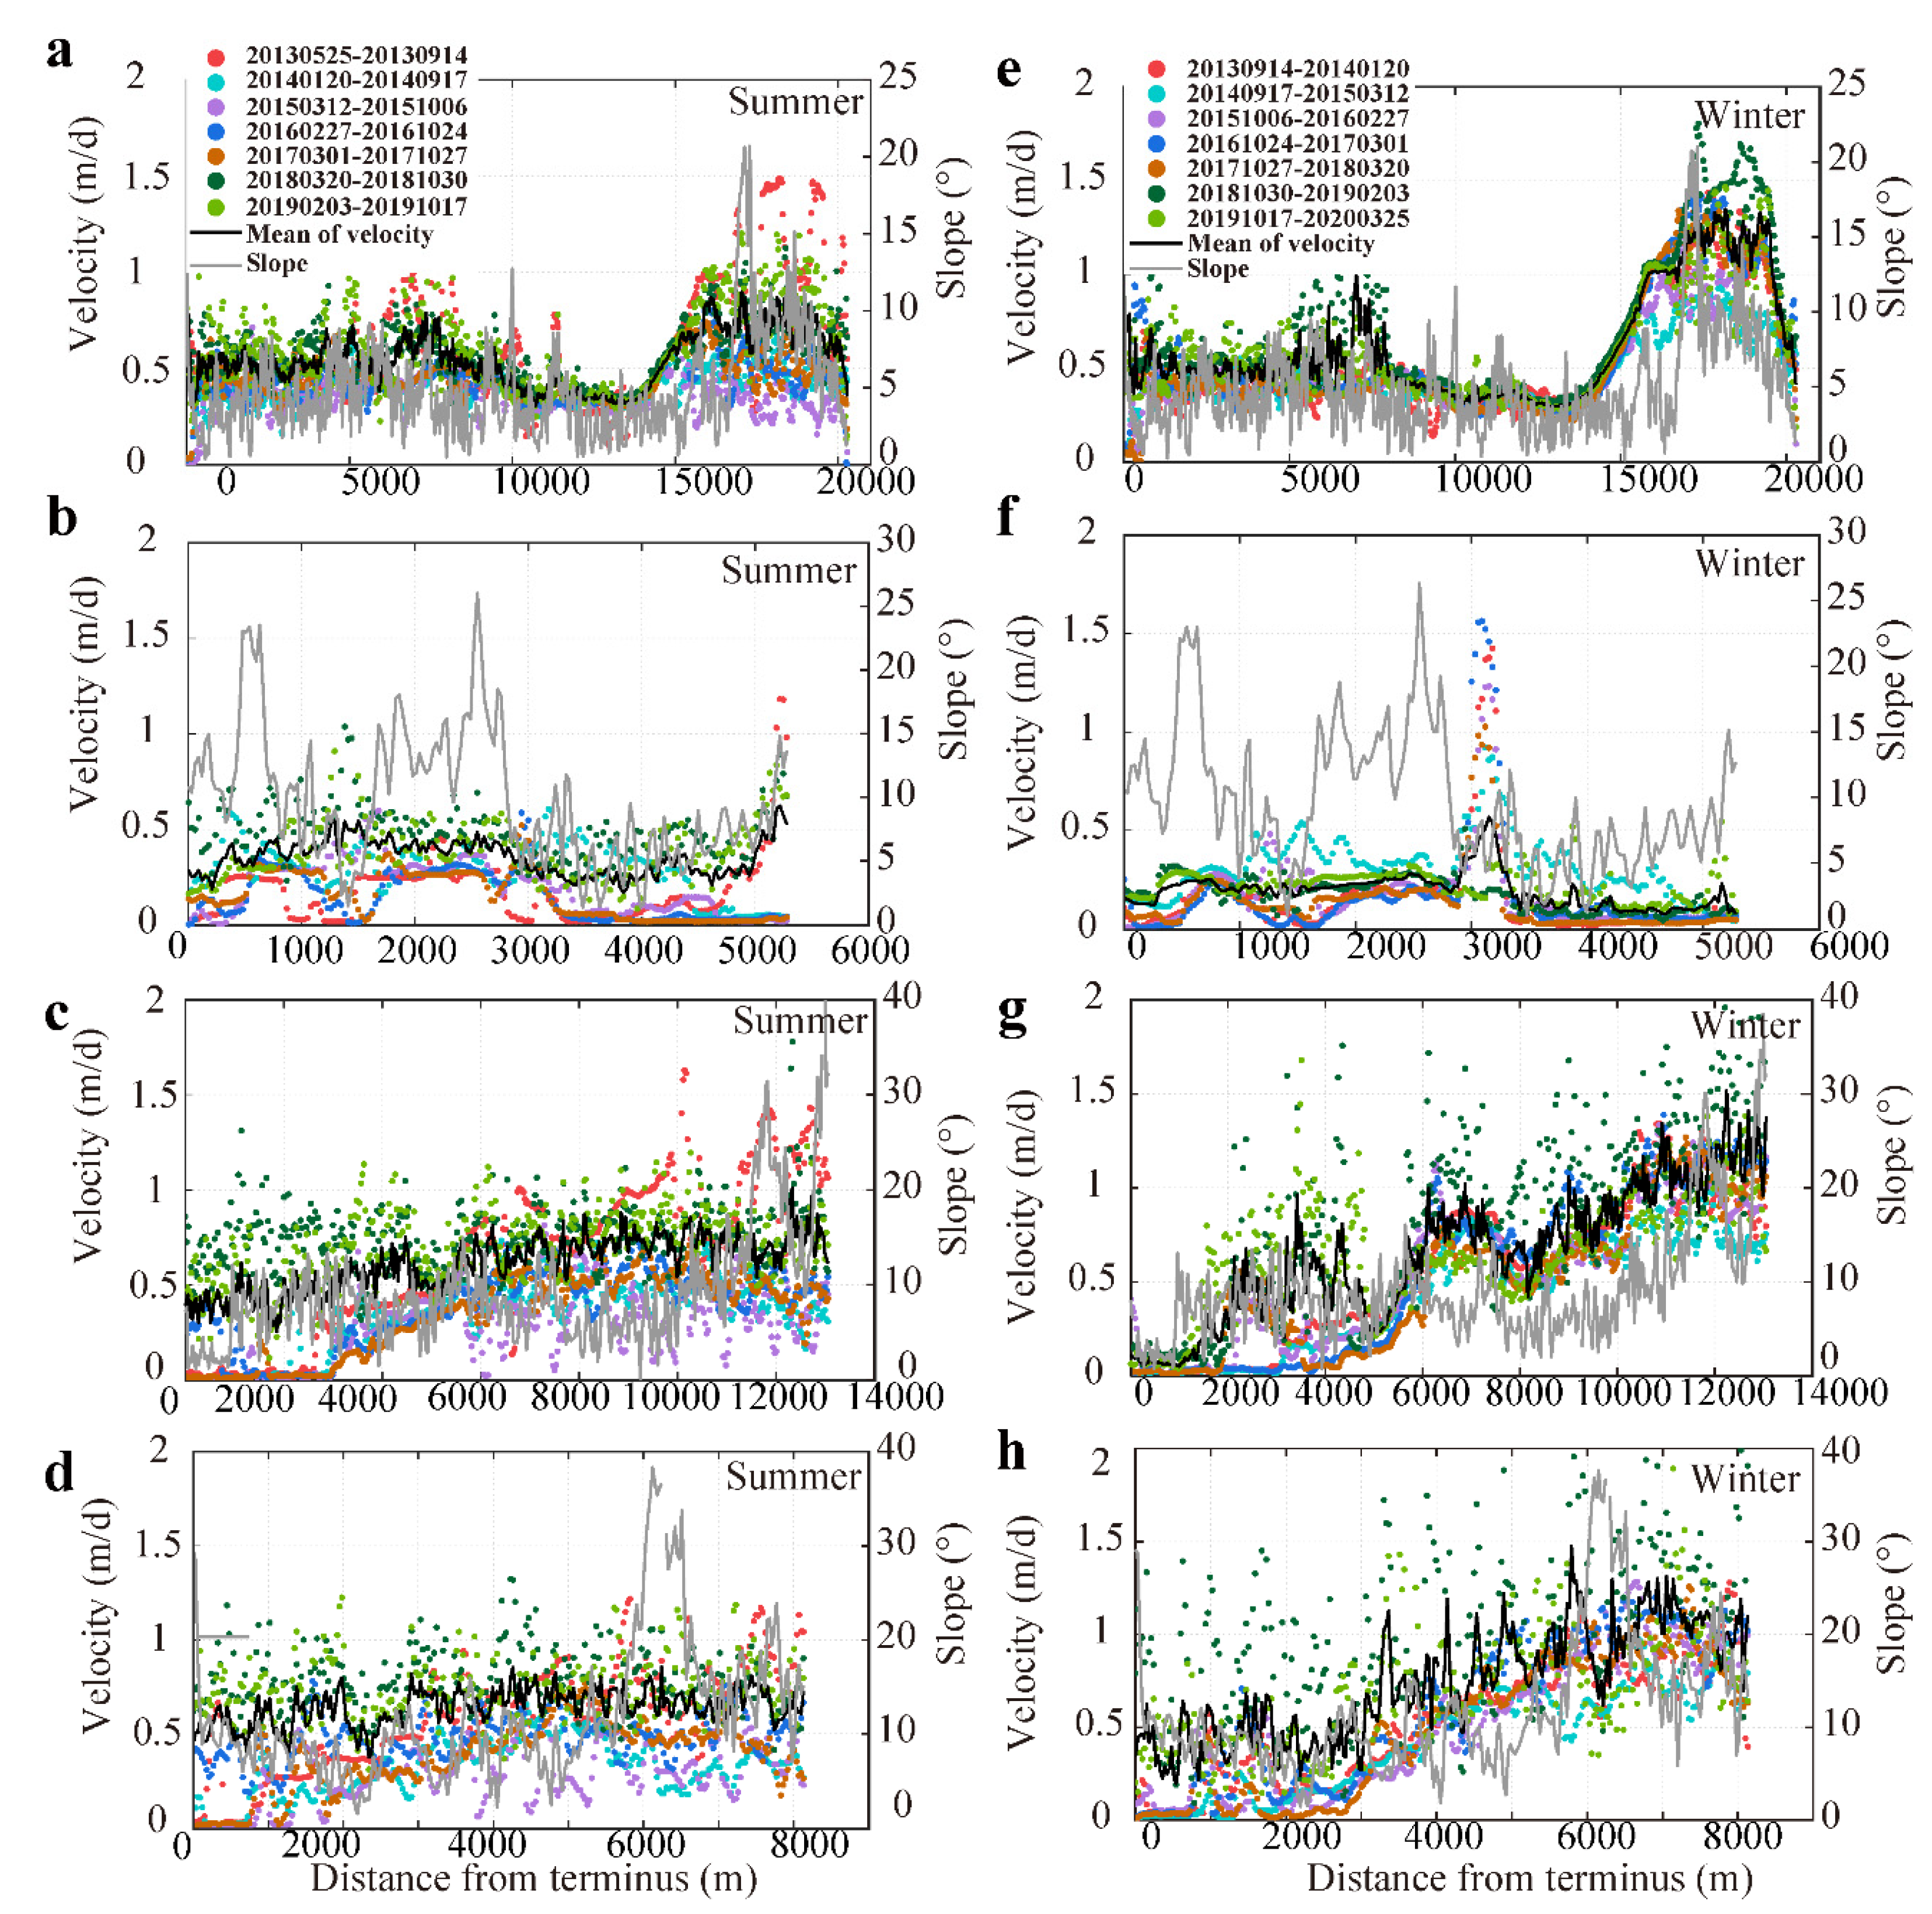
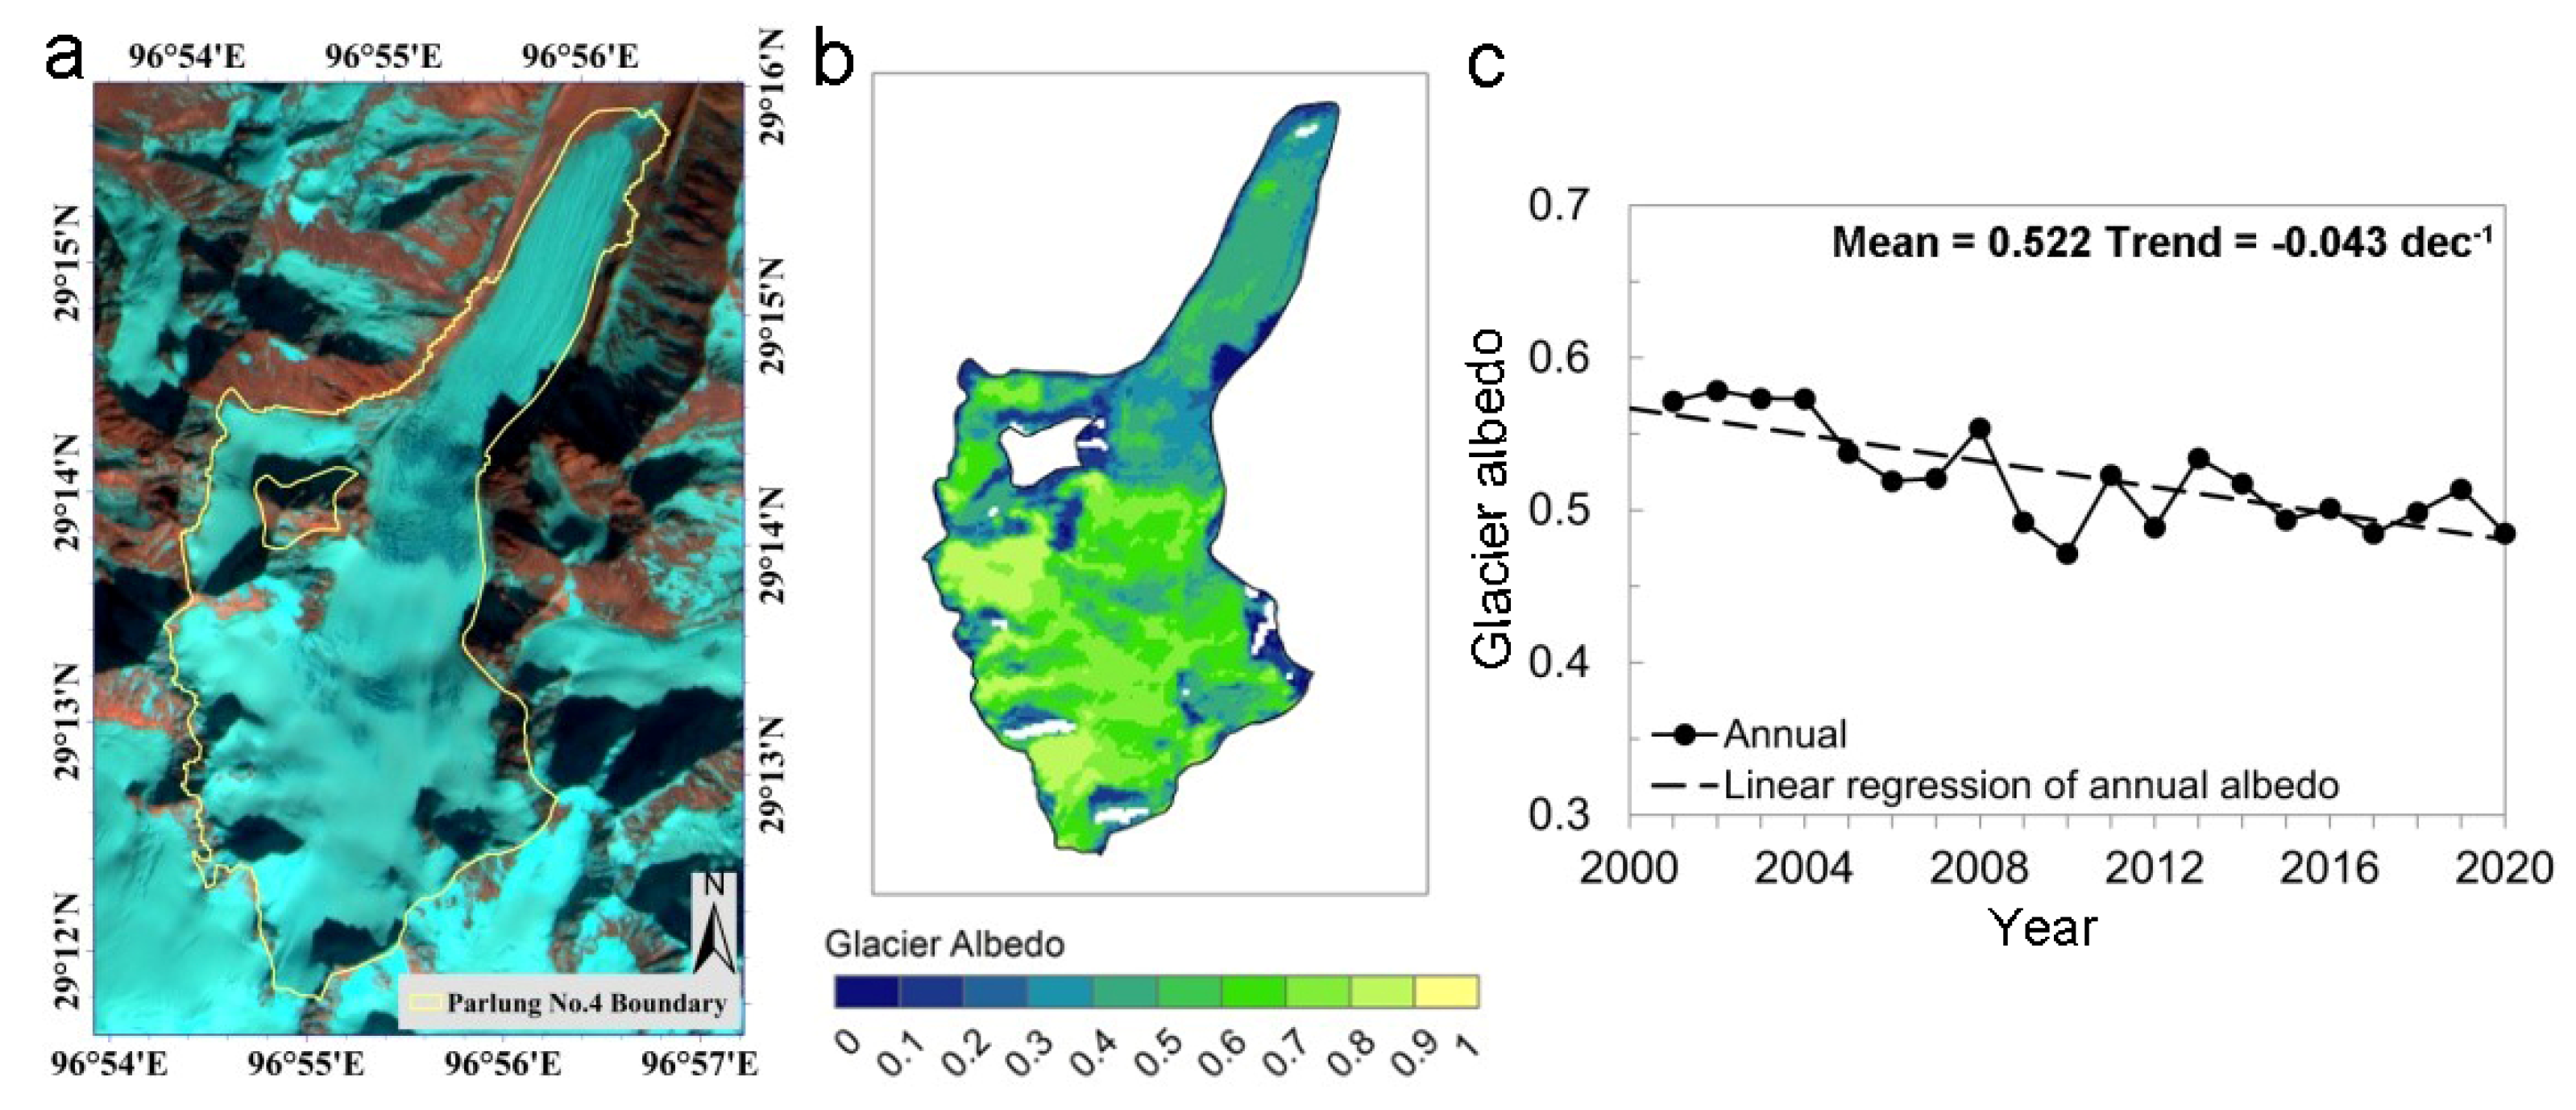
4.2.1. Results
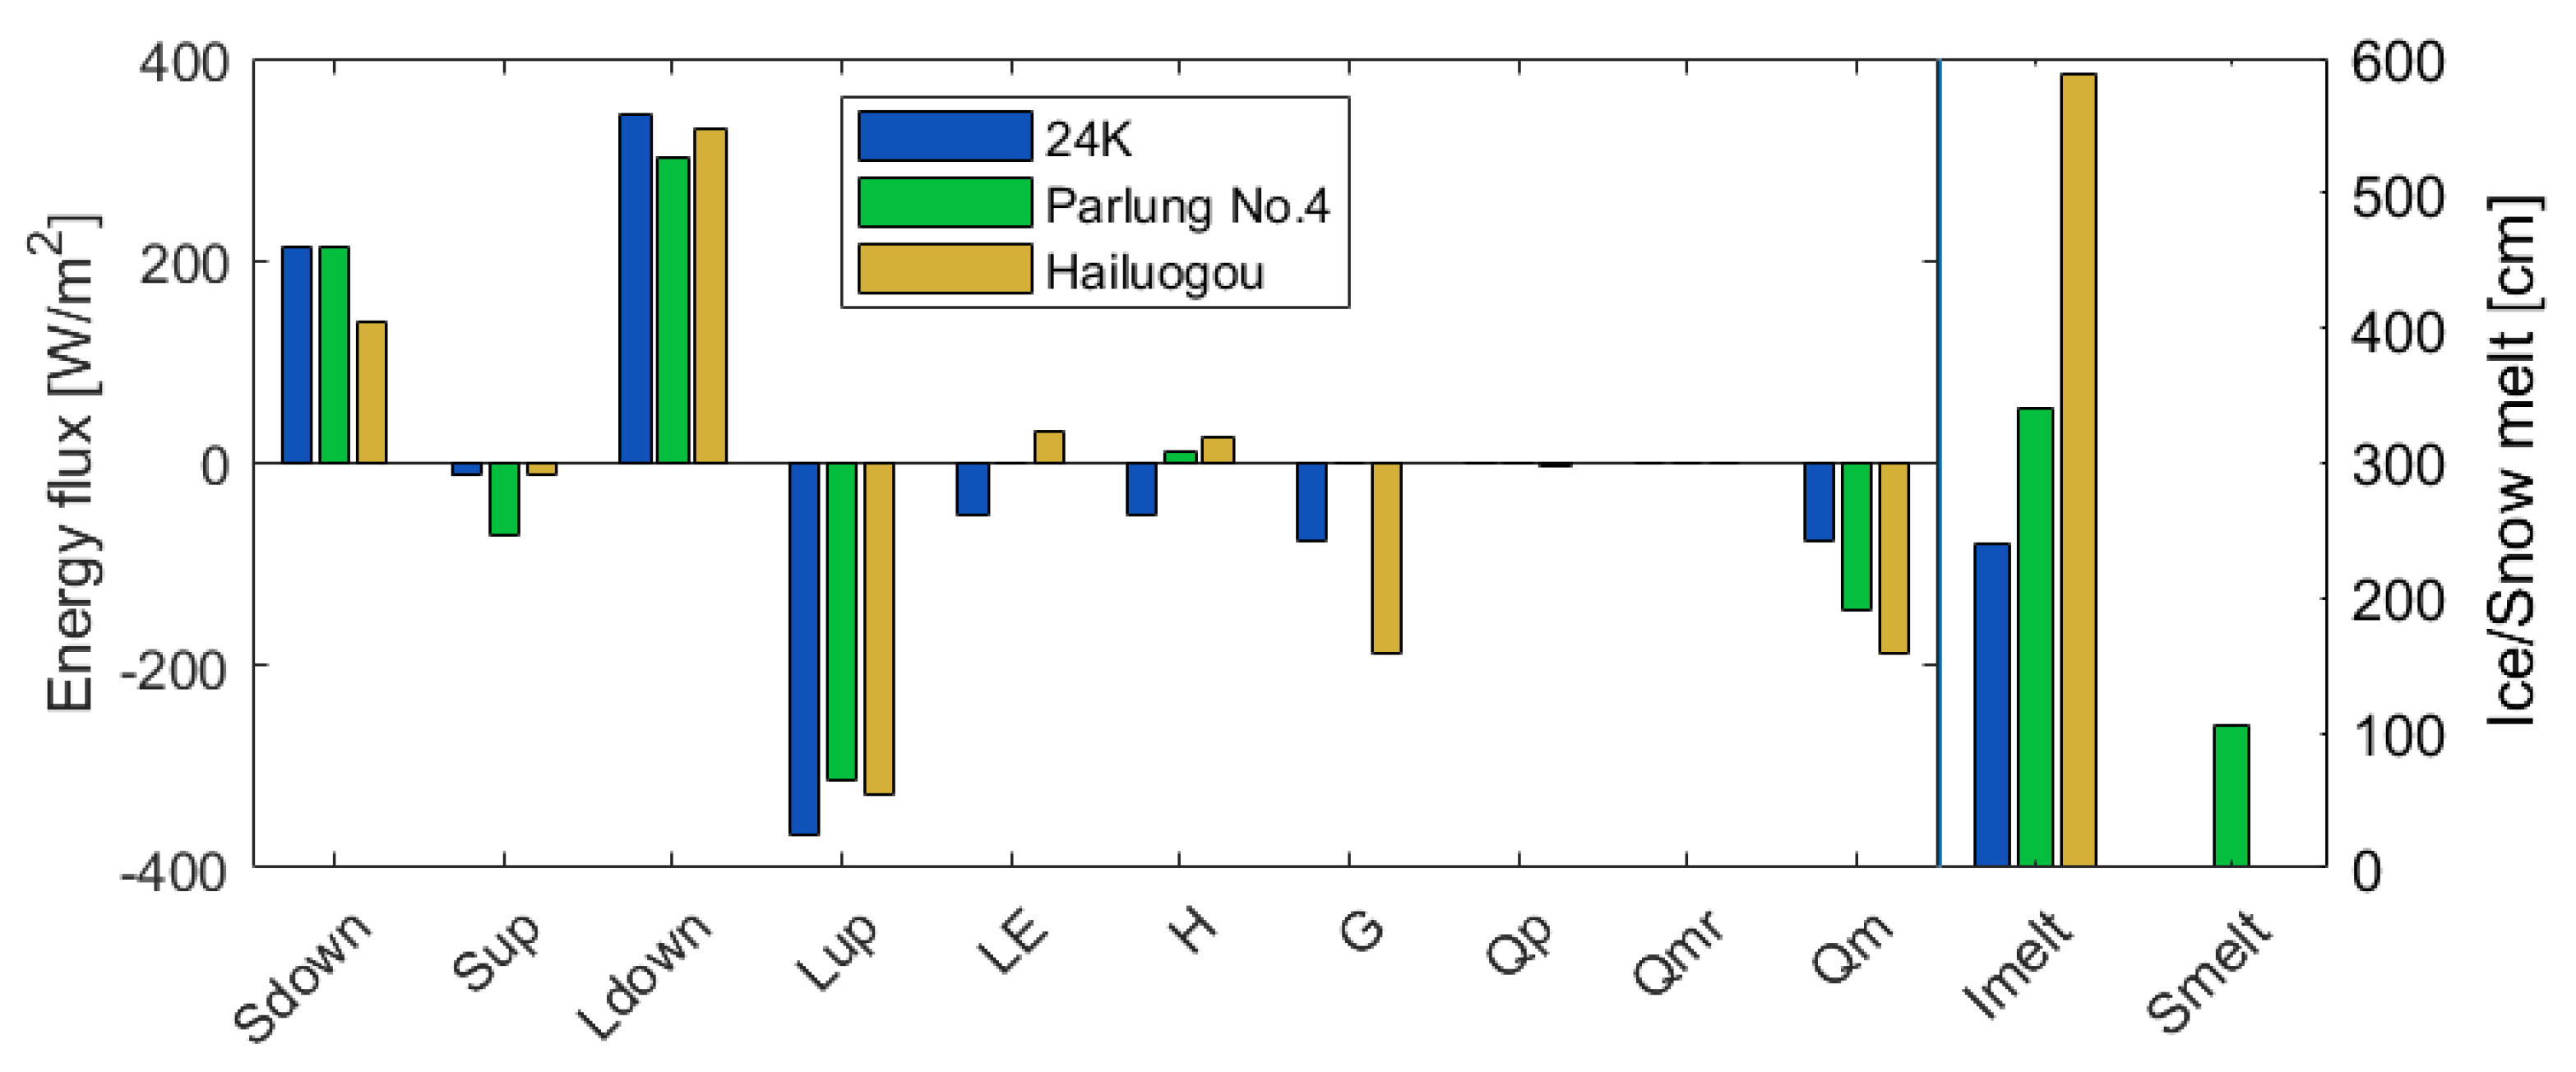
Observation and Modeling of Glacier Energy and Mass Balance
4.2.2. Conclusions
4.3. Forcing, Calibration, Validation and Data Assimilation in Basin Scale Hydrological Models Using Satellite Data Products
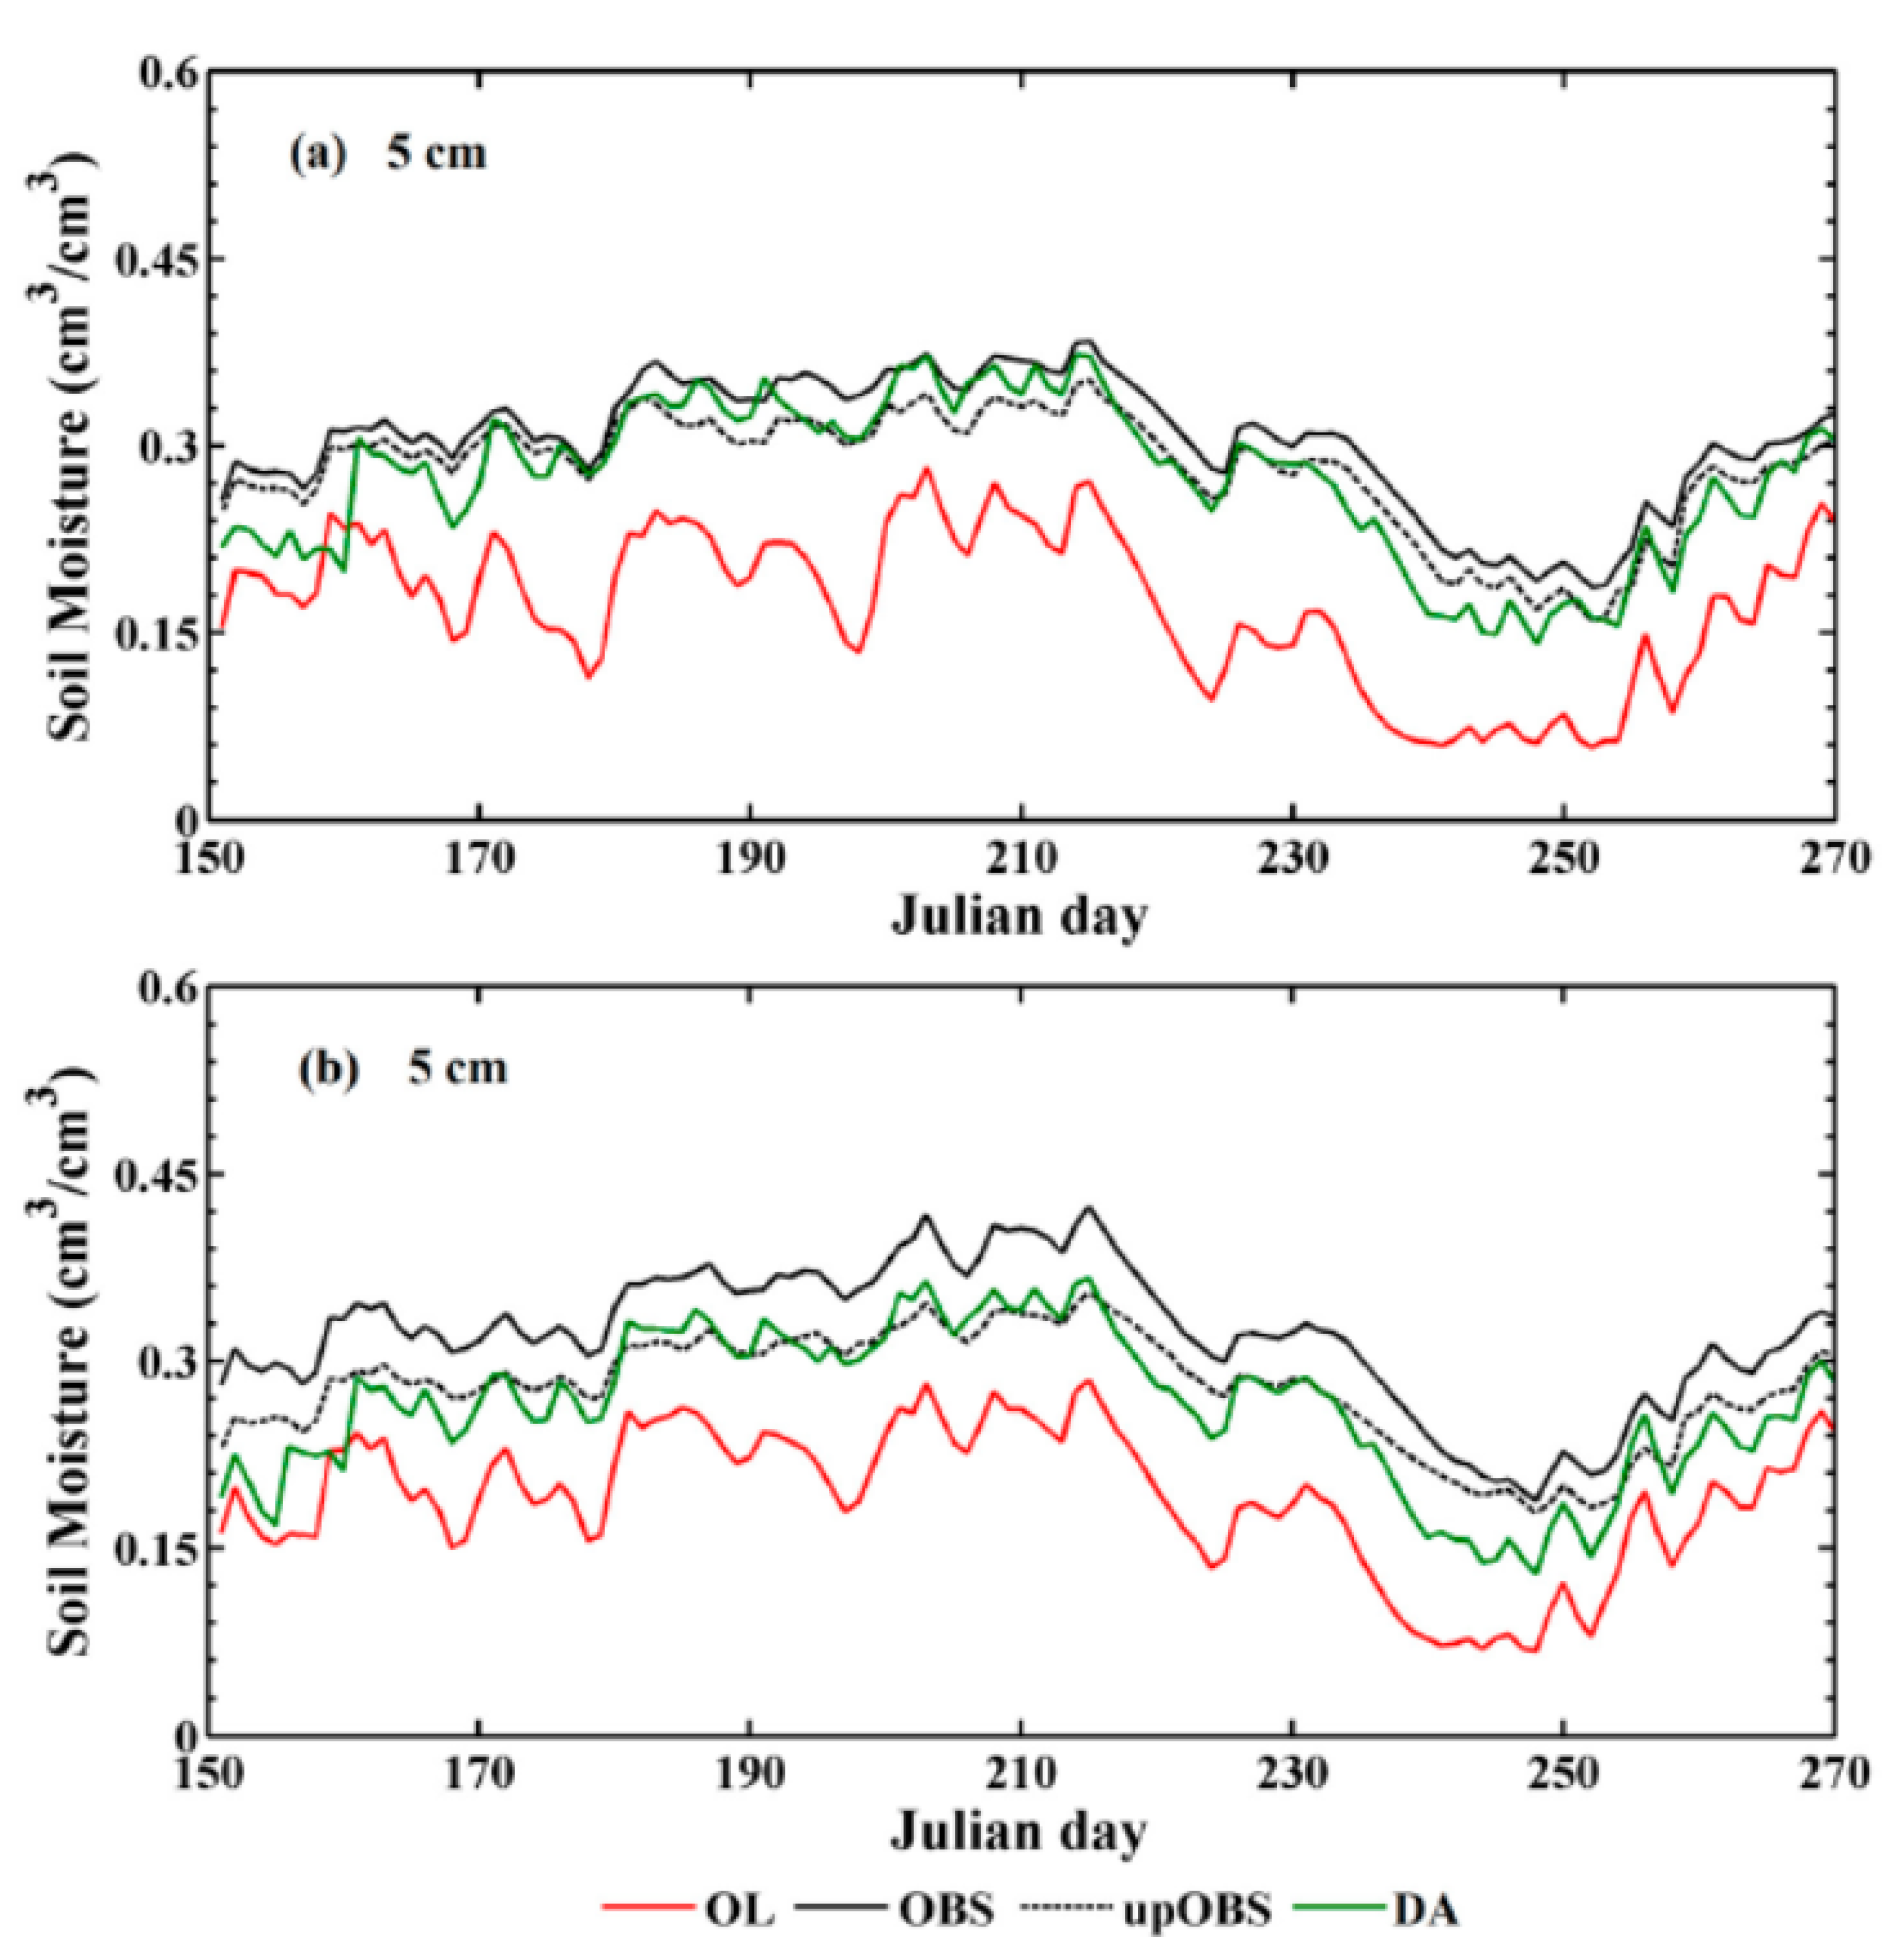
4.3.1. Results
4.3.2. Conclusions
4.4. Monitoring Water Resources in Red River Basin Using Microwave Remote Sensing
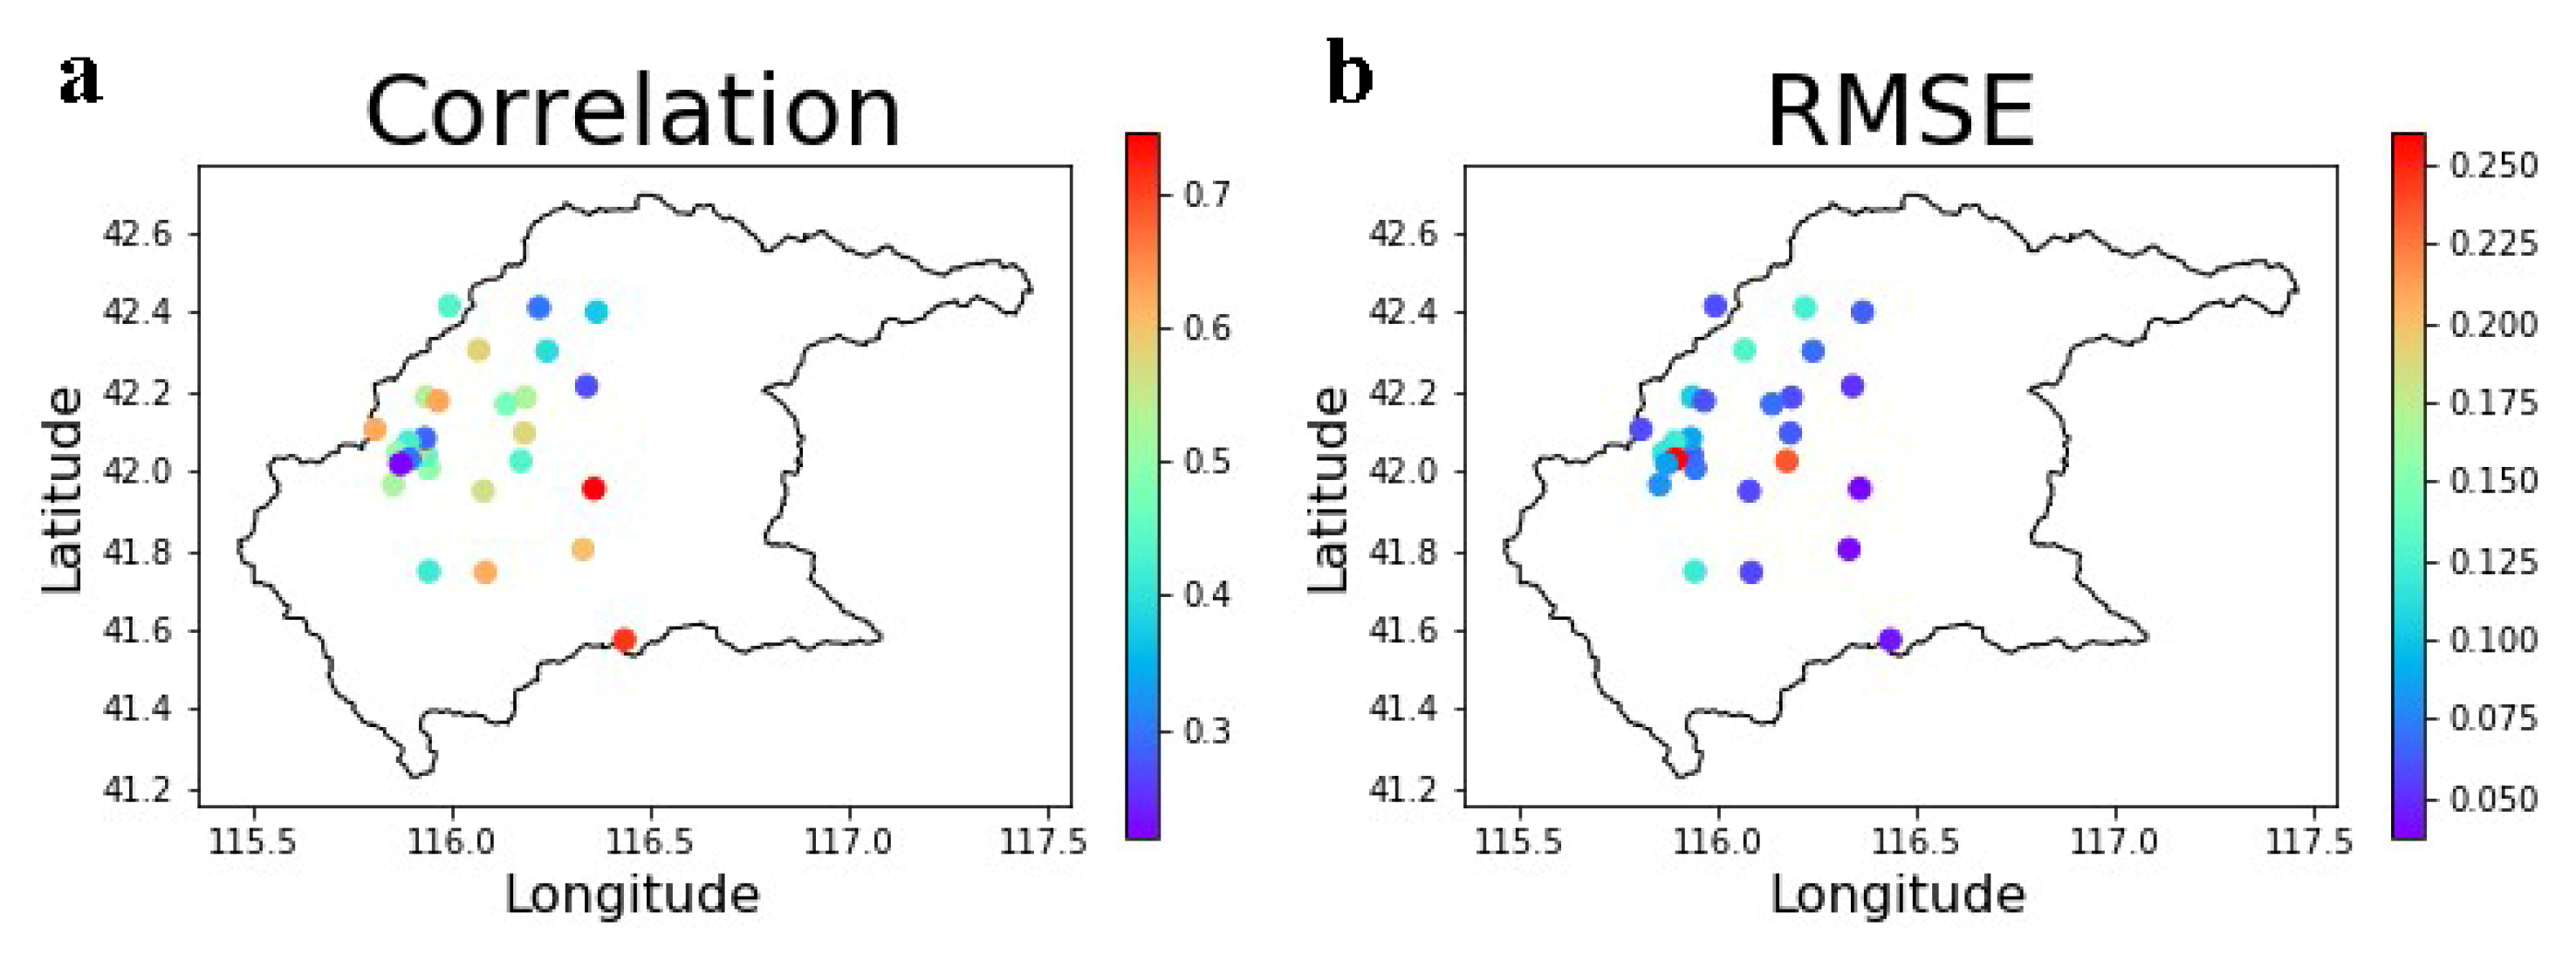
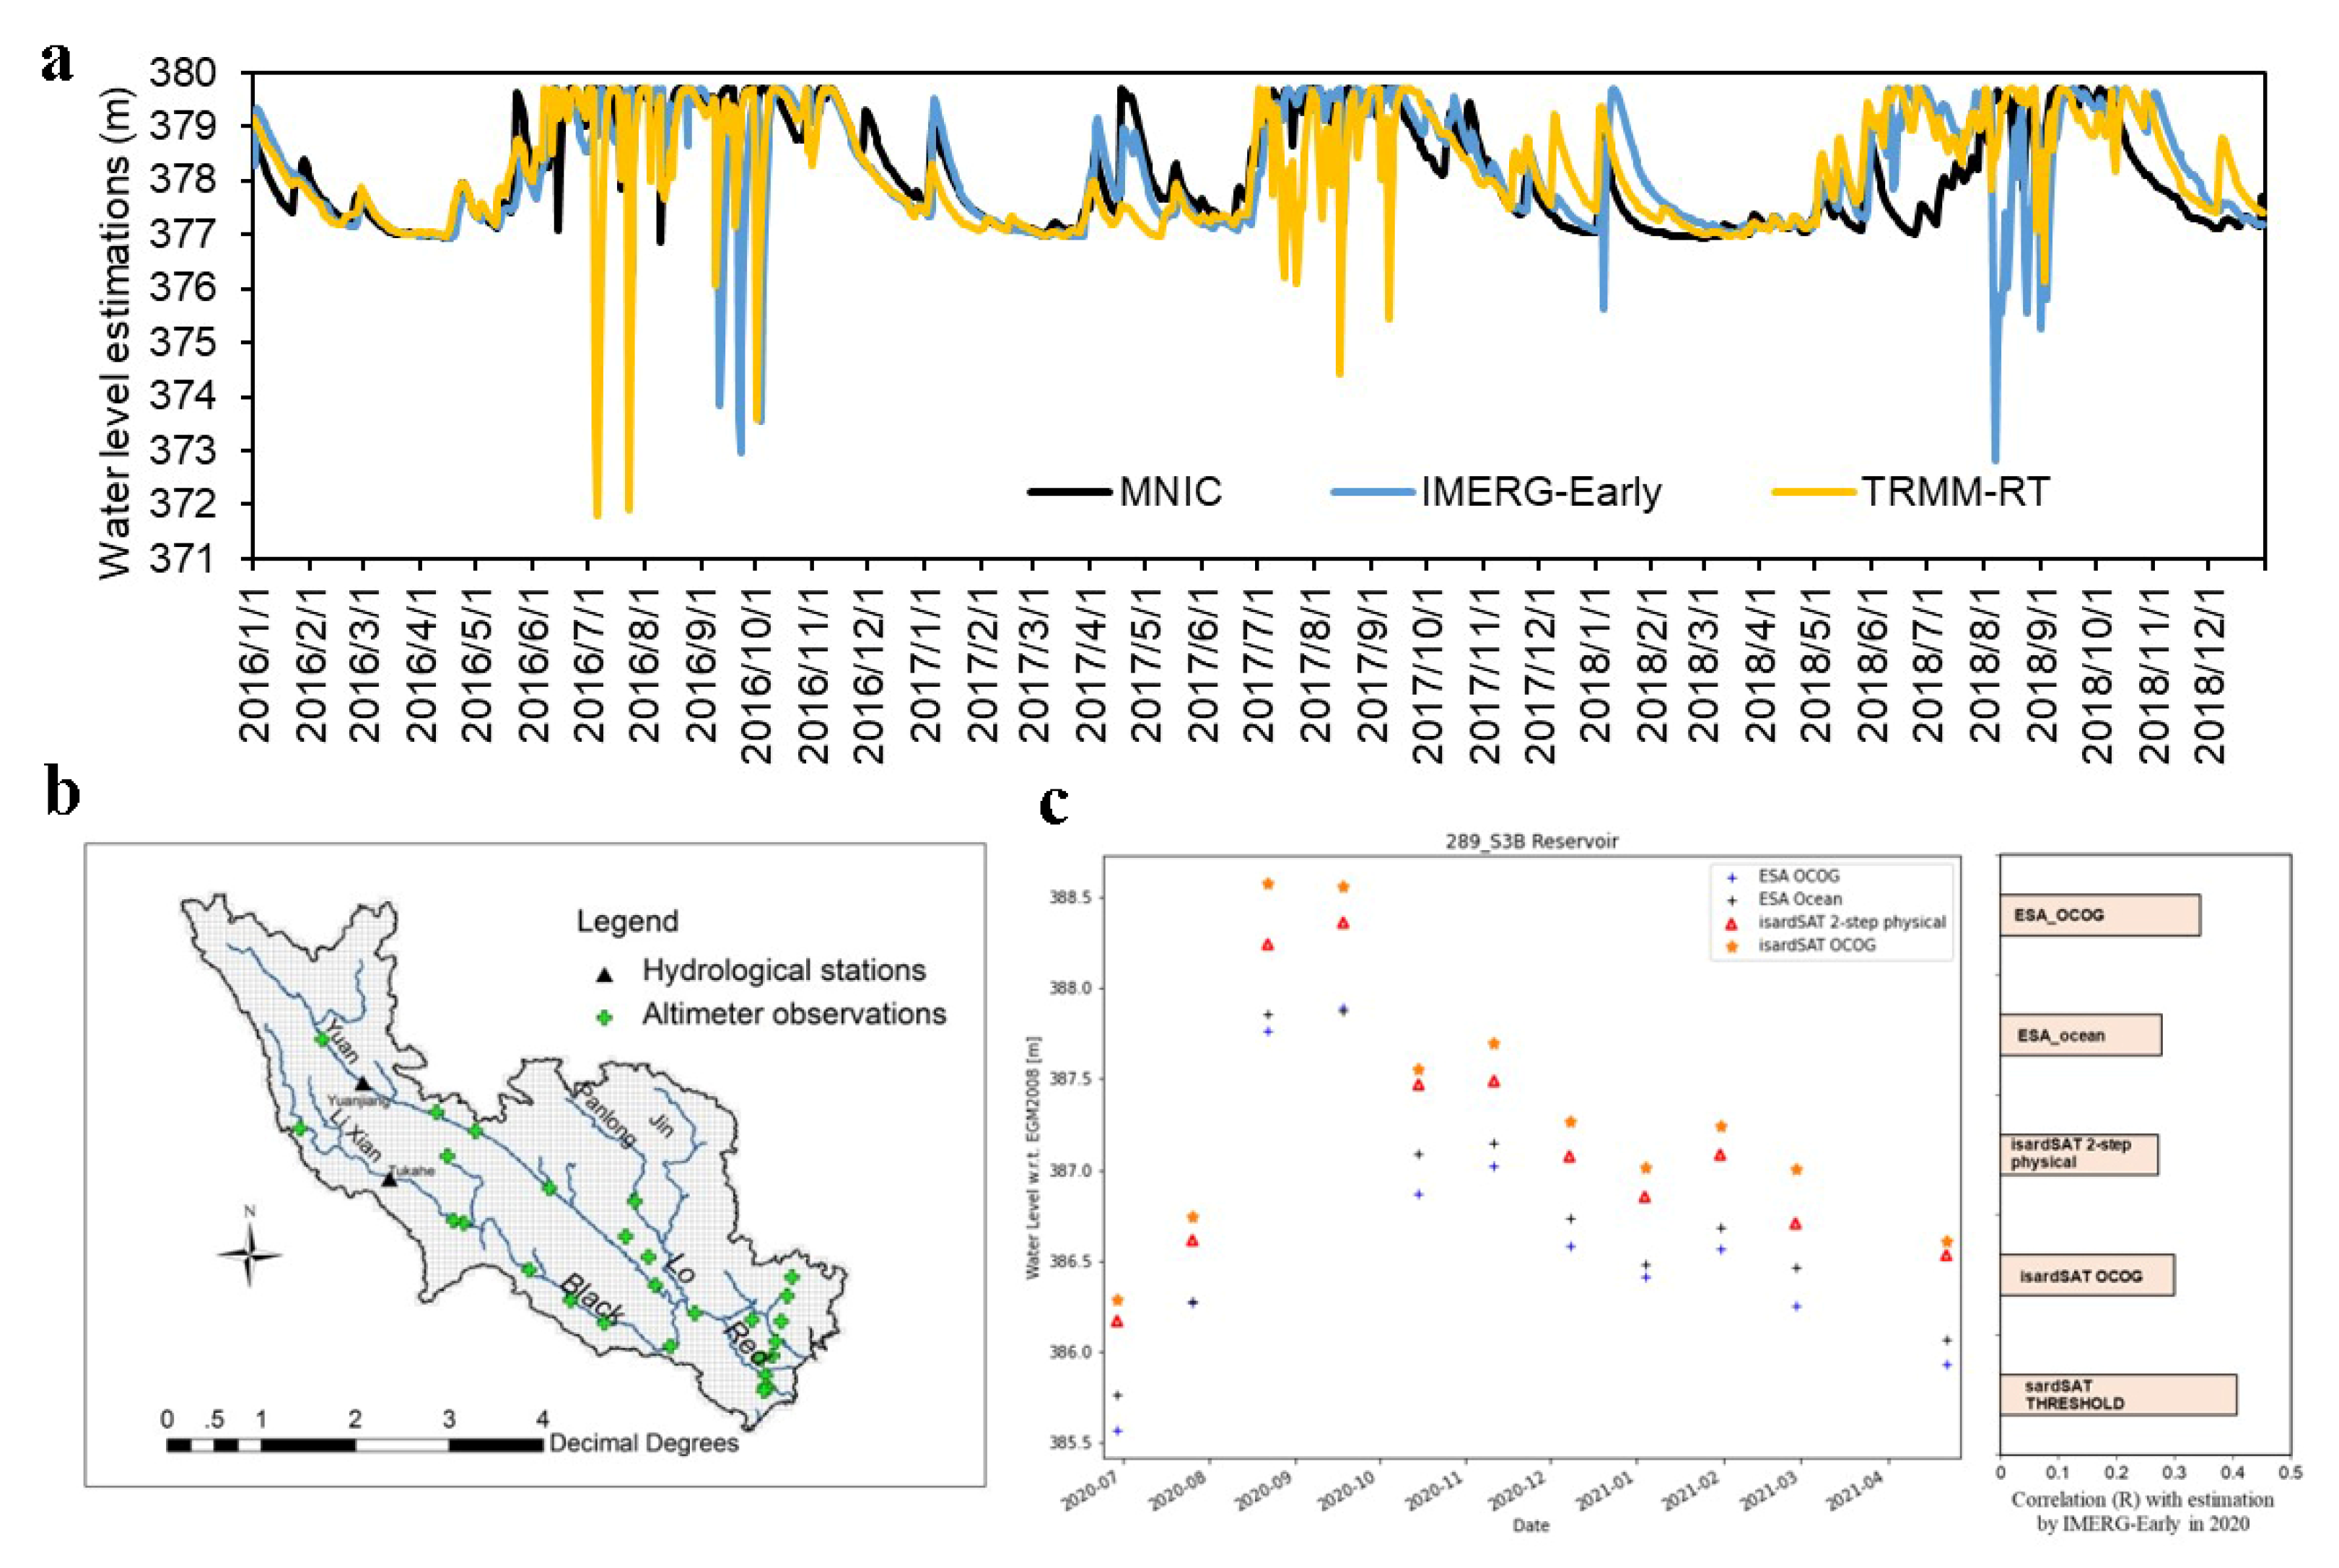
4.4.1. Results
4.4.2. Conclusions
- (a)
- A higher spatial resolution of data products on SSM is necessary for studies on specific river basins. Different solutions have been proposed in literature to downscale SSM data, including the one documented in this study;
- (b)
- The Red River case study has demonstrated that usable measurements of water level can be retrieved from the S3/RA data even from water targets smaller than the satellite footprint. This requires advanced data processing as described.
5. Main Conclusions
Author Contributions
Funding
Data Availability Statement
Conflicts of Interest
References
- Beniston, M.; Farinotti, D.; Stoffel, M.; Andreassen, L.M.; Coppola, E.; Eckert, N.; Fantini, A.; Giacona, F.; Hauck, C.; Huss, M.; et al. The European mountain cryosphere: A review of its current state, trends, and future challenges. Cryosphere 2018, 12, 759–794. [Google Scholar] [CrossRef] [Green Version]
- Menenti, M.; Su, B.; de Michele, C.; Jia, L.; Sobrino, J.; Ma, Y.; Yan, Y.; Li, X.; Ueno, K.; Bastiaansen, W.; et al. Coordinated Asia–European Long-Term Observing System of Qinghai—Tibet Plateau Hydro-Meteorological Processes and the Asian-Monsoon System with Ground Satellite Image Data and Numerical Simulations (CEOP-AEGIS). Final Report; University of Strasbourg: Strasbourg, France, 2014; ISSN 2118-7843. [Google Scholar]
- Barnett, T.P.; Dümenil, L.; Schlese, U.; Roeckner, E. The Effect of Eurasian Snow Cover on Global Climate. Science 1988, 239, 504–507. [Google Scholar] [CrossRef] [PubMed]
- Mastrotheodoros, T.; Pappas, C.; Molnar, P.; Burlando, P.; Manoli, G.; Parajka, J.; Rigon, R.; Szeles, B.; Bottazzi, M.; Hadjidoukas, P.; et al. More green and less blue water in the Alps during warmer summers. Nat. Clim. Chang. 2020, 10, 155–161. [Google Scholar] [CrossRef]
- Wood, E.F.; Roundy, J.K.; Troy, T.J.; van Beek, R.; Bierkens, M.; Blyth, E.; de Roo, A.; Döll, P.; Ek, M.; Famiglietti, J.; et al. Reply to comment by Keith, J. Beven and Hannah, L. Cloke on “hyperresolution global land surface modeling: Meeting a grand challenge for monitoring Earth’s terrestrial water”. Water Resour. Res. 2012, 48. [Google Scholar] [CrossRef] [Green Version]
- Zhong, B.; Yang, A.; Nie, A.; Yao, Y.; Zhang, H.; Wu, S.; Liu, Q. Finer Resolution Land-Cover Mapping Using Multiple Classifiers and Multisource Remotely Sensed Data in the Heihe River Basin. IEEE J. Sel. Top. Appl. Earth Obs. Remote. Sens. 2015, 8, 4973–4992. [Google Scholar] [CrossRef]
- Wang, T.; Zhang, G.; Li, D.; Tang, X.; Jiang, Y.-H.; Pan, H.-B.; Zhu, X.; Fang, C. Geometric Accuracy Validation for ZY-3 Satellite Imagery. IEEE Geosci. Remote. Sens. Lett. 2014, 11, 1168–1171. [Google Scholar] [CrossRef]
- Pan, X.; Tian, X.; Li, X.; Xie, Z.; Shao, A.; Lu, C. Assimilating Doppler radar radial velocity and reflectivity observations in the weather research and forecasting model by a proper orthogonal-decomposition-based ensemble, three-dimensional variational assimilation method. J. Geophys. Res. Space Phys. 2012, 117. [Google Scholar] [CrossRef] [Green Version]
- Corbari, C.; Ravazzani, G.; Mancini, M. A distributed thermodynamic model for energy and mass balance computation: FEST-EWB. Hydrol. Process. 2010, 25, 1443–1452. [Google Scholar] [CrossRef]
- Ravazzani, G.; Mancini, M.; Giudici, I.; Amadio, P. Effects of soil moisture parameterization on a real-time flood forecasting system based on rainfall thresholds. Proc. IAHS-AISH Publ. 2007, 313, 4017. [Google Scholar]
- Corbari, C.; Mancini, M. Calibration and Validation of a Distributed Energy–Water Balance Model Using Satellite Data of Land Surface Temperature and Ground Discharge Measurements. J. Hydrometeorol. 2014, 15, 376–392. [Google Scholar] [CrossRef]
- Corbari, C.; Ravazzani, G.; Martinelli, J.; Mancini, M. Elevation based correction of snow coverage retrieved from satellite images to improve model calibration. Hydrol. Earth Syst. Sci. 2009, 13, 639–649. [Google Scholar] [CrossRef] [Green Version]
- Chen, Q.; Jia, L.; Menenti, M.; Hutjes, R.; Hu, G.; Zheng, C.; Wang, K. A numerical analysis of aggregation error in evapotranspiration estimates due to heterogeneity of soil moisture and leaf area index. Agric. For. Meteorol. 2019, 269–270, 335–350. [Google Scholar] [CrossRef]
- Zheng, C.; Jia, L. Global canopy rainfall interception loss derived from satellite earth observations. Ecohydrology 2020, 13, e2186. [Google Scholar] [CrossRef] [Green Version]
- Wang, N.; Jia, L.; Zheng, C.; Menenti, M. Estimation of subpixel snow sublimation from multispectral satellite observations. J. Appl. Remote Sens. 2017, 11, 046017. [Google Scholar] [CrossRef]
- Liu, S.; Li, X.; Xu, Z.; Che, T.; Xiao, Q.; Ma, M.; Liu, Q.; Jin, R.; Guo, J.; Wang, L.; et al. The Heihe Integrated Observatory Network: A Basin-Scale Land Surface Processes Observatory in China. Vadose Zone J. 2018, 17, 1–21. [Google Scholar] [CrossRef]
- Ma, Y.; Hu, Z.; Xie, Z.; Ma, W.; Wang, B.; Chen, X.; Li, M.; Zhong, L.; Sun, F.; Gu, L.; et al. A long-term (2005–2016) dataset of hourly integrated land–atmosphere interaction observations on the Tibetan Plateau. Earth Syst. Sci. Data 2020, 12, 2937–2957. [Google Scholar] [CrossRef]
- Jia, L.; Zheng, C.; Hu, G.C.; Menenti, M. 4.03—Evapotranspiration. In Comprehensive Remote Sensing; Liang, S., Ed.; Elsevier: Oxford, UK, 2018; pp. 25–50. ISBN 9780128032213. [Google Scholar]
- Ren, S.; Menenti, M.; Jia, L.; Zhang, J.; Zhang, J.; Li, X. Glacier Mass Balance in the Nyainqentanglha Mountains between 2000 and 2017 Retrieved from ZiYuan-3 Stereo Images and the SRTM DEM. Remote Sens. 2020, 12, 864. [Google Scholar] [CrossRef] [Green Version]
- Zhang, J.; Jia, L.; Menenti, M.; Ren, S. Interannual and Seasonal Variability of Glacier Surface Velocity in the Parlung Zangbo Basin, Tibetan Plateau. Remote Sens. 2020, 13, 80. [Google Scholar] [CrossRef]
- Ren, S.; Miles, E.S.; Jia, L.; Menenti, M.; Kneib, M.; Buri, P.; McCarthy, M.J.; Shaw, T.E.; Yang, W.; Pellicciotti, F. Anisotropy parameterization development and evaluation for glacier surface albedo retrieval from satellite observations. Remote Sens. 2021, 13, 1714. [Google Scholar] [CrossRef]
- Ding, B.; Yang, K.; Yang, W.; He, X.; Chen, Y.; Lazhu; Guo, X.; Wang, L.; Wu, H.; Yao, T. Development of a Water and Enthalpy Budget-based Glacier mass balance Model (WEB-GM) and its preliminary validation. Water Resour. Res. 2017, 53, 3146–3178. [Google Scholar] [CrossRef]
- Shaw, T.E.; Yang, W.; Ayala, Á.; Bravo, C.; Zhao, C.; Pellicciotti, F. Distributed summer air temperatures across mountain glaciers in the south-east Tibetan Plateau: Temperature sensitivity and comparison with existing glacier datasets. Cryosphere 2021, 15, 595–614. [Google Scholar] [CrossRef]
- Girona-Mata, M.; Miles, E.S.; Ragettli, S.; Pellicciotti, F. High-Resolution Snowline Delineation From Landsat Imagery to Infer Snow Cover Controls in a Himalayan Catchment. Water Resour. Res. 2019, 55, 6754–6772. [Google Scholar] [CrossRef] [Green Version]
- Herreid, S.; Pellicciotti, F. The state of rock debris covering Earth’s glaciers. Nat. Geosci. 2020, 13, 621–627. [Google Scholar] [CrossRef]
- Kneib, M.; Miles, E.; Jola, S.; Buri, P.; Herreid, S.; Bhattacharya, A.; Watson, C.; Bolch, T.; Quincey, D.; Pellicciotti, F. Mapping ice cliffs on debris-covered glaciers using multispectral satellite images. Remote Sens. Environ. 2021, 253, 112201. [Google Scholar] [CrossRef]
- Miles, E.S.; Willis, I.C.; Arnold, N.S.; Steiner, J.; Pellicciotti, F. Spatial, seasonal and interannual variability of supraglacial ponds in the Langtang Valley of Nepal, 1999–2013. J. Glaciol. 2017, 63, 88–105. [Google Scholar] [CrossRef] [Green Version]
- Herreid, S.; Pellicciotti, F. Automated detection of ice cliffs within supraglacial debris cover. Cryosphere 2018, 12, 1811–1829. [Google Scholar] [CrossRef] [Green Version]
- Steiner, J.F.; Buri, P.; Miles, E.S.; Ragettli, S.; Pellicciotti, F. Supraglacial ice cliffs and ponds on debris-covered glaciers: Spatio-temporal distribution and characteristics. J. Glaciol. 2019, 65, 617–632. [Google Scholar] [CrossRef] [Green Version]
- Buri, P.; Pellicciotti, F. Aspect controls the survival of ice cliffs on debris-covered glaciers. Proc. Natl. Acad. Sci. USA 2018, 115, 4369–4374. [Google Scholar] [CrossRef] [PubMed] [Green Version]
- Buri, P.; Miles, E.S.; Steiner, J.F.; Ragettli, S.; Pellicciotti, F. Supraglacial Ice Cliffs Can Substantially Increase the Mass Loss of Debris-Covered Glaciers. Geophys. Res. Lett. 2021, 48, e2020GL092150. [Google Scholar] [CrossRef]
- Miles, E.S.; Willis, I.; Buri, P.; Steiner, J.F.; Arnold, N.S.; Pellicciotti, F. Surface Pond Energy Absorption Across Four Himalayan Glaciers Accounts for 1/8 of Total Catchment Ice Loss. Geophys. Res. Lett. 2018, 45, 10–464. [Google Scholar] [CrossRef] [PubMed] [Green Version]
- Stigter, E.E.; Steiner, J.F.; Koch, I.; Saloranta, T.M.; Kirkham, J.D.; Immerzeel, W.W. Energy and mass balance dynamics of the seasonal snowpack at two high-altitude sites in the Himalaya. Cold Reg. Sci. Technol. 2021, 183, 103233. [Google Scholar] [CrossRef]
- Ayala, A.; Pellicciotti, F.; MacDonell, S.; McPhee, J.; Burlando, P. Patterns of glacier ablation across North-Central Chile: Identifying the limits of empirical melt models under sublimation-favorable conditions. Water Resour. Res. 2017, 53, 5601–5625. [Google Scholar] [CrossRef] [Green Version]
- Li, X.; Cheng, G.; Lin, H.; Cai, X.; Fang, M.; Ge, Y.; Yingchun, G.; Chen, M.; Li, W. Watershed System Model: The Essentials to Model Complex Human-Nature System at the River Basin Scale. J. Geophys. Res. Atmos. 2018, 123, 3019–3034. [Google Scholar] [CrossRef]
- Li, X.; Cheng, G.; Liu, S.; Xiao, Q.; Ma, M.; Jin, R.; Che, T.; Liu, Q.; Wang, W.; Qi, Y.; et al. Heihe watershed allied telemetry experimental research (HiWater) scientific objectives and experimental design. Bull. Am. Meteorol. Soc. 2013, 94, 1145–1160. [Google Scholar] [CrossRef]
- Che, T.; Li, X.; Liu, S.; Li, H.; Xu, Z.; Tan, J.; Zhang, Y.; Ren, Z.; Xiao, L.; Deng, J.; et al. Integrated hydrometeorological, snow and frozen-ground observations in the alpine region of the Heihe River Basin, China. Earth Syst. Sci. Data 2019, 11, 1483–1499. [Google Scholar] [CrossRef] [Green Version]
- Li, X.; Liu, S.; Xiao, Q.; Ma, M.; Jin, R.; Che, T.; Wang, W.; Hu, X.; Xu, Z.; Wen, J.; et al. A multiscale dataset for understanding complex eco-hydrological processes in a heterogeneous oasis system. Sci. Data 2017, 4, 170083. [Google Scholar] [CrossRef] [Green Version]
- Li, X.; Zhang, L.; Zheng, Y.; Yang, D.; Wu, F.; Tian, Y.; Han, F.; Gao, B.; Li, H.; Zhang, Y.; et al. Novel hybrid coupling of ecohydrology and socioeconomy at river basin scale: A watershed system model for the Heihe River basin. Environ. Model. Softw. 2021, 141, 105058. [Google Scholar] [CrossRef]
- Tian, Y.; Zheng, Y.; Han, F.; Zheng, C.; Li, X. A comprehensive graphical modeling platform designed for integrated hydrological simulation. Environ. Model. Softw. 2018, 108, 154–173. [Google Scholar] [CrossRef]
- Han, F.; Zheng, Y.; Tian, Y.; Li, X.; Zheng, C. Accounting for field-scale heterogeneity in the ecohydrological modeling of large arid river basins: Strategies and relevance. J. Hydrol. 2021, 595, 126045. [Google Scholar] [CrossRef]
- Wu, F.; Bai, Y.; Zhang, Y.; Li, Z. Balancing water demand for the Heihe River Basin in Northwest China. Phys. Chem. Earth 2017, 101, 178–184. [Google Scholar] [CrossRef]
- Chen, W.; Shen, H.; Huang, C.; Li, X. Improving Soil Moisture Estimation with a Dual Ensemble Kalman Smoother by Jointly Assimilating AMSR-E Brightness Temperature and MODIS LST. Remote Sens. 2017, 9, 273. [Google Scholar] [CrossRef] [Green Version]
- Zhang, Y.; Cheng, G.; Li, X.; Jin, H.; Yang, D.; Flerchinger, G.N.; Chang, X.; Bense, V.F.; Han, X.; Liang, J. Influences of Frozen Ground and Climate Change on Hydrological Processes in an Alpine Watershed: A Case Study in the Upstream Area of the Hei’he River, Northwest China. Permafr. Periglac. Process. 2017, 28, 420–432. [Google Scholar] [CrossRef]
- Pan, X.; Li, X.; Cheng, G.; Hong, Y. Effects of 4D-Var Data Assimilation Using Remote Sensing Precipitation Products in a WRF Model over the Complex Terrain of an Arid Region River Basin. Remote Sens. 2017, 9, 963. [Google Scholar] [CrossRef] [Green Version]
- Liu, F.; Wang, L.; Li, X.; Huang, C. ComDA: A common software for nonlinear and Non-Gaussian Land Data Assimilation. Environ. Model. Softw. 2020, 127, 104638. [Google Scholar] [CrossRef]
- Paciolla, N.; Corbari, C.; Hu, G.; Zheng, C.; Menenti, M.; Jia, L.; Mancini, M. Evapotranspiration estimates from an energy-water-balance model calibrated on satellite land surface temperature over the Heihe basin. J. Arid. Environ. 2021, 188, 104466. [Google Scholar] [CrossRef]
- Dee, D.P.; Uppala, S.M.; Simmons, A.J.; Berrisford, P.; Poli, P.; Kobayashi, S.; Andrae, U.; Balmaseda, M.A.; Balsamo, G.; Bauer, P.; et al. The ERA-Interim reanalysis: Configuration and performance of the data assimilation system. Q. J. R. Meteorol. Soc. 2011, 137, 553–597. [Google Scholar] [CrossRef]
- Rodell, M.; Houser, P.; Jambor, U.; Gottschalck, J.; Mitchell, K.; Meng, C.-J.; Arsenault, K.; Cosgrove, B.; Radakovich, J.; Bosilovich, M.; et al. The Global Land Data Assimilation System. Bull. Am. Meteorol. Soc. 2004, 85, 381–394. [Google Scholar] [CrossRef] [Green Version]
- Miralles, D.G.; Holmes, T.R.H.; de Jeu, R.A.M.; Gash, J.H.; Meesters, A.G.C.A.; Dolman, A.J. Global land-surface evaporation estimated from satellite-based observations. Hydrol. Earth Syst. Sci. 2011, 15, 453–469. [Google Scholar] [CrossRef] [Green Version]
- Gelaro, R.; McCarty, W.; Suárez, M.J.; Todling, R.; Molod, A.; Takacs, L.; Randles, C.A.; Darmenov, A.; Bosilovich, M.G.; Reichle, R.; et al. The Modern-Era Retrospective Analysis for Research and Applications, Version 2 (MERRA-2). J. Clim. 2017, 30, 5419–5454. [Google Scholar] [CrossRef]
- Merlin, O.; Escorihuela, M.J.; Mayoral, M.A.; Hagolle, O.; Al Bitar, A.; Kerr, Y. Self-calibrated evaporation-based disaggregation of SMOS soil moisture: An evaluation study at 3 km and 100 m resolution in Catalunya, Spain. Remote Sens. Environ. 2013, 130, 25–38. [Google Scholar] [CrossRef] [Green Version]
- Merlin, O.; Rüdiger, C.; Al Bitar, A.; Richaume, P.; Walker, J.P.; Kerr, Y.H. Disaggregation of SMOS Soil Moisture in Southeastern Australia. IEEE Trans. Geosci. Remote Sens. 2012, 50, 1556–1571. [Google Scholar] [CrossRef] [Green Version]
- Zhao, T.; Shi, J.; Lv, L.; Xu, H.; Chen, D.; Cui, Q.; Jackson, T.J.; Yan, G.; Jia, L.; Chen, L.; et al. Soil moisture experiment in the Luan River supporting new satellite mission opportunities. Remote Sens. Environ. 2020, 240, 111680. [Google Scholar] [CrossRef]
- Gao, Q.; Makhoul, E.; Escorihuela, M.J.; Zribi, M.; Seguí, P.Q.; García, P.; Roca, M. Analysis of Retrackers’ Performances and Water Level Retrieval over the Ebro River Basin Using Sentinel-3. Remote Sens. 2019, 11, 718. [Google Scholar] [CrossRef] [Green Version]


| Multi-Source Hydrological Data Products to Monitor High Asian River Basins and Regional Water Security | ||||
|---|---|---|---|---|
| LI (China) | LI Xin | LI (ESA) | Massimo MENENTI | |
| Sub-Project | PI | Senior Scientists | Junior Scientists | PhD Students |
| Data products terrestrial water cycle | JIA Li Massimo MENENTI | LIU Qinhuo QIU Yubao | ZHENG Chaolei, CHEN Qiting, LU Jing, ZHOU Jie, HU Guangcheng, WU Yerong | ZHANG Jingxiao, REN Shaoting, XIE Qiuxia, WANG Ning, SUN Yibo, MO Xinyu, ZHANG Jing, JIA Junru |
| High elevation hydrological processes | YANG Kun Francesca PELLICCIOTTI | Baohong Ding, Wei Yang Pascal Buri, Mike McCarthy, Evan Miles, Thomas Shaw | Achille Pierre Jouberton, Marin Kneib, Stefan Fugger | |
| Basin scale hydrological models | LI Xin Marco MANCINI | HUANG Chunlin, ZHOU Ji, HAN Xujun, PAN Xiaoduo, LI Hongyi | MA Chunfeng, ZHOU Yanzhao Chiara Corbari | Nicola Paciolla |
| Water resources Red River Basin | SHI Jiancheng Maria José ESCORIHUELA | LI Rui, ZHAO Tianjie, Vivien Stefan, GAO Qi | Giovanni Paolini | |
| ESA Third Party Mission | Nr. of Scenes | ESA, Explorers and Sentinels Data | Nr. of Scenes | Chinese EO Data | Nr. of Scenes |
|---|---|---|---|---|---|
| ESA–CCI soil moisture products | 910 | Sentinel-1 | 120 | ZY-3 TLA stereo images | 14 |
| ESA–CCI land cover | 1 | Sentinel-2 | 233 | FY3-B/C SSM products | 1920 |
| L5/TM | 29 | Sentinel-3 | 200 | GF-1 | 60 |
| SMOS | 150 | GF-2 | 50 | ||
| ESA 1 km LAI products | 324 | GF-3 | 1 | ||
| GF-5 | 1 | ||||
| Total | 940 | 1027 |
| Heihe River Basin | Chiese River Basin | ||||||||
|---|---|---|---|---|---|---|---|---|---|
| Station | Evaluated Item | RMSE | m | R2 | Year | Evaluated Item | RMSE | m | R2 |
| Daman | LE | 47 | 0.44 | 0.63 | 2016 | SSM | 0.03 | 0.89 | 0.75 |
| H | 48 | 0.76 | 0.53 | LE | 25.7 | 0.94 | 0.8 | ||
| H | 38.3 | 0.99 | 0.79 | ||||||
| Yingke | LE | 44 | 0.5 | 0.66 | 2017 | SSM | 0.1 | 0.78 | 0.65 |
| H | 49 | 0.73 | 0.54 | LE | 49 | 0.93 | 0.7 | ||
| H | 78 | 1.1 | 0.8 | ||||||
| 2018 | SSM | 0.07 | 0.8 | 0.7 | |||||
| LE | 43 | 1.1 | 0.67 | ||||||
| H | 50 | 1.2 | 0.83 | ||||||
Publisher’s Note: MDPI stays neutral with regard to jurisdictional claims in published maps and institutional affiliations. |
© 2021 by the authors. Licensee MDPI, Basel, Switzerland. This article is an open access article distributed under the terms and conditions of the Creative Commons Attribution (CC BY) license (https://creativecommons.org/licenses/by/4.0/).
Share and Cite
Menenti, M.; Li, X.; Jia, L.; Yang, K.; Pellicciotti, F.; Mancini, M.; Shi, J.; Escorihuela, M.J.; Zheng, C.; Chen, Q.; et al. Multi-Source Hydrological Data Products to Monitor High Asian River Basins and Regional Water Security. Remote Sens. 2021, 13, 5122. https://doi.org/10.3390/rs13245122
Menenti M, Li X, Jia L, Yang K, Pellicciotti F, Mancini M, Shi J, Escorihuela MJ, Zheng C, Chen Q, et al. Multi-Source Hydrological Data Products to Monitor High Asian River Basins and Regional Water Security. Remote Sensing. 2021; 13(24):5122. https://doi.org/10.3390/rs13245122
Chicago/Turabian StyleMenenti, Massimo, Xin Li, Li Jia, Kun Yang, Francesca Pellicciotti, Marco Mancini, Jiancheng Shi, Maria José Escorihuela, Chaolei Zheng, Qiting Chen, and et al. 2021. "Multi-Source Hydrological Data Products to Monitor High Asian River Basins and Regional Water Security" Remote Sensing 13, no. 24: 5122. https://doi.org/10.3390/rs13245122
APA StyleMenenti, M., Li, X., Jia, L., Yang, K., Pellicciotti, F., Mancini, M., Shi, J., Escorihuela, M. J., Zheng, C., Chen, Q., Lu, J., Zhou, J., Hu, G., Ren, S., Zhang, J., Liu, Q., Qiu, Y., Huang, C., Zhou, J., ... Paolini, G. (2021). Multi-Source Hydrological Data Products to Monitor High Asian River Basins and Regional Water Security. Remote Sensing, 13(24), 5122. https://doi.org/10.3390/rs13245122