Technical Note

The Cross-Border Transport of PM2.5 from the Southeast Asian Biomass Burning Emissions and Its Impact on Air Pollution in Yunnan Plateau, Southwest China

1
Key Laboratory for Aerosol-Cloud-Precipitation of China Meteorological Administration, Nanjing University of Information Science and Technology, Nanjing 210044, China
2
China Institute for Radiation Protection, Taiyuan 030006, China
3
Department of Physics, Koneru Lakshmaiah Education Foundation (KLEF), Vaddeswaram, Guntur 522 502, Andhra Pradesh, India
4
School of Environment and Energy, South China University of Technology, Guangzhou 510006, China
5
State Key Laboratory of Pollution Control and Resource Reuse and School of the Environment, Nanjing University, 163 Xianlin Rd., Nanjing 210023, China
6
Fujian Academy of Environmental Sciences, Fuzhou 350011, China
*
Author to whom correspondence should be addressed.
Remote Sens. 2022, 14(8), 1886; https://doi.org/10.3390/rs14081886
Submission received: 10 March 2022 / Revised: 11 April 2022 / Accepted: 11 April 2022 / Published: 14 April 2022
(This article belongs to the Special Issue Air Quality Research Using Remote Sensing)

Abstract

:
Southeast Asia is one of the largest biomass burning (BB) regions in the world, and the air pollutants generated by this BB have an important impact on air pollution in southern China. However, the mechanism of the cross-border transport of BB pollutants to neighboring regions is yet to be understood. Based on the MODIS remote sensing products and conventional observation data of meteorology and the environment, the WRF-Chem and FLEXPART-WRF models were used to simulate a typical PM2.5 pollution episode that occurred during 24–26 March 2017 to analyze the mechanism of cross-border transport of BB pollutants over Yunnan Plateau (YP) in southwest China. During this air pollution episode, in conjunction with the flourishing BB activities over the neighboring Indo-China Peninsula (ICP) regions in Southeast Asia, and driven by the southwesterly winds prevailing from the ICP to YP, the cross-border transport of pollutants was observed along the transport pathway with the lifting plateau topography in YP. Based on the proximity to the BB sources in ICP, YP was divided into a source region (SR) and a receptor region (RR) for the cross-border transport, and the negative and positive correlation coefficients (R) between PM2.5 concentrations and wind speeds, respectively, were presented, indicating the different impacts of BB emissions on the two regions. XSBN and Kunming, the representative SR and RR sites in the border and hinterland of YP, respectively, have distinct mechanisms that enhance PM2.5 concentrations of air pollution. The SR site is mainly affected by the ICP BB emissions with local accumulation in the stagnant meteorological conditions, whereas the RR site is dominated by the regional transport of PM2.5 with strong winds and vertical mixing. It was revealed that the large PM2.5 contributions of ICP BB emissions lift from the lower altitudes in SR to the higher altitudes in RR for the regional transport of PM2.5. Moreover, the contributions of regional transport of PM2.5 decrease with the increase in transport distance, reflecting an important role of transport distance between the source–receptor areas in air pollution change.

1. Introduction

Haze pollution caused by aerosol especially PM2.5 has significant adverse effects on environmental change and human health [1,2]. In this regard, research has paid a large amount of attention to the air pollution in emission source areas such as the Yangtze River Delta, the Sichuan Basin, and the North China plain [3,4,5]. However, the Yunnan Plateau (YP), which is a relatively clean region in Southwest China having an aerosol optical depth (AOD) of ~0.1–0.2 [6,7], has lacked attention and studies on the mechanisms responsible for air pollution change.
The regional transport of atmospheric pollutants is one of the major elements affecting the air quality in China [8,9], and has become a critical part of the field of the atmospheric environment [10,11,12]. Long-range transport, including cross-border transport of atmospheric pollutants, can influence air quality in a large region [13,14,15]. As a result, strong winds can easily transport PM2.5 from upstream source regions to downwind areas, resulting in a rise in PM2.5 concentrations [16,17]. Meanwhile, strong winds can also play a role in sweeping local pollutants [18,19]. When the wind speed at source regions increases, air pollutants can be carried to the downstream regions, thus causing a reduction in pollutants in source regions. Therefore, it is an interesting topic of study to understand the role played by winds in the regional atmospheric environment.
Southeast Asia is one of the largest biomass burning (BB) regions in the world, with active fire activities in the spring [20]. As one of the major sources of PM2.5 emissions [21], BB emissions can contribute 70–80% to the total PM2.5 in source regions [22,23]. Meanwhile, PM2.5 generated by a large amount of BB emissions also has an impact on the downwind regions, due to the regional transport driven by atmospheric circulation [24]. Air pollutants produced from Southeast Asian BB emissions can be transported to Southwest China and the Yangtze River Delta over long distances, and even to Taiwan Province, Japan, and the entire East Asia. Although some studies found that air pollutants from BB in Southeast Asia have a significant impact on the atmospheric environment of Southeast China and the northwestern Pacific, few studies have investigated the influence of Southeast Asian BB on air quality in southwest China, and especially the YP region [25,26,27,28].
The YP region is located on the southwest border of China, and has a complex topography that gradually decreases from north to south, and southwesterly winds prevail in the YP region throughout the year [29]. The Indo-China Peninsula (ICP) in Southeast Asia, which adjoins the YP region, has shown high AOD values in the spring due to BB emissions [30]. Therefore, the YP region is inevitably influenced by the regional transport of air pollutants from Southeast Asia, especially ICP governed by southwesterly winds. However, the current studies on BB in Southeast Asia have mainly focused on the long-range transport of air pollutants with the effect on atmospheric chemical compositions [31,32], aerosols radiation [33,34,35], and climatic forcing [36,37]. Due to the lack of studies and analyses on the mechanism of cross-border transport of BB emissions from ICP to the bordering YP, the extent of the influence of BB on air quality in Southwest China is still not well understood. Therefore, in a region such as that of YP, which has the complex terrain of a plateau in a relatively clean environment, the underlying mechanism of air pollution is worthy of in-depth investigation associated with the cross-border or transboundary transport of PM2.5 from the Southeast Asian BB emissions.
In this study, we utilized the satellite-based MODIS remote sensing products and the observational data of meteorology and air pollutants to investigate an air pollution event that occurred during 24–26 March 2017 in the YP region associated with the cross-border transport of PM2.5 from the BB emission sources in ICP. By utilizing the Weather Research and Forecasting model coupled with Chemistry (WRF-Chem) and the Flexible Particle dispersion model (FLEXPART) driven by WRF (FLEXPART-WRF), we simulated the spatial–temporal variations in PM2.5 over Southwest China and Southeast Asia. The present study explored how the regional PM2.5 transported from BB emission sources in ICP affects the air quality in the downwind YP region, and the extent to which the regional transport of PM2.5 from BB emissions affected PM2.5 concentrations in the air pollution episode in YP.

2. Materials and Methods

2.1. Ground-Based Observation Data

To investigate the distribution of meteorological factors and PM2.5, and to validate the performance of the WRF-Chem simulation, hourly data of surface PM2.5 concentrations were obtained from the China National Environmental Monitoring Centre (CNEMC). Hourly near-surface wind speed, relative humidity, and air temperature data were derived from the China Meteorological Administration (CMA). The time we mention henceforth is YP’s local time (UTC + 08:00 h).

2.2. MODIS Remote Sensing Products

The MODIS instrument is a multispectral sensor aboard the Aqua and TERRA satellites. It contains 36 wavelength bands from 400 to 1440 nm and allows for the retrieval of aerosol items to cover the entire globe in 1–2 days. The AOD products derived from MODIS have been widely used at global or regional scales [38,39]. In this study, the MODIS Dark-Target/Deep-Blue combined data of Collection 6.1 averaged from Terra and Aqua were utilized to identify AOD’s geographic distribution and to validate the performance of the WRF-Chem Model.

2.3. Model Configuration

2.3.1. WRF-Chem Model

Here, the WRF-Chem online coupling model version 3.9.1 [40] was utilized to simulate an air pollution event that occurred over the YP. Two nested domains were used in the configuration. The coarse domain with a horizontal resolution of 27 × 27 km covered Southwest China and Southeast Asia, wherein the nested fine domain with a 9 × 9 km horizontal resolution included most of the YP and its surrounding ICP regions (Figure 1a). Thirty-two vertical hybrid layers were set from the surface to 50 hPa. The initial and boundary conditions of the WRF-Chem simulation were obtained from the ERA-Interim with a horizontal resolution of 0.75° × 0.75°.
Multiple physical schemes are utilized in the WRF-Chem simulation, such as the YSU boundary layer scheme [41], the Morrison 2 microphysics [42], the RRTMG radiation scheme [43], and the unified Noah land surface model [44]. The RADM2 chemical scheme [45] was selected for the atmospheric gas-phase chemistry mechanism. Table 1 lists the primary parameterization schemes utilized in the modeling configuration.
Figure 1. (a) Two nesting domains of WRF-Chem modeling with the terrain heights (m in a.s.l.) over the YP (outlined with dash red line) and surrounding regions in southwest China and Southeast Asia. (b) Spatial distribution of averaged surface PM2.5 concentrations (color shaded circles with black edges, µg m−3 in the upper color bar) observed at 16 urban sites (Table 2) from 24 to 26 March 2017 over YP, and spatial distribution of topographic height over YP and surrounding areas (color contours, m in a.s.l. in the lower color bar).
Remotesensing 14 01886 g001
Table 1. Parameterization schemes for the WRF-Chem simulation.
OptionsSchemes
MicrophysicsMorrison 2-moment scheme (Morrison)
Longwave radiationRapid Radiative Transfer Model for GCMs (RRTMG)
Shortwave radiationRapid Radiative Transfer Model for GCMs (RRTMG)
Land-surfaceNoah Land Surface Model (Noah)
Boundary layerYonsei University scheme (YSU)
CumulusImproved version of the Grell–Devenyi ensemble scheme (Grell 3-D)
PhotolysisMadronich photolysis scheme (Madronich)
ChemistryThe regional acid deposition model, version 2 (RADM2)
Aerosol particlesThe Modal Aerosol Dynamics Model for Europe (MADE/SORGAM)
Table 2. Names of all sites in YP and their corresponding site numbers.
Number123456
NameXishuangbannaPuerLincangYuxiHongheWenshan
Number789101112
NameDehongBaoshanDaliChuxiongKunmingQujing
Name13141516
NumberNujiangDiqingLijiangZhaotong

2.3.2. Air Pollutant Emission Inventories

Three emissions were used to drive the WRF-Chem modeling. The anthropogenic emission data were taken from MIX [46], which covers more than 30 different countries and regions in Asia, based on a multi-scale data coupling method to include local source inventories, such as ANL-India (India), CAPSS (Korea), REAS2 (Japan, Taiwan, China), MEIC (anthropogenic sources in mainland China), and PKU-NH3 (ammonia emission inventory in China). MIX consists of emissions from on-road mobile sources, agricultural activities, power plants, industrial processes, and residential combustion.
Using the Model of Emissions of Gases and Aerosols from Nature (MEGAN), which includes more than 20 biogenic species [47], the online biogenic emissions were calculated. The hourly BB emissions were obtained from the Fire Inventory from NCAR (FINN) [48]. The FINN was produced using land cover types and fire point emissions monitored by the MODIS satellites (Terra and Aqua), combined with emission factors and combustible loads, and includes particulate matter and gas emissions from biomass burning in agriculture, forests, etc. The horizontal resolution of FINN is 1 km, and the vertical distribution of the fire emission pollutants is calculated by the online plume-rise parameterization [49,50].

2.3.3. Numerical Experiments

Based on the modeling configurations, two numerical experiments were conducted during 21–27 March 2017, of which the first two days were used as the spin-up time of modeling a PM2.5 pollution episode. The experiments were: (1) a control experiment (CE), with the MIX anthropogenic emission inventory, the MEGAN biogenic emission inventory, and the FINN BB emission inventory in the modeling configuration; (2) a sensitivity experiment (SE), which was the same as CE but with the BB emissions turned off over two domains.
Through the comparison of the PM2.5 concentrations between CE and SE, the contribution rates of BB emissions to PM2.5 concentrations for the air pollution episode were evaluated by Equation (1):
Contribution   rates = PM 2.5 _ CE PM 2.5 _ SE PM 2.5 _ CE × 100 %
where PM2.5_CE and PM2.5_SE represent the results from CE and SE, respectively.

2.3.4. FLEXPART-WRF Models

The Flexible Particle dispersion model (FLEXPART) [51,52] is a Lagrangian particle diffusion model considering the processes of wet and dry depositions, turbulent diffusion, and tracer transport [53]. FLEXPART driven by WRF (FLEXPART-WRF) has been widely utilized to examine the potential sources and the long-distance transport of air pollutants [54,55,56]. Based on this backward trajectory model, we followed the method proposed by Chen et al. [57] and Yu et al. [55] to identify the upstream emission sources of air pollution in the YP region.

2.4. WRF-Chem Modeling Validation

A credible simulation of meteorology is essential for the simulation of air pollutants with WRF-Chem [58]. Therefore, the meteorological simulation in typical sites (sites 1–11 in Figure 1b and Table 2 with average surface PM2.5 concentrations over 35 µg m−3 during the pollution episode) was validated by comparing the modeling results with meteorological observations of 10 m wind speed (WS10), 2 m relative humidity (RH2), and 2 m air temperature (T2). Table 3 and Figure 2a–c list the statistical measures used to compare the observed and simulated meteorological variables. R, RMSE, MB, and ME denote the correlation coefficient, the root mean square, the mean bias, and the mean error, respectively. The CE results of surface PM2.5 concentrations were validated with the observational data in typical sites, and the statistical verification is shown in Table 4 and Figure 2d with the R, RMSE, mean fractional bias (MFB), and mean fractional error (MFE).
Due to the different physical properties of AOD and PM2.5, there is no good linear relationship between them [59]. Consequently, the vertically integrated concentrations of PM2.5 above 700 hPa averaged from 24 to 26 March 2017 were compared with the MODIS AOD shown in Figure 3b,c. The WRF-Chem simulation was evaluated to reasonably capture the spatial distribution of AOD. Both AOD and PM2.5 concentrations increase gradually from northern to southern YP, reaching maximum values in Laos and Vietnam near the southeastern border of YP, and relatively large values in Beibu Gulf and Guangxi province.
On the whole, the validation indicates that the meteorological variations and development of PM2.5 concentrations were reasonably reproduced by the simulation results of WRF-Chem during the air pollution episode, satisfying Boylan’s recommendation for good modeling performance [60]. Thus, the WRF-Chem results could be utilized in the investigation of the cross-border transport of PM2.5 from BB sources in Southeast Asia and the influence on air pollution in YP, a clean region in Southwest China.

3. Results and Discussion

3.1. A Springtime Air Pollution Event Observed in YP

As shown in Figure 3a, in 2017, the AOD values were high in central-east China compared to the low AOD values in YP and Southeast Asia. Previous studies on the distributions of PM2.5 concentrations and AOD over China showed that the YP, which has low PM2.5 pollution and low AOD, presents a clean atmospheric environment compared to other regions of China [61,62].
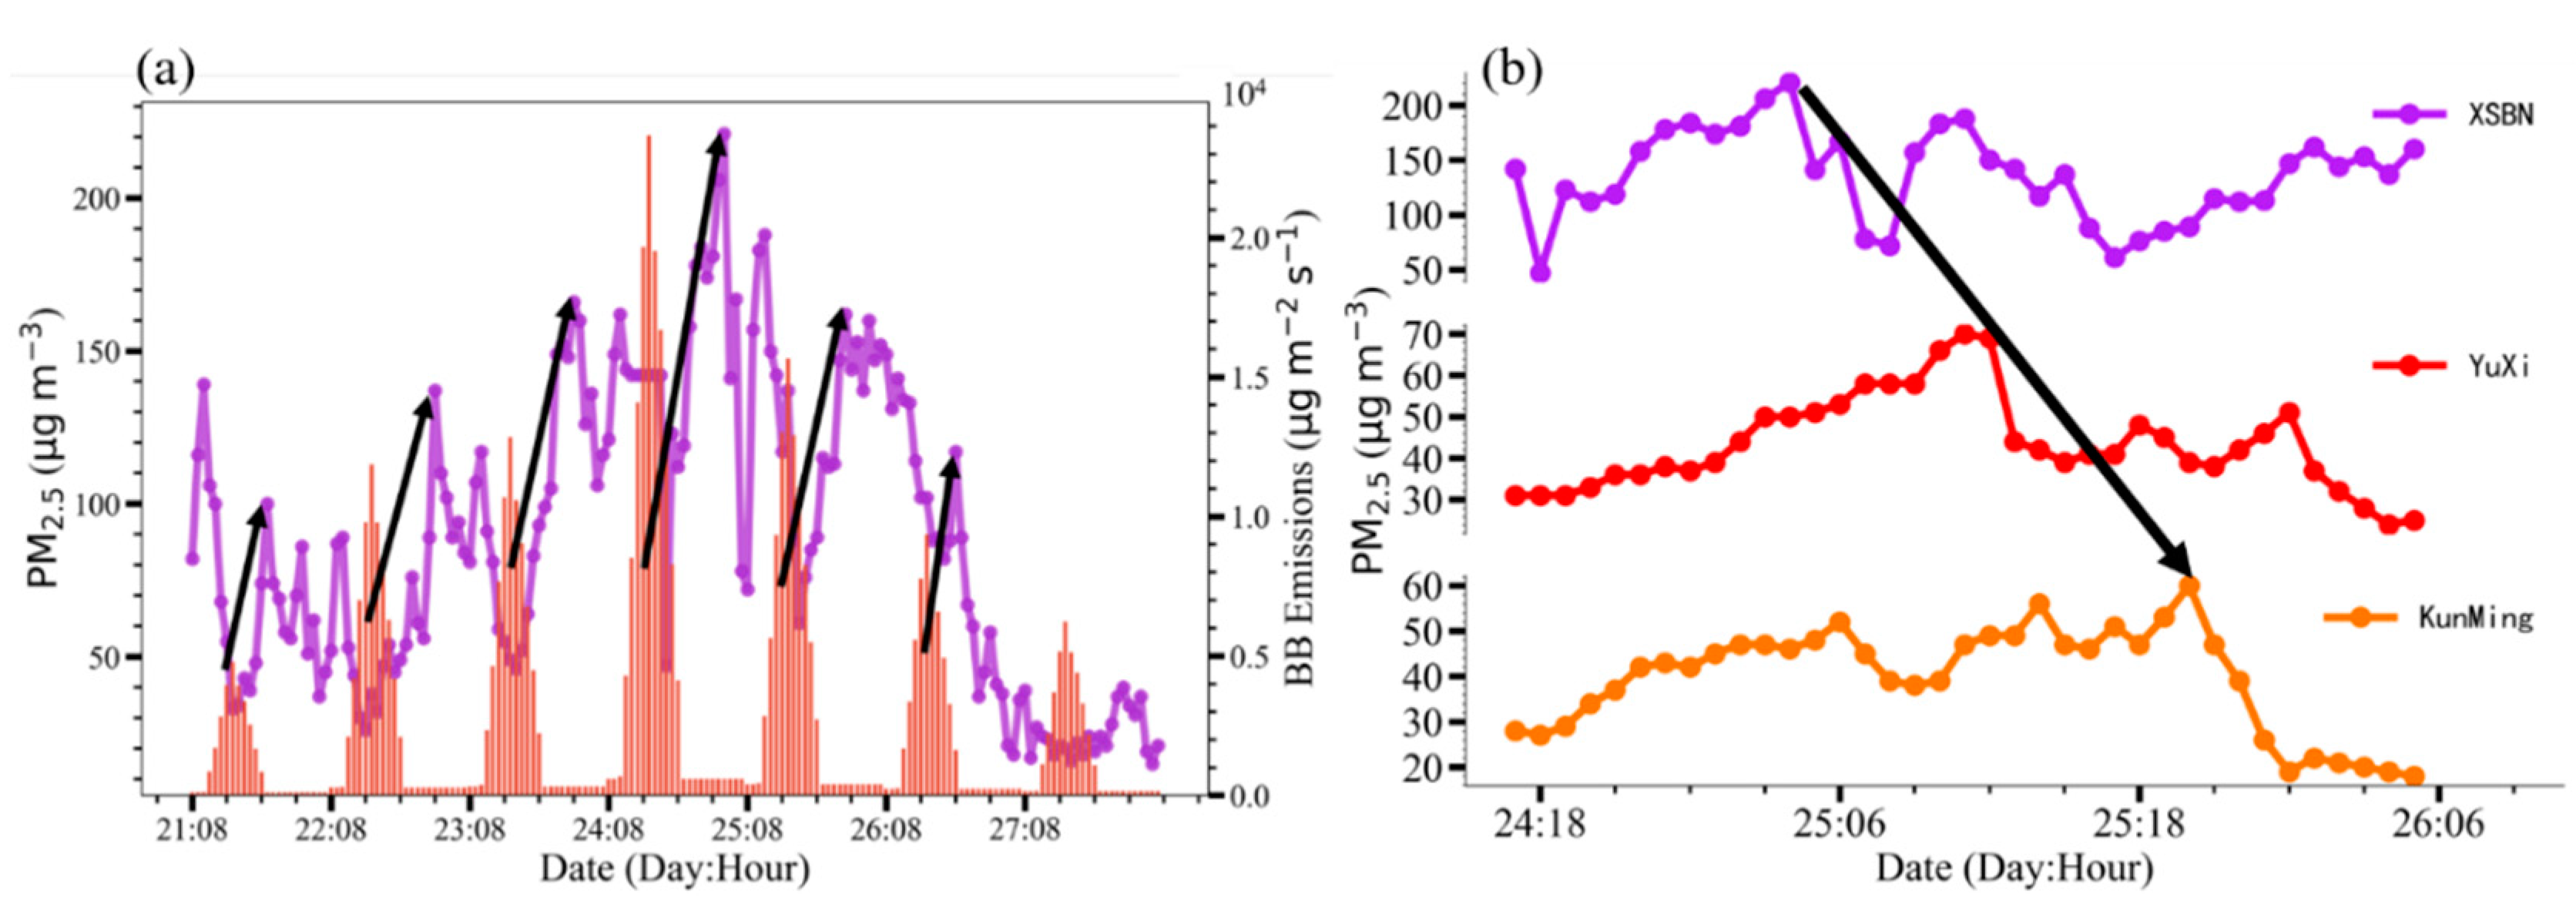
However, against the background of such a clean atmospheric environment, an air pollution event occurred over YP during 24–26 March 2017. Based on the observation data obtained from CNEMC (Figure 1b) and MODIS (Figure 3b), the distribution of daily average PM2.5 concentrations and AOD during the pollution period over YP showed decreasing values with increasing distances to the Southeast Asian BB sources and the uplifting topographic heights from the southern to northern YP. The red dots in Figure 3b show the spatial distribution of average BB PM2.5 emissions obtained from FINN during the pollution period. There are few BB emissions in YP, whereas the three major emission-intensive areas are in the neighboring ICP regions, which are in northern Myanmar, eastern Myanmar, and northern Laos. We further summed the intensity of BB emissions in Domain 2 (Figure 1a) to obtain the hourly variation curve of BB emissions (Figure 4a). From 21 to 27 March 2017, the BB emission intensity and the PM2.5 concentrations in Xishuangbanna (XSBN, site 1) showed consistent daily variations. The PM2.5 concentrations in XSBN increased with increasing BB emission intensity (black arrows in Figure 4a). When the intensity of BB emissions decreased and remained at a low level, the PM2.5 concentrations also decreased rapidly. Moreover, the daily maximum PM2.5 concentrations and daily maximum BB emission intensity also had a good one-to-one correspondence. The pollution episode that occurred during 24–26 March over YP is in good agreement with the most active BB activities compared to other days. The lagged correlation between BB emission intensity and PM2.5 concentrations was further calculated with a lag time of 10 h. The changes in the two values were estimated to have a good positive correlation (R = 0.45), passing the significant level of 0.01, indicating the mechanism behind this pollution event in YP has a strong link to BB emissions over ICP.
It is noteworthy that the AOD reached its maximum in northern Laos and northwestern Vietnam near the southeastern border of YP (Figure 3b), which is attributed to the convergence of the southeastern and southwestern winds (Figure 5c) and the obstruction effect of the large topographic height in both northern and eastern parts of this area (Figure 1b). The dual effect of these two factors led to the accumulation of pollutants because southwesterly winds prevailed in ICP and YP from the low to high altitude, and the high mountains largely blocked the further transport of pollutants from this area to the YP region. The present work mainly focuses on the effect of BB emissions on the air quality of YP under the prevailing southwesterly winds. The pollution mechanism of this high AOD area under the influence of BB emissions could be the material or objective for further study.
To further understand the influence of prevailing southwesterly winds on the pollution event on YP, we explored the hourly variations in PM2.5 concentrations from 18:00 h local time on 24 March to 06:00 h on 26 March at three observational sites, XSBN, Yuxi, and Kunming, which are in the major pollutants’ transport pathway (sites 1,4,11 in Figure 1b). Driven by southwesterly winds, the surface PM2.5 peaks advanced northwards at 02:00 h on 25 March, from XSBN, at 10:00 on 25 March to Yuxi, and at 20:00 on 25 March to Kunming, with a quasi-9 h time lag (Figure 4b). At 02:00 on 25 March (Figure 5a), the PM2.5 concentrations reached more than 150 µg m−3 in many areas of ICP, and the PM2.5 in XSBN, the southernmost border city in YP, peaked first. At this time, Yuxi and Kunming were relatively clean, and the southwesterly winds prevailing in ICP and YP were conducive to the cross-border transport of pollutants from the upward ICP to the downwind YP region. About 8 h later, the pollutants were transported to Yuxi at 10:00 h on 25 March (Figure 5b). With the strengthening of southwesterly winds, the pollutants were finally transported to Kunming at 20:00 h on 25 March (Figure 5c), and the PM2.5 concentrations in most cities of the central and southern YP reported an increase in PM2.5. This phenomenon reflects an obvious characteristic of transport-type pollution events, and previous studies on transport-type pollution events showed that pollutant concentrations have a good correlation with wind speed [17,55]. This provided a motivation to further understand the relationship between PM2.5 concentrations and wind speed during the pollution event that occurred over YP, which is explained in the next sections.

3.2. Correlation between Wind Speeds and PM2.5 Concentrations

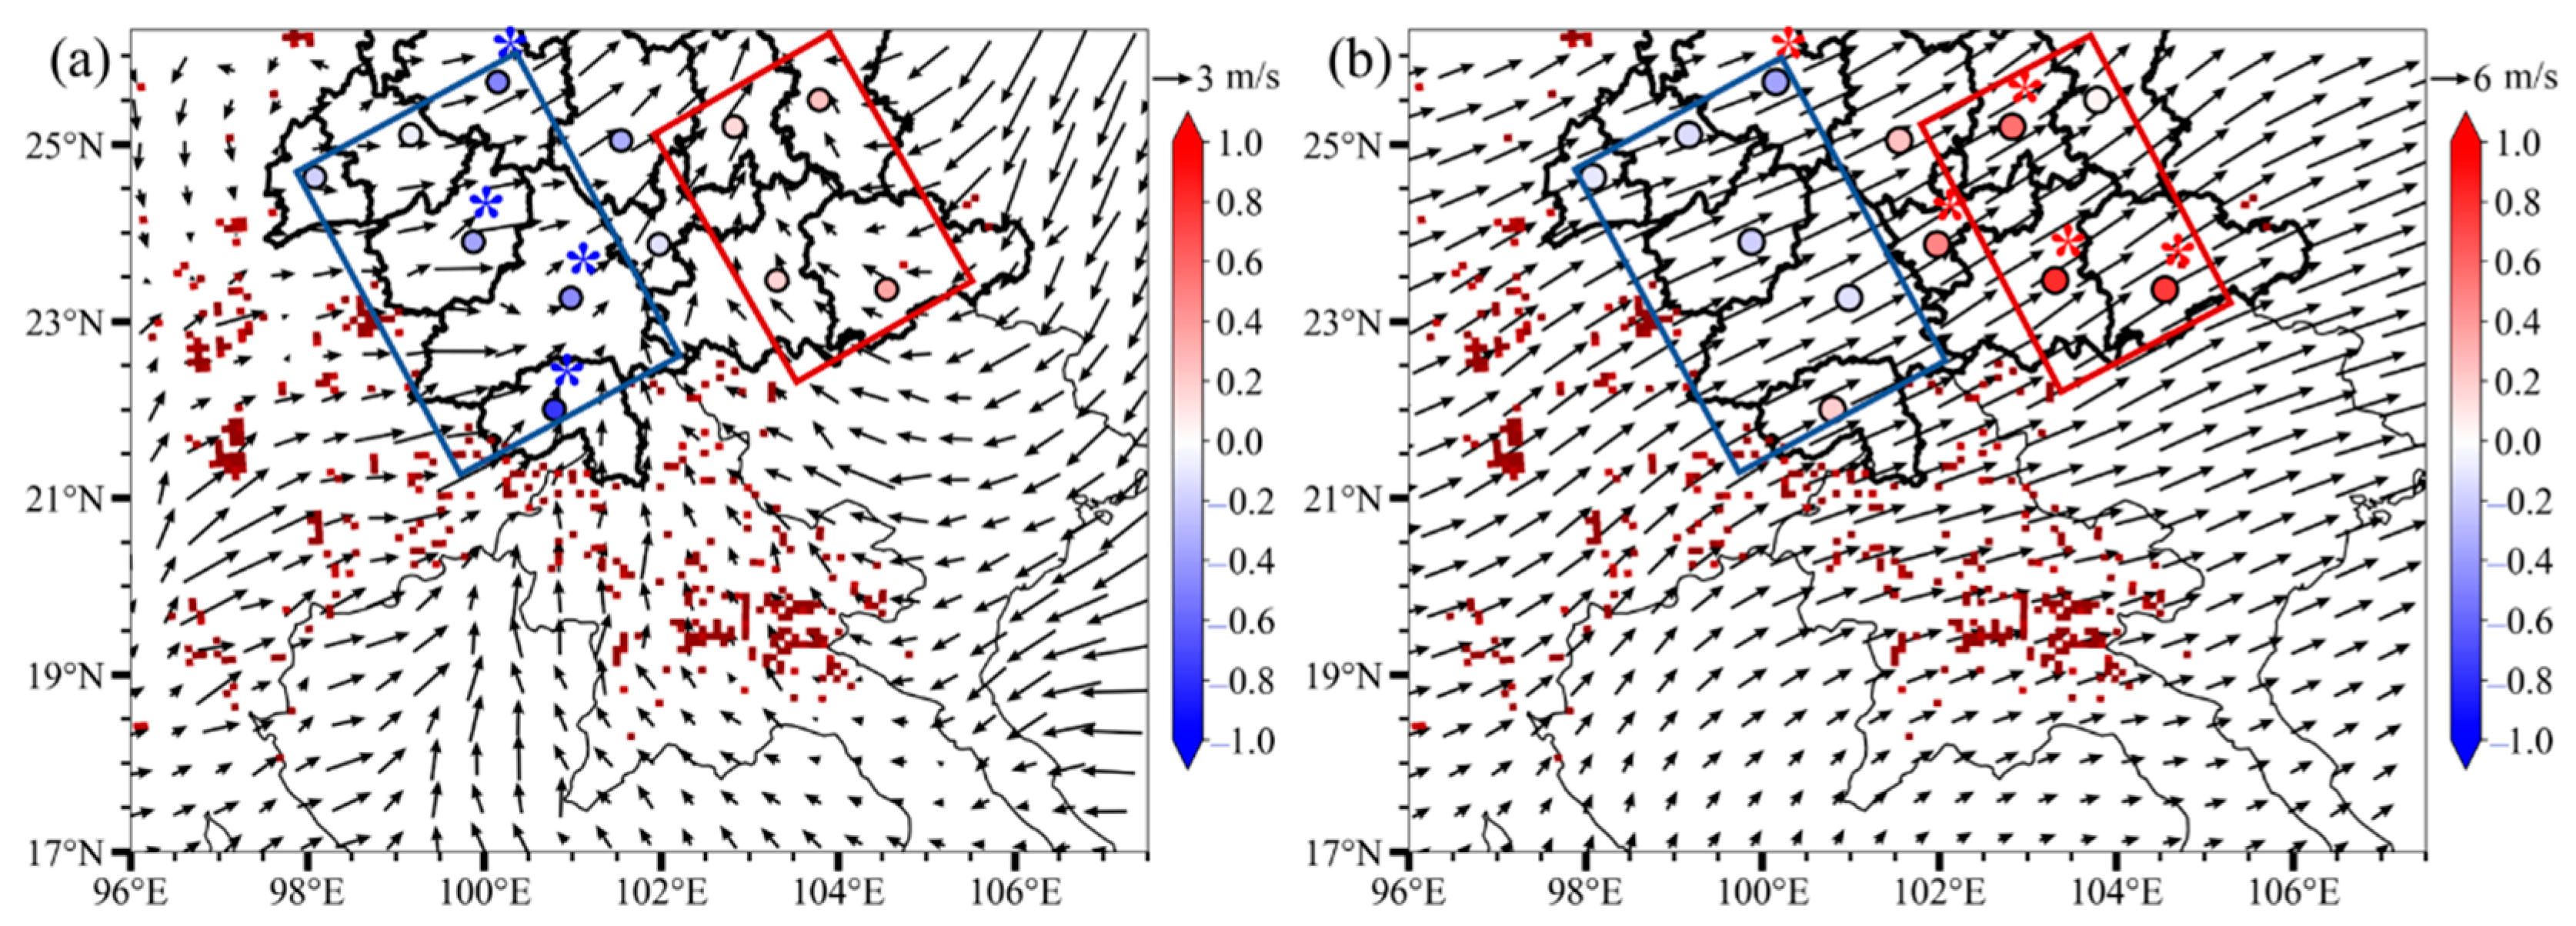
The near-surface wind speeds at 10 m are correlated with the PM2.5 concentrations over YP, and the spatial distribution of the correlation coefficients (R) is shown in Figure 6a. The PM2.5 concentrations in XSBN, the closest site to the BB emissions in ICP, have a significant negative correlation with wind speed, with an R-value of −0.71, passing the significance level at 99%. This indicates that, when the near-surface wind speed increases, more PM2.5 concentrations are exported from XSBN, presenting a similar effect over the “source” region (SR) of PM2.5 emissions. The border sites on the southwestern part of YP, which are close to the fire activities, all showed the similar effect. In the hinterland of YP, which is further from the fire activities, positive correlations were observed between the near-surface wind speeds and the PM2.5 concentrations.
Previous studies showed that a major transport channel of BB pollutants from the ICP to southern China exists around 700 hPa [25], and the transport height is elevated with the increase in distance between YP and ICP. Therefore, we further calculated the R between surface PM2.5 concentrations and 700 hPa wind speed (Figure 6b), and the significant positive correlations with R > 0.5 over the central and eastern regions of YP, where the strong winds in the free troposphere play a crucial role in transporting air pollutants to the surface. As a result, these areas are depicted as a “receptor” region (RR) in regional PM2.5 transport, which is in good agreement with the study of Yu et al. [55]. The specific mechanisms of air pollution that occurred in the “source” and “receptor” regions in the regional PM2.5 transport are described in the following sections.

3.3. The Different Mechanisms of PM2.5 Pollution in SR and RR

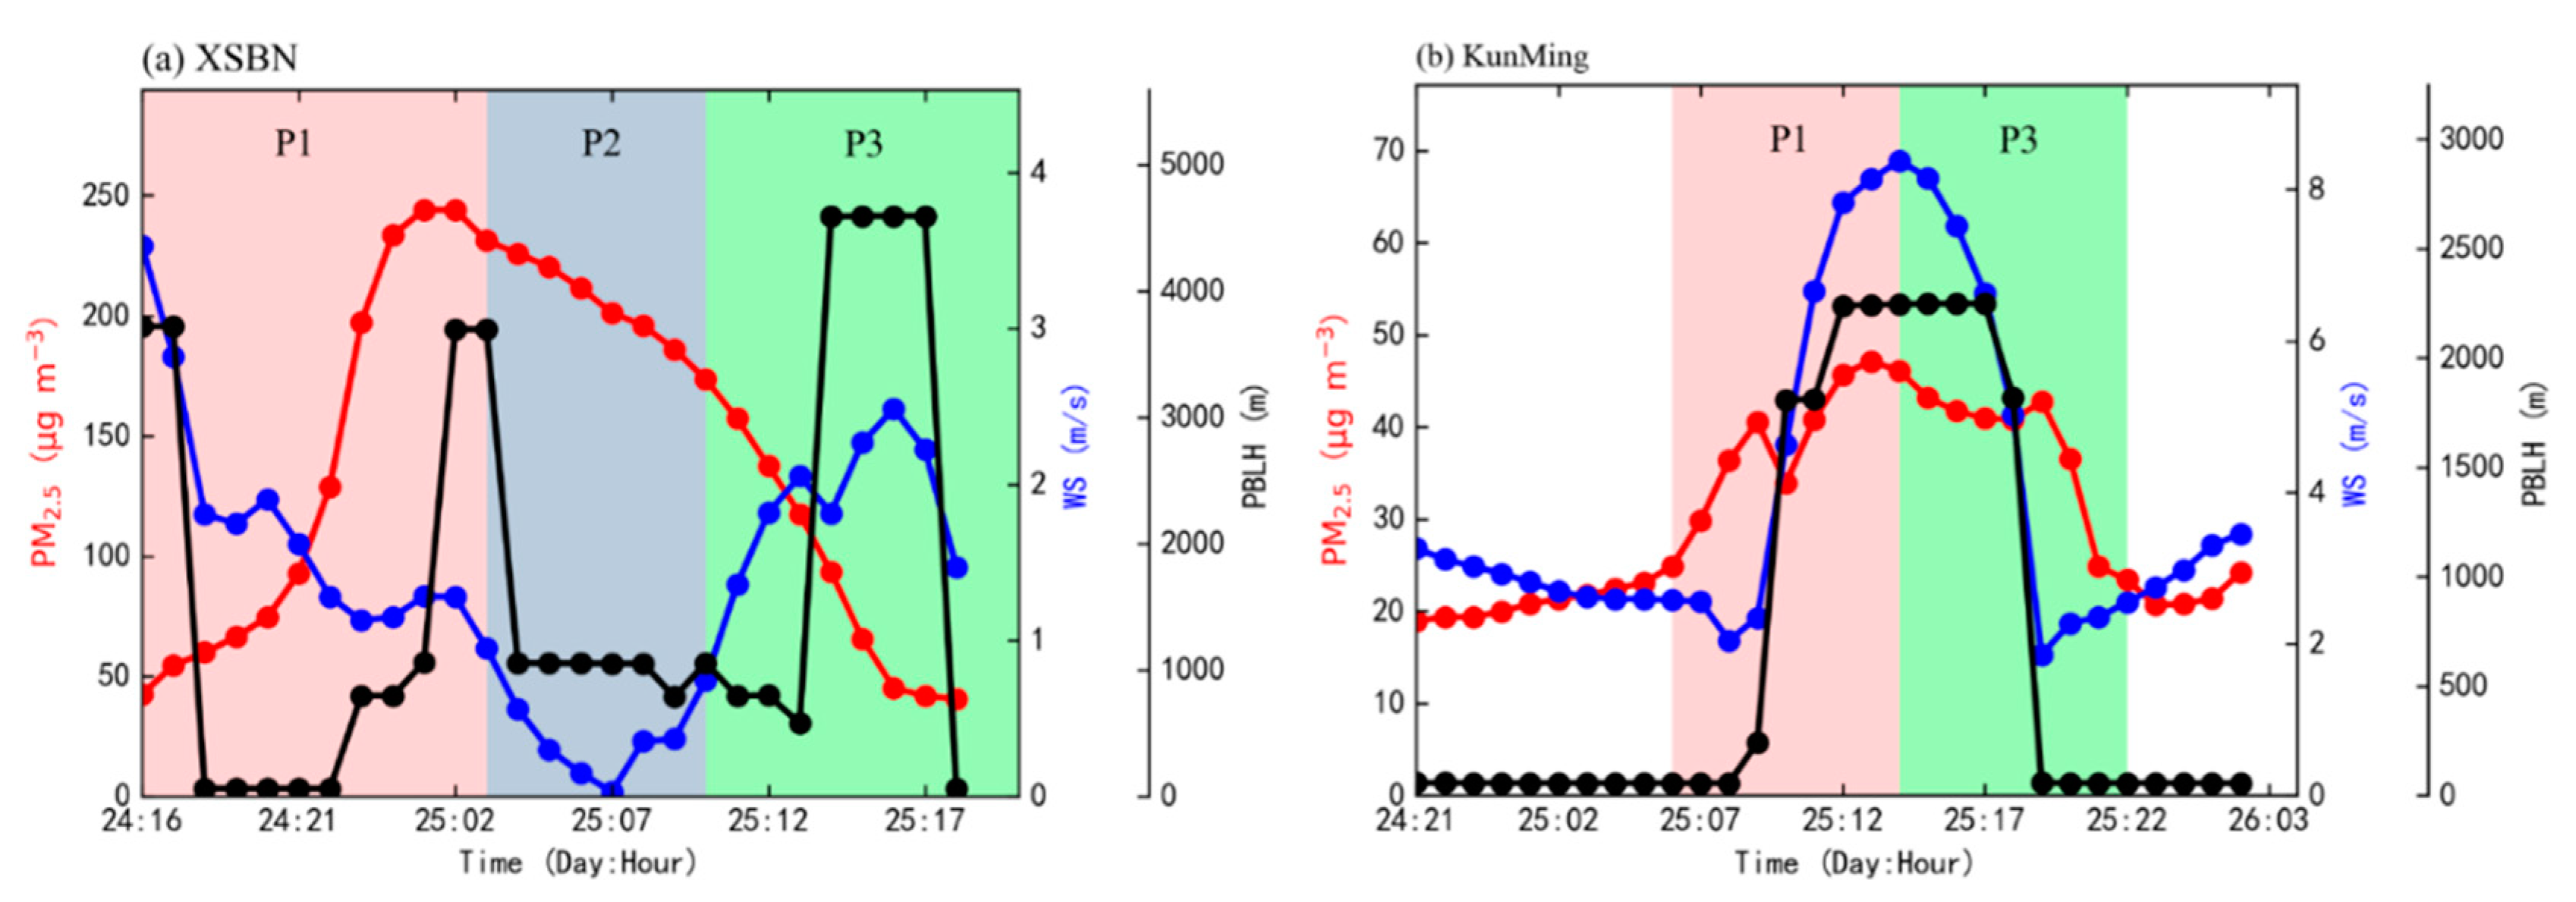
For XSBN, the representative site in SR, the pollution episode is divided into three periods (Figure 7a), namely the formation period (P1), the maintenance period (P2), and the dissipation period (P3). In P1, the weak wind speed decreased, the boundary layer height was mostly below 1000 m, and the PM2.5 concentrations increased rapidly. Previous studies showed that the transport distance plays a significant role in the regional transport of PM2.5 from BB emissions. On strong BB days, the mean PM2.5 concentrations increase sharply when the distance between the source region and the downwind region is less than 100 km [63]. Meanwhile, Figure 4a shows a synergistic daily variation in PM2.5 in XSBN and BB emission intensity in ICP bordering YP. As a result, the BB emissions can affect the PM2.5 concentrations in XSBN under the weak wind speed and low boundary layer height. The PM2.5 emitted from fire activities is also transported over XSBN by channels at high altitudes. The boundary layer height begins to increase in the second half of P1, once above 3000 m, which is conducive to the development of turbulence. The turbulence further promotes the vertical mixing of PM2.5 and facilitates the diffusion of PM2.5 from high altitude to the ground, further aggravating the pollution.
In P2, the fire activities ended in ICP (Figure 4a), and the vertical mixing process was weakened simultaneously with decreasing boundary layer height. However, the PM2.5 concentrations decreased slowly with the decreasing wind speed and boundary layer height. Hence, XSBN shows a stable meteorological condition that is conducive to the maintenance of air pollution [64,65]. Under this condition, the PM2.5 concentrations were continuously over 150 µg m−3 and the PM2.5 residue lies on the surface. In P3, the wind speed and boundary layer height increased simultaneously; as a result, the PM2.5 concentrations decreased rapidly under the dual effect of horizontal and vertical diffusion. This resulted in the end of P2. To summarize, the changes in PM2.5 in XSBN are mainly affected by BB emissions, stagnant meteorological conditions, vertical mixing, and strong winds.
In Kunming, the representative site in RR (Figure 7b), although the PM2.5 concentrations increased during the event, the air quality still maintained a good level, which is closely related to the fact that the site is far away from fire activities. In this area, meteorological conditions play a major role in controlling the PM2.5 changes under specific processes. Kunming only experienced two periods i.e., the P1 and P3. With increasing wind speed and boundary layer height, the prevailing southwesterly winds transported PM2.5 over Kunming and then increased the ground PM2.5 concentrations through vertical mixing of turbulence. After that, with decreasing boundary layer height and wind speed, the vertical mixing effect diminished, and the PM2.5 concentrations decreased. As a result, the changes in PM2.5 in Kunming were mainly affected by the regional transport of PM2.5 due to strong winds and vertical mixing.

3.4. Patterns of Regional PM2.5 Transport to Different YP Sites

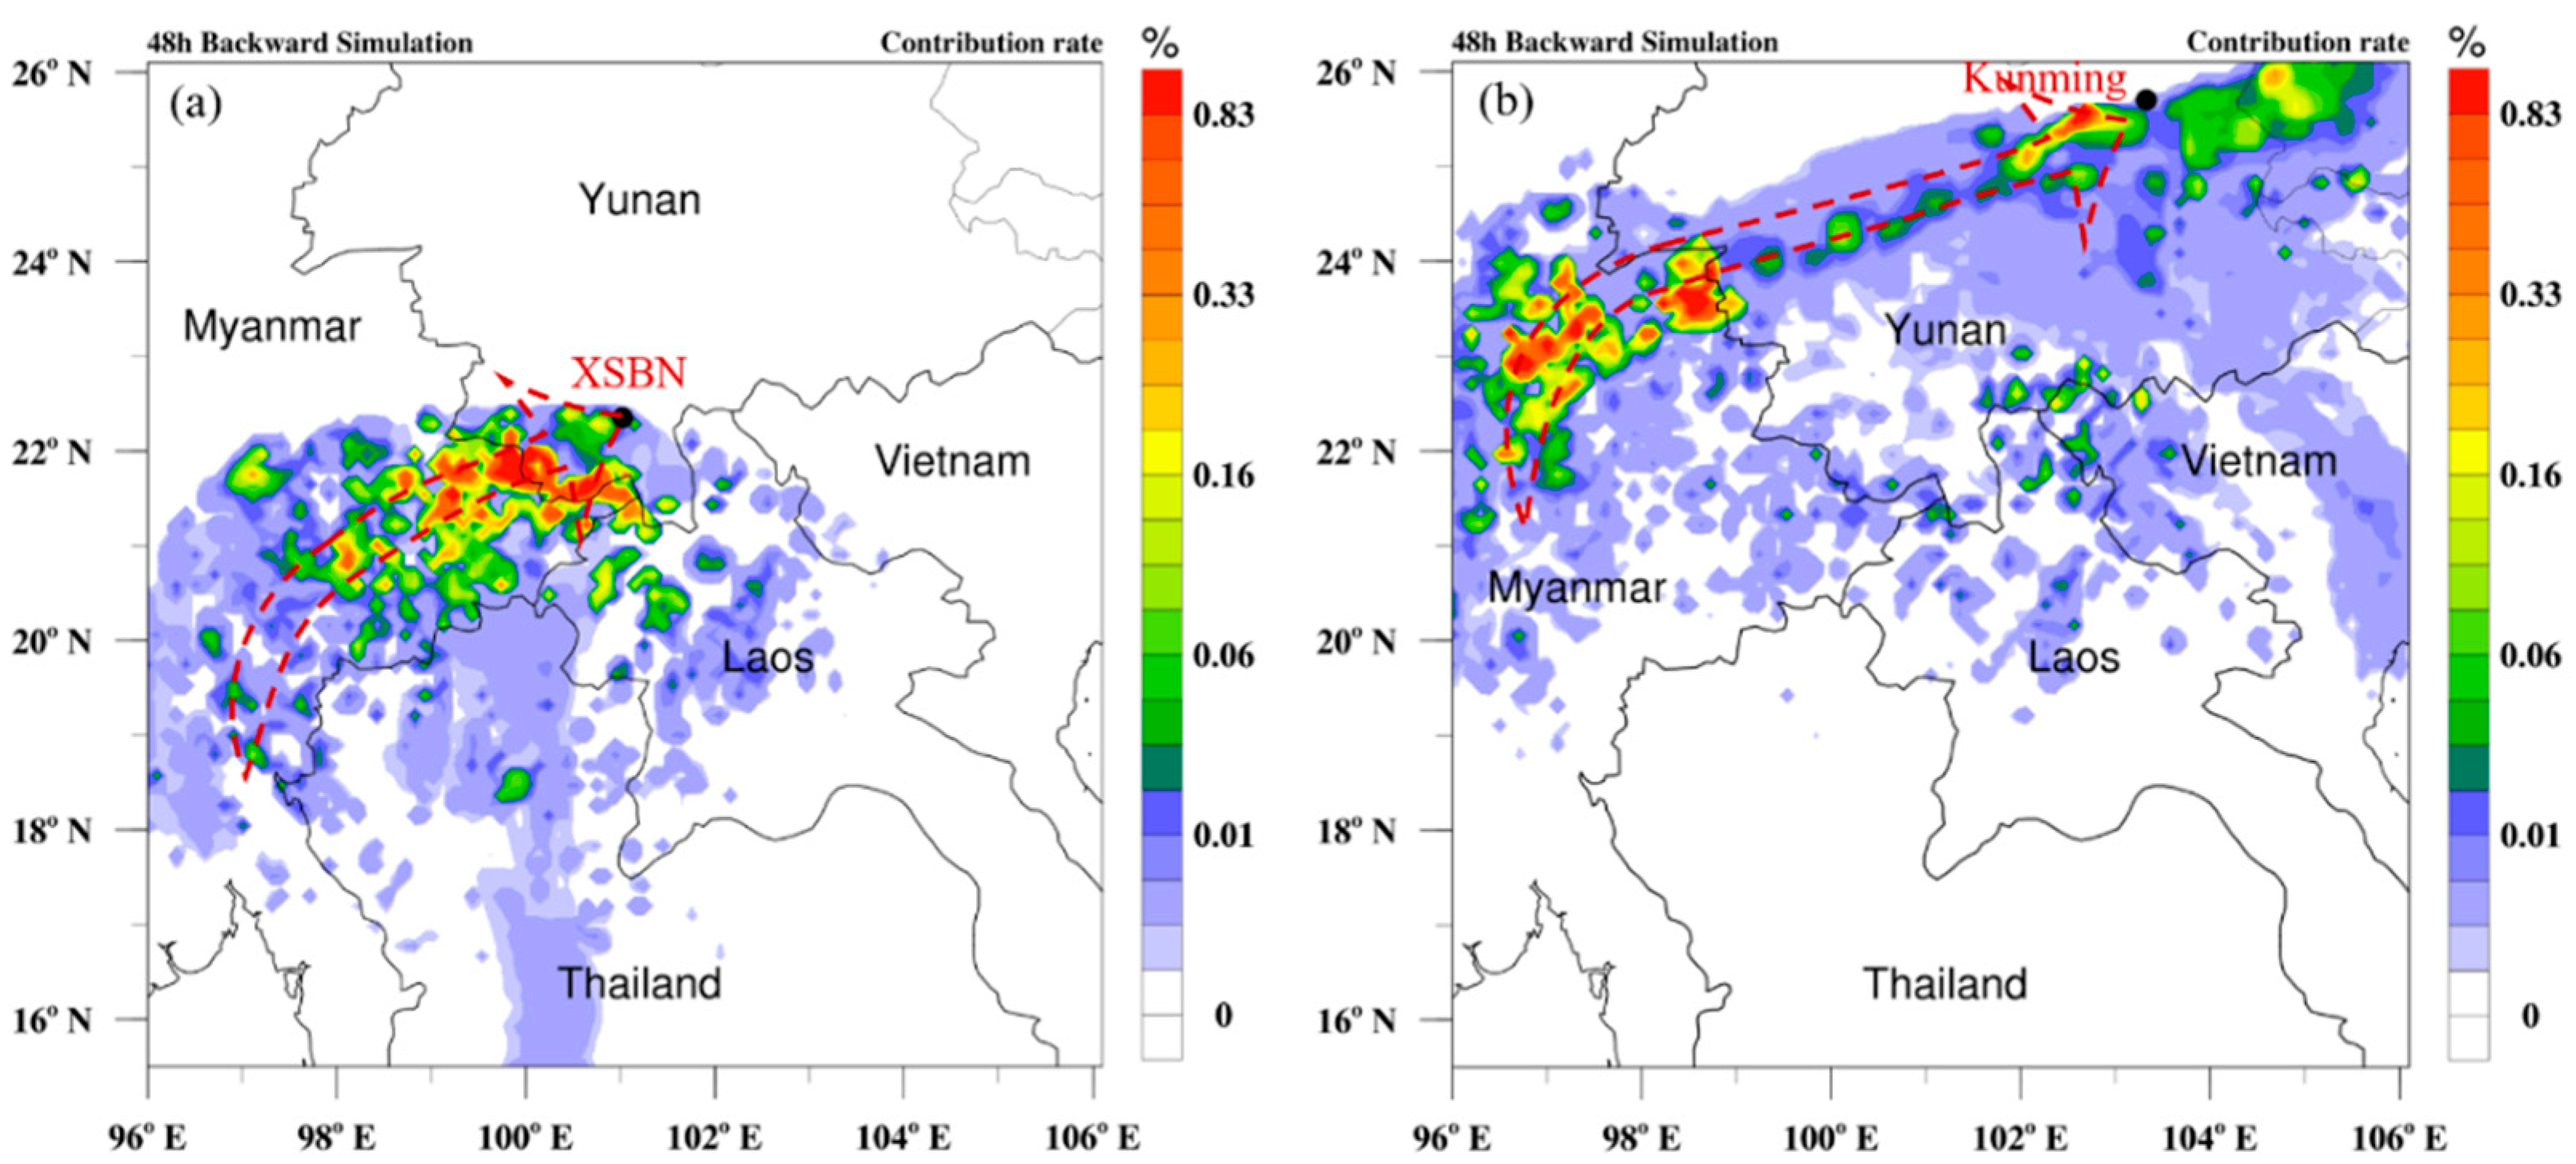
The representative SR and RR sites in the border and hinterland of YP, XSBN, and Kunming, respectively, were selected to estimate the contributions of regional PM2.5 transport to air pollution in YP. The estimation was based on the air particle residence time during the pollution period simulated by the FLEXPART-WRF model and three air pollutant emission inventories described in Section 2.3.2. Each simulation was run for a 48-h rearward trajectory of 50,000 air particles being released from two sites, and the air particle residence time was calculated in a 0.1° × 0.1° horizontal spatial resolution. The air particle residence time was further multiplied with the PM2.5 emission fluxes from three air pollutant emission inventories to quantify the contribution of regional PM2.5 transport to PM2.5 concentrations over the YP. Detailed methods can be found in Chen et al. [57] and Yu et al. [55].
Governed by the prevailing southwesterly winds, the regional transport of PM2.5 from the BB emission source regions in ICP provided a significant contribution to the elevated PM2.5 concentrations over XSBN and Kunming during 24–26 March 2017 (Figure 8). For XSBN, the major pathway is the southwesterly route from southern and eastern Myanmar, wherein the eastern regions of Myanmar bordering XSBN contribute the most. For Kunming, the PM2.5 concentrations are dominated by multiple sources, and the major pathway is the southwesterly route from eastern Myanmar. Moreover, there are two additional minor sources from the northern regions of ICP bordering YP and the domestic area in the east of Kunming. The short-range transport of PM2.5 has a major impact on PM2.5 concentrations over XSBN, whereas the PM2.5 concentrations over Kunming are dominated by the long-range transport of PM2.5.

3.5. Contribution of BB Emissions to PM2.5 Concentrations over YP

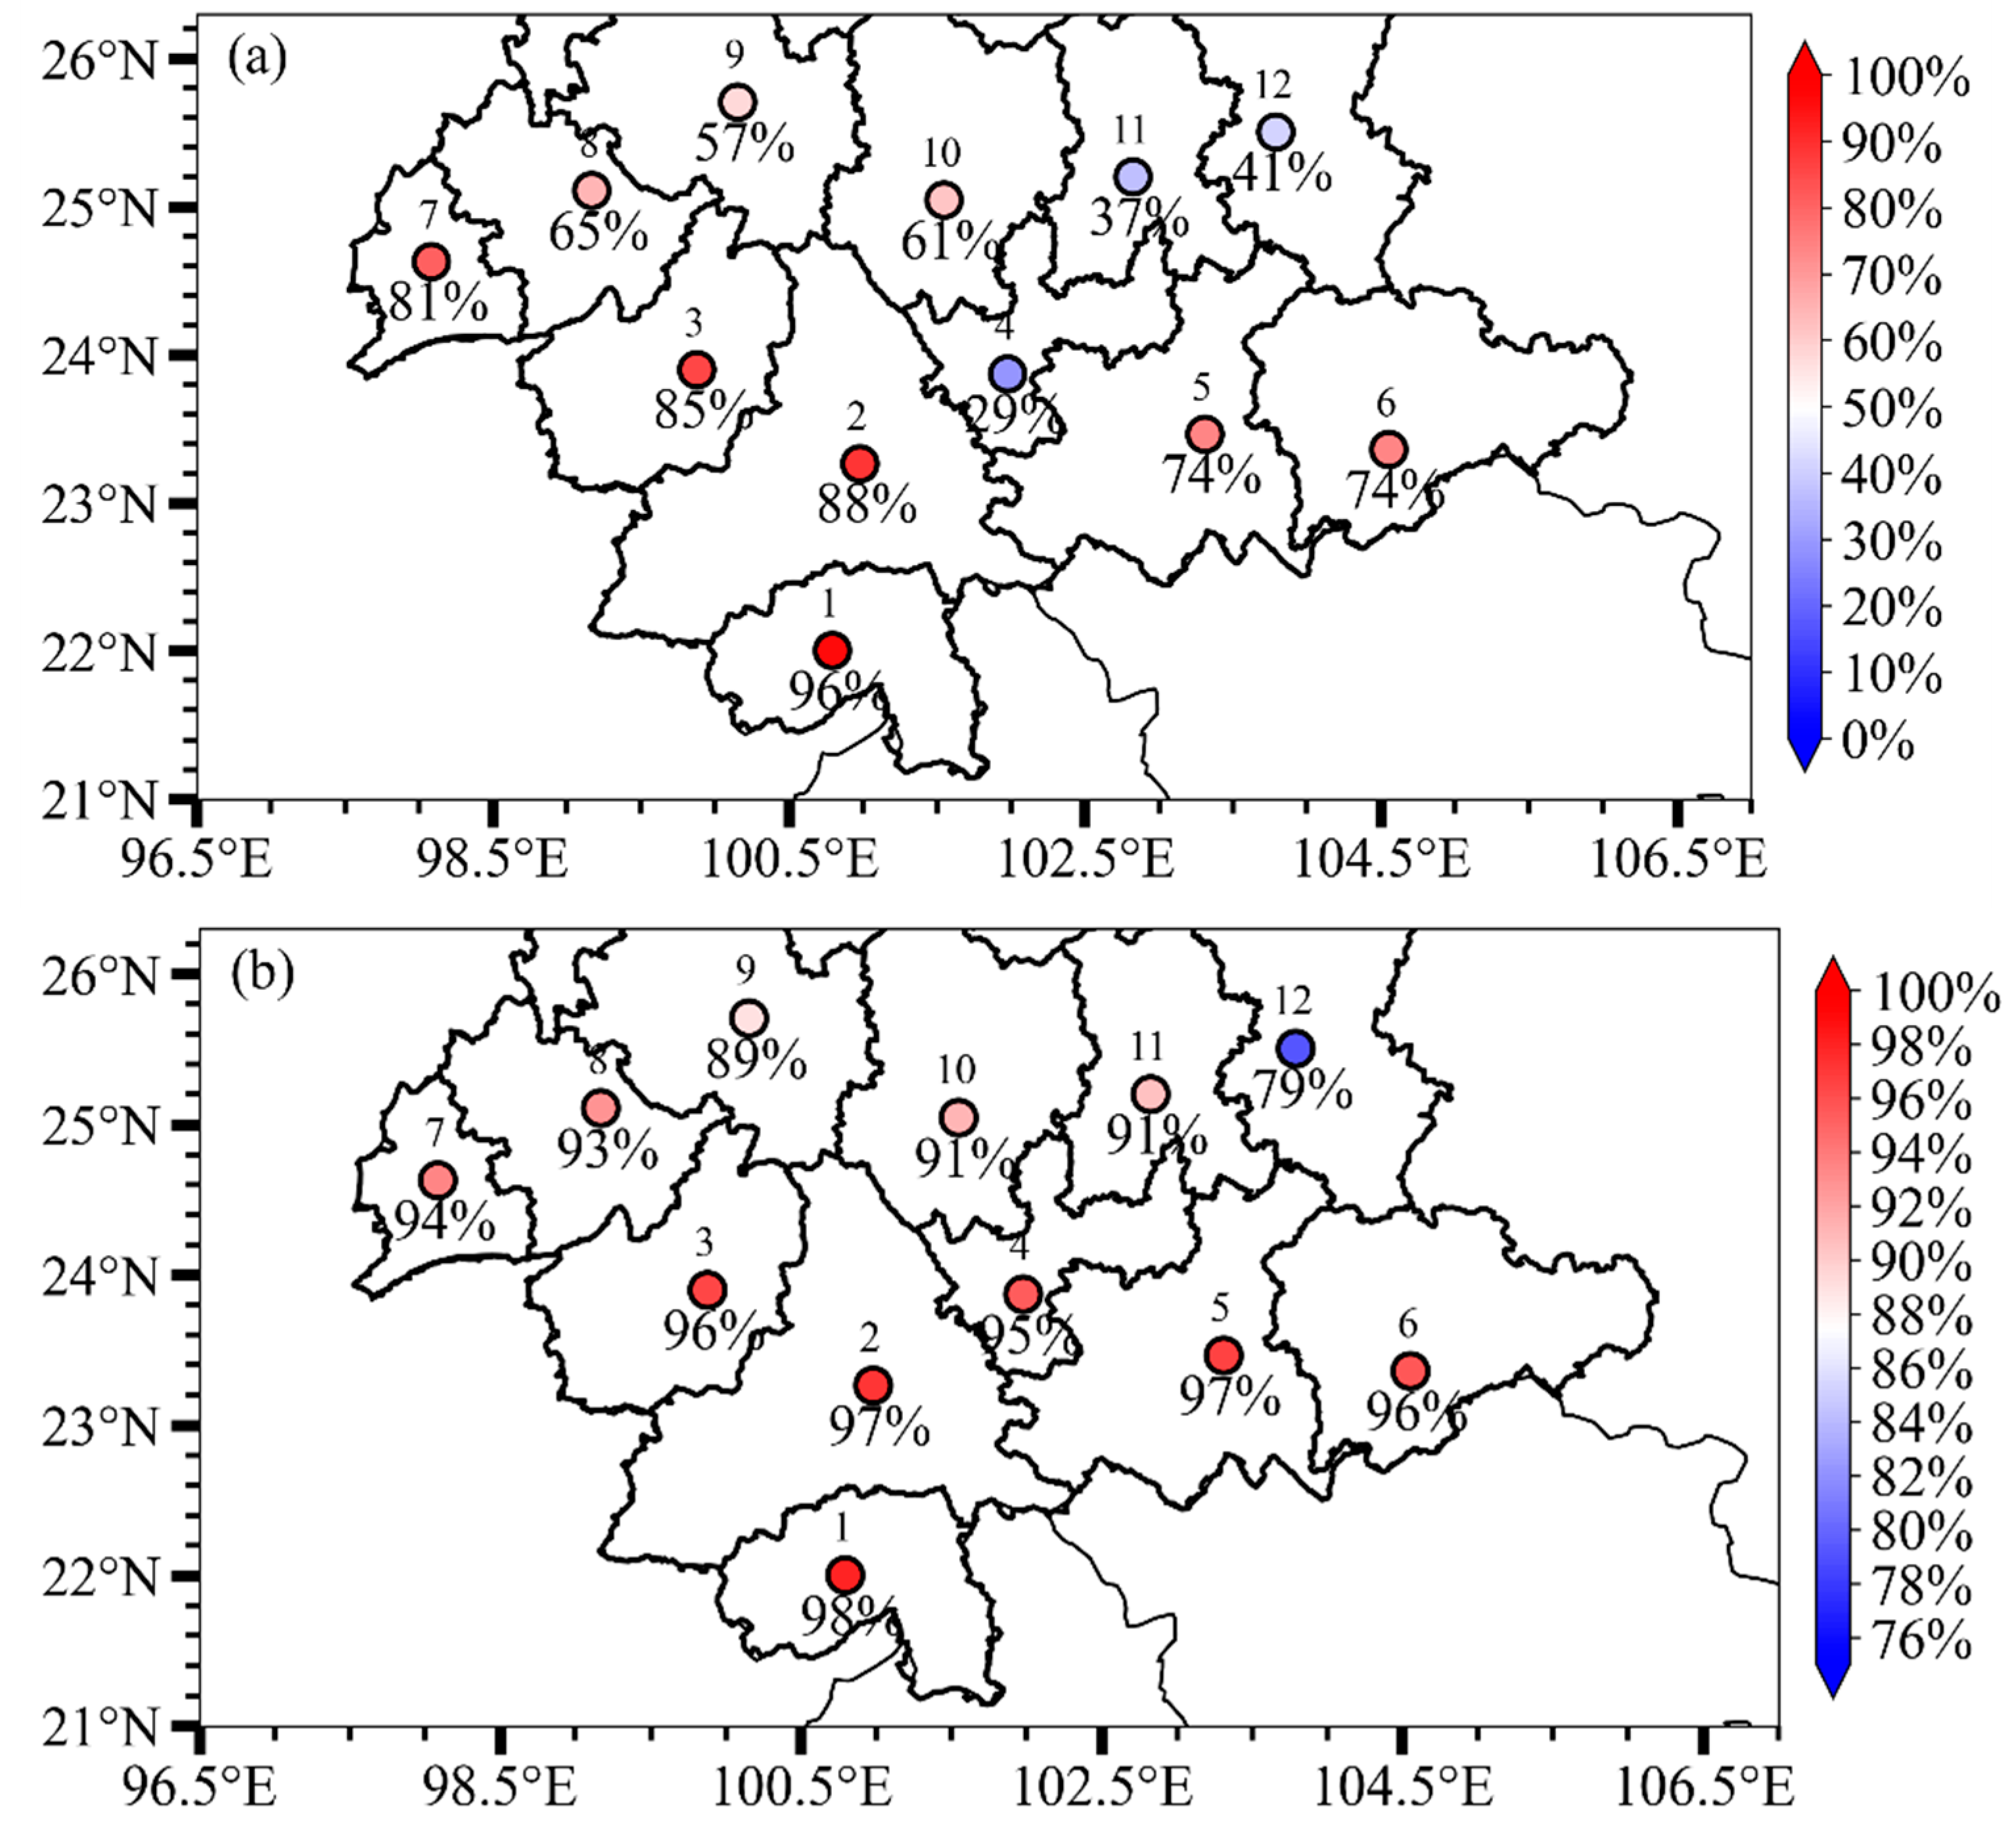
The contribution rates of BB emissions to PM2.5 concentrations in YP were quantitatively estimated by Equation (1). The spatial distribution of the contribution rates to surface PM2.5 concentrations in YP sites (Figure 9a) is highly similar to the distribution of PM2.5 concentrations in Figure 1b. The contribution rates gradually decrease along the transport pathway following the lifting plateau topography in YP. The regional average contribution rate over SR is larger than that in RR, with a difference of 23% (Table 5), and the regional average contribution rate over the whole YP is up to 69%. Three sites with low contribution rates (below 50%) are identified as Yuxi (site 4), Kunming (site 11), and Qujing (site 12). In Yuxi and Kunming, which are the industrial cities of YP, the local anthropogenic emissions are relatively higher, causing the reduction in BB contributions to PM2.5 concentrations. For Qujing, the farthest city from BB emission sources, the long transport distance and greater topography height reduce the impact of BB contributions to local PM2.5 concentrations. However, the contribution rate is still up to 41% against the clean background, which further confirms the important impact of BB emissions on the air quality over YP.
The pollutants from BB emissions have a characteristic of vertical distribution. As a result, the contribution rates of BB emissions to PM2.5 concentrations at 700 hPa were further analyzed (Figure 9b). Two distinctive features can be noticed: (1) The contribution rates in most sites and the regional average contribution rate of YP increase with increasing altitude. However, the increments in the SR sites are much smaller than those in RR, wherein the regional average increment in SR is 16% from surface to 700 hPa, whereas that in RR is 34% (Table 5). The regional PM2.5 transport at high altitudes has a larger impact on RR sites, which is consistent with the pollution mechanism discussed in Section 3.3. (2) In Yuxi and Kunming, where the contribution rates of BB emissions to PM2.5 concentrations at the surface are relatively small, the contribution rates increase more than 50% from the surface to 700 hPa, indicating that BB emissions have a much greater impact on high-altitude PM2.5 concentrations than anthropogenic emissions.
Moreover, the regional average contribution rate over SR is larger than that in RR at both the surface and 700 hPa (Table 5), but the difference between SR and RR (SR minus RR) at the surface (23%) is much greater than that at 700 hPa (4%) due to the obstruction effect of topographic height along the transport pathway. The contributions of regional transport of PM2.5 from BB activities decrease with increasing transport distance, reflecting an important role of transport distance between the source–receptor areas in changing the air pollution.

4. Conclusions

Using MODIS remote sensing products and ground-based observations, and conducting model simulations with WRF-Chem and WRF-FLEXPART, the present study examined an air pollution event that occurred over YP, resulting from the cross-border transport of PM2.5 due to BB activities from ICP to YP. The aim was to explore how BB emissions in ICP affect the air quality in the neighboring YP.
Under the prevailing southwesterly winds, the BB sources in ICP have different impacts on the PM2.5 concentrations over SR and RR. XSBN and Kunming, the representative sites in SR and RR, respectively, have distinct mechanisms enhancing PM2.5 concentrations of air pollution. The SR site is mainly affected by Southeast Asian BB emissions with local accumulation in the stagnant meteorological conditions, whereas the RR site is dominated by the regional PM2.5 transport with strong winds and vertical mixing. XSBN and Kunming also have different major pathways of regional PM2.5 transport. The PM2.5 concentrations in XSBN are mainly affected by short-range transport of PM2.5, whereas long-range transport of PM2.5 plays a dominating role in Kunming. The regional average PM2.5 contributions of ICP BB emissions to surface PM2.5 over SR is larger than that in RR, with a difference of 23%; in addition, the regional average increments in the contribution from the surface to 700 hPa are 16% in SR and 34% in RR. It is revealed that the large PM2.5 contributions of ICP BB emissions lift from the lower altitudes in SR to the higher altitudes in RR in regional PM2.5 transport. Moreover, the contributions of regional transport of PM2.5 decrease with an increase in transport distance, reflecting an important role of transport distance between the source–receptor areas in changing the scenario of air pollution.
Based on the investigation of a springtime air pollution event in YP, which differs from other regions such as Eastern China where pollution events happen frequently, the study revealed the underlying mechanism of the pollution episode in YP and the extent to which the regional transport of PM2.5 from BB emissions affects PM2.5 concentrations in YP. However, the MIX anthropogenic emissions in YP and ICP were produced based on data from 2010, which contain more uncertainties compared to those of Eastern China. As a result, future studies involving air pollution simulations can be greatly enhanced by a more accurate emission inventory. To further understand the mechanisms in the regional transport of PM2.5 from BB activities, future exploration can be conducted with the support of multi-source satellite data, long-term ground observations, and a modeling study with refined model schemes and data assimilation.

Author Contributions

Data curation, Q.Y. and Z.T.; Funding acquisition, T.Z.; Methodology, Q.Y., T.Z., J.C. and W.H.; Visualization, Z.S. and J.H.; Writing—original draft, Q.Y.; Writing—review and editing, T.Z. and K.R.K. All authors have read and agreed to the published version of the manuscript.

Funding

This research was financially funded by grants received from the National Key Research and Development Program of China (2019YFC0214604), the National Natural Science Foundation of China (41830965; 91744209). One of the authors KRK is grateful to the Science and Engineering Research Board (S ERB), a statutory body under the Department of Science and Technology (DST), India for providing financial grants through the Start-Up Research Grant (SRG; File No. SRG/2020/001445) scheme and the DST, Govt. of India, for the award of the DST-FIST Level-1 (Grant No.SR/FST/PS-1/2018/35) scheme to the Department of Physics, KLEF.

Data Availability Statement

MODIS L3 Atmosphere products (AOD) are available at https://ladsweb.modaps.eosdis.nasa.gov/search/ (accessed on 1 March 2022). ERA-Interim reanalysis data are available at https://www.ecmwf.int/en/forecasts/datasets/reanalysis-datasets/era-interim (accessed on 1 March 2022). The PM2.5 datasets and near-surface meteorological data are available at http://www.cnemc.cn and http://data.cma.cn/ (accessed on 1 March 2022).

Conflicts of Interest

The authors declare no conflict of interest.

References

  1. Guo, Y.; Zeng, H.; Zheng, R.; Li, S.; Barnett, A.G.; Zhang, S.; Zou, X.; Huxley, R.R.; Chen, W.; Williams, G. Lung cancer incidence and ambient air pollution in China: A spatial age–period cohort study 1990–2009. Lancet 2015, 386, S5. [Google Scholar] [CrossRef]
  2. Dawson, J.P.; Adams, P.J.; Pandis, S.N. Sensitivity of PM 2.5 to climate in the Eastern US: A modeling case study. Atmos. Chem. Phys. 2007, 7, 4295–4309. [Google Scholar] [CrossRef] [Green Version]
  3. Fu, Q.; Zhuang, G.; Wang, J.; Xu, C.; Huang, K.; Li, J.; Hou, B.; Lu, T.; Streets, D.G. Mechanism of formation of the heaviest pollution episode ever recorded in the Yangtze River Delta, China. Atmos. Environ. 2008, 42, 2023–2036. [Google Scholar] [CrossRef]
  4. Shu, Z.; Liu, Y.; Zhao, T.; Xia, J.; Wang, C.; Cao, L.; Wang, H.; Zhang, L.; Zheng, Y.; Shen, L. Elevated 3D structures of PM 2.5 and impact of complex terrain-forcing circulations on heavy haze pollution over Sichuan Basin, China. Atmos. Chem. Phys. 2021, 21, 9253–9268. [Google Scholar] [CrossRef]
  5. Zhang, J.P.; Zhu, T.; Zhang, Q.H.; Li, C.C.; Shu, H.L.; Ying, Y.; Dai, Z.P.; Wang, X.; Liu, X.Y.; Liang, A.M. The impact of circulation patterns on regional transport pathways and air quality over Beijing and its surroundings. Atmos. Chem. Phys. 2012, 12, 5031–5053. [Google Scholar] [CrossRef] [Green Version]
  6. Li, C.; Mao, J.; Lau, K.-H.A.; Chen, J.-C.; Yuan, Z.; Liu, X.; Zhu, A.; Liu, G. Characteristics of distribution and seasonal variation of aerosol optical depth in eastern China with MODIS products. Chinese Sci. Bull. 2003, 48, 2488–2495. [Google Scholar]
  7. Luo, Y.; Zheng, X.; Zhao, T.; Chen, J. A climatology of aerosol optical depth over China from recent 10 years of MODIS remote sensing data. Int. J. Climatol. 2014, 34, 863–870. [Google Scholar] [CrossRef]
  8. Huang, X.; Ding, A.; Wang, Z.; Ding, K.; Gao, J.; Chai, F.; Fu, C. Amplified transboundary transport of haze by aerosol–boundary layer interaction in China. Nat. Geosci. 2020, 13, 428–434. [Google Scholar] [CrossRef]
  9. Miao, Y.; Guo, J.; Liu, S.; Liu, H.; Zhang, G.; Yan, Y.; He, J. Relay transport of aerosols to Beijing-Tianjin-Hebei region by multi-scale atmospheric circulations. Atmos. Environ. 2017, 165, 35–45. [Google Scholar] [CrossRef]
  10. Kang, H.; Zhu, B.; Gao, J.; He, Y.; Wang, H.; Su, J.; Pan, C.; Zhu, T.; Yu, B. Potential impacts of cold frontal passage on air quality over the Yangtze River Delta, China. Atmos. Chem. Phys. 2019, 19, 3673–3685. [Google Scholar] [CrossRef] [Green Version]
  11. Lu, M.; Tang, X.; Wang, Z.; Gbaguidi, A.; Liang, S.; Hu, K.; Wu, L.; Wu, H.; Huang, Z.; Shen, L. Source tagging modeling study of heavy haze episodes under complex regional transport processes over Wuhan megacity, Central China. Environ. Pollut. 2017, 231, 612–621. [Google Scholar] [CrossRef] [PubMed]
  12. Zhang, H.; Cheng, S.; Yao, S.; Wang, X.; Zhang, J. Multiple perspectives for modeling regional PM2. 5 transport across cities in the Beijing–Tianjin–Hebei region during haze episodes. Atmos. Environ. 2019, 212, 22–35. [Google Scholar] [CrossRef]
  13. Squizzato, S.; Masiol, M.; Innocente, E.; Pecorari, E.; Rampazzo, G.; Pavoni, B. A procedure to assess local and long-range transport contributions to PM2. 5 and secondary inorganic aerosol. J. Aerosol Sci. 2012, 46, 64–76. [Google Scholar] [CrossRef]
  14. Lang, J.; Cheng, S.; Li, J.; Chen, D.; Zhou, Y.; Wei, X.; Han, L.; Wang, H. A monitoring and modeling study to investigate regional transport and characteristics of PM2. 5 pollution. Aerosol Air Qual. Res. 2013, 13, 943–956. [Google Scholar] [CrossRef] [Green Version]
  15. Wu, J.; Li, G.; Cao, J.; Bei, N.; Wang, Y.; Feng, T.; Huang, R.; Liu, S.; Zhang, Q.; Tie, X. Contributions of trans-boundary transport to summertime air quality in Beijing, China. Atmos. Chem. Phys. 2017, 17, 2035–2051. [Google Scholar] [CrossRef] [Green Version]
  16. Wang, Y.; Bao, S.; Wang, S.; Hu, Y.; Shi, X.; Wang, J.; Zhao, B.; Jiang, J.; Zheng, M.; Wu, M. Local and regional contributions to fine particulate matter in Beijing during heavy haze episodes. Sci. Total Environ. 2017, 580, 283–296. [Google Scholar] [CrossRef]
  17. Hu, W.; Zhao, T.; Bai, Y.; Kong, S.; Xiong, J.; Sun, X.; Yang, Q.; Gu, Y.; Lu, H. Importance of regional PM2. 5 transport and precipitation washout in heavy air pollution in the Twain-Hu Basin over Central China: Observational analysis and WRF-Chem simulation. Sci. Total Environ. 2021, 758, 143710. [Google Scholar] [CrossRef]
  18. Lin, C.-Y.; Liu, S.C.; Chou, C.C.K.; Liu, T.H.; Lee, C.-T.; Yuan, C.-S.; Shiu, C.-J.; Young, C.-Y. Long-range transport of Asian dust and air pollutants to Taiwan. Terr. Atmos. Ocean. Sci. 2004, 15, 759–784. [Google Scholar] [CrossRef] [Green Version]
  19. Sánchez-Ccoyllo, O.R.; de Fatima Andrade, M. The influence of meteorological conditions on the behavior of pollutants concentrations in São Paulo, Brazil. Environ. Pollut. 2002, 116, 257–263. [Google Scholar] [CrossRef]
  20. Gustafsson, O.; Krusa, M.; Zencak, Z.; Sheesley, R.J.; Granat, L.; Engstrom, E.; Praveen, P.S.; Rao, P.; Leck, C.; Rodhe, H. Brown clouds over South Asia: Biomass or fossil fuel combustion? Science 2009, 323, 495–498. [Google Scholar] [CrossRef]
  21. Reisen, F.; Meyer, C.P.M.; Keywood, M.D. Impact of biomass burning sources on seasonal aerosol air quality. Atmos. Environ. 2013, 67, 437–447. [Google Scholar] [CrossRef]
  22. Fu, J.S.; Hsu, N.C.; Gao, Y.; Huang, K.; Li, C.; Lin, N.-H.; Tsay, S.-C. Evaluating the influences of biomass burning during 2006 BASE-ASIA: A regional chemical transport modeling. Atmos. Chem. Phys. 2012, 12, 3837–3855. [Google Scholar] [CrossRef] [Green Version]
  23. Zhang, Y.; Yang, Y.; Li, J.; Wang, Y.; Wang, Z. Modeling the Impacts of Biomass Burning in Southeast Asia on PMover China in Spring. Res. Environ. Sci. 2016, 29, 952–962. [Google Scholar]
  24. Tian, D.; Hu, Y.; Wang, Y.; Boylan, J.W.; Zheng, M.; Russell, A.G. Assessment of biomass burning emissions and their impacts on urban and regional PM2. 5: A Georgia case study. Environ. Sci. Technol. 2009, 43, 299–305. [Google Scholar] [CrossRef]
  25. Lin, C.-Y.; Hsu, H.-M.; Lee, Y.H.; Kuo, C.H.; Sheng, Y.-F.; Chu, D.A. A new transport mechanism of biomass burning from Indochina as identified by modeling studies. Atmos. Chem. Phys. 2009, 9, 7901–7911. [Google Scholar] [CrossRef] [Green Version]
  26. Tsay, S.C.; Hsu, N.C.; Lau, W.K.; Li, C.; Gabriel, P.M.; Ji, Q.; Holben, B.N.; Judd Welton, E.; Nguyen, A.X.; Janjai, S. From BASE-ASIA toward 7-SEAS: A satellite-surface perspective of boreal spring biomass-burning aerosols and clouds in Southeast Asia. Atmos. Environ. 2013, 78, 20–34. [Google Scholar] [CrossRef] [Green Version]
  27. Deng, X.; Tie, X.; Zhou, X.; Wu, D.; Zhong, L.; Tan, H.; Fei, L.; Huang, X.; Bi, X.; Tao, D. Effects of Southeast Asia biomass burning on aerosols and ozone concentrations over the Pearl River Delta (PRD) region. Atmos. Environ. 2008, 42, 8493–8501. [Google Scholar] [CrossRef]
  28. Chan, C.Y.; Chan, L.Y.; Harris, J.M.; Oltmans, S.J.; Zheng, X.D. Characteristics of biomass burning emission sources, transport, and chemical speciation in enhanced springtime tropospheric ozone profile over Hong Kong. J. Geophys. Res. Atmos. 2003, 108, ACH-3. [Google Scholar] [CrossRef] [Green Version]
  29. Wang, Y. Yunnan Mountain Climate; Yunnan Science and Technology Press: Kunming, China, 2006. (In Chinese) [Google Scholar]
  30. Zhu, J.; Xia, X.; Che, H.; Wang, J.; Zhang, J.; Duan, Y. Study of aerosol optical properties at Kunming in southwest China and long-range transport of biomass burning aerosols from North Burma. Atmos. Res. 2016, 169, 237–247. [Google Scholar] [CrossRef]
  31. Nguyen, L.S.P.; Huang, H.Y.; Lei, T.L.; Bui, T.T.; Wang, S.H.; Chi, K.H.; Sheu, G.R.; Lee, C.T.; Ou-Yang, C.F.; Lin, N.H. Characterizing a landmark biomass-burning event and its implication for aging processes during long-range transport. Atmos. Environ. 2020, 241, 117766. [Google Scholar] [CrossRef]
  32. Huang, K.; Fu, J.S.; Hsu, N.C.; Gao, Y.; Dong, X.; Tsay, S.C.; Lam, Y.F. Impact assessment of biomass burning on air quality in Southeast and East Asia during BASE-ASIA. Atmos. Environ. 2013, 78, 291–302. [Google Scholar] [CrossRef] [Green Version]
  33. Zhang, Y.; Peng, Y.; Song, W.; Zhang, Y.L.; Ponsawansong, P.; Prapamontol, T.; Wang, Y. Contribution of brown carbon to the light absorption and radiative effect of carbonaceous aerosols from biomass burning emissions in Chiang Mai, Thailand. Atmos. Environ. 2021, 260, 118544. [Google Scholar] [CrossRef]
  34. Ding, K.; Huang, X.; Ding, A.; Wang, M.; Su, H.; Kerminen, V.M.; Petäjä, T.; Tan, Z.; Wang, Z.; Zhou, D.; et al. Aerosol-boundary-layer-monsoon interactions amplify semi-direct effect of biomass smoke on low cloud formation in Southeast Asia. Nat. Commun. 2021, 12, 6416. [Google Scholar] [CrossRef] [PubMed]
  35. Ge, C.; Wang, J.; Reid, J.S. Mesoscale modeling of smoke transport over the Southeast Asian Maritime Continent: Coupling of smoke direct radiative effect below and above the low-level clouds. Atmos. Chem. Phys. 2014, 14, 159–174. [Google Scholar] [CrossRef] [Green Version]
  36. Zhu, A.; Xu, H.; Deng, J.; Ma, J.; Li, S. El Niño--Southern Oscillation (ENSO) effect on interannual variability in spring aerosols over East Asia. Atmos. Chem. Phys. 2021, 21, 5919–5933. [Google Scholar] [CrossRef]
  37. Dong, X.; Fu, J.S.; Huang, K.; Zhu, Q.; Tipton, M. Regional climate effects of biomass burning and dust in East Asia: Evidence from modeling and observation. Geophys. Res. Lett. 2019, 46, 11490–11499. [Google Scholar] [CrossRef]
  38. Bilal, M.; Nazeer, M.; Qiu, Z.; Ding, X.; Wei, J. Global validation of MODIS C6 and C6. 1 merged aerosol products over diverse vegetated surfaces. Remote Sens. 2018, 10, 475. [Google Scholar] [CrossRef] [Green Version]
  39. Ma, Y.; Li, Z.; Li, Z.; Xie, Y.; Fu, Q.; Li, D.; Zhang, Y.; Xu, H.; Li, K. Validation of MODIS aerosol optical depth retrieval over mountains in central China based on a sun-sky radiometer site of SONET. Remote Sens. 2016, 8, 111. [Google Scholar] [CrossRef] [Green Version]
  40. Grell, G.A.; Peckham, S.E.; Schmitz, R.; McKeen, S.A.; Frost, G.; Skamarock, W.C.; Eder, B. Fully coupled “online” chemistry within the WRF model. Atmos. Environ. 2005, 39, 6957–6975. [Google Scholar] [CrossRef]
  41. Hong, S.Y.; Noh, Y.; Dudhia, J. A New Vertical Diffusion Package with an Explicit Treatment of Entrainment Processes. Mon. Weather Rev. 2005, 134, 2318. [Google Scholar] [CrossRef] [Green Version]
  42. Morrison, H.; Thompson, G.; Tatarskii, V. Impact of Cloud Microphysics on the Development of Trailing Stratiform Precipitation in a Simulated Squall Line: Comparison of One- and Two-Moment Schemes. Mon. Weather Rev. 2009, 137, 991–1007. [Google Scholar] [CrossRef] [Green Version]
  43. Iacono, M.J.; Delamere, J.S.; Mlawer, E.J.; Shephard, M.W.; Collins, W.D. Radiative Forcing by Long-Lived Greenhouse Gases: Calculations with the AER Radiative Transfer Models. J. Geophys. Res. Atmos. 2008, 113, D13103. [Google Scholar] [CrossRef]
  44. Chen, F.; Dudhia, J. Coupling an Advanced Land Surface–Hydrology Model with the Penn State–NCAR MM5 Modeling System. Part I: Model Implementation and Sensitivity. Mon. Weather Rev. 2001, 129, 569–585. [Google Scholar] [CrossRef] [Green Version]
  45. Stockwell, W.R.; Middleton, P.; Chang, J.S.; Tang, X. The second generation regional acid deposition model chemical mechanism for regional air quality modeling. J. Geophys. Res. Atmos. 1990, 95, 16343. [Google Scholar] [CrossRef]
  46. Li, M.; Zhang, Q.; Kurokawa, J.I.; Woo, J.H.; He, K.; Lu, Z.; Ohara, T.; Song, Y.; Streets, D.G.; Carmichael, G.R. MIX: A mosaic Asian anthropogenic emission inventory under the international collaboration framework of the MICS-Asia and HTAP. Atmos. Chem. Phys. 2017, 17, 935–963. [Google Scholar] [CrossRef] [Green Version]
  47. Guenther, A.; Karl, T.; Harley, P.; Wiedinmyer, C.; Palmer, P.I.; Geron, C. Estimates of global terrestrial isoprene emissions using MEGAN (Model of Emissions of Gases and Aerosols from Nature). Atmos. Chem. Phys. 2006, 6, 3181–3210. [Google Scholar] [CrossRef] [Green Version]
  48. Wiedinmyer, C.; Akagi, S.K.; Yokelson, R.J.; Emmons, L. The Fire INventory from NCAR (FINN): A high resolution global model to estimate the emissions from open burning. Geosci. Model Dev. 2011, 4, 625–641. [Google Scholar] [CrossRef] [Green Version]
  49. Freitas, S.R.; Longo, K.M.; Chatfield, R.; Latham, D.; Dias, M.S.; Andreae, M.O.; Prins, E.; Santos, J.C.; Gielow, R.; Carvalho, J.A. Including the sub-grid scale plume rise of vegetation fires in low resolution atmospheric transport models. Atmos. Chem. Phys. 2007, 7, 447–450. [Google Scholar] [CrossRef] [Green Version]
  50. Freitas, S.R.; Longo, K.M.; Trentmann, J.; Latham, D. Technical Note: Sensitivity of 1-D smoke plume rise models to the inclusion of environmental wind drag. Atmos. Chem. Phys. 2010, 10, 585–594. [Google Scholar] [CrossRef] [Green Version]
  51. Stohl, A. A backward modeling study of intercontinental pollution transport using aircraft measurements. J. Geophys. Res. Atmos. 2003, 108, 108. [Google Scholar] [CrossRef]
  52. Stohl, A.; Forster, C.; Frank, A.; Seibert, P.; Wotawa, G. Technical note: The Lagrangian particle dispersion model FLEXPART version 6.2. Atmos. Chem. Phys. 2005, 5, 2461–2474. [Google Scholar] [CrossRef] [Green Version]
  53. Brioude, J.; Arnold, D.; Stoh, A.; Cassiani, M.; Morton, D.; Seibert, P.; Angevine, W.; Evan, S.; Dingwell, A.; Fast, J.D. The Lagrangian particle dispersion model FLEXPART-WRF version 3.1. Geosci. Model Dev. 2013, 6, 1889–1904. [Google Scholar] [CrossRef] [Green Version]
  54. Sauvage, B.; Fontaine, A.; Eckhardt, S.; Auby, A.; Boulanger, D.; Petetin, H.; Paugam, R.; Athier, G.; Cousin, J.M.; Darras, S. Source attribution using FLEXPART and carbon monoxide emission inventories: SOFT-IO version 1.0. Atmos. Chem. Phys. 2017, 17, 15271–15292. [Google Scholar] [CrossRef] [Green Version]
  55. Yu, C.; Zhao, T.; Bai, Y.; Zhang, L.; Chang, J. Heavy air pollution with a unique “non-stagnant” atmospheric boundary layer in the Yangtze River middle basin aggravated by regional transport of PM2.5 over China. Atmos. Chem. Phys. 2020, 20, 7217–7230. [Google Scholar] [CrossRef]
  56. Shen, L.; Hu, W.; Zhao, T.; Bai, Y.; Wang, H.; Kong, S.; Zhu, Y. Changes in the Distribution Pattern of PM2.5 Pollution over Central China. Remote Sens. 2021, 13, 4855. [Google Scholar] [CrossRef]
  57. Chen, S.; Zhou, G.; Zhu, B.; Geng, F.; Chang, L. A method for fast quantification of air pollutant sources. Acta Sci. Circumstantiae 2017, 37, 2474–2481. [Google Scholar]
  58. Hanna, S.R.; Yang, R. Evaluations of Mesoscale Models’ Simulations of Near-Surface Winds, Temperature Gradients, and Mixing Depths. J. Appl. Meteorol. 2001, 40, 1095–1104. [Google Scholar] [CrossRef]
  59. Zhai, S.; Jacob, D.J.; Brewer, J.F.; Li, K.; Moch, J.M.; Kim, J.; Lee, S.; Lim, H.; Lee, H.C.; Kuk, S.K. Relating geostationary satellite measurements of aerosol optical depth (AOD) over East Asia to fine particulate matter (PM 2.5): Insights from the KORUS-AQ aircraft campaign and GEOS-Chem model simulations. Atmos. Chem. Phys. 2021, 21, 16775–16791. [Google Scholar] [CrossRef]
  60. Boylan, J.W.; Russell, A.G. PM and light extinction model performance metrics, goals, and criteria for three-dimensional air quality models. Atmos. Environ. 2006, 40, 4946–4959. [Google Scholar] [CrossRef]
  61. Ye, W.-F.; Ma, Z.-Y.; Ha, X.-Z. Spatial-temporal patterns of PM2. 5 concentrations for 338 Chinese cities. Sci. Total Environ. 2018, 631, 524–533. [Google Scholar] [CrossRef]
  62. de Leeuw, G.; Sogacheva, L.; Rodriguez, E.; Kourtidis, K.; Georgoulias, A.K.; Alexandri, G.; Amiridis, V.; Proestakis, E.; Marinou, E.; Xue, Y. Two decades of satellite observations of AOD over mainland China using ATSR-2, AATSR and MODIS/Terra: Data set evaluation and large-scale patterns. Atmos. Chem. Phys. 2018, 18, 1573–1592. [Google Scholar] [CrossRef] [Green Version]
  63. Li, X.; Cheng, T.; Shi, S.; Guo, H.; Han, Z. Evaluating the impacts of burning biomass on PM2.5 regional transport under various emission conditions. Sci. Total Environ. 2021, 793, 148481. [Google Scholar] [CrossRef] [PubMed]
  64. Huang, Q.; Cai, X.; Wang, J.; Song, Y.; Zhu, T. Climatological study of the Boundary-layer air Stagnation Index for China and its relationship with air pollution. Atmos. Chem. Phys. 2018, 18, 7573–7593. [Google Scholar] [CrossRef] [Green Version]
  65. Xu, X.; Zhao, T.; Liu, F.; Gong, S.L.; Kristovich, D.; Lu, C.; Guo, Y.; Cheng, X.; Wang, Y.; Ding, G. Climate modulation of the Tibetan Plateau on haze in China. Atmos. Chem. Phys. 2016, 16, 1365–1375. [Google Scholar] [CrossRef] [Green Version]
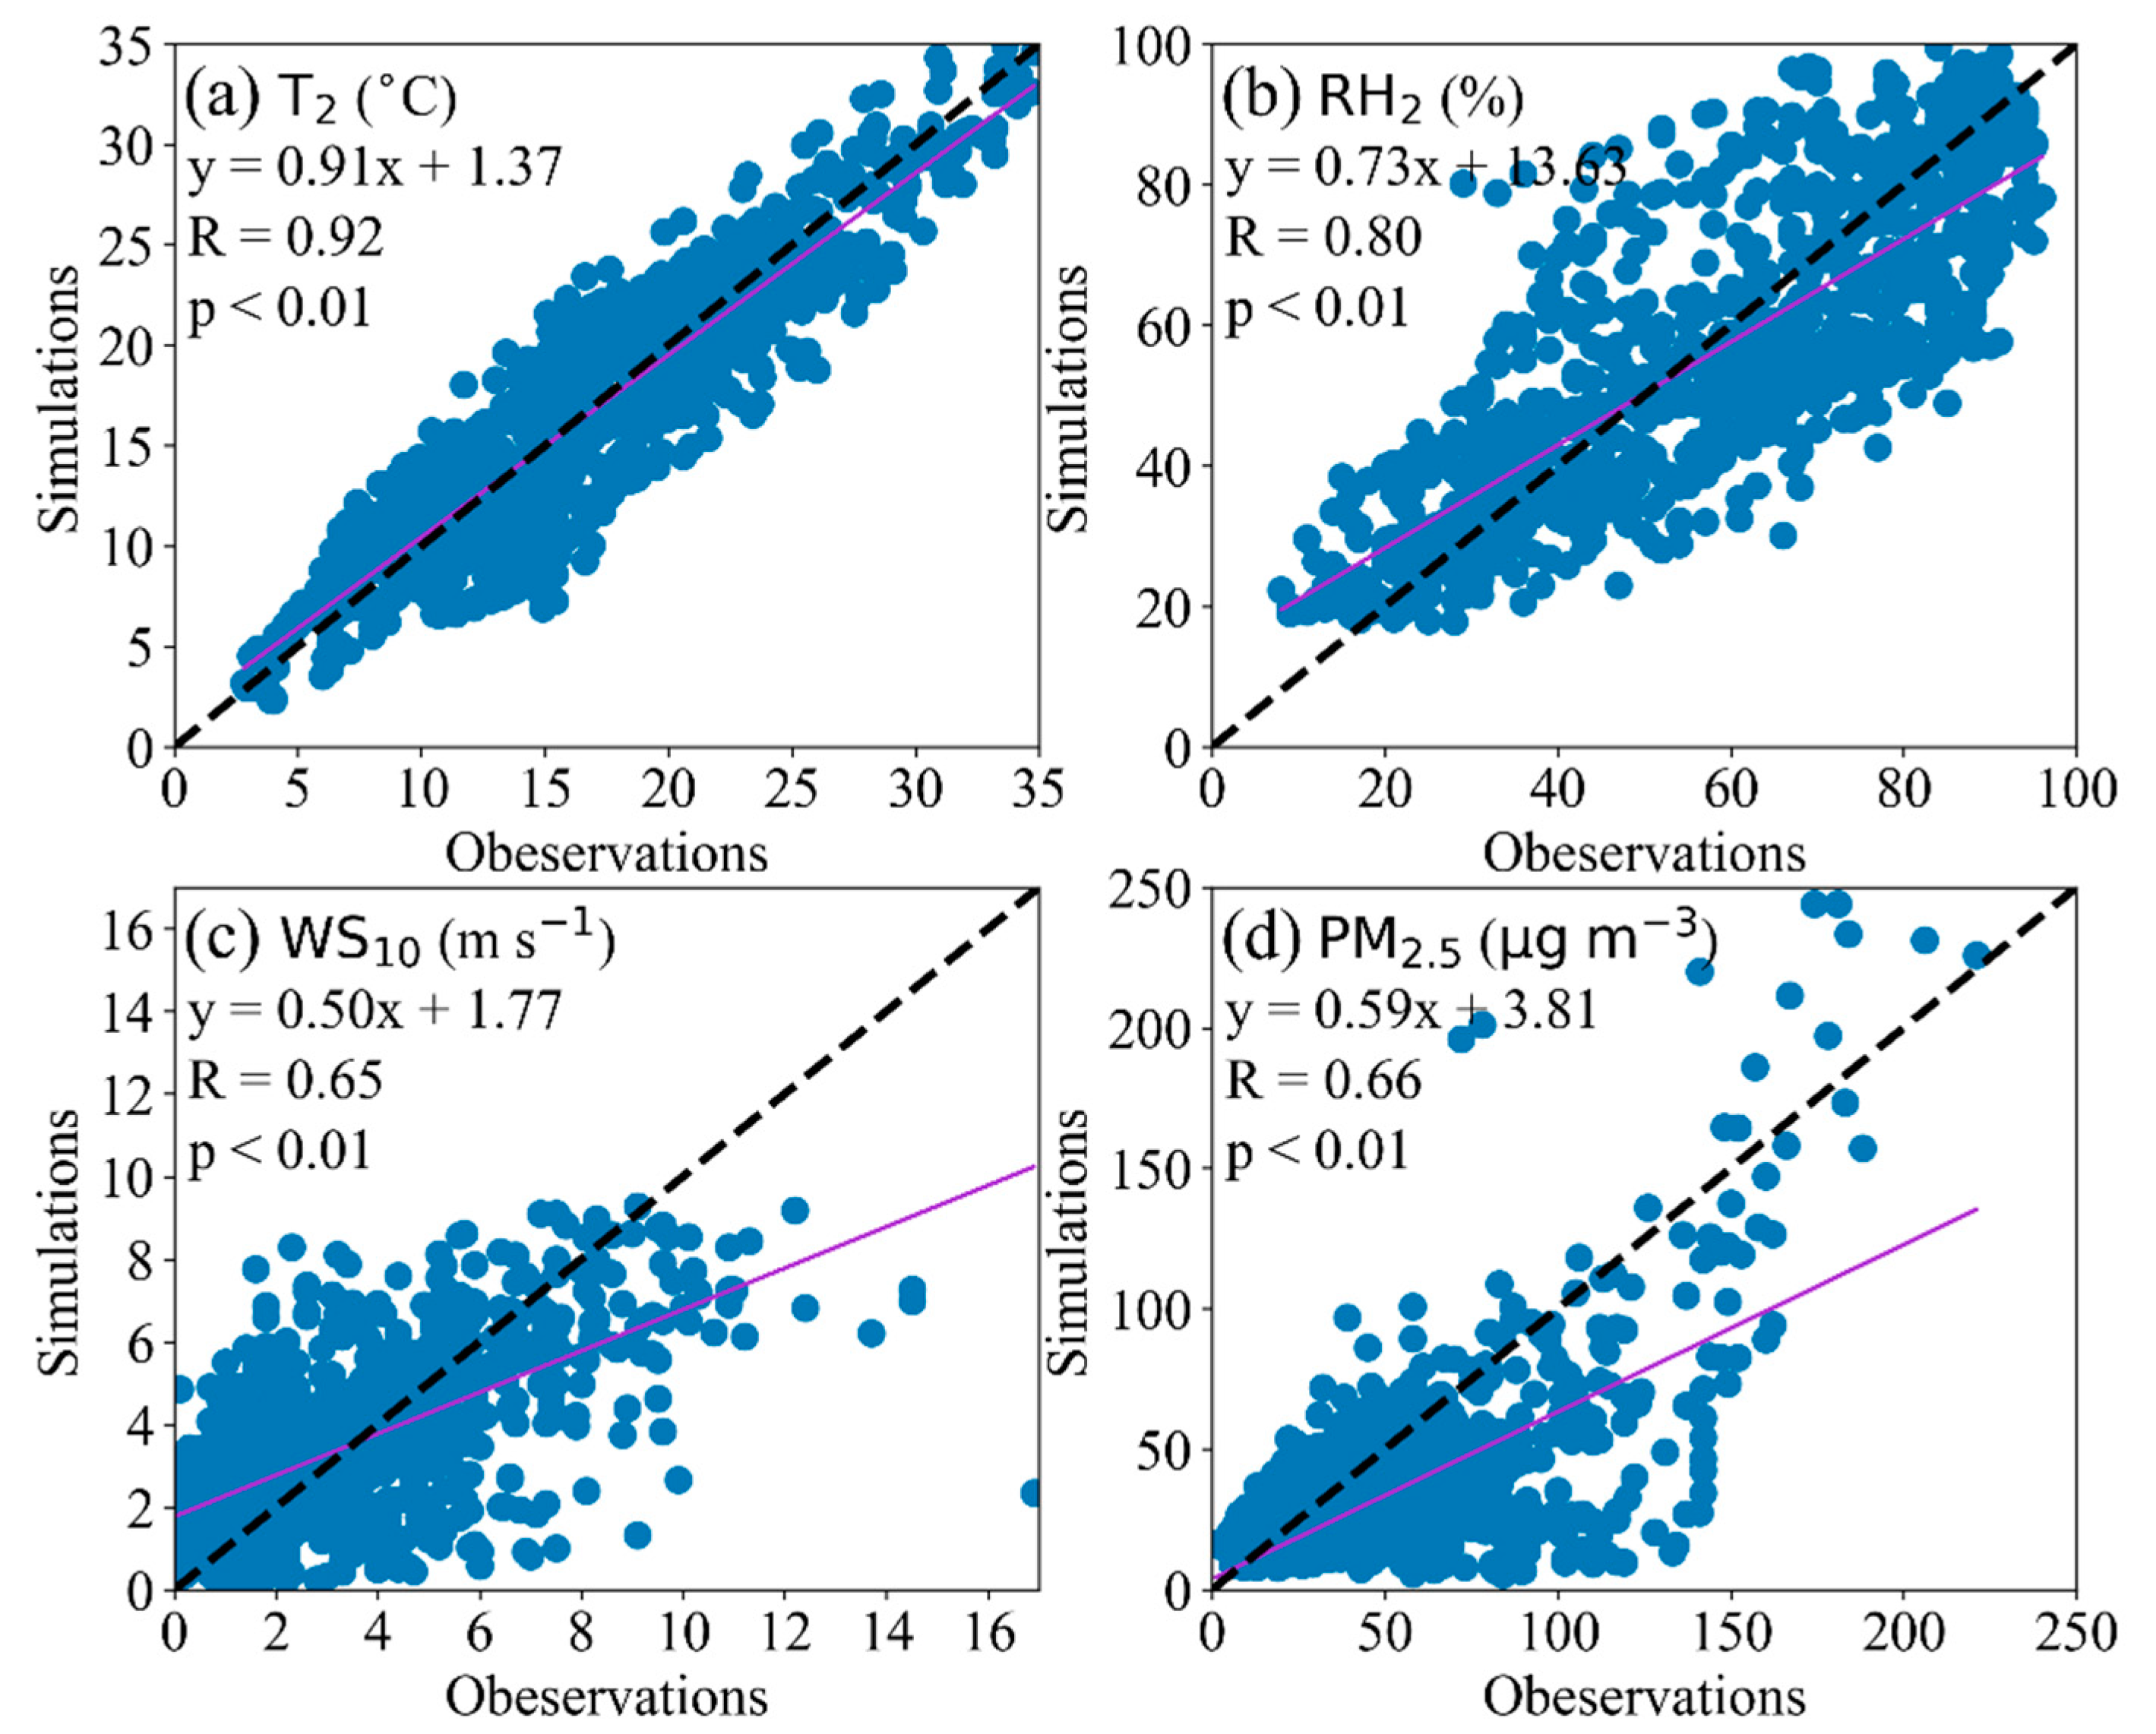
Figure 2. Scatter plots between observations and simulations of hourly meteorological parameters and PM2.5 at 11 typical sites during 24–26 March 2017 (blue dots) with liner fitting lines (purple solid lines) passing 99% significance level and 1:1 line (black dash lines) between observations and simulations.
Remotesensing 14 01886 g002
Figure 3. (a) Spatial distribution of the monthly mean of MODIS AOD in 2017 over East and Southeast Asia. (b) Spatial distribution of the daily mean of MODIS AOD and BB PM2.5 emissions from FINN (red dots, emission rate > 3.5 µg m−3 s−1) during 24–26 March 2017 over Southeast Asia, with the main BB emission sources marked in red rectangles and YP outlined with a bold black line. (c) Spatial distribution of the hourly mean of PM2.5 concentrations (µg m−3) modeled from 24 to 26 March 2017 over YP and its surrounding areas; the PM2.5 concentrations were obtained by vertical integration from 700 hPa upwards.
Remotesensing 14 01886 g003
Figure 4. (a) Hourly changes in PM2.5 concentrations observed in XSBN (purple line) and BB PM2.5 emission rate averaged in Domain 2 from FINN (red bar) The black arrows indicate the PM2.5 concentrations increase with increasing BB emission intensity. (b) Hourly changes in PM2.5 concentrations in three downstream sites, XSBN, Yuxi, and Kunming, from 18:00 of 24 March to 06:00 of 26 March. The black arrow indicates the intervals of the lag time along with the regional PM2.5 transport from XSBN to Kunming during the air pollution episode.
Remotesensing 14 01886 g004
Figure 5. Spatial distribution of surface PM2.5 concentrations and 10 m wind vectors simulated at (a) 02:00 of 25 March, (b) 10:00 of 25 March, and (c) 20:00 of 25 March. The purple arrows highlight the major southwesterly winds, and the green arrow in (c) highlights the major southeasterly winds.
Remotesensing 14 01886 g005
Figure 6. Spatial distribution of correlation coefficients (R) between surface PM2.5 concentrations and (a) 10 m wind speed and (b) 700 hPa wind speed in sites over YP (scatters), and distribution of averaged (a) 10 m wind fields and (b) 700 hPa wind fields during 24–26 March 2017. The blue and red rectangles in both (a,b) represent SR and RR, respectively. The red dots are the same as in Figure 2b. The “*” indicates R passed the 99% confidence level.
Remotesensing 14 01886 g006
Figure 7. Hourly variations in PM2.5 concentrations (red lines), wind speed (WS, blue lines), and planetary boundary layer height (PBLH, black lines) at two representative sites: (a) XSBN in SR and (b) Kunming in RR, from 16:00 of 24 March to 03:00 of 26 March. P1, P2, and P3 indicate the formation, maintenance, and dissipation periods of the air pollution episode, respectively.
Remotesensing 14 01886 g007
Figure 8. Spatial distribution of contribution rates (color contours) to PM2.5 concentrations in (a) XSBN and (b) Kunming with the major pathways of regional transport (red dash arrows) simulated by the FLEXPART-WRF model from 08:00 of 24 March to 08:00 of 26 March.
Remotesensing 14 01886 g008
Figure 9. Spatial distribution of the contribution rates of BB emissions to PM2.5 concentrations at 12 sites (the numbers 1–12) over YP: (a) at the surface and (b) at 700 hPa.
Remotesensing 14 01886 g009
Table 3. Statistical metrics between observed and simulated meteorological parameters averaged over 11 typical sites during 24–26 March 2017. The “*” indicates R passed the 99.9% confidence level.
RRMSEMBME
T2 (°C)0.92 *2.71−0.252.16
WS10 (m s−1)0.65 *2.030.101.51
RH2 (%)0.80 *14.11−1.3111.10
Table 4. Statistical metrics of the comparisons from hourly observed and simulated surface PM2.5 concentrations at 11 typical sites during 24–26 March 2017. The “*” indicates R passed the 99.9% confidence level.
RRMSE (μg m−3)MFB (%)MFE (%)
PM2.50.66 *31.09−21.3033.26
Table 5. Regional average contribution rates of BB emissions over the Southeast Asian region to PM2.5 concentrations at the surface and 700 hPa over SR and RR, and the regional average increments from the surface to 700 hPa in the two regions.
SRRR
Surface79%56%
700 hPa94%90%
Increments16%34%
Publisher’s Note: MDPI stays neutral with regard to jurisdictional claims in published maps and institutional affiliations.