Abstract
The KITSUNE satellite is a 6-unit CubeSat platform with the main mission of 5-m-class Earth observation in low Earth orbit (LEO), and the payload is developed with a 31.4 MP commercial off-the-shelf sensor, customized optics, and a camera controller board. Even though the payload is designed for Earth observation and to capture man-made patterns on the ground as the main mission, a secondary mission is planned for the classification of wildfire images by the convolution neural network (CNN) approach. Therefore, KITSUNE will be the first CubeSat to employ CNN to classify wildfire images in LEO. In this study, a deep-learning approach is utilized onboard the satellite in order to reduce the downlink data by pre-processing instead of the traditional method of performing the image processing at the ground station. The pre-trained CNN models generated in Colab are saved in RPi CM3+, in which, an uplink command will execute the image classification algorithm and append the results on the captured image data. The on-ground testing indicated that it could achieve an overall accuracy of 98% and an F1 score of a 97% success rate in classifying the wildfire events running on the satellite system using the MiniVGGNet network. Meanwhile, the LeNet and ShallowNet models were also compared and implemented on the CubeSat with 95% and 92% F1 scores, respectively. Overall, this study demonstrated the capability of small satellites to perform CNN onboard in orbit. Finally, the KITSUNE satellite is deployed from ISS on March 2022.
1. Introduction
The CubeSat has been defined by the factor of 1U (unit) on a 1.33 kg scale that can increase up to 12U. Since the first successfully operational CubeSat, XI-IV in 2004 [1,2], researchers from other universities have actively joined the space sector to develop educational CubeSats [3,4,5,6]. The main reason is that small satellites could be built efficiently by students, as they require a shorter development time and have low costs compared to traditional satellites. A study has outlined the key factors for a successful small satellite project, such as limited timeline, adequate team communications, well-informed utilization of available volume, and state-of-the-art components [7]. A decent communication functioning in a close working space is considerably important. Most traditional aerospace institutions have failed due to the rigidity of management structure and point of view. Since CubeSat subsystems are continuously evolving, objectives could be selected from the most straightforward missions, such as an imaging mission [8,9,10] to complex interplanetary missions [11,12].
Although Earth Observation (EO) is an attractive mission for CubeSats, there are several limitations of having a high resolution (<1 m) using the CubeSat platform [13]. A 1U CubeSat can acquire a high ground spatial distance (GSD) with a significantly narrow-angle lens such as one with a length of <100 mm; however, the GSD can be increased by increasing the number of units. Currently, the satellite developers use 3U or 6U CubeSats to implement medium-resolution camera payloads [14]. Theoretically, the camera sensor requires a larger form factor lens to improve focal length. Achieving < 10-m resolution by integrating a high-resolution imaging sensor, including a lens with a fixed focal length, is challenging. For instance, the Schmidt-Cassegrain reflective telephoto lens is used for an EO mission, as it provides a large aperture and field of view due to the limited size of CubeSats [15,16]. In addition, a thermal control design has a vital role in acquiring high-focus images, which are commonly integrated with the lens in most optical payloads. For instance, Smith et al. [17] explained how the ASTERIA flight model was equipped with a thermal strap in order to capture high-quality images by transferring the heat across the payload.
The spectral resolution has an essential parameter in determining the target application for the EO missions from the visible (VIS) to the infrared (IR) range of image sensors. Nevertheless, multispectral and hyperspectral sensors are also available in current technology, which would combine into a single sensor [18,19]. Furthermore, temporal resolution is another functional specification to achieve a successful EO mission [20]. An EO mission benefits from low altitude and an increased number of satellites in a constellation in order to achieve high temporal resolution, and a daily revisit time is required for an EO satellite to effectively monitor the changes on the ground. For instance, Planet Lab is a company that has leveraged the EO mission by deploying a constellation of 3U CubeSats named Doves [21], which had over 250 CubeSats orbiting Earth with 3-m resolution until 2021. More importantly, Doves can provide worldwide daily images with multispectral bands for a wide range of remote sensing applications, such as monitoring natural disasters. Various sensors have been implemented on remote sensing satellites to detect and monitor natural disasters on Earth. EO CubeSats such as ZaCube-2 can detect fire using a K-line sensor [22] and PhiSat-1 implemented machine learning to screen cloud images onboard [23]. Meanwhile, GOMX-4 has a mission to monitor the Arctic region [24], and MeznSat carried a micro-spectrometer to track greenhouse gases [25].
Natural disasters like wildfires occur in significantly increasing numbers every year around the world [26], and the traditional way to detect and monitor these catastrophes is to employ EO satellites [27]. These satellites have the ability to monitor multiple regions around the world simultaneously, while their performance depends on spatial and temporal resolution as well. The importance of wildfire detection by satellites could be explained by providing imagery data for early-stage fires and mapping fire occurrences in order to inform regional fire departments. Currently, imagery from active EO satellites like GOES, Landsat-8, Himawari-8, and Sentinel-2 has been used for fire monitoring [28]. Gibson et al. [29] utilized the Sentinel-2 data to map the fire severity in southeastern Australia, while Novo et al. [30] used both Sentinel-2 and aerial LiDAR data for forest fire assessment in Galacia, Spain. Most researchers have leveraged the high spatial resolution with a multi-spectral sensor by implementing artificial intelligence (AI) to detect such disasters.
The high computing processing tools have created a big challenge for the satellite developers to implement processing onboard in space. The traditional EO satellites, such as GOES, MODIS, Meteosat, and Himawari-8, utilize a ground-based fire thermal anomaly (FTA) algorithm [31]. The complex algorithm adaptation has improved active fire pixel detection by approximately 6% for GOES -16 mission compared to GOES-13. On the other hand, a smaller bus system like IPEX, which is a 1U CubeSat, is limited in onboard execution of machine learning (ML), and successful mission results presented the feasibility of flying a Support Vector Machine (SVM) onboard with limited power generation [32]. In addition, the PhiSat-1 constellation of 6U CubeSats was launched in 2020, and they are currently operating in orbit. This mission includes the AI cloud detection experiment, which runs on an embedded vision processing unit (VPU) onboard the satellite [33]. However, such studies are considerably limited for other remote sensing applications by applying traditional feature extraction and ML approaches.
Despite the various deep-learning (DL) techniques for satellite image classification, CubeSat platforms have not been employed particularly for onboard processing for active fire detection. This study is unique and worth publishing since it is a DL implementation onboard a small satellite platform such as a CubeSat, which has significantly limited resources compared to ground applications and traditional large-scale satellites. These limited resources could be listed as processing power, memory size, downlink capacity from the satellite to the ground station, and allocated battery power for long-duration tasks to perform DL techniques with a single-board computer (SBC).
The DL model in this study could be trained on the ground with a dataset, and the resulting pre-trained model could be employed onboard CubeSat for image classification such as wildfire detection applications. Since the objective is selected as wildfire detection, the dataset has been prepared from a set of satellite images containing wildfire occurrences around the world. In addition, the small satellite in this study is a 6U CubeSat called KITSUNE, which has been recently deployed from the International Space Station (ISS). Even though the limited resources would not allow for executing the DL onboard, the pre-trained algorithm is planned to be demonstrated as a secondary mission. The on-orbit results for wildfire classification will be compared to the results on the ground after downloading the images from the camera payload. However, on-orbit DL training performance results are not in the scope of this study. In this paper, the development of the DL algorithm used for wildfire classification is discussed in addition to the integration into a small satellite system. Therefore, the camera payload, which is based on commercial off-the-shelf (COTS) components, is described together with the satellite bus system and the testing results for the space environment and functionality since they are related to the requirements to perform wildfire classification.
To better understand the feasibility of implementing DL wildfire detection onboard CubeSats, this study conducted the first systematic analysis of developing a CubeSat payload with a 5-m-resolution imaging mission. KITSUNE, which means fox in Japanese, is a 6U CubeSat platform developed as a collaboration project that was designed and developed by the Kyushu Institute of Technology (Kitakyushu), Harada Seiki Co., Ltd. (Hamamatsu), and Addnics Corp. (Tokyo) in Japan. The project started in September 2019, and KITSUNE was delivered to the Japan Aerospace Exploration Agency (JAXA) in November 2021. The satellite was deployed to the low Earth orbit (LEO) on 24 March 2022, and it is currently in the initial operation phase. Overall, the main purposes of the present paper are to validate the camera payload design for a 5-m-class imaging mission through the space environment and long-duration operation test, in addition to the study of the feasibility of classifying wildfire images onboard a CubeSat using the CNN approach. The imaging mission and DL execution onboard CubeSat during the ground functional tests showed the novelty of this study.
The paper consists of five parts, starting with the mission design and requirements in Section 2. Section 3 explains the method of CNN fire detection and the functional test. The experimental results are presented in Section 4 and, finally, discussion and conclusions from the study are provided in Section 5 and Section 6, respectively.
2. KITSUNE Satellite
2.1. Overview
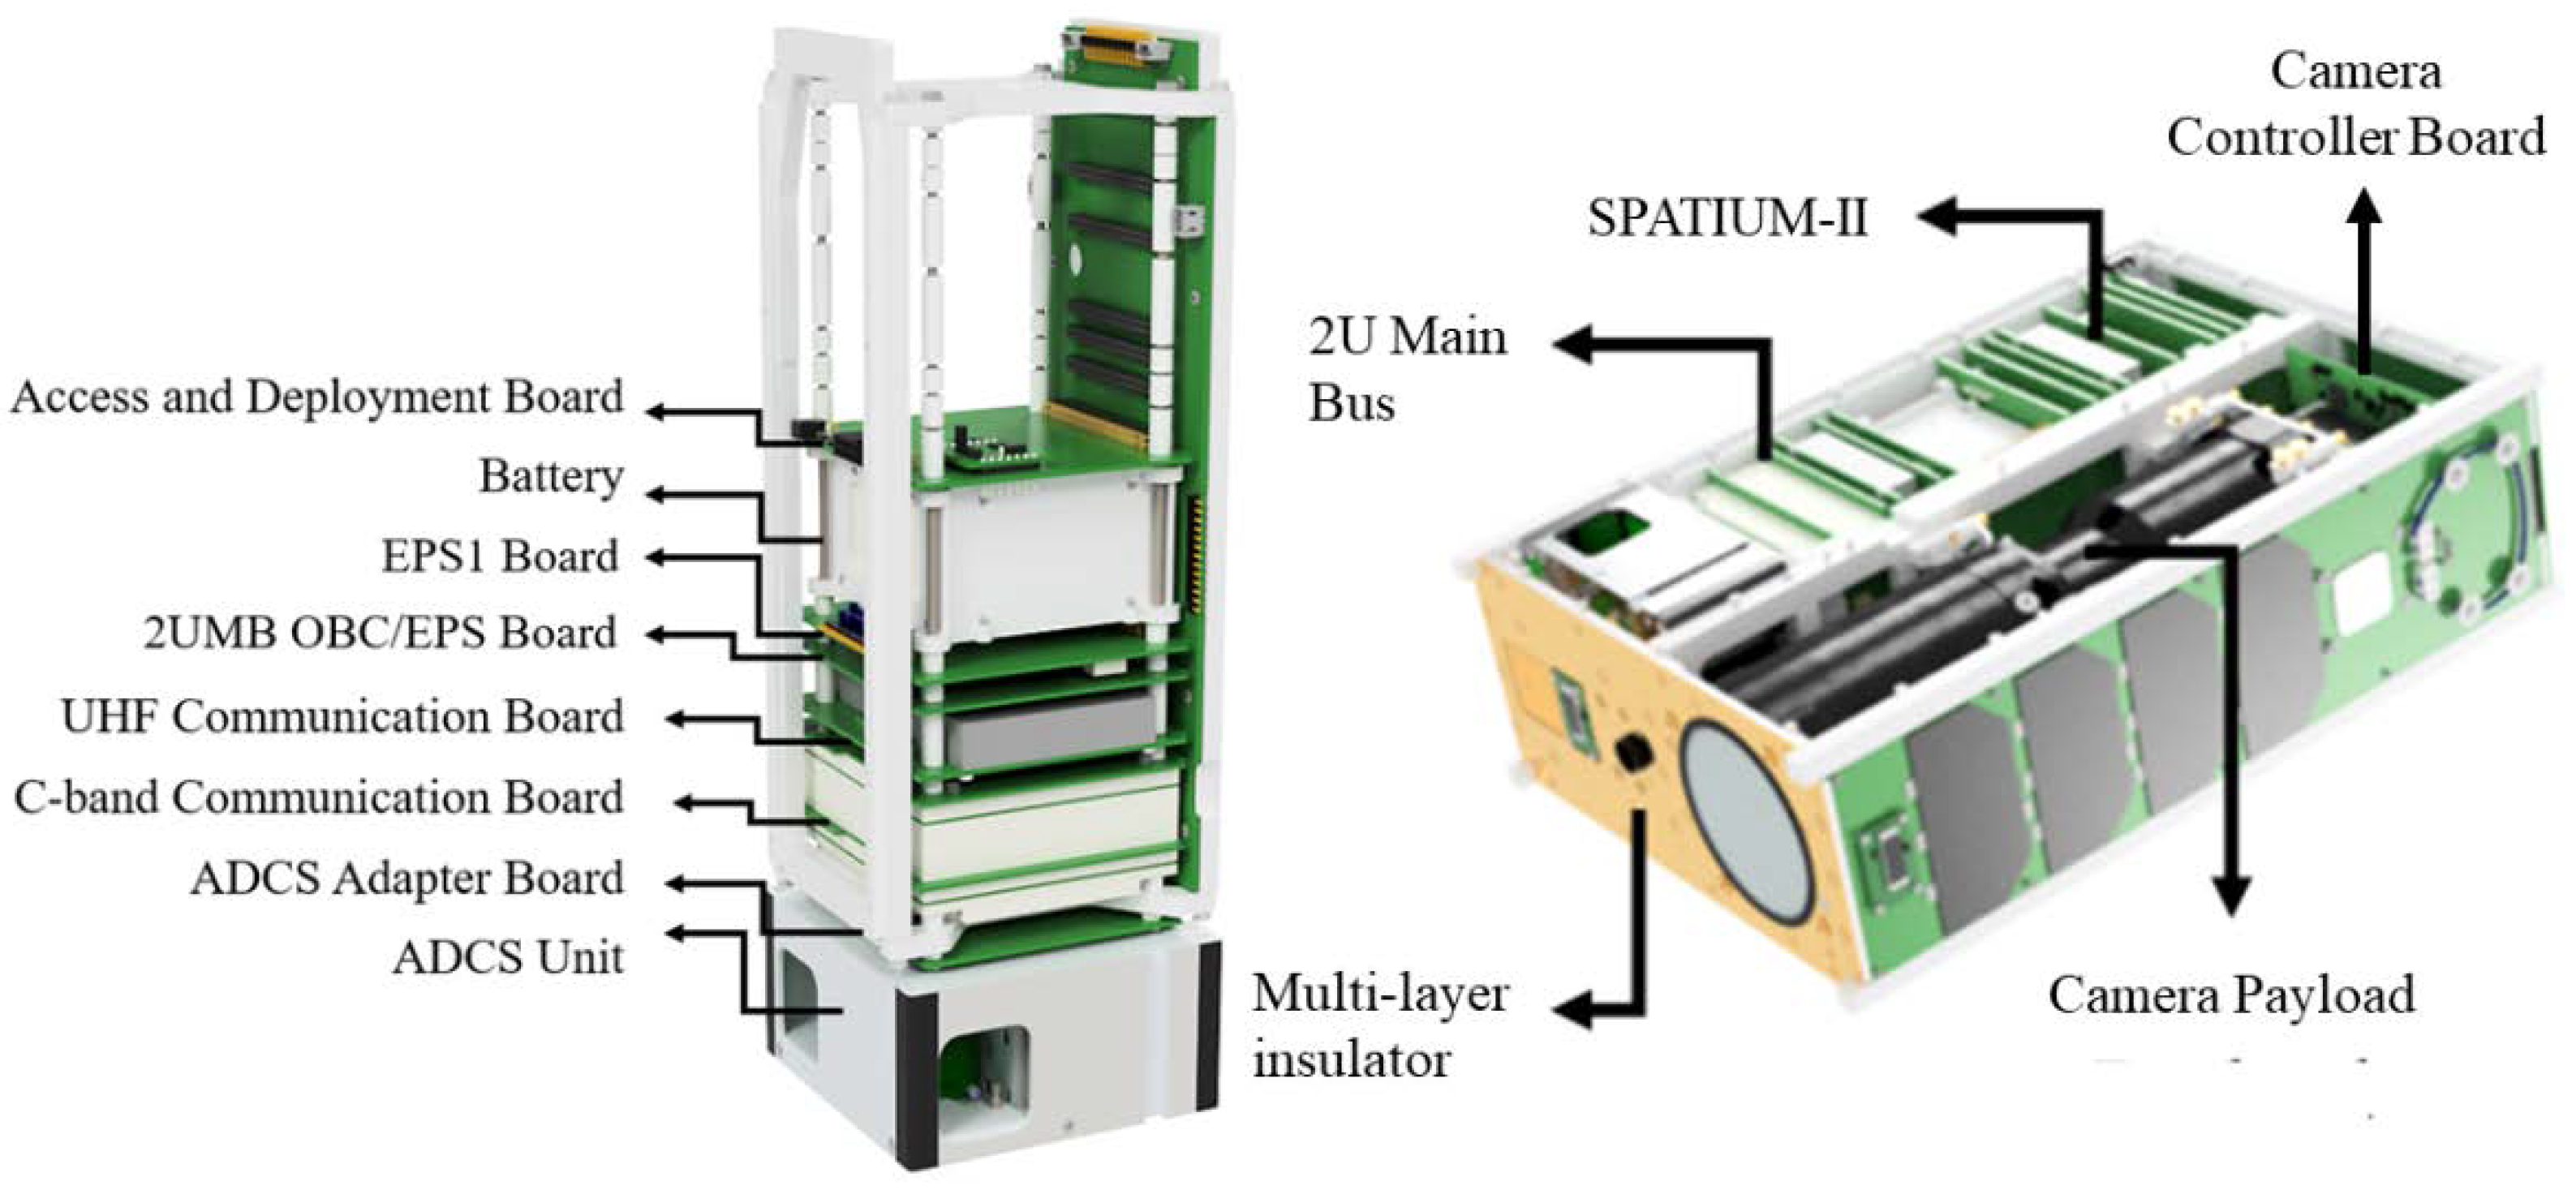
The KITSUNE CubeSat is designed using a 6U platform consisting of a 3U imaging payload, 2U main bus system, and 1U SPATIUM-2 (space precision atomic-clock timing utility mission). Four main objectives are introduced for the 2U main bus and 3U camera payload: (1) Earth observation with a 5-m-class resolution of visible images, (2) development of a 2U Kyutech standard bus system, (3) downlink of a low-resolution image from a secondary camera by C-band uplink, and (4) demonstration of C-band communication with the main and mobile ground station (GS). Each mission design is well-distributed among the collaborators. Harada Seiki engineers and the Kyutech camera team have focused on the imaging mission, while missions 3 and 4 are conducted by the Addnics engineer and Kyutech communication team.
The 2U main bus system is solely designed by the Kyutech team, which is adopted from the BIRDS project configuration [34]. Onboard computer (OBC), electrical power system (EPS), attitude determination and control system (ADCS), and communication boards (COM) are well-integrated by stacking horizontally on a backplane board (BPB) (Figure 1). This design reduces the number of harnesses where a point of failure might happen. The OBC has a redundant pair of PIC microcontrollers that act as the central command and data handling as well as communication for transmitting the beacon of the satellite. On the other hand, the EPS has a vital role in supplying sufficient power to the satellite. The primary EPS of KITSUNE has 34 solar cells attached to every solar panel board of each axis, except the -Z axis. Meanwhile, the secondary EPS is the rechargeable batteries that can provide a maximum of 14 W. An MAI-401 active control module is used for the ADCS. It is a commercial off-the-shelf (COTS) product that consists of reaction wheels and sun sensors, where the GPS and magnetometer are integrated into the other boards. The GPS is placed on the solar panel, and the magnetometer is connected 10 cm away from the ADCS module in order to avoid the electromagnetic noise generated by the reaction wheels. Two communication subsystems are installed in the KITSUNE satellite for uplink and downlink purposes. First, the C-band radio is mainly used for the camera payload to download the images to the Kyutech GS and the ADCS data during the image capturing. Secondly, an ultra-high-frequency (UHF) transceiver receives the uplink commands from the GS, downlinks the thumbnail images, and transmits the telemetry and continuous wave (CW) beacon. Nevertheless, the focus of this paper is only on the main mission, which is the camera payload and related main bus systems.
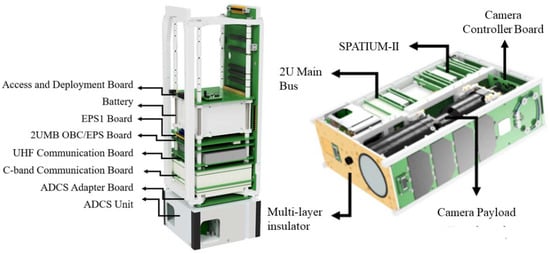
Figure 1.
KITSUNE 2U main bus system configuration (left) and the satellite overview with 3U imaging payload (right).
2.2. Mission and System Requirements
In the early stages of KITSUNE development, the idea is to capture artificial colorful patterns or characters within a 100 × 100 m2 space for entertainment and social purposes. The primary objective is to provide a 5-m-class resolution imaging service aligned with the mission statement. Wildfire detection is included as a secondary objective to increase the functionality of the imaging payload. Therefore, the following success criteria are generated to categorize the mission outcome: (1) minimal success with downlinking an out-of-focus image to the GS, (2) full success with capturing any letters or characters done by a group of people within a 100 × 100 m2 space, and (3) extra success of capturing images with 5-m-class resolution (<6 m/pixel) as well as correctly classifying wildfire images.
The payload system requirements are generated according to the mission statement and objectives in addition to the following 6U CubeSat limitations:
- The ground resolution should be <6 m/pixel in addition to the ground swath of approximately 20 km;
- The overall payload should be able to fit within a volume of 90.0 mm × 90.0 mm × 327.5 mm;
- The camera sensor should have a pixel size larger than 3.0 µm with a global shutter and a shutter speed of less than 1/3200 s. In addition, it should be able to capture six images in a row with approximately 1 frame per second;
- The camera controller board (CCB) should capture images and transfer over C-band communication for downlink when it is requested by uplink commands. This could be either in real-time mode or downlink mode over C-band flash memory for stored images;
- The camera sensor should capture RGB images with JPG compression (>90%) with correct colors;
- The power consumption of the overall mission should be less than 10.0 Wh per orbit, and the in-rush current should be less than the overcurrent protection settings of the EPS;
- The mission should be operated by the uplink commands both from UHF GS and C-band mobile GS. In addition, images and telemetry should be received by UHF GS and C-band main GS;
- The satellite should point the camera and C-band Tx antenna with approximately 0.25° accuracy in target and nadir pointing modes by using the ADCS subsystem;
- The electronics should survive a total ionization dose of approximately 200.0 Gy. In addition, they should be able to operate within the temperature range of −20.0 °C to +50.0 °C while the range of temperature difference should be between −5.0 °C to +5.0 °C for the lens components.
2.3. Hardware
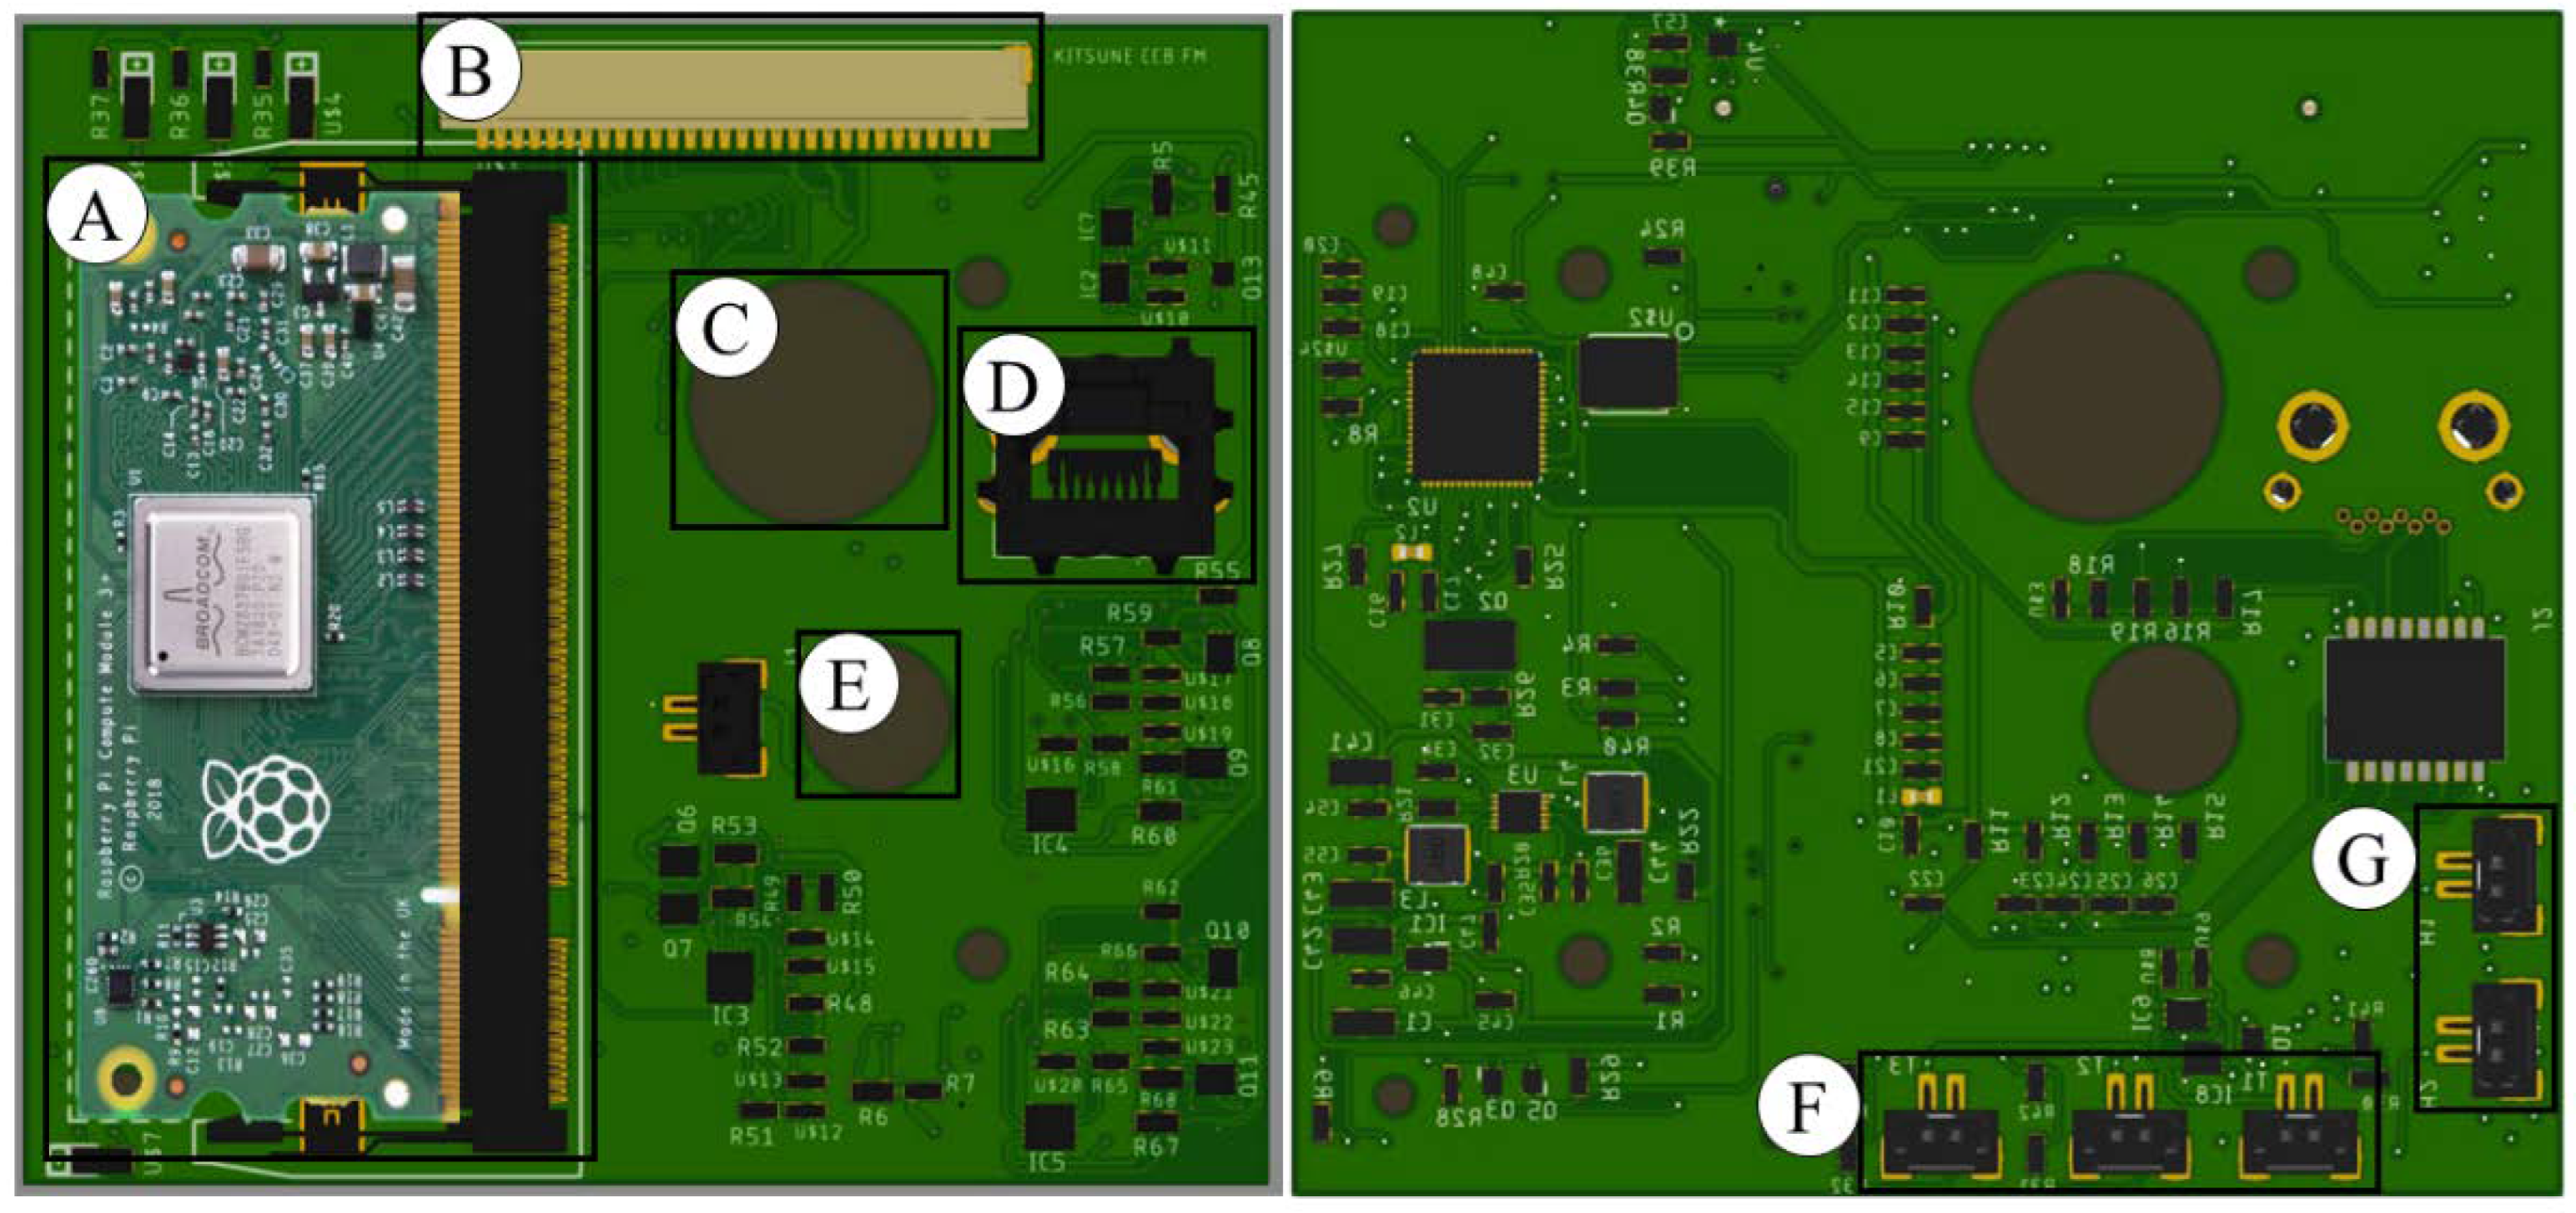
The 3U imaging payload is connected via a harness to the main bus system, which consists of three components: (1) camera controller board (CCB), (2) camera sensor (CAM), and (3) camera lens (Table 1). A COTS CMOS camera sensor with 31.4-megapixel (MP) resolution is controlled by Raspberry Pi Compute Module 3+ (RPi CM3+) attached to the CCB (Figure 2). The payload is enabled to capture a full resolution of 6464 × 4852 pixels through a 300-mm custom-made RICOH lens. These three components are based on the mission objectives and requirements. Therefore, several trade-off studies have been conducted before choosing the final components to achieve a 5-m resolution. The sensor pixels and lens focal length are the two critical parameters to determine the resolution of image output and field of view. The ground spatial distance (GSD) can be easily calculated using Equation (1):
where h is the altitude of the satellite, FOVH is the field of view for horizontal, and is the pixel number of the image sensor for horizontal.

Table 1.
Imaging payload properties.

Figure 2.
Camera Controller Board (CCB) design: (A) Raspberry Pi Compute Module 3+; (B) CCB-backplane board connector; (C) CCB-CAM sensor LAN cable hole; (D) RJ45 connector; (E) CCB-CAM sensor power cable hole; (F) temperature sensor connectors; (G) heater connectors.
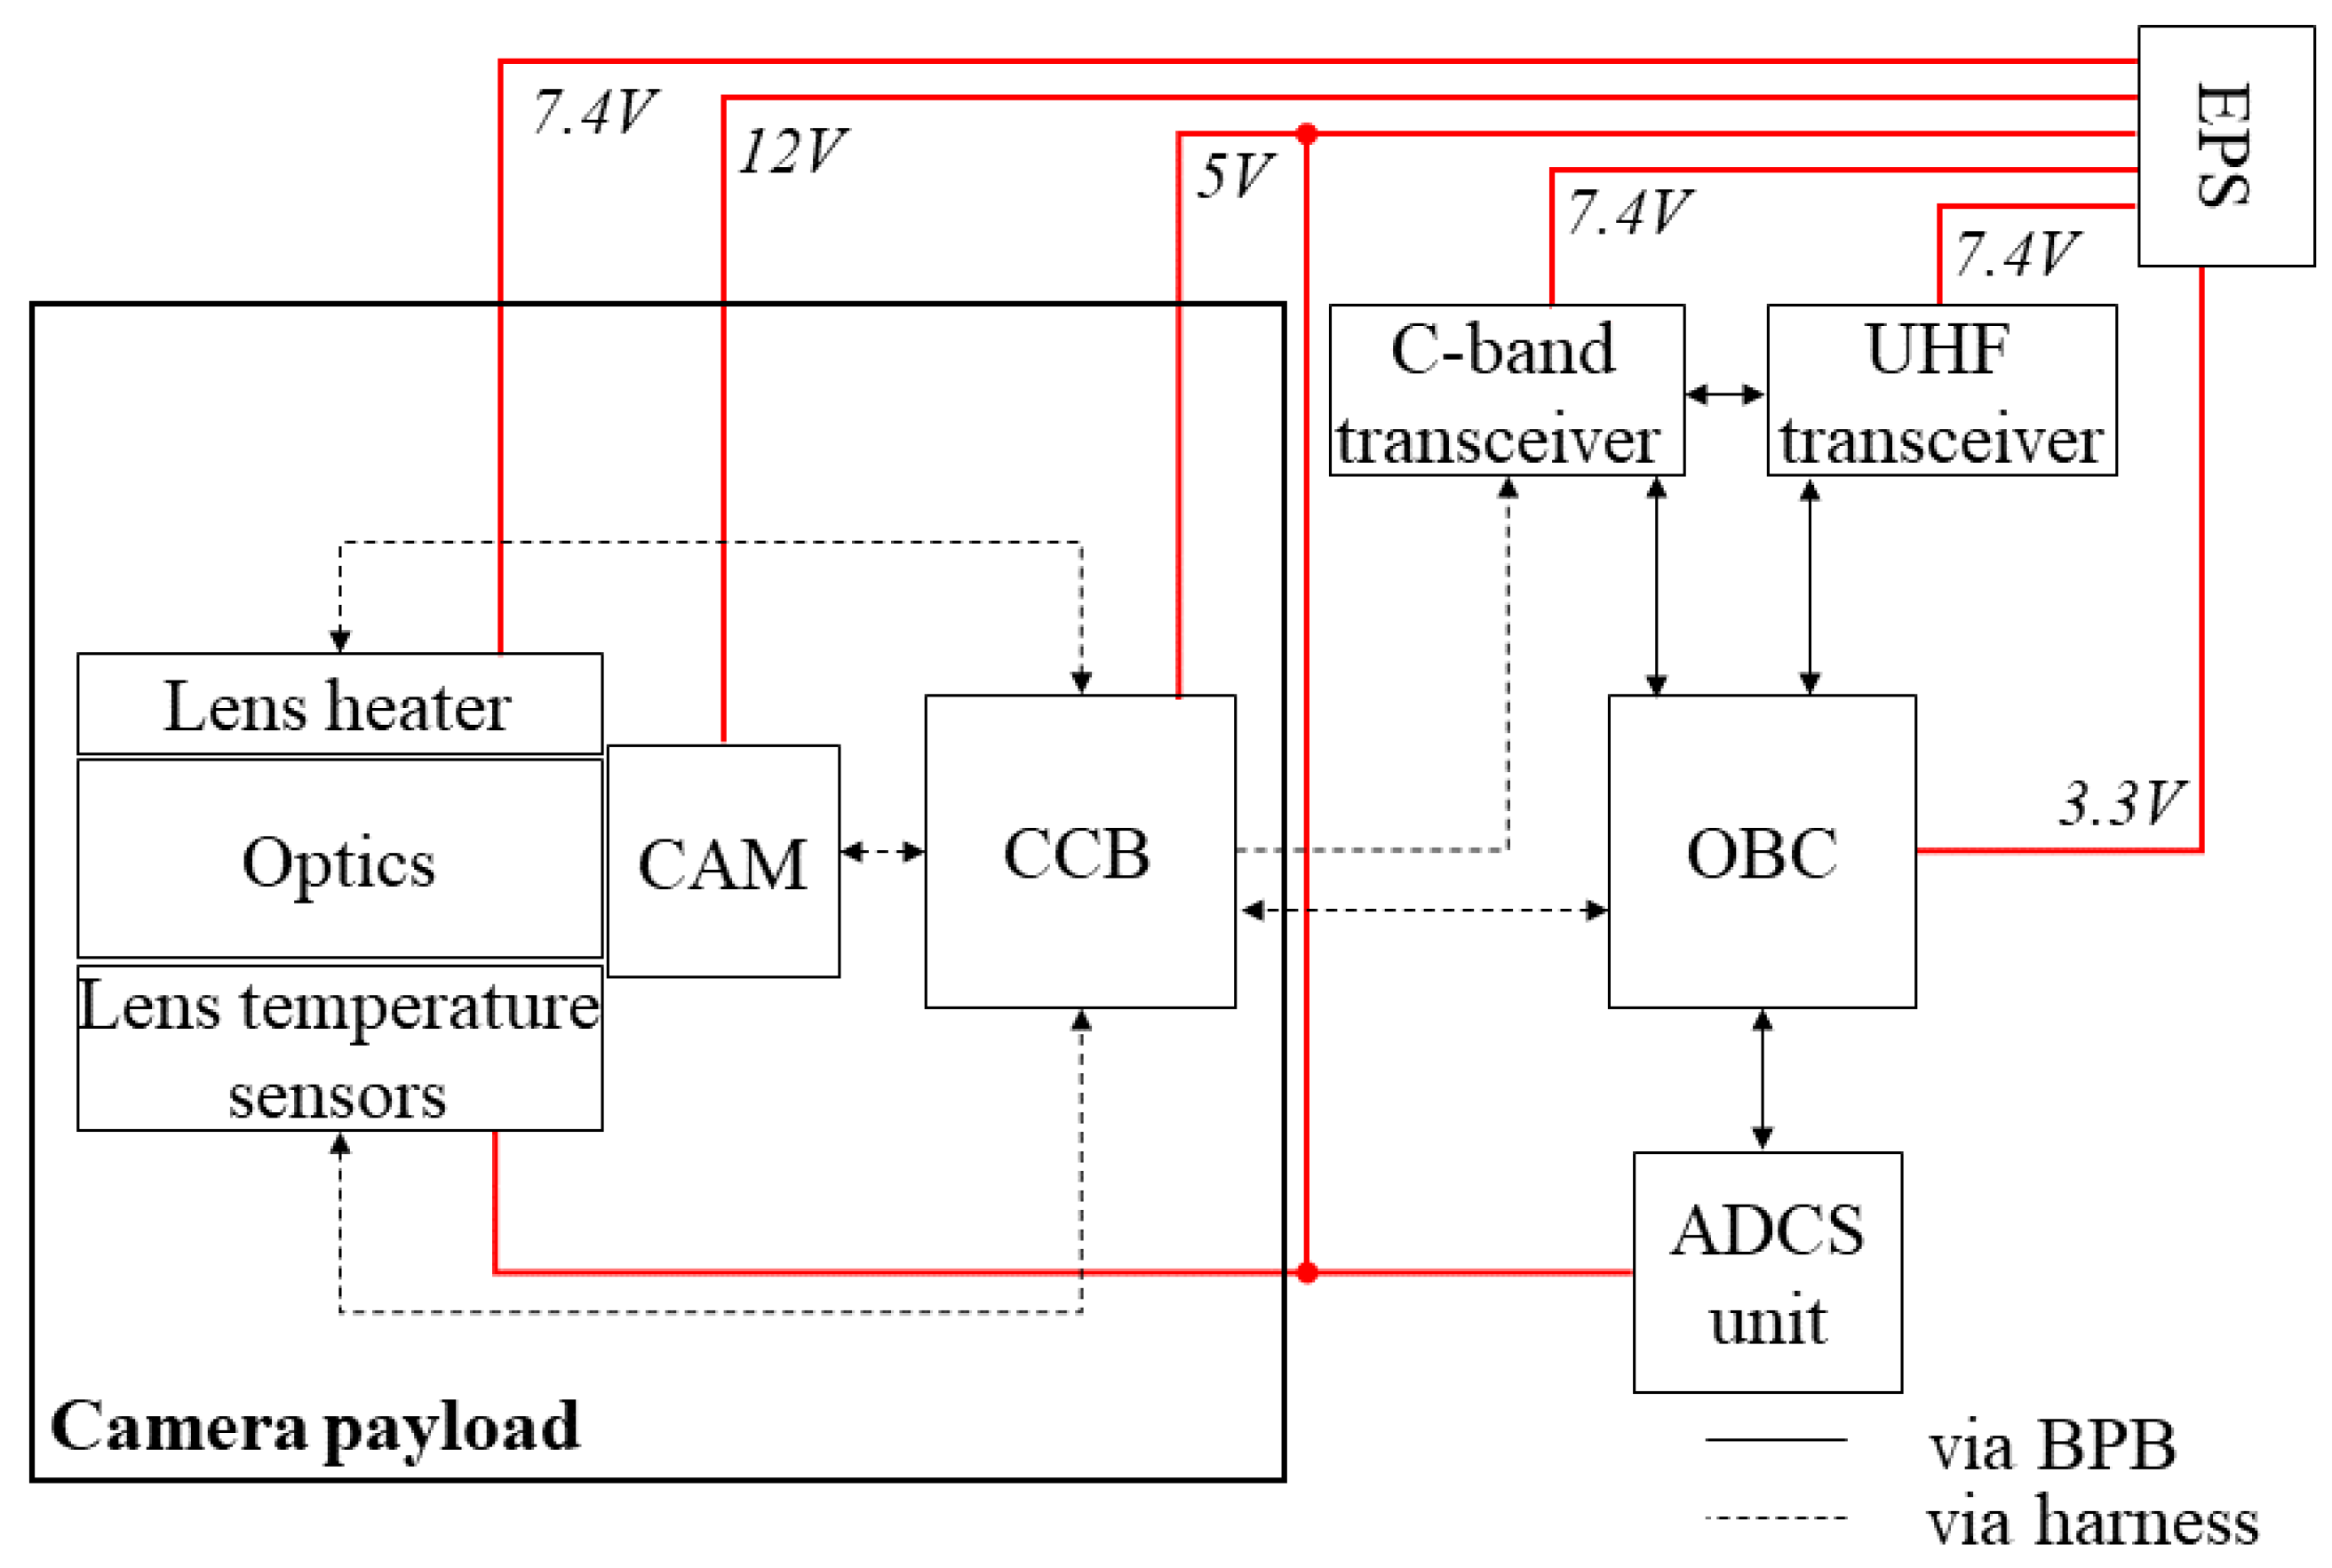
The payload is turned on only during mission execution from the uplink command. The activation is mainly controlled by the OBC, which provides the CAM parameters. As the payload system interfaces with each of the 2U main bus systems (Figure 3), the total energy consumed is the highest during downlink images through C-band communication, followed by camera mission execution. The detailed results are discussed thoroughly in Section 4.
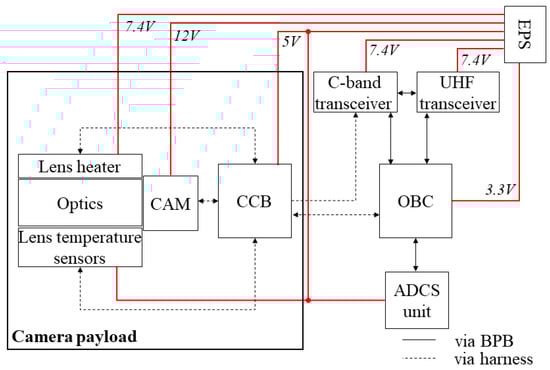
Figure 3.
KITSUNE main mission subsystems block diagram.
After the camera payload was selected, the thermal design was another essential task to maintain the internal temperature of KITSUNE CubeSat. It does not have an on-orbit focus adjustment function due to the difficulties of designing a system to endure the launch and space environment. The camera lenses and the associated image quality are susceptible to temperature variations. Therefore, the focal length under space conditions was calculated based on several thermal vacuum test results.
2.4. Software
2.4.1. Camera Controller Board
The RPi CM3+ on the CCB is where all the code scripts are written. It is installed with the GNU/Linux Ubuntu distribution version 18.04 operating system (OS) that is very compatible with the Application Programming Interface (API) of the CAM. C++ and Perl are used to communicate the RPi CM3+ with the CAM software and other subsystems (OBC and C-band). In addition, wildfire classification is executed using DL libraries. OpenCV version 4.4.0 and Tensorflow version 2.4.0 are installed in the RPi CM3+ to train the dataset and classify the input image based on a convolution neural network algorithm. The limited size of the random access memory (RAM) without graphics processing unit (GPU) of RPi CM3+ created a tight DL training process but may be possible by choosing the optimum CNN model and training parameters. A second option is to train the CNN algorithm using other computers or Colaboratory (Colab), generating a pre-trained model that can be used for classifying input images captured by the KITSUNE payload onboard the RPi CM3+. The classification step has no trouble running on RPi CM3+ as the process has lower computational costs than the training step. Finally, for KITSUNE, the second option is chosen to train the CNN model on Colab with more RAM and GPU availability.
The CAM software, DL libraries, CNN pre-trained models, and code scripts are installed and organized in dedicated directories for smooth execution. Forty-nine percent of the 32-GB embedded multi-media card (eMMC) has been consumed, and the rest is reserved for flight image data. The size of the pre-trained models is 200 MB, which uses less than 1% of the memory on the RPi CM3+; however, the DL libraries are significantly heavy and utilize most memory. An erase-flash-memory command is also implemented in case there is no available space. The free memory could survive for around four months without erasing the eMMC for an image captured daily. Hence, the mission operation will be carefully coordinated in order to avoid any losses of images captured by the payload.
The CAM codes are created based on the mission operation scenario. The entire mission case is an uplink capture command sent to the CubeSat in the first pass, the initial downlink command in the second pass, and the final downlink command in the third and following passes. The capturing command script worked to acquire six images in PNG (or JPG) file format with sensor parameters, such as resolution, gain, and exposure values. The full resolution of the payload is 6464 × 4852 pixels, while the gain and exposure values can be input manually or automatically. Finally, the initial downlink retrieved six thumbnails and selected one PNG (or JPG) image in the following downlink satellite passes.
The camera payload consists of two modes: target pointing and nadir pointing. The first mode is where the coordinates and time are provided from the orbital parameters of the CubeSat. The GS monitors the latitude and longitude of the satellite while the time is generated from the GPS onboard. Meanwhile, the nadir pointing is time-sensitive only. Therefore, both modes require a degree of high accuracy from the ADCS to point the payload to face Earth. After the photo was captured, KITSUNE would have the option to classify image data onboard or directly downlink to the GS. The DL algorithm can be executed by choosing these three CNN models: ShallowNet, LeNet, and MiniVGGNet. The classified result will be appended to the image. On the other hand, the downlink options are real-time and from the buffer memory. The real-time option is conducted through C-band communication. However, the second option has two possibilities: either C-band or UHF communication. Due to the limited speed of UHF (4800 bps), the thumbnail images are saved in the buffer memory of the transceiver before the mission downlink. Thus, it creates the feasibility of retrieving the images in a pass-time window. The high-quality images in PNG format are planned to be downloaded via the C-band transceiver. Overall, the capturing process is illustrated in Figure 4 until the image data analysis takes place at the GS.
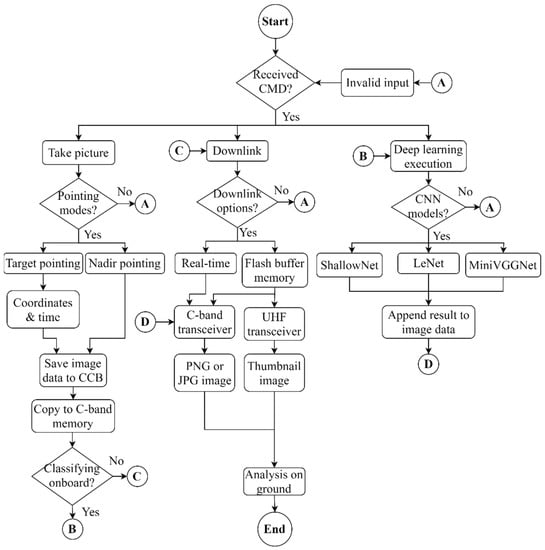
Figure 4.
Camera mission with deep-learning execution flowchart.
2.4.2. Ground Station Software
The KITSUNE GS software is created and tested before the satellite is launched. The input of the uplink command to the CubeSat, particularly for taking pictures and DL execution commands are included in the GUI. The operator can use manual (default) or scheduled modes. Both modes are required to send three uplink commands: take a picture, execute DL, and downlink image data. The scheduled mode has the advantage of sending the commands within one satellite pass, while the manual mode has two options: to directly downlink the image data or go through the DL algorithm in the next pass. The reasons are to create flexibility for the operator and to avoid any undesired impact on the primary mission of KITSUNE.
In addition, the picture-taking command is executed at random (default) or targeting wildfire images. Capturing a random image is a more straightforward option to apply (nadir pointing), while the coordinates and time are strictly required in the uplink command for taking a wildfire image (target pointing). A complete image will be downloaded and analyzed thoroughly at the GS if the image is correctly classified as a wildfire from the downlink data result. In the end, the number of those images that are positively predicted is recorded and evaluated to show the effectiveness of applying an onboard DL algorithm while counting how much of the downlink communication load it can reduce.
3. Methods
3.1. Wildfire Image Classification
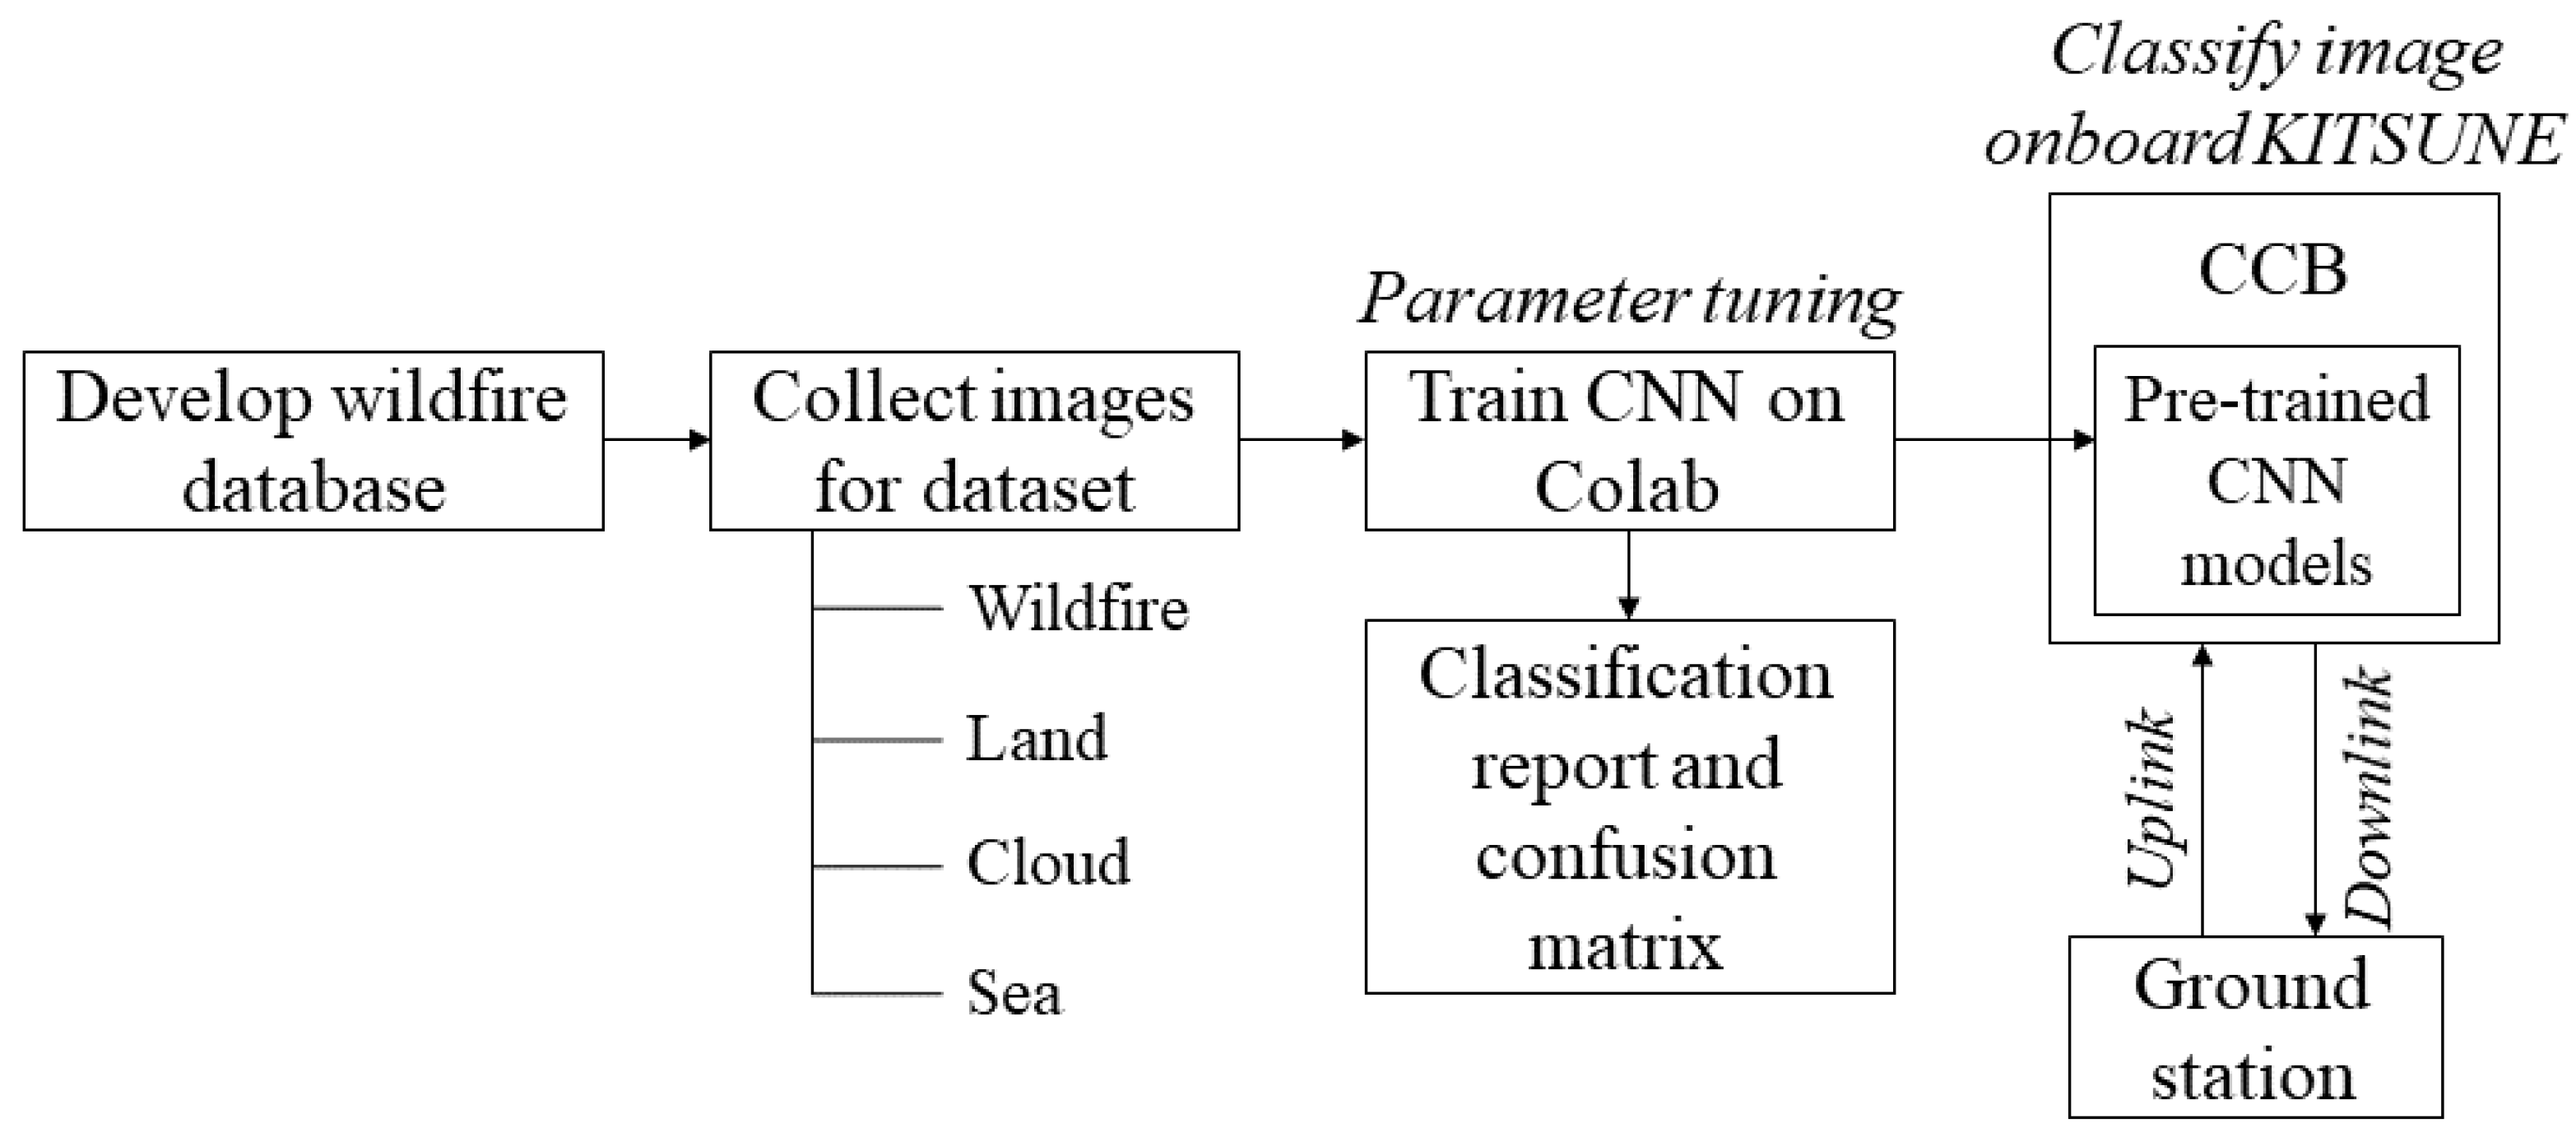
A comprehensive study has been conducted to collect 715 wildfire cases between 2010 and 2020 around the globe. The sources were from the news, research papers, and fire department reports (British Columbia wildfire service website and Cal Fire website). Several incidents have complete reports, which were very helpful to generate a wildfire database. The database consists of dates, locations, a geographic coordinate system, burned areas, causes, suppression costs, and casualties. It also refers to and compares with other databases, such as Monitoring Trends in Burn Severity (MTBS), the National Interagency Fire Center (NIFC), the Global Fire Emissions Database (GFED), the Fire-CCI dataset, and the TERN AusCover dataset [35,36,37]. The differences and limitations were the burned area size and the designated locations. In this study, the fire sizes collected worldwide are more than 0.05 km2, classified based on National Wildfire Coordinating Group (NWCG) values. The wildfire database development is the beginning of the study method, as illustrated in Figure 5.
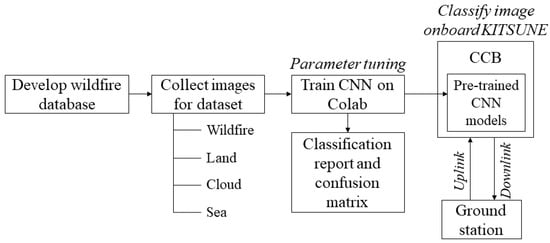
Figure 5.
Flowchart of the study methods.
Satellite imagery data were then retrieved following the previously created wildfire database information. Doves (3-m resolution), Sentinel-2 (10-m resolution), Landsat-8 (30-m resolution), and MODIS (250-m resolution) data have been chosen to be downloaded through the Sentinel Hub EO browser and Planet Explorer using free registered as well as the Education and Research Standard (PlanetScope) accounts, respectively. Having multi-resolution data creates a robust dataset of the DL training afterward. Generally, a CubeSat imaging payload is within the chosen resolution, and the KITSUNE payload also falls within the selected resolution range. Moreover, previous studies have utilized multispectral bands for wildfire detection applications [28,38,39]. However, in this study, only the visible 3-band (RGB) spectral resolution was retrieved from satellite imagery to generate the dataset. This was due to the consistency with the spectral resolution installed for the KITSUNE camera sensor and, eventually, eased the training process of the DL algorithm.
A DL algorithm can be created after the satellite imagery dataset has been collected. Four labels of the dataset were manually organized: (1) wildfire, (2) land, (3) cloud, and (4) sea. Each label consisted of a thousand images. The convolution neural network (CNN) parameters are set in the training script, which runs in Colab, generating the pre-trained model in the ‘.hdf5’ file, classification report, and confusion matrix. Several parameters have been tuned extensively: (1) input pixel, (2) data augmentation, (3) CNN models, (4) optimizers, and (5) learning rate. Then, the dataset was divided into training and testing, 75% and 25%, respectively. The labels were pre-processed to 100 × 100 pixels (128 and 224 pixels for comparison) before training using the CNN networks. Multiple combinations of variables were tested, including type of optimizer (SGD and Adam), learning rate (0.005 and 0.05), and data augmentation (rotate, zoom, shift, and flip). Three models: (1) ShallowNet, (2) LeNet, and (3) MiniVGGNet were chosen, based on the evaluation metrics, to complement the classification results as well as the limitation of executing on the RPi CM3+ platform. The performance of a classification model depended on the number of correct and incorrect predictions. True positive (TP) referred to pixels assigned as the target object in both ground truth and detection results. If pixels were identified as the target object in prediction only and not in the ground truth, they are called false positives (FP). False negatives (FN) and true negatives (TN) are vice versa from the FP and TP, respectively. These four parameters are essential for illustrating the confusion matrix and calculating the performance. Accuracy (A), precision (P), recall (R), and F1 score were the evaluation metrics that have been commonly used to thoroughly analyze networks. The formula is shown in Equations (2)–(5), accordingly.
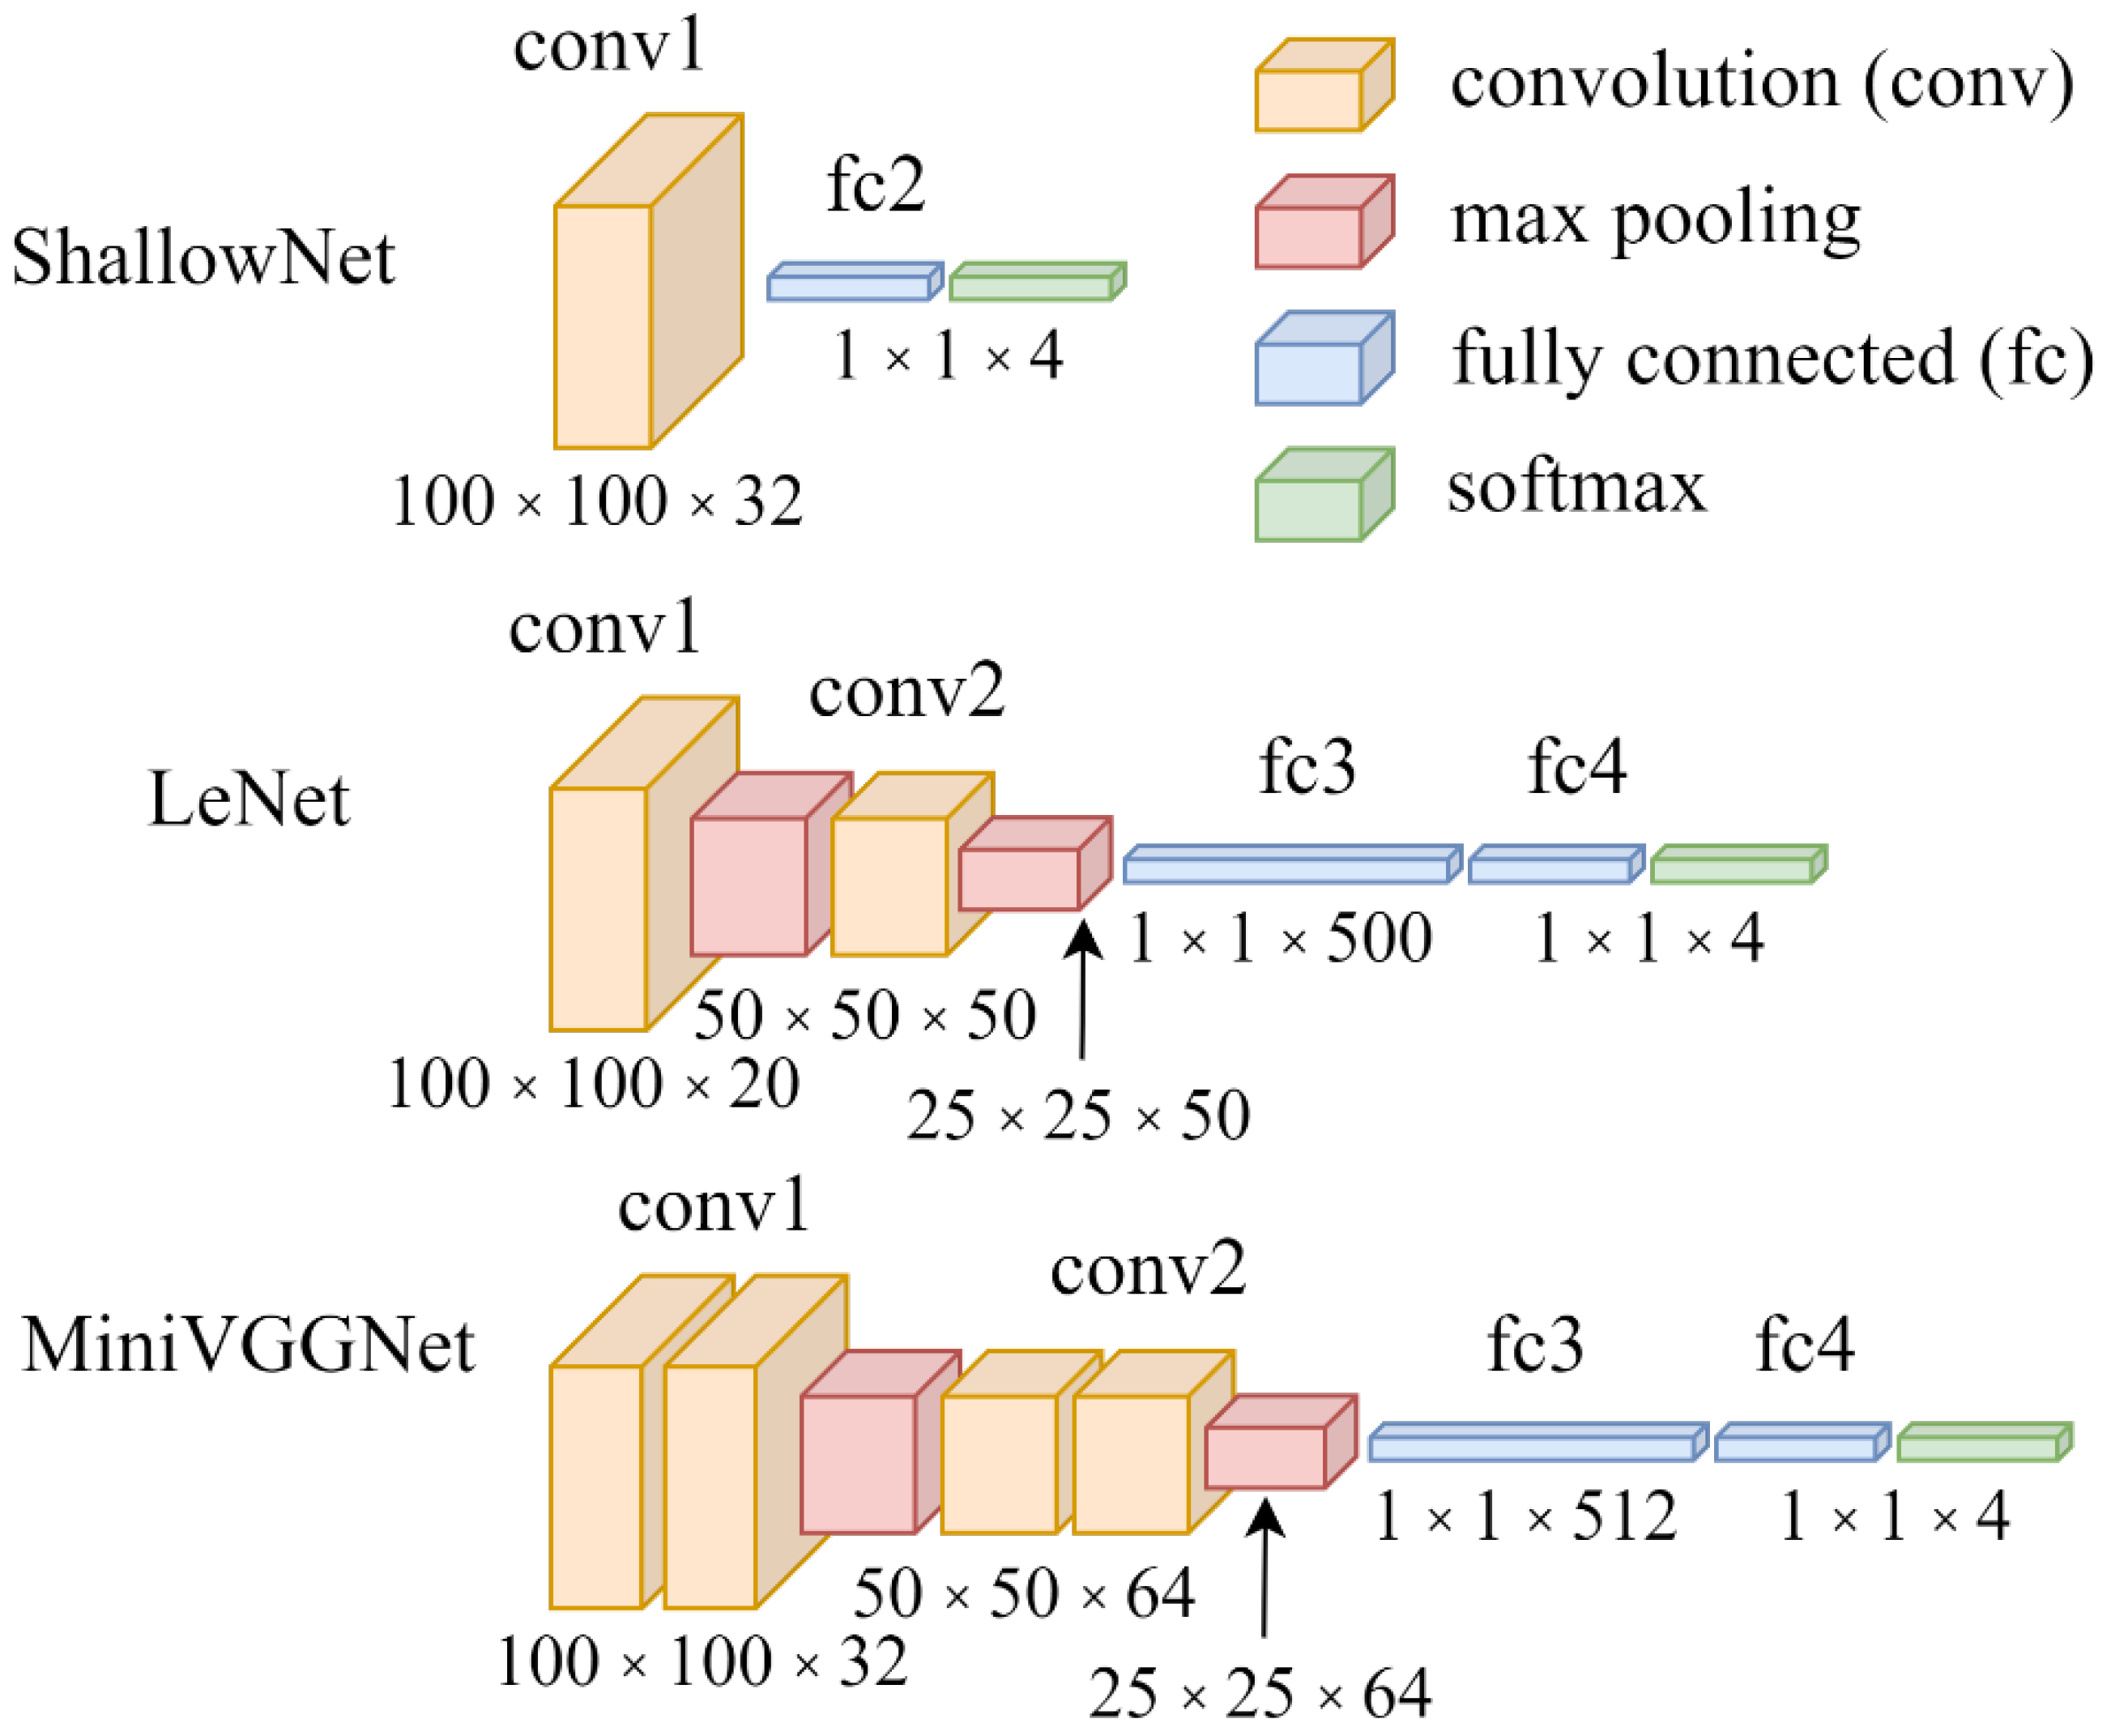
The CNN models consist of three different architectures with distinctive hidden layers: ShallowNet, LeNet, and MiniVGGNet (Figure 6) [40]. ShallowNet has one hidden layer (conv1), while the other two have two layers (conv1 and conv2). MiniVGGNet was convoluted twice in each hidden layer compared to only once with LeNet. The fully connected (fc) function was commonly applied with the softmax classifier, which will directly output the input if it was positive; otherwise, it will output to zero. In addition, batch normalization and dropout have also been implemented in the MiniVGGNet network. Hence, they help reduce the effects of overfitting and ultimately increase classification accuracy. Finally, these networks are classified into four outputs: cloud, land, sea, and wildfire.
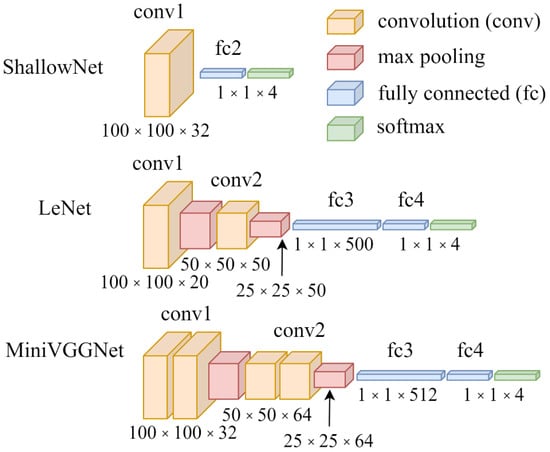
Figure 6.
ShallowNet, LeNet, and MiniVGGNet model architecture design.
3.2. Functional Test
In the satellite system, a functional test (FT) was performed to verify each subsystem’s communications and interfaces, including the payload. Functional testing of pre-, during, and post-environmental testing was advisable to conduct in the same way as the mission plan of satellite operation in orbit. The FT was carried out on the ground during the space environment and long-duration operation tests (LDOT). The camera mission with DL execution is discussed in Section 4.
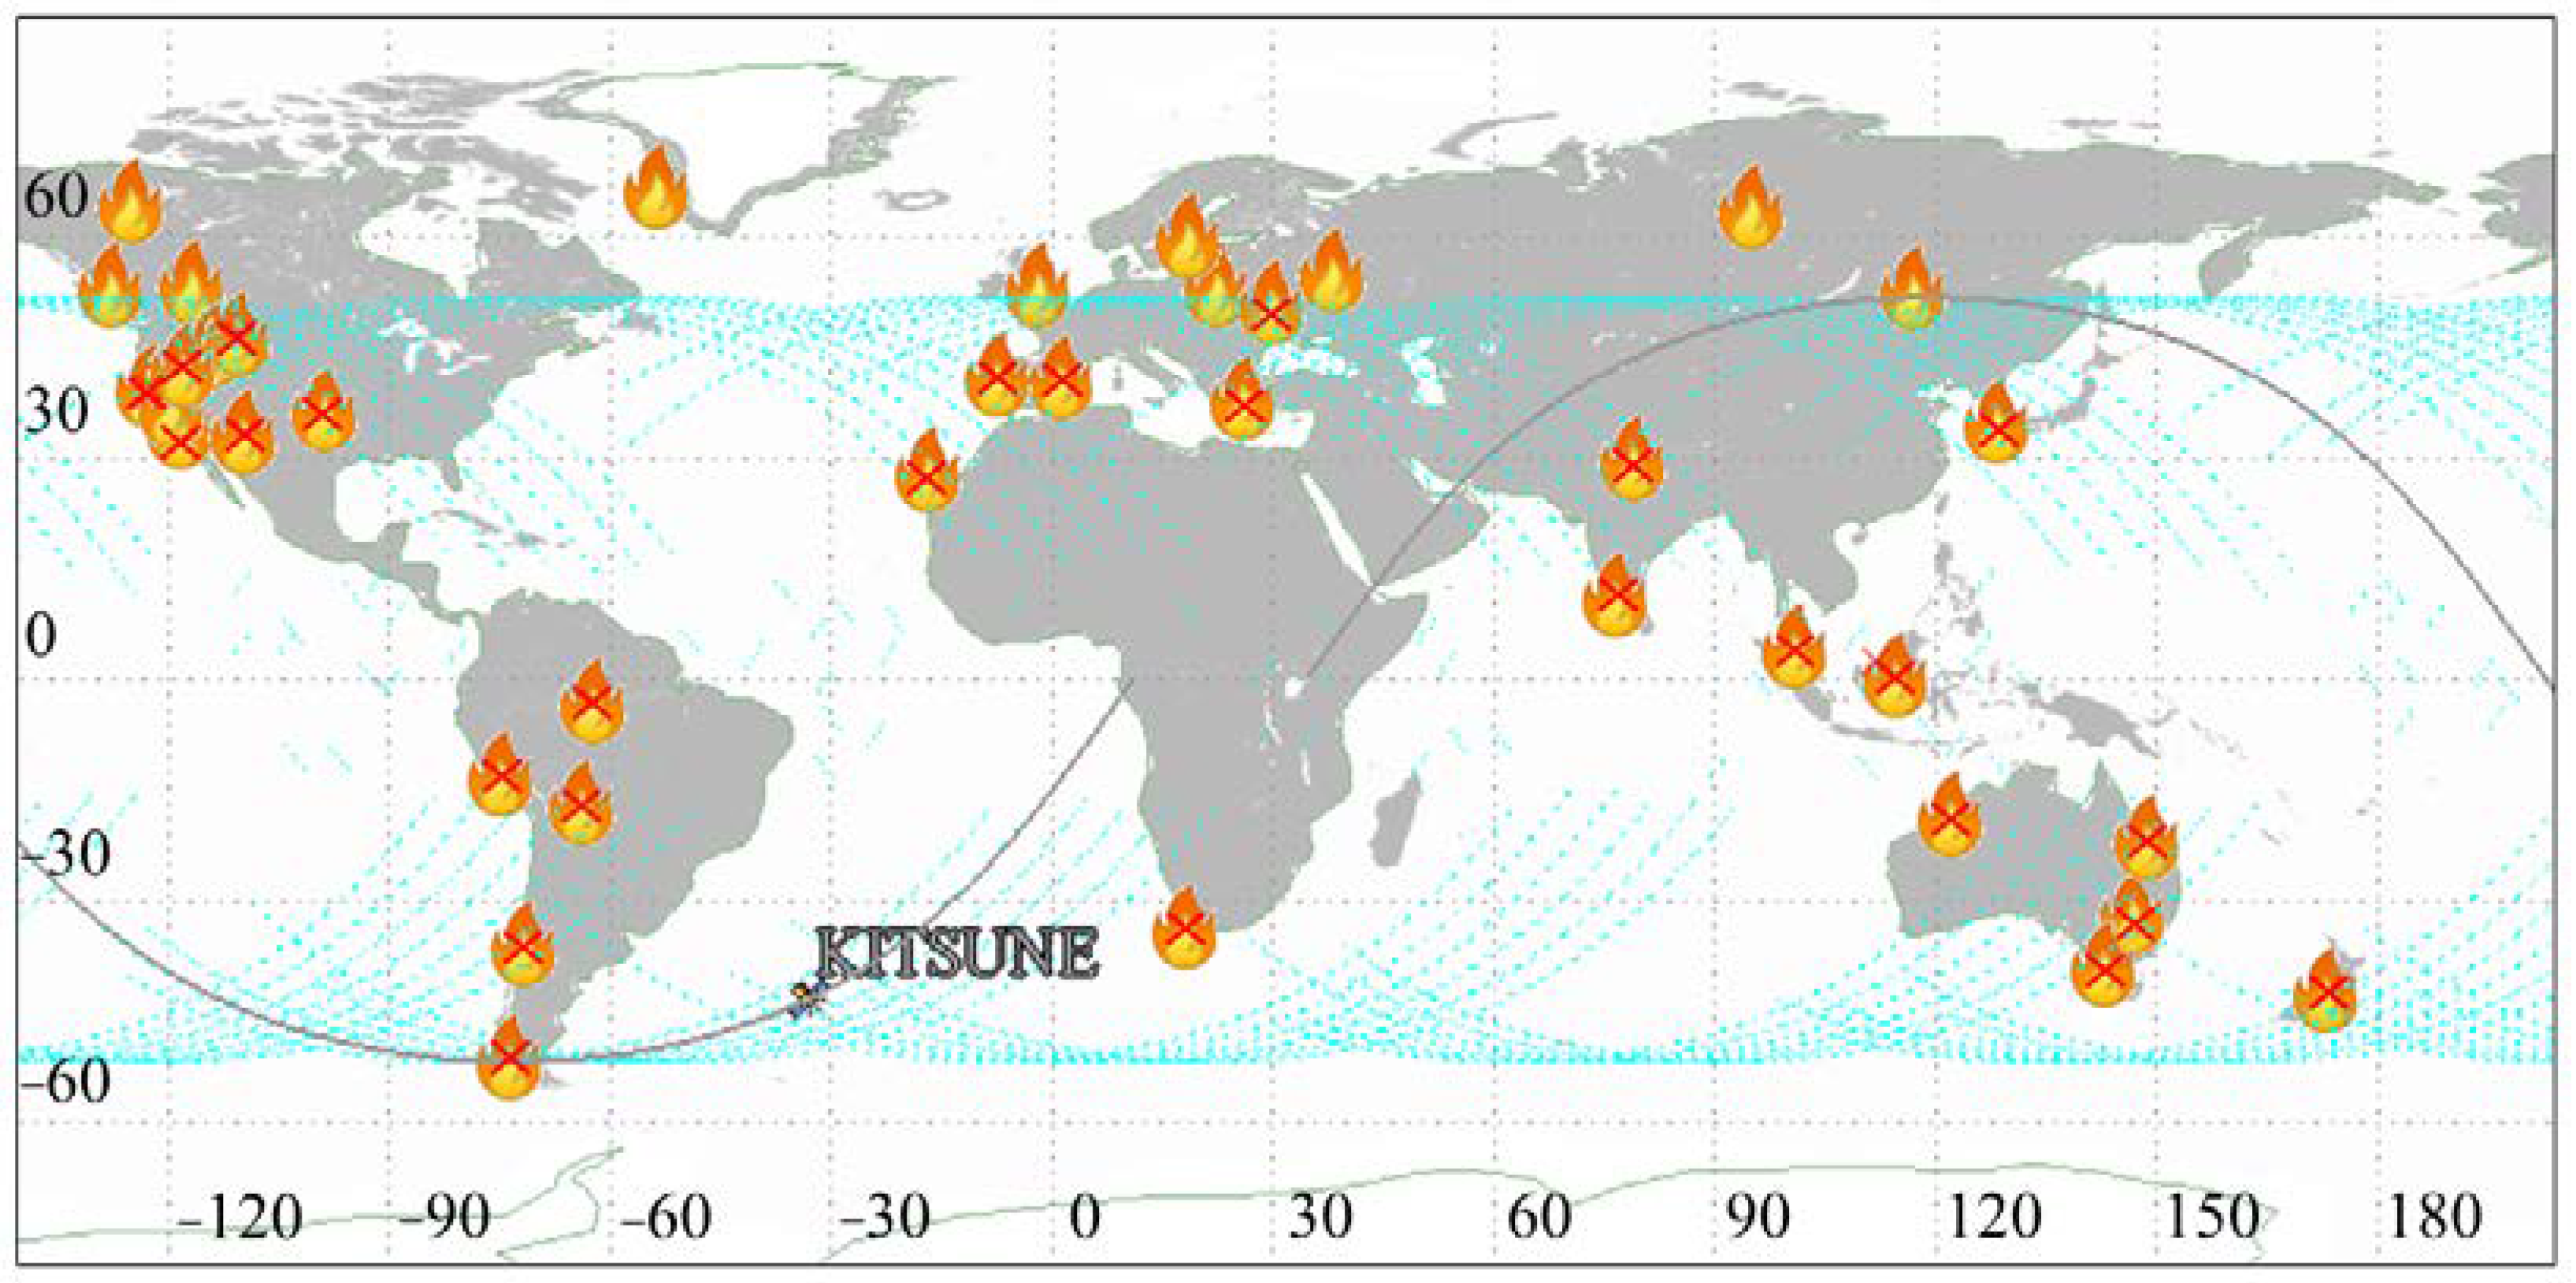
As mentioned in Section 2, wildfire detection was an extra mission in the KITSUNE operation. The DL algorithm shall be executed only from an uplink command after camera mission execution. Any images captured by the payload have the option to downlink immediately or through the classification method. The image recognition result will be appended to the image data, not affecting the main mission. On the GS side, the satellite operator can classify the image using only one model or all three networks. This gives flexibility for the GS operator to determine which algorithm was well-suited to the image captured by the payload. Moreover, KITSUNE will execute the ShallowNet model in any captured images in an early demonstration of wildfire detection due to its very low computational memory yet high accuracy. Later, the CubeSat can be planned to take any wildfire events from a dedicated coordinate based on the news source. However, several places were identified as having the highest possibility for wildfire occurrence, namely, California (USA), British Columbia (Canada), New South Wales and Victoria (Australia), Sarawak (Malaysia), and Kalimantan (Indonesia). Utilizing STK software, the prediction of KITSUNE passing these locations was simulated based on the International Space Station (ISS) orbit (Figure 7). The blue dashed lines with red x’s are the area covered by KITSUNE orbit between January and March 2022. However, British Columbia will be discarded from the prediction operation plan due to no passes towards the location in the designed orbit.
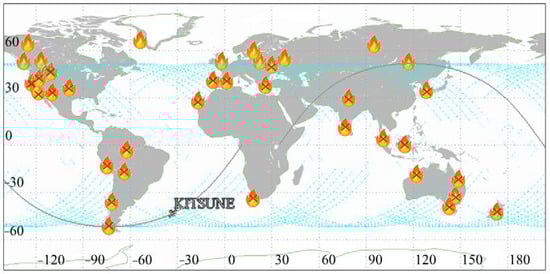
Figure 7.
Satellite track (blue dotted lines) of KITSUNE between January and March 2022.
4. Results
4.1. Total Ionizing Dose (TID) Radiation Test
The total ionizing dose (TID) radiation test was conducted at the unit system level before any other space environment test, such as a thermal vacuum test (TVT). The primary objective of the test was to show that the RPi CM3+ stays operational and that the interfaces were stable in radiated environments. The central processing unit (CPU) of BCM2837B0 and embedded multimedia card (eMMC) are the main components that need to be observed by running the ‘flash test’ script. The secondary objective was to prove that the DL algorithm (training and classification tests) can be executed, and the last objective was to measure the power consumption during the TID test. The RPi CM3+ was exposed to a radiation source of Co-60 in the chamber facility. Six hours of the test were equivalent to 200 Gy of radiation simulated for two years in orbit. Similar tests were also carried out by Toumbas [41] on RPi CM3 and by Slater et al. [42] on Jetson Nano GPU. The differences between the test in this study and that in the study by Toumbas [41] were the type of radiation source and the amount of radiated energy.
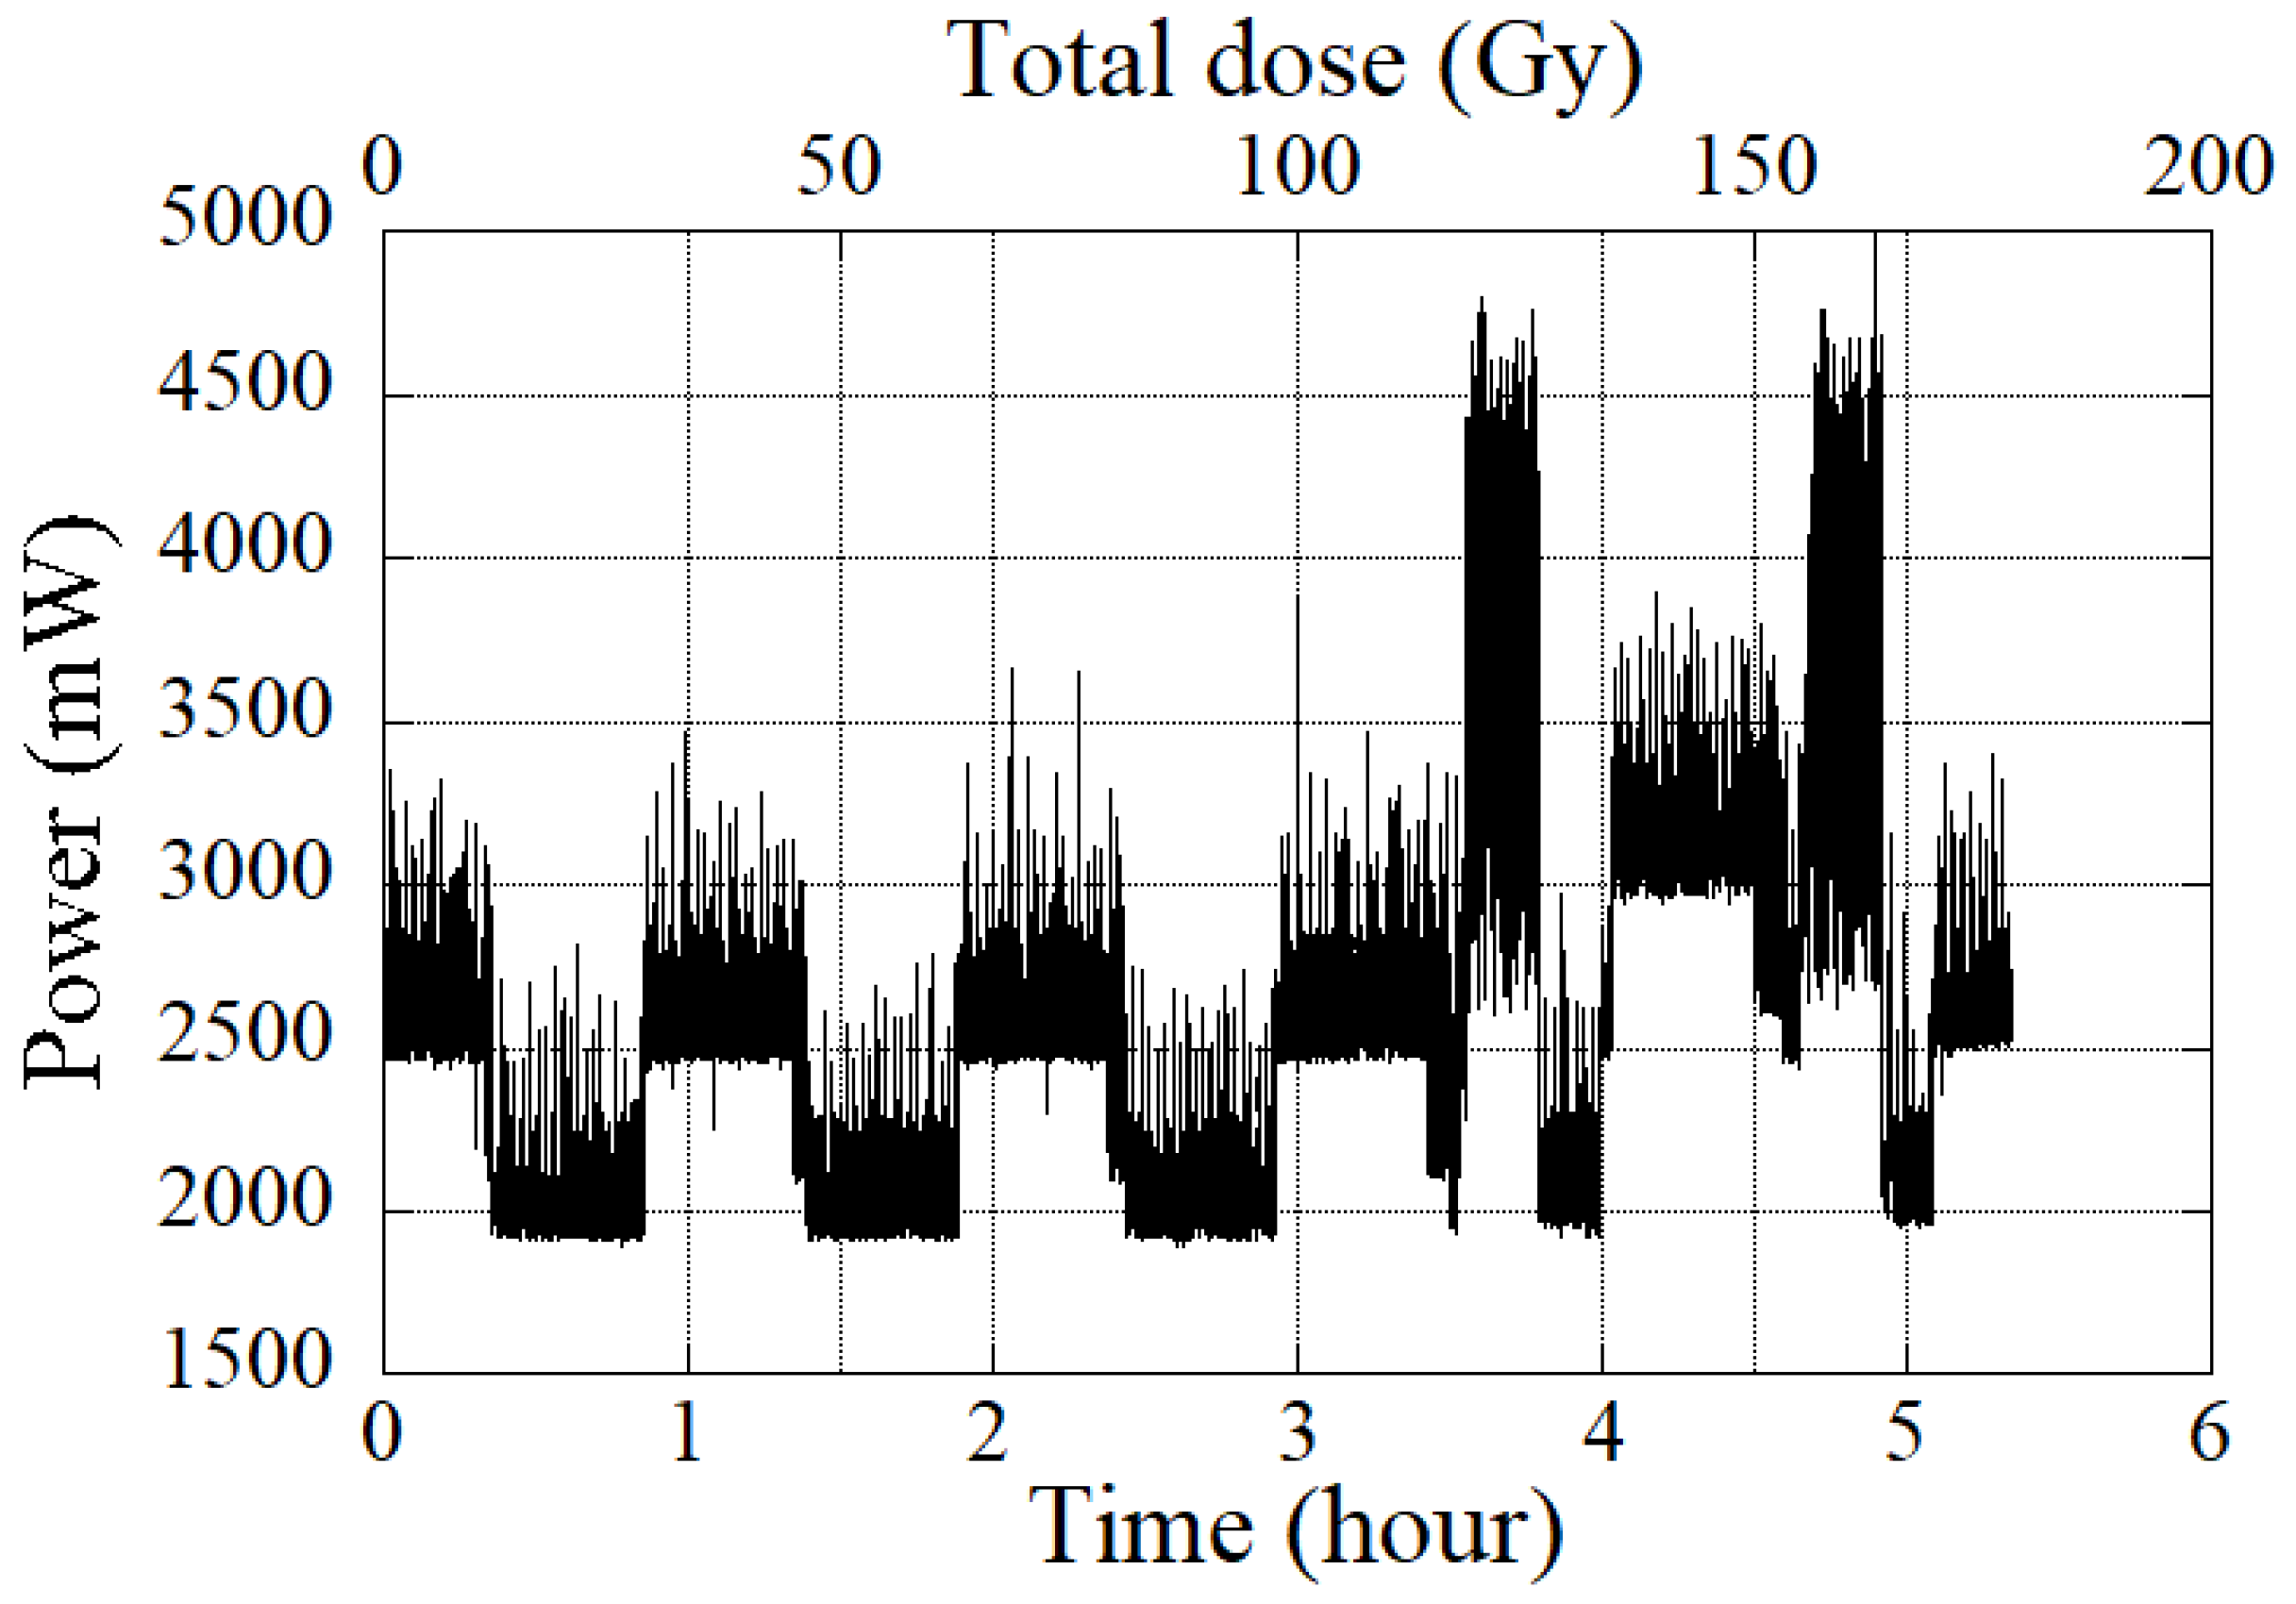
The first objective was verified using a pseudo-random number generator. A known seed was used to generate files with uniformly dispersed byte values. Each file was seeded differently, resulting in unique files. This way, the same test can be run multiple times and create identical test files each time. During the TID test, a total of 75 files were generated and compared with the equal number of files previously created in the computer. Later, each generated file was hashed using the sha256 algorithm. This hash function had the virtue of returning a 256-bit-long result that was significantly different, even with only a single bit of difference. Additionally, hash collisions between separate files were improbable, and none have been documented so far for the sha256 algorithm. Each file was generated in about two minutes using RPi CM3+. After generating a collection of 15 files, a 30-min delay was added. The reason for this was to manually execute the DL algorithm. On the following day, the hashes were compared between the reference test (before the TID test), the actual test, and the post-functionality test using RPi CM3+. The results showed that no discrepancies were discovered for every 75 files. It verified that the eMMC on RPi CM3+ could stay operationally stable for two years in orbit. However, several anomalies were observed on the CPU of RPi CM3+. Overall, the flash test code was run five times and twice for the DL algorithms (training and classification tests) with a second of time sampling. Based on Figure 8, the RPi CM3+ consumed extra power without executing any code that started right before the execution of flash test5 (at 4 h). The issues were recovered after running the DL training test2 (at 4 h 55 min) and rebooting the RPi CM3+ at the end of the TID test. It showed that a single event latch-up occurred at the time of 133 Gy being exposed to the test article.
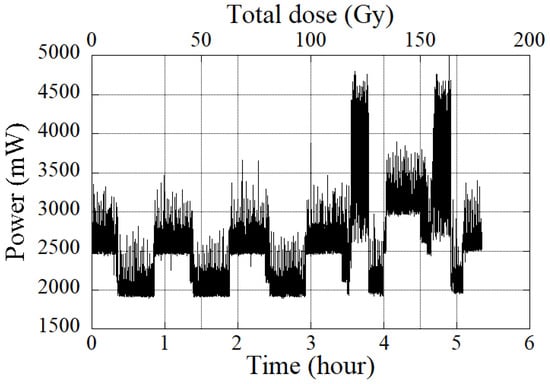
Figure 8.
Power consumption of Raspberry Pi Compute Module 3+ during radiation test.
4.2. Thermal Vacuum Test (TVT)
The thermal vacuum test was focused on simulating the satellite operation in space conditions, the worst hot and cold in a vacuum environment. Two main objectives were verifying the functionality of the camera payload and the feasibility of running the classification algorithm at the satellite system level. The external solar panel board of KITSUNE experienced two thermal cycles between −30 and +50 degrees Celsius, which, based on the BIRDS project [34] and ISO 19683 Space systems—design qualification and acceptance tests of small spacecraft and units. Overall, both objectives met the mission requirements without anomalies observed during TVT.
4.3. Long-Duration Operation Test (LDOT)
The third important step after the space environment test was the long-duration operation test (LDOT). The main objective was to validate the software design of the camera payload. Every mission scenario was executed with multiple parameter combinations: number of images, image format, exposure time, gain, and compression quality. Several days were spent running the LDOT, finding software bugs, and resolving them. The critical point of this test was to calculate the exact timing of mission execution. For instance, the camera sensor needs enough time to copy the image data into the flash memory of CCB before cutting off the power line. Due to the limited speed of the LAN chip used (10 Mbps), the mission command had to be sent ahead of time from the OBC. That was also to guarantee that the image was captured by the camera at the targeted location. Moreover, the power consumption during the LDOT was observed and plotted, simulating four passes of KITSUNE in space (Table 2). The satellite was connected to a power supply where it was programmed for charging and discharging conditions to precisely verify the mission feasibility. Finally, the test was only monitored thoroughly using the GS setup in the cleanroom, with the serial cable connected to KITSUNE for any debugging issues.
Table 2.
Summary of mission execution in four passes during the long duration operation test (“+” means turn on and “−” means turn off).
A complete main camera mission was tested in four passes. The first pass was when the camera payload captured six photos at the desired time and coordinates. Before the sensor was turned on, the ADCS was set to nadir (or target) pointing mode an hour ahead. The 12-V power line was designated for the camera sensor, and CCB used the 5-V line. The result of the overall energy consumption during the first pass was recorded at 2.90 Wh for 1400 s. In addition to this pass, the CCB was programmed to convert PNG images into JPG format files and autonomously generate thumbnails. The mission plan was to downlink the thumbnails via UHF communication first before deciding to retrieve the complete targeted PNG/JPG image data through the C-band.
The thumbnails and JPG images were downloaded in the second pass through UHF and C-band communications. The unregulated power1 (for UHF) and unregulated power2 (for C-band) were mainly used and consumed 2.81 Wh. The thumbnails were retrieved and selected first before downlinking the corresponding JPG image via the C-band. Later, high-quality PNG image data was downloaded in the third pass. In summary, the complete mission from capturing six PNG photos to downlinking them through the UHF and the C-band took three satellite passes, including several margins, as shown in the LDOT result in Table 2.
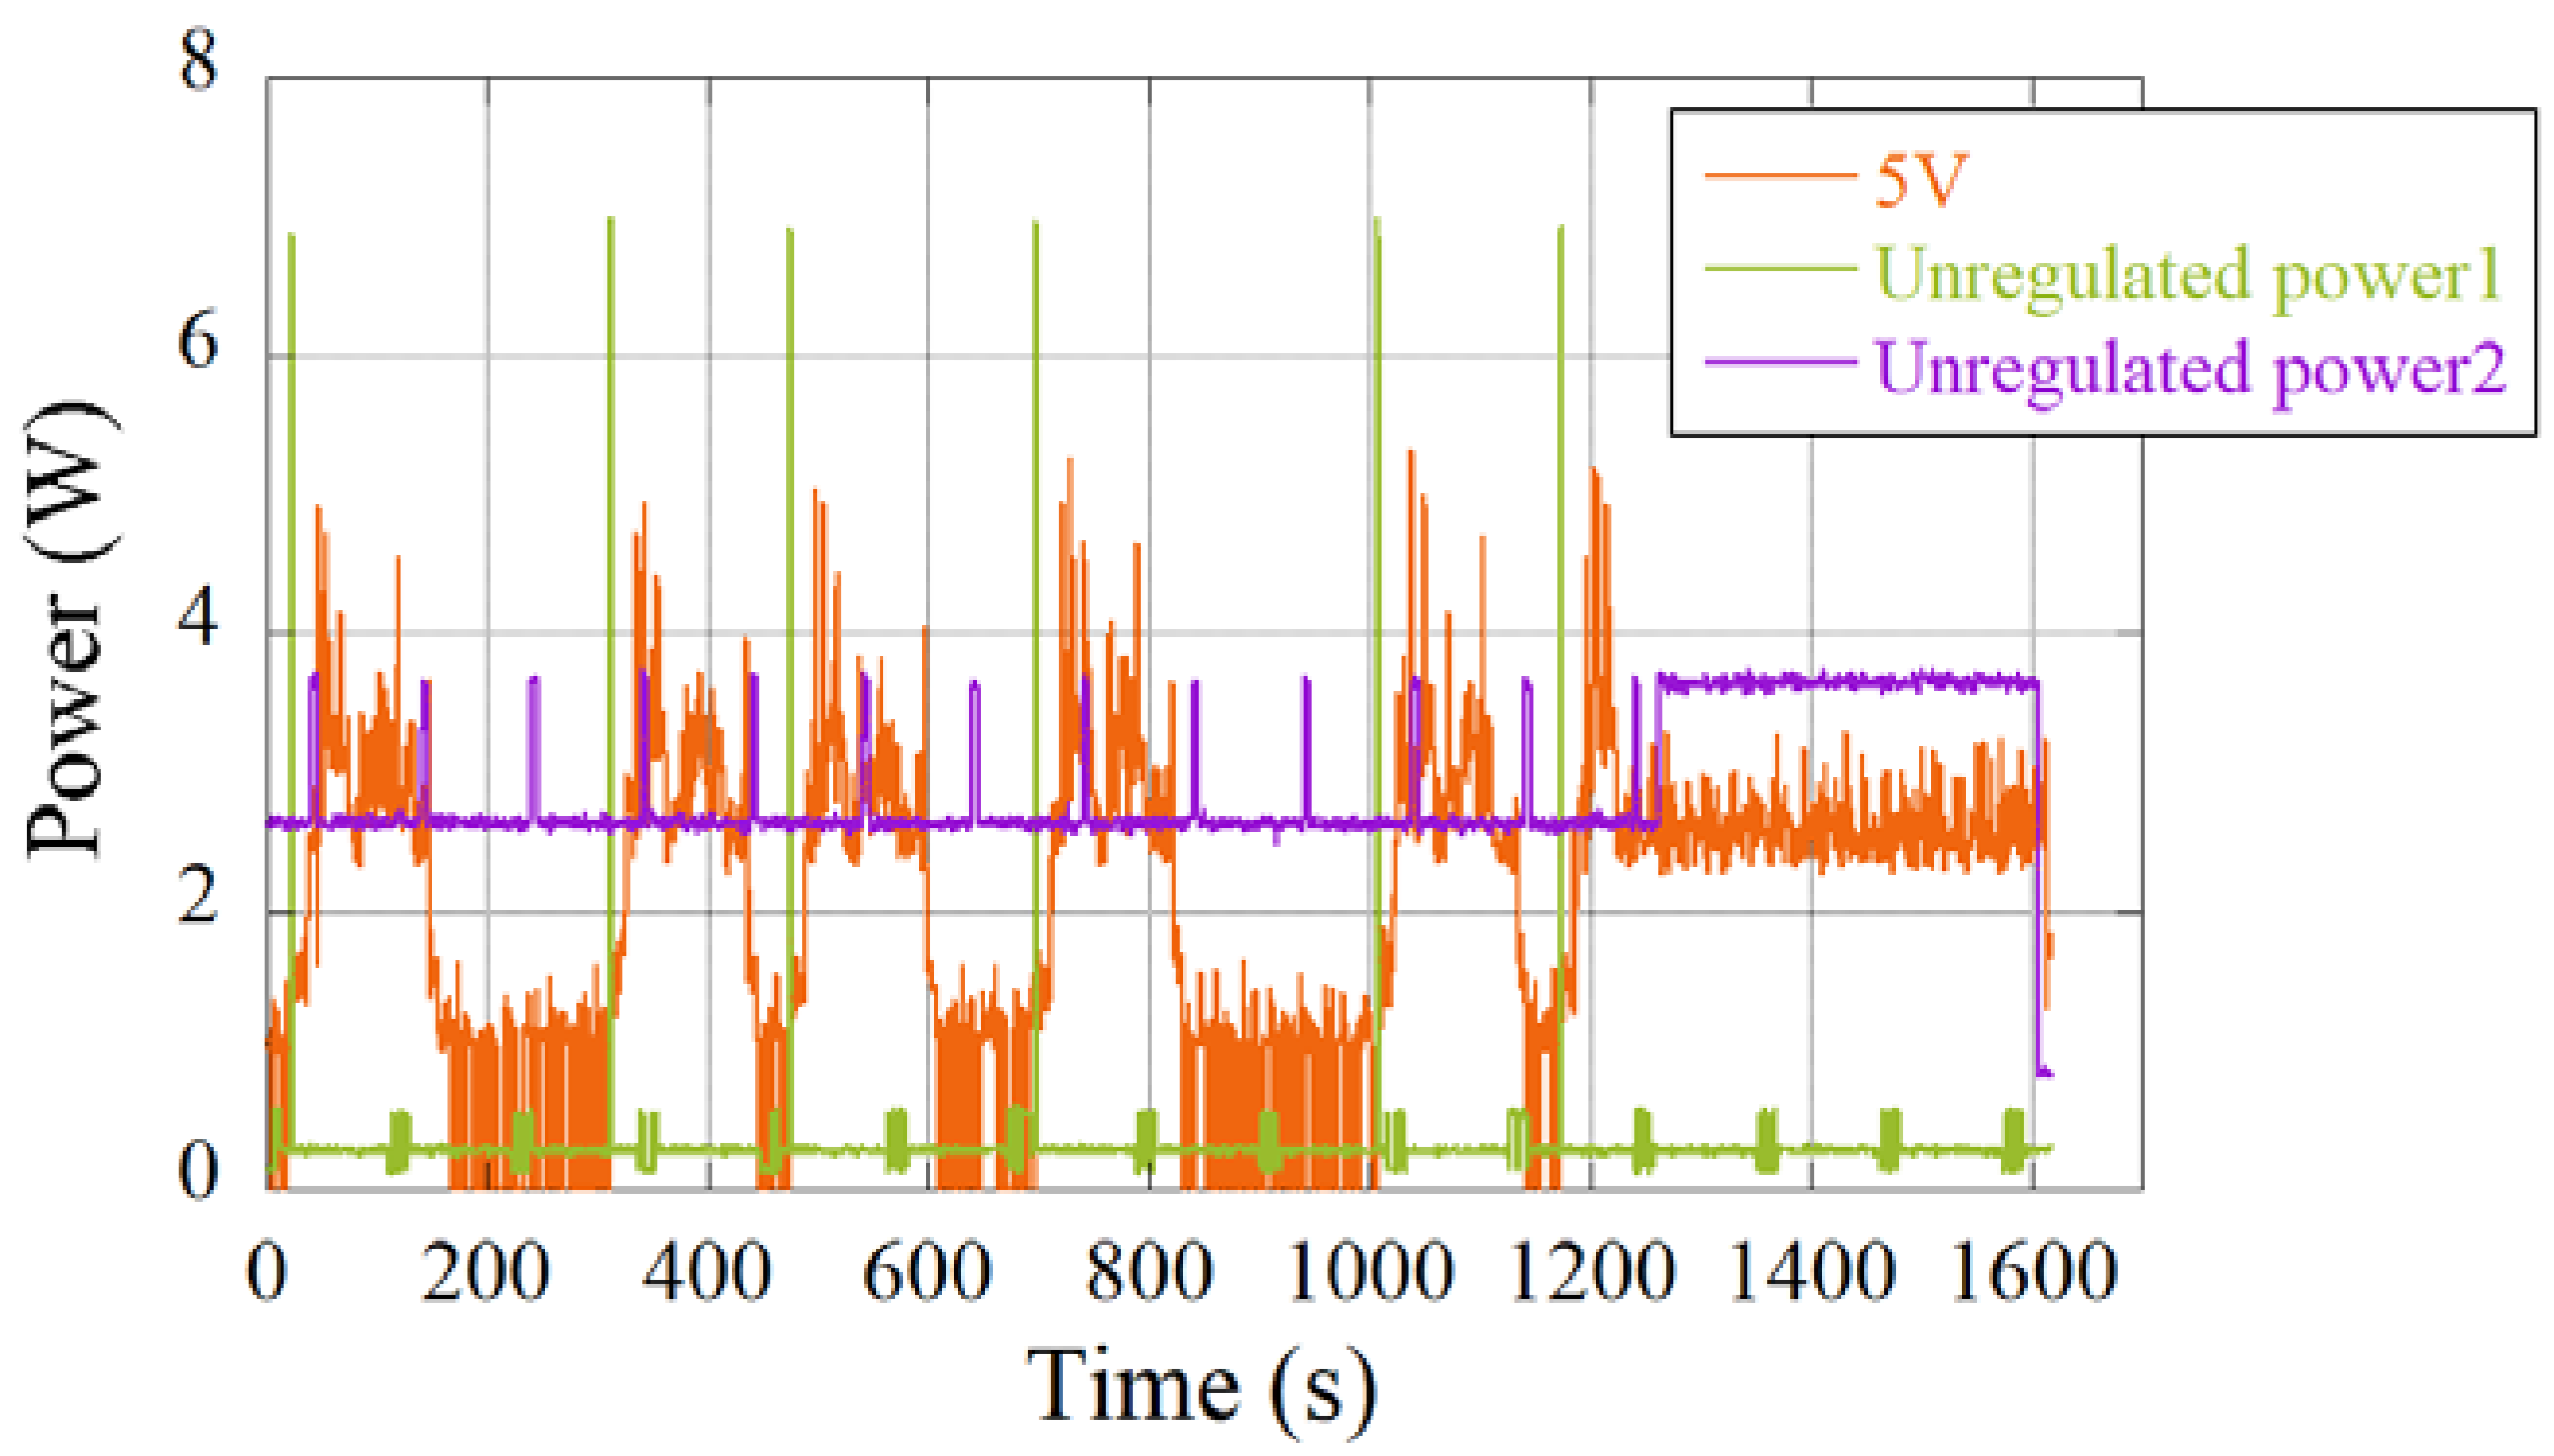
At the final pass of the LDOT, the DL algorithm for wildfire classification was tested. Three pre-trained CNN models have been used onboard KITSUNE: ShallowNet, LeNet, and MiniVGGNet. The objective was to identify which models are applicable and to correctly classify the images captured by the payload. A complete cycle of DL execution, from classifying images to saving the processed image data into the C-band flash memory, was shown in this LDOT (Figure 9). The DL was run five times using different combinations of models and images between 0 and 1142 s. Six short peaks of 7 W unregulated power1 were recorded because the uplink command was received for DL execution purposes. The result of the LDOT showed that the algorithm took about 137 s to classify the images and consumed about 680 MB of RPi CM+ memory, referring to the 5-V line in Figure 9. At the end of this pass (1200 s above), both the RPi CM3+ and C-band transceivers were turned on for transferring the image data between the flash memories. Furthermore, the final classification results were appended to the image data for further analysis at the GS. Therefore, it verified the demonstration of running a DL-classification algorithm onboard KITSUNE simulated in orbit.

Figure 9.
Power consumption of KITSUNE deep-learning execution (fourth pass).
4.4. Convolution Neural Network for Wildfire Dataset
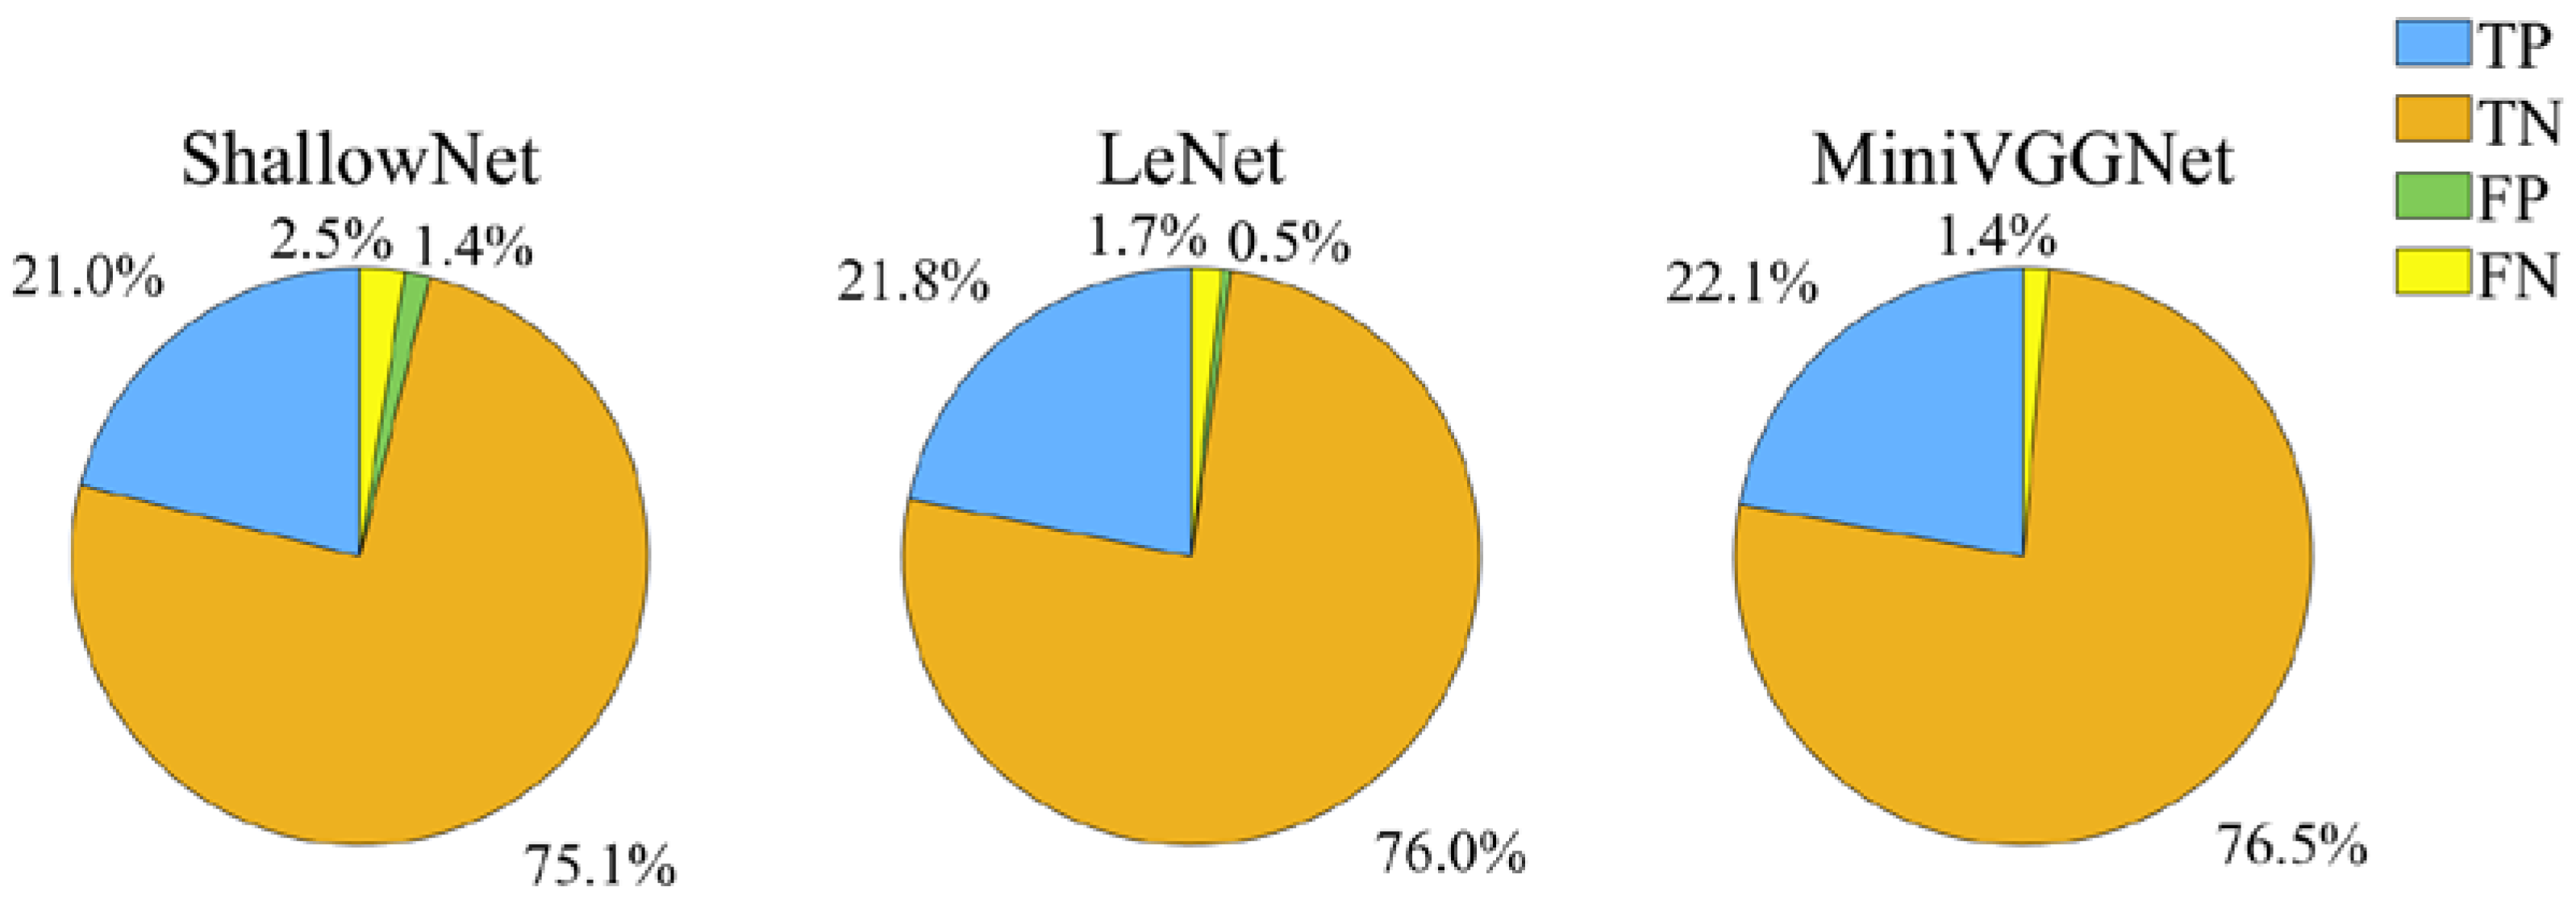
The confusion matrix and classification report were calculated and tabulated as standard techniques to verify the accuracy of DL models. Similar analysis methods were also conducted to test the dataset with respect to the CNN or other ML classifiers [43,44,45,46]. In this study, the results were also generated using the scikit-learn library included in the python script (Table 3). The gray color shows the true positive (TP) with and without the normalized values, respective to the four labels. The confusion matrix shows that the CNN models were chosen based on the small number of false positive (FP) and false negative (FN) results: 14 and 25 for ShallowNet, 5 and 17 for LeNet, and 0 and 14 for MiniVGGNet, respectively (Figure 10). Ultimately, the MiniVGGNet model was considered the best CNN network, when compared with LeNet and ShallowNet, with minor type 1 errors (FP) and type 2 errors (FN).
Table 3.
Confusion matrix of ShallowNet, LeNet, and MiniVGGNet (gray color means TP value).
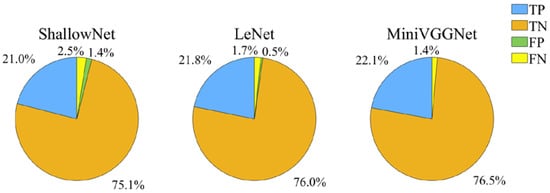
Figure 10.
The true positive, true negative, false positive, and false negative results corresponding to the models.
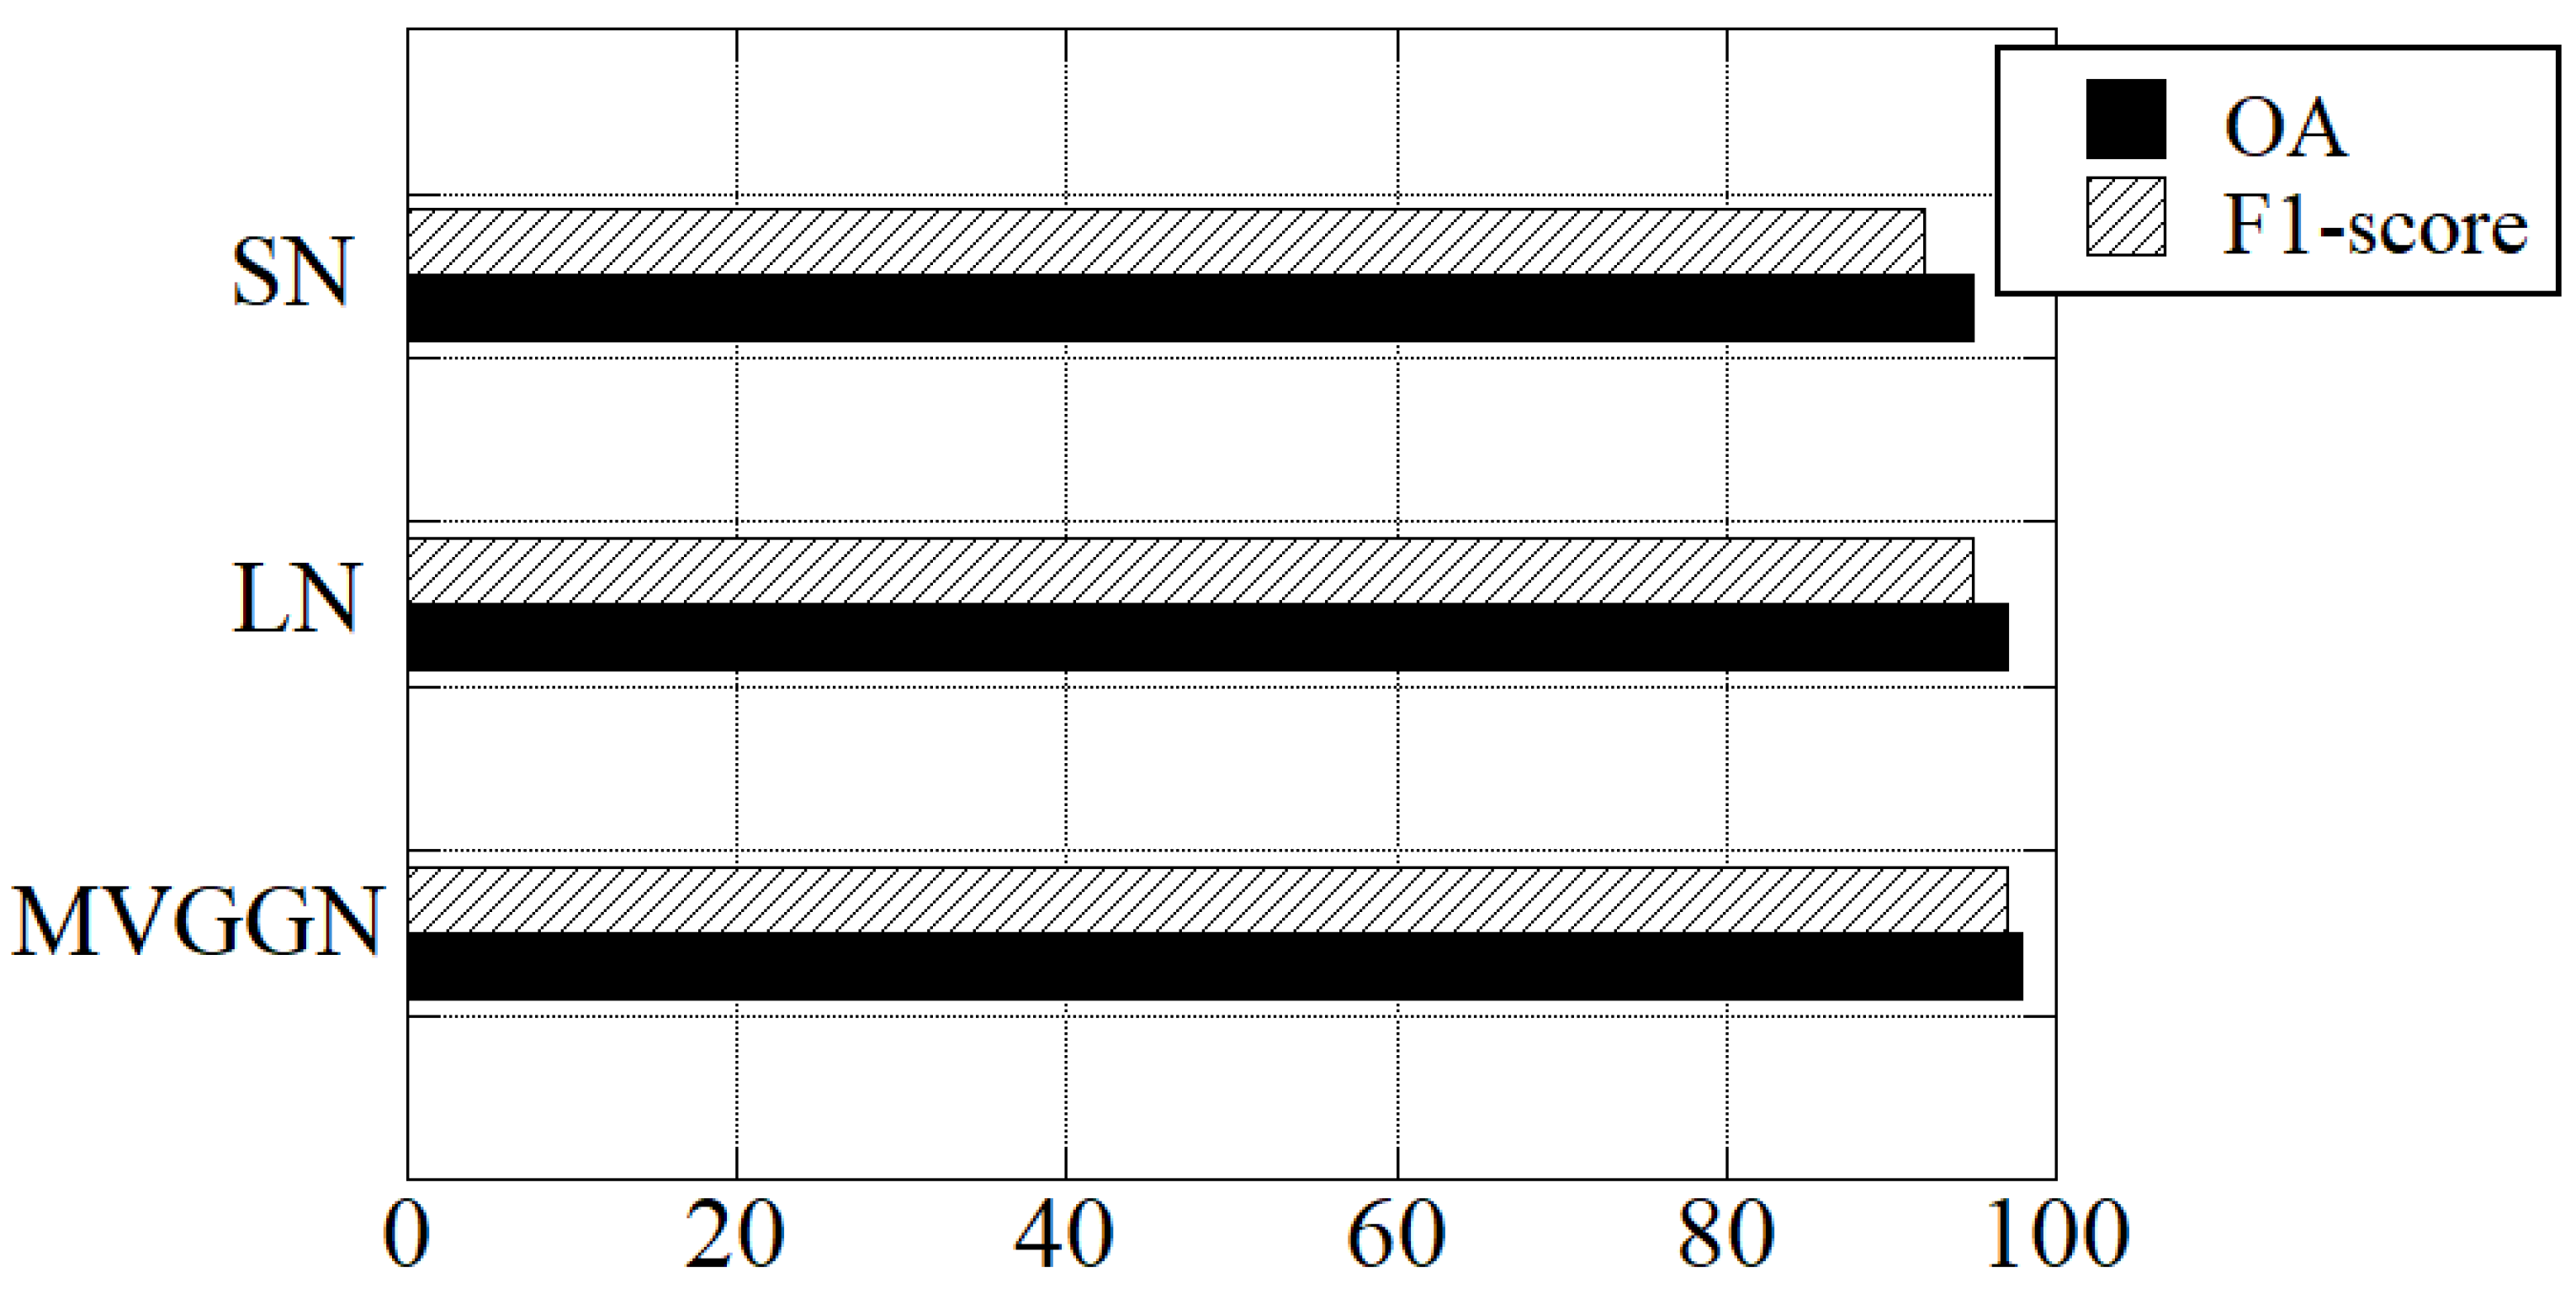
In addition, the classification reports were supported by the confusion matrix results. The pre-trained CNN models of ShallowNet, LeNet, and MiniVGGNet had 95%, 97%, and 98% of the overall accuracy (OA), respectively (Figure 11). The F1 scores of the wildfire label were also analyzed to have a more accurate comparison between these networks. Similar to the OA results, the F1 scores of MiniVGGNet had the highest score at 97%, followed by 95% for LeNet and 92% for ShallowNet. The MiniVGGNet model used in this study shows significantly higher accuracy compared to other approaches. Giuffrida et al. [33] discussed that applying a Deep Neural Network for cloud detection could achieve 92% accuracy. Meanwhile, utilizing CNN onboard for binary image classification could obtain 90% accuracy, as Maskey et al. [45] presented. Therefore, the main contributions are the training dataset and the parameter tuning of the neural network.
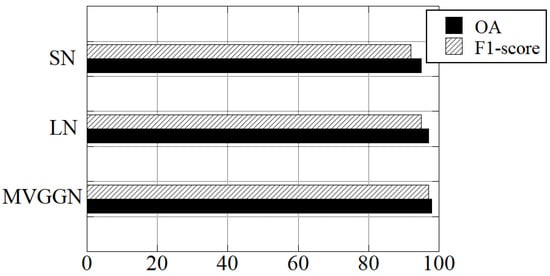
Figure 11.
Comparison of ShallowNet (SN), LeNet (LN), and MiniVGGNet (MVGGN) models in overall accuracy and F1 score of wildfire results.
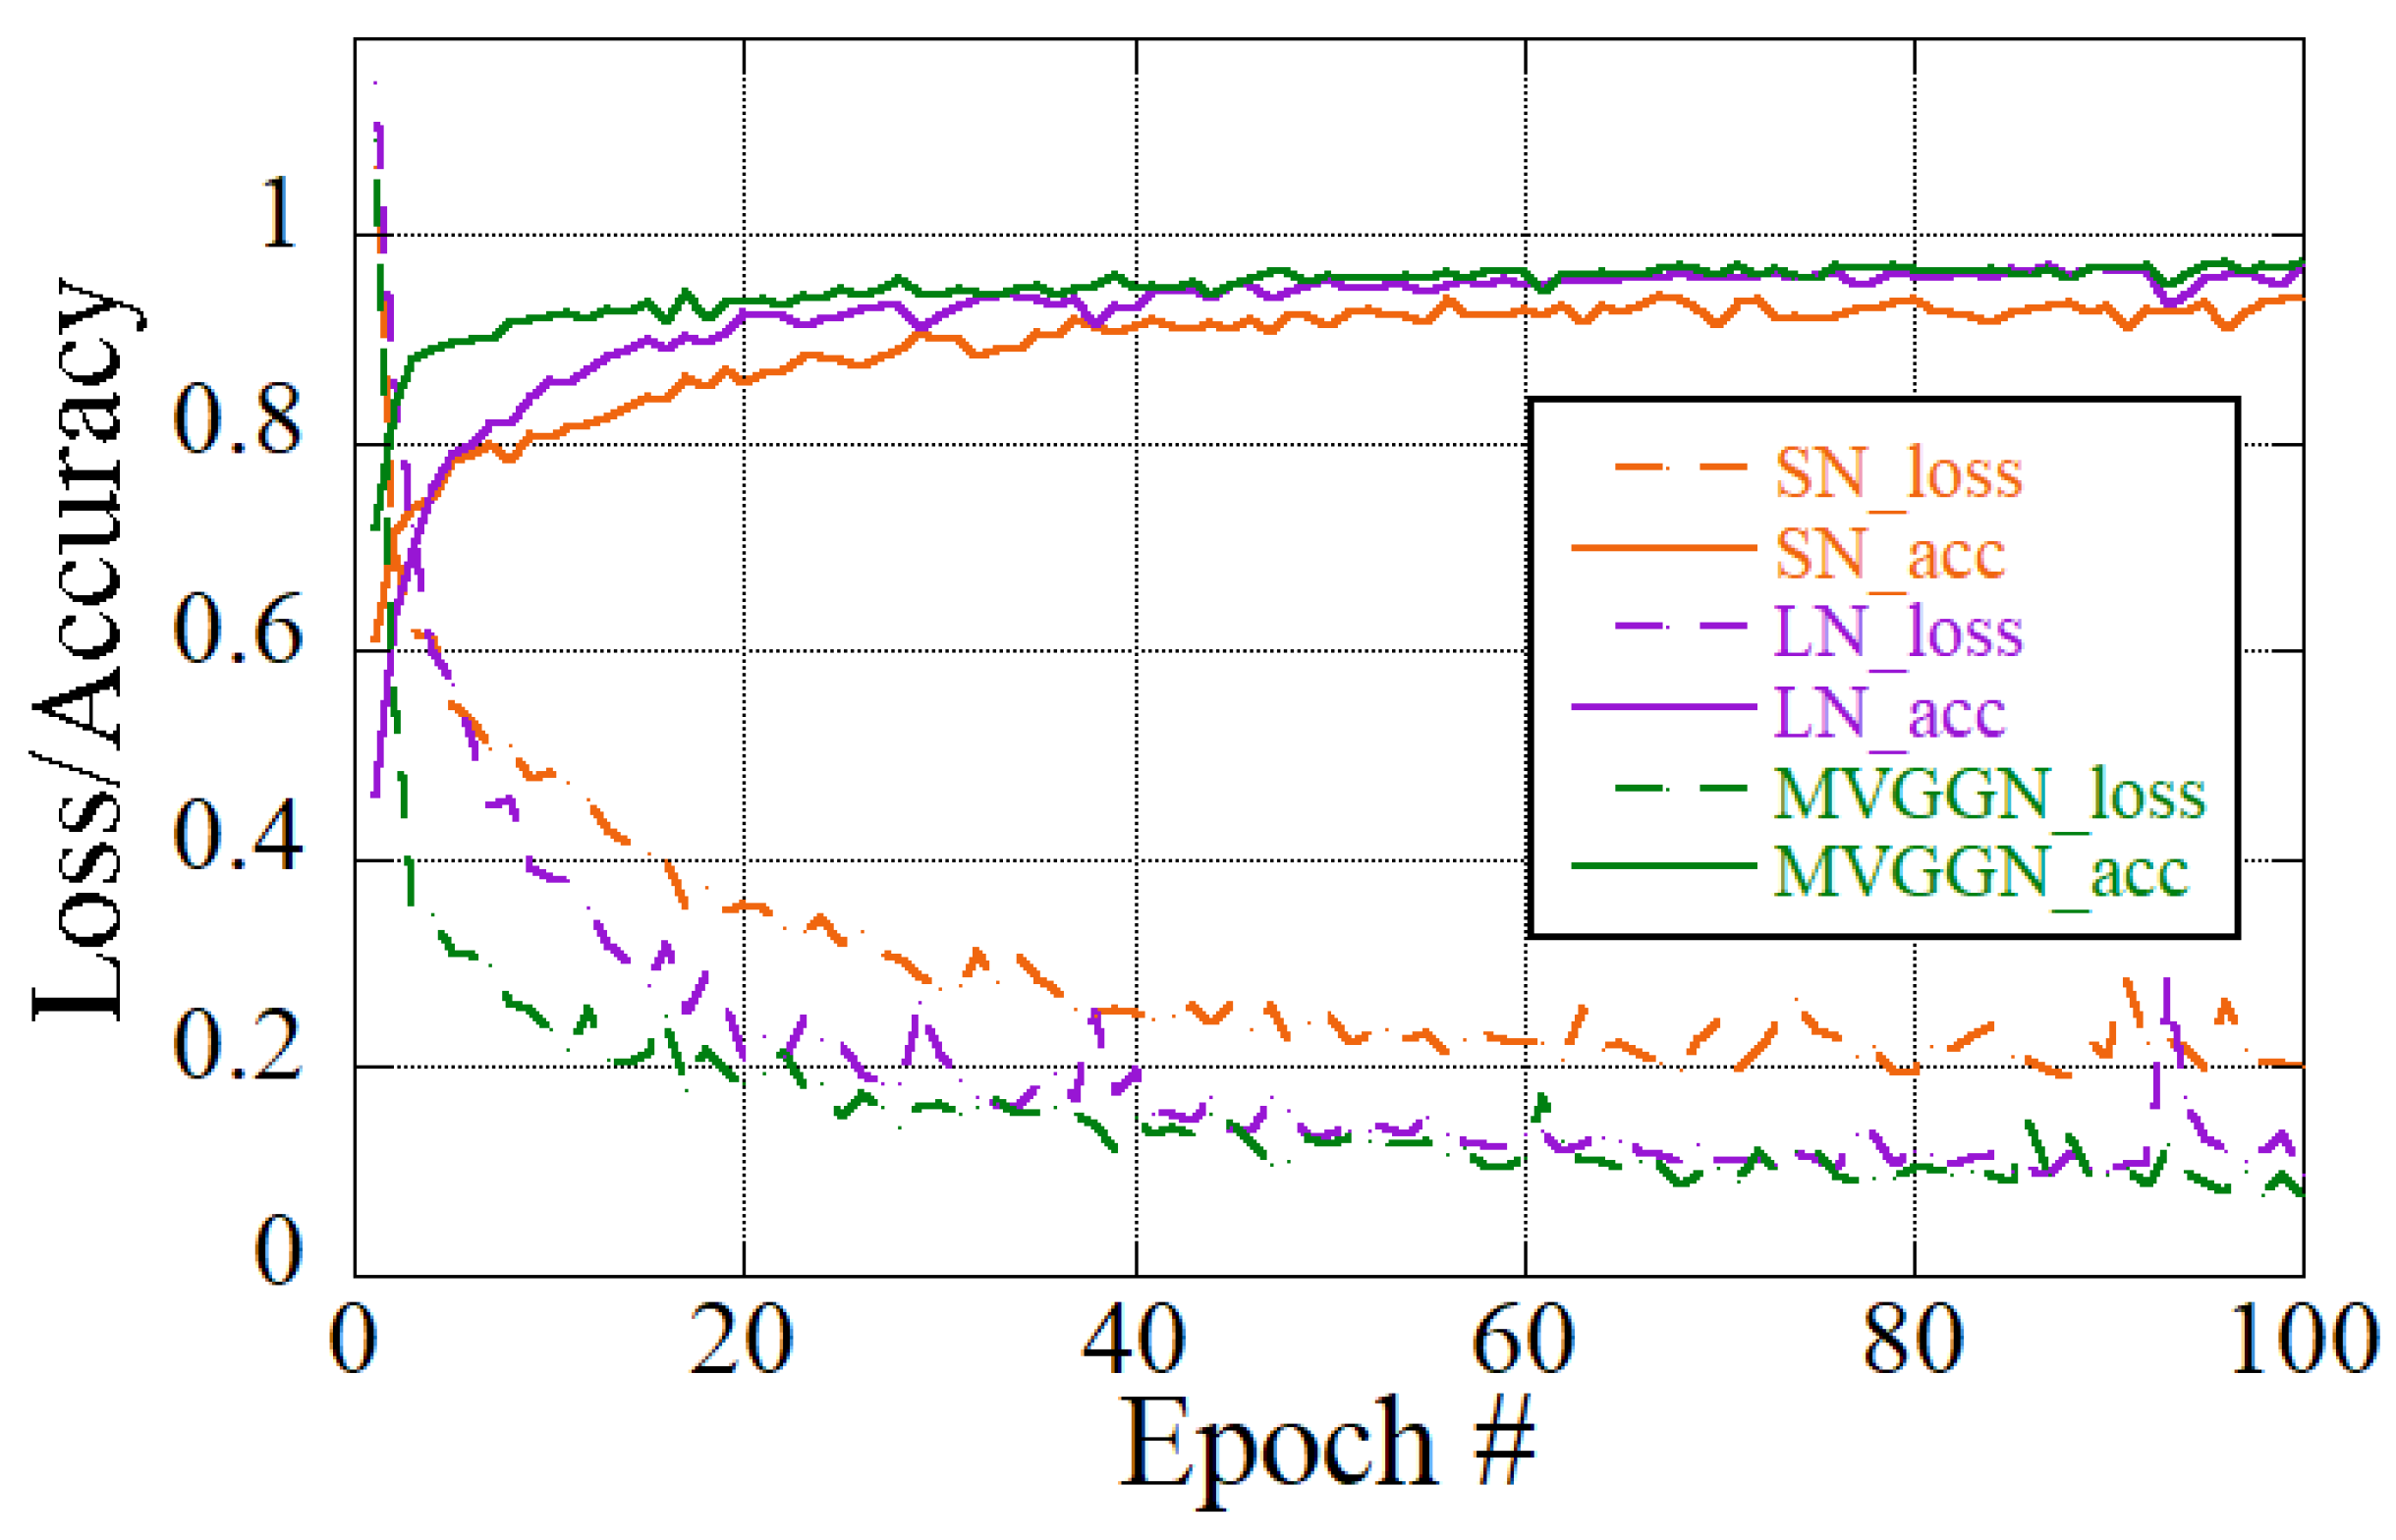
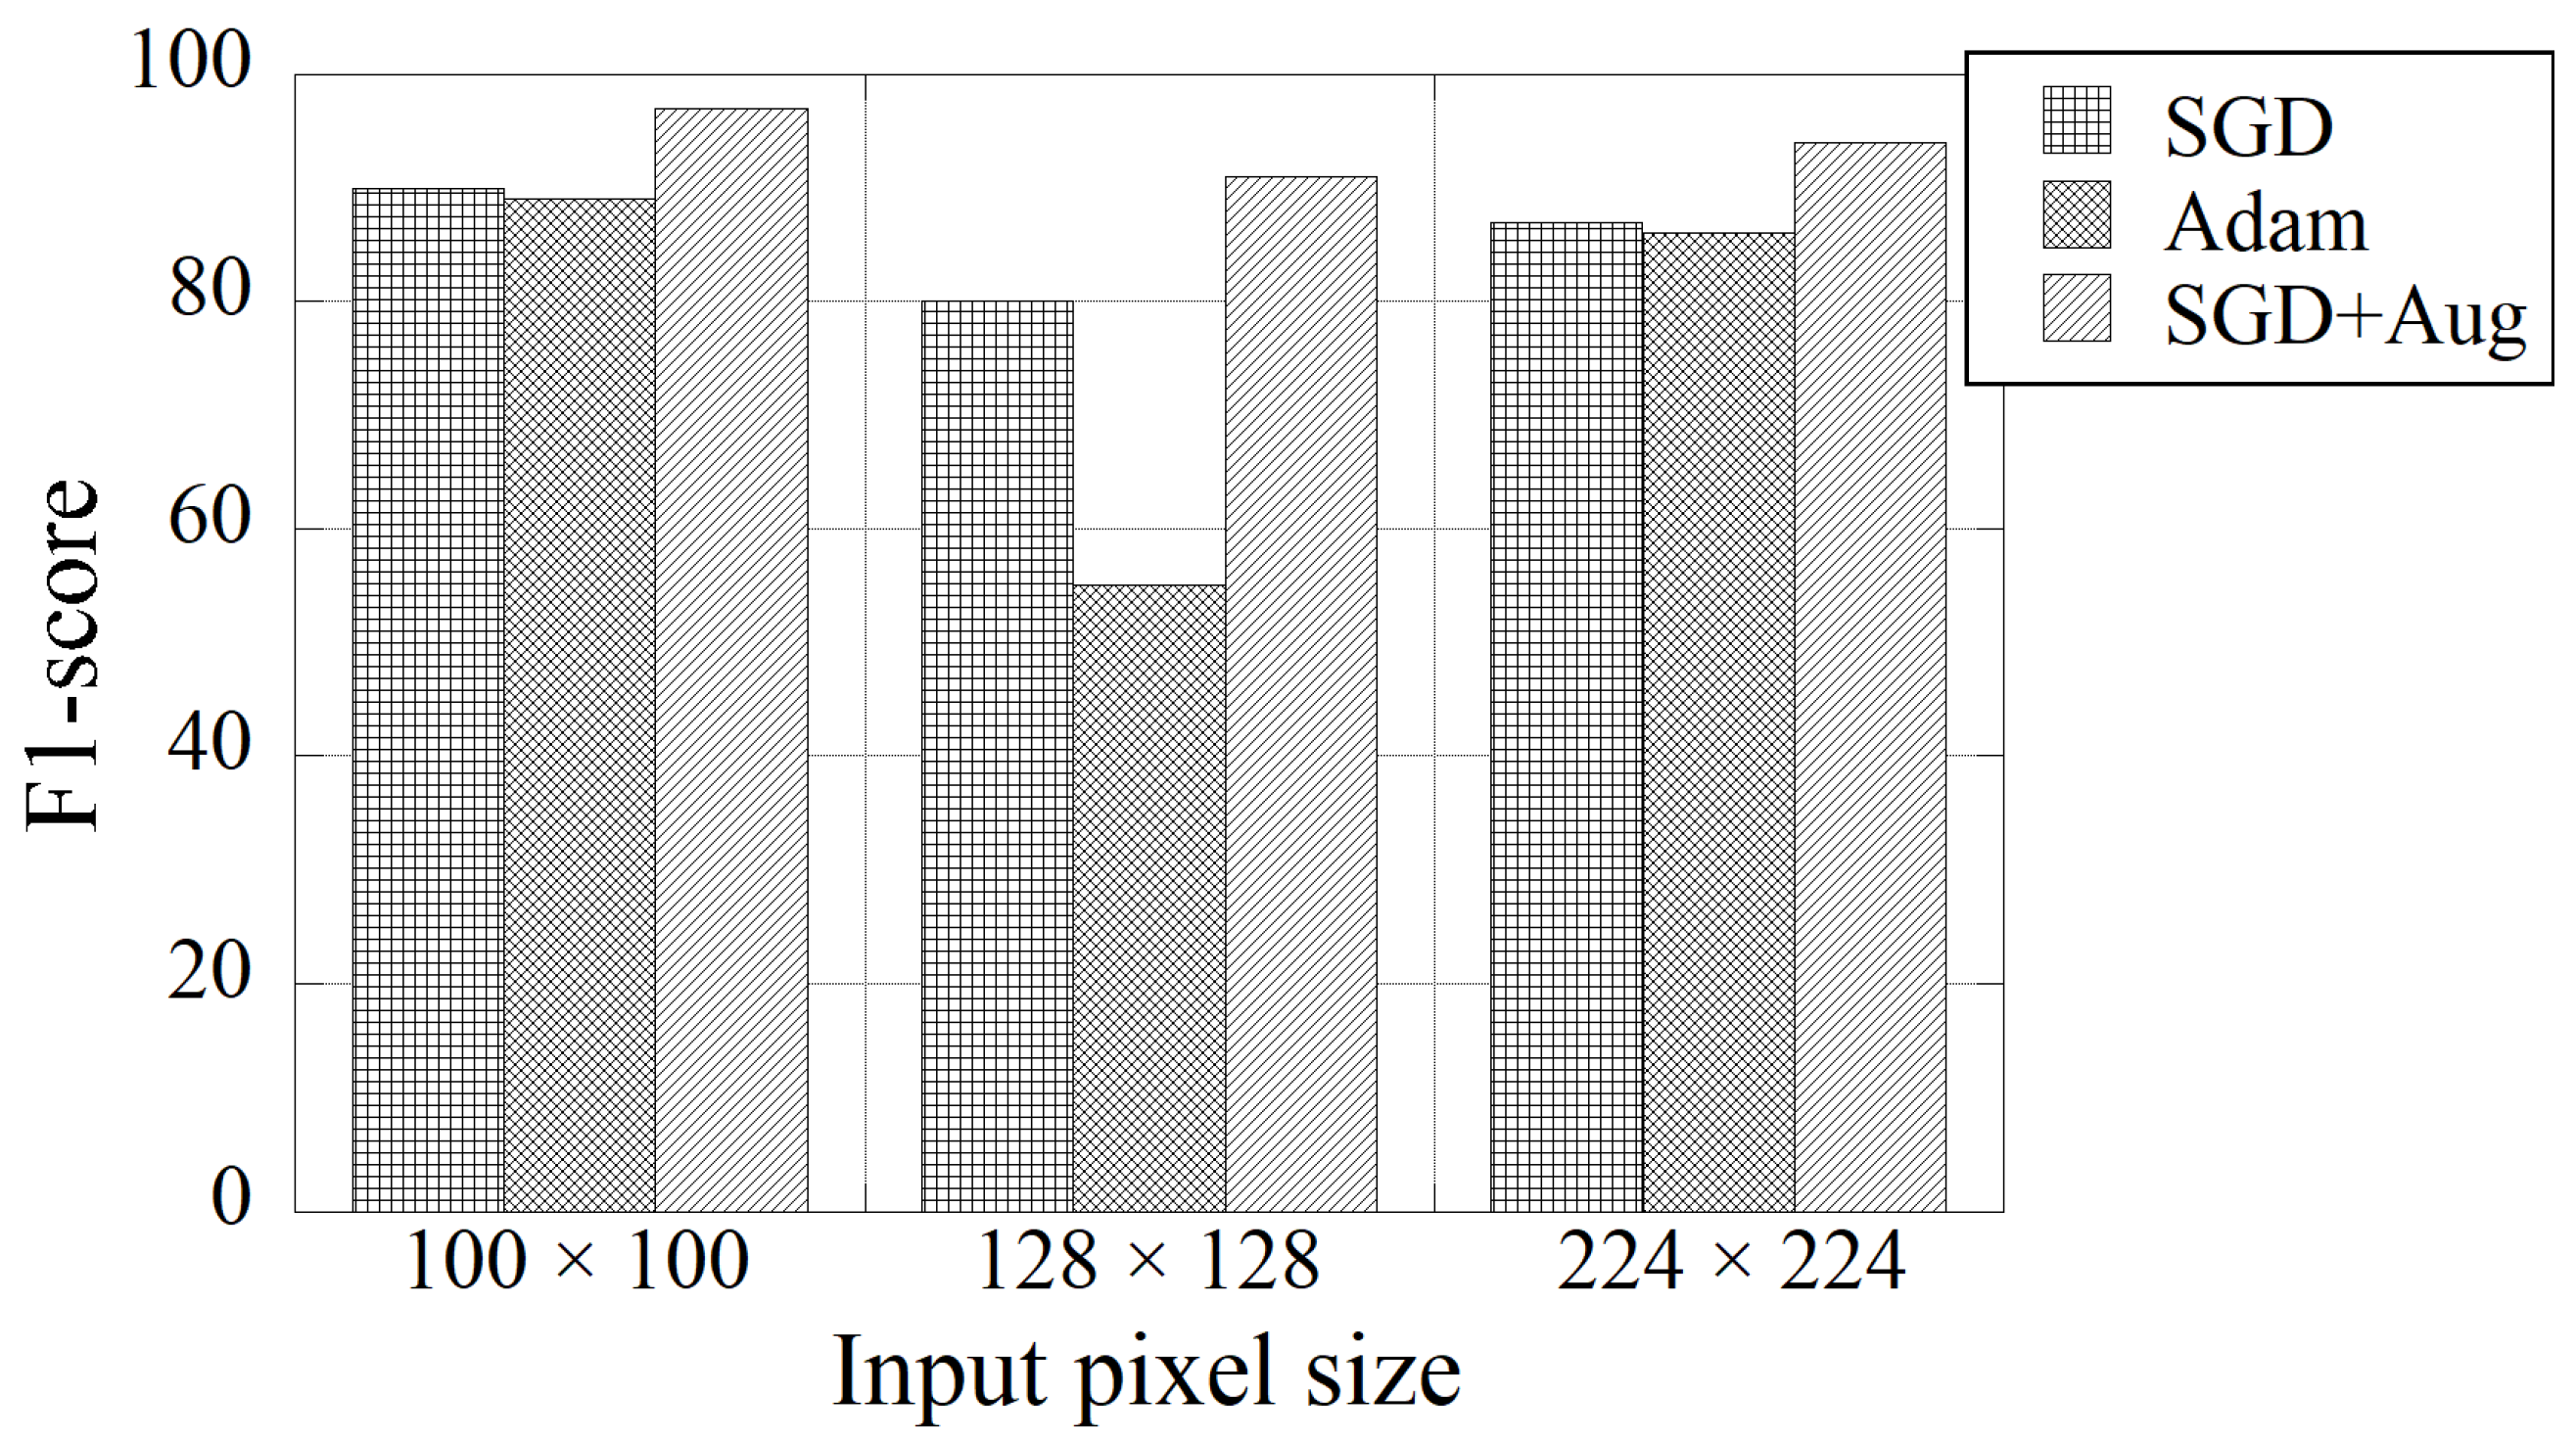
Furthermore, the training loss and accuracy were also plotted to correlate how the models were trained concerning 100 epochs (Figure 12). MiniVGNet achieved 90% training accuracy at epoch 6 and less than 20% of training loss at epoch 20. It was also noticeable that these three models were trained at different learning rates to gain the highest accuracy possible, 0.05 for MiniVGGNet, whereas it was 0.005 for LeNet and ShallowNet. On the other hand, other parameters, like input pixel size and type of optimizers, were measured to see whether they would increase the F1 scores of the CNN models. Figure 13 shows the differentiation results on the MiniVGGNet network. Increasing the input size would not increase the scores, while the best optimizer implemented was the Stochastic Gradient Descent (SGD) combined with data augmentation (rotate, zoom, shift, and flip). Therefore, the optimum combination of the MiniVGGNet model parameter was 100 × 100 pixels, SGD, and using augmentation images.
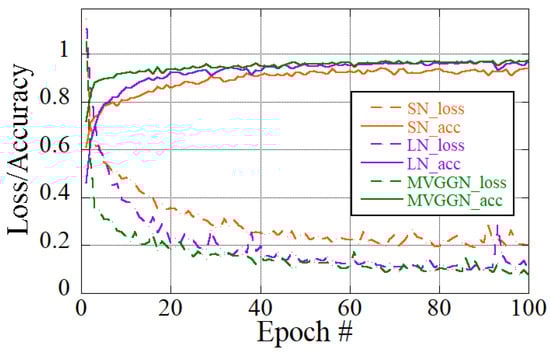
Figure 12.
Training loss and accuracy of ShallowNet (SN), LeNet (LN), and MiniVGGNet (MVGGN) models.
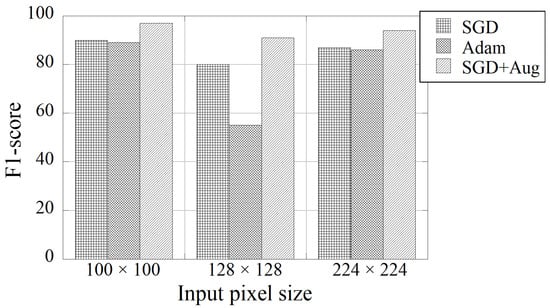
Figure 13.
F1 score of wildfire results using MiniVGGNet model with different input pixel sizes and optimizer types.
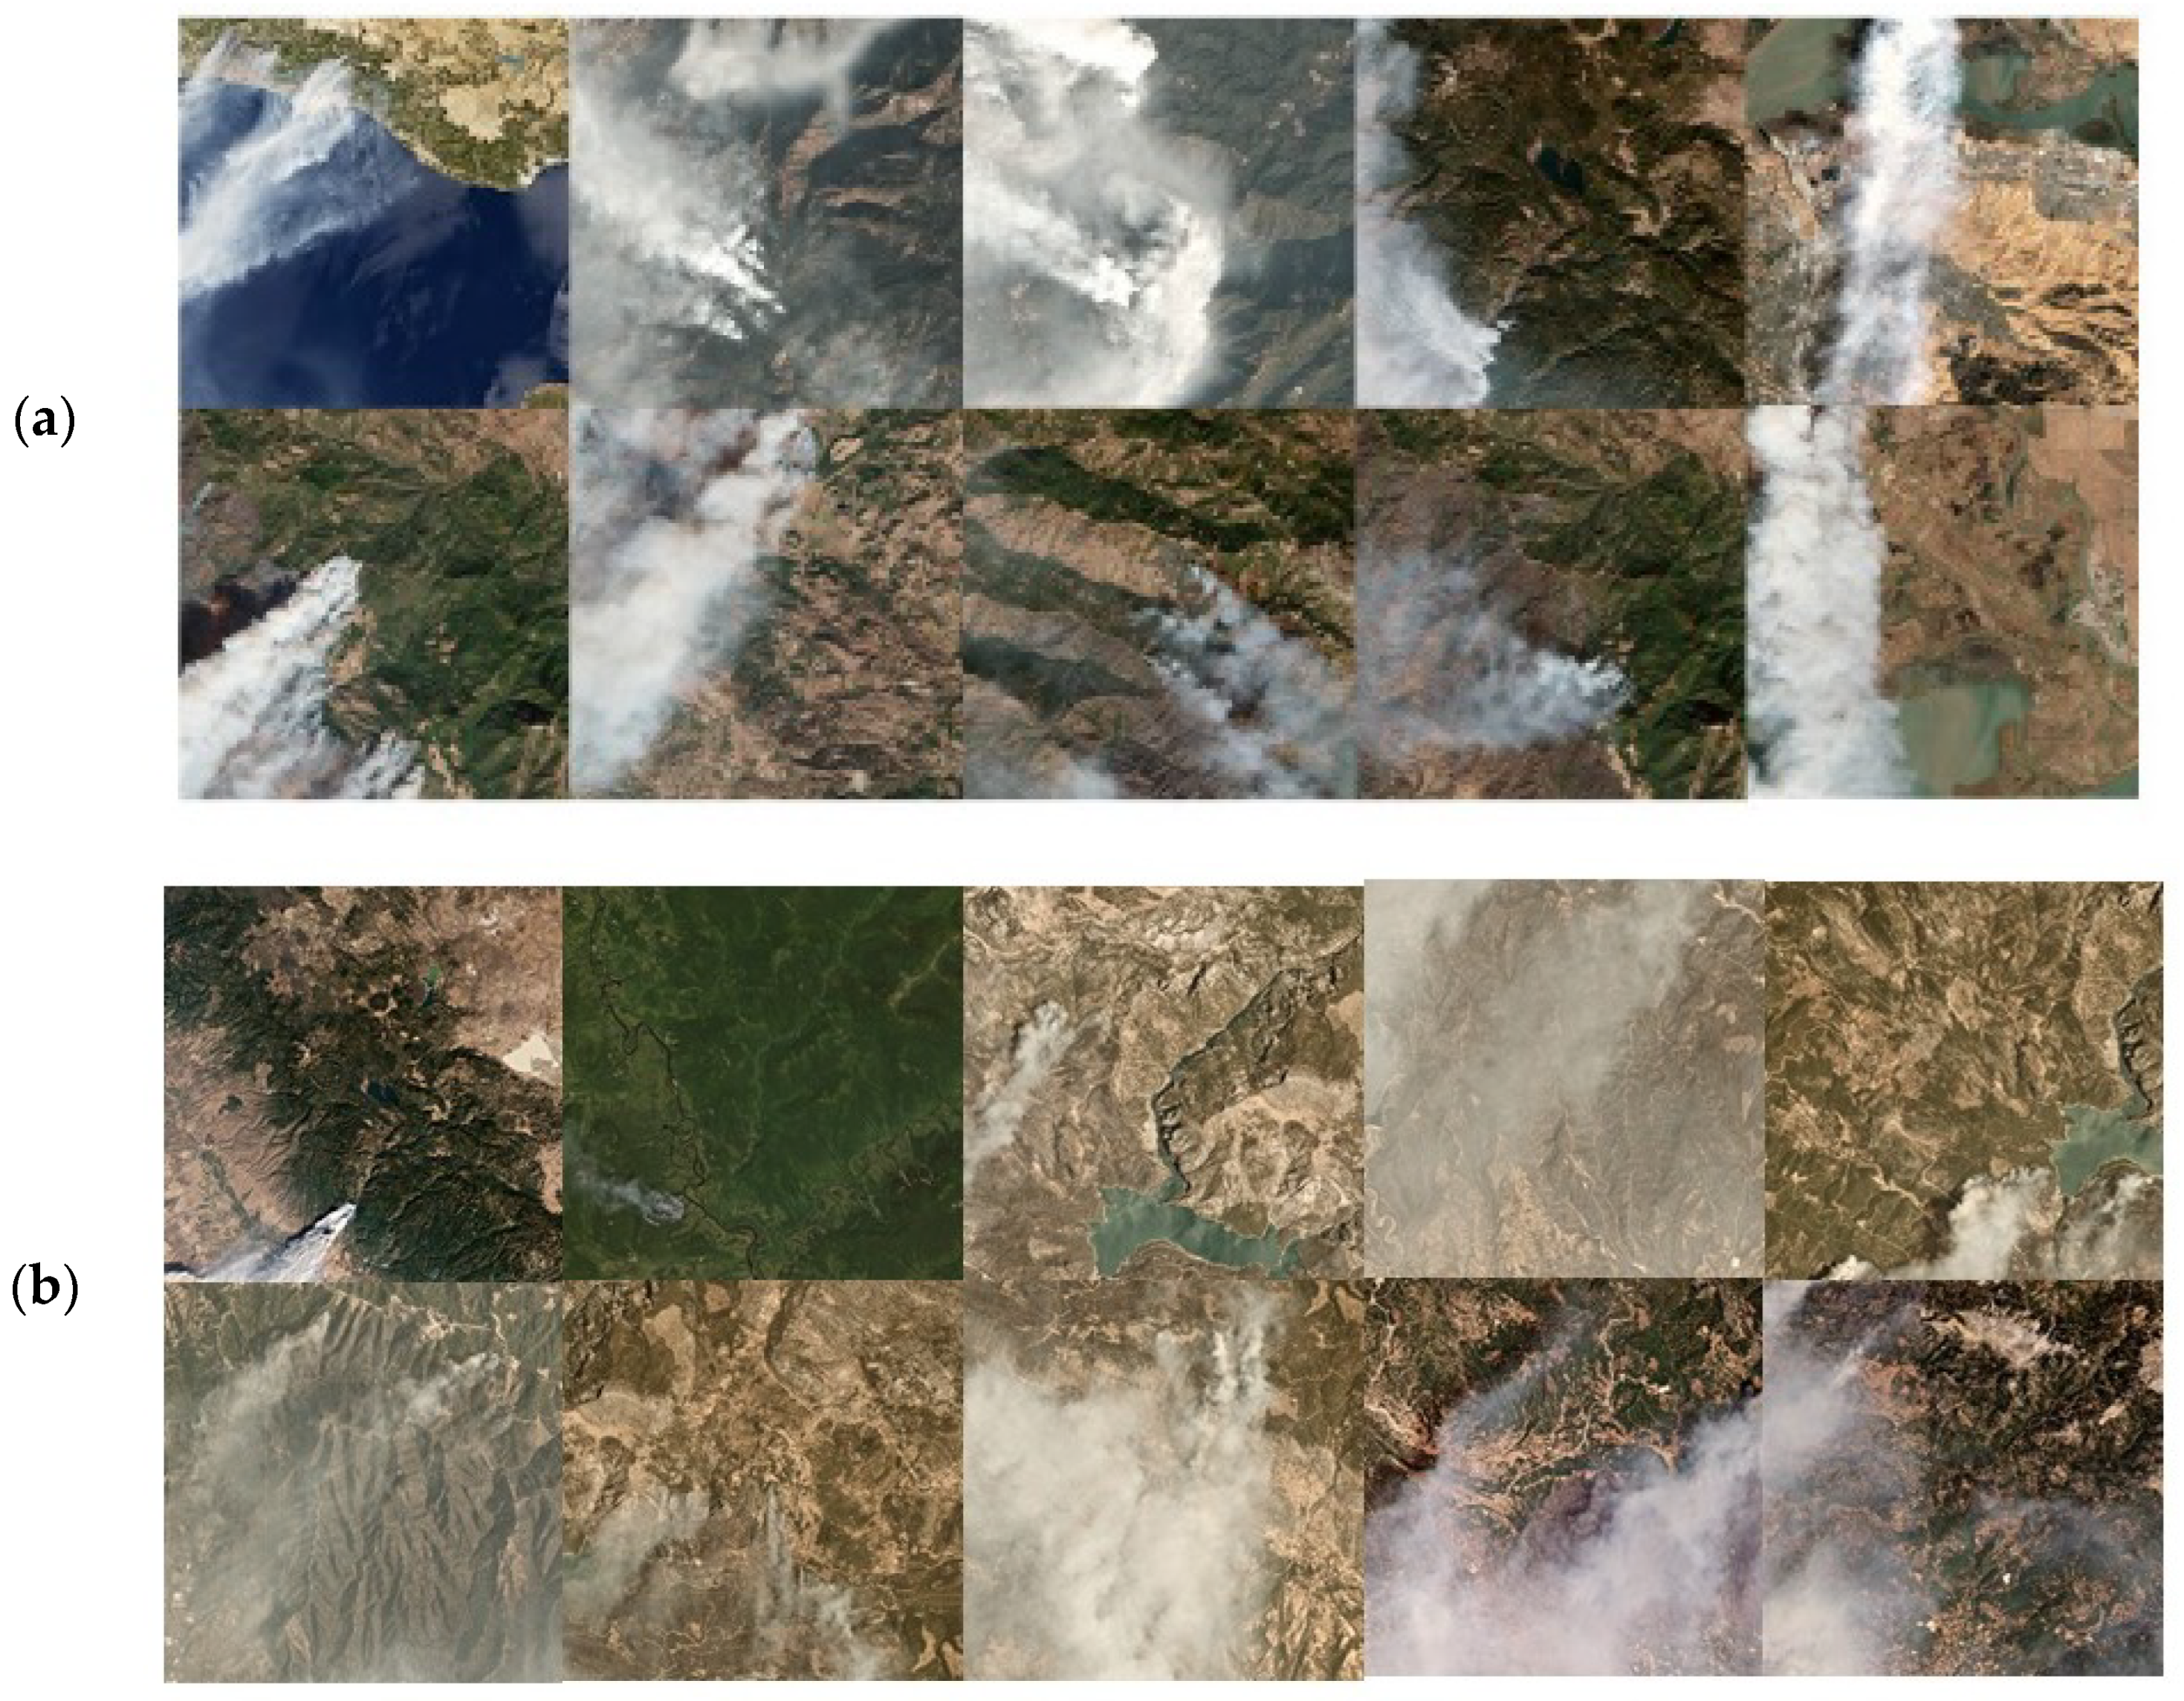
Several raw images were also tested by running the three DL models. The wildfire images were retrieved from the Doves, Sentinel-2, and Landsat-8 satellites. They were captured during the Kincade-Maria fire in the USA in October 2019 and the Turkey wildfire in July 2021 (Figure 14). Overall, the classification results showed the correct and incorrect predictions by implementing the pre-trained MiniVGGNet model. Most of the images from Sentinel-2 and Landsat-8 were correctly predicted, while fewer were correctly predicted based on Doves images. Although the dataset was robustly trained using multiple resolution images, the difficulties of positive classification remained, especially for high resolution. The misclassified results were frequently labeled as clouds. The result would be improved if a visible and infrared camera payload were used, and infrared images were added to the training dataset. Nevertheless, in this study, wildfire-detection processing onboard the CubeSat was verified using a visible camera, with the best CNN model being MiniVGGNet, followed by LeNet and ShallowNet.
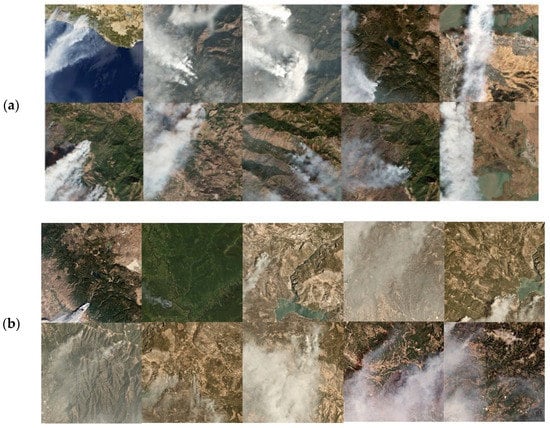
Figure 14.
Classification test results using pre-trained MiniVGGNet model: (a) correct; (b) incorrect predictions.
5. Discussion
The interface speed is a parameter that should be highlighted for designing a camera payload, especially with regard to communication between the CPU and the camera sensor. It will affect the time taken for data transfer and, eventually, increase the power consumption during the mission execution. The USB3.0 and Ethernet interfaces are currently considered the high-speed communication options offered by the COTS camera sensor. A similar study was also applied to a Korean 6U CubeSat using an Ethernet interface design [47]. They had integrated a medium resolution of 3 m with an Intel CPU SBC. Thus, it shows an essential balance in terms of using high-end components for both CPU and camera sensors with high-speed communication.
In current technology, the camera sensor has evolved from a single band to hyperspectral on a miniaturized scale. Multiple bands of images are significantly helpful for remote sensing applications. The fundamental challenges are the considerable data size for both the DL training algorithm and the captured images by the camera payload in addition to the processing power onboard a small satellite. Furthermore, the downlink capabilities of small satellites could be described as other challenges in addition to the amount of power generated from the solar panels per orbit. For instance, Danielsen et al. [44] indicated how critical the power limitation is for onboard processing on HYPSO-1, which is another 6U CubeSat equipped with a hyperspectral imaging payload. In addition, HYPSO-1 utilizes Self-Organizing Maps (SOMs) on sea scenes with an overall accuracy above 90%. The SOM algorithm consumed a maximum computational time of 380 s. This accuracy and computational time could be improved by applying the CNN model, as the results shown in this paper for wildfire image classification reached 98% accuracy with a runtime of 137 s. Therefore, the implementation of ML or DL onboard a CubeSat is significantly affected by the computational costs.
A similar 6U CubeSat, PhiSat-1, demonstrated the Deep Neural Network (DNN) for cloud detection onboard using hyperspectral images. Giuffrida et al. [33] discussed that the test set achieved 92% accuracy with 1% FP using dataset images from Sentinel-2. The CNN-based algorithm showed a considerably impressive result, which consumed 0.16 mWh of energy. The DL runtime could be reduced with the support of the Myriad 2 VPU hardware accelerator integrated onboard PhiSat-1. However, in this paper, the CNN model of MiniVGGNet implemented onboard KITSUNE demonstrated 98% accuracy, 0% of FP, and consumed 0.10 Wh of energy without VPU installed. The significant difference in power consumption could be argued, but the power was calculated by turning on RPi CM3+, executing the image classification algorithm, and finally turning it off. In the KITSUNE design, the RPi CM3+ is not continuously on to avoid the anomaly of SEL, which was observed in TID radiation on the ground test.
On top of that, machine learning was generally executed on the ground. Chen et al. [48] discussed how and why image processing was conducted after downloading the image data at the GS. There is always a significant issue in comparing the downlink capability between a traditional satellite and a CubeSat. However, our study to classify images onboard is advantageous for the nanosatellite class and complemented the low latency of downlink communication. Challenges with regard to computational costs, power, and time were tackled and improved in the mission plan strategy.
The ultimate goal of the DL approach onboard a CubeSat is to have the re-training model capability. Images captured by the payload can be utilized and classified directly to update the dataset labels. In this study, the KITSUNE design was tested and showed promising results for conducting a re-training model onboard, but several issues will be raised. The main question will be regarding how much confidence there can be that the images captured are correctly classified and sorted in the respective label for the re-training process. Humans should be involved in the training process of the DL algorithm. Therefore, image classification is only implemented in the final software. Meanwhile, a different approach was studied by Mikuriya et al. [49], where the classifier will be shared between both onboard and ground learning. The study was interesting, but that will eventually become a burden to the communication load between the satellite and GS, where most of the CubeSat failures involving communication occur.
In summary, although this study tested only three CNN networks, other existing models have not been initialized yet with the wildfire dataset, such as Inception, DeeperGoogLeNet, DenseNet, and U-Net. Buonaiuto et al. [50] presented a study showing that image processing can have these three tasks: image classification/recognition, object detection and location, and image segmentation. An extension study is also recommended to further analyze the classified images from the satellite on the ground by implementing a CNN network like U-Net for image segmentation.
Remote-sensing technology via satellite has an important role to play in reducing wildfire impacts. A CNN fusion of onboard image classification and on-the-ground image segmentation can truly assist the authorities in handling those catastrophes. Szpakowski and Jensen [51] reviewed that remote sensing techniques in fire ecology are related to fire-risk mapping, fuel mapping, active fire detection, burned area estimates, burn severity assessment, and post-fire vegetation recovery monitoring. Consistent with this study, the CNN image classification was implemented onboard a CubeSat to detect active fires. Moreover, the mapping and assessment should be conducted on the ground, utilizing CNN image segmentation. Overall, it can create an artificial intelligence ecosystem to overcome the natural disaster consequences, particularly in regard to global wildfires.
6. Conclusions
In this study, we discussed the design of the KITSUNE 6U CubeSat 5-m Earth observation mission. Wildfire detection using a deep-learning (DL) algorithm was also tested along with the functional test of the satellite system. The test conditions were set as close to those of the space environment as possible to thoroughly verify the camera payload. The classification algorithm was executed in the KITSUNE flight model, resulting in 98% overall accuracy and a 97% F1 score when implementing the MiniVGGNet model. The LeNet and ShallowNet networks were implemented together onboard the CubeSat to complement and compare the classification results. Moreover, the TID radiation result also showed that the radiated environment in space may affect image classification performance onboard the satellite by a single event latch-up during the test. Extra precautions and observations should be made before executing the main mission and the image classification. Ultimately, KITSUNE will be launched in 2022, and the results discussed in this paper will be compared and verified after mission success.
Several future works and improvements have been identified to improve the DL wildfire detection accuracy. Instead of utilizing a visible spectral band, researchers could implement multispectral or hyperspectral bands for the EO CubeSat payload. The latest COTS sensor technology has evolved and been miniaturized, so it can fit into the nanosatellite class. Other DL models and techniques can be further tested for future CubeSat projects by considering the limitations of memory and power consumption of the single-board computer integrated onboard. An intelligent CubeSat constellation operation aims to improve the valuable downlink of remote sensing big data to users on Earth. Finally, this also suggests that, instead of utilizing CNN for image classification, a fusion with image segmentation is a future direction to take to improve remote sensing techniques in wildfire applications.
Author Contributions
Conceptualization, M.H.b.A. and N.C.O.; methodology, M.H.b.A.; software, M.H.b.A. and V.H.S.; validation, M.H.b.A., N.C.O., V.H.S. and T.O.; formal analysis, M.H.b.A.; investigation, M.H.b.A. and N.C.O.; resources, M.C.; data curation, M.H.b.A.; writing—original draft preparation, M.H.b.A.; writing—review and editing, N.C.O., V.H.S. and M.C.; visualization, M.H.b.A. and N.C.O.; supervision, M.C.; project administration, M.C.; funding acquisition, M.C. All authors have read and agreed to the published version of the manuscript.
Funding
This research received no external funding.
Institutional Review Board Statement
Not applicable.
Informed Consent Statement
Not applicable.
Data Availability Statement
Not applicable.
Acknowledgments
The authors would like to express their appreciation for the valuable comments of the associate editors and anonymous reviewers. This work was supported by KITSUNE members collaborating with the Harada Seiki Co., Ltd., and Addnics Corp. in Japan. In addition, the datasets were collected from a Planet Education and Research Standard plan subscription.
Conflicts of Interest
The authors declare no conflict of interest.
References
- Nakasuka, S.; Sako, N.; Sahara, H.; Nakamura, Y.; Eishima, T.; Komatsu, M. Evolution from education to practical use in University of Tokyo’s nano-satellite activities. Acta Astronaut. 2010, 66, 1099–1105. [Google Scholar] [CrossRef]
- Tsuda, Y.; Sako, N.; Eishima, T.; Ito, T.; Arikawa, Y.; Miyamura, N.; Tanaka, A.; Nakasuka, S. University of Tokyo’s CubeSat project—Its educational and technological significance. In Proceedings of the the 15th Annual AIAA/USU Conference on Small Satellites, Logan, UT, USA, 13–16 August 2001. [Google Scholar]
- Berthoud, L.; Swartwout, M.; Blvd, L.; Louis, S.; Cutler, J.; Klumpar, D. University CubeSat Project Management for Success. In Proceedings of the the 33rd Annual AIAA/USU Conference on Small Satellites, Logan, UT, USA, 3–8 August 2019; p. 63. [Google Scholar]
- Chin, A.; Coelho, R.; Brooks, L.; Nugent, R.; Puig-Suari, J. Standardization Promotes Flexibility: A Review of CubeSats’ Success. In Proceedings of the AIAA 6th Responsive Space Conference, Los Angeles, CA, USA, 28 April–1 May 2008. [Google Scholar]
- Nugent, R.; Munakata, R.; Chin, A.; Coelho, R.; Puig-Suari, J. The CubeSat: The picosatellite standard for research and education. In Proceedings of the AIAA Space 2008 Conference and Exhibition, San Diego, CA, USA, 9–11 September 2008. [Google Scholar] [CrossRef] [Green Version]
- Toorian, A.; Diaz, K.; Lee, S. The CubeSat approach to space access. In Proceedings of the 2008 IEEE Aerospace Conference, Big Sky, MT, USA, 1–8 March 2008; Volume 1. [Google Scholar] [CrossRef]
- Sweeting, M.N. Small Satellites for Affordable Access to Space. Coop. Space 1999, 430, 393. [Google Scholar]
- Sandau, R. Status and trends of small satellite missions for Earth observation. Acta Astronaut. 2010, 66, 1–12. [Google Scholar] [CrossRef]
- Swartwout, M. You say “Picosat”, i say ’“CubeSat”: Developing a better taxonomy for secondary spacecraft. In Proceedings of the 2018 IEEE Aerospace Conference, Big Sky, MT, USA, 3–10 March 2018; pp. 1–17. [Google Scholar] [CrossRef]
- Villela, T.; Costa, C.A.; Brandão, A.M.; Bueno, F.T.; Leonardi, R. Towards the thousandth CubeSat: A statistical overview. Int. J. Aerosp. Eng. 2019, 2019, 5063145. [Google Scholar] [CrossRef]
- Liddle, J.D.; Holt, A.P.; Jason, S.J.; O’Donnell, K.A.; Stevens, E.J. Space science with CubeSats and nanosatellites. Nat. Astron. 2020, 4, 1026–1030. [Google Scholar] [CrossRef]
- Poghosyan, A.; Golkar, A. CubeSat evolution: Analyzing CubeSat capabilities for conducting science missions. Prog. Aerosp. Sci. 2017, 88, 59–83. [Google Scholar] [CrossRef]
- Toth, C.; Jóźków, G. Remote sensing platforms and sensors: A survey. ISPRS J. Photogramm. Remote Sens. 2016, 115, 22–36. [Google Scholar] [CrossRef]
- Giulio, M.; Yesie, L.; Brama, M.Z. Athenoxat-1, Night Vision Experiments in LEO. In Proceedings of the 30th AIAA/USU Conference on Small Satellites, Logan, UT, USA, 6–11 August 2016; pp. 7–12. [Google Scholar]
- Brychikhin, M.N.; Chkhalo, N.I.; Eikhorn, Y.O.; Malyshev, I.V.; Pestov, A.E.; Plastinin, Y.A.; Polkovnikov, V.N.; Rizvanov, A.A.; Salashchenko, N.N.; Strulya, I.L.; et al. Reflective Schmidt–Cassegrain system for large-aperture telescopes. Appl. Opt. 2016, 55, 4430. [Google Scholar] [CrossRef]
- Da Deppo, V.; Sandri, P.; Mazzinghi, P.; Zuccaro Marchi, A. A lightweight Schmidt space telescope configuration for ultra-high energy cosmic ray detection. Int. Conf. Space Opt. 2019, 11180, 252. [Google Scholar] [CrossRef] [Green Version]
- Smith, M.W.; Donner, A.; Knapp, M.; Pong, C.M.; Smith, C.; Luu, J.; Pasquale, P.D.; Bocchino, R.L.; Campuzano, B.; Loveland, J.; et al. On-Orbit Results and Lessons Learned from the ASTERIA Space Telescope Mission. In Proceedings of the 32nd AIAA/USU Conference on Small Satellites, Logan, UT, USA, 4–9 August 2018. [Google Scholar]
- Pastena, M.; Carnicero Domínguez, B.; Mathieu, P.P.; Regan, A.; Esposito, M.; Conticello, S.; Van Dijk, C.; Vercruyssen, N.; Foglia Manzillo, P.; Koelemann, R.; et al. ESA Earth observation directorate NewSpace initiatives. In Proceedings of the 33rd AIAA/USU Conference on Small Satellites, Logan, UT, USA, 3–8 August 2019; pp. 1–3. [Google Scholar]
- Urihara, B.J.K.; Uwahara, T.K.; Ujita, S.F.; Ato, Y.S.; Anyu, K.H. A High Spatial Resolution Multispectral Sensor on the RISESAT microsatellite. Trans. Jpn. Soc. Aeronaut. Space Sci. Aerosp. Technol. Jpn. 2020, 18, 186–191. [Google Scholar]
- Houborg, R.; McCabe, M.F. A Cubesat enabled Spatio-Temporal Enhancement Method (CESTEM) utilizing Planet, Landsat and MODIS data. Remote Sens. Environ. 2018, 209, 211–226. [Google Scholar] [CrossRef]
- Boshuizen, C.R.; Mason, J.; Klupar, P.; Spanhake, S. Results from the Planet Labs Flock Constellation. In Proceedings of the 28th AIAA/USU Conference on Small Satellites, Logan, UT, USA, 4–7 August 2014. [Google Scholar]
- Griffith, D.; Cogan, D.; Magidimisha, E.; Van Zyl, R. Flight hardware verification and validation of the K-line fire sensor payload on ZACube-2. In Proceedings of the Fifth Conference on Sensors, MEMS, and Electro-Optic Systems, Skukuza, South Africa, 8–10 October 2018; International Society for Optics and Photonics: Bellingham, WA, USA, 2019; p. 100. [Google Scholar] [CrossRef]
- Esposito, M.; Dominguez, B.C.; Pastena, M.; Vercruyssen, N.; Conticello, S.S.; van Dijk, C.; Manzillo, P.F.; Koeleman, R. Highly integration of hyperspectral, thermal and artificial intelligence for the ESA PHISAT-1 mission. In Proceedings of the International Astronautical Congress IAC 2019, Washington, DC, USA, 21–25 October 2019; pp. 1–8. [Google Scholar]
- Stock, G.; Fraire, J.A.; Hermanns, H.; Cruz, E.; Isaacs, A.; Imbrosh, Z. On the Automation, Optimization, and In-Orbit Validation of Intelligent Satellite Constellation Operations. In Proceedings of the 36th AIAA/USU Conference on Small Satellites, Logan, UT, USA, 7–12 August 2019; p. SSC21-V-05. [Google Scholar]
- Jallad, A.H.; Marpu, P.; Aziz, Z.A.; Al Marar, A.; Awad, M. MeznSat-A 3U CubeSat for monitoring greenhouse gases using short wave infra-red spectrometry: Mission concept and analysis. Aerospace 2019, 6, 118. [Google Scholar] [CrossRef] [Green Version]
- Weber, K.T.; Yadav, R. Spatiotemporal Trends in Wildfires across the Western United States (1950–2019). Remote Sens. 2020, 12, 2959. [Google Scholar] [CrossRef]
- de Almeida Pereira, G.H.; Fusioka, A.M.; Nassu, B.T.; Minetto, R. Active fire detection in Landsat-8 imagery: A large-scale dataset and a deep-learning study. ISPRS J. Photogramm. Remote Sens. 2021, 178, 171–186. [Google Scholar] [CrossRef]
- Chen, Y.; Lara, M.J.; Hu, F.S. A robust visible near-infrared index for fire severity mapping in Arctic tundra ecosystems. ISPRS J. Photogramm. Remote Sens. 2020, 159, 101–113. [Google Scholar] [CrossRef]
- Gibson, R.; Danaher, T.; Hehir, W.; Collins, L. A remote sensing approach to mapping fire severity in south-eastern Australia using sentinel 2 and random forest. Remote Sens. Environ. 2020, 240, 111702. [Google Scholar] [CrossRef]
- Novo, A.; Fariñas-Álvarez, N.; Martínez-Sánchez, J.; González-Jorge, H.; Fernández-Alonso, J.M.; Lorenzo, H. Mapping Forest Fire Risk—A Case Study in Galicia (Spain). Remote Sens. 2020, 12, 3705. [Google Scholar] [CrossRef]
- Xu, W.; Wooster, M.J.; He, J.; Zhang, T. Improvements in high-temporal resolution active fire detection and FRP retrieval over the Americas using GOES-16 ABI with the geostationary Fire Thermal Anomaly (FTA) algorithm. Sci. Remote Sens. 2021, 3, 100016. [Google Scholar] [CrossRef]
- Chien, S.; Doubleday, J.; Thompson, D.; Wagstaff, K.; Bellardo, J.; Francis, C.; Baumgarten, E.; Williams, A.; Yee, E.; Fluitt, D. Onboard Autonomy on the Intelligent Payload EXperiment (IPEX) CubeSat Mission: A pathfinder for the proposed HyspIRI Mission Intelligent Payload Module. In Proceedings of the 12th International Symposium on Artificial Intelligence, Robotics and Automation in Space, Montreal, QC, Canada, 18–22 June 2014; pp. 1–8. [Google Scholar]
- Giuffrida, G.; Diana, L.; de Gioia, F.; Benelli, G.; Meoni, G.; Donati, M.; Fanucci, L. CloudScout: A deep neural network for on-board cloud detection on hyperspectral images. Remote Sens. 2020, 12, 2205. [Google Scholar] [CrossRef]
- Kim, S.; Yamauchi, T.; Masui, H.; Cho, M. BIRDS BUS: A Standard CubeSat BUS for an Annual Educational Satellite Project. JoSS 2021, 10, 1015–1034. [Google Scholar]
- Balch, J.K.; St. Denis, L.A.; Mahood, A.L.; Mietkiewicz, N.P.; Williams, T.M.; McGlinchy, J.; Cook, M.C. Fired (Fire events delineation): An open, flexible algorithm and database of us fire events derived from the modis burned area product (2001–2019). Remote Sens. 2020, 12, 3498. [Google Scholar] [CrossRef]
- Pinto, M.M.; Libonati, R.; Trigo, R.M.; Trigo, I.F.; DaCamara, C.C. A deep learning approach for mapping and dating burned areas using temporal sequences of satellite images. ISPRS J. Photogramm. Remote Sens. 2020, 160, 260–274. [Google Scholar] [CrossRef]
- Wang, J.; Zhang, X. Investigation of wildfire impacts on land surface phenology from MODIS time series in the western US forests. ISPRS J. Photogramm. Remote Sens. 2020, 159, 281–295. [Google Scholar] [CrossRef]
- Collins, L.; Griffioen, P.; Newell, G.; Mellor, A. The utility of Random Forests for wildfire severity mapping. Remote Sens. Environ. 2018, 216, 374–384. [Google Scholar] [CrossRef]
- Hislop, S.; Haywood, A.; Jones, S.; Soto-Berelov, M.; Skidmore, A.; Nguyen, T.H. A satellite data driven approach to monitoring and reporting fire disturbance and recovery across boreal and temperate forests. Int. J. Appl. Earth Obs. Geoinf. 2020, 87, 102034. [Google Scholar] [CrossRef]
- Rosebrock, A. Deep Learning for Computer Vision with Python, 3rd ed.; PyImageSearch: Philadelphia, PA, USA, 2019; Volume Starter Bundle; ISBN 9788578110796. [Google Scholar]
- Toumbas, G. Raspberry Pi Radiation Experiment; University of Surrey: Guildford, UK, 2018. [Google Scholar]
- Slater, W.S.; Tiwari, N.P.; Lovelly, T.M.; Mee, J.K. Total Ionizing Dose Radiation Testing of NVIDIA Jetson Nano GPUs. In Proceedings of the 2020 IEEE High Performance Extreme Computing Conference, HPEC 2020, Waltham, MA, USA, 22–24 September 2020. [Google Scholar]
- Thanh Noi, P.; Kappas, M. Comparison of Random Forest, k-Nearest Neighbor, and Support Vector Machine Classifiers for Land Cover Classification Using Sentinel-2 Imagery. Sensor 2017, 18, 18. [Google Scholar] [CrossRef] [Green Version]
- Danielsen, A.S.; Johansen, T.A.; Garrett, J.L. Self-organizing maps for clustering hyperspectral images on-board a cubesat. Remote Sens. 2021, 13, 4174. [Google Scholar] [CrossRef]
- Maskey, A.; Cho, M. CubeSatNet: Ultralight Convolutional Neural Network designed for on-orbit binary image classification on a 1U CubeSat. Eng. Appl. Artif. Intell. 2020, 96, 103952. [Google Scholar] [CrossRef]
- Mohanty, S.P.; Czakon, J.; Kaczmarek, K.A.; Pyskir, A.; Tarasiewicz, P.; Kunwar, S.; Rohrbach, J.; Luo, D.; Prasad, M.; Fleer, S.; et al. Deep Learning for Understanding Satellite Imagery: An Experimental Survey. Front. Artif. Intell. 2020, 3, 1–21. [Google Scholar] [CrossRef]
- Cho, D.-H.; Choi, W.-S.; Kim, M.-K.; Kim, J.-H.; Sim, E.; Kim, H.-D. High-Resolution Image and Video CubeSat (HiREV): Development of Space Technology Test Platform Using a Low-Cost CubeSat Platform. Int. J. Aerosp. Eng. 2019, 2019, 8916416. [Google Scholar] [CrossRef]
- Chen, Z.; Yang, T.; Wang, F.; He, W.; Hua, B.; Wu, Y. Ship Detection from Remote Sensing Images Based on Modified Convolution Neural Network. In Proceedings of the International Symposium on Space Technology and Science Aerospace Engineering, Fukui, Japan, 15–21 June 2019. [Google Scholar]
- Mikuriya, W.; Obata, T.; Ikari, S.; Funase, R.; Nakasuka, S. Cooperative Learning Between On-board and Ground Computers for Remote Sensing Image Processing. In Proceedings of the International Symposium on Space Technology and Science Aerospace Engineering, Fukui, Japan, 15–21 June 2019. [Google Scholar]
- Buonaiuto, N.; Kief, C.; Louie, M.; Aarestad, J.; Zufelt, B.; Mital, R.; Mateik, D.; Sivilli, R.; Bhopale, A. Satellite Identification Imaging for Small Satellites Using NVIDIA. In Proceedings of the 31th AIAA/USU Conference on Small Satellites, Logan, UT, USA, 5–10 August 2017. [Google Scholar]
- Szpakowski, D.M.; Jensen, J.L.R. A Review of the Applications of Remote Sensing in Fire Ecology. Remote Sens. 2019, 11, 2638. [Google Scholar] [CrossRef] [Green Version]

Publisher’s Note: MDPI stays neutral with regard to jurisdictional claims in published maps and institutional affiliations. |
© 2022 by the authors. Licensee MDPI, Basel, Switzerland. This article is an open access article distributed under the terms and conditions of the Creative Commons Attribution (CC BY) license (https://creativecommons.org/licenses/by/4.0/).