
The Role of Environmental Water and Reedbed Condition on the Response of Phragmites australis Reedbeds to Flooding


Abstract
:
1. Introduction
2. Methods and Study Design
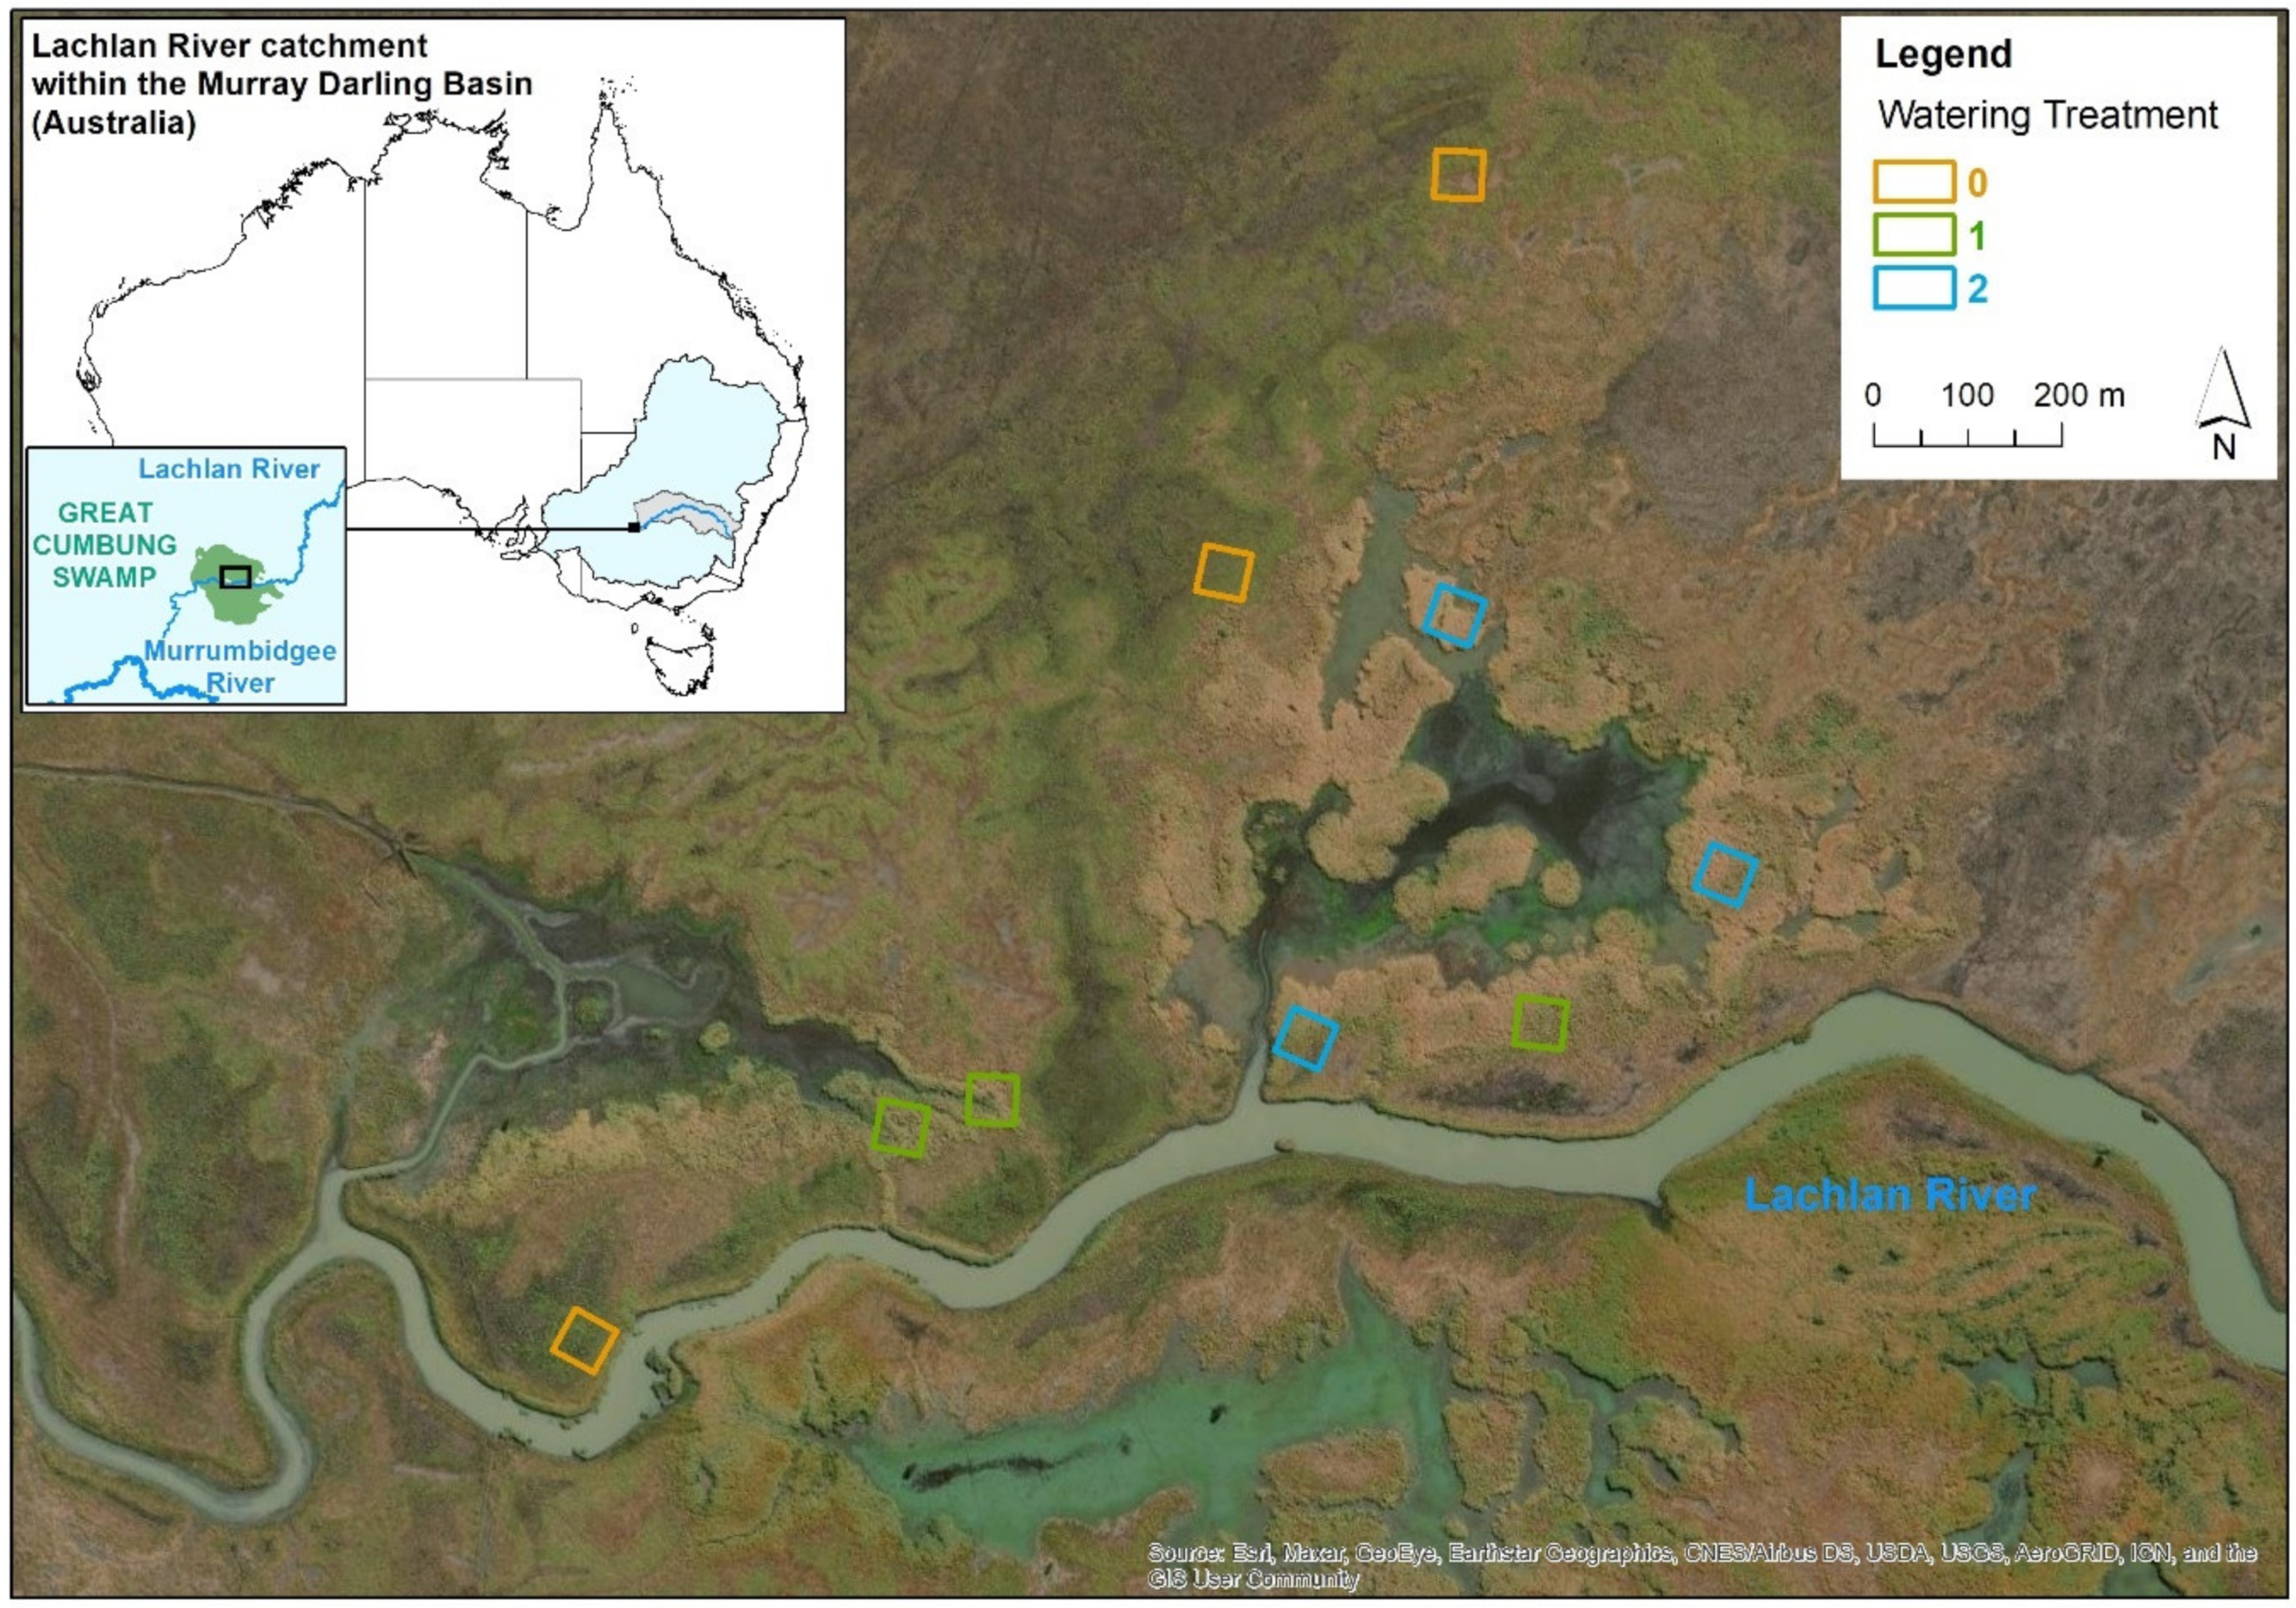
2.1. Study Area
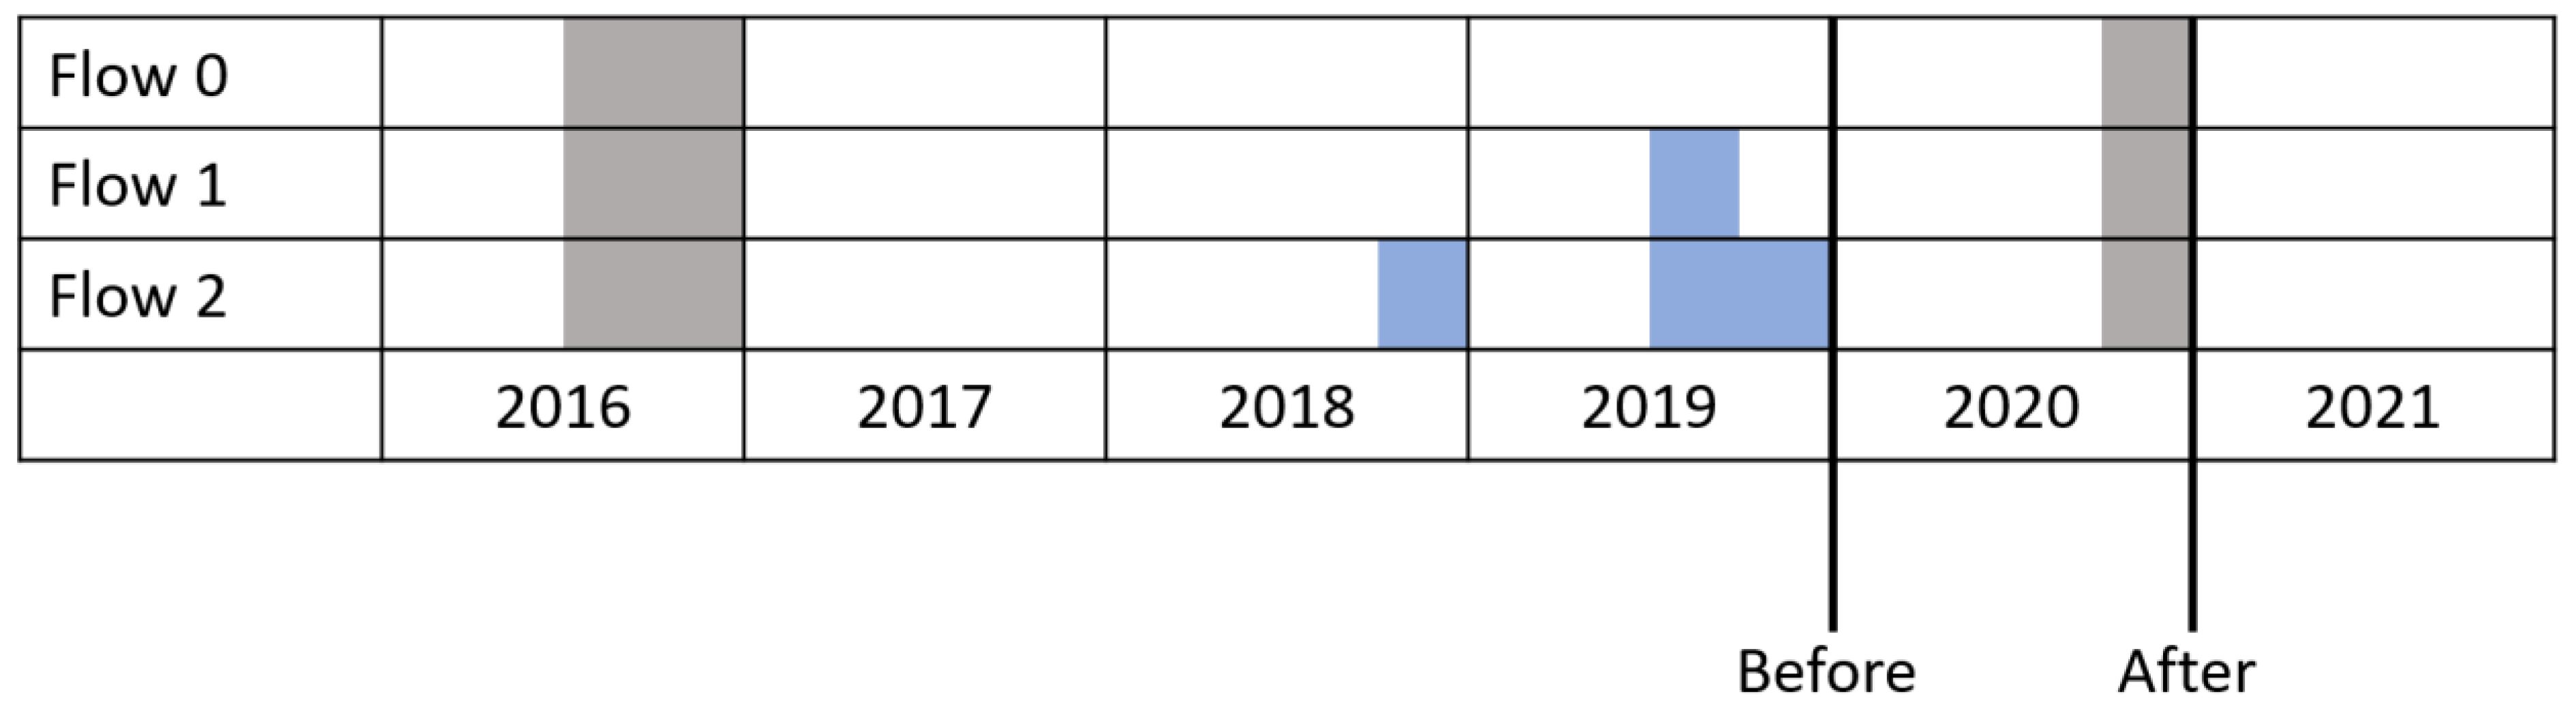
2.2. Site Selection
2.3. Establishing Reedbed Condition
2.4. Monitoring
2.5. Data Analysis
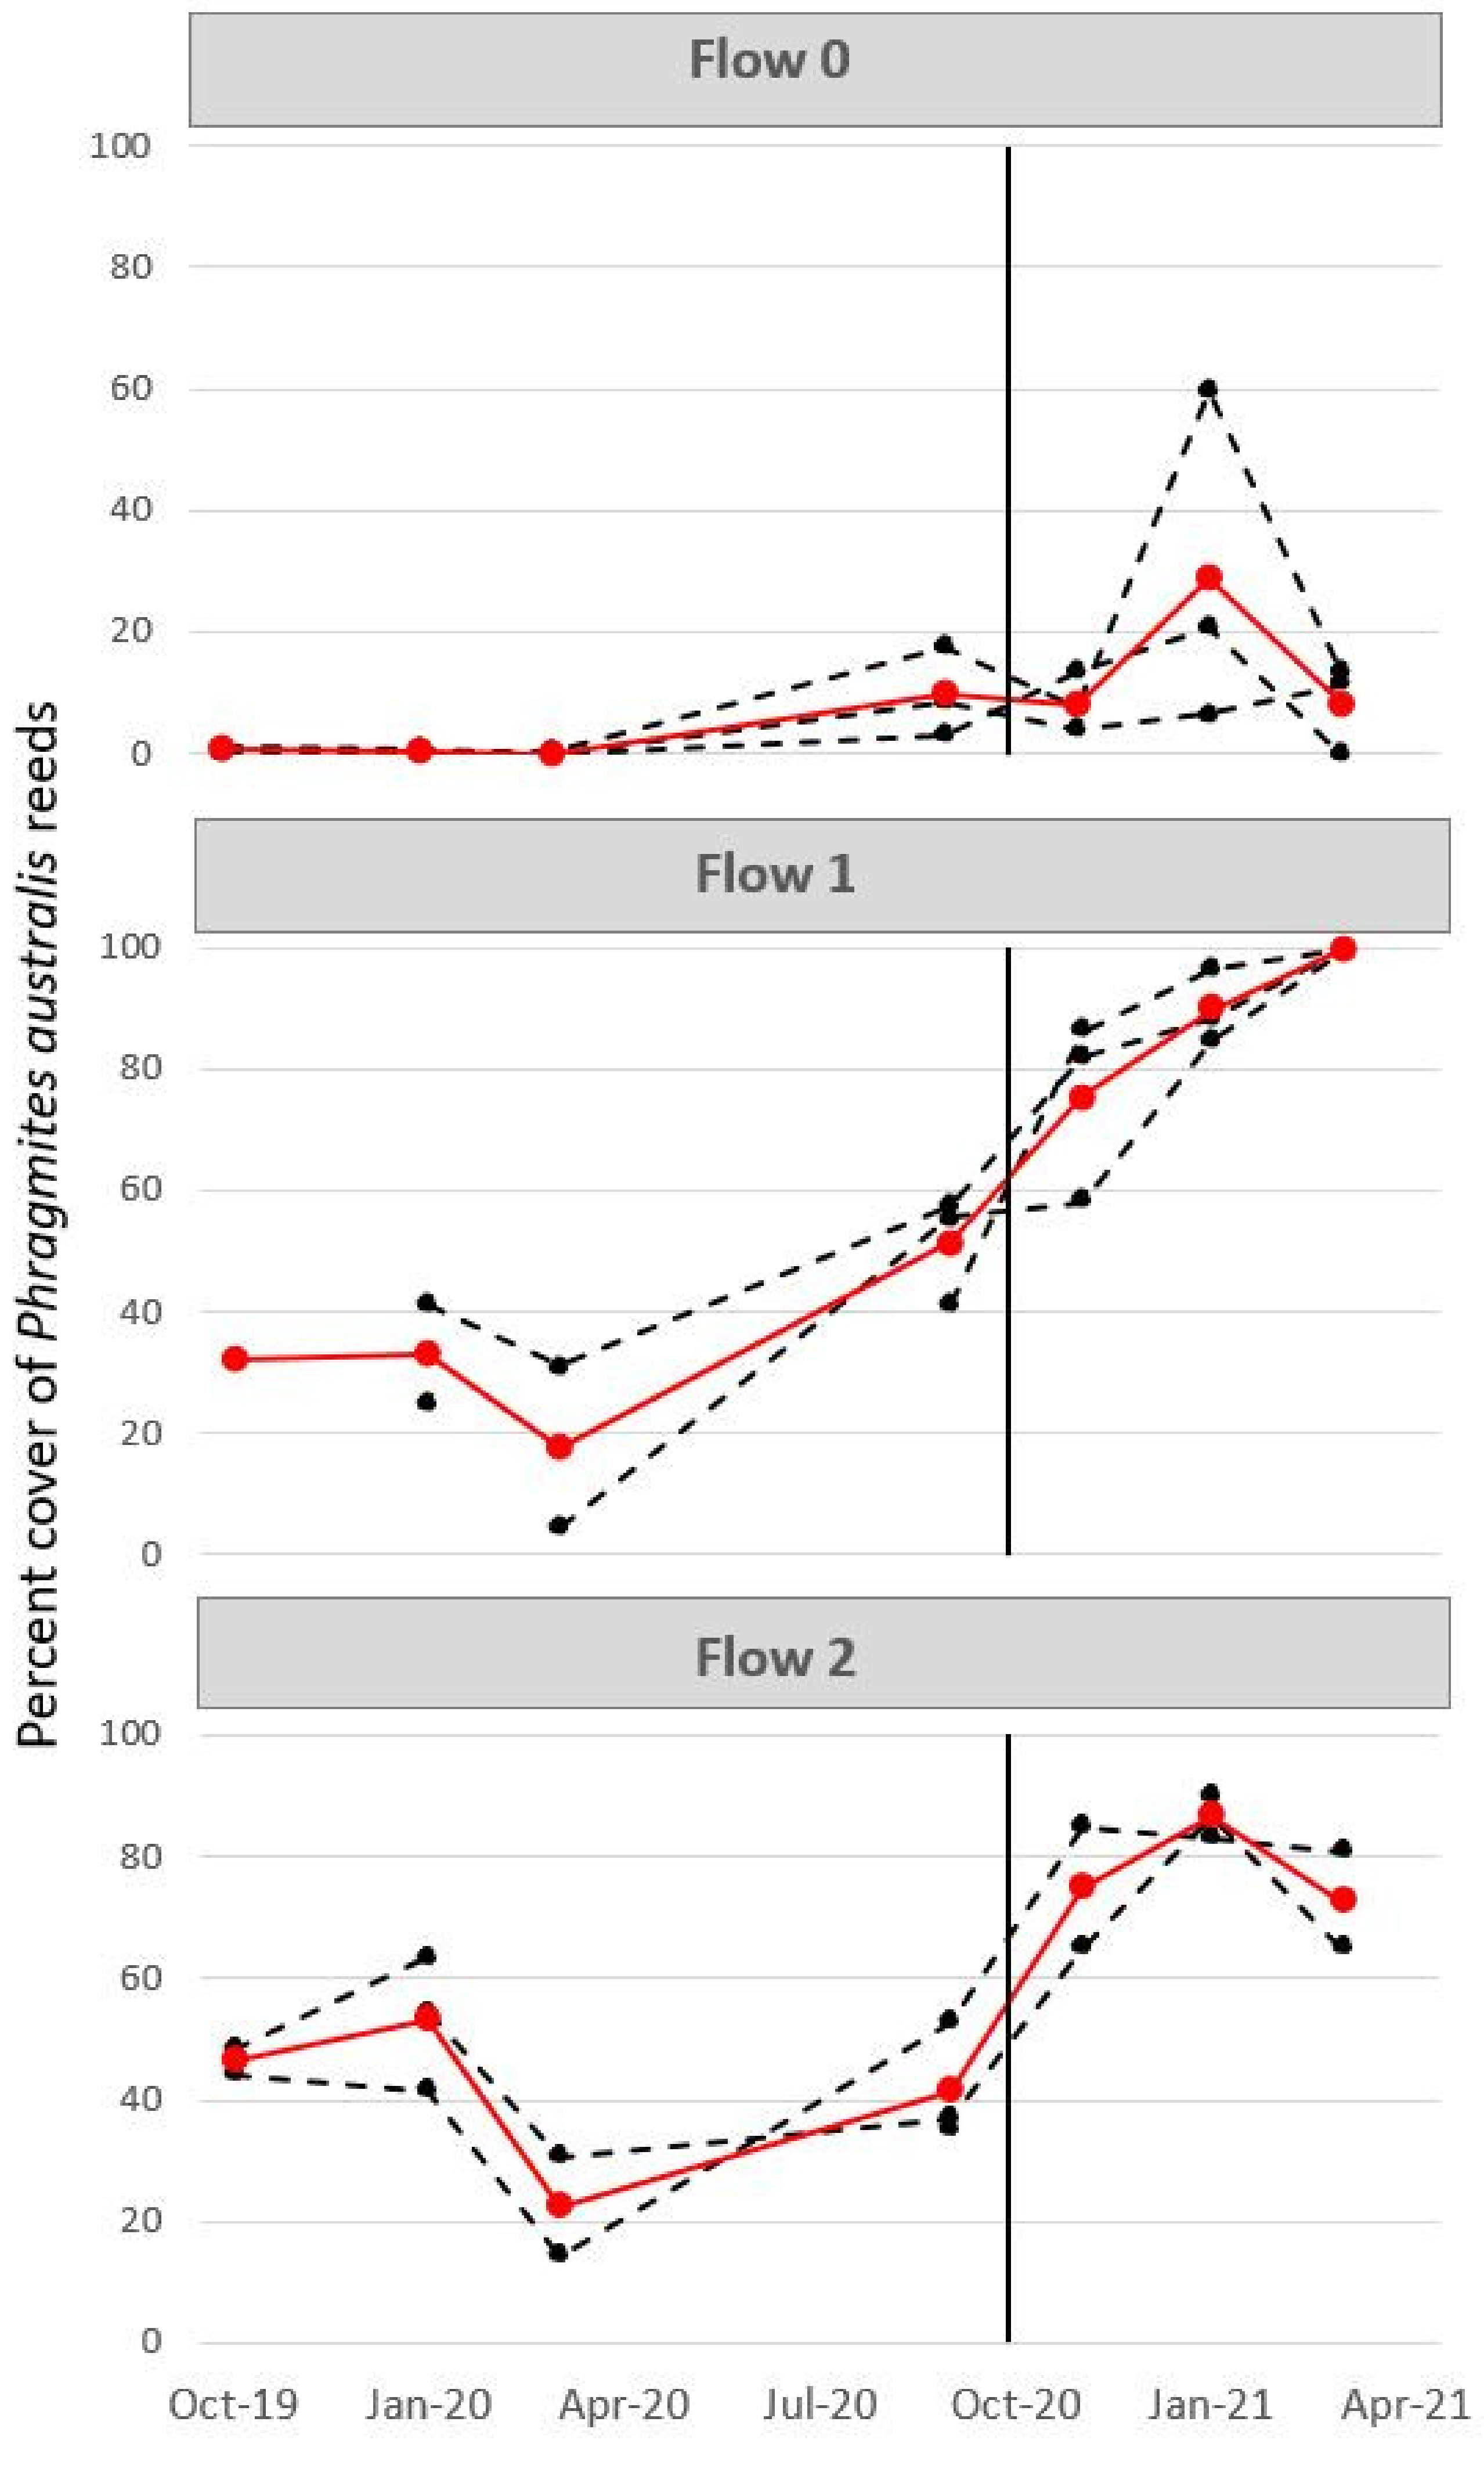
3. Results
4. Discussion
5. Conclusions
Author Contributions
Funding
Data Availability Statement
Acknowledgments
Conflicts of Interest
References
- Davidson, N.C. How much wetland has the world lost? Long-term and recent trends in global wetland area. Mar. Freshw. Res. 2014, 65, 934–941. [Google Scholar] [CrossRef]
- Ward, J.V.; Stanford, J. Ecological connectivity in alluvial river ecosystems and its disruption by flow regulation. Regul. Rivers Res. Manag. 1995, 11, 105–119. [Google Scholar] [CrossRef]
- Poff, N.L.; Olden, J.D.; Merritt, D.M.; Pepin, D.M. Homogenization of regional river dynamics by dams and global biodiversity implications. Proc. Natl. Acad. Sci. USA 2007, 104, 5732–5737. [Google Scholar] [CrossRef] [PubMed] [Green Version]
- Kingsford, R.T. Ecological impacts of dams, water diversions and river management on floodplain wetlands in Australia. Austral. Ecol. 2000, 25, 109–127. [Google Scholar] [CrossRef]
- Higgisson, W.; Higgisson, B.; Powell, M.; Driver, P.; Dyer, F. Impacts of water resource development on hydrological connectivity of different floodplain habitats in a highly variable system. River Res. Appl. 2020, 36, 542–552. [Google Scholar] [CrossRef]
- Bond, N.R.; Grigg, N.; Roberts, J.; McGinness, H.; Nielsen, D.; O’Brien, M.; Overton, I.; Pollino, C.; Reid, J.R.; Stratford, D. Assessment of environmental flow scenarios using state-and-transition models. Freshw. Biol. 2018, 63, 804–816. [Google Scholar] [CrossRef]
- Zedler, J.B.; Kercher, S. Wetlansd resources: Status, trends, ecosystem services, and restorability. Annu. Rev. Environ. Resour. 2005, 30, 39–74. [Google Scholar] [CrossRef] [Green Version]
- Janse, J.H.; van Dam, A.A.; Hes, E.M.; de Klein, J.J.; Finlayson, C.M.; Janssen, A.B.; van Wijk, D.; Mooij, W.M.; Verhoeven, J.T. Towards a global model for wetlands ecosystem services. Curr. Opin. Environ. Sustain. 2019, 36, 11–19. [Google Scholar] [CrossRef]
- Zierholz, C.; Prosser, I.; Fogarty, P.; Rustomji, P. In-stream wetlands and their significance for channel filling and the catchment sediment budget, Jugiong Creek, New South Wales. Geomorphology 2001, 38, 221–235. [Google Scholar] [CrossRef]
- Tanner, C.C. Plants for constructed wetland treatment systems—A comparison of the growth and nutrient uptake of eight emergent species. Ecol. Eng. 1996, 7, 59–83. [Google Scholar] [CrossRef]
- Morganti, M.; Manica, M.; Bogliani, G.; Gustin, M.; Luoni, F.; Trotti, P.; Perin, V.; Brambilla, M. Multi-species habitat models highlight the key importance of flooded reedbeds for inland wetland birds: Implications for management and conservation. Avian Res. 2019, 10, 15. [Google Scholar] [CrossRef] [Green Version]
- Eller, F.; Skálová, H.; Caplan, J.S.; Bhattarai, G.P.; Burger, M.K.; Cronin, J.T.; Guo, W.-Y.; Guo, X.; Hazelton, E.L.; Kettenring, K.M. Cosmopolitan species as models for ecophysiological responses to global change: The common reed Phragmites australis. Front. Plant Sci. 2017, 8, 1833. [Google Scholar] [CrossRef] [PubMed] [Green Version]
- Ostendorp, W. ‘Die-back’ of reeds in Europe—A critical review of literature. Aquat. Bot. 1989, 35, 5–26. [Google Scholar] [CrossRef] [Green Version]
- Thomas, R.; Bowen, S.; Simpson, S.; Cox, S.; Sims, N.; Hunter, S.; Lu, Y. Inundation response of vegetation communities of the Macquarie Marshes in semi-arid Australia. Ecosyst. Response Model. Murray-Darling Basin 2010, 9, 137–150. [Google Scholar]
- Roberts, J. Changes in Phragmites australis in south-eastern Australia: A habitat assessment. Folia Geobot. 2000, 35, 353–362. [Google Scholar] [CrossRef]
- Galatowitsch, S.M.; Anderson, N.O.; Ascher, P.D. Invasiveness in wetland plants in temperate North America. Wetlands 1999, 19, 733–755. [Google Scholar] [CrossRef]
- Chambers, R.M.; Meyerson, L.A.; Saltonstall, K. Expansion of Phragmites australis into tidal wetlands of North America. Aquat. Bot. 1999, 64, 261–273. [Google Scholar] [CrossRef]
- Whitaker, K.; Rogers, K.; Saintilan, N.; Mazumder, D.; Wen, L.; Morrison, R.J. Vegetation persistence and carbon storage: Implications for environmental water management for Phragmites australis. Water Resour. Res. 2015, 51, 5284–5300. [Google Scholar] [CrossRef]
- Baldwin, D.S.; Rees, G.N.; Wilson, J.S.; Colloff, M.J.; Whitworth, K.L.; Pitman, T.L.; Wallace, T.A. Provisioning of bioavailable carbon between the wet and dry phases in a semi-arid floodplain. Oecologia 2013, 172, 539–550. [Google Scholar] [CrossRef]
- Higgisson, W.; Cobb, A.; Tschierschke, A.; Dyer, F. Estimating the cover of Phragmites australis using unmanned aerial vehicles and neural networks in a semi-arid wetland. River Res. Appl. 2021, 37, 1312–1322. [Google Scholar] [CrossRef]
- Page, K.; Read, A.; Frazier, P.; Mount, N. The effect of altered flow regime on the frequency and duration of bankfull discharge: Murrumbidgee River, Australia. River Res. Appl. 2005, 21, 567–578. [Google Scholar] [CrossRef]
- Grafton, R.Q.; Hussey, K. Buying back the living Murray: At what price? Aust. J. Environ. Manag. 2007, 14, 74–81. [Google Scholar] [CrossRef]
- Arthington, A.H.; Pusey, B.J. Flow restoration and protection in Australian rivers. River Res. Appl. 2003, 19, 377–395. [Google Scholar] [CrossRef]
- Garrick, D.; Siebentritt, M.A.; Aylward, B.; Bauer, C.J.; Purkey, A. Water markets and freshwater ecosystem services: Policy reform and implementation in the Columbia and Murray-Darling Basins. Ecol. Econ. 2009, 69, 366–379. [Google Scholar] [CrossRef]
- Nilsson, C.; Berggren, K. Alterations of riparian ecosystems caused by river regulation: Dam operations have caused global-scale ecological changes in riparian ecosystems. How to protect river environments and human needs of rivers remains one of the most important questions of our time. BioScience 2000, 50, 783–792. [Google Scholar]
- Bunn, S.E.; Arthington, A.H. Basic principles and ecological consequences of altered flow regimes for aquatic biodiversity. Environ. Manag. 2002, 30, 492–507. [Google Scholar] [CrossRef] [Green Version]
- Richter, B.D.; Warner, A.T.; Meyer, J.L.; Lutz, K. A collaborative and adaptive process for developing environmental flow recommendations. River Res. Appl. 2006, 22, 297–318. [Google Scholar] [CrossRef]
- Pahl-Wostl, C.; Arthington, A.; Bogardi, J.; Bunn, S.E.; Hoff, H.; Lebel, L.; Nikitina, E.; Palmer, M.; Poff, L.N.; Richards, K. Environmental flows and water governance: Managing sustainable water uses. Curr. Opin. Environ. Sustain. 2013, 5, 341–351. [Google Scholar] [CrossRef]
- Poff, N.L.; Richter, B.D.; Arthington, A.H.; Bunn, S.E.; Naiman, R.J.; Kendy, E.; Acreman, M.; Apse, C.; Bledsoe, B.P.; Freeman, M.C. The ecological limits of hydrologic alteration (ELOHA): A new framework for developing regional environmental flow standards. Freshw. Biol. 2010, 55, 147–170. [Google Scholar] [CrossRef] [Green Version]
- Roberts, J.; Marston, F. Water Regime for Wetland and Floodplain Plants: A Source Book for the Murray-Darling Basin; National Water Commission: Canberra, Australia, 2011. [Google Scholar]
- Campbell, C.J.; Thompson, R.M.; Capon, S.J.; Dyer, F.J. Rethinking condition: Measuring and evaluating wetland vegetation responses to water management. Front. Environ. Sci. 2022, 9, 801250. [Google Scholar] [CrossRef]
- Camarretta, N.; Harrison, P.A.; Bailey, T.; Potts, B.; Lucieer, A.; Davidson, N.; Hunt, M. Monitoring forest structure to guide adaptive management of forest restoration: A review of remote sensing approaches. N. For. 2020, 51, 573–596. [Google Scholar] [CrossRef]
- Samiappan, S.; Turnage, G.; Hathcock, L.; Casagrande, L.; Stinson, P.; Moorhead, R. Using unmanned aerial vehicles for high-resolution remote sensing to map invasive Phragmites australis in coastal wetlands. Int. J. Remote Sens. 2017, 38, 2199–2217. [Google Scholar] [CrossRef]
- Wagner, F.H.; Sanchez, A.; Tarabalka, Y.; Lotte, R.G.; Ferreira, M.P.; Aidar, M.P.; Gloor, E.; Phillips, O.L.; Aragao, L.E. Using the U-net convolutional network to map forest types and disturbance in the Atlantic rainforest with very high resolution images. Remote Sens. Ecol. Conserv. 2019, 5, 360–375. [Google Scholar] [CrossRef] [Green Version]
- Kattenborn, T.; Eichel, J.; Fassnacht, F.E. Convolutional Neural Networks enable efficient, accurate and fine-grained segmentation of plant species and communities from high-resolution UAV imagery. Sci. Rep. 2019, 9, 17656. [Google Scholar] [CrossRef]
- Howard, R.J.; Turluck, T.D. Phragmites australis expansion in a restored brackish marsh: Documentation at different time scales. Wetlands 2013, 33, 207–215. [Google Scholar] [CrossRef]
- MDBA. Assessment of Environmental Water Requirements for the Proposed Basin Plan: Great Cumbung Swamp; MDBA: Canberra, Australia, 2012. [Google Scholar]
- Maher, P.N. Bird Survey of the Lachlan/Murrumbidgee Confluence Wetlands; NSW National Parks and Wildlife Service Griffith: Griffith, Australia, 1990. [Google Scholar]
- Driver, P.D.; Barbour, E.; Michener, K. An Integrated Surface Water, Groundwater and Wetland Plant Model of Drought Response and Recovery for Environmental Water Management. In Proceedings of the 19th International Congress on Modelling and Simulation, Perth, Australia, 12–16 December 2011; pp. 12–16. [Google Scholar]
- O’Brien, P.; Burne, R. The Great Cumbung Swamp–Terminus of the low-gradient Lachlan River, Eastern Australia. AGSO J. Aust. Geol. Geophys. 1994, 15, 223–234. [Google Scholar]
- Bureau of Meteorology, Australian Government. Climate Statistics for Australian Locations, Summary Statistics Collector (Oxley (Walmer Downs)). Available online: http://www.bom.gov.au/jsp/ncc/cdio/weatherData/av?p_nccObsCode=136&p_display_type=dailyDataFile&p_startYear=2021&p_c=-481293988&p_stn_num=049055 (accessed on 9 November 2021).
- Driver, P.; Chowdhury, S.H.T.; Lloyd-Jones, P.; Raisin, G.; Ribbons, C.; Singh, G.; Wettin, P. Natural and Modified Flows of the Lachlan Valley Wetlands; NSW Department of Infrastructure, Planning and Natural Resources, Central West Region, Ed.; Resource Analysis Unit, NSW Department of Infrastructure, Planning and Natural Resources: Forbes, Australia, 2004. [Google Scholar]
- Dyer, F.; Broadhurst, B.; Tschierschke, A.; Higgisson, W.; Thompson, R.; Clear, R.; Driver, P.; Bowen, S.; Lenehan, J.; Thomas, R.; et al. Commonwealth Environmental Water Office Lachlan Selected Area Monitoring, Evaluation and Research Plan (2019–2022); Australia Commonwealth Environmental Water Office: Canberra, Australia, 2019. [Google Scholar]
- Gibbons, P.; Zerger, A.; Jones, S.; Ryan, P. Mapping Vegetation Condition in the Context of Biodiversity Conservation. Ecol. Manag. Restor. 2006, 7, S1–S2. [Google Scholar] [CrossRef]
- Poulin, B.; Davranche, A.; Lefebvre, G. Ecological assessment of Phragmites australis wetlands using multi-season SPOT-5 scenes. Remote Sens. Environ. 2010, 114, 1602–1609. [Google Scholar] [CrossRef] [Green Version]
- Hawke, C.; José, P. Reedbed Management for Commercial and Wildlife Interests; Royal Society for the Protection of Birds: London, UK, 1996. [Google Scholar]
- Corti Meneses, N.; Baier, S.; Geist, J.; Schneider, T. Evaluation of Green-LiDAR Data for Mapping Extent, Density and Height of Aquatic Reed Beds at Lake Chiemsee, Bavaria—Germany. Remote Sens. 2017, 9, 1308. [Google Scholar] [CrossRef] [Green Version]
- Overton, I.; Pollino, C.; Roberts, J.; Reid, J.; Bond, N.; McGinness, H.; Gawne, B.; Stratford, D.; Merrin, L.; Barma, D. Development of the Murray-Darling Basin Plan SDL Adjustment Ecological Elements Method; CSIRO for the Murray-Darling Basin Authority: Canberra, Australia, 2014. [Google Scholar]
- Dyer, F.; Broadhurst, B.; Tschierchke, A.; Higgisson, W.; Thompson, R.; Kerezsy, A.; Lenehan, J.; Thiem, J.; Wright, D. Commonwealth Environmental Water Office Monitoring, Evaluation and Research Program: Lachlan River System, 2019–2020 Technical Report; Australia Commonwealth Environmental Water Office: Canberra, Australia, 2020. [Google Scholar]
- Bond, N.R.; Lake, P.S.; Arthington, A.H. The impacts of drought on freshwater ecosystems: An Australian perspective. Hydrobiologia 2008, 600, 3–16. [Google Scholar] [CrossRef] [Green Version]
- Pagter, M.; Bragato, C.; Brix, H. Tolerance and physiological responses of Phragmites australis to water deficit. Aquat. Bot. 2005, 81, 285–299. [Google Scholar] [CrossRef]
- Dyer, F.; Campbell, C.; Higgisson, W.; Tschierschke, A.; Doody, T. Basin-Scale Evaluation of Commonwealth Environmental Water: Vegetation Theme. Flow MER Program; Commonwealth Environmental Water Office (CEWO) Monitoring, Ed.; Department of Agriculture, Water and the Environment: Canberra, Australia, 2021. [Google Scholar]

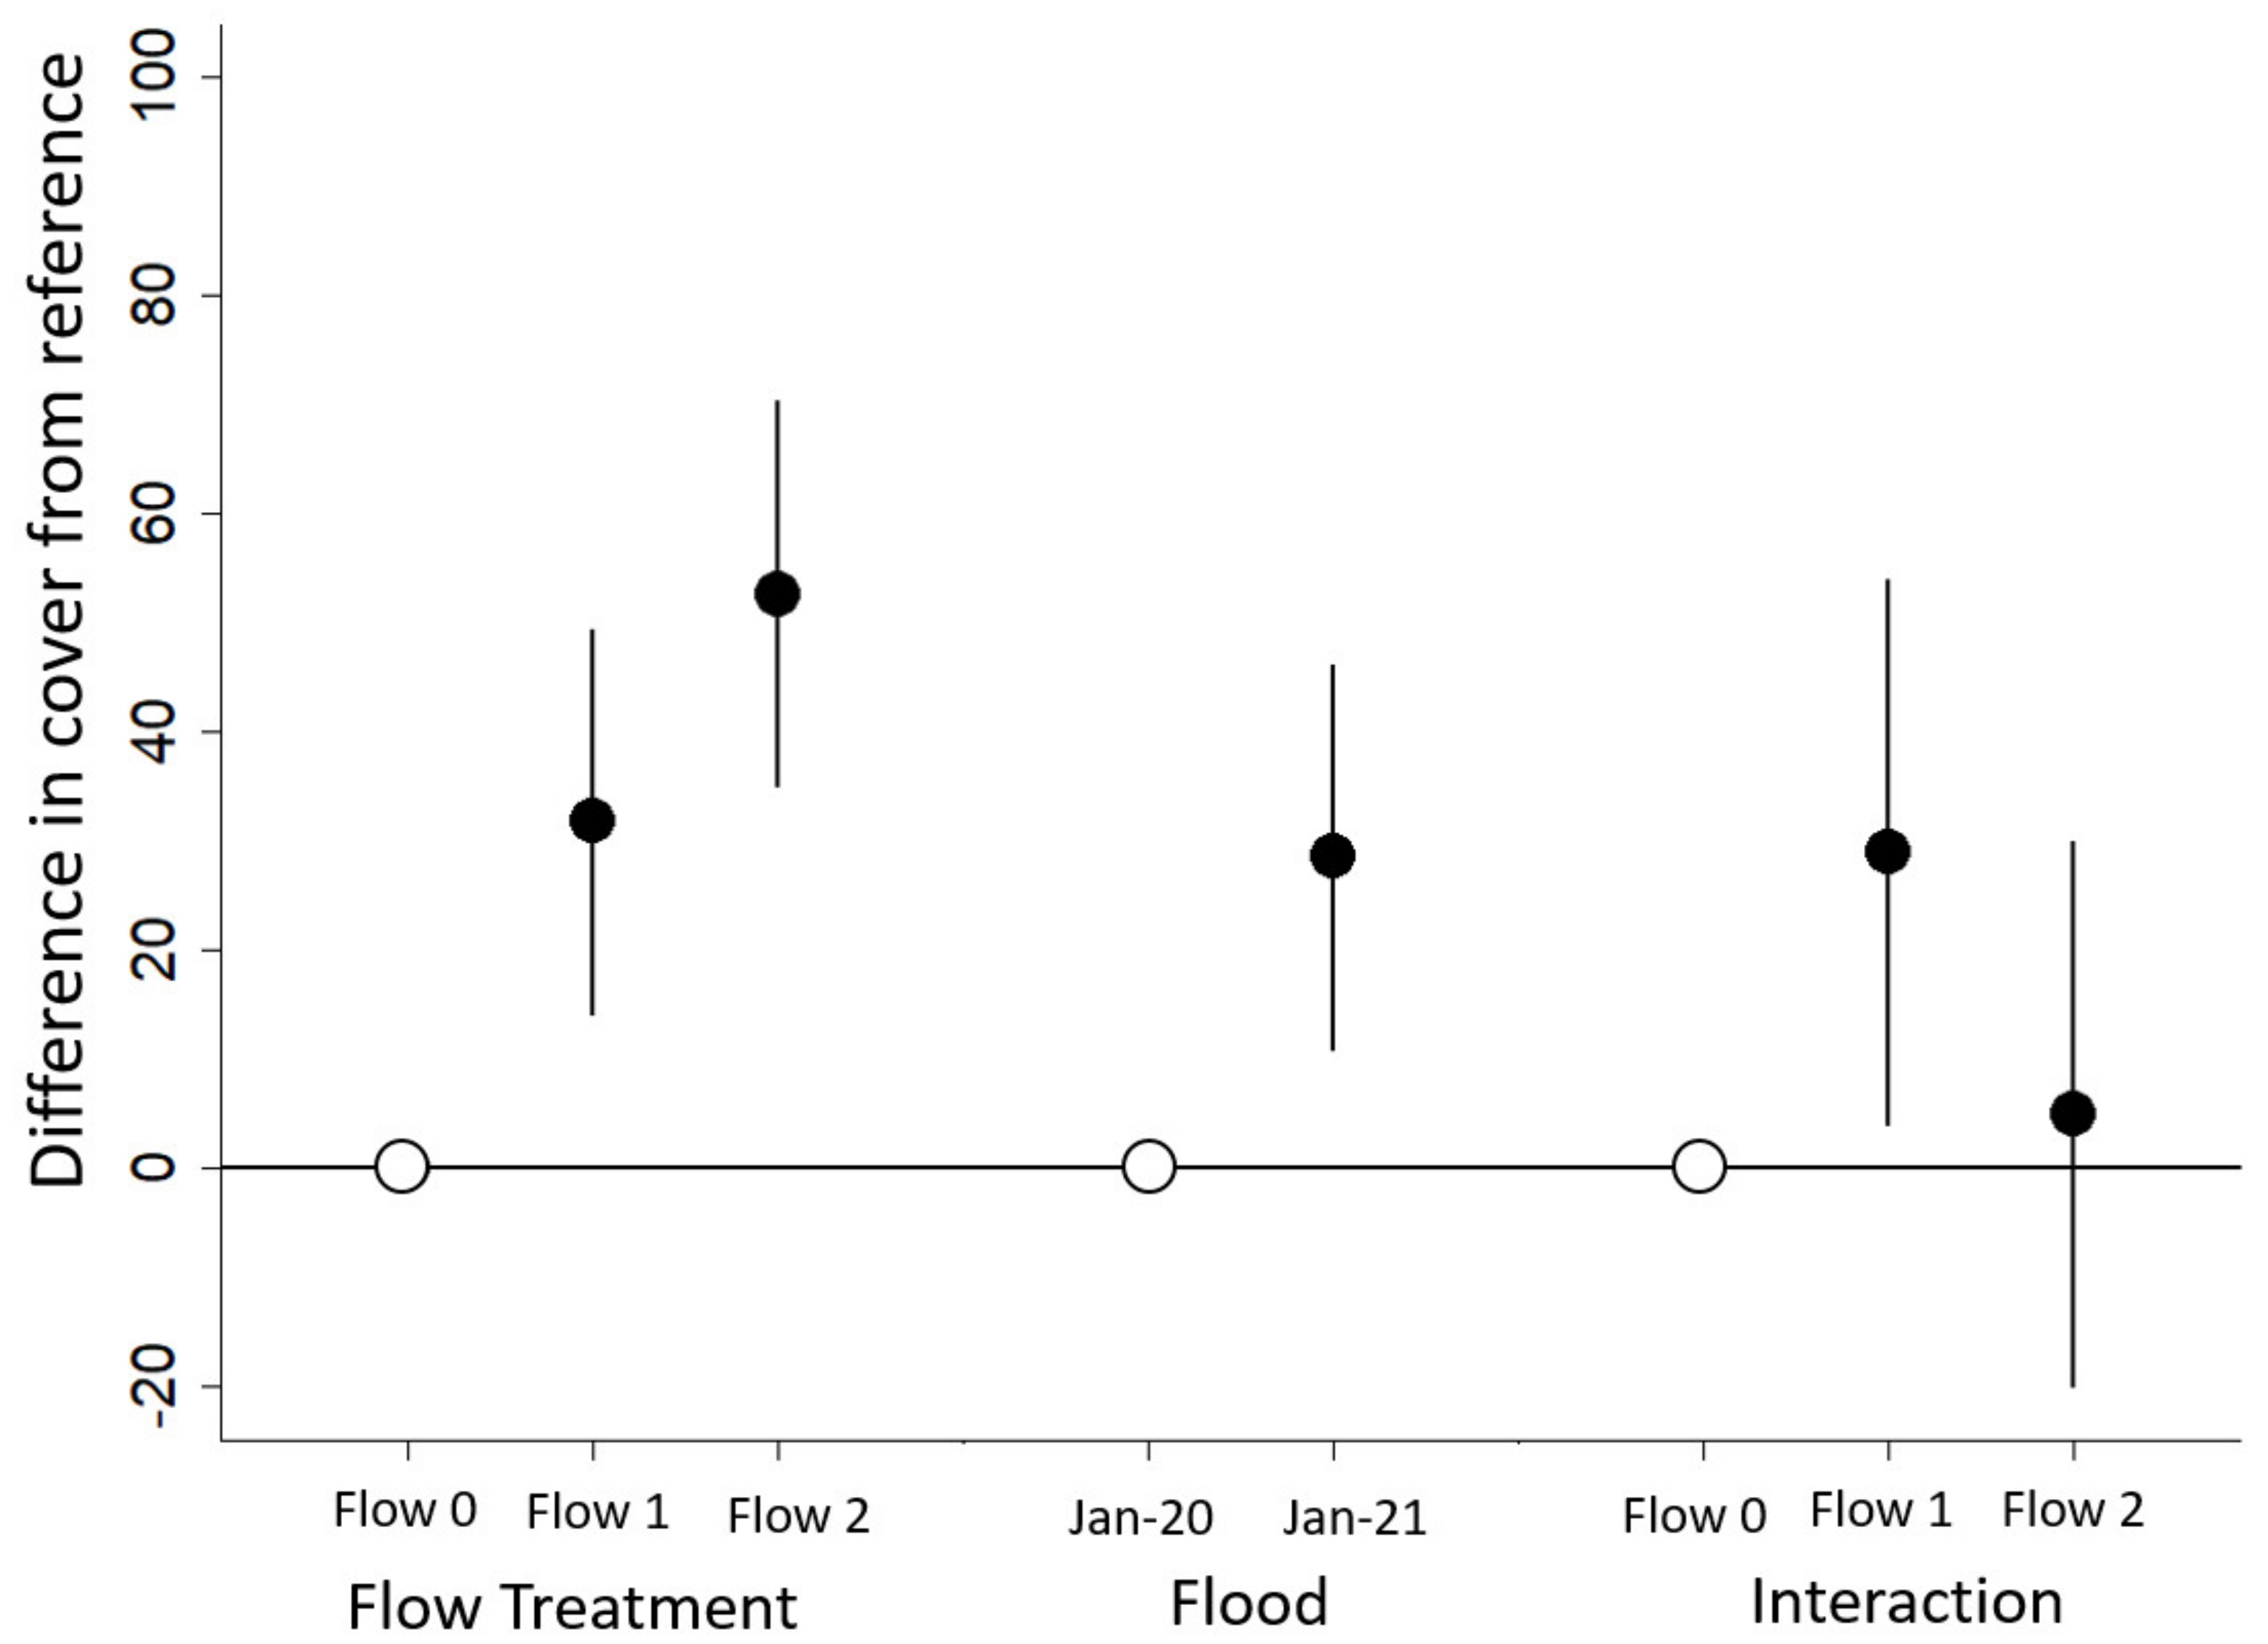
| Fixed Effects | Estimate | Standard Error | t-Values | p-Values |
|---|---|---|---|---|
| Intercept | 0.3309 | 7.3857 | 0.045 | |
| January 2020 Flow 1 | 31.8371 | 10.4450 | 3.048 | 0.0101 * |
| January 2020 Flow 2 | 52.7111 | 10.4450 | 5.047 | 0.0003 * |
| January 2021 | 28.5957 | 10.4401 | 2.739 | 0.0339 * |
| January 2021 Flow 1 | 29.0043 | 14.7645 | 1.964 | 0.0971 |
| January 2021 Flow 2 | 5.0118 | 14.7645 | 0.339 | 0.7458 |
Publisher’s Note: MDPI stays neutral with regard to jurisdictional claims in published maps and institutional affiliations. |
© 2022 by the authors. Licensee MDPI, Basel, Switzerland. This article is an open access article distributed under the terms and conditions of the Creative Commons Attribution (CC BY) license (https://creativecommons.org/licenses/by/4.0/).
Share and Cite
Higgisson, W.; Cobb, A.; Tschierschke, A.; Dyer, F. The Role of Environmental Water and Reedbed Condition on the Response of Phragmites australis Reedbeds to Flooding. Remote Sens. 2022, 14, 1868. https://doi.org/10.3390/rs14081868
Higgisson W, Cobb A, Tschierschke A, Dyer F. The Role of Environmental Water and Reedbed Condition on the Response of Phragmites australis Reedbeds to Flooding. Remote Sensing. 2022; 14(8):1868. https://doi.org/10.3390/rs14081868
Chicago/Turabian StyleHiggisson, William, Adrian Cobb, Alica Tschierschke, and Fiona Dyer. 2022. "The Role of Environmental Water and Reedbed Condition on the Response of Phragmites australis Reedbeds to Flooding" Remote Sensing 14, no. 8: 1868. https://doi.org/10.3390/rs14081868
APA StyleHiggisson, W., Cobb, A., Tschierschke, A., & Dyer, F. (2022). The Role of Environmental Water and Reedbed Condition on the Response of Phragmites australis Reedbeds to Flooding. Remote Sensing, 14(8), 1868. https://doi.org/10.3390/rs14081868