Broadscale Landscape Mapping Provides Insight into the Commonwealth of Dominica and Surrounding Islands Offshore Environment
Abstract
1. Introduction
Approach
2. Materials and Methods
2.1. Study Area
2.2. Data
2.2.1. Bathymetric Data
2.2.2. Satellite and Oceanographic Model Derived Variables
2.3. Landscape Mapping
- Principal component analysis (PCA). PCA was conducted on the nine input variables to reduce the data to linearly independent Principal Components (PCs) and remove collinearity. These PCs account for the greatest variance in the data without needing to predetermine which variables should be used for the analysis. PCs with eigenvalues less than 1 are traditionally discarded following the Kaiser-Guttman criterion; however, the initial eigenvalues calculated from the larger dataset had one borderline value and so the study was performed using both values >1 and >0.97. A Varimax rotation of the retained PCs was performed, to clarify the loadings matrix structure, and the subsequent analysis was performed on the resulting rotated PCs (RPCs).
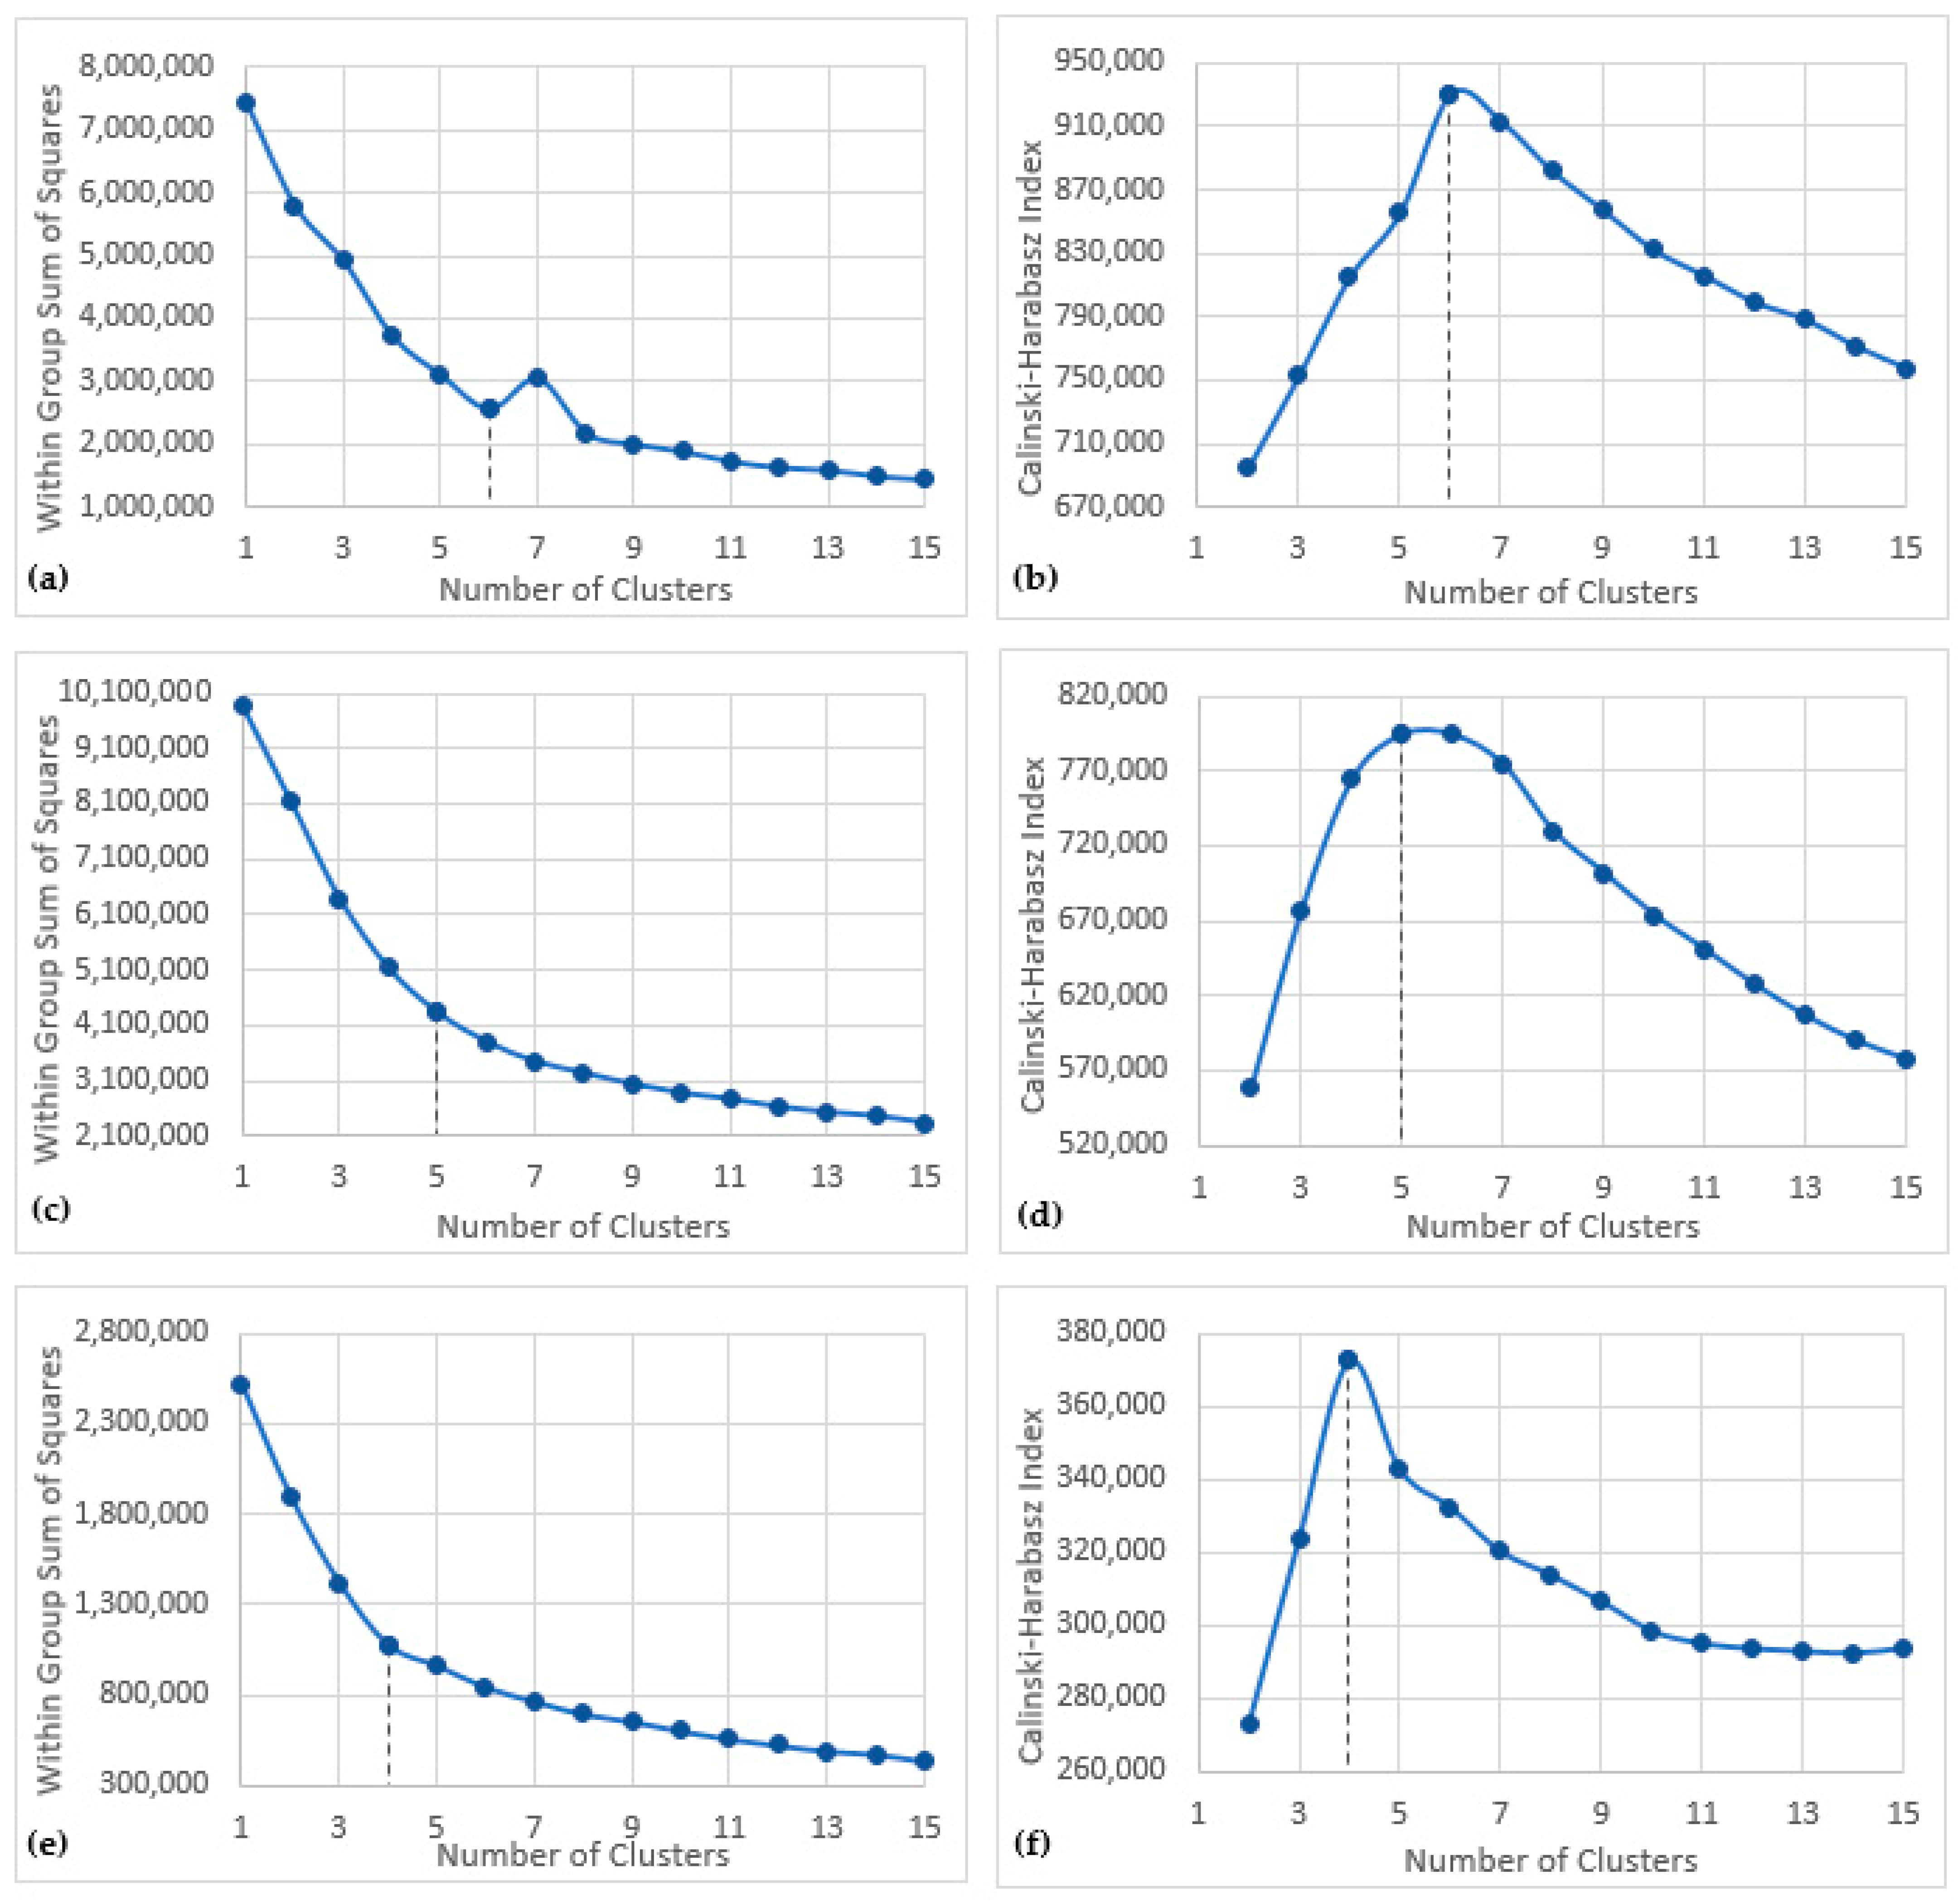
- Determine optimum number of clusters. A predefined number of clusters must be input into the K-means clustering algorithm. Here we used both the Calinski-Harabasz index (C-H) [40] and the elbow method [22] to determine the number of clusters. The C-H index is the ratio of the sum of inter-cluster variance to the intra-cluster variance; the highest value indicates the optimum number of clusters. The elbow method assesses the variance within clusters against a range of cluster values (here 1–15). The point at which increasing the number of clusters does not significantly lower the intra-cluster variance is the optimum number of clusters.
- K-means clustering. K-means clustering is a common algorithm used to partition marine environmental data [17,41]. The number of clusters for K-means clustering must be specified for this analysis; both the Calinski-Harabasz index (C-H) [40] and the elbow method [22] will be used to determine this value in an objective way. The K-means clustering algorithm uses an iterative method, whereby cluster centres are randomly allocated, and each data point is temporarily assigned to the cluster that minimises the distance between the focal point and the centre of the cluster in the multidimensional PC space. The centre points are then repeatedly shifted, the distances recalculated, and the data points re-allocated to the closest cluster centres, until the positions of the centroids are optimal or until the specified number of iterations has been reached.
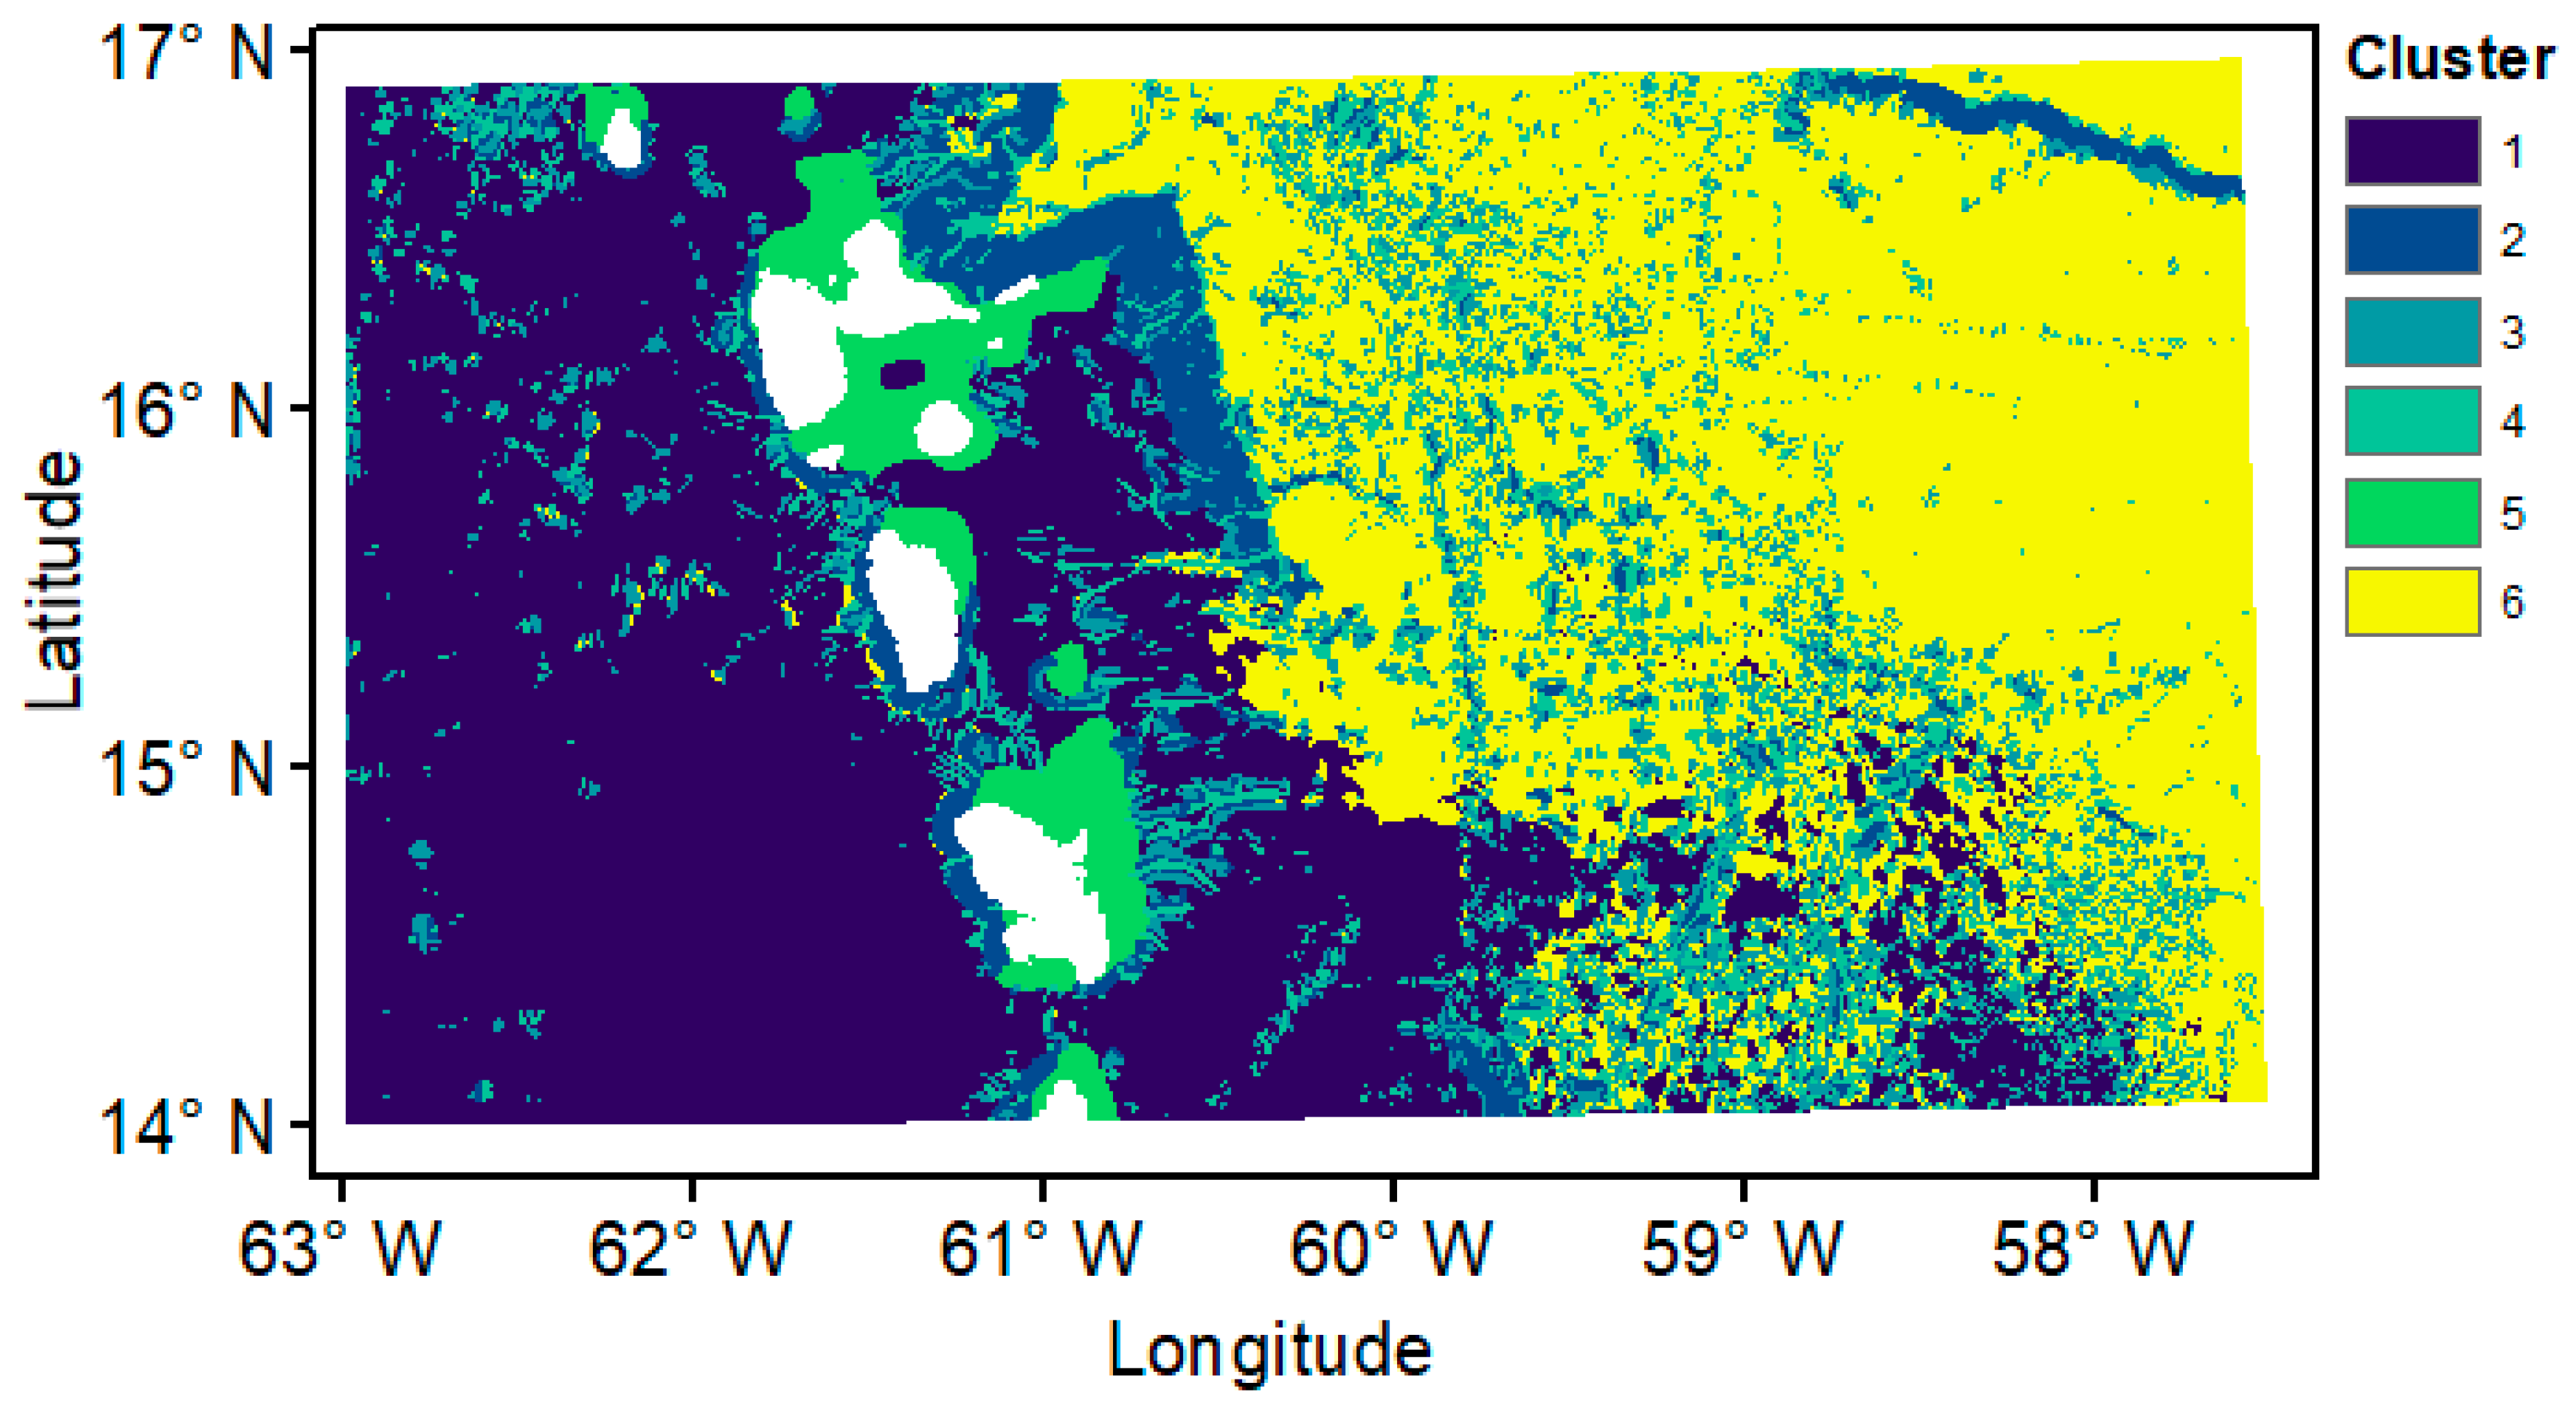
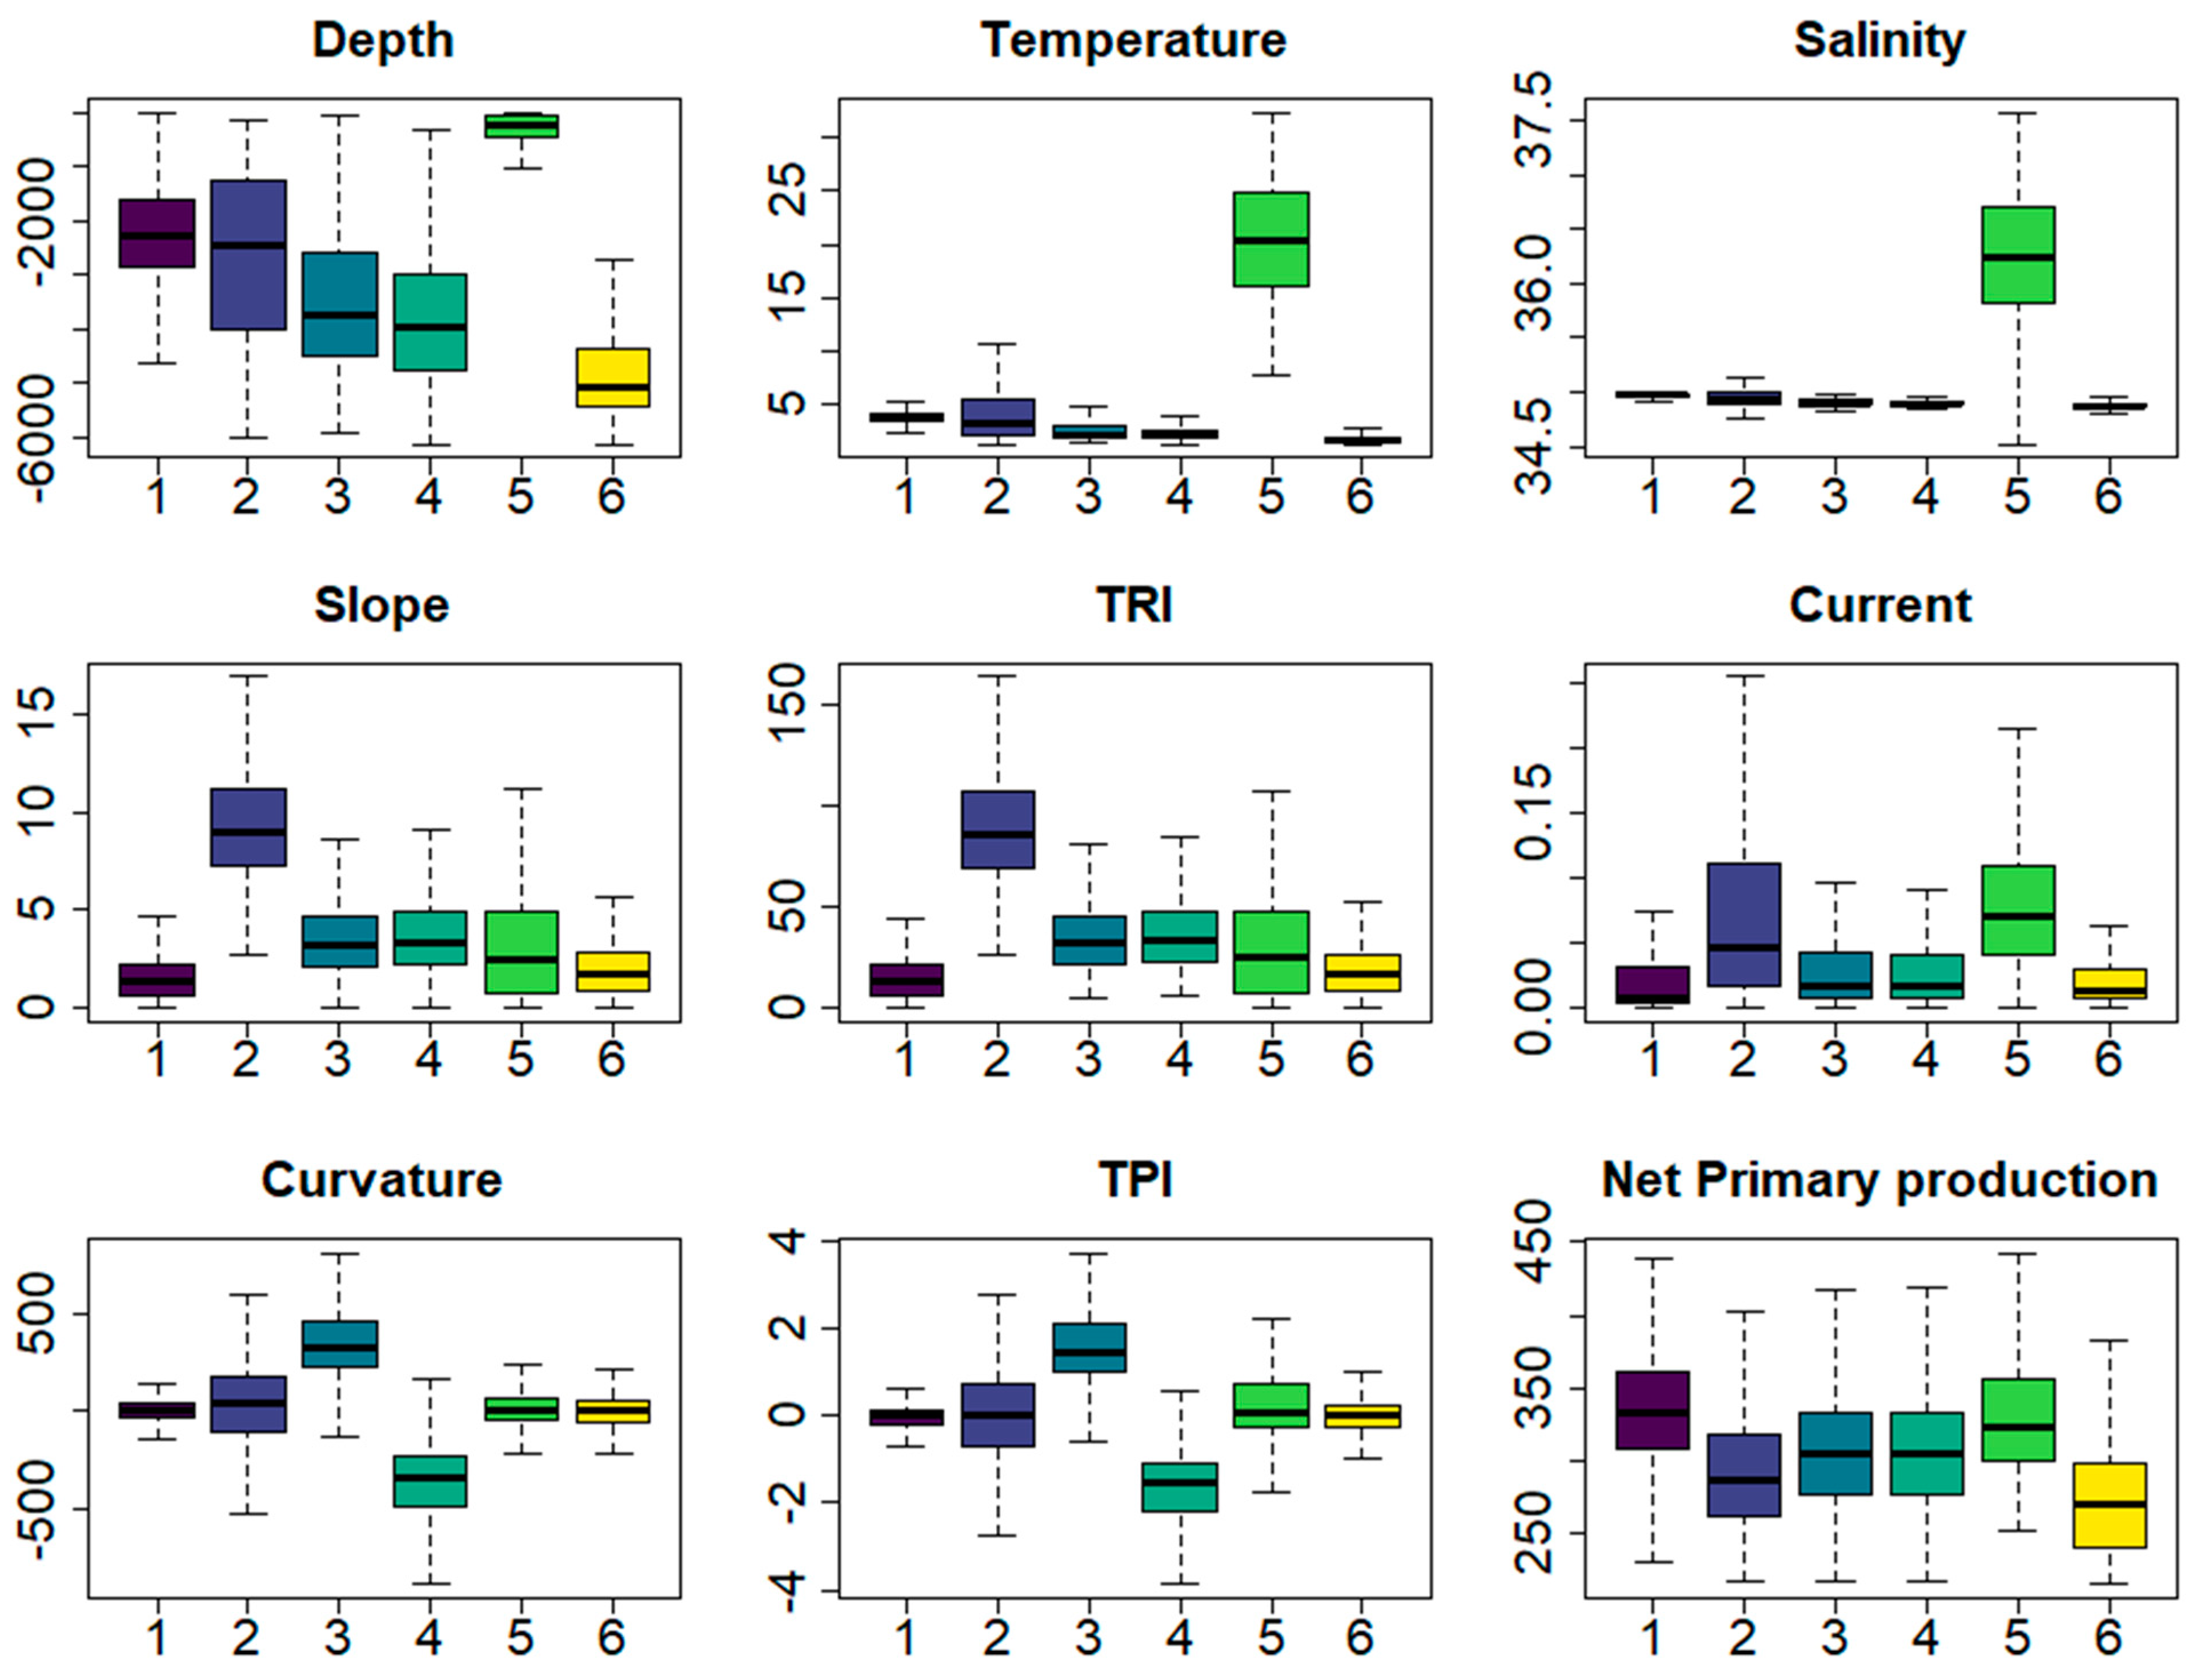
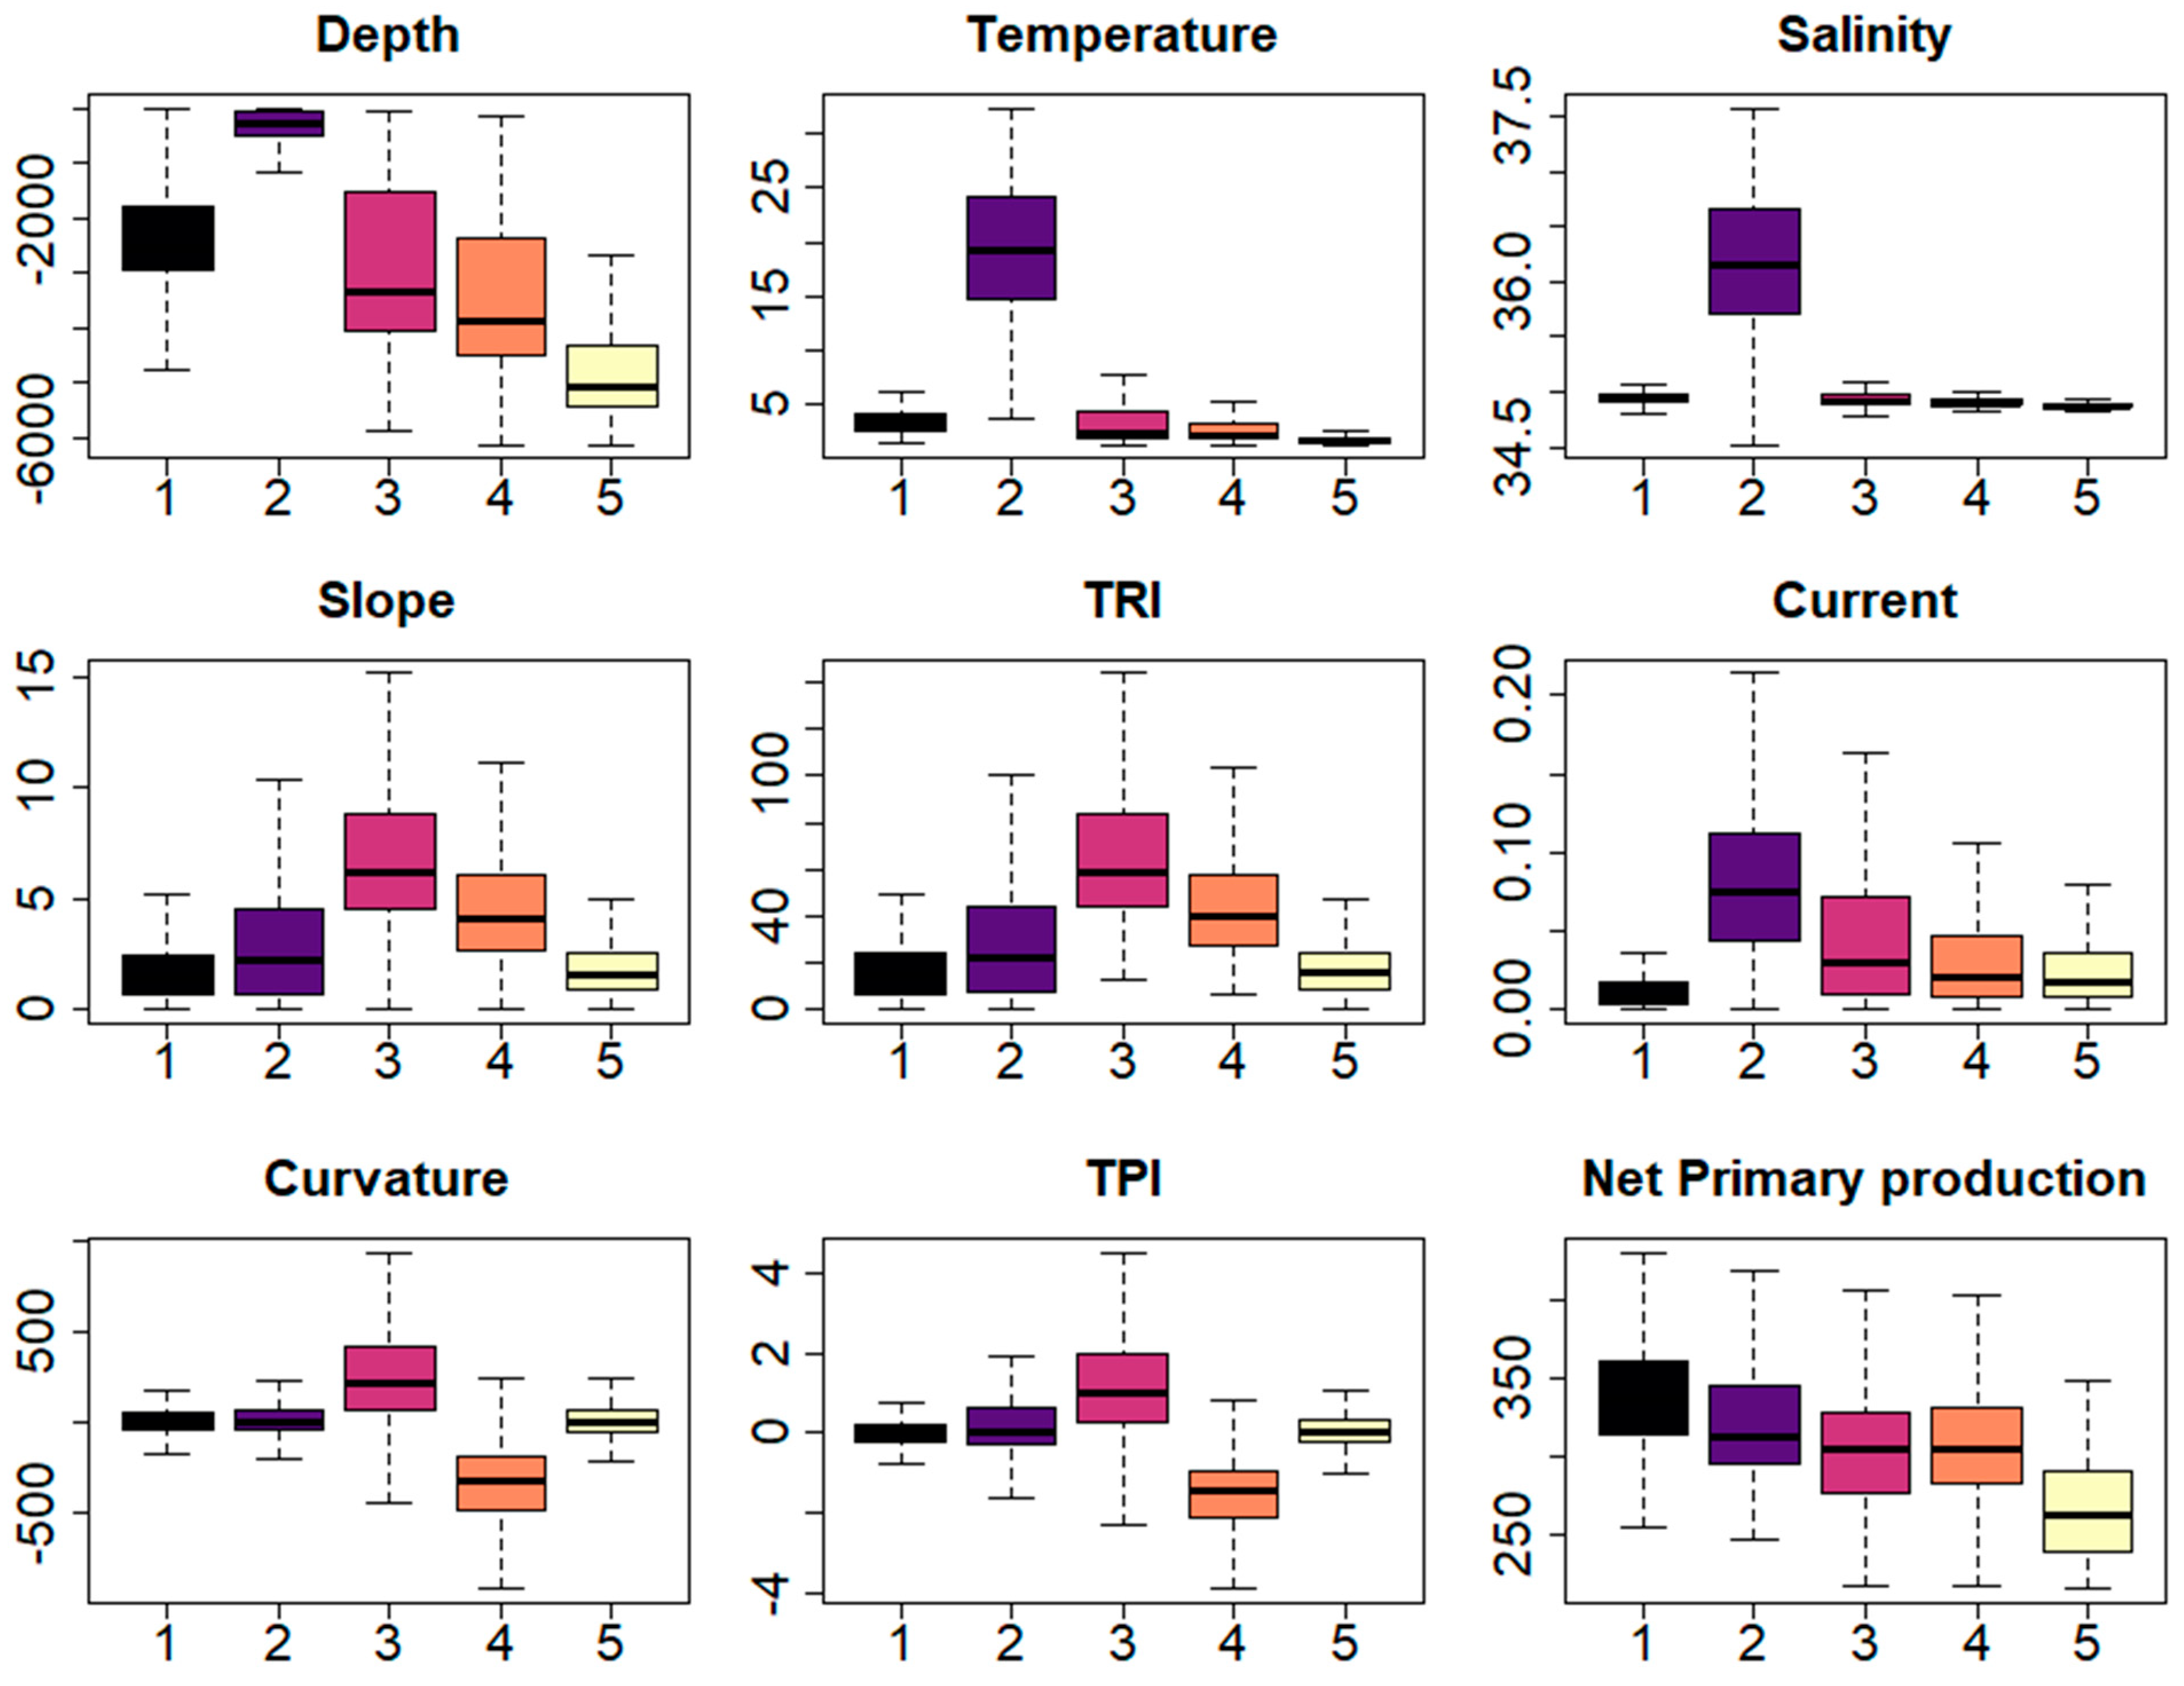
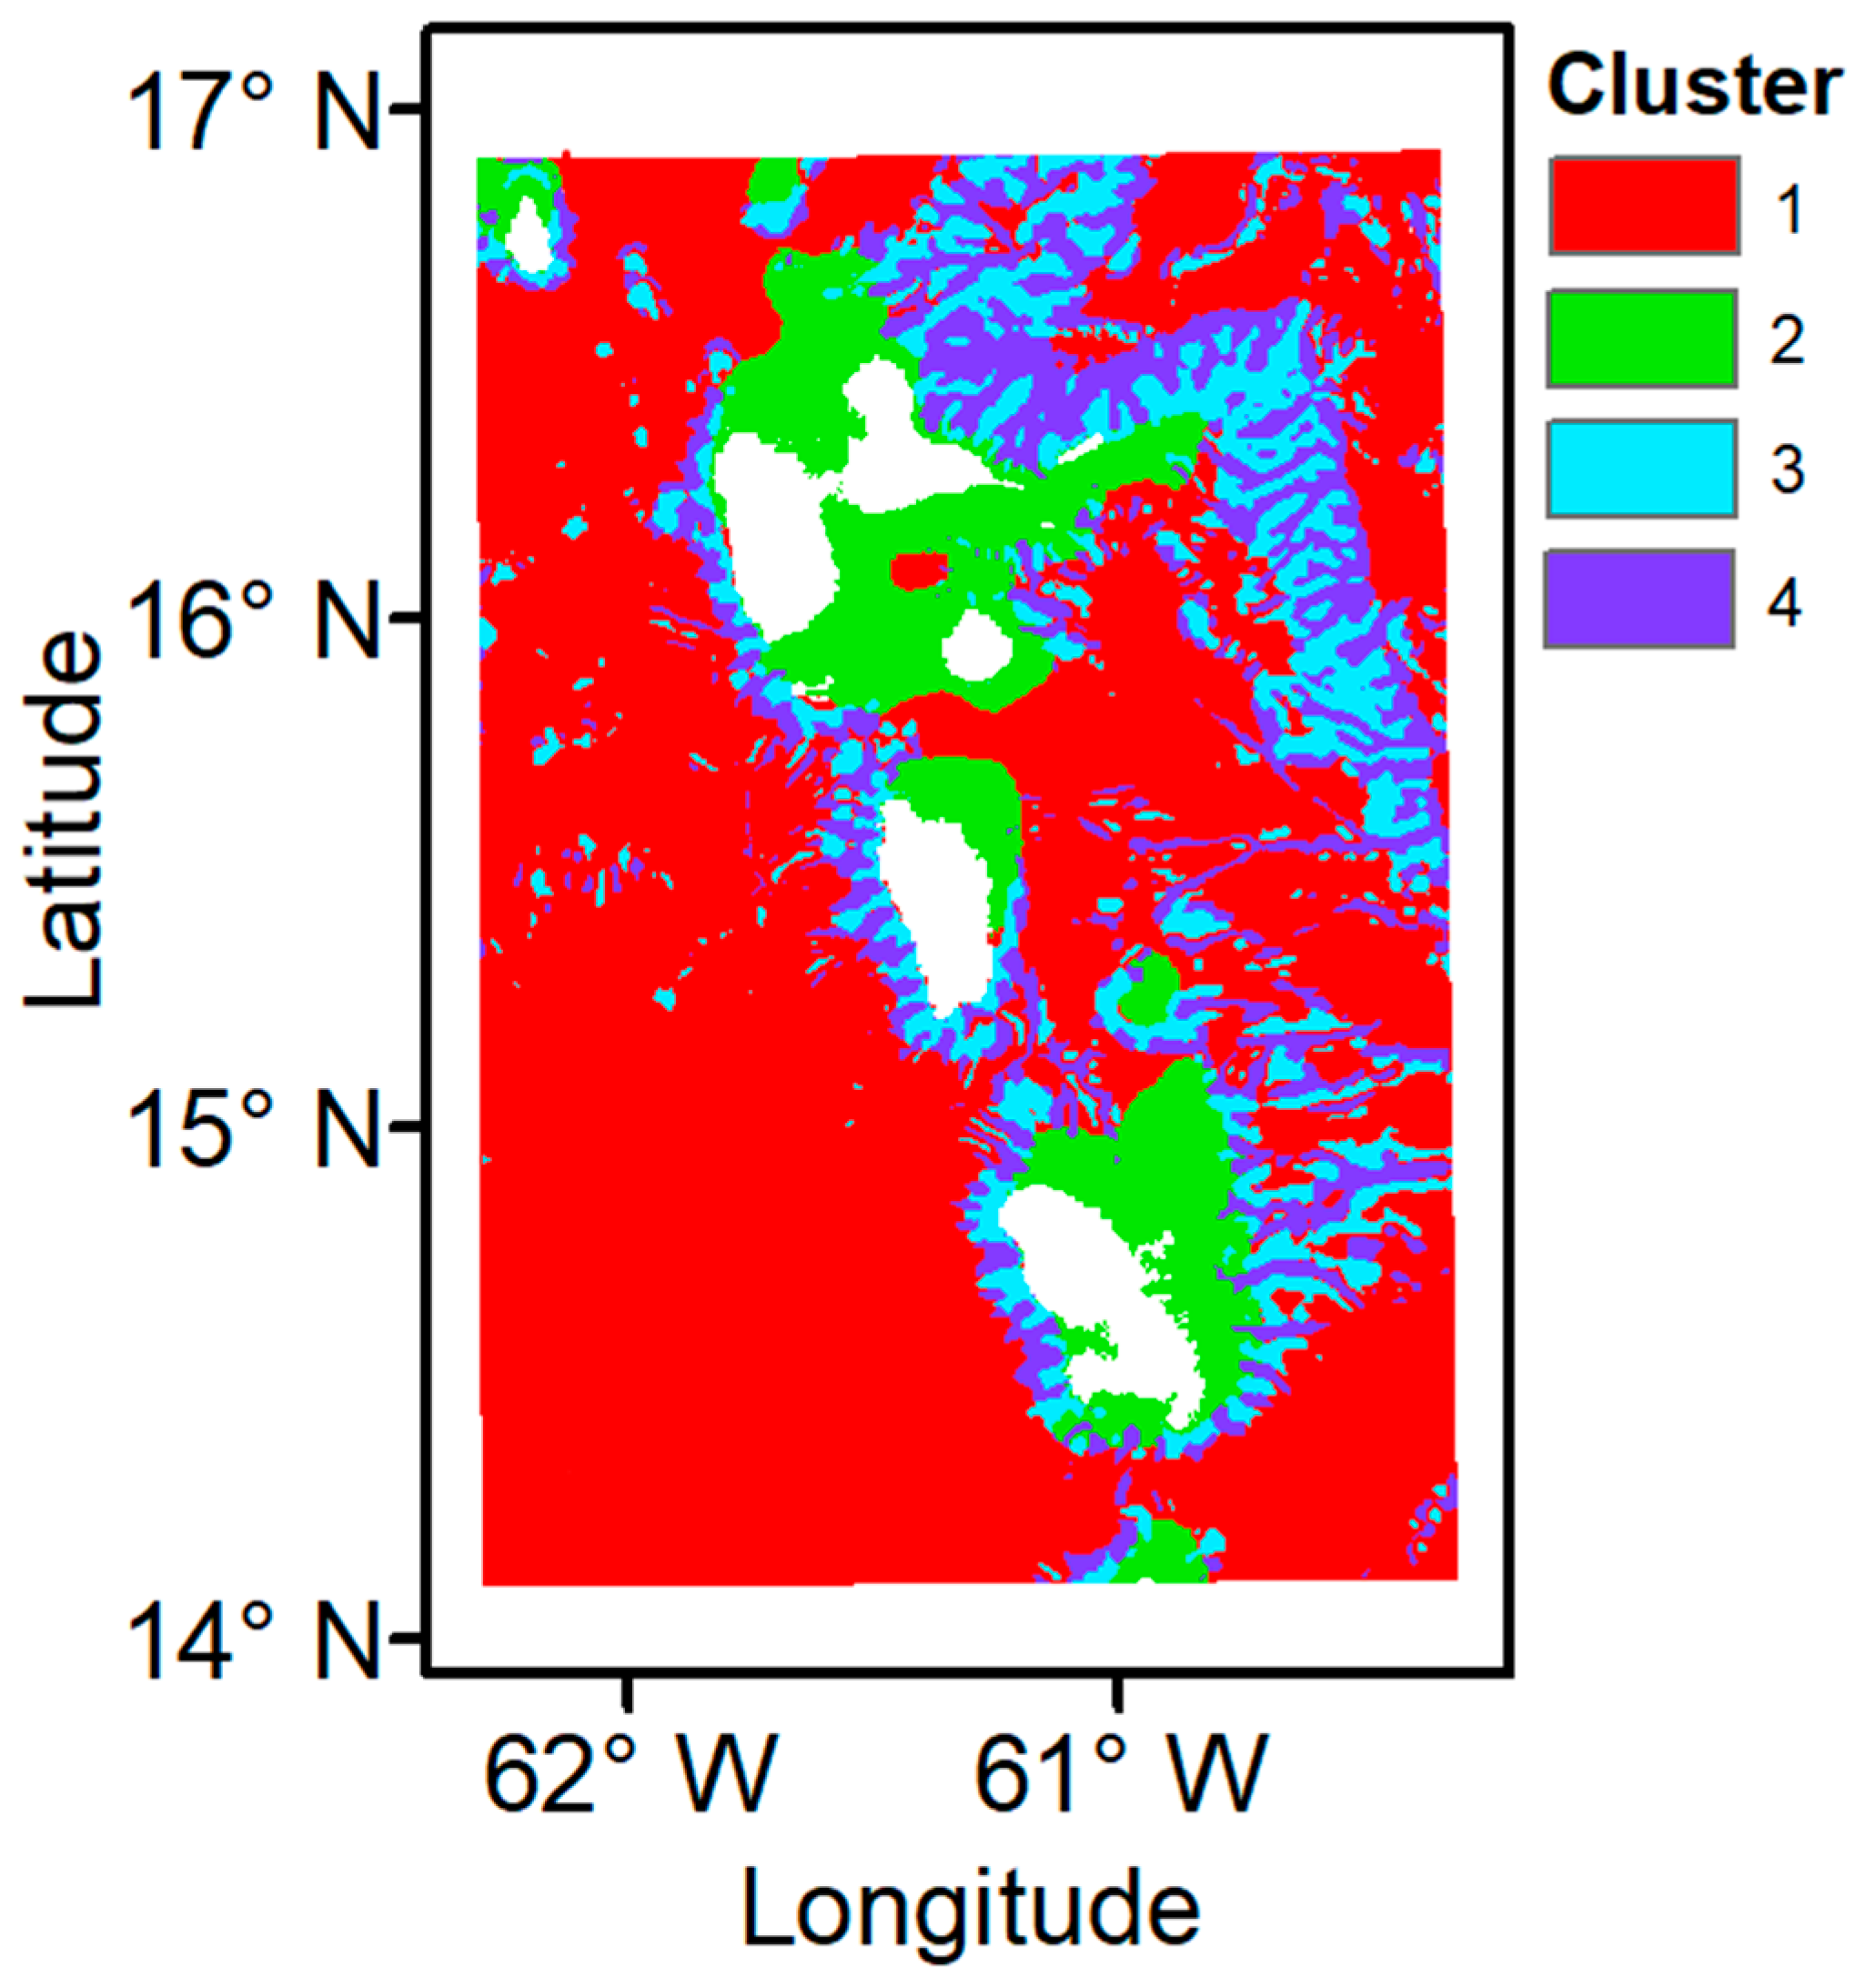
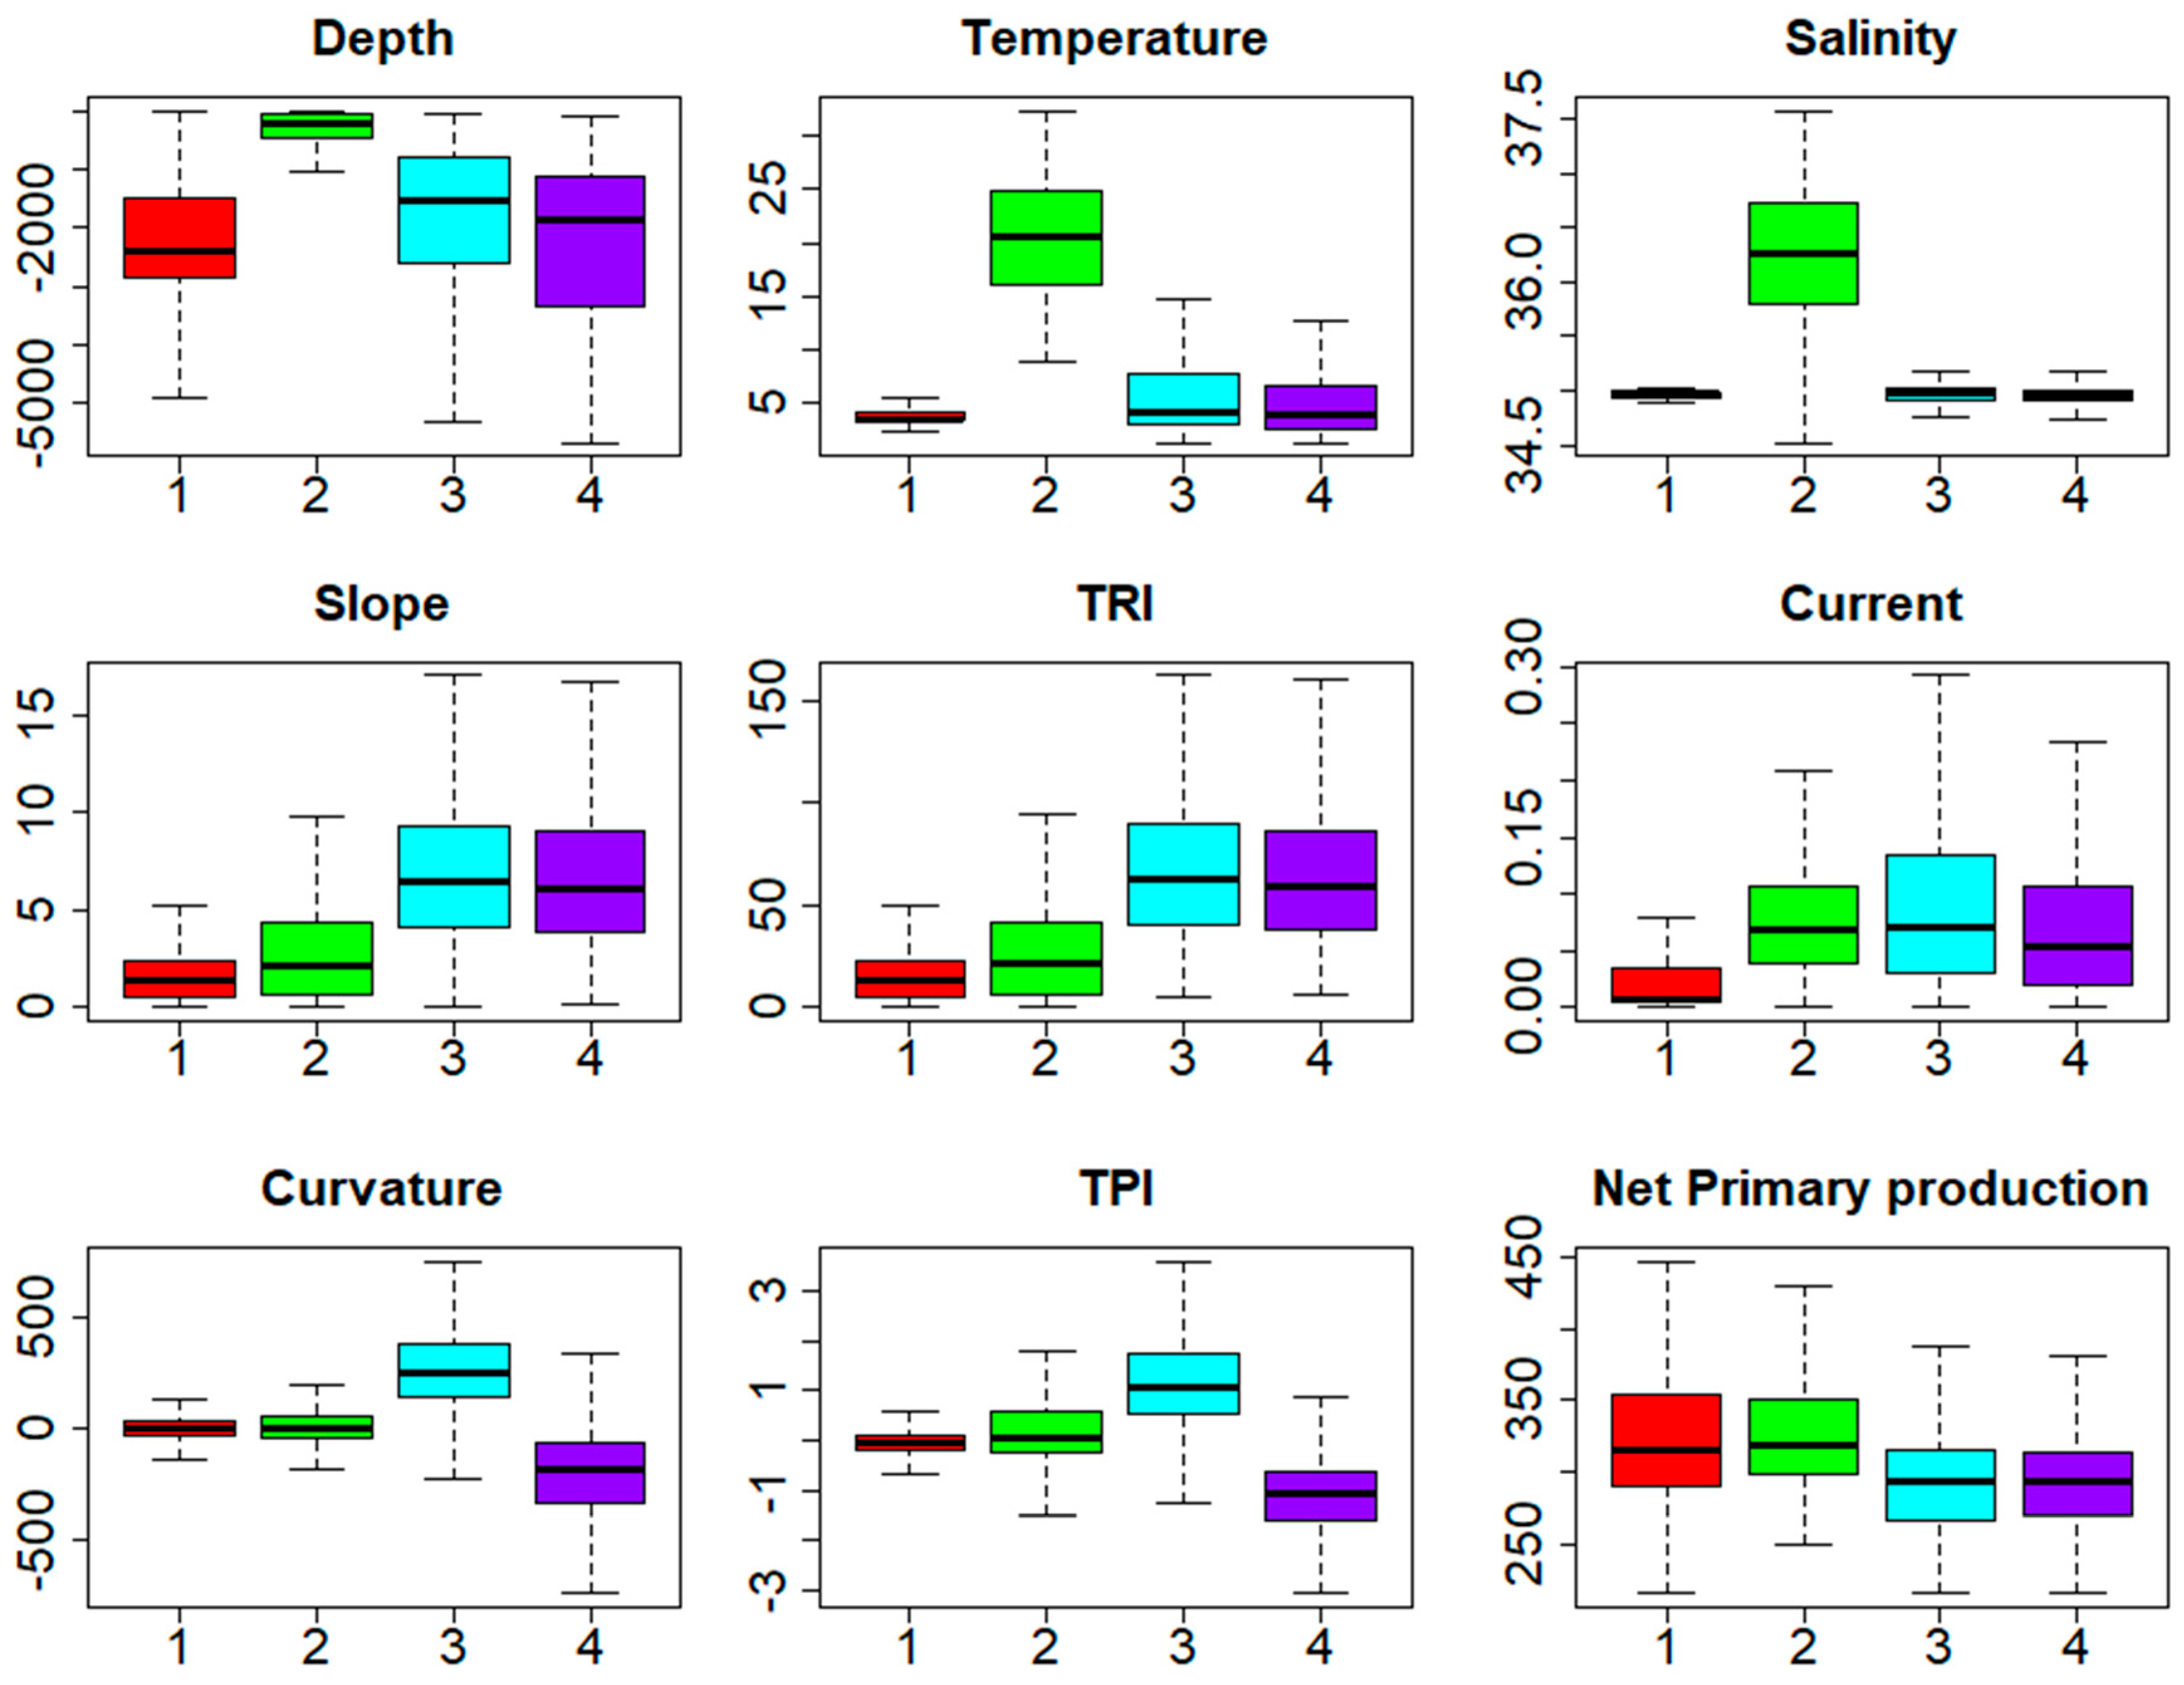
- Landscape map. The final cluster value for each data point was plotted against the point location to create a landscape map of the study regions. Boxplots summarising the distribution of the original input abiotic variables against the K-means cluster values were created to assess the influence of the abiotic inputs on the cluster solution and determine the physical characteristics of each cluster.
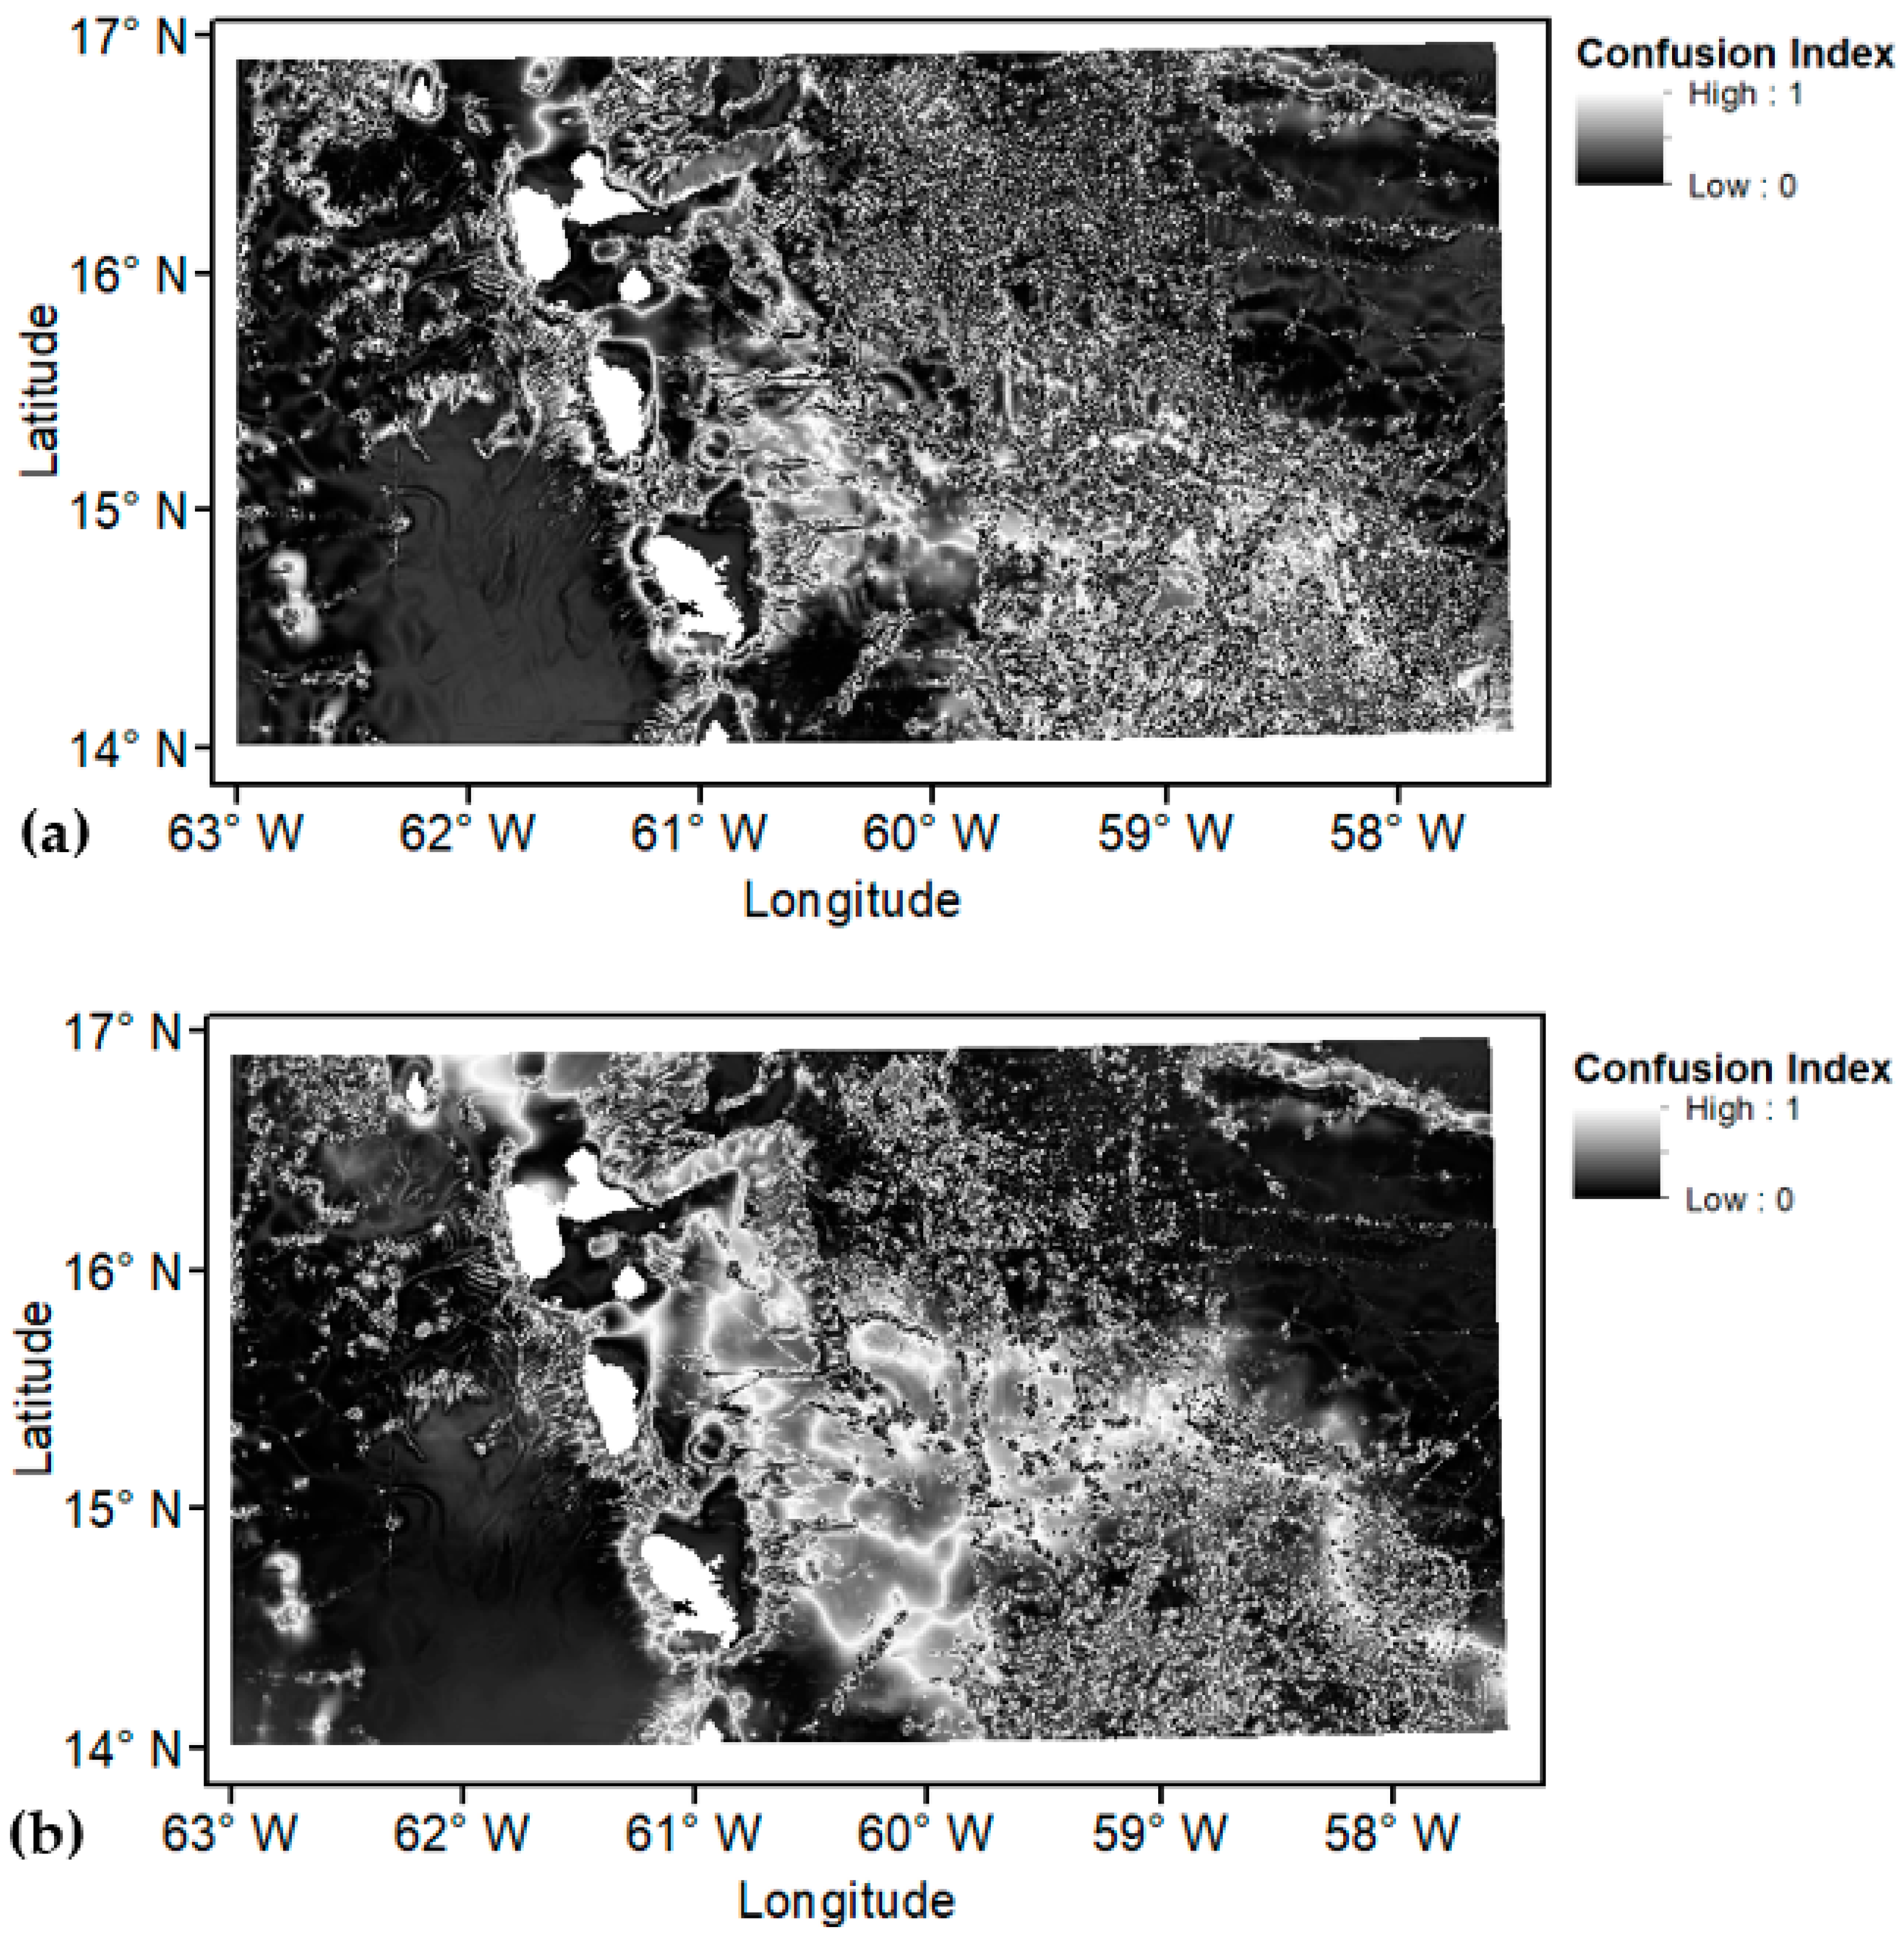
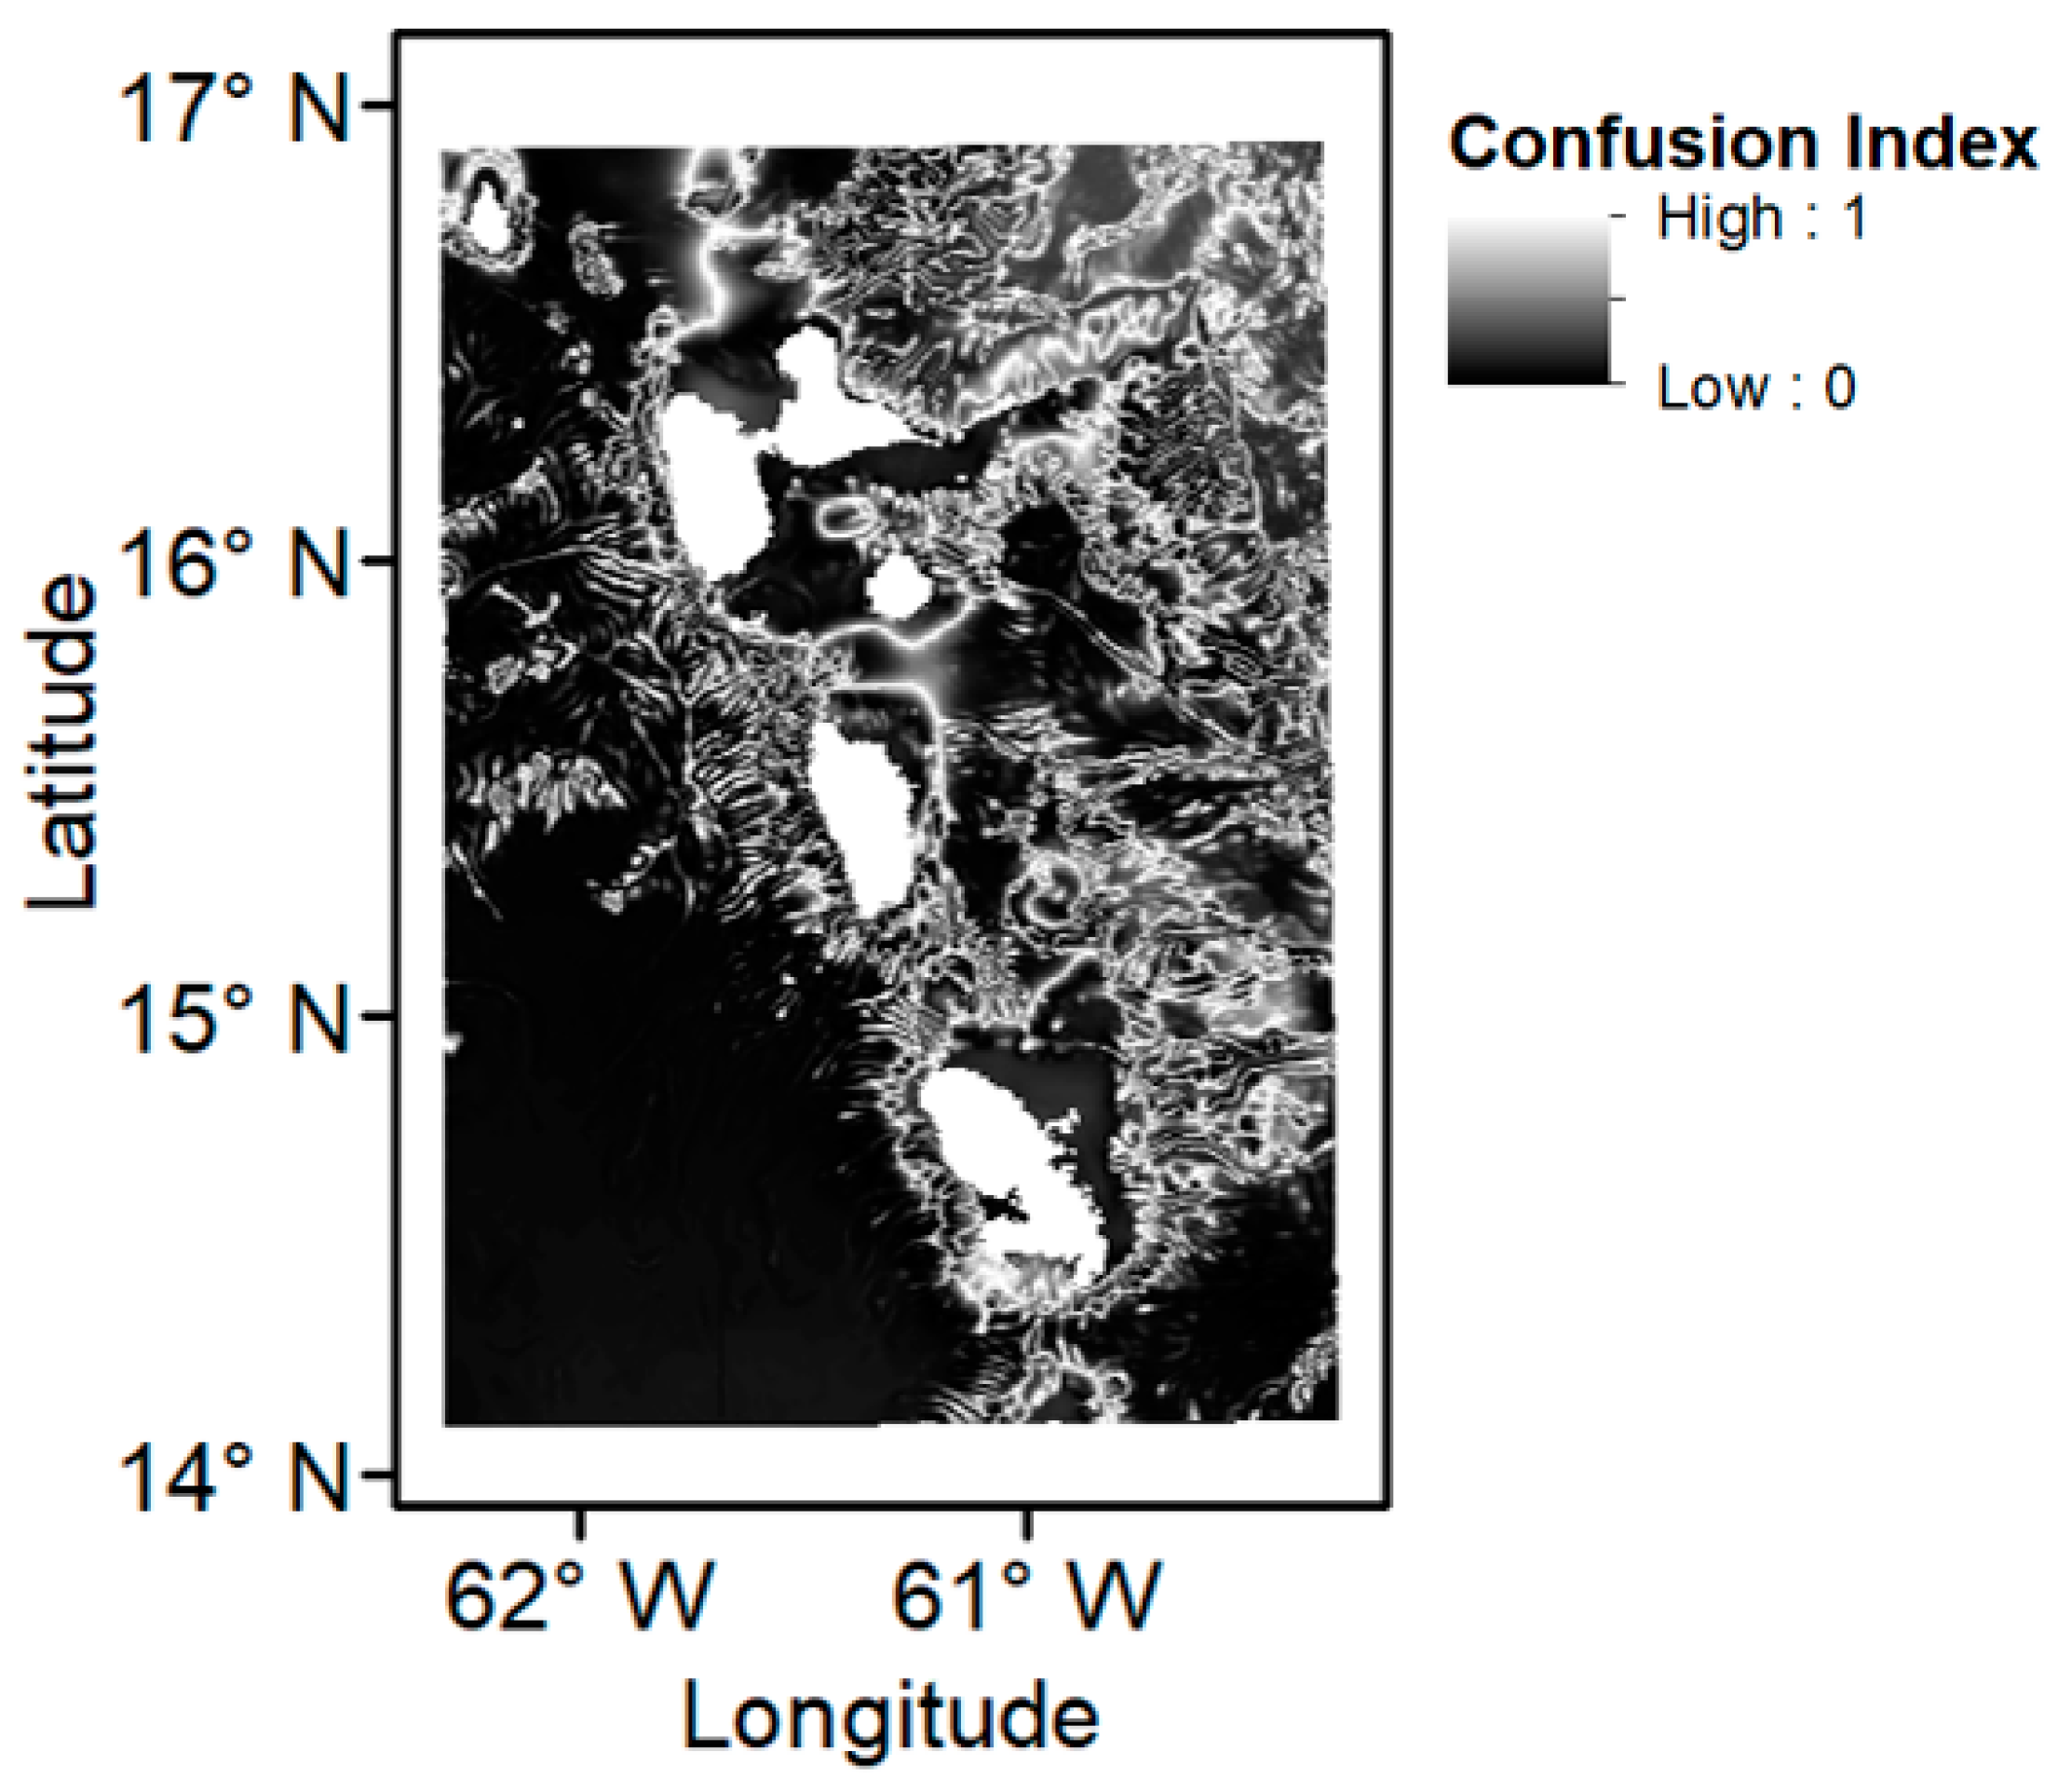
- Confusion Index Map. To assess how well each data point fitted within its assigned cluster, a confusion index map was created using the inverse distance squared in attribute space between the data observation and each K-means cluster centre to give a cluster membership value. A quantitative uncertainty measurement can be calculated using, for each data point, the ratio of the second highest membership value versus the highest, known as a confusion index (CI) [19]. If the data point is well characterised by the assigned cluster, the CI value will approach zero. Conversely, if the data point is not dominated by the assigned cluster, and the membership values are spread across several clusters, the value will be closer to one. These values were plotted against the data observation location to create a confusion map. For more detail, see Hogg et al. [18].
3. Results
3.1. PCA and Eigenvalues
3.1.1. Larger Study Area
3.1.2. Smaller Study Area
3.2. Clustering and K-Means
3.2.1. Larger Study Area
3.2.2. Smaller Study Area
3.3. Broadscale Landscape Map
3.3.1. Larger Study Area
3.3.2. Smaller Study Area
3.4. Confusion Index Map
3.4.1. Larger Study Area
3.4.2. Smaller Study Area
4. Discussion
4.1. The Marine Landscape around Dominica
4.2. Unsupervised Classification: Methodological Considerations
5. Conclusions
Author Contributions
Funding
Institutional Review Board Statement
Informed Consent Statement
Data Availability Statement
Acknowledgments
Conflicts of Interest
References
- Halpern, B.; Walbridge, S.; Selkoe, K.; Kappel, C.; Micheli, F.; D’Agrosa, C.; Bruno, J.; Casey, K.; Ebert, C.; Fox, H.; et al. A Global Map of Human Impact on Marine Ecosystems. Science 2008, 319, 948–952. [Google Scholar] [CrossRef] [PubMed]
- Diesing, M.; Green, S.L.; Stephens, D.; Lark, R.M.; Stewart, H.A.; Dove, D. Mapping seabed sediments: Comparison of manual, geostatistical, object-based image analysis and machine learning approaches. Cont. Shelf Res. 2014, 84, 107–119. [Google Scholar] [CrossRef]
- Scobie, M. Global marine and ocean governance, and Caribbean SIDS. In Global Environmental Governance and Small States: Architectures and Agency in the Caribbean; Edward Elgar Publishing: Cheltenham, UK, 2019; pp. 90–117. [Google Scholar] [CrossRef]
- Pinnegar, J.K.; Engelhard, G.H.; Norris, N.J.; Theophille, D.; Sebastien, R.D. Assessing vulnerability and adaptive capacity of the fisheries sector in Dominica: Long-term climate change and catastrophic hurricanes. ICES J. Mar. Sci. 2019, 76, 1353–1367. [Google Scholar] [CrossRef]
- Fishery and Aquaculture Country Profiles: The Commonwealth of Dominica: The Commonwealth of Dominica. Available online: http://www.fao.org/fishery/facp/DMA/en (accessed on 8 January 2021).
- Miller, K.A.; Thompson, K.F.; Johnston, P.; Santillo, D. An Overview of Seabed Mining Including the Current State of Development, Environmental Impacts, and Knowledge Gaps. Front. Mar. Sci. 2018, 4, 418. [Google Scholar] [CrossRef]
- Cuyvers, L.; Berry, W.; Gjerde, K.; Thiele, T.; Wilhem, C. Deep Seabed Mining: A Rising Environmental Challenge; IUCN and Gallifrey Foundation: Gland, Switzerland, 2018. [Google Scholar]
- Baker, E.K.; Harris, P.T. Habitat mapping and marine management. In Seafloor Geomorphology as Benthic Habitat, 2nd ed.; Harris, P.T., Baker, E., Eds.; Elsevier: Amsterdam, The Netherlands, 2020; Chapter 2; pp. 17–33. [Google Scholar] [CrossRef]
- Cogan, C.B.; Todd, B.J.; Lawton, P.; Noji, T.T. The role of marine habitat mapping in ecosystem-based management. ICES J. Mar. Sci. 2009, 66, 2033–2042. [Google Scholar] [CrossRef]
- United Nations Environment Programme. Emerging Issues for Small Island Developing States: Results of the UNEP/UN DESA Foresight Process; United Nations Environment Programme: Nairobi, Kenya, 2014. [Google Scholar]
- Foreign and Commonwealth Office. Commonwealth Marine Economies Programme: Dominica. Available online: https://assets.publishing.service.gov.uk/government/uploads/system/uploads/attachment_data/file/806089/Commonwealth_Marine_Economies_Programme_-_Dominica_Country_review.pdf (accessed on 2 January 2022).
- Diamond, A.M.Y. Identification and Assessment of Scleractinians at Tarou Point, Dominica, West Indies. Coast. Manag. 2003, 31, 409–421. [Google Scholar] [CrossRef]
- Steiner, S.; Willette, D. Distribution and size of benthic marine habitats in Dominica, Lesser Antilles. Rev. Biol. Trop. 2010, 58, 589–602. [Google Scholar] [CrossRef][Green Version]
- Eboh, H.; Gallaher, C.; Pingel, T.; Ashley, W. Risk perception in small island developing states: A case study in the Commonwealth of Dominica. Nat. Hazards 2021, 105, 889–914. [Google Scholar] [CrossRef]
- Singh, G.G.; Cottrell, R.S.; Eddy, T.D.; Cisneros-Montemayor, A.M. Governing the Land-Sea Interface to Achieve Sustainable Coastal Development. Front. Mar. Sci. 2021, 8, 1046. [Google Scholar] [CrossRef]
- Steiner, S. Coral Reefs of Dominica (Lesser Antilles). Ann. Nat. Mus. Wien Ser. A 2015, 117, 47–119. [Google Scholar]
- Verfaillie, E.; Degraer, S.; Schelfaut, K.; Willems, W.; Van Lancker, V. A protocol for classifying ecologically relevant marine zones, a statistical approach. Estuar. Coast. Shelf Sci. 2009, 83, 175–185. [Google Scholar] [CrossRef]
- Hogg, O.T.; Huvenne, V.A.I.; Griffiths, H.J.; Dorschel, B.; Linse, K. Landscape mapping at sub-Antarctic South Georgia provides a protocol for underpinning large-scale marine protected areas. Sci. Rep. 2016, 6, 33163. [Google Scholar] [CrossRef] [PubMed]
- Ismail, K.; Huvenne, V.A.I.; Masson, D.G. Objective automated classification technique for marine landscape mapping in submarine canyons. Mar. Geol. 2015, 362, 17–32. [Google Scholar] [CrossRef]
- Yamada, T.; Prügel-Bennett, A.; Thornton, B. Learning features from georeferenced seafloor imagery with location guided autoencoders. J. Field Robot. 2021, 38, 52–67. [Google Scholar] [CrossRef]
- Yang, F.; Sun, Q.; Jin, H.; Zhou, Z. Superpixel Segmentation With Fully Convolutional Networks. In Proceedings of the IEEE/CVF Conference on Computer Vision and Pattern Recognition (CVPR), Online, 14–19 June 2020; pp. 13961–13970. [Google Scholar] [CrossRef]
- Kabacoff, R.I. R in Action: Data Analysis and Graphics with R, 2nd ed.; Simon and Schuster: New York, NY, USA, 2015. [Google Scholar]
- Hayton, J.C.; Allen, D.G.; Scarpello, V. Factor Retention Decisions in Exploratory Factor Analysis: A Tutorial on Parallel Analysis. Organ. Res. Methods 2004, 7, 191–205. [Google Scholar] [CrossRef]
- O’Connor, B.P. SPSS and SAS programs for determining the number of components using parallel analysis and Velicer’s MAP test. Behav. Res. Methods Instrum. Comput. 2000, 32, 396–402. [Google Scholar] [CrossRef]
- Patil, V.H.; Singh, S.N.; Mishra, S.; Todd Donavan, D. Efficient theory development and factor retention criteria: Abandon the ‘eigenvalue greater than one’ criterion. J. Bus. Res. 2008, 61, 162–170. [Google Scholar] [CrossRef]
- Legendre, P.; Legendre, L. Numerical Ecology, 3rd ed.; Elsevier: Amsterdam, The Netherlands, 2012. [Google Scholar]
- Kanyongo, G. The Influence of Reliability on Four Rules for Determining the Number of Components to Retain. J. Mod. Appl. Stat. Methods 2006, 5, 332–343. [Google Scholar] [CrossRef]
- Velicer, W.F.; Eaton, C.A.; Fava, J.L. Construct explication through factor or component analysis: A review and evaluation of alternative procedures for determining the number of factors or components. In Problems and Solutions in Human Assessment: Honoring Douglas N. Jackson at Seventy; Kluwer Academic/Plenum Publishers: New York, NY, USA, 2000; pp. 41–71. [Google Scholar] [CrossRef]
- Pituch, K.A.; Stevens, J.P. Applied Multivariate Statistics for the Social Sciences: Analyses with SAS and IBM’s SPSS, 6th ed.; Routledge: New York, NY, USA, 2016. [Google Scholar] [CrossRef]
- Stevens, R.; Willig, M. Geographical Ecology at the Community Level: Perspectives on the Diversity of New World Bats. Ecology 2002, 83, 545–560. [Google Scholar] [CrossRef]
- The GEBCO_2014 Grid. Version 20150318. GEBCO [Data Set]. 2015. Available online: http://www.gebco.net (accessed on 31 January 2019).
- Flanders Marine Institute. Maritime Boundaries Geodatabase: Maritime Boundaries and Exclusive Economic Zones (200NM); Version 11; Flanders Marine Institute: Ostend, Belgium, 2019. [Google Scholar] [CrossRef]
- SHOM. MNT Bathymétrique de Façade de la Guadeloupe et de la Martinique (Projet Homonim). SHOM [Data Set]. 2018. Available online: http://dx.doi.org/10.17183/MNT_ANTS100m_HOMONIM_WGS84 (accessed on 9 November 2018).
- Hutchinson, M.F. A New Procedure for Gridding Elevation and Stream Line Data with Automatic Removal of Spurious Pits. J. Hydrol. 1989, 106, 211–232. [Google Scholar] [CrossRef]
- Hutchinson, M.F.; Xu, T.; Stein, J. Recent Progress in the ANUDEM Elevation Gridding Procedure. Geomorphometry 2011, 2011, 19–22. [Google Scholar]
- Global Monitoring and Forecasting Center. Operational Mercator Global Ocean Analysis and Forecast System, E.U. Copernicus Marine Service Information [Data Set]. 2018. Available online: https://resources.marine.copernicus.eu (accessed on 23 January 2018).
- Behrenfeld, M.J.; Falkowski, P.G. Photosynthetic rates derived from satellite-based chlorophyll concentration. Limnol. Oceanogr. 1997, 42, 1–20. [Google Scholar] [CrossRef]
- RStudio: Integrated Development Environment for R; RStudio Team: Boston, MA, USA, 2021.
- Revelle, W. Psych: Procedures for Personality and Psychological Research; Northwestern University: Evanston, IL, USA, 2018. [Google Scholar]
- Caliński, T.; Harabasz, J. A Dendrite Method for Cluster Analysis. Commun. Stat. Theory Methods 1974, 3, 1–27. [Google Scholar] [CrossRef]
- Legendre, P.; Ellingsen, K.E.; Bjørnbom, E.; Casgrain, P. Rapid communication/communication rapide acoustic seabed classification: Improved statistical method. Can. J. Fish. Aquat. Sci. 2002, 59, 1085–1089. [Google Scholar] [CrossRef]
- Swanborn, D.J.B.; Huvenne, V.A.I.; Pittman, S.J.; Woodall, L.C. Bringing seascape ecology to the deep seabed: A review and framework for its application. Limnol. Oceanogr. 2022, 67, 66–88. [Google Scholar] [CrossRef]
- Macfarlane, K. Distribution of Benthic Marine Habitats of Dominica in the Northern Region of the West Coast of Dominica; Institute for Tropical Marine Ecology Research Reports: Roseau, Dominica, 2007; Volume 2, pp. 31–49. [Google Scholar]
- Price, L. The Distribution of Benthic Marine Habitats in the Central and Southern Regions of Dominica’s West Coast; Institute for Tropical Marine Ecology Research Reports: Roseau, Dominica, 2007; Volume 2, pp. 5–30. [Google Scholar]
- Ribó, M.; Macdonald, H.; Watson, S.J.; Hillman, J.R.; Strachan, L.J.; Thrush, S.F.; Mountjoy, J.J.; Hadfield, M.G.; Lamarche, G. Predicting habitat suitability of filter-feeder communities in a shallow marine environment, New Zealand. Mar. Environ. Res. 2021, 163, 105218. [Google Scholar] [CrossRef] [PubMed]
- Pearman, T.R.R.; Robert, K.; Callaway, A.; Hall, R.; Lo Iacono, C.; Huvenne, V.A.I. Improving the predictive capability of benthic species distribution models by incorporating oceanographic data—Towards holistic ecological modelling of a submarine canyon. Prog. Oceanogr. 2020, 184, 102338. [Google Scholar] [CrossRef]
- Friedman, A.; Pizarro, O.; Williams, S.; Johnson-Roberson, M. Multi-Scale Measures of Rugosity, Slope and Aspect from Benthic Stereo Image Reconstructions. PLoS ONE 2012, 7, e50440. [Google Scholar] [CrossRef]
- Hewitt, J. Effect of increased suspended sediment on suspension-feeding shellfish. Atmosphere 2002, 10, 8. [Google Scholar]
- Fisheries Division, Food and Agriculture Organization of the United Nations. Information on Fisheries Management in the Commonwealth of Dominica. Available online: https://www.fao.org/3/ab490e/AB490E02.htm (accessed on 2 January 2022).
- Folsom, W.B. World Swordfish Fisheries: An Analysis of Swordfish Fisheries, Market Trends, and Trade Patterns Past-Present-Future, Volume VI, Western Europe. NMFS-F/SPO-29; 1997. Available online: https://repository.library.noaa.gov/view/noaa/26615 (accessed on 3 January 2022).
- Martin, J.H.; Knauer, G.A.; Karl, D.M.; Broenkow, W.W. VERTEX: Carbon cycling in the northeast Pacific. Deep Sea Res. Part A Oceanogr. Res. Pap. 1987, 34, 267–285. [Google Scholar] [CrossRef]


| Bathymetric Derivatives | Description | Calculated |
|---|---|---|
| Slope | Gradient of bathymetry | Slope Spatial Analyst Tool in ArcMap (using a 3 × 3 cell neighbourhood) |
| Topographic Position Index | Compares elevation of focal cell to all cells in a specified neighbourhood | Land Facet Corridor Tools extension in ArcMap, radius of 4 cells (1000 m) |
| Terrain Ruggedness Index | The mean difference between a focal cell and the surrounding cells in a specified neighbourhood | SAGA GIS Terrain Analysis Morphometry, radius of 4 cells (1000 m) |
| Plan Curvature | Curvature of the surface perpendicular to the slope direction | Curvature Spatial Analyst Tool in ArcMap (using a 3 × 3 cell neighbourhood) |
| Satellite and Oceanographic Model Variables | Source | Calculated |
|---|---|---|
| Net Primary Production (mg C/m2/day) | Oregon State University Vertically Generalised Production Model | Monthly data averaged over 3 years (January 2016–December 2018) |
| Salinity (PSU) | Copernicus Global Ocean Model Timeseries | |
| Temperature (°C) | ||
| Current (m/s) |
| Larger Study Area | PC1 | PC2 | PC3 | PC4 | PC5 | PC6 | PC7 | PC8 | PC9 |
|---|---|---|---|---|---|---|---|---|---|
| Standard deviation | 1.684 | 1.411 | 1.330 | 0.990 | 0.862 | 0.611 | 0.468 | 0.294 | 0.057 |
| Proportion of Variance (%) | 31.500 | 22.122 | 19.643 | 10.894 | 8.263 | 4.148 | 2.436 | 0.958 | 0.036 |
| Cumulative Proportion (%) | 31.500 | 53.622 | 73.265 | 84.159 | 92.422 | 96.570 | 99.006 | 99.964 | 100.000 |
| Eigenvalue | 2.835 | 1.991 | 1.768 | 0.980 | 0.744 | 0.373 | 0.219 | 0.086 | 0.003 |
| Abiotic Variables (E3, Large) | RPC 1 | RPC 2 | RPC 3 |
|---|---|---|---|
| Depth | 0.829 | - | - |
| Slope | - | 0.974 | - |
| Plan Curvature | - | - | 0.943 |
| Topographic Position Index | - | - | 0.942 |
| Terrain Ruggedness Index | - | 0.975 | - |
| Salinity | 0.837 | - | - |
| Current | 0.352 | 0.441 | - |
| Temperature | 0.908 | - | - |
| Net Primary Productivity | 0.532 | - | - |
| Abiotic Variables (E4, Large) | RPC 1 | RPC 2 | RPC 3 | RPC 4 |
|---|---|---|---|---|
| Depth | 0.592 | - | - | 0.642 |
| Slope | - | 0.989 | - | - |
| Plan Curvature | - | - | 0.944 | - |
| Topographic Position Index | - | - | 0.942 | - |
| Terrain Ruggedness Index | - | 0.989 | - | - |
| Salinity | 0.908 | - | - | - |
| Current | 0.556 | 0.315 | - | - |
| Temperature | 0.909 | - | - | - |
| Net Primary Productivity | 0.055 | - | - | 0.928 |
| Smaller Study Area | PC 1 | PC 2 | PC 3 | PC 4 | PC 5 | PC 6 | PC 7 | PC 8 | PC 9 |
|---|---|---|---|---|---|---|---|---|---|
| Standard deviation | 1.661 | 1.471 | 1.300 | 0.936 | 0.818 | 0.714 | 0.487 | 0.306 | 0.031 |
| Proportion of Variance (%) | 30.642 | 24.058 | 18.790 | 9.737 | 7.431 | 5.657 | 2.637 | 1.037 | 0.011 |
| Cumulative Proportion (%) | 30.642 | 54.700 | 73.490 | 83.228 | 90.659 | 96.315 | 98.952 | 99.989 | 100.000 |
| Eigenvalue | 2.758 | 2.165 | 1.691 | 0.876 | 0.669 | 0.509 | 0.237 | 0.093 | 0.001 |
| Abiotic Variables (E3, Small) | RPC 1 | RPC 2 | RPC 3 |
|---|---|---|---|
| Depth | 0.798 | - | - |
| Slope | - | 0.948 | - |
| Plan Curvature | - | - | 0.937 |
| Topographic Position Index | - | - | 0.931 |
| Terrain Ruggedness Index | - | 0.948 | - |
| Salinity | 0.893 | - | - |
| Current | 0.338 | 0.535 | - |
| Temperature | 0.951 | - | - |
| Net Primary Productivity | - | −0.490 | - |
Publisher’s Note: MDPI stays neutral with regard to jurisdictional claims in published maps and institutional affiliations. |
© 2022 by the authors. Licensee MDPI, Basel, Switzerland. This article is an open access article distributed under the terms and conditions of the Creative Commons Attribution (CC BY) license (https://creativecommons.org/licenses/by/4.0/).
Share and Cite
Wardell, C.; Huvenne, V.A.I. Broadscale Landscape Mapping Provides Insight into the Commonwealth of Dominica and Surrounding Islands Offshore Environment. Remote Sens. 2022, 14, 1820. https://doi.org/10.3390/rs14081820
Wardell C, Huvenne VAI. Broadscale Landscape Mapping Provides Insight into the Commonwealth of Dominica and Surrounding Islands Offshore Environment. Remote Sensing. 2022; 14(8):1820. https://doi.org/10.3390/rs14081820
Chicago/Turabian StyleWardell, Catherine, and Veerle A. I. Huvenne. 2022. "Broadscale Landscape Mapping Provides Insight into the Commonwealth of Dominica and Surrounding Islands Offshore Environment" Remote Sensing 14, no. 8: 1820. https://doi.org/10.3390/rs14081820
APA StyleWardell, C., & Huvenne, V. A. I. (2022). Broadscale Landscape Mapping Provides Insight into the Commonwealth of Dominica and Surrounding Islands Offshore Environment. Remote Sensing, 14(8), 1820. https://doi.org/10.3390/rs14081820


