Article

Satellite Observed Spatial and Temporal Variabilities of Particulate Organic Carbon in the East China Sea

1
Eco-Environmental Monitoring and Research Center, Pearl River Valley and South China Sea Ecology and Environment Administration, Ministry of Ecology and Environment of the People’s Republic of China, Guangzhou 510611, China
2
School of Marine Sciences, Sun Yat-sen University, Guangzhou 510275, China
3
Department of Physics and Physical Oceanography, University of North Carolina Wilmington, Wilmington, NC 28403, USA
*
Author to whom correspondence should be addressed.
Remote Sens. 2022, 14(8), 1799; https://doi.org/10.3390/rs14081799
Submission received: 22 February 2022 / Revised: 2 April 2022 / Accepted: 5 April 2022 / Published: 8 April 2022

Abstract

:
In this study, we investigate spatial and temporal variabilities of particulate organic carbon (POC) in the East China Sea (ECS) and explore the dominant influencing factors for its three subregions—coastal, continental shelf and open sea—by analyzing satellite derived POC from 2001 to 2011 after calibration against in situ samplings. The analysis reveals that the largest POC occurs in spring at the coastal region with a value of 297.5 mg m−3, and the smallest in summer at the open sea region with a value of 108.9 mg m−3. POC in the coastal region is dominated by biological activity related to river discharge of nutrients and organic matter, and is regulated by sediment discharge variation due to the Three Gorge Project and chemical fertilizer application along the Changjiang River watershed; the open sea region is dominated by water exchange with the Kuroshio current, which results in the highest sea surface temperature and the lowest chlorophyll and POC among the three subregions; POC in the continental shelf region is driven by the seasonal competition between the influence of the coastal ocean and the Kuroshio current through biological activity and water exchange. A method to estimate the organic matter reserve in the ECS was developed based on satellite data and in situ samplings. Organic carbon storage was estimated at 4.08 × 10¹³ g, which could be used as a baseline for future estimates. An improved estimation could be found with additional in situ data and with the use of a more sophisticated algorithm for satellite POC analysis.

1. Introduction

Marine organic carbon exists in the ocean in two main forms, dissolved organic carbon (DOC) and particulate organic carbon (POC), which account for about 90% and 10% of the total organic carbon, respectively [1,2]. Although POC occupies a smaller proportion, it is the main form of “biological pump”, which buries and reserves carbon into the deep ocean and plays an important role in the global carbon cycle of marine systems [3,4,5,6].
Previous analyses of major ocean survey data in the 1980s (VERTEX) and 1990s (JGOFS) have demonstrated that the biochemical composition of POC is dynamic and informative [7,8]. Since then, increasingly detailed studies of POC components have been carried out, including exploration of POC formation and variation mechanisms, horizontal and vertical flux and source and sink estimations.
As one of the largest marginal regions with the highest primary productivity, the East China Sea (ECS) is known for strong spatial and temporal variabilities in POC [9,10]. POC generated by biological productivity in the nearshore region is significantly higher than the continental shelf and open sea regions, and is supported by nutrients supplied by coastal upwelling and terrestrial runoff [11,12]. In the continental shelf region, although the flux of Kuroshio subsurface water into ECS is larger than riverine flux into the inshore region, nutrient supply for biological productivity is limited by the deep water depth and strong stratification [13,14].
Available studies demonstrated the strong temporal variability of POC in ECS. Ref. [15] found that in fall, POC concentrations appear parallel to the coastline and decrease from land to open sea. In winter, this pattern can be affected by the intrusion of the Taiwan Warm Current (TWC) and stronger vertical mixing [16]. ECS is also proven to be a significant repository of sedimentary organic carbon with strong cross-shelf flux. The rate of organic carbon burial on the ECS shelf is roughly estimated as 600 ± 240 × 109 mol yr−1 [17]. A cross-shelf export flux reaching 106 × 106 mol yr−1 was calculated using a box model [18] and a sediment trap estimation of 20–67 mg m−2 d−1 [19]. POC flux in the middle shelf was estimated at 785 ± 438 mg m−2 yr−1 (about 33.4 ± 18.6 × 10⁹ mol yr−1), using a vertical mixing model [20]. Due to the sparseness of the spatial and temporal resolutions of field data used for these analyses, there is a high degree of uncertainty around these estimates [21,22]. To estimate the flux more accurately, it is necessary to combine multiple methods with more comprehensive spatial and temporal coverages.
Traditional methods of POC investigation have focused on laboratory measurements based on cruise samplings limited by large spatial and temporal gaps. These discrepancies can be filled by satellite observations. In this paper, Moderate Resolution Imaging Spectroradiometer (MODIS) data collected by the National Aeronautics and Space Administration (NASA) are coupled with in situ data from the ECS in autumn 2011 and used to analyze the spatiotemporal variations of POC in different regions, and to identify the influencing factors on the spatiotemporal variations. The algorithm used by MODIS [23] usually overestimates POC in coastal regions due to interference by chromophoric dissolved organic matter and other colored matter [24,25,26]. Prior to detailed analysis, we must calibrate the algorithm for POC estimation using a linear regression to accommodate the complex environmental conditions in the ECS.
Previous studies have evaluated the physical and hydrological influences on the ECS at a decadal scale and demonstrated that POC can be linked to longer timescale events [27,28]. This study will also investigate the interannual variability of POC using satellite data. The organic carbon storage in ECS are in the forms of DOC and POC [29,30]. Traditional analyses of organic carbon usually depend on samples from in situ cruises and stations and lack large-scale estimations for the whole ECS. In this study, we develop a method to estimate the total organic carbon in ECS by combining remotely sensed data with in situ sampling. Our results can provide a good reference for the study of long-term and large-scale variations of POC and carbon cycle at the marginal sea.

2. Materials and Methods
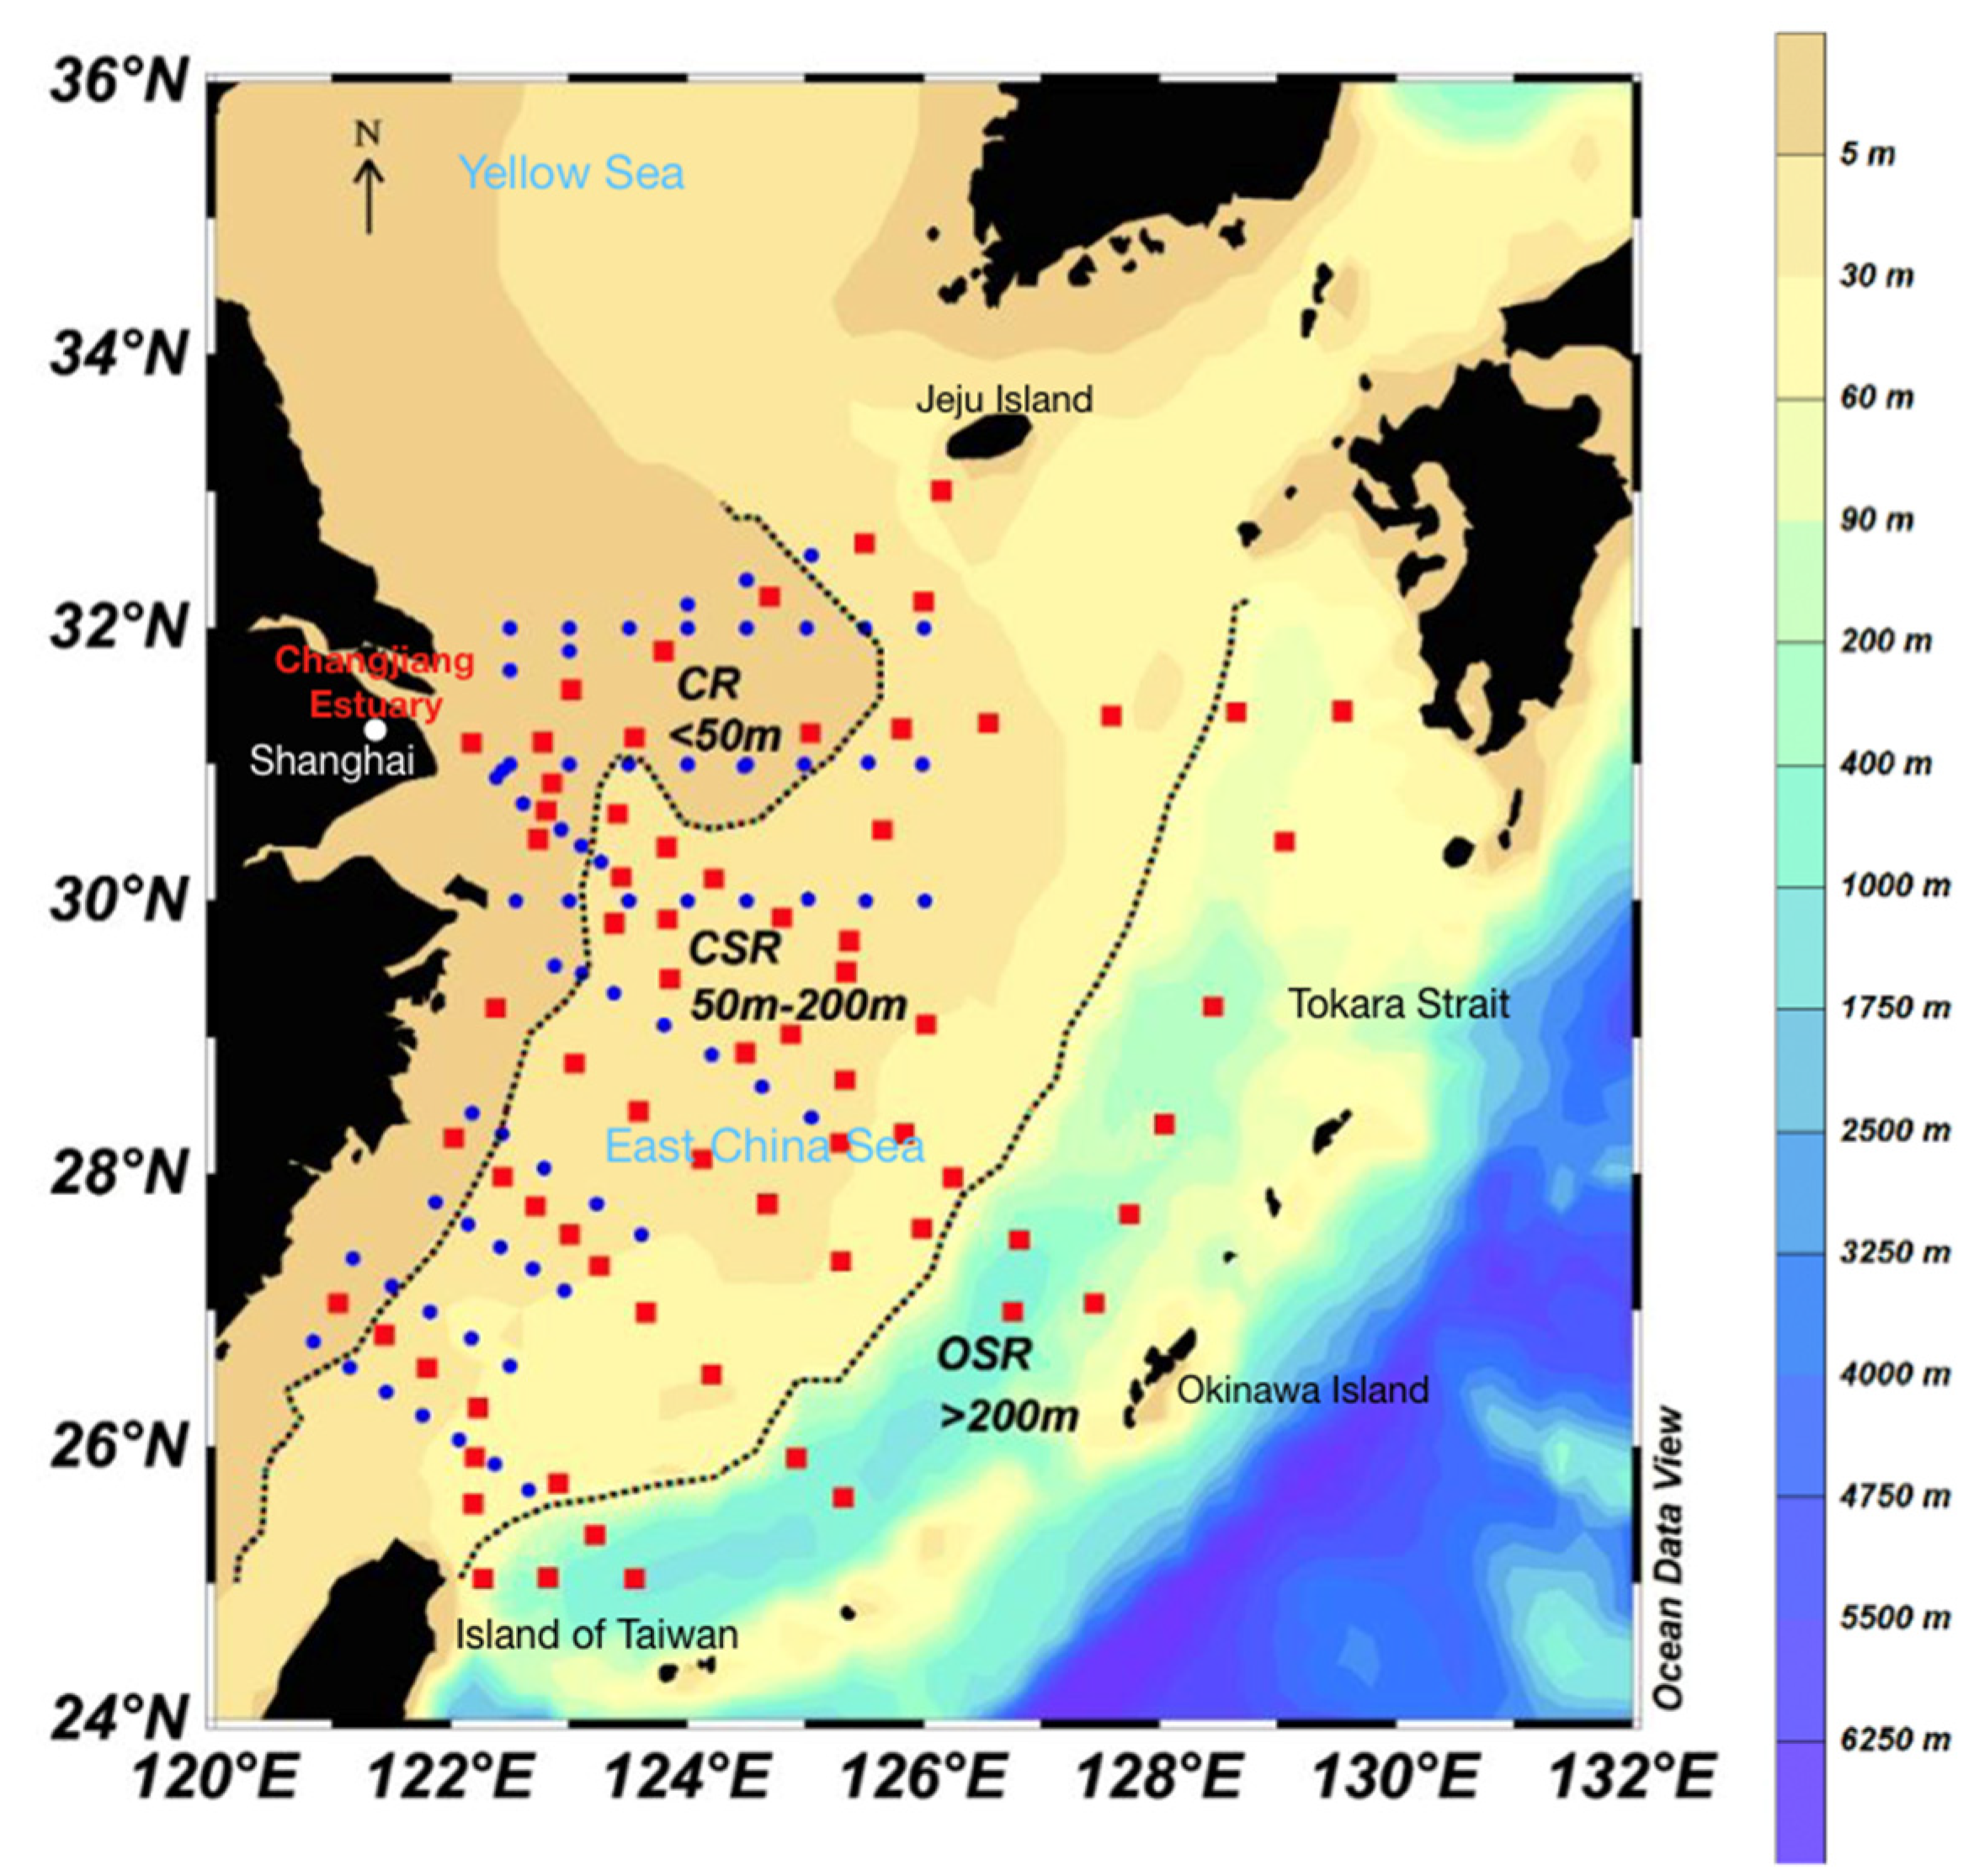
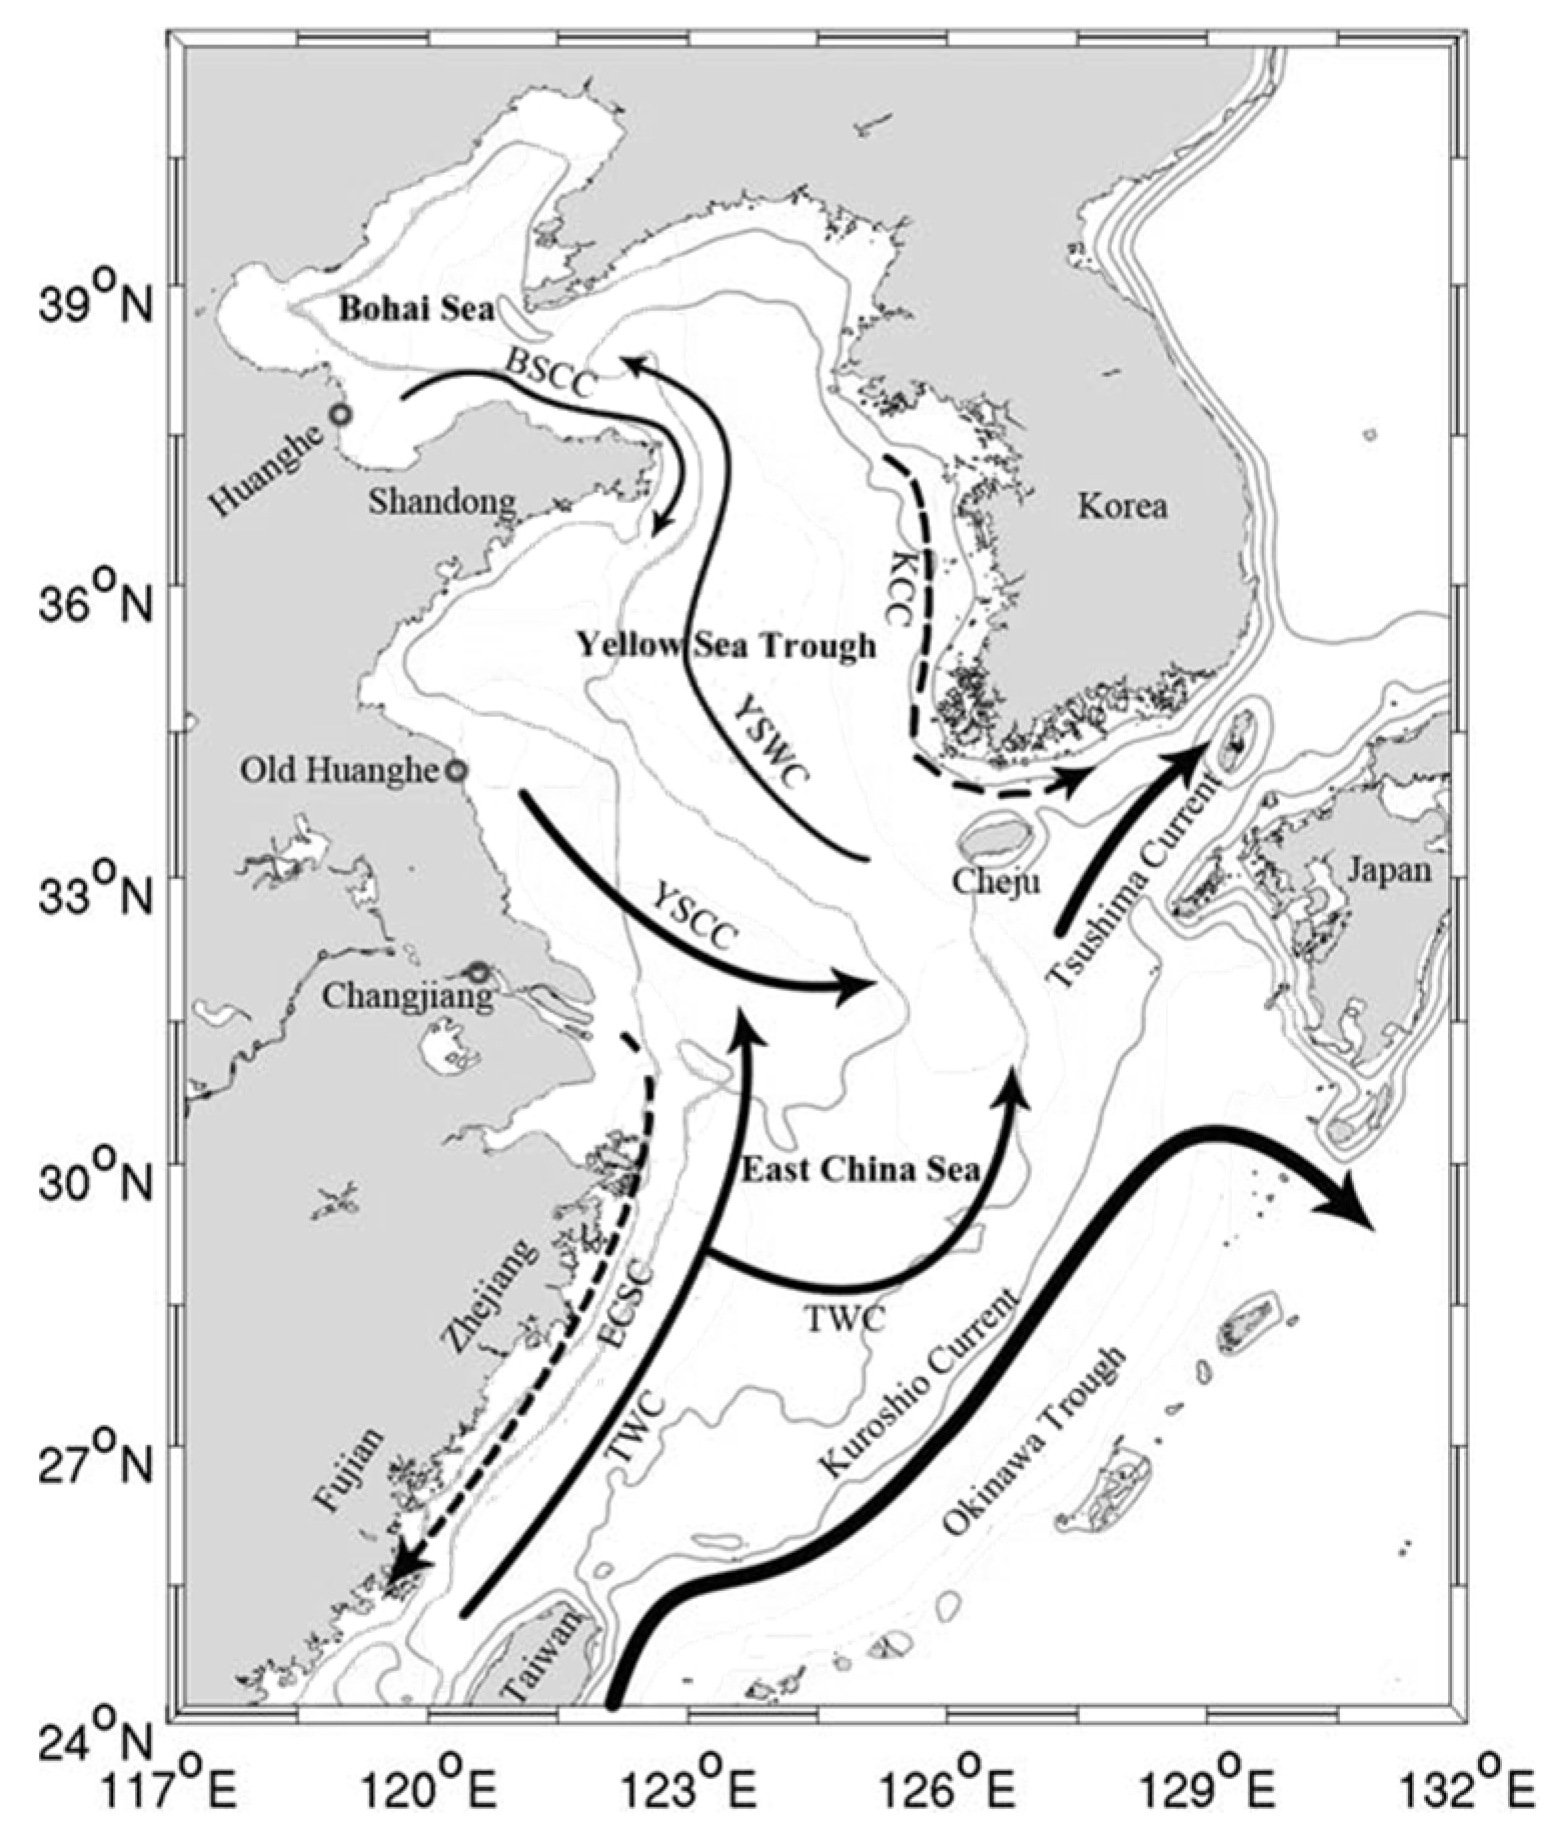
2.1. Study Area

The ECS is located between 23°00′N–33°00′N and 117°00′E–131°00′E, and is bordered by Jeju Island to the north, Tokara strait and Okinawa Island to the east and the Island of Taiwan to the south (Figure 1). It is one of the widest shelf seas in the world, covering an area about 7.7 × 10⁵ km2 (Zhang, 2010). According to bathymetry and current characteristics, the study region can be divided into three subregions: the coastal region (CR) with water depth < 50 m, covering an area of 2.11 × 10⁵ km2; the continental shelf region (CSR) with water depth between 50 m and 200 m, covering an area of 3.42 × 10⁵ km2; and the open sea region (OSR) with depth > 200 m, covering an area of 2.45 × 10⁵ km2.
The main circulation patterns in the ECS are composed of the nearshore and open sea current systems, with the open sea current system dominated by the Kuroshio (Figure 2). The Kuroshio enters the ECS at the east coast of Taiwan and travels to 35°N along the Japanese coast, extending from 120°E to 160°E, before flowing outward into the North Pacific [31]. The Kuroshio is narrow and fast, with high temperature, high salinity and high transparency waters, which significantly influence the ocean and atmosphere of the marginal seas in China [32,33]. Moreover, the Kuroshio is a key contributor to the heat, nutrient and matter exchange between the ECS and the western North Pacific, and therefore affects POC in ECS [17,34,35,36].

2.2. Data

Daily POC, sea surface temperature (SST) and Chlorophyll-a (Chl-a) level 3 data with a horizontal resolution of 4 km collected using MODIS from 2001 to 2011 were obtained from the NASA database website (http://oceandata.sci.gsfc.nasa.gov/ (accessed on 18 December 2013)). The MODIS sensor can provide full images of the Earth every 1 to 2 days with high radiometric sensitivity. Images are organized into different processing levels, archived and made available at no charge. The MODIS POC calculation uses an algorithm based on an empirical relationship between optical measurements and in situ measurements of POC in the eastern South Pacific and eastern Atlantic Oceans [23]. This is expressed as:
P O C s a t = A i R r s λ B R r s 555 B i
where A i and B i are regression coefficients; R r s is sea surface remote sensing reflectance; R r s λ B / R r s 555 represents the blue-to-green band ratio of reflectance with λ B chosen from wavelengths of 443 nm, 490 nm or 510 nm. Statistics found that R r s 443 / R r s 555 and R r s 490 / R r s 555 are well correlated with open ocean POC characteristics [23]. Although the algorithm works well at a global scale, it usually results in overestimation of POC concentration in coastal waters with complex optical properties and multiple POC sources [23,24]. To correct satellite-based POC estimation, different empirical equations have been applied for different regions [25,26].
To calibrate MODIS POC estimates in our study area, we matched MODIS POC data with in situ samplings by locating satellite pixels with the closest proximity to sampling stations on the day of sampling. The sampling stations cover all three sea regions and include 58 stations from the research cruise by the scientific research vessel “Kexue 3” from 10 October to 30 October 2011 and 73 stations from previous cruises in published articles (Figure 1, [16,20,37,38,39,40]). Kexue 3 samples were filtered within 24 h using Whatman GF/F filters (pore size = 0.7 μm) and stored in a −20 °C freezer until analysis. They were exposed to HCl vapor for 48 h to remove inorganic carbon, then dried in the oven at 60 °C. An elemental analyzer (Elementa, Germany) was used to measure and calculate the POC concentrations.
Ref. [27] has demonstrated the reliability of MODIS-derived POC estimates in areas adjacent to ECS with a focus on the Yellow–Bohai Sea. To determine more accurate estimates of POC concentrations in the studied regions, we used a linear regression relating measured POC to MODIS-derived POC ( P O C s a t ):
POC = P O C s a t × 0.89 34.3
The correlation coefficient between in situ measured POC and satellite-derived POC increases from 0.69 before calibration to 0.74 after calibration. The root-mean-square error (RMSE) decreases from 102.73 mg m−3 before calibration to 80.06 mg m−3 after calibration. POC calculations in the following sessions are based on these calibrated POC estimates. This method was also applied for the calibration of Chl-a in the studied regions [41].
Chl = 1.4732 × C h l s a t + 0.3115 0.3 1.0382 ,     C h l s a t < 2.336 C h l s a t × 0.428 ,     C h l s a t 2.336
where C h l s a t represents Chl-a before calibration. The MODIS standard algorithm for SST has high accuracy in the ECS, so no calibration was deemed necessary.
To estimate total organic carbon storage in ECS, we collected POC and DOC observations from available studies with details in Section 3.4.

3. Results and Discussion

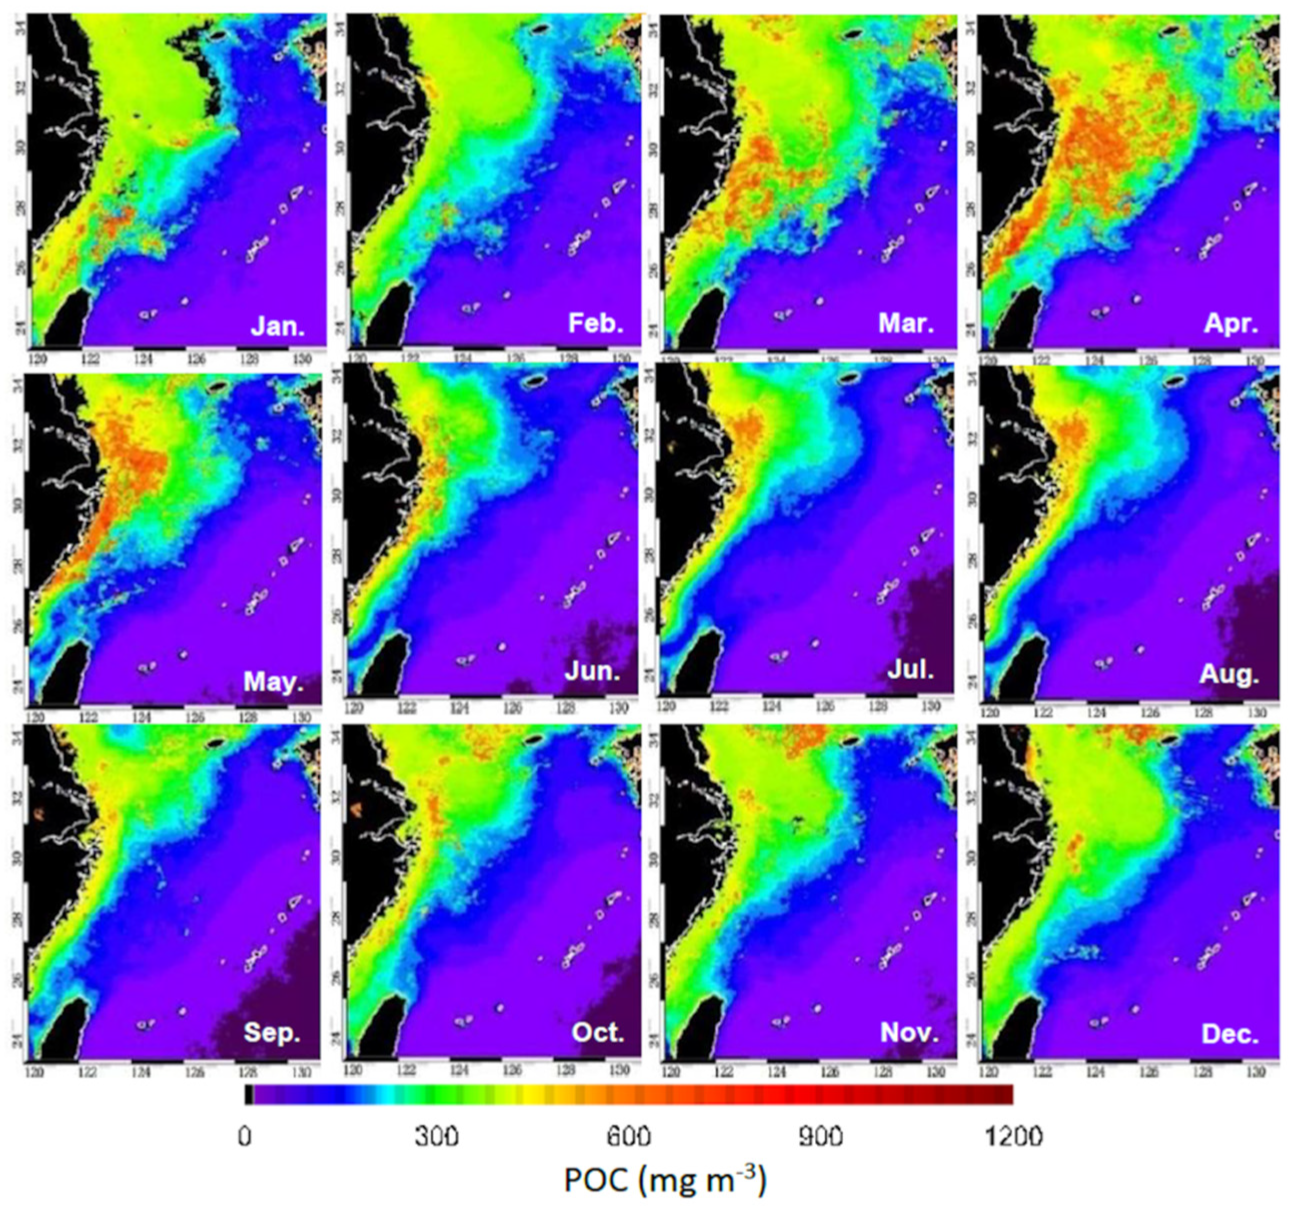
3.1. Spatiotemporal Distribution

Monthly averaged POC in ECS demonstrated strong seasonal variability over the whole ECS (Figure 3). In spring (March to May), the seasonally and spatially averaged POC concentration was 231.9 mg m−3, which is 45% larger than the averaged concentration of 160.1 mg m−3 in winter (December to February), 76% larger than the concentration of 132.1 mg m−3 in fall (September to November) and 93% larger than the smallest averaged concentration of 119.9 mg m−3 in summer (June to August).
The averaged POC also showed strong spatial variability, as shown in Figure 3. Concentration decreased from coastal region to open sea region, with year-round low POC concentrations mostly appearing in the open sea region near the Okinawa Trough under the influence of the Kuroshio Current. High POC concentration (>600 mg m−3) appeared around the coastal region, with the largest temporal variability due to the combined effects of primary productivity, terrestrial runoff and physical processes. High POC was observed in spring, which was consistent with observational studies suggesting that POC concentrations are dominated by biological activity due to high nutrients supply by terrestrial input and upwelling [27]. POC decreased in summer, despite high river discharge from sources including the Changjiang Estuary transporting higher quantities of POC from terrestrial runoff into the coastal region [42]. The large volume of freshwater induced stronger stratification, preventing nutrients and oxygen exchange between upper and deeper oceans [43]. A combination of insufficient nutrient supply to phytoplankton growth and continuous consumption by zooplankton and bacteria led to the reduction of POC in the upper ocean layers and caused the formation of a hypoxic zone in deeper layers [35]. However, some high POC areas can still be found at the northeastern Changjiang Estuary, potentially caused by the strong terrestrial input and increased sediment resuspension by southwestern monsoons [44]. In winter, the sub-peak in POC in the northeastern Changjiang Estuary was due to resuspension by strong northeastern monsoons lasting from late September to early April [45]. This was accompanied by a sub-peak in biological productivity [46], although this secondary effect was relatively weaker than the initial effect caused by the sediment resuspension by northeastern monsoons.

3.2. Relationship between POC and Chl-a/SST

Correlation analyses for Chl-a vs. POC and SST vs. POC were processed for all three subregions (Figure 4). The first analysis revealed that POC is positively correlated with Chl-a with the correlation coefficients increasing from 0.52 in the coastal region to 0.90 in open sea region.
Chl-a is the main pigment used for photosynthesis by phytoplankton, and is a significant indicator of marine phytoplankton biomass, reflecting the carbon fixation capacity for primary producers in seawater. Therefore, POC and Chl-a can be positively correlated with each other, with the increase in Chl-a accompanied by an increase in POC [47,48].
Our correlation analysis demonstrated that Chl-a and POC have a stronger correlation in regions with simpler POC sources, as represented by the strongest correlation of r2 = 0.90 in the open sea where biological productivity is the most important POC source. Under extensive influence of nutrient-poor Kuroshio water [45,49,50], the open sea area was oligotrophic with low productivity and concentration variation of Chl-a and POC remained low and stable. In the coastal region, the complex POC sources include primary productivity, terrestrial input, sediment resuspension and water exchange, all of which cause the POC to vary widely and be less correlated with Chl-a.
A negative correlation between POC and SST was identified in all three ECS regions, with the absolute values of r2 increasing from 0.46 in the coastal region to 0.78 in the open sea region (Figure 4d–f). The strong correlation in the open sea region was because SST dictates biological activities including the reproduction, predation and excretion of phytoplankton, which affects regional POC concentrations. For example, zooplankton and bacteria would be enhanced under appropriate seawater temperature, increasing the predation and excretion of phytoplankton and favoring the production of POC [51,52]. SST can also be correlated with POC through physical processes and can be used as an indicator of POC anomaly. A good example is that the cold-water wake induced by a typhoon event is regarded as a sign of bottom sediment entrainment and can result in an abnormal increase of POC concentrations [53,54].

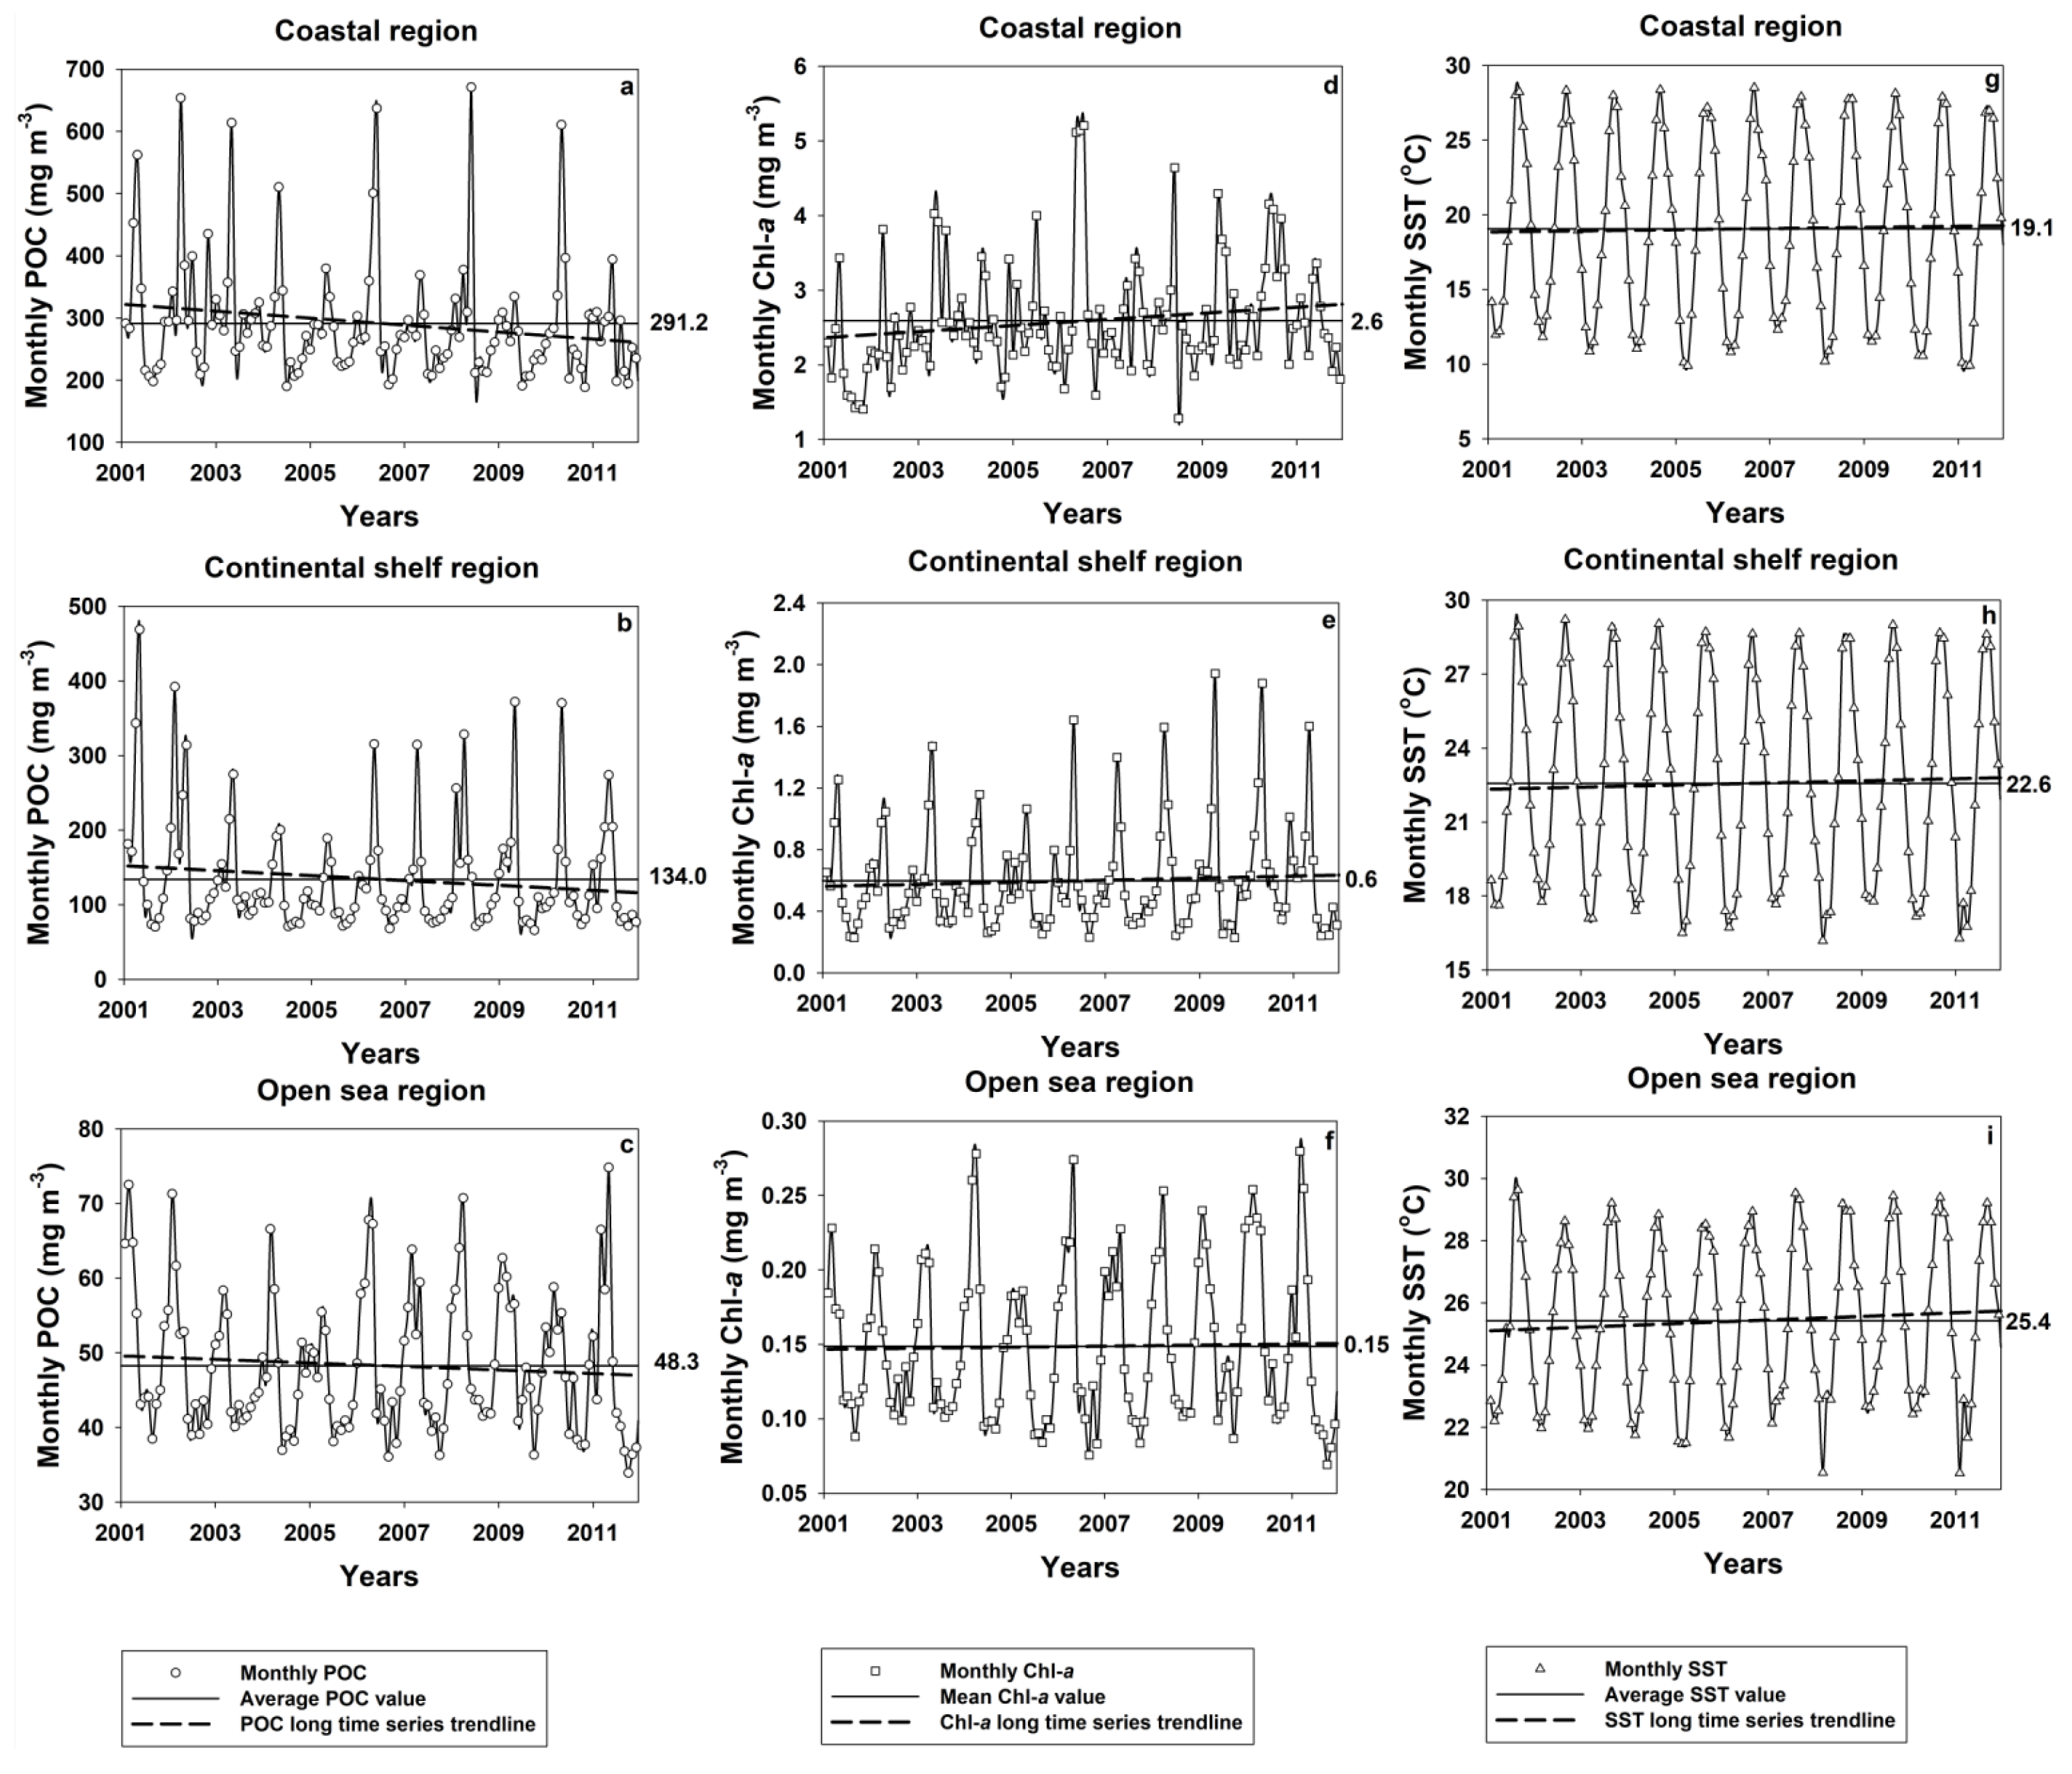
3.3. Interannual Variabilities of POC in Different Regions of ECS

Long term variations in POC and its correlation factors, SST and Chl-a, were discussed in three subregions of the ECS based on satellite data from 2001 to 2011 (Figure 5). POC concentrations in all three regions showed a decreasing trend from 2001 to 2011. However, the trends in SST and Chl-a were not consistent for different regions, which indicates different influencing factors for POC variations.

3.3.1. Coastal Region

In the coastal region, POC concentration decreased by 16.3% from 2001 to 2011, while Chl-a and SST both increased. The increase of Chl-a (by 25.5% from 2001 to 2011) conflicted with our analysis in Section 3.2, and indicated a positive correlation between POC and Chl-a. The inconsistent trends could be attributed to the following reasons: (1) accompanied by the development of the national economy, application of chemical fertilizers, including Nitrogen (N) and Phosphate (P) fertilizers, in the Changjiang River region increased gradually from 10.6 million tons in 2001 to 19.3 million tons in 2011 [55]. This has significantly augmented river nutrient loading; (2) The increase in P fertilizer (6.6%) application was larger than the increase in N fertilizer (5.2%). The coastal region of the ECS is P-limited [56,57], so the larger increase in P raised the N/P ratio and decreased P limitation, hence favoring phytoplankton growth and increasing Chl-a. In return, the enhanced phytoplankton biomass increased nutrient consumption and aggravated the imbalanced nutrient ratio in seawater [58,59]. The increase of SST also contributed to an increase in primary production by enhancing biological activities [60].
While primary production contributes to POC, it is not the only POC source in the coastal region. Terrestrial runoff, mainly from the Changjiang Estuary, is another important POC source that could potentially change POC. The construction of the Three Gorge Dam (TGD) has not only changed seasonal distribution of the Changjiang diluted water flux into the ECS [61,62], but also has decreased sediment discharge from 276 million tons in 2001 to 72 million tons in 2011 [63,64]. In addition to the sediment discharge decrease, a decrease in POC concentration was observed in the coastal region, with the variation trend similar to sediment discharge but much larger than river flux (Figure 6).
When comparing the initial 6 years (2001–2006) with the final 6 years (2006–2011), we found that sediment discharge and POC concentration decreased by 36.8% and 21.6%, respectively, while water flux slightly decreased by 4.6%. Therefore, the change in POC was dominated by sediment discharge instead of primary production or other variables directly related to river flux. POC decreased less than sediment discharge (Figure 6) due to the increasing effect of primary production on POC as previously mentioned. Moreover, the reduced sediment discharge increased seawater transparency in the coastal region, which further favored primary production and increased Chl-a. As a result, long term POC decreased while Chl-a increased, which contradicts the positively correlated relationship between POC and Chl-a. This result indicates that (1) coastal POC variation is strongly influenced by sediment discharge, (2) oceanic biological productivity may not be the dominant source of POC, and (3) the sediment discharge regulated by TGD is a more important influence on POC concentration in the coastal region than biological productivity.

3.3.2. Open Sea Region

Unlike the production of POC by both riverine and oceanic sources in the coastal region, POC in the open sea region was dominated by the Kuroshio Current waters. This region had lower POC concentrations and smaller fluctuations, and the corresponding Chl-a variation presented similar variations (Figure 5). Annual mean SST in this region showed a larger increase of 0.17 °C from 2001 to 2011, which may be a result of the intrusion of higher temperature water masses and heat exchange with the Kuroshio Current [65,66].

3.3.3. Continental Shelf Region

Seawater in the continental shelf region has multiple sources, including the Changjiang diluted water, Kuroshio Current, and water exchange with the Yellow Sea [67,68]. Therefore, POC is affected by a combination of biological productivity, terrestrial runoff and Kuroshio Current exchange. Long time series showed that in the continental shelf region, POC decreased by 0.91% each year while Chl-a and SST increased each year by 0.58% and 0.73%, respectively (Figure 5). As discussed above, the TGD effects could extend to the continental shelf region, especially in summer and autumn, with high sediment flux from the Changjiang diluted water greatly influencing its POC/Chl-a concentrations [42,43]. The weight of different influencing factors varies seasonally. To determine the dominant influencing factors in different seasons, we carried out a correlation analysis between POC in the continental shelf region with POC, Chl-a and SST in all sub-regions of the ECS (Table 1).
In spring, most of the terrestrial nutrient input does not reach the continental shelf region due to strong consumption in the coastal region. Therefore, POC in the continental shelf region was less affected by the riverine water exchange than the coastal area. Meanwhile, the Kuroshio Current was slow [69], which caused a peak in matter exchange between the Kuroshio and continental shelf water [70]. Therefore, spring POC variation in the continental shelf region was greatly influenced by POC from the Kuroshio Current, with a correlation coefficient of 0.67.
During summer, the larger river discharge from the Changjiang estuary transported abundant nutrients and organic matter to the continental shelf region, boosting POC concentration due to biological productivity and water exchange. The importance of water exchange was evidenced by the large correlation coefficients between continental shelf POC with coastal POC (0.51) and Chl-a (0.56). The importance of biological activities was evidenced by the large correlation coefficient between POC and Chl-a in the continental shelf region (0.81). Biological activities are affected by temperature, so correlation between continental shelf POC and continental shelf/coastal SST was also strong (0.52/0.72). This analysis is consistent with previous research, which found that both coastal and continental shelf Chl-a and sea temperature dominate continental shelf POC concentrations [13,68].
In fall, the Kuroshio Current is affected by monsoons, so its axis bends closer to the continental shelf region [71,72]. Northeast monsoons together with the strong Changjiang diluted water broke continental shelf stratification which caused the increase in primary productivity. Therefore, POC transport from the coastal and open sea regions both influenced the continental shelf region, with an emphasis on transport from the open sea region, demonstrated by an r2 of 0.88.
In winter, the Changjiang diluted water flux decreased, while the influence by the open sea region remained consistent, with a correlation coefficient for continental shelf POC and Kuroshio POC at 0.73. However, the correlation between coastal POC and continental shelf POC remained strong at 0.77 under the influence of physical processes. During winter, the strong northeast monsoon and coastal currents caused a strong exchange between coastal water and continental shelf water [73]. Therefore, POC import from coastal water, the Kuroshio, and intensive mixing and entrainment activities all contributed to POC variation in winter [34,74].
This analysis demonstrated that POC variations in the continental shelf region of the ECS are affected by multiple environmental factors in different regions, and the variations are not constant year-round. Therefore, it is necessary to conduct further research and quantitative analysis to detect the specific biological, physical and chemical effects and intrinsic mechanisms that influence POC variations.

3.4. Estimation of Organic Carbon Storage in ECS

Since satellite data can only reflect parameter surface variability and distribution, we developed a method to estimate the total organic carbon storage in ECS by combining satellite-derived surface POC, in situ observed surface POC, in situ observed POC for different layers and seasonal POC and DOC observations from available cruises.
We first estimated depth-averaged POC in ECS ( C satellite column P O C ) using satellite-observed surface POC for the whole ECS ( C satellite surface P O C ) and the ratio between depth-averaged POC based on in situ observations at different layers ( C measured column P O C ) and in situ surface observations ( C measured surface P O C ) in the form of:
C satellite column P O C C satellite surface P O C = C measured column P O C C measured surface P O C
The calculation of C measured surface P O C and C measured column P O C were based on historical observations shown in Table 2. We estimated POC on the surface and average over the whole water column as 174.40 mg m−3 and 146.00 mg m−3, respectively. We then generated ratios between DOC and POC in different seasons with vertical integration and arithmetic mean based on POC and DOC in situ samplings from available cruises (Table 2). These ratios were coupled with satellite data to estimate the organic carbon storage in ECS.
Annual average C satellite column P O C calculated by equation 4 is 118.85 mg m−3 (Table 3). In spring, POC accounts for the highest ratio of organic carbon (21.5%), while average organic carbon in the other seasons is less than in spring, at 13.1% (Table 4). Therefore, the calculated total organic carbon concentration reaches 907.25 mg m−3. With a total water volume of 4.5 × 10¹³ m3 for ECS [79], we made preliminary calculations of the annual total organic carbon in ECS, estimated at 4.08 × 10¹³ g yr−1. This result is close to the estimation by Chen et al. [17], 11.28 × 10¹³ g yr−1, based on mass balance calculations. In conclusion, this method uses satellite data, which can cover the whole research area with consistent and continuous temporal coverage, to estimate organic carbon content. More in situ data and an improved algorithm for satellite POC analysis will enhance the accuracy of these estimations.

4. Summary

In this paper, we applied a linear regression to calibrate MODIS derived POC concentrations in ECS and used calibrated POC estimates to investigate spatial and temporal variations of POC in three subregions of ECS. POC in the coastal region (with depth < 50 m) is mainly affected by water and sediment discharge from the Changjiang Estuary, which shows seasonal variability regulated by river discharge and the Three Gorge Project and demonstrates a decreasing trend at interannual scale regulated by the Three Gorge Project and chemical fertilizer application. In the continental shelf region (depth 50–200 m), variation of POC is controlled by multiple factors, dominated by the Changjiang diluted water in summer, Kuroshio Current water in spring, and a combination of both influences in fall. Although effects of the Changjiang diluted water in the coastal ocean weaken in winter, the coastal ocean still affects the continental shelf POC through northeast monsoon and induced currents. In the open sea region, POC concentration usually remains low and stable. In addition, the organic carbon stock in the entire water column has been evaluated with the ratio of measured data to satellite data. Preliminary estimation reveals that organic carbon reserve in the ECS is ~4.08 × 10¹³ g per year, a value that provides a new, comparative idea of the carbon reserve estimation for future study.

Author Contributions

Conceptualization, D.C. and Q.L.; methodology, L.Z.; validation, D.C. and L.Z.; investigation, L.Z.; writing—original draft preparation, D.C.; writing—review and editing, Q.L. and K.B.; supervision, Q.L. All authors have read and agreed to the published version of the manuscript.

Funding

Dongxing Chen was funded by the National Program on Key Basic Research Project of China (973 Program, Grant No. 2012CB956004).

Data Availability Statement

Publicly available datasets were analyzed in this study. This data can be found here: http://oceandata.sci.gsfc.nasa.gov/ (accessed on 18 December 2013).

Acknowledgments

We thank Jinpeng Yang, School of Marine Sciences, Sun Yat-sen University, for his valuable comments. We acknowledge NASA for providing MODIS data and the support of in situ samplings from “Kexue 3” scientific research vessel.

Conflicts of Interest

The authors declare no conflict of interest.

References

  1. Jahnke, R.A. The global ocean flux of particulate organic carbon: Areal distribution and magnitude. Glob. Biogeochem. Cycles 1996, 10, 71–88. [Google Scholar] [CrossRef]
  2. Loisel, H.; Nicolas, J.M.; Deschamps, P.Y.; Frouin, R. Seasonal and inter-annual variability of particulate organic matter in the global ocean. Geophys. Res. Lett. 2002, 29, 49–51. [Google Scholar] [CrossRef]
  3. Ducklow, H.W.; Steinberg, D.K.; Buesseler, K.O. Upper ocean carbon export and the biological pump. Oceanography 2001, 14, 50–58. [Google Scholar] [CrossRef]
  4. Honjo, S.; Manganini, S.J.; Krishfield, R.A.; Francois, R. Particulate organic carbon fluxes to the ocean interior and factors controlling the biological pump: A synthesis of global sediment trap programs since 1983. Prog. Oceanogr. 2008, 76, 217–285. [Google Scholar] [CrossRef]
  5. Honjo, S.; Eglinton, T.I.; Taylor, C.D.; Ulmer, K.M.; Sievert, S.M.; Bracher, A.; German, C.R.; Edgcomb, V.; Francois, R.; Iglesias-Rodriguez, M.D. Understanding the role of the biological pump in the global carbon cycle: An imperative for ocean science. Oceanography 2014, 27, 10–16. [Google Scholar] [CrossRef] [Green Version]
  6. Thomsen, L.; Aguzzi, J.; Costa, C.; De Leo, F.; Ogston, A.; Purser, A. The oceanic biological pump: Rapid carbon transfer to depth at continental margins during winter. Sci. Rep. 2017, 7, 10763. [Google Scholar]
  7. Wakeham, S.G.; Lee, C.; Farrington, J.W.; Gagosian, R.B. Biogeochemistry of particulate organic matter in the oceans: Results from sediment trap experiments. Deep Sea Res. Part A Oceanogr. Res. Pap. 1984, 31, 509–528. [Google Scholar] [CrossRef]
  8. Wakeham, S.G.; Lee, C.; Hedges, J.I. Fluxes of major biochemicals in the equatorial Pacific Ocean. In Dynamics and Characterization of Marine Organic Matter; Handa, N., Tanoue, E., Hama, T., Eds.; Terra Scientific Publishing Company: Tokyo, Japan/Kluwer, Dordrecht, 2000; pp. 117–140. [Google Scholar]
  9. Wang, S.-L.; Chen, C.-T.A.; Hong, G.-H.; Chung, C.-S. Carbon dioxide and related parameters in the East China Sea. Cont. Shelf Res. 2000, 20, 525–544. [Google Scholar] [CrossRef]
  10. Gong, G.C.; Chang, J.; Chiang, K.P.; Hsiung, T.M.; Hung, C.C.; Duan, S.W.; Codispoti, L. Reduction of primary production and changing of nutrient ratio in the East China Sea: Effect of the Three Gorges Dam? Geophys. Res. Lett. 2006, 33. [Google Scholar] [CrossRef] [Green Version]
  11. Yang, D.; Yin, B.; Liu, Z.; Feng, X. Numerical study of the ocean circulation on the East China Sea shelf and a Kuroshio bottom branch northeast of Taiwan in summer. J. Geophys. Res. Ocean. 2011, 116. [Google Scholar] [CrossRef] [Green Version]
  12. Lee, K.; Matsuno, T.; Endoh, T.; Ishizaka, J.; Zhu, Y.; Takeda, S.; Sukigara, C. A role of vertical mixing on nutrient supply into the subsurface chlorophyll maximum in the shelf region of the East China Sea. Cont. Shelf Res. 2017, 143, 139–150. [Google Scholar] [CrossRef]
  13. Gong, G.-C.; Chen, Y.-L.L.; Liu, K.-K. Chemical hydrography and chlorophyll a distribution in the East China Sea in summer: Implications in nutrient dynamics. Cont. Shelf Res. 1996, 16, 1561–1590. [Google Scholar] [CrossRef]
  14. Guo, X.; Zhu, X.H.; Wu, Q.S.; Huang, D. The Kuroshio nutrient stream and its temporal variation in the East China Sea. J. Geophys. Res. Ocean. 2012, 117. [Google Scholar] [CrossRef] [Green Version]
  15. Ziqiang, H.; Tianbao, F.; Yuanhui, Z. Distributive characteristics of POC in sea water in East China Sea. J. Oceanogr. Taiwan Strait 1997, 2, 145–152. [Google Scholar]
  16. Zhu, Z.Y.; Zhang, J.; Wu, Y.; Lin, J. Bulk particulate organic carbon in the East China Sea: Tidal influence and bottom transport. Prog. Oceanogr. 2006, 69, 37–60. [Google Scholar] [CrossRef]
  17. Chen, C.T.A.; Wang, S.L. Carbon, alkalinity and nutrient budgets on the East China Sea continental shelf. J. Geophys. Res. Ocean. 1999, 104, 20675–20686. [Google Scholar] [CrossRef]
  18. Hung, J.-J.; Lin, P.-L.; Liu, K.-K. Dissolved and particulate organic carbon in the southern East China Sea. Cont. Shelf Res. 2000, 20, 545–569. [Google Scholar] [CrossRef]
  19. Hung, C.C.; Gong, G.C. Export flux of POC in the main stream of the Kuroshio. Geophys. Res. Lett. 2007, 34. [Google Scholar] [CrossRef]
  20. Hung, C.-C.; Tseng, C.-W.; Gong, G.-C.; Chen, K.-S.; Chen, M.-H.; Hsu, S.-C. Fluxes of particulate organic carbon in the East China Sea in summer. Biogeosciences 2013, 10, 6469–6484. [Google Scholar] [CrossRef] [Green Version]
  21. Kao, S.; Lin, F.; Liu, K. Organic carbon and nitrogen contents and their isotopic compositions in surficial sediments from the East China Sea shelf and the southern Okinawa Trough. Deep Sea Res. Part II Top. Stud. Oceanogr. 2003, 50, 1203–1217. [Google Scholar] [CrossRef]
  22. Deng, B.; Zhang, J.; Wu, Y. Recent sediment accumulation and carbon burial in the East China Sea. Glob. Biogeochem. Cycles 2006, 20. [Google Scholar] [CrossRef]
  23. Stramski, D.; Reynolds, R.A.; Babin, M.; Kaczmarek, S.; Lewis, M.R.; Röttgers, R.; Sciandra, A.; Stramska, M.; Twardowski, M.; Franz, B. Relationships between the surface concentration of particulate organic carbon and optical properties in the eastern South Pacific and eastern Atlantic Oceans. Biogeosciences 2008, 5, 171–201. [Google Scholar] [CrossRef] [Green Version]
  24. Son, S.; Wang, M. Water properties in Chesapeake Bay from MODIS-Aqua measurements. Remote Sens. Environ. 2012, 123, 163–174. [Google Scholar] [CrossRef] [Green Version]
  25. Bai, Y.; He, X.; Pan, D.; Hao, Z.; Song, Q.; Lei, H. Remote sensing algorithm of particle attenuation coefficient in East China Sea. In Proceedings of the Remote Sensing of the Ocean, Sea Ice, and Large Water Regions 2008, Cardiff, Wales, UK, 15–18 September 2008; pp. 241–251. [Google Scholar]
  26. Liu, Q. Methods for the Estimation of Organic Carbon Stocks in the Upper Layer of the East China Sea by Satellite Remote Sensing. Ph.D. Thesis, Wuhan University, Wuhan, China, 2013. [Google Scholar]
  27. Fan, H.; Wang, X.; Zhang, H.; Yu, Z. Spatial and temporal variations of particulate organic carbon in the Yellow-Bohai Sea over 2002–2016. Sci. Rep. 2018, 8, 7971. [Google Scholar]
  28. Yu, J.; Wang, X.; Murtugudde, R.; Tian, F.; Zhang, R.H. Interannual-to-Decadal Variations of Particulate Organic Carbon and the Contribution of Phytoplankton in the Tropical Pacific During 1981–2016: A Model Study. J. Geophys. Res. Ocean. 2021, 126, e2020JC016515. [Google Scholar] [CrossRef]
  29. Nelson, D.; Sommers, L.E. Total carbon, organic carbon, and organic matter. Methods Soil Anal. Part 2 Chem. Microbiol. Prop. 1982, 9, 539–579. [Google Scholar]
  30. Nakatsuka, T.; Toda, M.; Kawamura, K.; Wakatsuchi, M. Dissolved and particulate organic carbon in the Sea of Okhotsk: Transport from continental shelf to ocean interior. J. Geophys. Res. Ocean. 2004, 109. [Google Scholar] [CrossRef] [Green Version]
  31. Hsueh, Y. The Kuroshio in the East China Sea. J. Mar. Syst. 2000, 24, 131–139. [Google Scholar] [CrossRef]
  32. Chen, Y.-l.L.; Chen, H.-Y.; Lin, Y.-H. Distribution and downward flux of Trichodesmium in the South China Sea as influenced by the transport from the Kuroshio Current. Mar. Ecol. Prog. Ser. 2003, 259, 47–57. [Google Scholar] [CrossRef]
  33. Taguchi, B.; Nakamura, H.; Nonaka, M.; Xie, S.-P. Influences of the Kuroshio/Oyashio Extensions on air–sea heat exchanges and storm-track activity as revealed in regional atmospheric model simulations for the 2003/04 cold season. J. Clim. 2009, 22, 6536–6560. [Google Scholar] [CrossRef] [Green Version]
  34. Zhang, J.; Liu, S.; Ren, J.; Wu, Y.; Zhang, G. Nutrient gradients from the eutrophic Changjiang (Yangtze River) Estuary to the oligotrophic Kuroshio waters and re-evaluation of budgets for the East China Sea Shelf. Prog. Oceanogr. 2007, 74, 449–478. [Google Scholar] [CrossRef]
  35. Wang, H.; Dai, M.; Liu, J.; Kao, S.-J.; Zhang, C.; Cai, W.-J.; Wang, G.; Qian, W.; Zhao, M.; Sun, Z. Eutrophication-driven hypoxia in the East China Sea off the Changjiang Estuary. Environ. Sci. Technol. 2016, 50, 2255–2263. [Google Scholar] [CrossRef] [PubMed]
  36. Bian, C.; Jiang, W.; Greatbatch, R.J. An exploratory model study of sediment transport sources and deposits in the Bohai Sea, Yellow Sea, and East China Sea. J. Geophys. Res. Ocean. 2013, 118, 5908–5923. [Google Scholar] [CrossRef] [Green Version]
  37. Li, N. Distribution, source of organic carbon and carbon-nitrogen-phosphors interaction in Changjing River estuary and Jiaozhou Bay waters. Ph.D. Thesis, The University of the Chinese Academy of Sciences, Beijing, China, 8 June 2006. [Google Scholar]
  38. Lin, J. Distributions of Dissolved Organic Carbon and Particulate Organic Carbon in the Changjiang Estuary and Its Adjacent Area. Master’s Thesis, East China Normal University, Shanghai, China, 2007. [Google Scholar]
  39. Cheng, J.; Shi, X.-Y.; Zhang, C.-S.; Wang, L.-S.; Huang, S.; Liu, D.-S. Temporal and spatial distribution of particulate organic carbon in the Yellow Sea and East China Sea in spring. Huan Jing Ke Xue Huanjing Kexue 2011, 32, 2505–2511. [Google Scholar]
  40. Shi, X.; Zhang, T.; Zhang, C.; Cheng, J. Spatial and temporal distribution of particulate organic carbon in Yellow Sea and East China Sea. Mar. Environ. Sci. 2011, 1, 1–9. [Google Scholar]
  41. Chen, D.; He, L.; Liu, F.; Yin, K. Effects of typhoon events on chlorophyll and carbon fixation in different regions of the East China Sea. Estuar. Coast. Shelf Sci. 2017, 194, 229–239. [Google Scholar] [CrossRef]
  42. Chang, P.H.; Isobe, A. A numerical study on the Changjiang diluted water in the Yellow and East China Seas. J. Geophys. Res. Ocean. 2003, 108. [Google Scholar] [CrossRef]
  43. Kim, H.-C.; Yamaguchi, H.; Yoo, S.; Zhu, J.; Okamura, K.; Kiyomoto, Y.; Tanaka, K.; Kim, S.-W.; Park, T.; Oh, I.S. Distribution of Changjiang diluted water detected by satellite chlorophyll-a and its interannual variation during 1998–2007. J. Oceanogr. 2009, 65, 129–135. [Google Scholar] [CrossRef]
  44. Ni, X.; Huang, D.; Zeng, D.; Zhang, T.; Li, H.; Chen, J. The impact of wind mixing on the variation of bottom dissolved oxygen off the Changjiang Estuary during summer. J. Mar. Syst. 2016, 154, 122–130. [Google Scholar] [CrossRef] [Green Version]
  45. Liu, Q.; Kandasamy, S.; Wang, H.; Wang, L.; Lin, B.; Gao, A.; Chen, C.T.A. Impact of hydrological conditions on the biogeochemical dynamics of suspended particulate organic matter in the upper mixed layer of the Southern East China Sea. J. Geophys. Res. Ocean. 2019, 124, 6120–6140. [Google Scholar] [CrossRef]
  46. Chen, Y.-L.L.; Chen, H.-Y. Nitrate-based new production and its relationship to primary production and chemical hydrography in spring and fall in the East China Sea. Deep Sea Res. Part II Top. Stud. Oceanogr. 2003, 50, 1249–1264. [Google Scholar] [CrossRef]
  47. Sathyendranath, S.; Stuart, V.; Nair, A.; Oka, K.; Nakane, T.; Bouman, H.; Forget, M.-H.; Maass, H.; Platt, T. Carbon-to-chlorophyll ratio and growth rate of phytoplankton in the sea. Mar. Ecol. Prog. Ser. 2009, 383, 73–84. [Google Scholar] [CrossRef]
  48. Jakobsen, H.H.; Markager, S. Carbon-to-chlorophyll ratio for phytoplankton in temperate coastal waters: Seasonal patterns and relationship to nutrients. Limnol. Oceanogr. 2016, 61, 1853–1868. [Google Scholar] [CrossRef]
  49. Wang, B.; Chen, J.; Jin, H.; Li, H.; Huang, D.; Cai, W.J. Diatom bloom-derived bottom water hypoxia off the Changjiang estuary, with and without typhoon influence. Limnol. Oceanogr. 2017, 62, 1552–1569. [Google Scholar] [CrossRef]
  50. Qu, B.; Song, J.; Yuan, H.; Li, X.; Li, N. Carbon chemistry in the mainstream of Kuroshio current in eastern Taiwan and its transport of carbon into the east China sea shelf. Sustainability 2018, 10, 791. [Google Scholar] [CrossRef] [Green Version]
  51. Berelson, W.; Haskell II, W.; Prokopenko, M.; Knapp, A.; Hammond, D.; Rollins, N.; Capone, D. Biogenic particle flux and benthic remineralization in the Eastern Tropical South Pacific. Deep Sea Res. Part I Oceanogr. Res. Pap. 2015, 99, 23–34. [Google Scholar] [CrossRef]
  52. Kelly, P.; Clementson, L.; Davies, C.; Corney, S.; Swadling, K. Zooplankton responses to increasing sea surface temperatures in the southeastern Australia global marine hotspot. Estuar. Coast. Shelf Sci. 2016, 180, 242–257. [Google Scholar] [CrossRef]
  53. Cronin, M.F.; Kessler, W.S. Near-surface shear flow in the tropical Pacific cold tongue front. J. Phys. Oceanogr. 2009, 39, 1200–1215. [Google Scholar] [CrossRef] [Green Version]
  54. Pan, A.; Guo, X.; Xu, J.; Huang, J.; Wan, X. Responses of Guangdong coastal upwelling to the summertime typhoons of 2006. Sci. China Earth Sci. 2012, 55, 495–506. [Google Scholar] [CrossRef]
  55. China Statistical Yearbook; National Bureau of Statistics of China; China Statistics Press: Beijing, China, 1999–2008.
  56. Harrison, P.; Hu, M.; Yang, Y.; Lu, X. Phosphate limitation in estuarine and coastal waters of China. J. Exp. Mar. Biol. Ecol. 1990, 140, 79–87. [Google Scholar] [CrossRef]
  57. Zhou, Z.-X.; Yu, R.-C.; Zhou, M.-J. Resolving the complex relationship between harmful algal blooms and environmental factors in the coastal waters adjacent to the Changjiang River estuary. Harmful Algae 2017, 62, 60–72. [Google Scholar] [CrossRef] [PubMed]
  58. Wang, B. Cultural eutrophication in the Changjiang (Yangtze River) plume: History and perspective. Estuar. Coast. Shelf Sci. 2006, 69, 471–477. [Google Scholar] [CrossRef]
  59. Li, Y.; Li, D.; Tang, J.; Wang, Y.; Liu, Z.; He, S. Long-term changes in the Changjiang Estuary plankton community related to anthropogenic eutrophication. Aquat. Ecosyst. Health Manag. 2010, 13, 66–72. [Google Scholar] [CrossRef]
  60. Zhang, Y.; Wang, T.; Li, H.; Bao, N.; Hall-Spencer, J.M.; Gao, K. Rising levels of temperature and CO2 antagonistically affect phytoplankton primary productivity in the South China Sea. Mar. Environ. Res. 2018, 141, 159–166. [Google Scholar] [CrossRef] [PubMed] [Green Version]
  61. Sun, Z.; Huang, Q.; Opp, C.; Hennig, T.; Marold, U. Impacts and implications of major changes caused by the Three Gorges Dam in the middle reaches of the Yangtze River, China. Water Resour. Manag. 2012, 26, 3367–3378. [Google Scholar] [CrossRef]
  62. Zhao, Y.; Zou, X.; Gao, J.; Xu, X.; Wang, C.; Tang, D.; Wang, T.; Wu, X. Quantifying the anthropogenic and climatic contributions to changes in water discharge and sediment load into the sea: A case study of the Yangtze River, China. Sci. Total Environ. 2015, 536, 803–812. [Google Scholar] [CrossRef] [PubMed]
  63. Yang, Z.-S.; Wang, H.-J.; Saito, Y.; Milliman, J.; Xu, K.; Qiao, S.; Shi, G. Dam impacts on the Changjiang (Yangtze) River sediment discharge to the sea: The past 55 years and after the Three Gorges Dam. Water Resour. Res. 2006, 42, W04407. [Google Scholar] [CrossRef]
  64. Dai, Z.; Fagherazzi, S.; Mei, X.; Gao, J. Decline in suspended sediment concentration delivered by the Changjiang (Yangtze) River into the East China Sea between 1956 and 2013. Geomorphology 2016, 268, 123–132. [Google Scholar] [CrossRef] [Green Version]
  65. Ichikawa, H.; Chaen, M. Seasonal variation of heat and freshwater transports by the Kuroshio in the East China Sea. J. Mar. Syst. 2000, 24, 119–129. [Google Scholar] [CrossRef]
  66. Kubota, M.; Iwabe, N.; Cronin, M.F.; Tomita, H. Surface heat fluxes from the NCEP/NCAR and NCEP/DOE reanalyses at the Kuroshio Extension Observatory buoy site. J. Geophys. Res. Ocean. 2008, 113. [Google Scholar] [CrossRef] [Green Version]
  67. Guo, X.; Miyazawa, Y.; Yamagata, T. The Kuroshio onshore intrusion along the shelf break of the East China Sea: The origin of the Tsushima Warm Current. J. Phys. Oceanogr. 2006, 36, 2205–2231. [Google Scholar] [CrossRef]
  68. Chen, C.; Xue, P.; Ding, P.; Beardsley, R.C.; Xu, Q.; Mao, X.; Gao, G.; Qi, J.; Li, C.; Lin, H. Physical mechanisms for the offshore detachment of the Changjiang Diluted Water in the East China Sea. J. Geophys. Res. Ocean. 2008, 113. [Google Scholar] [CrossRef]
  69. Andres, M.; Park, J.-H.; Wimbush, M.; Zhu, X.-H.; Chang, K.-I.; Ichikawa, H. Study of the Kuroshio/Ryukyu Current system based on satellite-altimeter and in situ measurements. J. Oceanogr. 2008, 64, 937–950. [Google Scholar] [CrossRef]
  70. Kang, J.-C.; Wang, G.-D.; Zhu, J.; Sun, W.-Z.; Liu, C.; Li, Y. Month temperature distribution of Kuroshio in East China Sea. Oceanol. Limnol. Sin. 2012, 5, 3–9. [Google Scholar]
  71. Chuang, W.-S.; Liang, W.-D. Seasonal variability of intrusion of the Kuroshio water across the continental shelf northeast of Taiwan. J. Oceanogr. 1994, 50, 531–542. [Google Scholar] [CrossRef]
  72. Lee, H.-J.; Chao, S.-Y. A climatological description of circulation in and around the East China Sea. Deep Sea Res. Part II Top. Stud. Oceanogr. 2003, 50, 1065–1084. [Google Scholar] [CrossRef]
  73. Zhou, F.; Xue, H.; Huang, D.; Xuan, J.; Ni, X.; Xiu, P.; Hao, Q. Cross-shelf exchange in the shelf of the East China Sea. J. Geophys. Res. Ocean. 2015, 120, 1545–1572. [Google Scholar] [CrossRef]
  74. Liu, J.; Xu, K.; Li, A.e.a.; Milliman, J.; Velozzi, D.; Xiao, S.; Yang, Z. Flux and fate of Yangtze River sediment delivered to the East China Sea. Geomorphology 2007, 85, 208–224. [Google Scholar] [CrossRef]
  75. Tian, L. Distributions of Organic Carbon in the East China Sea, Yellow Sea, Northeastern Hainan Rivers and Coasts. Master’s Thesis, East China Normal University, Shanghai, China, 2008. [Google Scholar]
  76. Zhang, T.; Wang, Z.; Shi, X.; Zhang, C. Spatial distribution of dissolved organic carbon in the Yellow Sea and East China Sea. Mar. Environ. Sci. 2011, 30, 162–166. [Google Scholar]
  77. Cheng, J.; Zhang, C.; Wang, H.; Wu, J.; Ding, Y.; Shi, X. Spatial and temporal distribution of particulate organic carbon in the Yellow Sea and the East China Sea in winter. Mar. Environ. Sci. 2012, 31, 25–29. [Google Scholar]
  78. Shang, R.; Wang, Z.; Zhang, C.; Shi, X. Distribution of dissolved organic carbon in the Yellow Sea and East China Sea in winter. Adv. Mar. Sci. 2012, 30, 94–101. [Google Scholar]
  79. Peng, T.H.; Hung, J.J.; Wanninkhof, R.; Millero, F.J. Carbon budget in the East China Sea in spring. Tellus B Chem. Phys. Meteorol. 1999, 51, 531–540. [Google Scholar] [CrossRef]
Figure 1. Study area and locations of POC sampling stations in ECS. The study area is divided into three regions by the dashed lines, including the coastal region (CR, <50 m water depth area); the continental shelf region (CSR, 50–200 m water depth area); and the open sea region (OSR, >200 m water depth area). Blue dots represent in situ observational stations in 2011 and red square represent stations of published data.
Remotesensing 14 01799 g001
Figure 2. A schematic map of the most influential currents around East China Sea in summer and winter. Arrows with solid lines represent currents that flow in the same direction during both seasons; Arrows with dashed lines indicate the winter currents that flow in the opposite directions during the summer. Abbreviation of the currents: the Bohai Sea Coastal Current (BSCC), the Yellow Sea Warm Current (YSWC), the Yellow Sea Coastal Current (YSCC), the Taiwan Warm Current (TWC), the Korea Coastal Current (KCC) and the East China Sea Coastal Current (ECSCC). This figure is based on the research of Bian et al. Reprinted/adapted with permission from Ref. [36]. 2013. AGU.
Remotesensing 14 01799 g002
Figure 3. Monthly averaged POC horizontal distribution in the ECS from 2001–2011.
Remotesensing 14 01799 g003
Figure 4. Plots a–c represent the monthly averaged Chl-a vs. POC in all three selected regions of the ECS; Plots d–f represent the monthly averaged SST vs. POC. The r2 value represents the correlation coefficient and all data comparisons have passed the significance test (p < 0.05).
Remotesensing 14 01799 g004
Figure 5. Time series of monthly averaged POC (ac), Chl-a concentrations (df) and SST (gi) in three different regions of the ECS. Bold values on the right y-axis represent the average values from 2001 to 2011. Trend lines are calculated by linear regression.
Remotesensing 14 01799 g005
Figure 6. Annual water flux (vertical bars) and sediment discharge (red broken line) from the Changjiang River and POC concentration in the ECS (blue broken line), from 2001 to 2011, respectively. Data was obtained from River Sediment Bulletin of China, 2001–2011, from Datong hydrological station. Trendlines were calculated by linear regression.
Remotesensing 14 01799 g006
Table 1. Correlation between POC in continental shelf region with POC, Chl-a and SST in the studied regions (p < 0.05). Bold numbers represent values with significant correlation.
SeasonRegionr2 (POC)r2 (Chl-a)r2 (SST)
SpringCoastal0.340.170.17
Continental/0.340.18
Open sea0.670.050.30
SummerCoastal0.510.560.72
Continental/0.810.52
Open sea0.070.050.08
FallCoastal0.690.010.08
Continental/0.300.51
Open sea0.880.810.45
WinterCoastal0.770.200.53
Continental/0.270.57
Open sea0.730.060.42
Table 2. Seasonal measured POC and DOC data collected from different cruises in ECS (Unit: mg m−3).
Season/DepthPOC RangePOC AverageReferenceDOC-RangeDOC-AverageReferences
spring
surface49.15–2817.29276.98[38]720–1290890[75]
10 m39.60–2736.93304.44//
30 m46.70–666.73172.76//
bottom25.37–2654.07291.82600–1010800
water column
average
24.33–2817.29230.76750–990840
summer
surface22–240132.28[16]660–30501270[39]
10 m14.5–554170.04760–21201160
30 m0.6–312148.28670–18801090
50 m//730–1390990
bottom1.4–853220.04570–2040970
water column
average
0.6–853130500–30501080
autumn
surface39–682132.03 590–61001090
30 m20.75–19176.54In situ data,
2011
590–2170
620–1120
940
870
[76]
50 m21.20–140.1763.61
75 m11.75–131.1753.82540–980760
bottom7.25–766125.27440–12,0301130
water column
average
7.25–76697.37440–12,030990
winter
surface36.39–1555.96156.32 444–24911017
10 m40.27–306.96102.61[77]621–17631066[78]
30 m15.09–205.6593.07514–1865950
50 m2.49–156.9861.65623–1650956
75 m//623–1373912
bottom5.29–1658.96201.88440–1763986
water column
average
2.49–1658.96125.88440–2491967
Table 3. Annual satellite data of POC in ECS (Unit: mg m−3).
Year C s a t e l l i t e s u r f a c e P O C C s a t e l l i t e c o l u m n P O C
2001158.90133.48
2002164.81138.44
2003152.43128.04
2004132.34111.16
2005133.98112.54
2006139.02116.77
2007127.60107.18
2008137.02115.09
2009145.90122.55
2010131.83110.73
2011132.60111.38
Average141.49118.85
Table 4. Seasonal POC and DOC average integral measured data (Unit: mg m−3).
SeasonsDOCPOCPOC% in Total Organic Carbon
Spring84023021.5%
Summer108013010.7%
Fall990978.9%
Winter96712611.5%
Average96914613.1%
Publisher’s Note: MDPI stays neutral with regard to jurisdictional claims in published maps and institutional affiliations.

