Article

The Impact of Climate Changes on Slope Stability and Landslide Conditioning Factors: An Example from Kravarsko, Croatia

Croatian Geological Survey, 10000 Zagreb, Croatia
*
Author to whom correspondence should be addressed.
Remote Sens. 2022, 14(8), 1794; https://doi.org/10.3390/rs14081794
Submission received: 2 March 2022 / Revised: 4 April 2022 / Accepted: 6 April 2022 / Published: 8 April 2022
(This article belongs to the Section Remote Sensing in Geology, Geomorphology and Hydrology)

Abstract

:
The Gajevo landslide in the Kravarsko area (Vukomeričke Gorice hilly area, northern Croatia) was chosen for investigation due to the existing landslide risk for the households at the landslide crown. Available data are limited, but a new landslide map and cross-section was developed within the presented research, mostly based on detailed light detection and ranging (LiDAR) data and field mapping. By comparing available orthophotos of the landslide, resident testimonies, precipitation data, and media releases, it was concluded that the landslide was activated in February 2014. The landslide was primarily triggered by increased precipitation (its measured variations could be in direct connection with ongoing global climate changes), but natural terrain features and anthropogenic factors also affected slope stability. New findings have led to the conclusion that the existing landslide area is large and complex and the crown and head scarp area should be stabilized by urgent remediation measures.

1. Introduction

Landslides are a type of “mass wasting” which denotes any downslope movement of rock and soil under the direct influence of gravity [1,2]. They represent geohazardous events that can significantly affect the safety of people and can present danger to property [3,4]. As landslides differ due to site-specific characteristics and available data different variations and combinations of remote sensing methodology can be applied in its research when more landslide data is needed [5,6,7,8,9,10]. Even when in some cases landslide data is practically non-existent with different methods of remote sensing some of the much-needed input can be obtained [11,12] and understanding of the site-specific problem can be enhanced [5,6,7,8,9,10].
Although some landslide inventory data are available for the Zagreb city area [13,14], there are a lack of landslide data and information for the wider Zagreb County area, i.e., Vukomeričke Gorice hilly area, which does not mean that landslides do not occur there. Indeed, in 2014 a natural disaster was declared for the Kravarsko area because of landslide phenomena [15]. To improve the existing landslide data sets, initial Gajevo landslide map was developed [16] and the wider Kravarsko area was chosen as one of six pilot areas within the safEarth project (Interreg IPA: CBC program Croatia, Bosnia and Herzegovina, Montenegro) and in the GeoTwinn project (Wide-spread-05-2017-Twinning project: Croatian Geological Survey, HGI-CGS; British Geological Survey, BGS; and Geological Survey of Denmark and Greenland, GEUS). Within safEarth and GeoTwinn projects detailed LiDAR data was obtained and landslide inventory for the Kravarsko area has been developed by Croatian Geological Survey [10]. According to available data and field mapping conducted by Croatian Geological Survey landslides occur frequently in the Kravarsko area, causing damage to property and infrastructure [10,15,16]. The selected Gajevo landslide is a complex landslide, with more than one generation of movement, but with the dominance of rotational slide type. A slide is a downslope movement of a rock or soil mass occurring on surfaces of rupture or relatively thin zones of intense shear strain [4].
The advantages of applying remote sensing methods in landslide research are discussed within this paper using a concrete example of an active landslide that endangers local population and property [9,10,17]. The Gajevo landslide might be a good example of climate change influence on landslide activation [18,19,20]. The unusually high amount of precipitation (1601 mm in 2014) and specific site lithology (interchange of sandy and clayey layers i.e., heterogeneous Vrbova fm.) are considered the main triggers of landslide activation. Our research aimed to apply remote sensing methods and field investigations in the interpretation of the Gajevo landslide. The time (Section 4.1 and Section 5.1) and cause of landslide activation were determined (Section 5.2.2 and Section 5.2.3), and at the same time a preliminary geological model, new engineering–geological units (Section 4.5), precipitation and temperature data analysis (Section 5.2.3), and definition of a directly endangered area for the households are presented (Section 5.2.1).

2. Study Area

2.1. Geographical Settings

The research area is located in northern Croatia, in the central part of the Vukomeričke Gorice hilly area in Kravarsko municipality (Figure 1). Vukomeričke Gorice is a ~50 km long hilly area situated ~25 km south of Zagreb with a northwest to southeast orientation, between the Sava and Kupa valleys, just before their junction. Kravarsko stands out as the central settlement of this hilly area with an average height of approximately 200 m above sea level (m.a.s.l.) and with a temperate continental climate [21,22]. In winter, precipitation is lower, while at the transition from spring to summer, precipitation is somewhat higher [23]. The average sum value of precipitation in the winter (December, January and February) from 2000 to 2020 is 196 mm. While, for the same period, the average sum value of precipitation for the spring/summer (May, June and July) is 223 mm (source: Croatian Meteorological and Hydrological Service). The hilly area of Vukomeričke Gorice and investigated Kravarsko locality has experienced many landslides, and as a result of these movements, houses, roads, water systems, and power lines are endangered and locally damaged [10,15,24,25].

2.2. Geological Settings

The geological structure and development of the investigated area of the Vukomeričke Gorice are associated with the southwestern margin of the Pannonian basin system. This sedimentary basin system is situated in Central and Southeastern Europe. During the Miocene and Pliocene, the area was a part of the Central Paratethys [26]. The partial withdrawal of the Upper Miocene waters of the Pannonian basin system to the east formed Lake Slavonia, within which the Upper Pliocene deposits were deposited. During Pliocene, this lake spread from present-day Western Romania in the east to the Vukomeričke Gorice in the west [27]. The beginning of the development of Lake Slavonia is characterized by the extinction of brackish organisms, followed by the sudden endemic development of snails of the genus Viviparus. According to the mentioned genus of snails, Pliocene sediments deposited in Lake Slavonia are known as “Paludin deposits” or Viviparus layers/beds, and according to their developmental sequence, they are divided into the lower, middle, and upper Viviparus layers/beds. They are the most common surface deposits in the Vukomeričke Gorice hilly area. Viviparus beds are an interbedded mixture of Pliocene clay and sand, with some gravel and lignite intercalations [28]. Thickness is variable and directly dependent on the paleorelief: The deposit thickness on the hill ranges is from 200 to 400 m, while in the Sava depression it is from 350 to over 1000 m [24,25,29]. Only the northern part of Vukomeričke Gorice is covered with Plioquaternary clays, gravels, and sands [30,31], while along the northeast margins of the Vukomeričke Gorice Pliocene, deposits are covered with Pleistocene loess-like sediments [24,25].
In the wider area, the appearance of coarse-grained gray and brown sandstones was observed. They appear as irregular interlayers within the sands and are considered lithoarenites. Angular to subangular lithogenic particles predominate in the composition of detritus. Cement is calcite, and the particles are mostly coated with limonite coating (ferrous/ochre to red color) [32]. There is a sequence of fine-grained gravel, most of which is multi-colored quartz, usually up to three centimeters in diameter. The sand/gravel is cemented in places with limonite or opal and turns rarely into limonitized sandstone/conglomerate. Clays are less represented, and their ratio to sand is 1:4 to 1:6 [10,33]. In the area of research, there is a surface layer of sand, clay, or their mixtures of variable thickness. It is followed by deposits with a higher proportion of sand also containing different ratios of clay and gravel. These deposits are often local aquifers. At the same time, it is often the case that the sand/clay contact is a water-permeable/water-impermeable zone where, due to high pore-water pressures, the slide surface occurs. This is also the case with the Gajevo landslide: There are occasional springs in the sands, impermeable clay is found under the sands, and the main slide surface is on their contact [10,16,24,29,32].
Numerous small capacity springs, mostly periodical, appear in these deposits. As a result of the low water permeability of the upper deposits, rainwater partly runs off on the terrain surface (due to the high presence of fine particles, i.e., clay and silt) and partly infiltrates the underground (where sand and gravel particles are mainly present) [28,30,32]. Most of the sediments previously described as Viviparus beds are now classified as Vrbova fm. [34,35,36]. As a result of the variations in the permeable and impermeable deposits in this informal lithostratigraphic unit, there have been numerous landslides recorded [10,24,37,38,39,40].

3. Data and Methods

In this paper theoretical basics of landslides and remote sensing are presented. Available data related to the area of research (reports, scientific papers, maps, photo documentation, etc.), were gathered and reviewed. The “cabinet” maps of the Gajevo landslide were prepared and field verified. As a result, a new Gajevo landslide map and cross-section were developed with a definition of an area still directly endangered by a landslide. Precipitation analysis was also performed, and indications are that there is a correlation with ongoing climate changes.
This research was mainly based on the following data: Detailed LiDAR data collected for the ”safEarth“ project (Interreg IPA: CBC program Croatia, Bosnia and Herzegovina, Montenegro), field data, results of investigation presented in the master’s thesis [16], sedimentary logs developed for the wider area [29], the small scale Landslide Susceptibility Map of Croatia [41], the Basic Geological Map of Yugoslavia at the scale of 1:100,000 (Sheet Sisak with Guide) [24,25], orthophotos from 1968, 2011, 2014, 2018 and 2020 (from National Geodetic Administration of Croatia, NGA), a 1:5,000 scale topographic map (from National Geodetic Administration of Croatia, NGA), the Engineering–Geological Map of the Republic of Croatia at the scale of 1:300,000 [42], and the Engineering–Geological Map of Yugoslavia at the scale of 1:500,000 [39]. These data sets are public and freely available. Other available data were also used in analysis and verification (for example, precipitation and temperature data from the Croatian Meteorological and Hydrological Service). A comparison with different landslide case studies was made to optimize the research [19,20,43,44,45,46,47,48,49,50].
For the geological landslide case study, the basic geological properties of the locality and the wider area had to be taken into account. After the relevant literature and historical data analysis, geological and engineering–geological field mapping was conducted on site in several occasions (in 2018, 2019, 2020, and 2021), and lithological characteristics of the sediments were specified in more detail for the Gajevo landslide locality. The detailed LiDAR data from the “safEarth” project gave valuable insight into the geomorphological aspects of the area, while detailed orthophotos were used in the land cover classification. All of the available images (Section 4.1) and developed detailed digital elevation models (DEMs, Section 4.2) were used and played an integral part in landslide mapping, geological and engineering–geological analysis, and in the new landslide map and cross-section development (Section 4.5).

4. Results

4.1. Historical Orthophotos Analysis

By comparing the available orthophotos from the National Geodetic Administration of Croatia (NGA), the time (historical) sequence of the development of the Gajevo area/landslide was analyzed (photos from 1968, 2011, 2014, 2018, and 2020). The orthophotos provided an insight into the past 50 years and as such served as a valuable source of otherwise inaccessible historical information (Figure 2). During the 1960s the area was covered with cropland and forest: without houses and a landslide (Figure 2a). On the orthophoto from 2011 (Figure 2b) the landslide is not visible, but on the orthophoto from 2014, the landslide is present (Figure 2c, major cracks are marked with blue arrows). This fact places the proximate time of the landslide activation (based on Figure 2b,c) in the interval of 2011 to 2014. On the orthophotos, it is visible that the road was remediated with an embankment made of stone blocks (landslide damage example, Figure 2c–e, blue polygon). In the landslide body, a storage object was heavily damaged (Figure 2c,d, red polygon with object) and eventually removed (Figure 2e, red polygon without object).

4.2. Remote Landslide Mapping

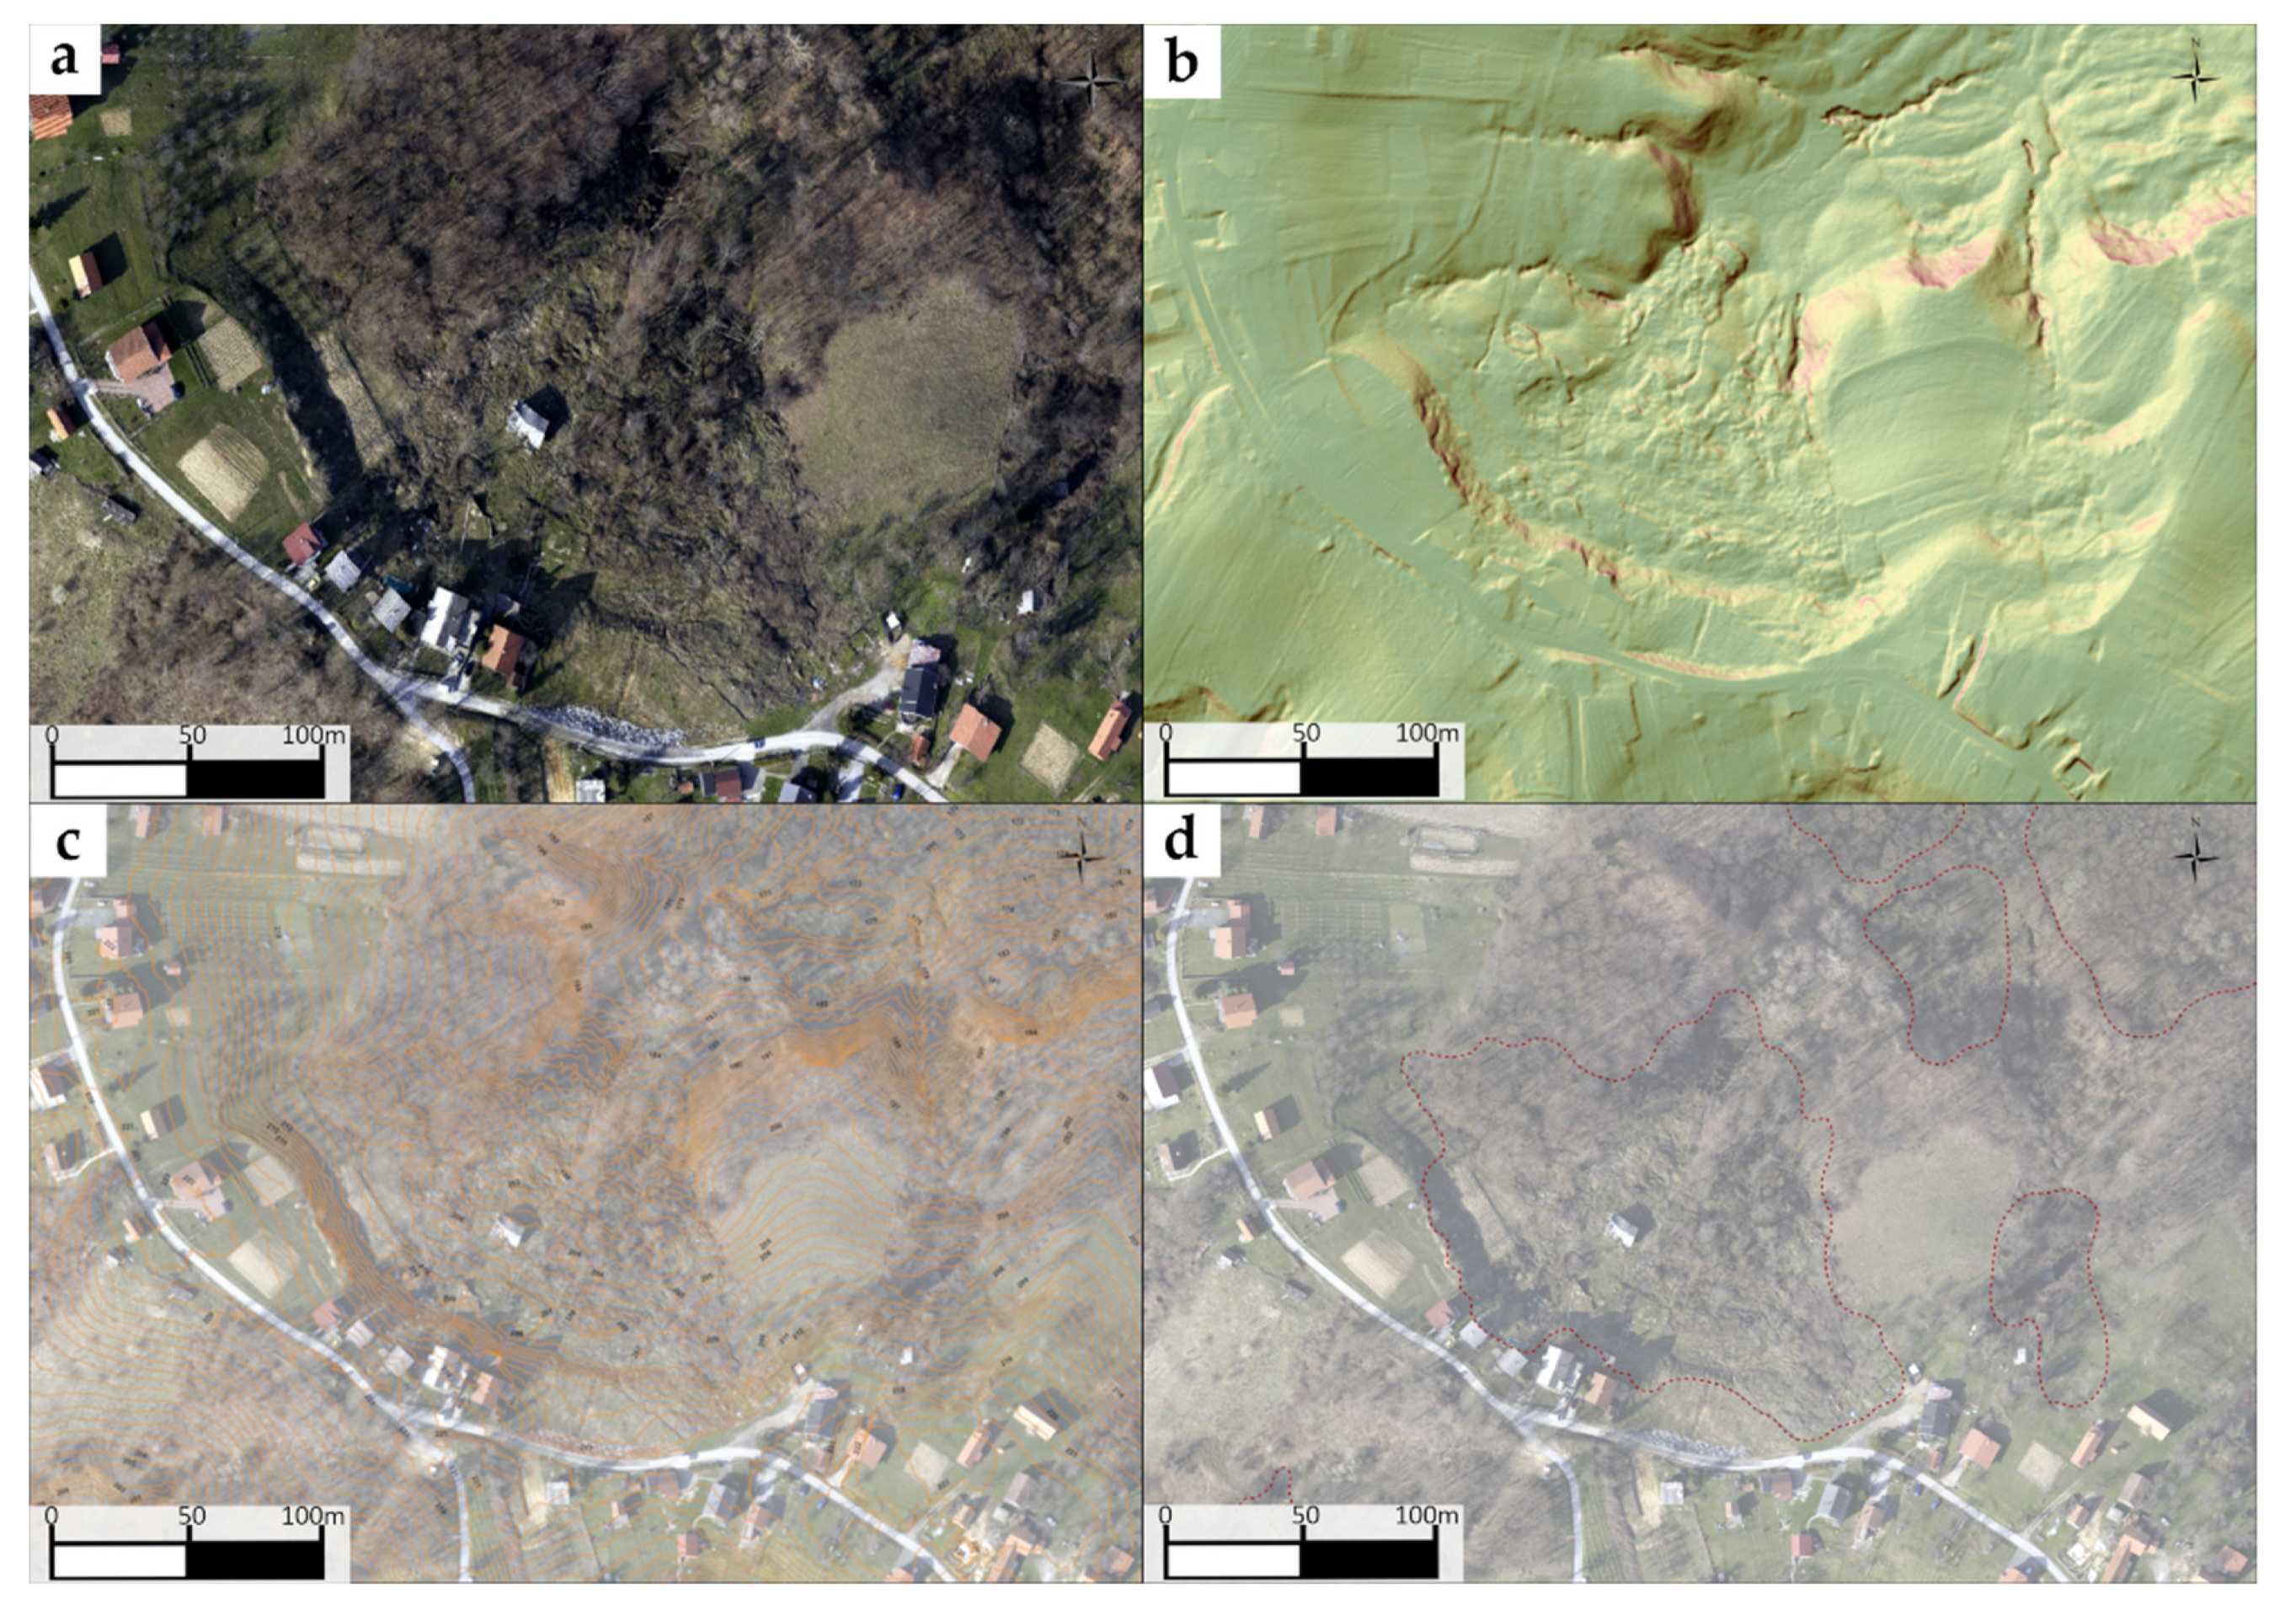
Remote sensing is the science of gathering data about an object or phenomenon based on measurements of reflected and emitted radiation [51]. Landslide inventory development based on remote sensing data is possible (e.g., aerial photography and DEM) if there are distinct landslide features that can be mapped [11,52,53]. In some cases, landslide mapping is even more precise and easier on the high-resolution DEMs, and this is the case with the Gajevo landslide [9,54] (Figure 3). Based on remote data collected during the “safEarth” project, cabinet maps were developed from which important information was extracted (Figure 3), and the area affected by sliding (area ~ 19,500 m2, maximum length ~ 160 m, maximum width ~ 225 m) and the land cover were also determined. According to orthophotos six houses are situated either on the landslide or next to it.
In the spring of 2018, an aerial LiDAR scan with a density of 20 points per m2 was performed, and detailed orthophotos of the area (10 × 10 cm pixel size) were acquired (Figure 3a). From the LiDAR scan, it was possible to generate detailed high-resolution digital elevation models (DEMs) with 0.5 × 0.5 m cell size: a surface model, terrain model, hillshade, and slope model (Figure 3b). A 1 m contour line topography map model was also developed from LiDAR data (Figure 3c). On the developed DEMs several generations of deformations in the Gajevo landslide body are visible (newer, smaller landslides within the area of the initial landslide, please also see Section 5), and landslides in the vicinity can also be identified. Based on detailed orthophotos and high-resolution DEMs, the Gajevo landslide area was preliminarily mapped (Figure 3d). This Gajevo landslide map was based on remote sensing data and developed in the cabinet, so field verification of it was undertaken (geological investigations).

4.3. Geological Field Investigations

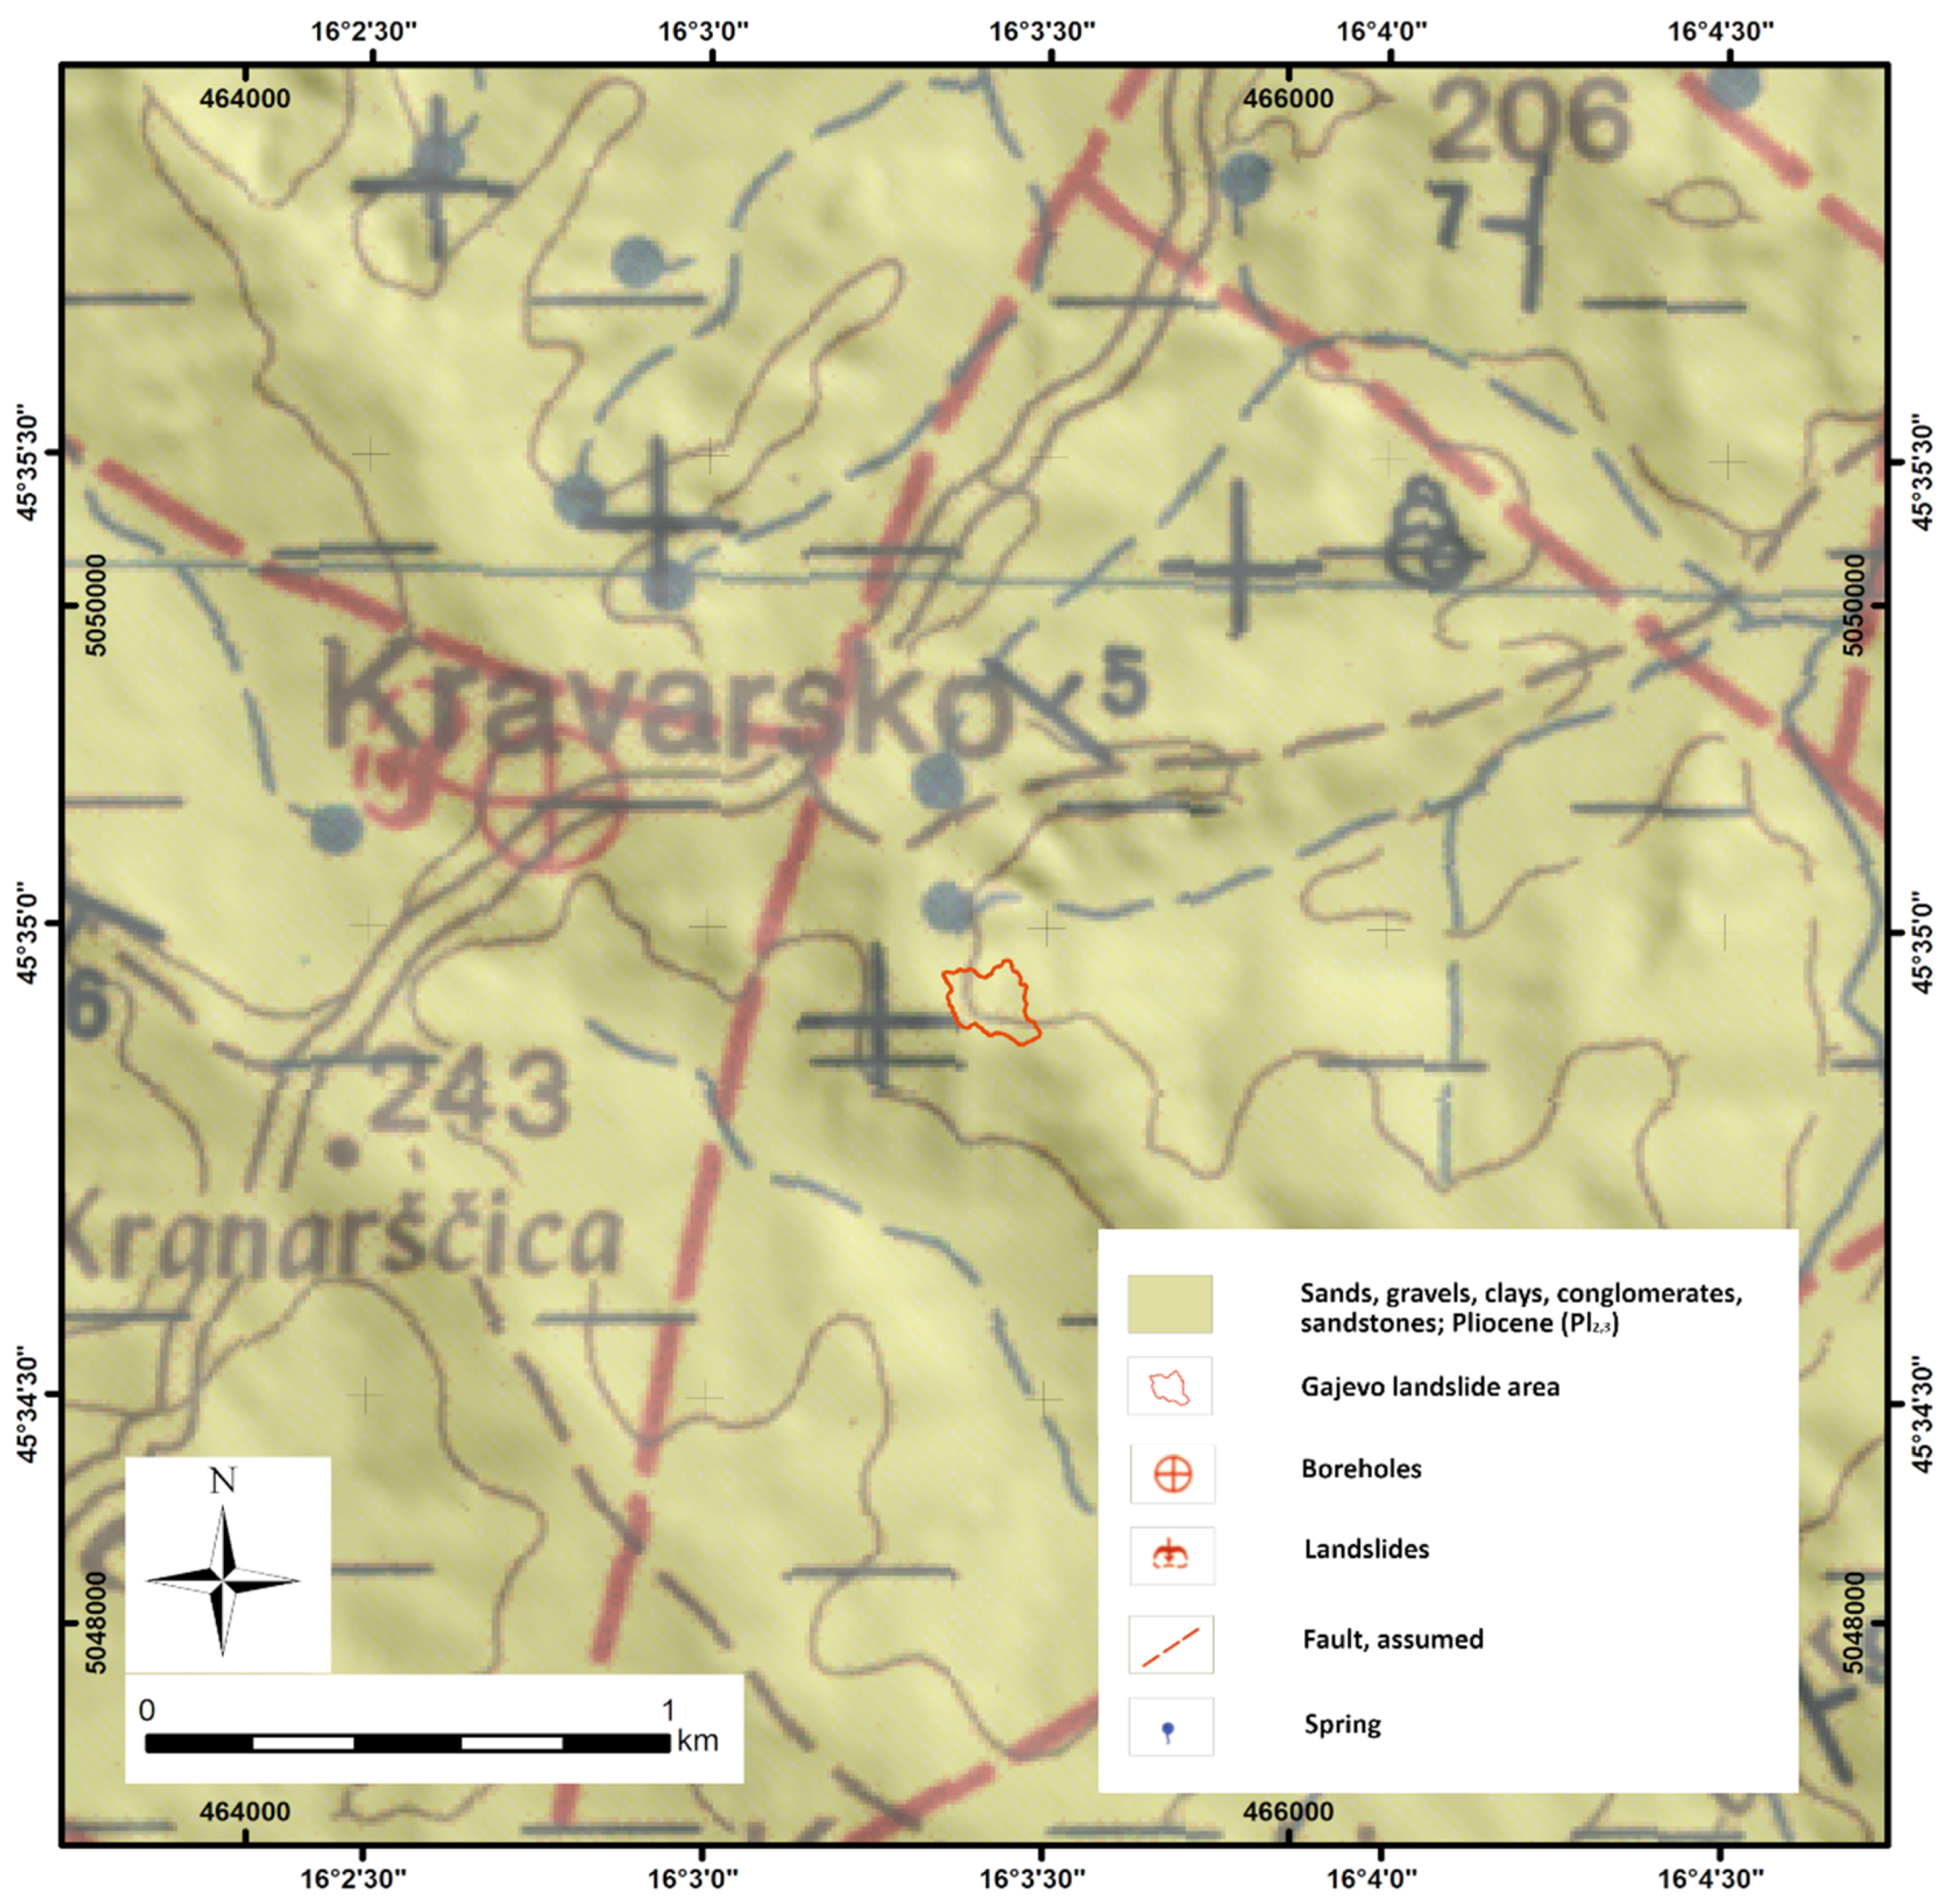
Available, relevant geological data were revised for the wider area (see Section 3). The Basic Geological Map of Yugoslavia at the scale of 1:100,000 (Sheet Sisak with Guide) [24,25] was the largest scale map available for the research area (details are shown in Figure 4). On this map, the wider area is in Viviparus beds represented with an interbedded mixture of Pliocene sands, clays, silts, gravels, sandstones, conglomerates, and lignite intercalations. Still, in the Kravarsko landslide area, the sediments mainly consist of sands, clays, and silts (or their mixtures) [10,16,28]. As for the Gajevo area, new data was acquired and detailed geological and engineering–geological mapping was performed also a new map was developed (please see Section 4.5).
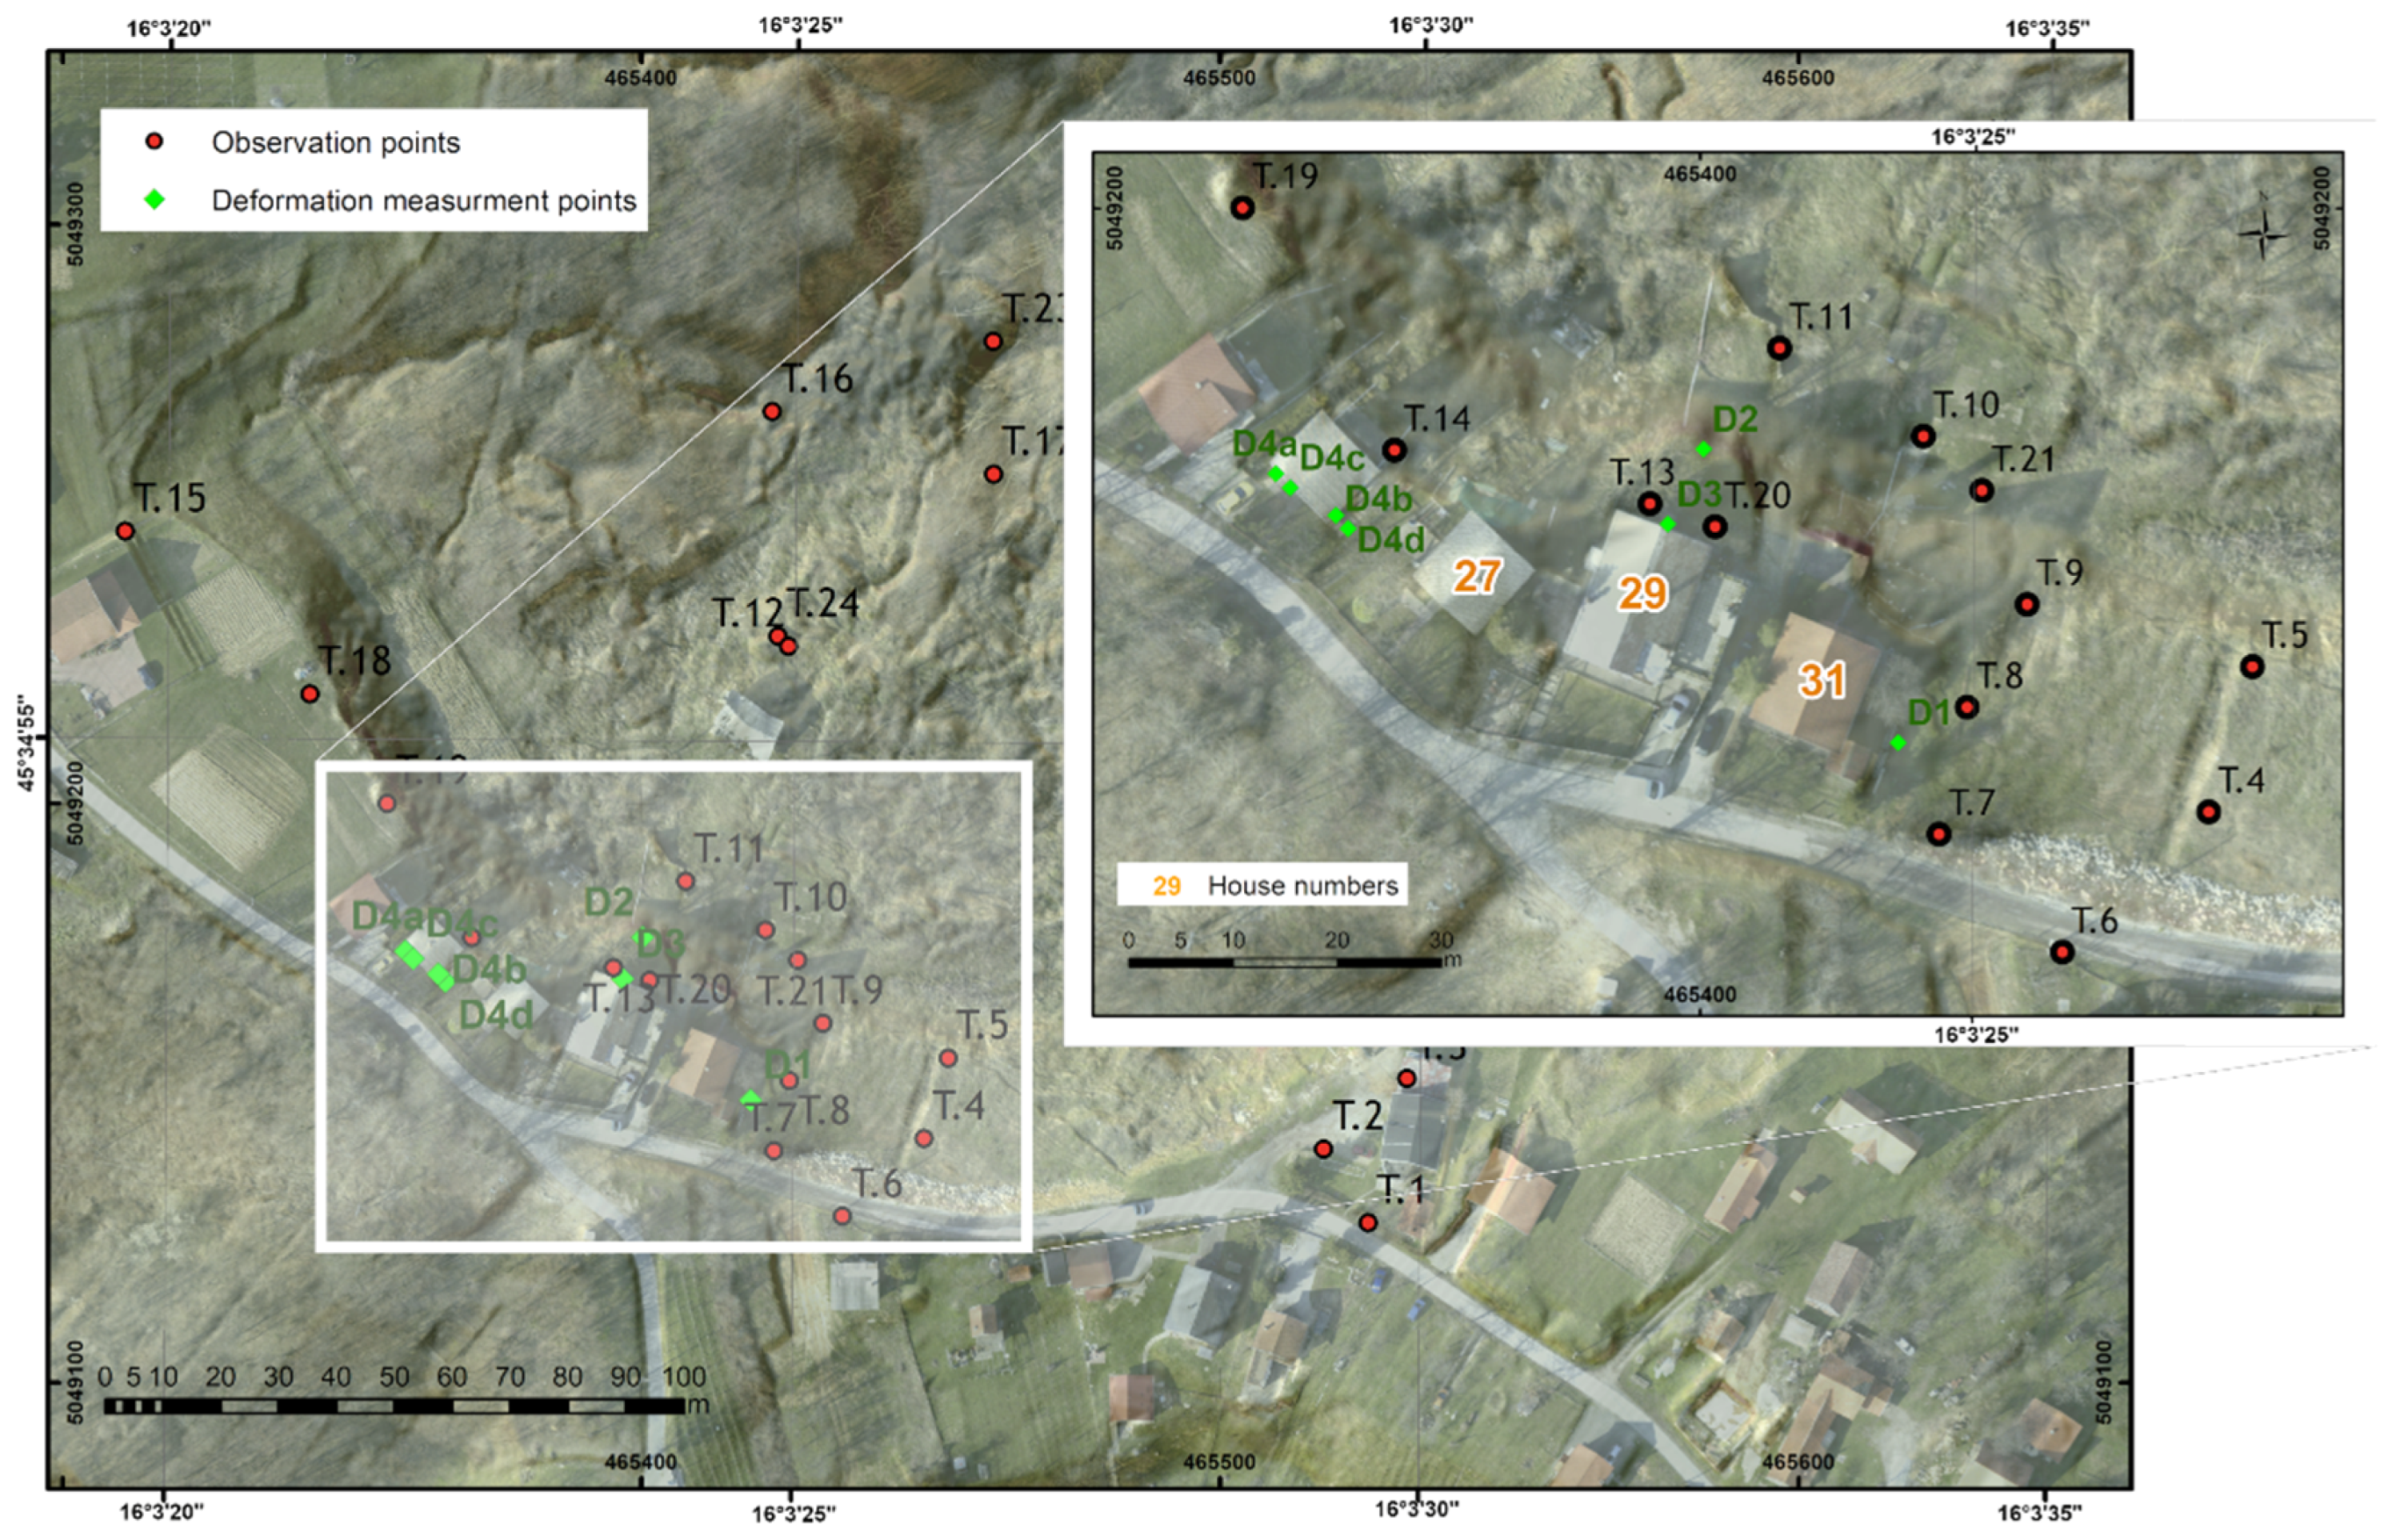
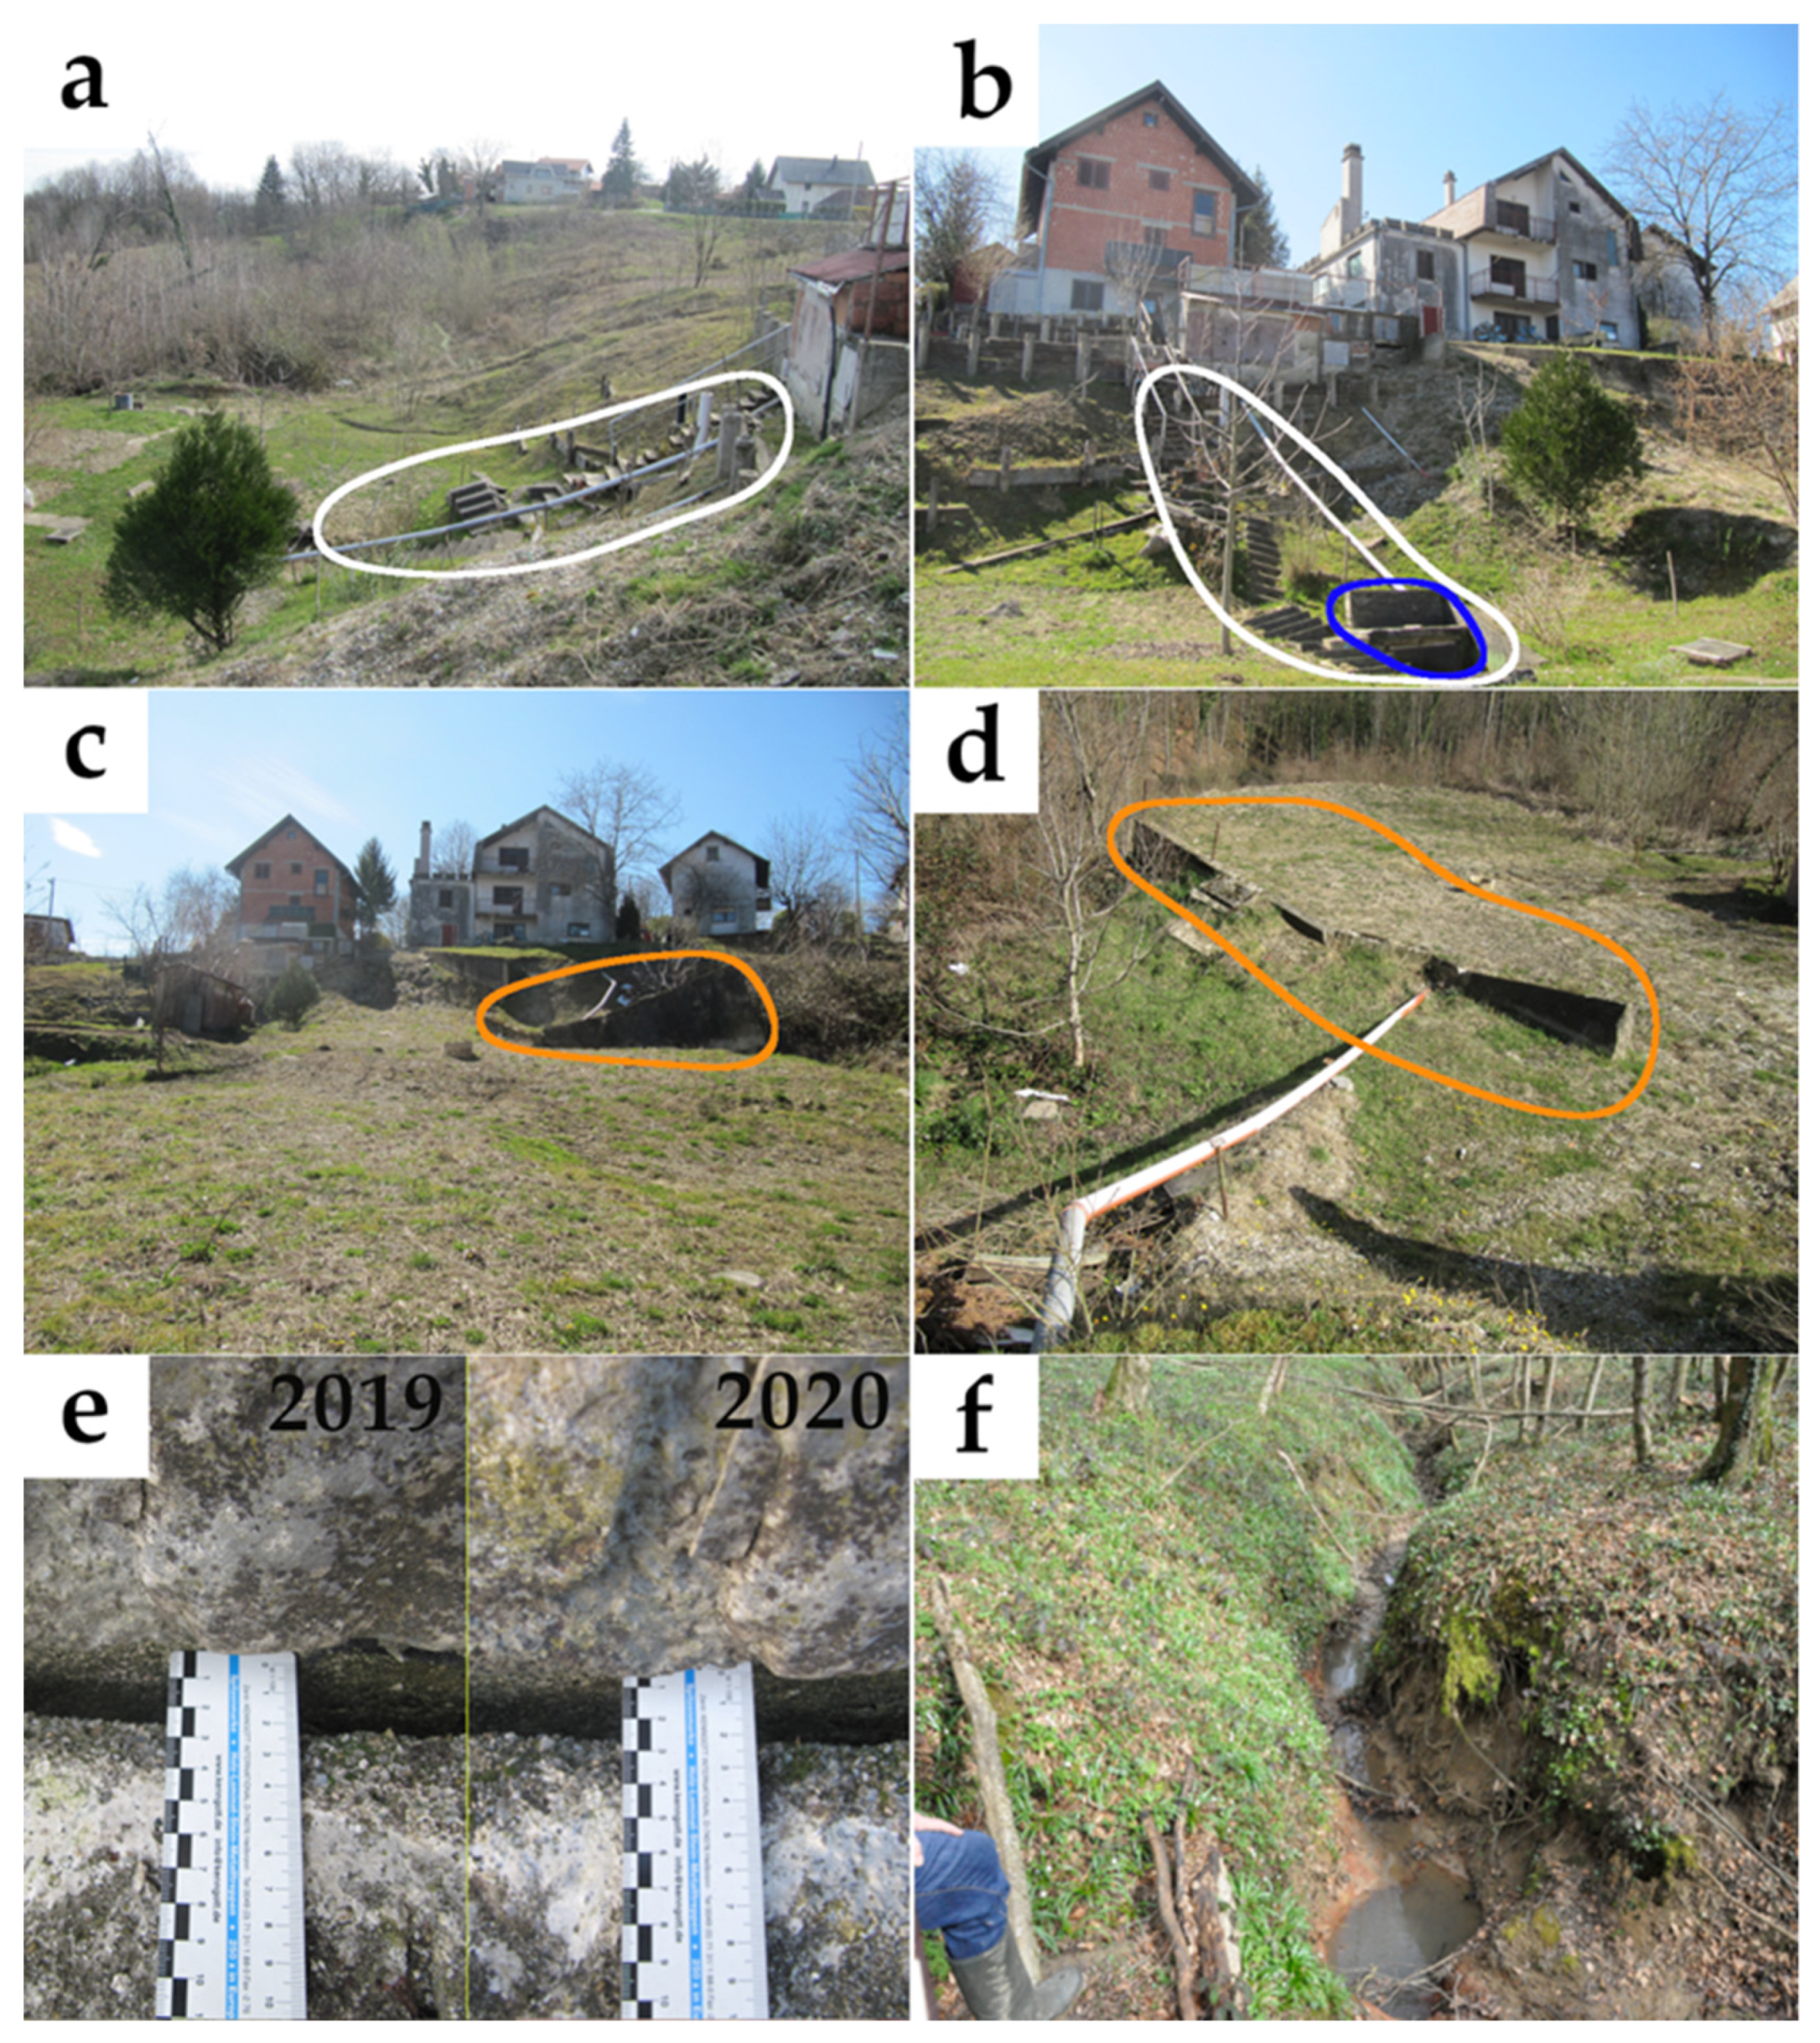
Field mapping included 24 observation points (from T.1 to T.24) and deformation measurement points (from D1 to D4d), (Figure 5) with landslide field form completion and engineering–geological field form for soil description filled. Geological and engineering–geological mapping was performed, landslide features and indications were recorded, and locations for measuring deformations on objects were selected (Figure 6).
Deformation measurements indicated that from October 2019 to January 2021 there were no visible movements or crack propagations. For example, in Figure 6e we can see that the crack width, caused by the slide, is in both cases 2.5 cm which indicates there was no significant spreading due to subsidence/sliding. The situation was the same with other measurement points. Therefore, the landslide in that period can be considered inactive, which coincides with the precipitation data i.e., no significant variations in precipitation were recorded.

4.4. Precipitation Analysis

Climate changes have also affected the study area [55]. There are years when there is less rainfall in the annual rainfall count and years when rainfall exceeds the precipitation thresholds [56,57,58]. Although both factors have an influence on triggering the mechanisms of landslide activation, exceeding the precipitation thresholds (punctual intense precipitation) is more important than the number of days it rains per year (accumulated annual precipitation) [19,20,47,59,60,61].
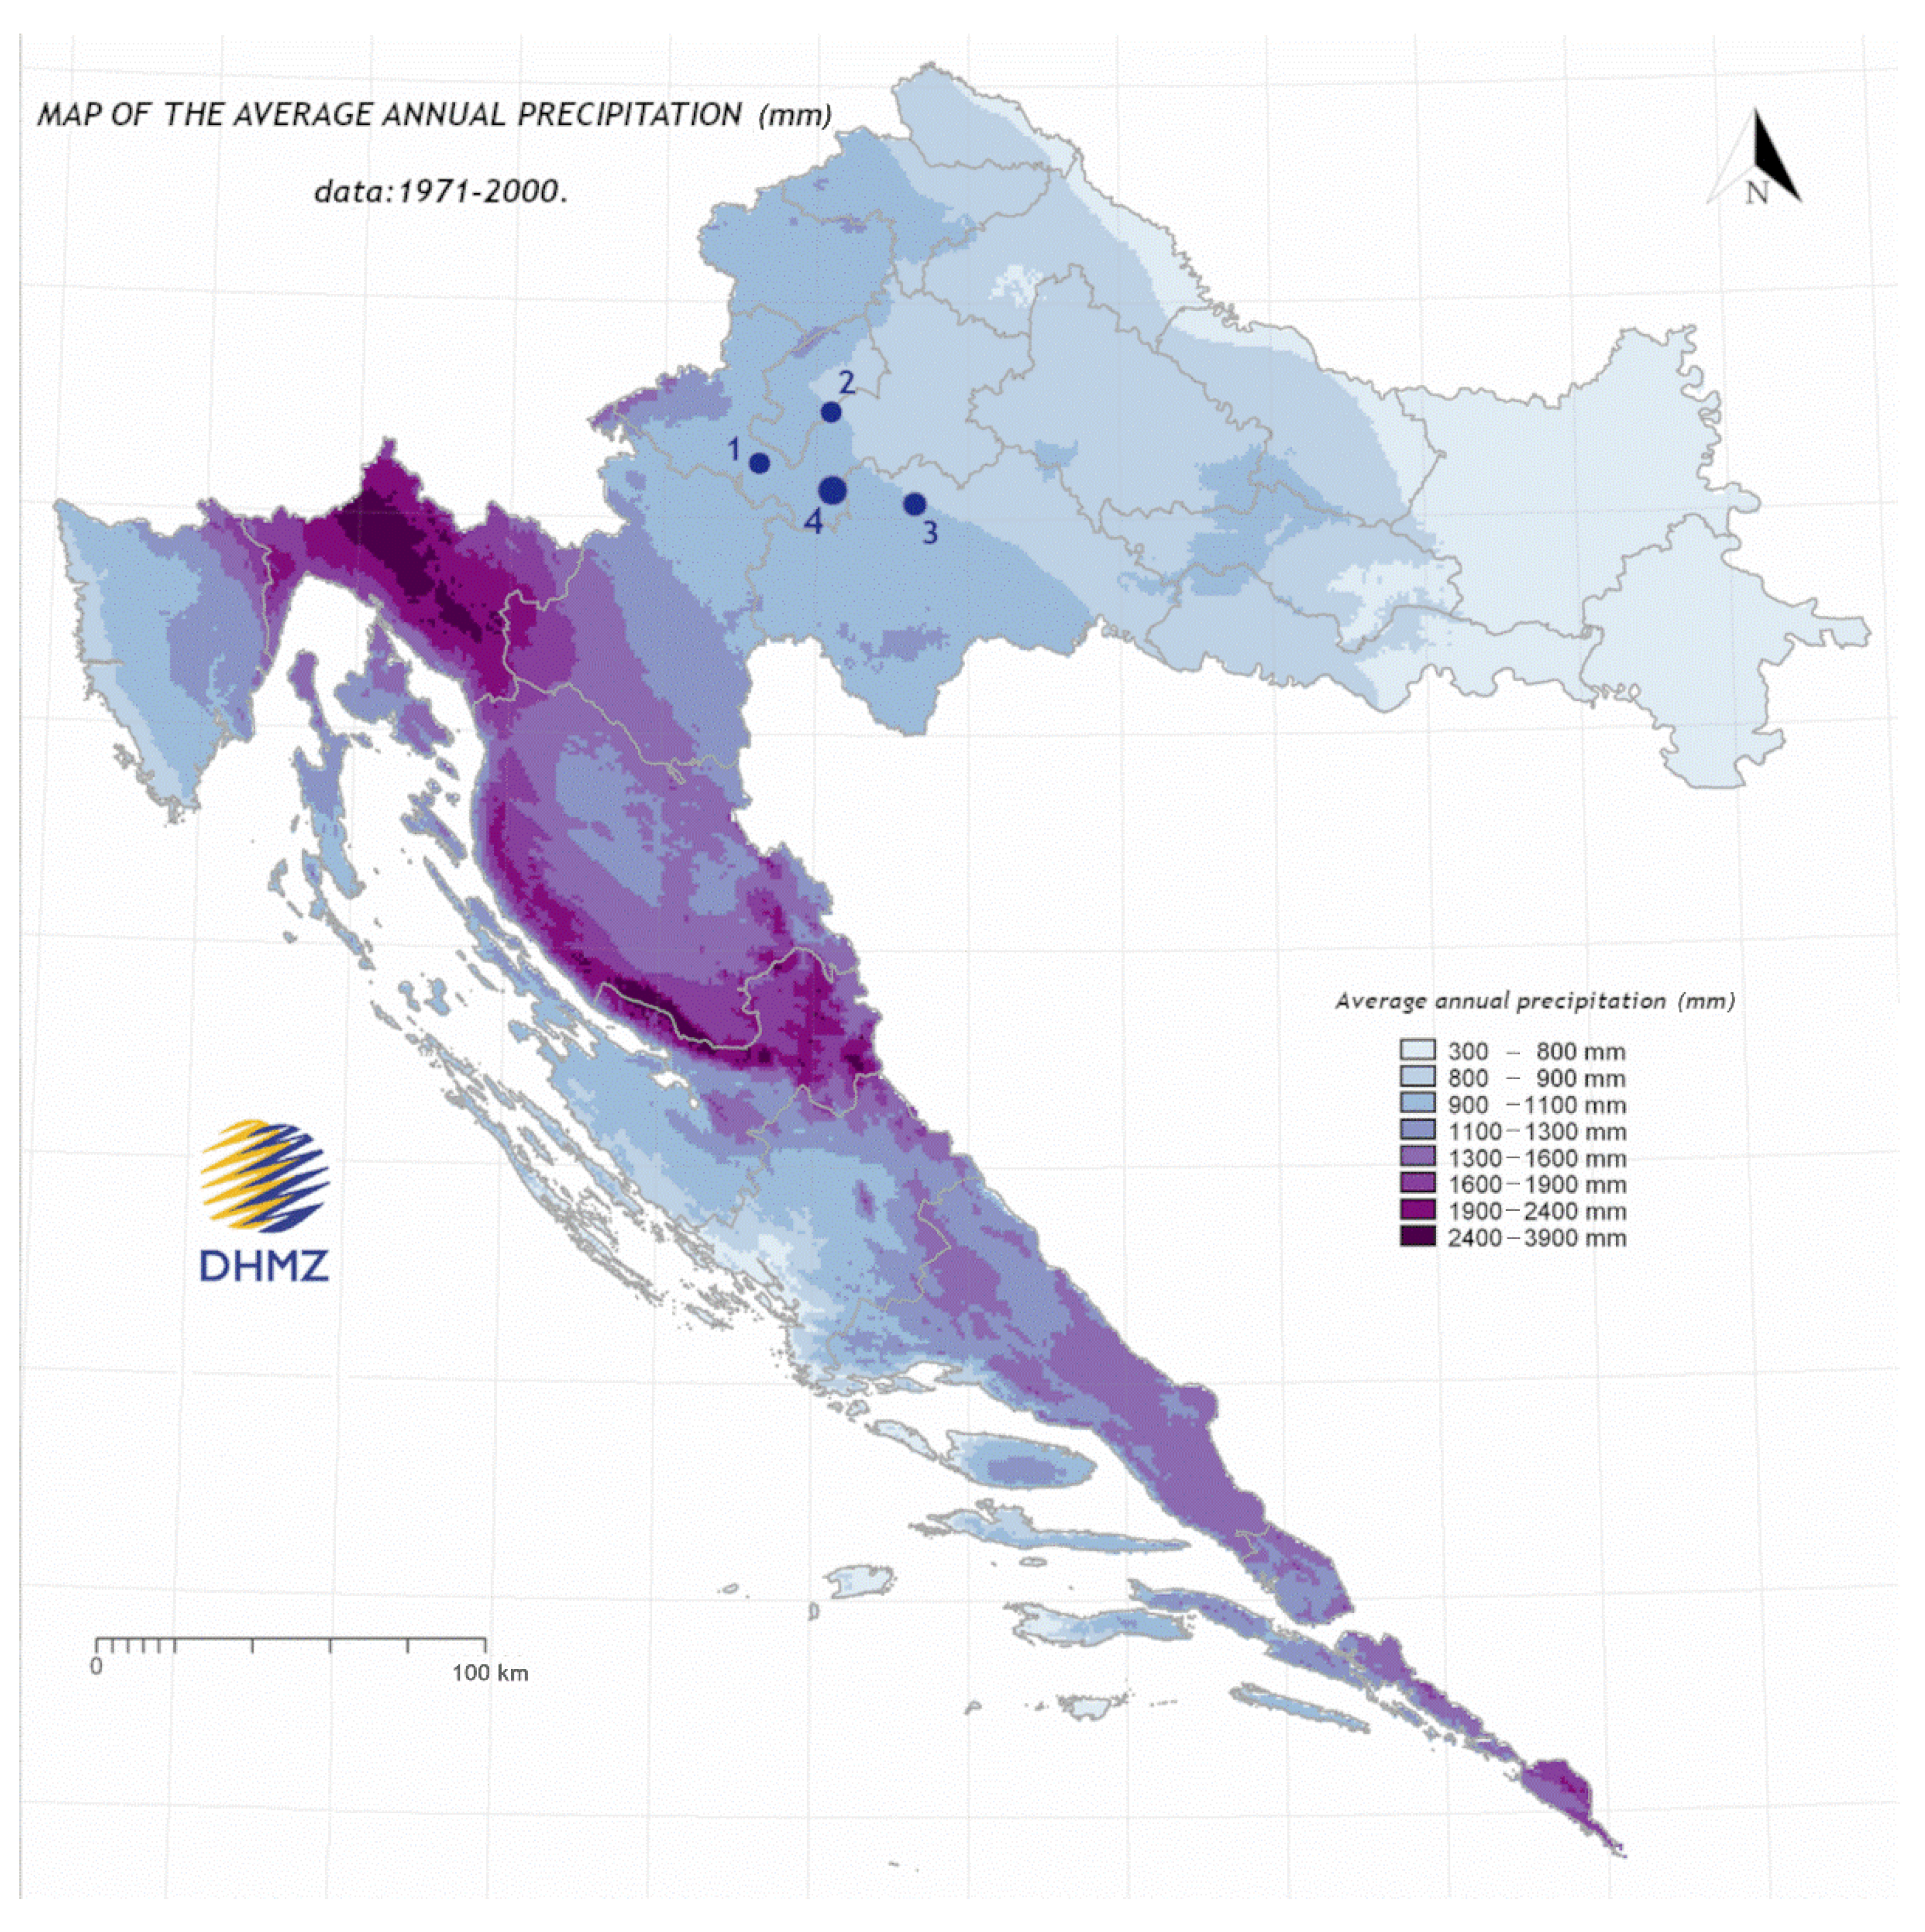
For this study, precipitation and temperature data from nearest meteorological stations Kravarsko, Pisarovina, Zagreb-Pleso airport, and Sisak were used (Figure 7). The available data included historical data from 1971 to 2000 and data for the more recent period from 2000 to 2020. The available data were reviewed and analyzed to correlate the occurrence of landslides with unusually large amounts of precipitation in the area of Kravarsko. Historical average annual precipitation data for the period 1971–2000 reveals that the Kravarsko area is in the range of 900 to 1100 mm (Figure 7).
The data for the recent period from 2000 to 2020 indicate that climate changes are an important factor in landslide occurrence. For this statement available data for the relatively recent occurrence of landslides in similar, nearby locations and available historical landslide data were also reviewed: For the Zagreb area the increased values of precipitation (1150 mm for 2013 and 1460 mm for 2014) caused more than 150 landslide activation (reports) in 2013 and 2014 [13,14,53].
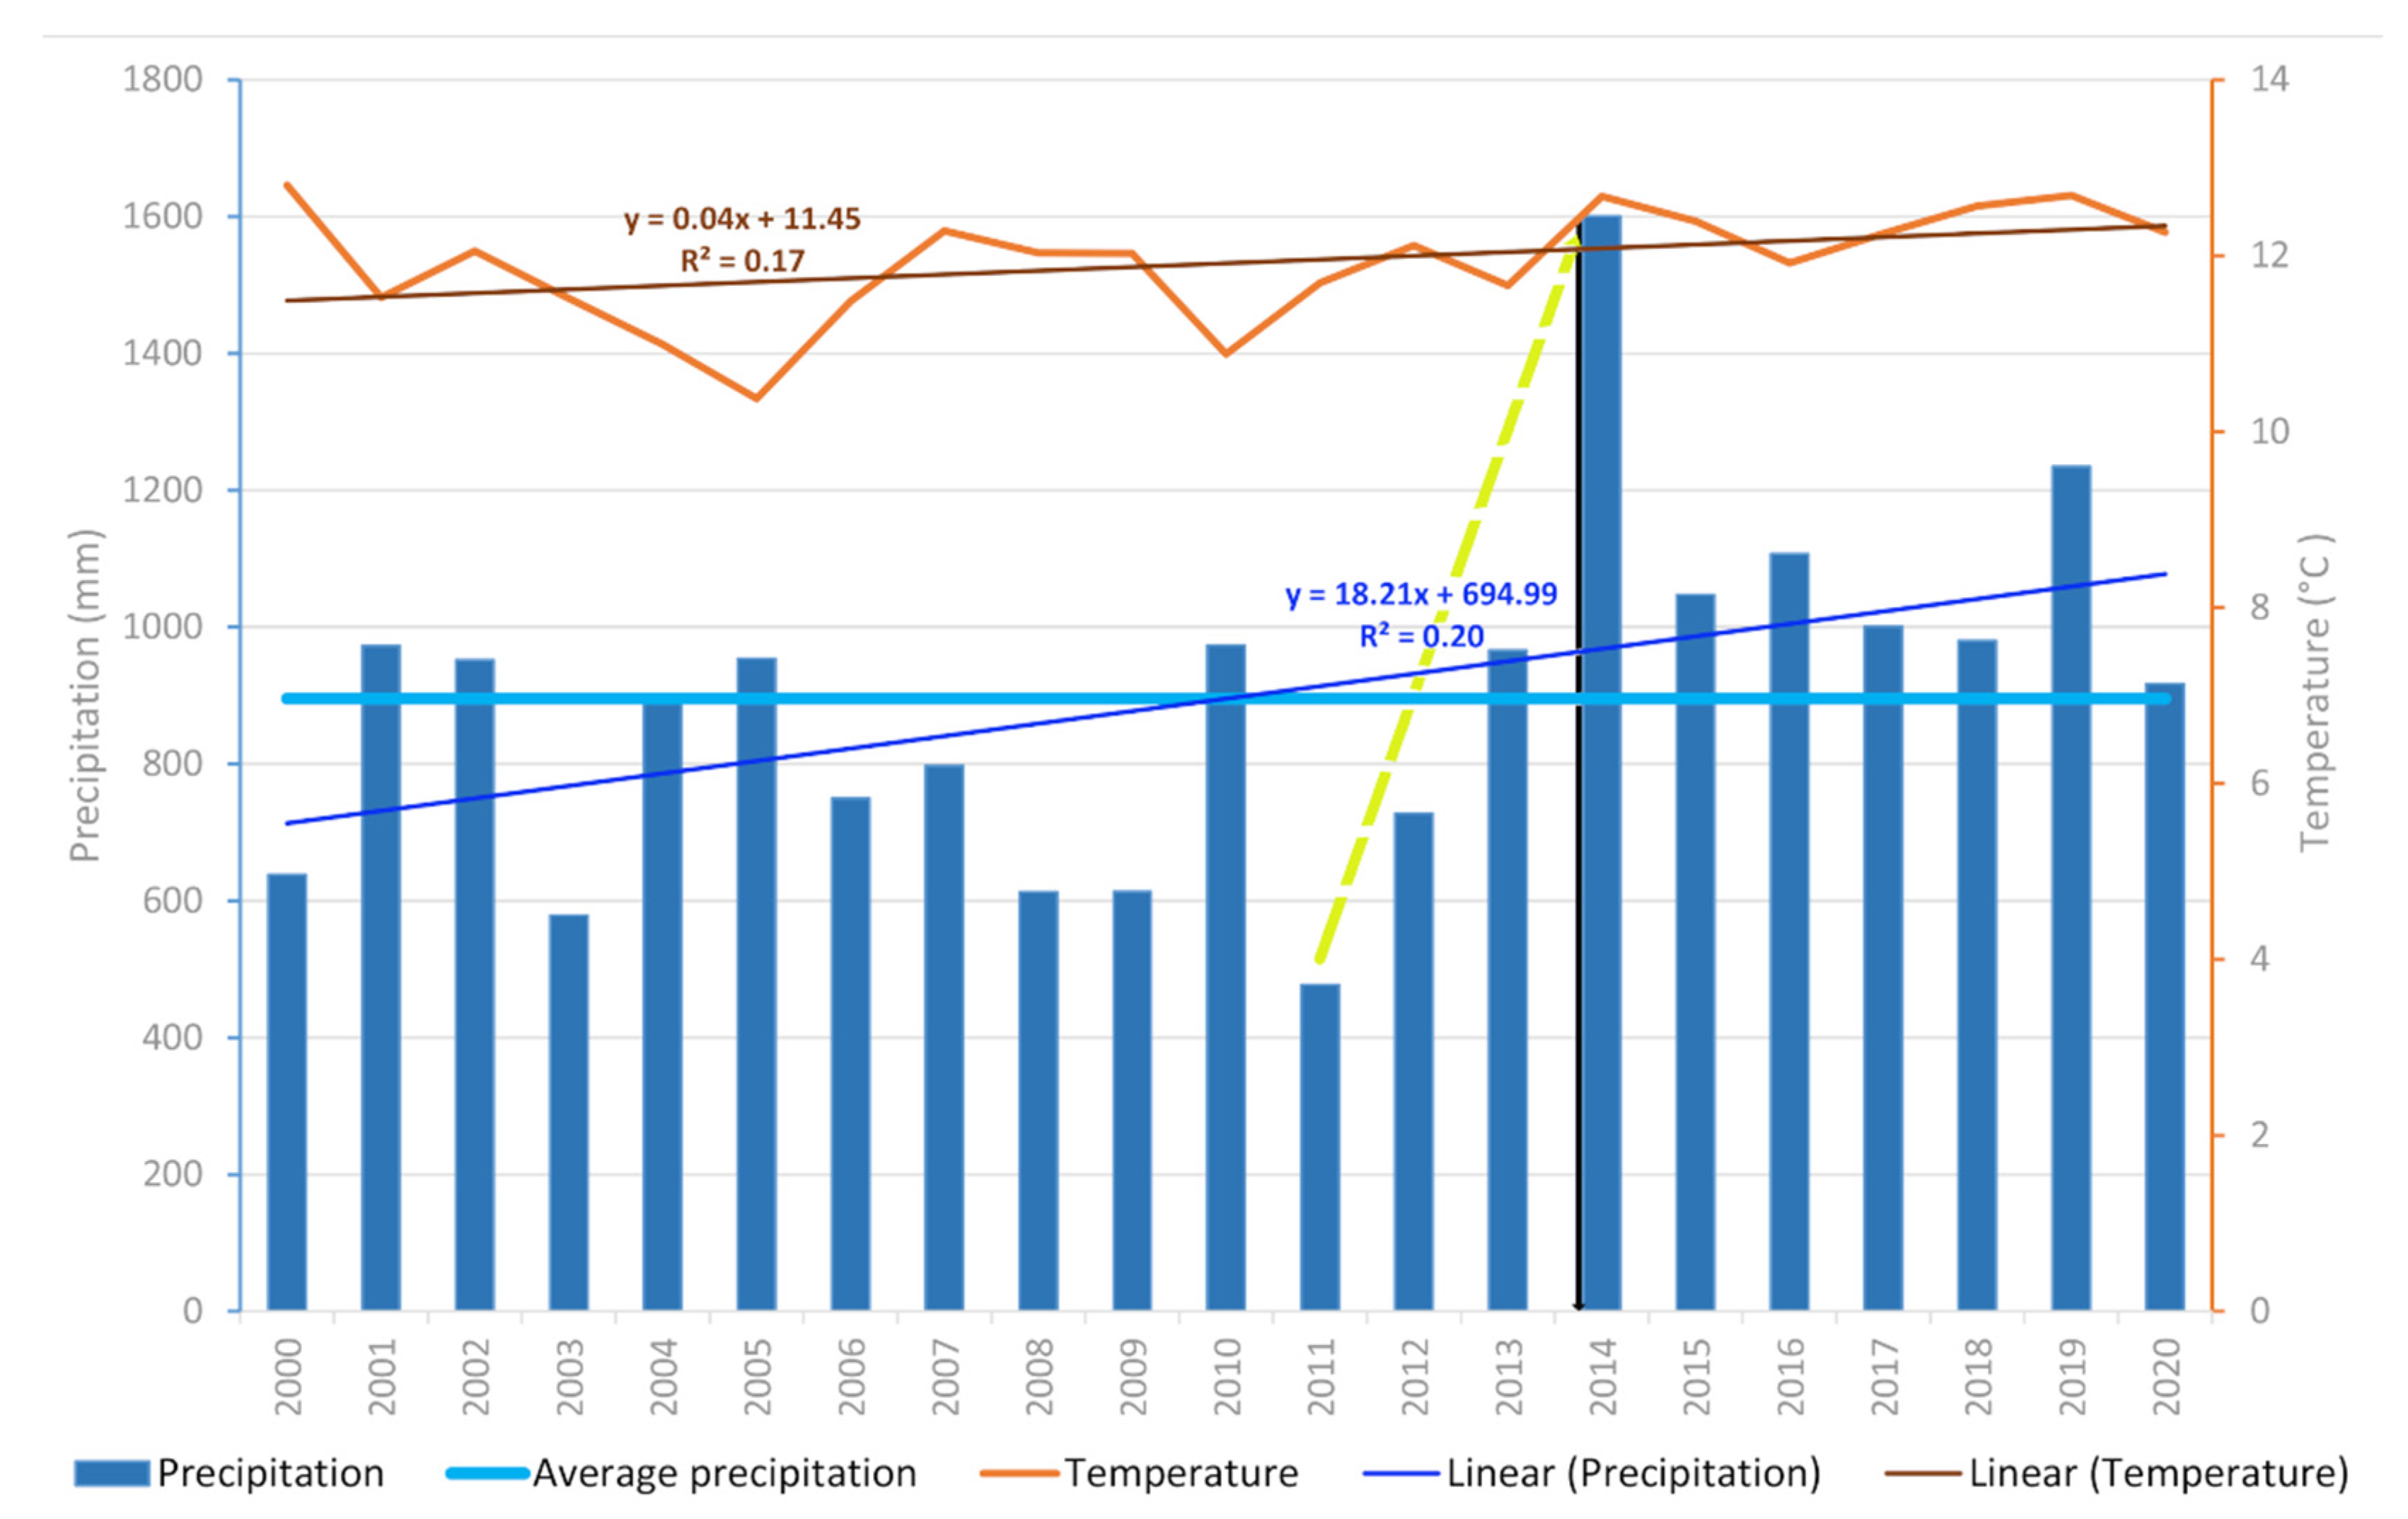
Precipitation from meteorological station Kravarsko and temperature from meteorological station Zagreb-Pleso airport were also correlated: The data indicate a slow increase in temperature and precipitation over the last 20 years, which can be assigned to ongoing climate changes (Figure 8) [55].

4.5. Gajevo Landslide Engineering–Geological Map and Cross-Section Development

All available geological data and research results were taken into account and a new detailed Gajevo landslide engineering–geological map and cross-section were developed. The initial map was based on the 1:500,000 scale Engineering–Geological Map of Yugoslavia [39], the 1:300,000 scale Engineering–Geological Map of the Republic of Croatia [42], Basic Geological Map of Yugoslavia at a scale of 1:100,000 (Sheet Sisak) [24,25] (Figure 4), and prepared cabinet maps (Figure 3). The research area is in one lithological unit on this initial map represented with Pliocene sandstones, sands, and clays, i.e., Viviparus beds.
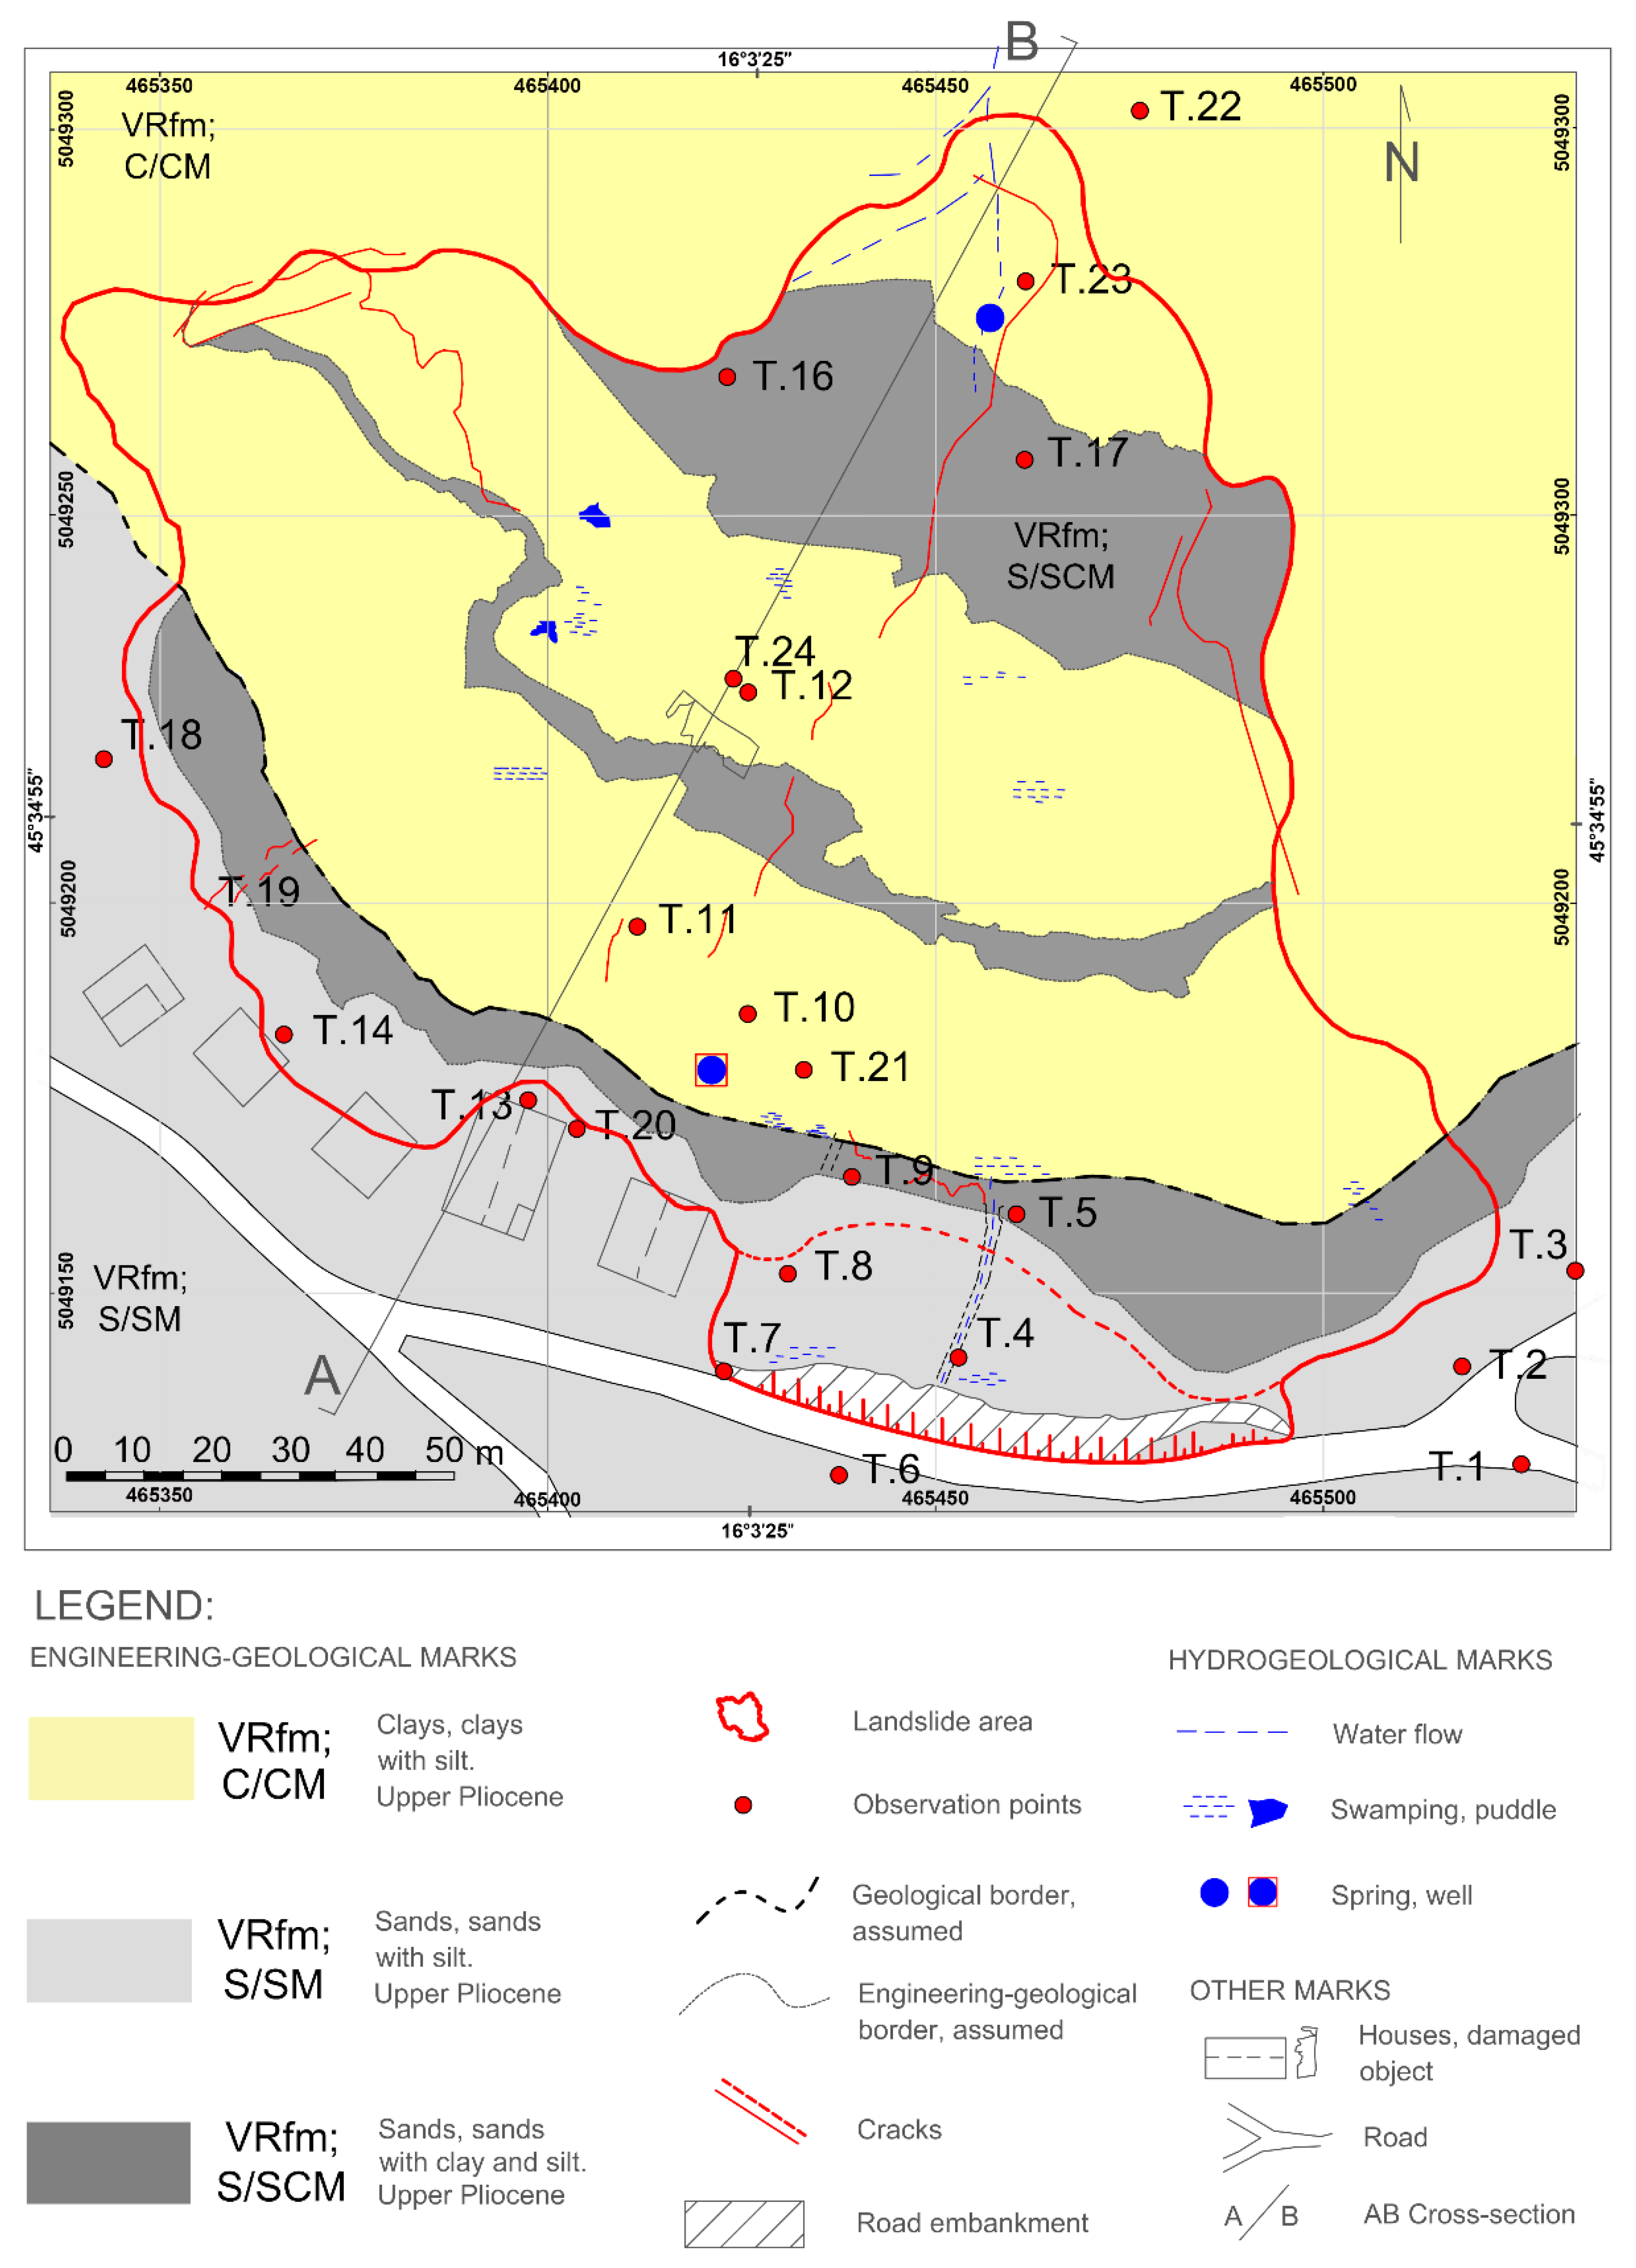
As vegetation and human activity on the surface made it difficult to determine the deposits in the field, shallow excavations were also performed, and landslide main scarp was investigated. After conducting fieldwork it was concluded that the mapped units on the Gajevo landslide area consist of the informal Vrbova formation (Vrbova fm.), Pliocene (Pl1-3), previously described as Viviparus beds, and Pliocene (Pl2-3) [10,34,35,36]. In the field three units were differentiated: VRfm-S/SM sands, sands with silt (light gray on the map); VRfm-S/SCM sands, sands with clay and silt (dark gray on the map); and VRfm-C/CM clays, clays with silt (yellow on the map), as shown in Figure 9.
The new, revised Gajevo landslide engineering–geological map shows three mapped units and marked water phenomena and major cracks. The springing and the outflow of water occur on the upper part of the slope (main scarp area) on the contact of the sandy and clayey layers. Water re-enters the body of the landslide at the locations of mapped sandy layers (dark gray zones). In the areas where clay prevails on the surface, the water is retained in the form of puddles and swamps. The instability of the terrain is present all the way to the lower part of the slope, i.e., to the valley where the inclinations are decreased and the relief became flat. The developed map differentiates three lithological units of the same (informal) geological formation, showing the elements of landslide (area, cracks) and water status (springs, puddles, swamps) with the objects in the area (houses, collapsed object, road, embankment), as shown in Figure 9.
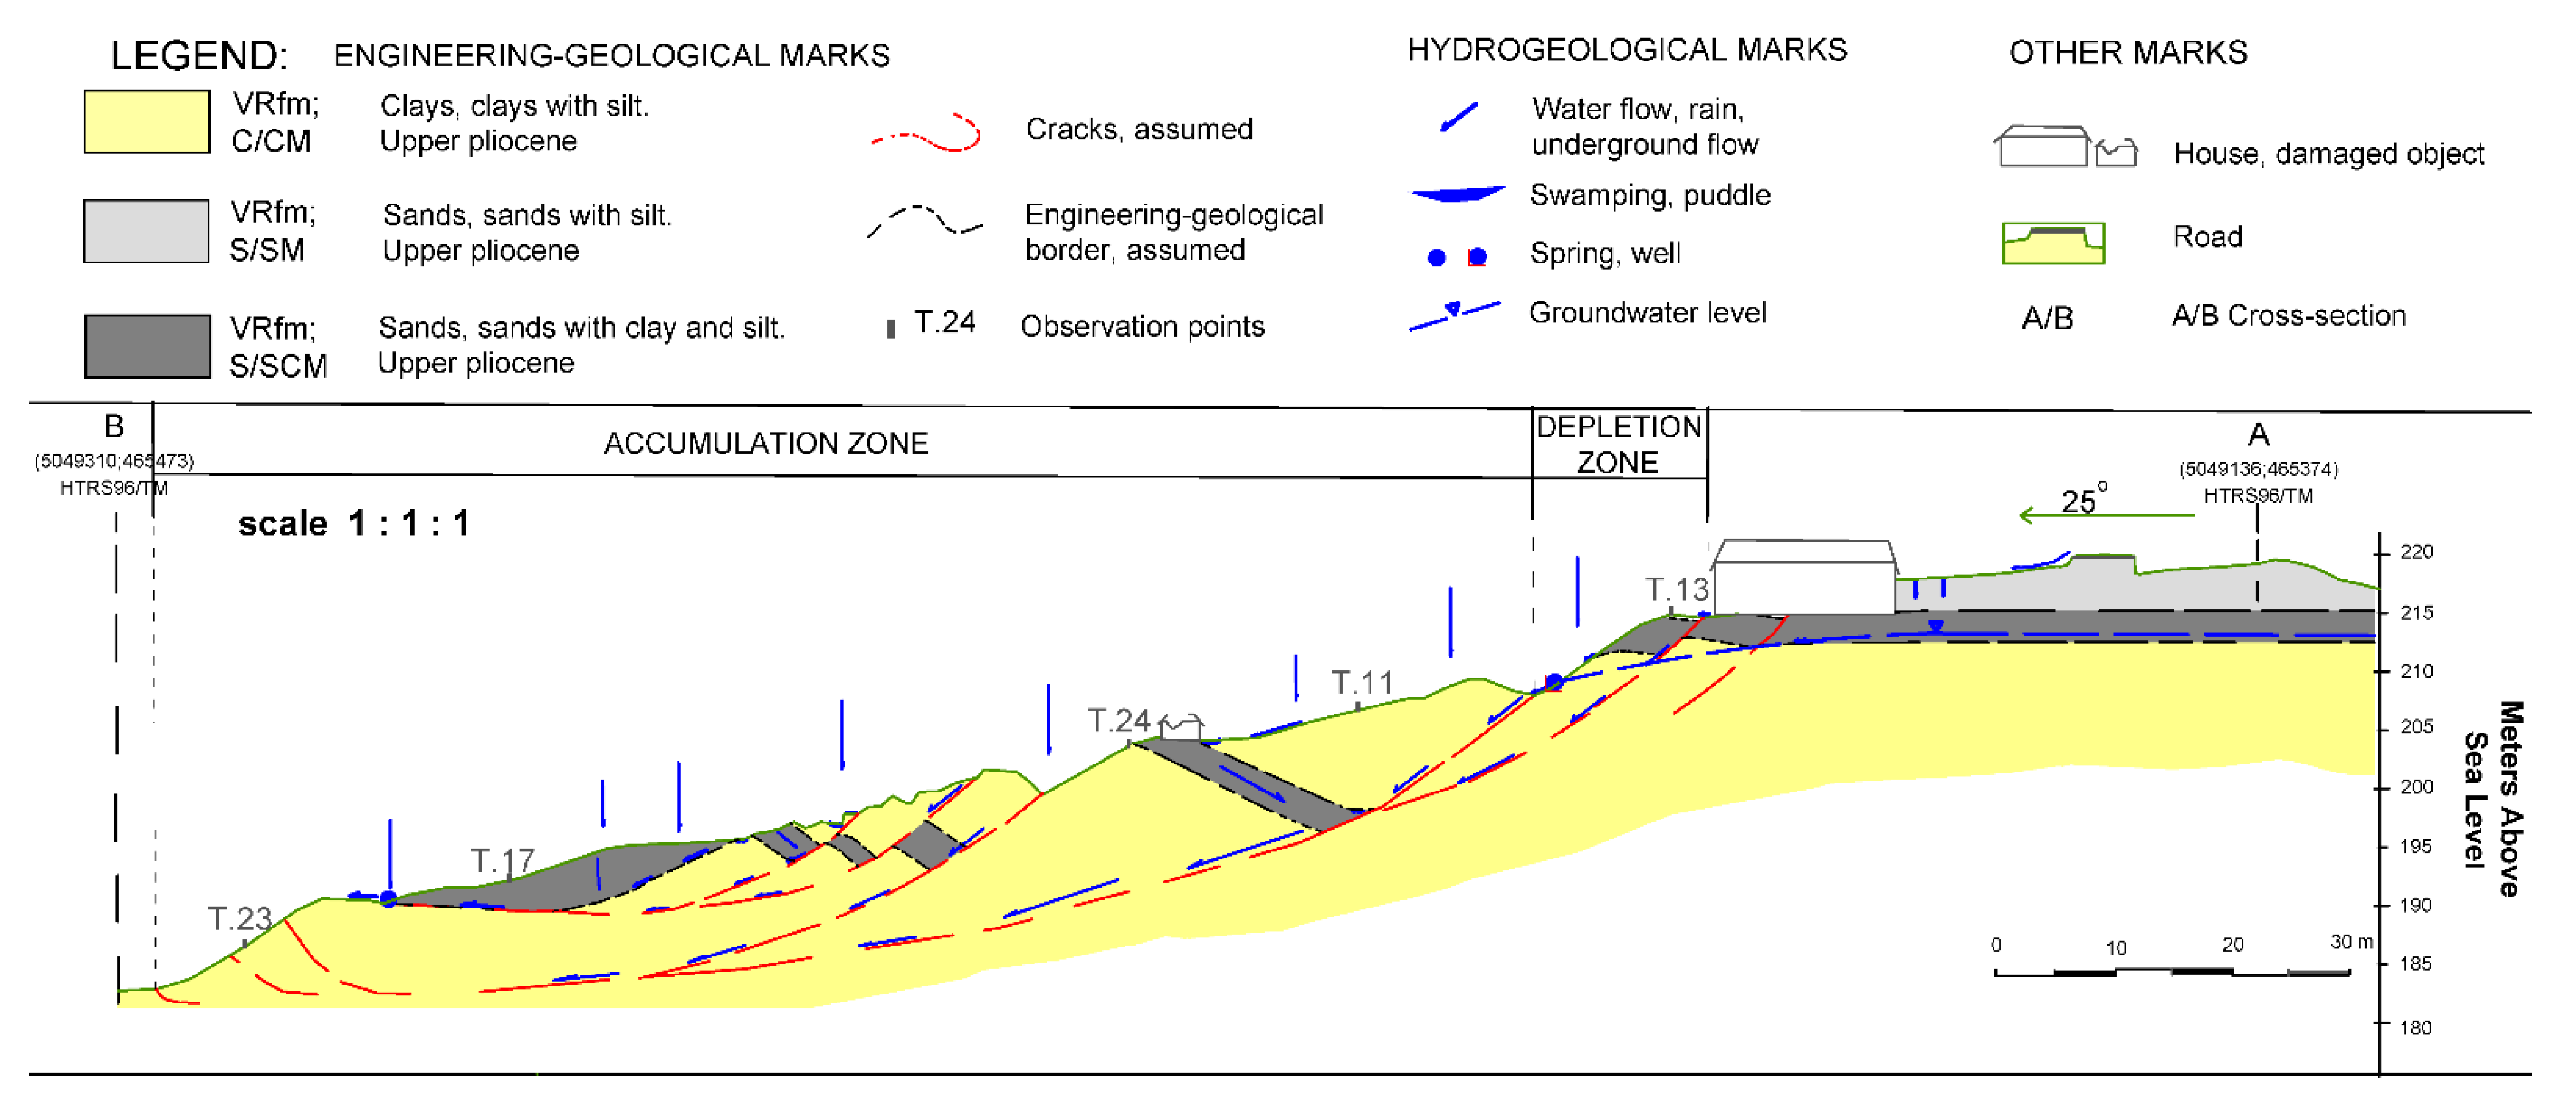
The engineering–geological cross-section AB of the Gajevo landslide with 25° azimuth was based on LiDAR data: The detailed DEMs and topographic map with 1 m contour lines were used in its development. On the cross-section, cracks and deformations in the landslide body are clearly visible, as well as several generations of sliding, and the existence of more sliding surfaces can be interpreted. Two characteristic landslide zones are visible on the topographic profile: the zone of depletion and the accumulation zone (Figure 10).
The cross-section shows the assumed/interpreted sliding surfaces according to mapped deformations on the terrain surface. Additionally, springs, swamps, and a well with the assumed/interpreted lithological changes of material in the deeper layers (based on the mapped surface changes) are presented. The location of the house (number 29) is also shown with the road on the top of the slope.
The landslide is located on the northern side of the slope, and the main scarp extends along the road for about 225 m. At the beginning of the AB cross-section, the sliding started next to the house, but it is possible that cracks also appeared under the house. Cracks are visible on the north side of the house where the existing wall is cracked and split. Gajevo landslide covers an area of ~19,500 m2 with height difference of ~35 m. Head scarp height varies between 5–10 m. At the same time “the toe of the head scarp zone” is the area where multiple occasional small springs occur and water is present on the terrain. Within the well the water level is on the terrain surface level i.e., marks the line of groundwater level.
The well ~20 m east of the cross-section is shown on the cross-section: The assumption is that in the location of the well the upper part of the landslide is drained, i.e., the main scarp area drainage is an ongoing natural process. The rest of the water from the landslide body is drained in the lower part of the slope: probably in multiple places and levels, but eventually, all of the water ends up in Koravec creek below the landslide toe part.
Furthermore, it is assumed from the cross-section that the deepest sliding surface is approximately 5–15 m deep (depending on the material accumulation in the landslide body). The assumption is that the sliding surface is the deepest in the zone of the collapsed object on the profile (T.24), i.e., in the zone of accumulation of material in the middle part of the landslide.
The precipitation drainage is ongoing partially on the surface and partially underground. Some of the precipitation probably flows downslope on the surface until the terrain becomes semi-permeable (sandy) when water enters the underground (middle part of the landslide). The drainage is ongoing partially on the sliding surfaces underground as they are the zones where the material is weakened. The lower part of the landslide is composed of “chaotic” colluvium without expressed surface water, and it is relatively dry. It is diffusely drained in multiple places. Eventually, the water content from the landslide body area ends up in the Koravec stream downslope.

5. Discussion

In this research, the remote landslide mapping data and data collected in the field were used to develop and verify a new Gajevo landslide map and cross-section. By conducting geological investigations on the Gajevo landslide area, three engineering–geological units were differentiated in Vrbova fm. The Gajevo landslide can be considered currently inactive, although there were some minor movements in some parts of the landslide in the last 12 months (data from December 2021). The landslide is a complex slide: There are several generations of movement, and several smaller landslides within the colluvium can be identified on detailed DEMs (and in the field). In 2014 the majority of the movements occurred, but as field mapping was conducted a couple of times (in 2018, 2019, 2020 and 2021) some more recent deformations within the landslide body were visible in the field. With the help of detailed DEM and from the field data six smaller landslides of different generations (younger than 2014) in the landslide body were distinguished (Figure 11). According to movement type the sliding(s) are composite and mainly can be considered as rotational, but there are also areas of translational slide and flow. According to the depth of the deepest sliding surface, the landslide varies from shallow (1–5 m) to deep (5–20 m).

5.1. Activation Time

Based on historical aerial photographs, the approximate time of landslide activation was set sometime in the period 2011–2014 (Figure 2a,c). This is in accordance with precipitation data which indicate wintertime of 2014 as the landslide activation period (confirmed by eyewitness accounts). Information from locals, media releases, and precipitation analysis were used to assess landslide activation more accurately. Based on such data, the activation time of the landslide was determined as February 2014 [16]. The Kravarsko municipality has even declared a state of emergency due to the increased occurrence of landslides in February 2014 [15].

5.2. Landslide Conditioning Factors

5.2.1. Terrain Characteristics

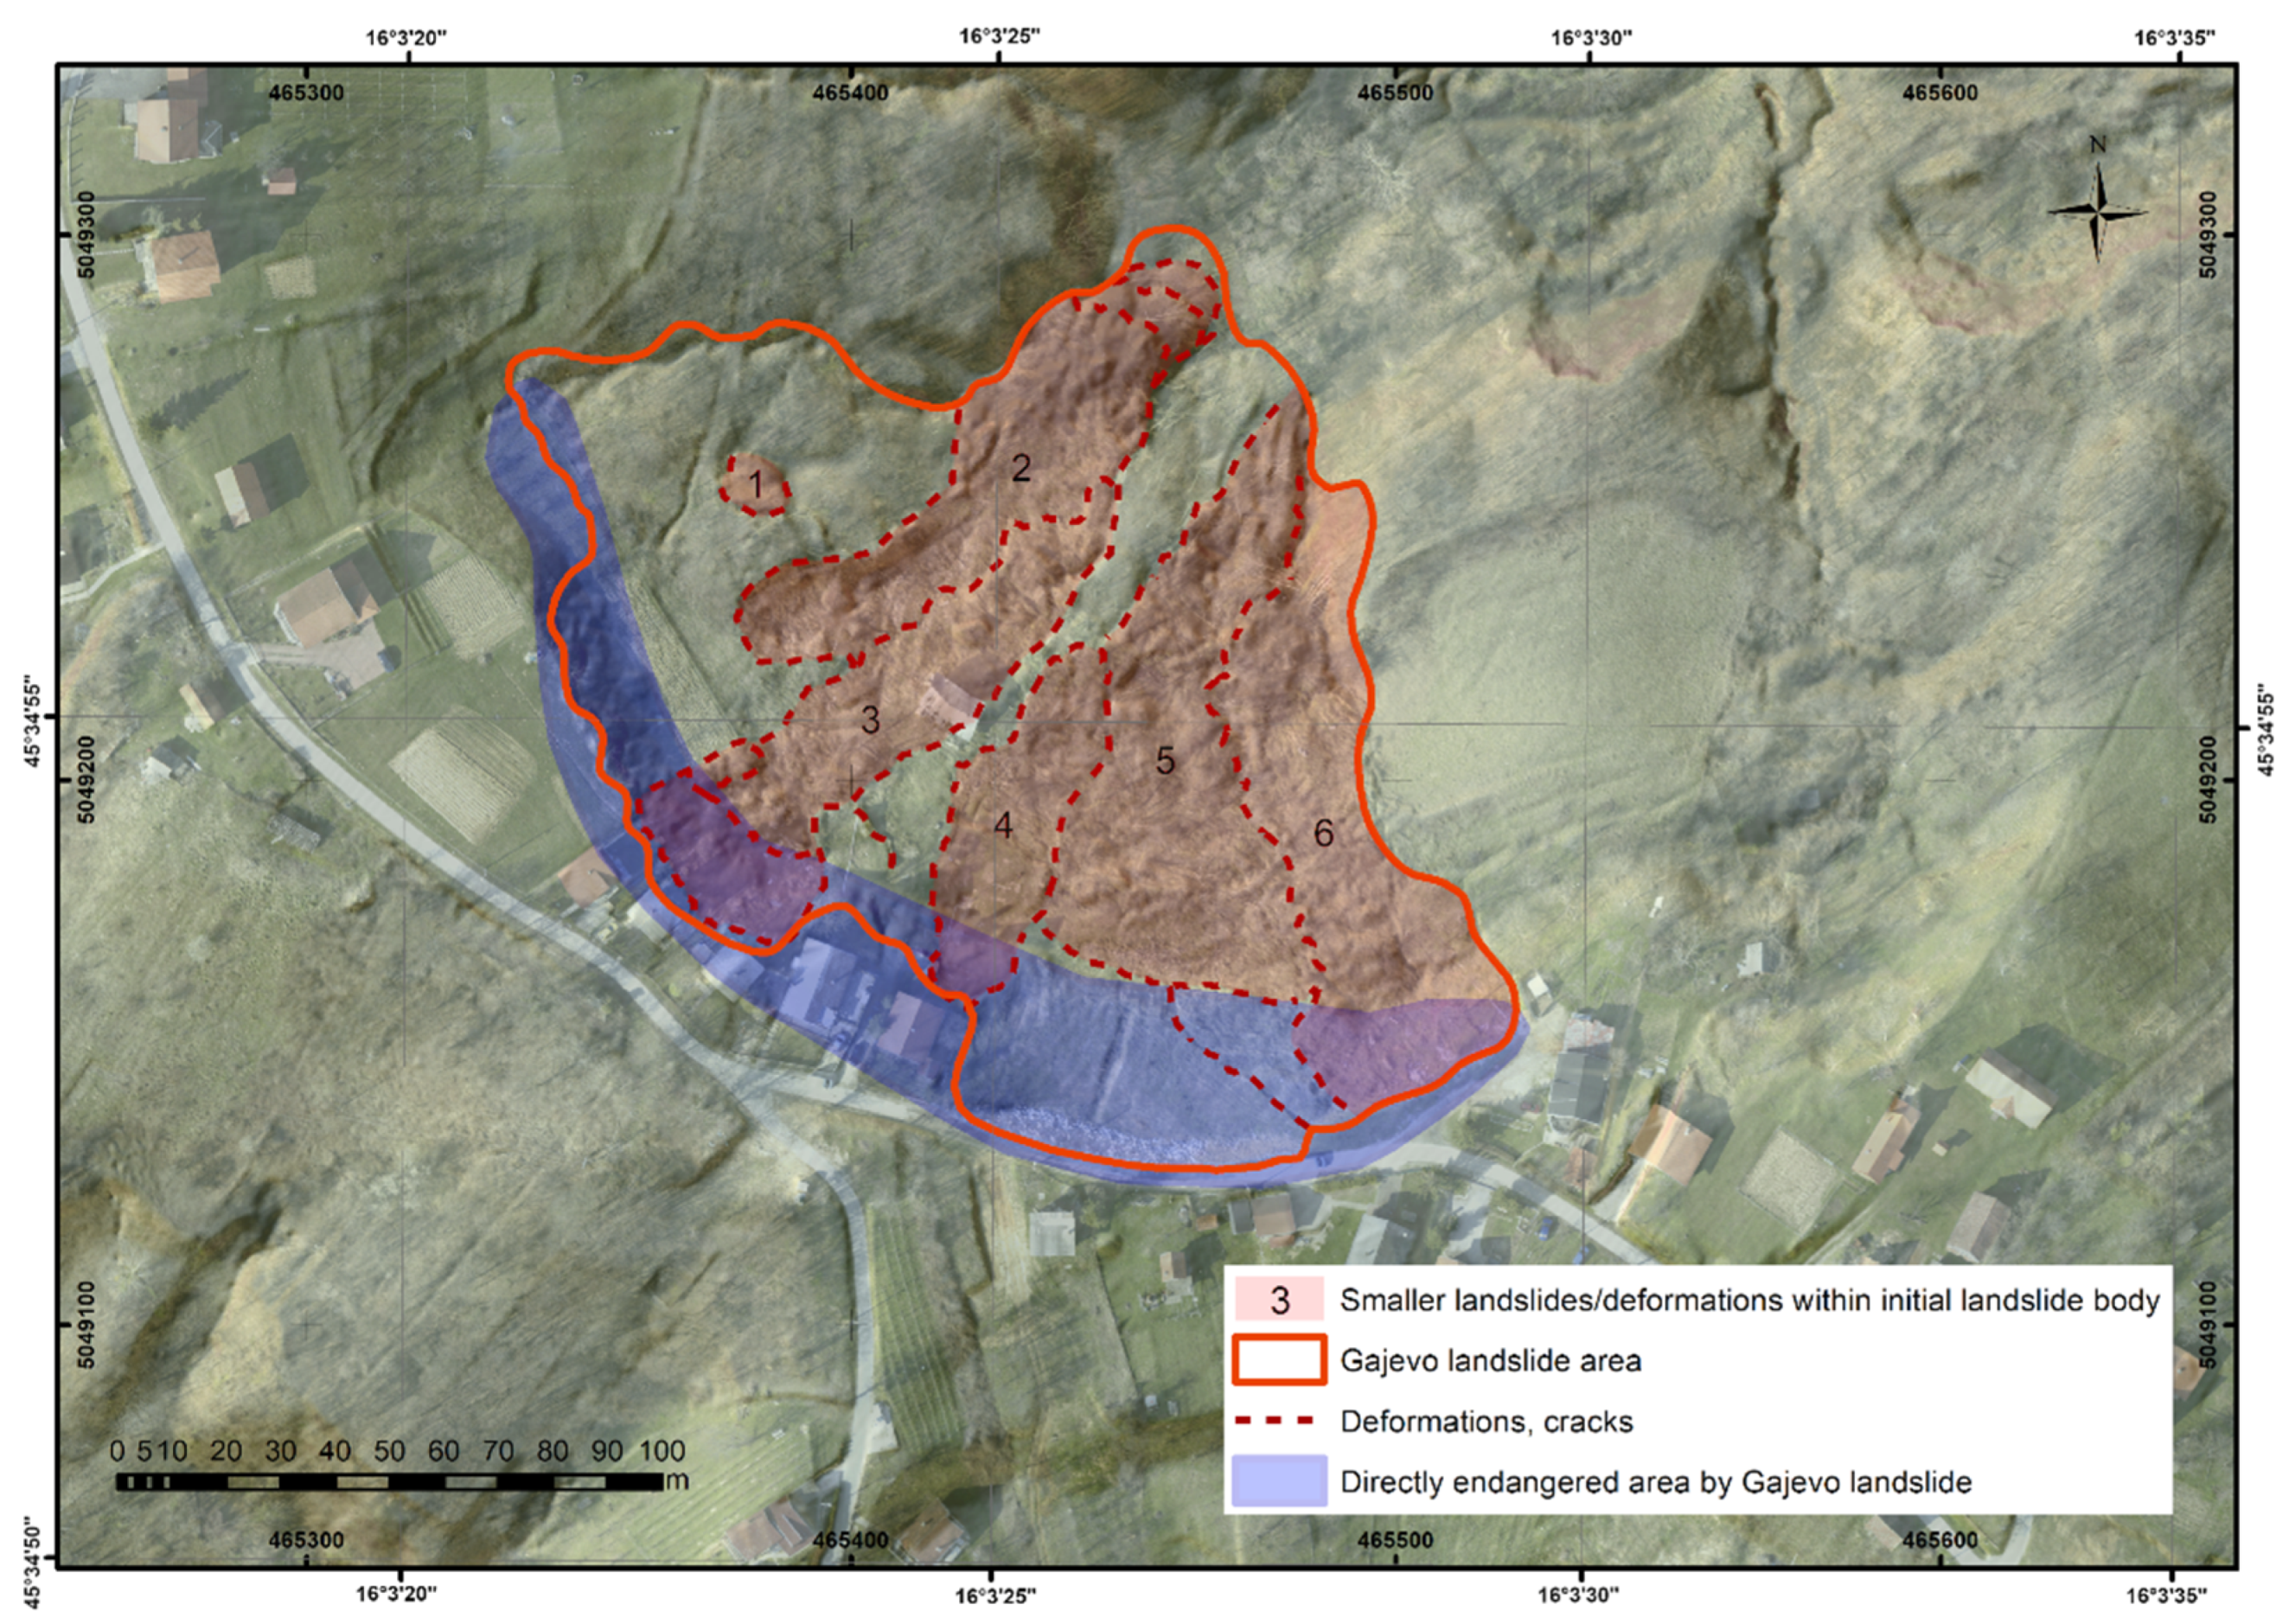
The Gajevo landslide is located on the north side of the slope and north of the road. There are houses located on/above the landslide, i.e., in the crown area of the landslide (Figure 11). These houses are still endangered. The main scarp of the landslide is practically under the houses at Gajevo Street, house numbers 23-31. The lithological composition of the Pliocene Viviparus layers of Vukomeričke Gorice includes sands, gravels, clays, silts, sandstones, conglomerates, and several occurrences of lignite layers [24,25,29], while on site, in Vrbova fm., three units were mapped: sands, sand with clays, and clays. The geological mapping conclusion is that on the Gajevo landslide area there are zones with mixtures of sands and clays with silts and some organic components. These variations (different material ratios) are site-specific and highly variable both laterally and vertically. Still, three zones were differentiated in the field based on engineering–geological material characteristics: mainly coherent, mainly incoherent, and mixture. The colluvium is predominantly coherent (clays with silts), while the incoherent material (sand) is predominantly on the upper part of the slope, and in the sandy layers water accumulates in the pores. At the contact of water-impermeable coherent layers (made of clays) and water-permeable incoherent layers (made of sands), local, periodical springs are present, and it is usually at these contacts that sliding occurs. These specific lithological characteristics of heterogeneous Vrbova fm. are extremely unstable on slopes and favor the development of landslides [37,38,40].
The assumed depth of the sliding surface in the landslide area is mostly 10 m, the shape of the landslide is almost equidimensional (~225 m wide and ~160 m long), and the area affected by a landslide is ~19,500 m2. The direction of exposure of the slope and the direction of movement is towards the northeast.
One of the main contributions of this research (besides the new landslide map, cross-section development, and precipitation analysis) is the fact that the area directly endangered by the Gajevo landslide can be defined: It is the landslide crown and head scarp area (the head scarp height is in range of 5 to 10 m) with five houses and the road on the verge of the landslide (Figure 11) which is ~1/3 of Gajevo landslide area (~6,500 m2). Slope stability and landslide activation were pre-defined by terrain characteristics, i.e., geological structure (interchange of the permeable and impermeable layers) and terrain morphology. As the layers are horizontal or sub-horizontal, the degree of disintegration, i.e., weathering at surface layers (which are loose and poorly lithified) is in direct correlation with the amount and penetration of the precipitation. Increased humidity/water content in the material led to slope collapse.

5.2.2. Anthropogenic Factor

Even though the existing terrain characteristics were unfavorable the anthropogenic factor also adversely affected the stability of the slope: Additional load was placed on the top of the slope (road and houses were built; Figure 2, Figure 11 and Figure 12), and the drainage of rainwater from the road and houses is not well regulated, i.e., the collection and discharge of rainwater are concentrated down the slope (in the landslide body). In addition, there may have been a leak in the water line (originally was placed underground in the body of the road). The water line is now placed on the slope’s surface but this cannot be considered as a permanent solution; see Figure 12).

5.2.3. Climate Change and Precipitation Value Correlation

The hypothesis that the main cause (triggering factor) of the Gajevo landslide was primarily climate changes (in the broader sense) was tested by precipitation data analysis.
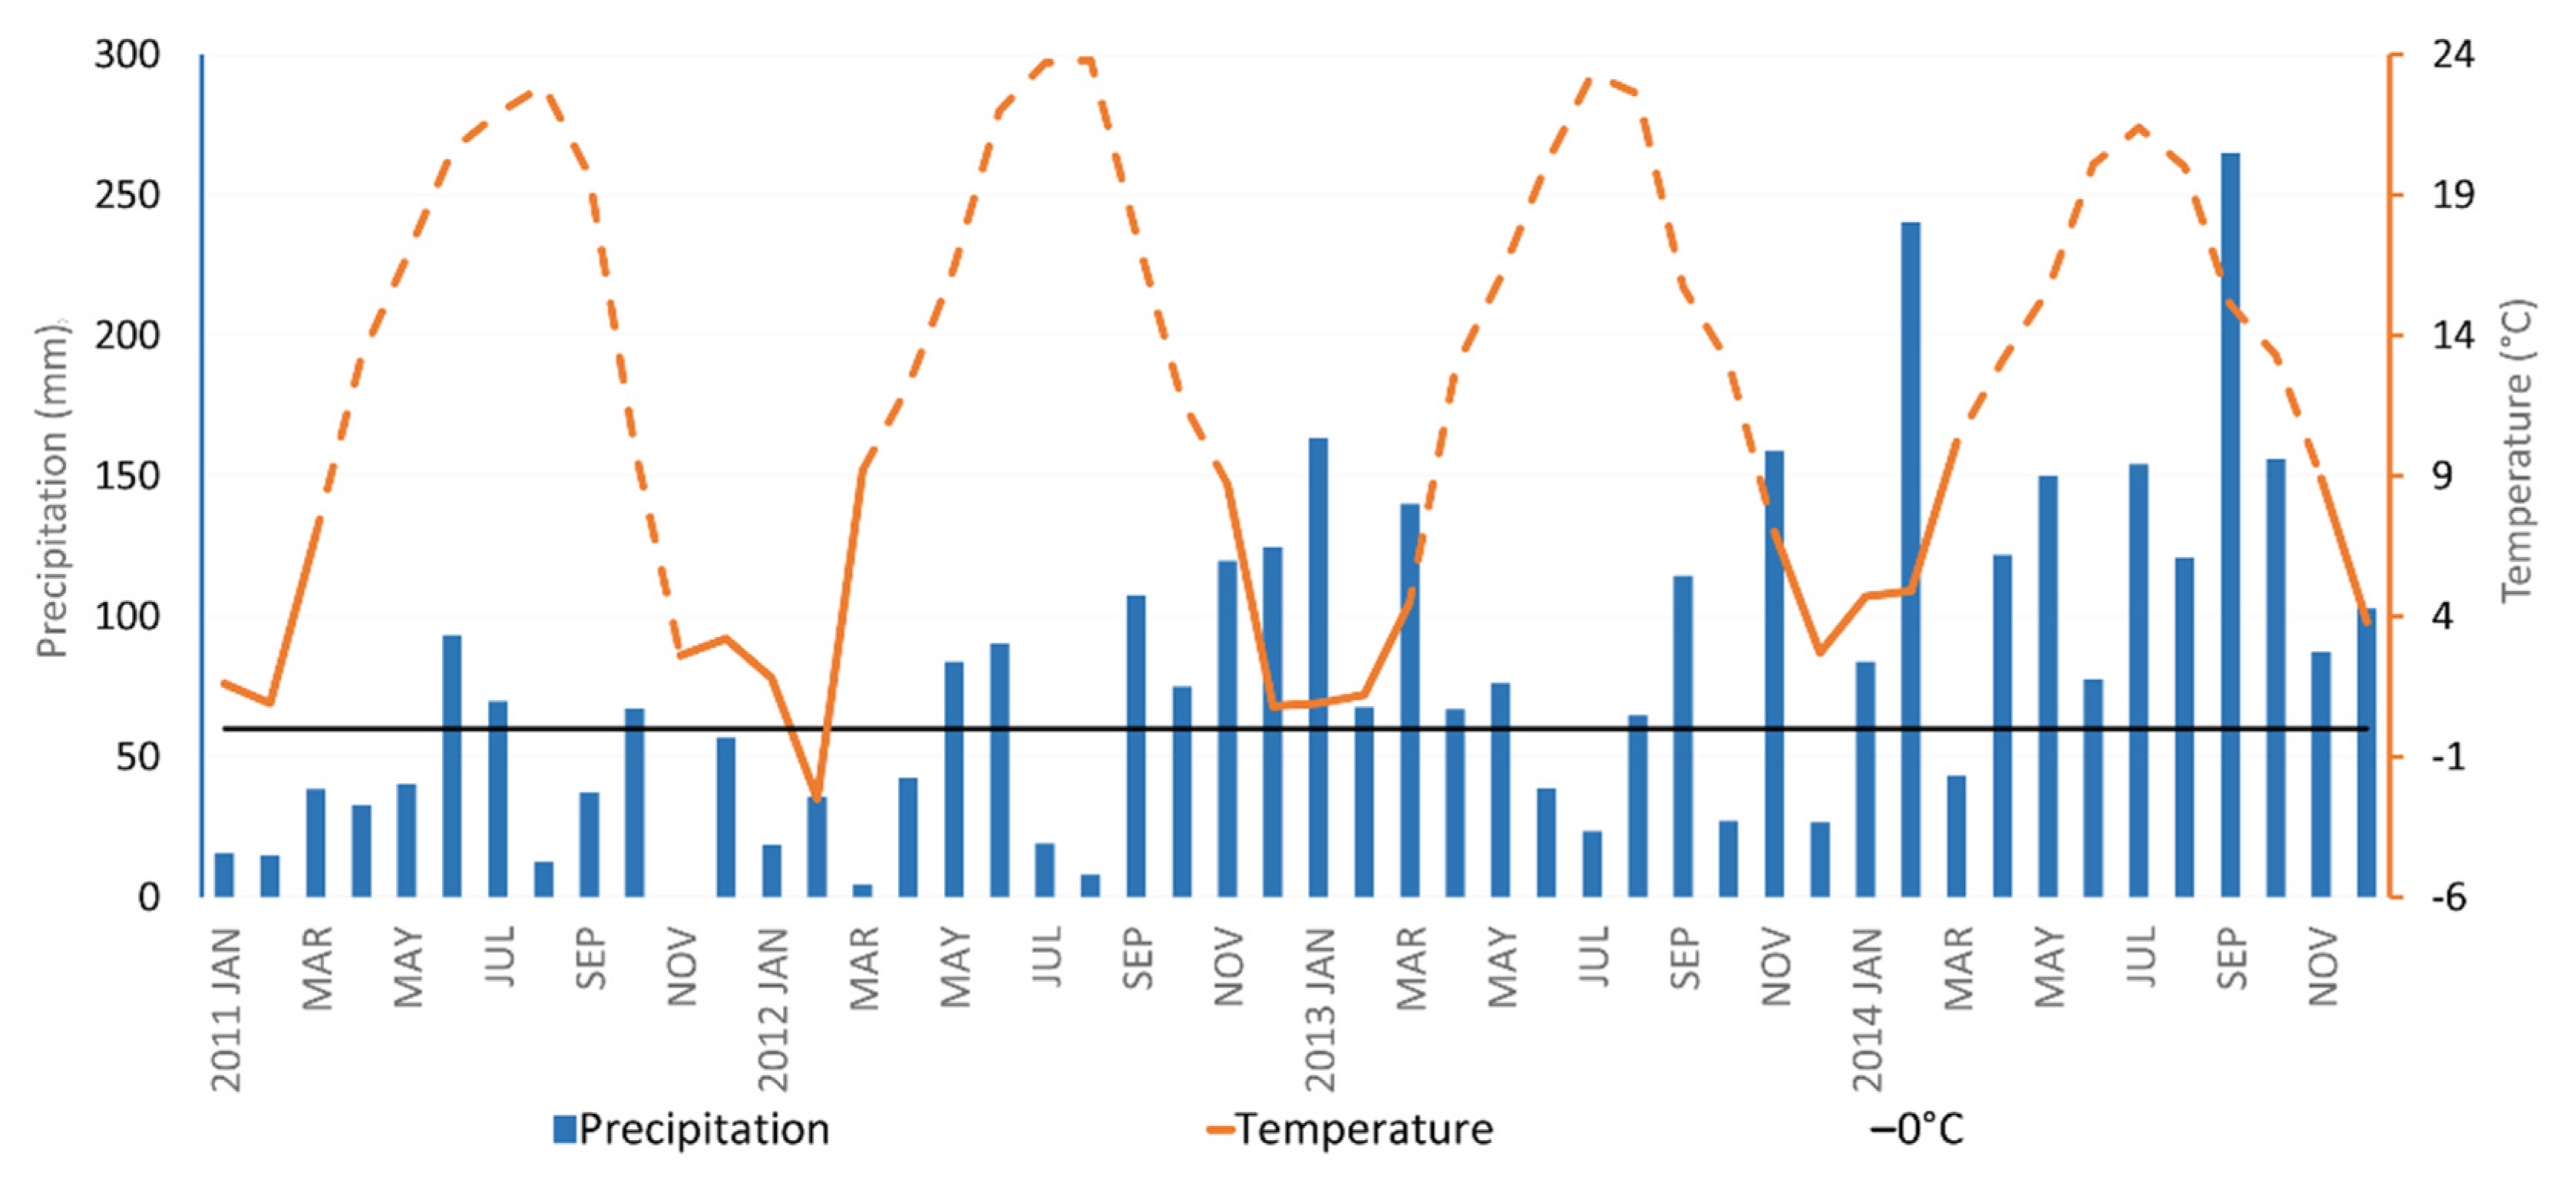
The precipitation values from Kravarsko meteorological station shows that during 2014, the annual rainfall (of 1601 mm) was approximately 45–78% higher than the average annual values in the period from 1971 to 2000 (of 900–1100 mm) but also 79% higher than the average annual values from 2000 to 2020 (of 895 mm; Figure 7 and Figure 8). Furthermore, the significant difference in precipitation amounts for Kravarsko meteorological station between 2011 and 2014, with the precipitation amount in 2011 being 447 mm and in 2014 being 1601 mm (Figure 8, Table 1), is a crucial factor that triggered the landslide activation. This large amplitude indicates the change in rainfall pattern, and it is also considered as a sign of a growing impact of global warming and climate changes on the usual annual precipitation values [47,63,64].
Based on the geographical position, available landslide data, and comparison of the meteorological station Kravarsko data with other close-by meteorological stations, the data for the research area are considered comparable with Zagreb County and City of Zagreb area precipitation and landslide data. According to available data from the Podsljeme hilly area of the City of Zagreb, the largest number of landslides (more than 150) was reported in 2013 and 2014 [13]. The amount of precipitation in winter 2013-2014 also has very similar values for the area of Podsljeme hilly area and Vukomeričke Gorice hilly area (Table 1). These data are indicative as the area of the Podsljeme has a similar geological build and geographical setting to Vukomeričke Gorice [14]. As such these data sets point out climate changes as ongoing with their impacts in the wider area.
The ongoing climate changes (manifested in temperature and precipitation changes, Figure 8 and Figure 13) affect the Gajevo landslide area greatly: The data show that in the period from 2011 to 2014 there was an increase in precipitation and the monthly average temperature in winter (Figure 13). This sharp rise in temperatures especially in February 2014, accompanied by heavy rain, caused the snow to melt. With melting snow and heavy rainfall, groundwater levels have risen dramatically and rapidly, leading to an increase in pore-water pressures that reduced the shear strength of the soil and caused the activation of the landslide [65,66]. Moreover, there is a possibility of the “long term” influence of a sudden amplitude of precipitation between dry years (2011 and 2012) when desiccation cracks are likely to occur in the study area and with years of increased rainfall (in 2013 and 2014) when deeper water penetration was expected due to higher precipitation values and “pre-existing non-healed” desiccation cracks through which critical levels of pore pressure were reached more easily [66,67,68,69].

6. Conclusions

Relevant available data were reviewed, and two methods for Gajevo landslide mapping were used: remote and field mapping. Analysis of existing remote sensing data (historical orthophoto documentation) had great importance because it gave insight into the historical development of the landslide area through the last 50 years. By cabinet processing and analysis of detailed remote sensing data, cartographic base maps were developed. They were based on high-resolution DEMs (0.5 × 0.5 m cell size), orthophotos (10 × 10 cm pixel size), and a 1 m contour line topography map. From the cabinet maps, information about the Gajevo landslide was gained. The area affected by the landslide was drawn out, the land cover was determined, and visible signs of damage were noted. Classic field mapping, at the same time, served for remote mapping data/developed cabinet maps verification and for the definition of geological/engineering–geological units on the area. Importantly, in the area with dense vegetation, mapping on the high-quality remote sensing data/high-resolution DEMs can be even more accurate than the classic field mapping. Moreover, the analysis of remote data allows a larger terrain area to be processed/inspected without loss of quality which means optimization of time and economic resources. Nevertheless, classic field mapping cannot be ignored or neglected. The combination of remote and field methods facilitates the efficient implementation and improved research results. Geological and engineering–geological field mapping of the landslide area was performed multiple times (in 2018, 2019, 2020, and 2021) to gather info about the landslide area (24 field points were marked, along with deformation measurement points on the houses in the landslide crown area). Differences in lithology were noted, and the landslide area was divided into three engineering–geological units. The results are presented on the new Gajevo landslide map. On the map, major cracks and occurrences of water are noted. The landslide area drawn out in the cabinet map was corrected in the field: As the landslide partially affects the road, the embankment area was included in the landslide area. An engineering–geological cross-section of the Gajevo landslide was also developed, and the most endangered area in terms of future movements and damage was defined: the landslide crown and head scarp area.
Based on the relevant available temperature and precipitation data, it can be concluded that the high amount of precipitation in February 2014 was the main landslide triggering factor (besides the existing unfavorable morphological, geological, and anthropogenic factors). The ongoing climate changes (manifested in temperature and precipitation changes) affect the Gajevo landslide area greatly: The data show that in the period from 2011 to 2014 there was an increase in precipitation and the monthly average temperature in winter.
Although it is currently inactive, the Gajevo landslide in the Kravarsko area (northern Croatia), can be reactivated in case of heavier precipitation or due to anthropogenic activities. This can lead to greater damage to houses in the landslide crown area and endangerment of lives. The Gajevo landslide is complex, with more generations of landslides, smaller landslides in the main landslide body are also present, and multiple slide surfaces at different depths exist. The landslide area material variations are site-specific and highly variable both laterally and vertically (sand vs. clay). Taking into account these facts, further detailed research is recommended, for example drilling, geophysical investigations, laboratory analysis, water data gathering, situation monitoring, and new data analysis.
For the local community, it is advised to monitor the area, with emphasis on the endangered housing area/landslide crown and head scarp area. It should be noted that the current slope drainage system is inadequately constructed since the majority of the drainage pipes end out in the body of the landslide. Additionally, drainage from the road is not adequate. All of the present water should be, in a controlled way, gathered and steered away to the existing Koravec stream downslope. Apart from the recommended drainage system improvements, it is necessary to inform and educate the local community about possibilities and means of coexistence with the landslide and how individuals can contribute to landslide remediation. Landslide mitigation should be performed at least to some degree at the directly endangered area, and in this case, timely intervention can be crucial in preventing safety risks and damage to property.

Author Contributions

Conceptualization, L.M., L.P. and V.G.; methodology, L.P., L.M. and V.G.; software, L.M.; validation, L.P., I.M. and V.G.; formal analysis L.P.,V.G. and I.M.; investigation, L.M. and L.P.; data curation, L.M., V.G. and L.P.; writing—original draft preparation, L.M. and I.M.; writing—review and editing, L.P., V.G. and I.M.; visualization, L.M.; supervision, L.P. and L.M.; All authors have read and agreed to the published version of the manuscript.

Funding

This research received no external funding.

Institutional Review Board Statement

Not applicable.

Informed Consent Statement

Not applicable.

Data Availability Statement

Not applicable.

Acknowledgments

The authors would like to express their thanks to: (I) Interreg IPA CBC Croatia–Bosnia and Herzegovina–Montenegro projects: safEarth (HR-BA-ME59) and RESPONSa and its members; (II) H2020-WIDESPREAD-05-2017-Twinning project (project acronym: GeoTwinn, project ID: 809943) and its members; (III) colleagues from HGI-CGS who helped with this research in any form; and (IV) Croatian Meteorological and Hydrological Service.

Conflicts of Interest

The authors declare no conflict of interest.

References

  1. Varnes, D.J. Landslide Hazard Zonation: A Review of Principles and Practice; International Association for Engineering Geology: Paris, France, 1984; pp. 1–63. [Google Scholar]
  2. Cornforth, D.H. Landslides in Practice: Investigation, Analysis, and Remedial/Preventative Options in Soils; John Wiley & Sons: Hoboken, NJ, USA, 2005; pp. 1–596. [Google Scholar]
  3. Bell, F.G. Geological Hazards: Their Assessments, Avoidance and Mitigation; E&FN Spon Press: London, UK, 2003. [Google Scholar]
  4. Highland, L.M.; Bobrowsky, P. The Landslide Handbook—A Guide to Understanding Landslides; US Geological Survey: Denver, CO, USA, 2008; pp. 1–147. [Google Scholar] [CrossRef]
  5. Giordan, D.; Allasia, P.; Manconi, A.; Baldo, M.; Santangelo, M.; Cardinali, M.; Corazza, A.; Albanese, V.; Lollino, G.; Guzzetti, F. Morphological and kinematic evolution of a large earthflow: The Montaguto landslide, southern Italy. Geomorphology 2013, 187, 61–79. [Google Scholar] [CrossRef]
  6. Turner, D.; Lucieer, A.; de Jong, S. Time Series Analysis of Landslide Dynamics Using an Unmanned Aerial Vehicle (UAV). Remote Sens. 2015, 7, 1736–1757. [Google Scholar] [CrossRef] [Green Version]
  7. Pellicani, R.; Argentiero, I.; Manzari, P.; Spilotro, G.; Marzo, C.; Ermini, R.; Apollonio, C. UAV and Airborne LiDAR Data for Interpreting Kinematic Evolution of Landslide Movements: The Case Study of the Montescaglioso Landslide (Southern Italy). Geosciences 2019, 9, 248. [Google Scholar] [CrossRef] [Green Version]
  8. Conforti, M.; Mercuri, M.; Borrelli, L. Morphological Changes Detection of a Large Earthflow Using Archived Images, LiDAR-Derived DTM, and UAV-Based Remote Sensing. Remote Sens. 2021, 13, 120. [Google Scholar] [CrossRef]
  9. Podolszki, L.; Kosović, I.; Novosel, T.; Kurečić, T. Multi-Level Sensing Technologies in Landslide Research—Hrvatska Kostajnica Case Study, Croatia. Sensors 2022, 22, 177. [Google Scholar] [CrossRef] [PubMed]
  10. Podolszki, L.; Kurečić, T.; Bateson, L.; Svennevig, K. Remote Landslide Mapping, Field Validation and Model Development—An Example from Kravarsko, Croatia. Geol. Croat. 2022, 75, 67–82. [Google Scholar] [CrossRef]
  11. Paine, D.P.; Kiser, J.D. Aerial Photography and Image Interpretation, 3rd ed.; John Wiley & Sons Inc.: Hoboken, NJ, USA, 2012. [Google Scholar]
  12. Guzzetti, F.; Mondini, A.C.; Cardinali, M.; Fiorucci, F.; Santangelo, M.; Chang, K.T. Landslide Inventory Maps: New Tools for an Old Problem. Earth-Sci. Rev. 2012, 112, 42–66. [Google Scholar] [CrossRef] [Green Version]
  13. Miklin, Ž.; Podolszki, L.; Novosel, T.; Sokolić, Ž.; Ofak, J.; Padovan, B.; Zailac, K. Detaljna Inženjerskogeološka Karta Podsljemenske Urbanizirane Zone Mjerila 1:5000 (DIGK-Faza II)[Detailed Engineering–geological Map of Podsljeme Urban Area in Scale of 1:5000 (Phase II)—In Croatian]. Unpublished internal map, Croat. Geol. Surv., Zagreb 2018, Books 1-6, 41 maps.
  14. Miklin, Ž.; Mlinar, Ž.; Brkić, Ž.; Hećimović, I. Detaljna Inženjerskogeološka Karta Podsljemenske Urbanizirane Zone Mjerila 1:5000 (DIGK-Faza I) [Detailed Engineering–geological Map of Podsljeme Urban Area in Scale of 1:5000 (Phase I)—In Croatian]. Unpublished internal map, Croat. Geol. Surv., Zagreb 2007, Books 1-4, 44 maps.
  15. Zagrebačka županija. Proglašena Elementarna Nepogoda Za Općinu Kravarsko. Available online: https://www.zagrebacka-zupanija.hr/vijesti/1763/proglasena-elementarna-nepogoda-za-opcinu-kravarsk (accessed on 17 February 2022).
  16. Miklin, L. Primjena Metoda Daljinskih Istraživanja Na Klizištu Gajevo, Kravarsko [Application of Remote Sensing Methods on the Gajevo Landslide (Kravarsko)—In Croatian]. Master’s Thesis, University of Zagreb, Zagreb, Croatia, 2021. [Google Scholar]
  17. Bostjančić, I.; Filipović, M.; Gulam, V.; Pollak, D. Regional-Scale Landslide Susceptibility Mapping Using Limited LiDAR-Based Landslide Inventories for Sisak-Moslavina County, Croatia. Sustainability 2021, 13, 4543. [Google Scholar] [CrossRef]
  18. Crozier, M.J. Deciphering the Effect of Climate Change on Landslide Activity: A Review. Geomorphology 2010, 124, 260–267. [Google Scholar] [CrossRef]
  19. Gariano, S.L.; Guzzetti, F. Landslides in a Changing Climate. Earth-Sci. Rev. 2016, 162, 227–252. [Google Scholar] [CrossRef] [Green Version]
  20. Palmer, J. A Slippery Slope: Could Climate Change Lead to More Landslides? Eos 2020, 101, 1–13. [Google Scholar] [CrossRef]
  21. Beck, H.E.; Zimmermann, N.E.; Mcvicar, T.R.; Vergopolan, N.; Berg, A.; Wood, E.F. Data Descriptor: Present and Future Köppen-Geiger Climate Classification Maps at 1-Km Resolution. Sci. Data 2018, 5, 180214. [Google Scholar] [CrossRef] [PubMed] [Green Version]
  22. Nimac, I.; Perčec Tadić, M. New 1981–2010 Climatological Normals for Croatia and Comparison to Previous 1961–1990 and 1971–2000 Normals. In Proceedings of the GeoMLA Conference, Belgrade, Srbija, 21–24 June 2016; pp. 79–85, ISBN 978-86-7518-190-3. [Google Scholar]
  23. Zaninović, K.; Gajić-Čapka, M.; Perčec Tadić, M.; Vučetić, M.; Milković, J.; Bajić, A.; Cindrić, K.; Cvitan, L.; Katušin, Z.; Kaučić, D. Klimatski Atlas Hrvatske: 1961–1990: 1971–2000. [Climate Atlas of Croatia: 1961–1990: 1971–2000.—In Croatian]. 2008, p. 200. ISBN 978-953-7526-01-6.
  24. Pikija, M. Osnovna Geološka Karta SFRJ 1:100.000—List Sisak L33-93 [Basic Geological Map SFRY in Scale of 1:100,000—Sheet Sisak L33-93—In Croatian]; Belgrade, Serbia, 1987.
  25. Pikija, M. Osnovna Geološka Karta SFRJ 1:100.000—Tumač Za List Sisak L33-93 [Guide for Basic Geological Map SFRY in Scale of 1:100,000—Sheet Sisak L33-93—In Croatian]; Belgrade, 1987.
  26. Rögl, F.; Steininger, F.F. Neogene Paratethys, Mediterranean and Indo-Pacific Seaways. Geol. J. 1984, 11, 171–200. [Google Scholar]
  27. Neubauer, T.A.; Harzhauser, M.; Kroh, A.; Georgopoulou, E.; Mandic, O. A Gastropod-Based Biogeographic Scheme for the European Neogene Freshwater Systems. Earth-Sci. Rev. 2015, 143, 98–116. [Google Scholar] [CrossRef] [Green Version]
  28. Mandic, O.; Kurečić, T.; Neubauer, T.A.; Harzhauser, M. Stratigraphic and Palaeogeographic Significance of Lacustrine Molluscs from the Pliocene Viviparus Beds in Central Croatia. Geol. Croat. 2015, 68, 179–207. [Google Scholar] [CrossRef]
  29. Kurečić, T. Sedimentologija i Paleoekologija Pliocenskih Viviparus Slojeva Vukomeričkih Gorica a [Sedimentology and Paleoecology of Pliocene Viviparus Beds from the Area of Vukomeričke Gorice—in Croatian]. Ph.D. Thesis, University of Zagreb, Zagreb, Croatia, 2017. [Google Scholar]
  30. Šikić, K., Basch, O.; Šimunić, A. Osnovna Geološka Karta SFRJ 1:100.000—List Zagreb L33-80 [Basic Geological Map SFRY in Scale of 1:100,000—Sheet Zagreb L33-80—In Croatian]; Belgrade, Serbia, 1978.
  31. Šikić, K.; Basch, O.; Šimunić, A. Osnovna Geološka Karta SFRJ 1:100.000—Tumač Za List Zagreb L33-80 [Guide for Basic Geological Map SFRY in Scale of 1:100,000—Sheet Zagreb L33-80—In Croatian]; Belgrade, Serbia, 1979.
  32. Tišljar, J. Sedimentologija Klastičnih Silicijskih Taložina. Institut Za Geološka Istraživanja [Sedimentology of Clastic Silicon Sediments. Institute of Geological Research—In Croatian]; Institut za geološka istraživanja: Zagreb, Croatia, 2004. [Google Scholar]
  33. Šimunić, A. Geološko Kartiranje Sjeveroistočnog Dijela Vukomeričkih Gorica [Geological Mapping of North Eastern Part of Vukomerička Hills—In Croatian]; Croatian Geological Survey: Zagreb, Croatia, 1964; Unpublished internal report. [Google Scholar]
  34. Halamić, J.; Belak, M.; Pavelić, D.; Avanić, R.; Filjak, R.; Šparica, M.; Brkić, M.; Kovačić, M.; Vrsaljko, D.; Banak, A.; et al. Osnovna Geološka Karta Republike Hrvatske Mjerila 1: 50,000—Požeška Gora [Basic Geological Map of the Republic of Croatia 1:50000—Požeška Gora—in Croatian]; Zagreb, Croatia, 2019.
  35. Sebe, K.; Kovačić, M.; Magyar, I.; Krizmanić, K.; Špelić, M.; Bigunac, D.; Sütő-Szentai, M.; Kovács, Á.; Szuromi-Korecz, A.; Bakrač, K.; et al. Correlation of Upper Miocene-Pliocene Lake Pannon Deposits across the Drava Basin, Croatia and Hungary. Geol. Croat. 2020, 73, 177–195. [Google Scholar] [CrossRef]
  36. Kovačić, M. Sedimentologija Gornjomiocenskih Naslaga Jugozapadnog Dijela Panonskog Bazena [Sedimentology of the Upper Miocene Deposits from the Southwestern Part of Pannonian Basin—in Croatian with an English Summary]. Ph.D. Thesis, University of Zagreb, Zagreb, Croatia, 2004. [Google Scholar]
  37. Pollak, D.; Hećej, N.; Grizelj, A. Landslide Inventory and Characteristics, Based on LiDAR Scanning and Optimised Field Investigations in the Kutina Area. Geol. Croat. 2021, 75. [Google Scholar] [CrossRef]
  38. Bostjančić, I.; Avanić, R.; Frangen, T.; Pavić, M. Spatial Distribution and Geometric Characteristics of Landslides with Special Reference to Geological Units in the Area of Slavonski Brod, Croatia. Geol. Croat. 2022, 75. [Google Scholar] [CrossRef]
  39. Čubrilović, P.; Palavestrić, L.; Nikolić, T. Inženjerskogeološka Karta Jugoslavije 1:500,000 [Engineering–geological Map of Yugoslavia in Scale of 1:500,000—in Croatian]; Belgrade, Srbija, 1967.
  40. Frangen, T.; Pavić, M.; Gulam, V.; Kurečić, T. Use of LiDAR-Derived Landslide Inventory Map in Assessing Influencing Factors for Landslide Susceptibility of Geological Units in the Petrinja Area (Croatia). Geol. Croat. 2022, 75, 35–49. [Google Scholar] [CrossRef]
  41. Podolszki, L.; Pollak, D.; Gulam, V.; Miklin, Ž. Development of Landslide Susceptibility Map of Croatia. In Engineering Geology for Society and Territory—Volume 2: Landslide Processes; Lollino, G., Giordan, D., Crosta, G.B., Corominas, J., Azzam, R., Wasowski, J., Sciarra, N., Eds.; Springer: Berlin/Heidelberg, Germany, 2015; Volume 2, pp. 947–950. [Google Scholar] [CrossRef] [Green Version]
  42. Braun, K. Inženjerskogeološka Karta Republike Hrvatske M 1:300.000 [Engineering–geological Map of the Republic of Croatia 1: 300,000—In Croatian]; Croatian Geological Survey: Zagreb, Croatia 1999; Unpublished internal map.
  43. Calcaterra, D.; Parise, M.; Palma, B. Combining Historical and Geological Data for the Assessment of the Landslide Hazard: A Case Study from Campania, Italy. Nat. Hazards Earth Syst. Sci. 2003, 3, 3–16. [Google Scholar] [CrossRef] [Green Version]
  44. Guzzetti, F.; Peruccacci, S.; Rossi, M.; Stark, C.P. The Rainfall Intensity—Duration Control of Shallow Landslides and Debris Flows: An Update. Landslides 2008, 5, 3–17. [Google Scholar] [CrossRef]
  45. Valenzuela, P.; José, I.M.; Antonio, D.I.M.; García, M. Rainfall Thresholds for the Triggering of Landslides Considering Previous Soil Moisture Conditions (Asturias, NW Spain). Landslides 2018, 15, 273–282. [Google Scholar] [CrossRef]
  46. Mwaniki, M.; Ngigi, T.; Waithaka, E. Rainfall Induced Landslide Probability Mapping for Central Province. In Proceedings of the Geoinformation for a Better World: Proceedings Applied Geoinformatics for Society and Environment 2011—AGSE 2011, Nairobi, Kenya, 15–19 August 2011; pp. 203–213. [Google Scholar] [CrossRef]
  47. Leyva, S.; Cruz-Pérez, N.; Rodríguez-Martín, J.; Miklin, L.; Santamarta, J.C. Rockfall and Rainfall Correlation in the Anaga Nature Reserve in Tenerife (Canary Islands, Spain). Rock Mech. Rock Eng. 2022. [Google Scholar] [CrossRef]
  48. Miklin, Ž.; Urumović, K.; Terzić, J.; Halamić, J.; Novosel, T. Engineering–geological Model of Landslide Dragodan. Zb. na Tr.—Kn. 1/Lepitkova, S.; Boev, B.—Struga Makedon. Geološko Društvo, 2016; pp. 229–237.
  49. Kosović, I.; Podolszki, L.; Pollak, D.; Gulam, V.; Bostjančić, I.; Frangen, T. Landslide Kubarnovo Brdo—Stari Put in Hrvatska Kostajnica. In Proceedings of the 6th Croatian Geological Congress with International Participation, Zagreb, Croatia, 9–12 October 2019; Excursion Guide-Book; Hrvatski Geološki Institute—Croatian Geological Survey: Zagreb, Croatia, 2019; pp. 9–11. [Google Scholar]
  50. Gulam, V.; Bostjančić, I.; Hećej, N.; Filipović, M.; Filjak, R. Preliminary Analysis of LiDAR-Based Landslide Inventory in the Area of Samobor. Geol. Croat. 2022, 75. [Google Scholar] [CrossRef]
  51. Frančula, N.; Lapaine, M.; Vucetic, N. Primjena Daljinskih Istraživanja u Kartografiji. Geod. List 1994, 48, 265–276. [Google Scholar]
  52. Miyagi, T.; Prasad, B.G.; Tanavud, C.; Potichan, A.; Hamasaki, E. Landslide Risk Evaluation and Mapping—Manual of Aerial Photo Interpretation for Landslide Topography and Risk Management—Report of the National Research Institute for Earth Science and Disaster Prevention; Japan, 2004. [CrossRef]
  53. Podolszki, L. Stereoskopska Analiza Klizišta i Relativne Opasnosti Od Klizanja Na Južnim Obroncima Medvednice [Stereoscopic Analysis of Landslides and Landslide Susceptibility on the Southern Slopes of the Medvednica Mt.—In Croatian]. Ph.D. Thesis, University of Zagreb, Zagreb, Croatia, 2014. [Google Scholar]
  54. McCalpin, J. Preliminary Age Classification of Landslides for Inventory Mapping. In Proceedings of the 21st Annual Symposium on Engineering Geology and Soil Engineering Symposium; University Press: Moscow, Idaho, 1984; pp. 99–111. [Google Scholar]
  55. Ministry of Economy and Sustainable Development of the Republic of Croatia; Utjecaji Klimatskih Promjena [Impacts of Climate Change- In Croatian]. Available online: https://prilagodba-klimi.hr/utjecaji-klimatskih-promjena/ (accessed on 17 February 2022).
  56. Luo, J.; Zheng, Z.; Li, T.; He, S. Spatial Heterogeneity of Microtopography and Its Influence on the Flow Convergence of Slopes under Different Rainfall Patterns. J. Hydrol. 2017, 545, 88–99. [Google Scholar] [CrossRef]
  57. Komori, D.; Rangsiwanichpong, P.; Inoue, N.; Ono, K. Climate Risk Management Distributed Probability of Slope Failure in Thailand under Climate Change. Clim. Risk Manag. 2018, 20, 126–137. [Google Scholar] [CrossRef]
  58. Peleikis, J.; Grätz, M.; Brnada, I. Adaptation to Climate Change in Croatia Country Brief. 2014, 1–13. Available online: https://www4.unfccc.int/sites/NAPC/Documents%20NAP/Adaptation%20Strategies%20and%20Plans/Adaptation%20to%20Climate%20Change%20in%20Croatia.pdf (accessed on 17 February 2022).
  59. Bello-Rodríguez, V.; Gómez, L.A.; Fernández López, Á.; Del-Arco-Aguilar, M.J.; Hernández-Hernández, R.; Emerson, B.; González-Mancebo, J.M. Short- and Long-Term Effects of Fire in Subtropical Cloud Forests on an Oceanic Island. Land Degrad. Dev. 2019, 30, 448–458. [Google Scholar] [CrossRef]
  60. Hendrix, C.S.; Salehyan, I. Climate Change, Rainfall, and Social Conflict in Africa. J. Peace Res. 2012, 49, 35–50. [Google Scholar] [CrossRef]
  61. Alvioli, M.; Melillo, M.; Guzzetti, F.; Rossi, M.; Palazzi, E.; von Hardenberg, J.; Brunetti, M.T.; Peruccacci, S. Implications of Climate Change on Landslide Hazard in Central Italy. Sci. Total Environ. 2018, 630, 1528–1543. [Google Scholar] [CrossRef]
  62. Perčec Tadić, M.; Gajić Čapka, M. Karta Srednje Godišnje Količine Oborine za Razdoblje 1971–2000; [Map of the average annual precipitation for the period 1971–2000]; Državni Hidrometeorloški Zavod: Zagreb, Croatia, 2010. [Google Scholar]
  63. Fowler, H.J.; Ali, H.; Allan, R.P.; Ban, N.; Barbero, R.; Berg, P.; Blenkinsop, S.; Cabi, N.S.; Chan, S.; Dale, M.; et al. Towards Advancing Scientific Knowledge of Climate Change Impacts on Short-Duration Rainfall Extremes. Philos. Trans. R. Soc. A Math. Phys. Eng. Sci. 2021, 379, 20190542. [Google Scholar] [CrossRef] [PubMed]
  64. Sipayung, S.B.; Nurlatifah, A.; Siswanto, B.; Slamet S, L. Analysis of Climate Change Impact on Rainfall Pattern of Sambas District, West Kalimantan. IOP Conf. Ser. Earth Environ. Sci. 2018, 149, 012029. [Google Scholar] [CrossRef]
  65. Dore, M.H.I. Climate Change and Changes in Global Precipitation Patterns: What Do We Know? Environ. Int. 2005, 31, 1167–1181. [Google Scholar] [CrossRef] [PubMed]
  66. Skempton, A.W. The Pore-Pressure Coefficient in Saturated Soils. Géotechnique 1960, 10, 186–187. [Google Scholar] [CrossRef]
  67. Gao, Q.F.; Zeng, L.; Shi, Z.N. Effects of Desiccation Cracks and Vegetation on the Shallow Stability of a Red Clay Cut Slope under Rainfall Infiltration. Comput. Geotech. 2021, 140, 104436. [Google Scholar] [CrossRef]
  68. Zhang, J.M.; Luo, Y.; Zhou, Z.; Chong, L.; Victor, C.; Zhang, Y.F. Effects of Preferential Flow Induced by Desiccation Cracks on Slope Stability. Eng. Geol. 2021, 288, 106164. [Google Scholar] [CrossRef]
  69. Tichavský, R.; Antonio Ballesteros-Cánovas, J.; Šilhán, K.; Tolasz, R.; Stoffel, M. Dry Spells and Extreme Precipitation Are the Main Trigger of Landslides in Central Europe. Sci. Rep. 2019, 9, 14560. [Google Scholar] [CrossRef]
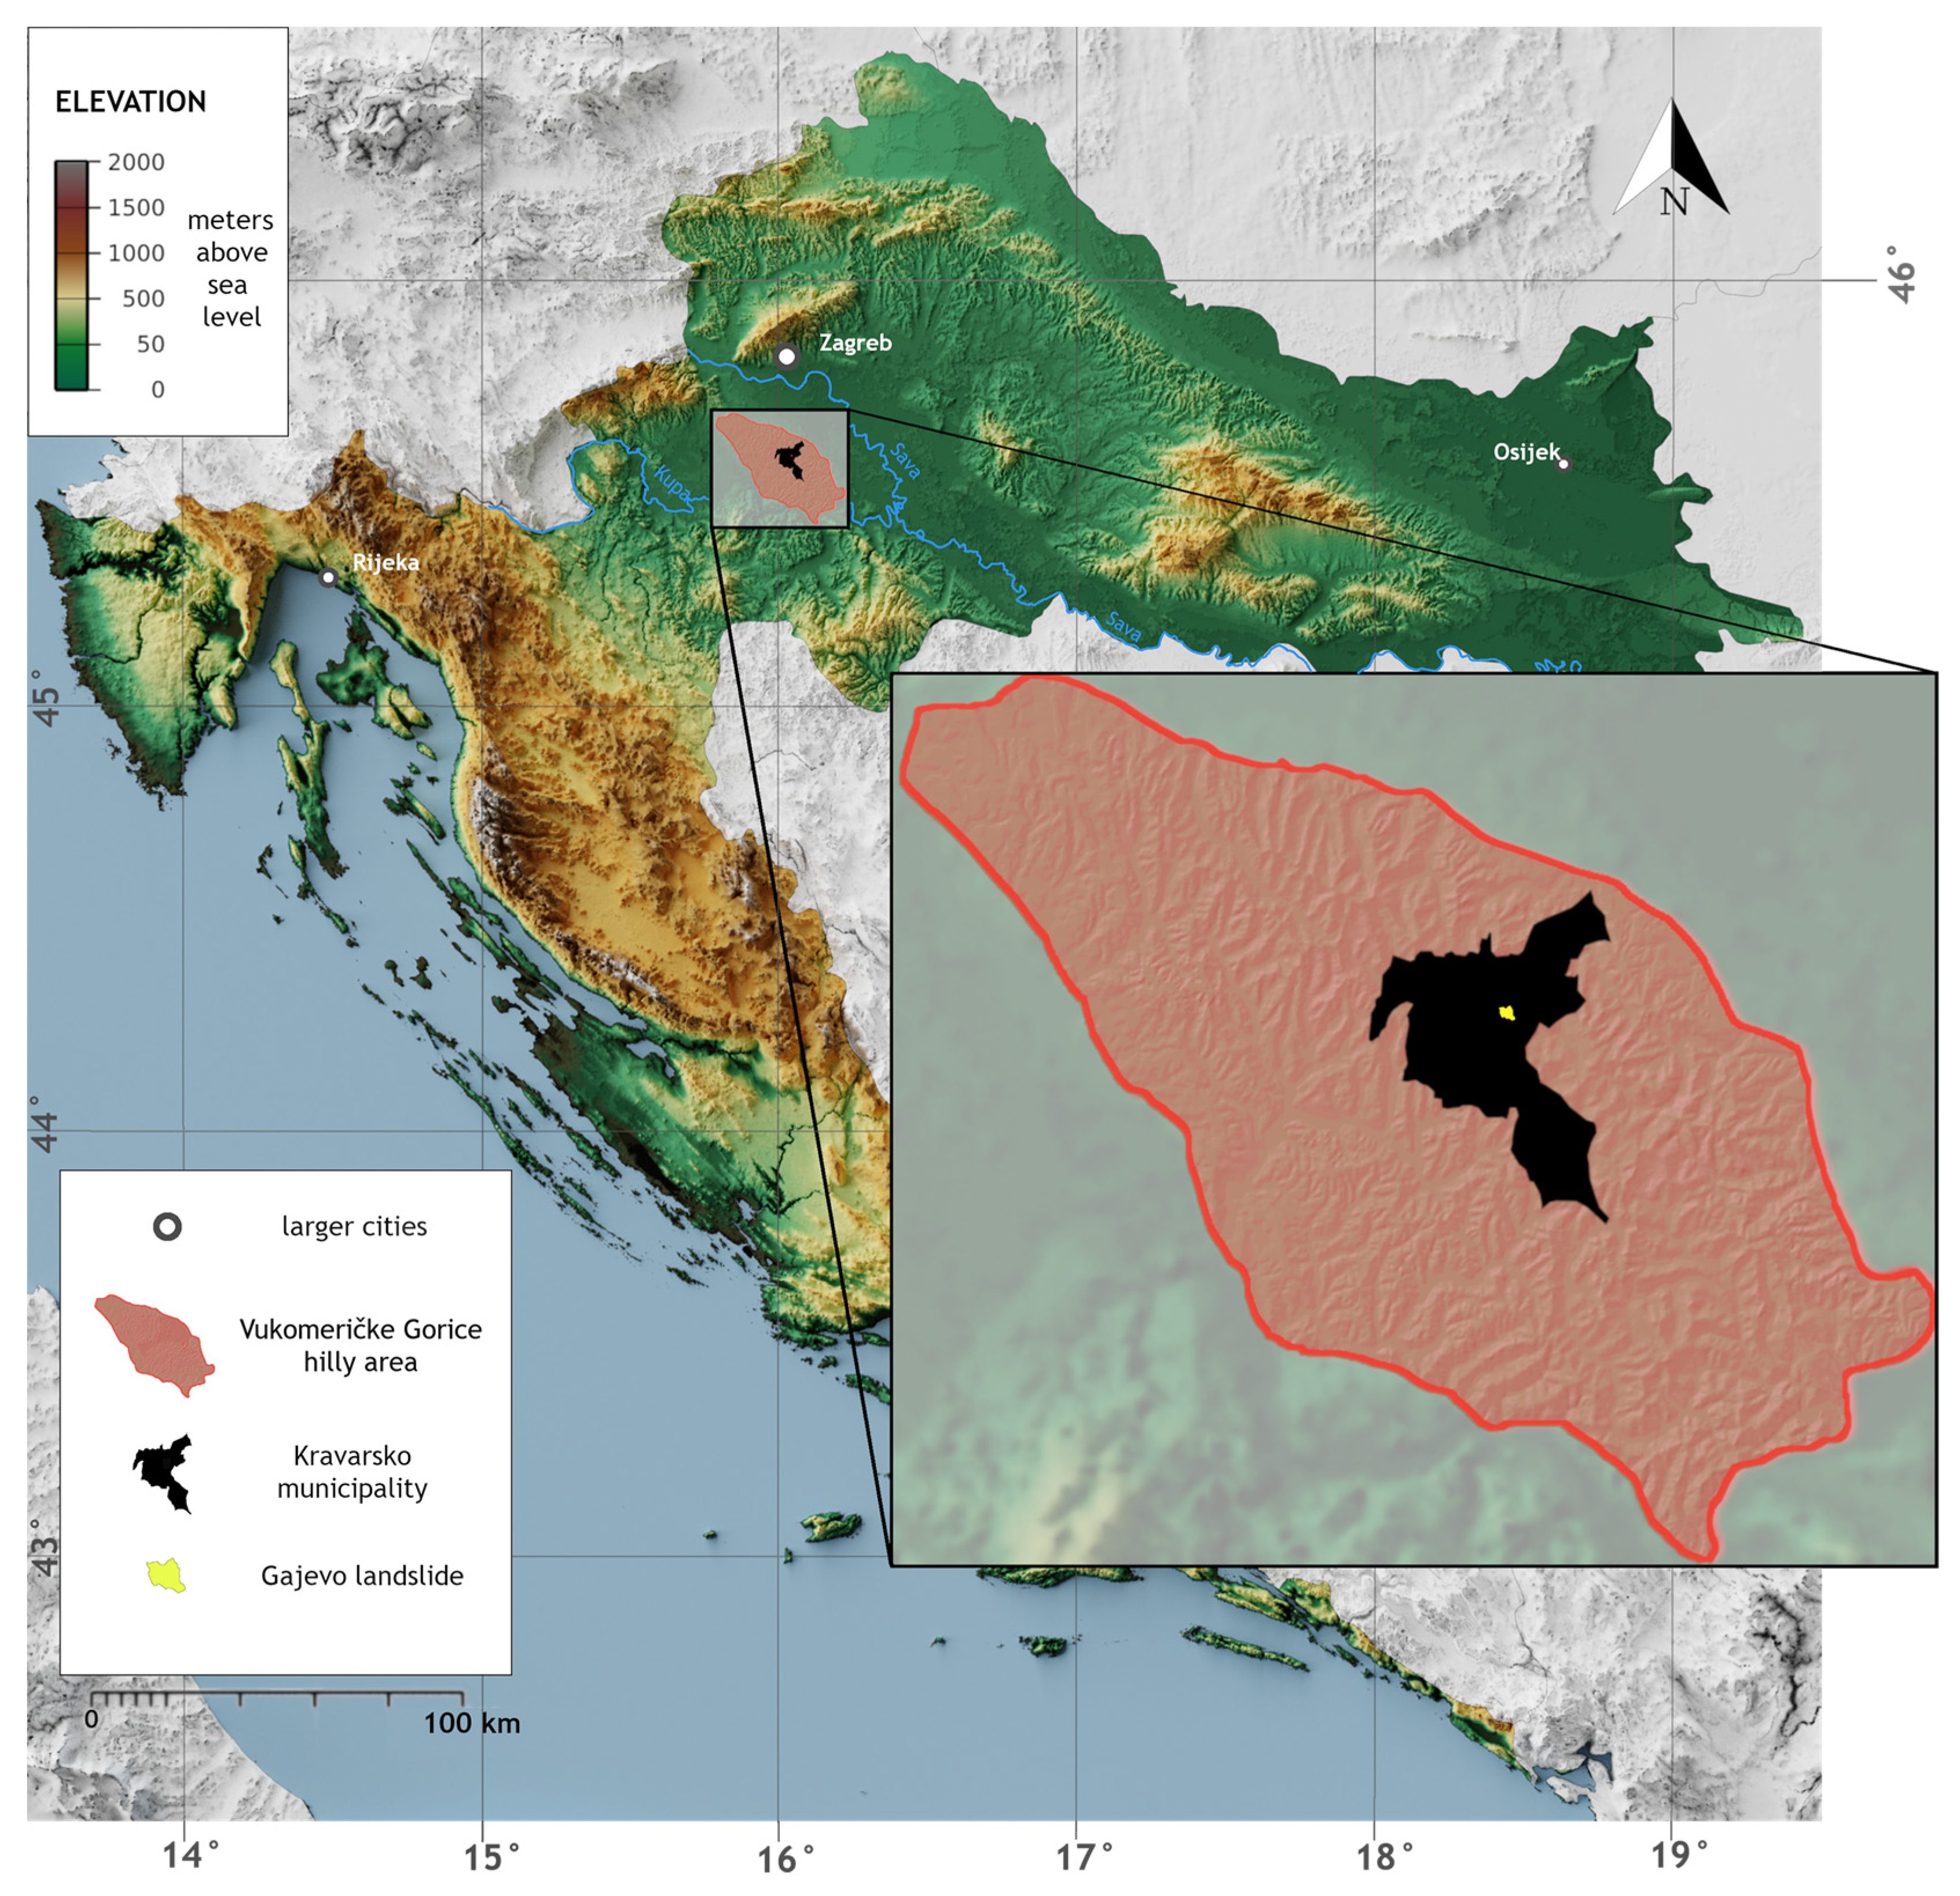
Figure 1. Relief map of Croatia with the geographical position of the investigated area between Sava and Kupa valleys; Vukomeričke Gorice hilly area (red polygon), Kravarsko municipality (black polygon), and Gajevo landslide (yellow polygon).
Remotesensing 14 01794 g001
Figure 2. Historical orthophotos and development of the research area (Gajevo landslide): (a) Gajevo area in 1968 with croplands and forests; (b) Gajevo area in 2011 with houses but without visible landslide features; (c) visible landslide in 2014, with marked “fresh” major cracks (blue arrows), road embankment (blue polygon) and damaged object in the landslide body (red polygon); (d) landslide area in 2018, where the cracks are masked by vegetation; and (e) landslide area in 2020, where the damaged object in the landslide body is removed (red polygon).
Remotesensing 14 01794 g002
Figure 3. Comparison of developed “cabinet” maps based on data obtained by remote sensing. The picture marked with (a) shows an orthophoto from 2018 from which land cover and the area affected by the landslide were determined. The map marked with the letter (b) shows a combination of detailed hillshade, terrain slope model, and the morphology of the terrain without buildings and visible vegetation. This model was used as a basis for remote mapping of the area affected by the landslide as the scars formed during sliding are visible on the terrain model and can be identified; (c) orthophoto with the generated 1 m contour lines (developed from the detailed digital elevation model (DEM), which was used in landslide cross-section development); (d) orthophoto of increased transparency, on which the Gajevo landslide and other smaller landslides in its vicinity are marked. The remote mapping was based on high-resolution DEMs, orthophotos, and the developed 1 m contour line topography map.
Remotesensing 14 01794 g003
Figure 4. Detail from the Basic Geological Map of Yugoslavia at the scale of 1:100,000 (Sheet Sisak with Guide) [24,25]: the wider area is in Viviparus beds represented with an interbedded mixture of Pliocene sands, gravels, clays, conglomerates, and sandstones. Landslides are also indicated in the wider area (marked with red lines with arrow), and the Gajevo landslide area is marked (red polygon). Degrees, minutes and seconds are marked on the outside of the data frame (map). Still as in Croatia the official spatial reference in use is HTRS96 Croatia TM the coordinates marked by easting and northing are also given, but inside the data frame (map).
Remotesensing 14 01794 g004
Figure 5. Orthophoto map with terrain morphology, marked field observation points (red dots: T.1 to T.24), deformation measurement points (green dots: D1, D2, D3, D4a, and D4d), and house numbers (orange markings). Houses at the landslide crown area are still endangered by the Gajevo landslide. Spatial reference is given in degrees, minutes and seconds and in HTRS96 Croatia TM.
Remotesensing 14 01794 g005
Figure 6. Gajevo landslide area: (a) view to the east part of the landslide from T.20 observation point; (b) landslide crown from T.10 observation point with damage “right under” the houses; (c) view of the endangered houses from T.12/T.24 observation points (from the location of the collapsed object); (d) view to the north from T.20 observation point; (e) crack measurements on D3 measurement point in October 2019 and March 2020; (f) Koravec creek located under the landslide toe (T.22). Some details are highlighted: White lines mark the “shifted” stairs, the blue line marks the well (with water on the terrain level) and orange lines mark the collapsed wall (photos from field mapping by Croatian Geological Survey from October 2019, March, and July 2020).
Remotesensing 14 01794 g006
Figure 7. Map of the average annual precipitation for the period from 1971 to 2000 for Croatia. Relevant meteorological stations for the research area are Pisarovina (1), Zagreb-Pleso airport (2), Sisak (3), Kravarsko (4) [23,62].
Remotesensing 14 01794 g007
Figure 8. Precipitation data from meteorological station Kravarsko and temperature data from Zagreb-Pleso airport meteorological station with a linear representation: the data indicate a slow increase in temperature and precipitation from 2000 to 2020. The black arrow indicates the activation time of the Gajevo landslide (2014), and the yellow arrow shows the (high value of) precipitation amplitude (Source: Croatian Meteorological and Hydrological Service).
Remotesensing 14 01794 g008
Figure 9. Gajevo landslide engineering–geological map. Spatial reference is given in degrees, minutes and seconds and in HTRS96 Croatia TM.
Remotesensing 14 01794 g009
Figure 10. Gajevo landslide engineering–geological cross-section.
Remotesensing 14 01794 g010
Figure 11. Orthophoto map and detailed DEM with visible smaller landslides/deformations within the area of the initial landslide. The blue area is directly endangered by Gajevo landslide: the crown and the head scarp area. Spatial reference is given in degrees, minutes and seconds and in HTRS96 Croatia TM.
Remotesensing 14 01794 g011
Figure 12. Photography of the “surface” water line and location of the first four observation points (T.1–T.4). Surface water drainage from the road embankment is also ongoing by the surface canal (by T.4), which is not a viable solution as the gathered water content ends up in the landslide body.
Remotesensing 14 01794 g012
Figure 13. The average monthly precipitation data from meteorological station Kravarsko and temperature data from meteorological station Zagreb-Pleso airport from 2011 to 2014. An emphasis is placed on changes in temperature in winter months (orange markings, full line) when higher temperatures were accompanied by high precipitation values—for example February 2014 (Source: Croatian Meteorological and Hydrological Service).
Remotesensing 14 01794 g013
Table 1. Precipitation at relevant meteorological stations (MSs) shows the increased amount of precipitation in 2013 and 2014 in the wider research area (City of Zagreb—CZ, Zagreb County—ZC, Sisačko-moslovačka County—SMC) and in the research area (Kravarsko area in Zagreb County—ZC); see also Figure 7 (Source: Croatian Meteorological and Hydrological Service).
YEAR OF MEASUREMENTMETEOROLOGICAL STATIONS (MSs)
Pisarovina MS
ZC (mm)
Zagreb-Pleso Airport MS CZ (mm)Sisak MS SMC (mm)Kravarsko MS ZC (mm)
2012949853811728
2013133111501072966
20141634146014511601
2015106293510031047
2016103597410241107
20179379229391001
2018871968924980
20191226105410961234
2020917959761917
Publisher’s Note: MDPI stays neutral with regard to jurisdictional claims in published maps and institutional affiliations.