Article

The August 2019 Piton de la Fournaise (La Réunion Island) Eruption: Analysis of the Multi-Source Deformation Pattern Detected through Sentinel-1 DInSAR Measurements

1
Istituto per il Rilevamento Elettromagnetico dell’Ambiente, IREA-CNR, 80124 Napoli, Italy
2
Dipartimento di Scienze della Terra, Sapienza Università di Roma, 00185 Rome, Italy
*
Author to whom correspondence should be addressed.
Remote Sens. 2022, 14(7), 1762; https://doi.org/10.3390/rs14071762
Submission received: 24 February 2022 / Revised: 31 March 2022 / Accepted: 4 April 2022 / Published: 6 April 2022
(This article belongs to the Special Issue Geodetic Observations for Earth System)

Abstract

:
Piton de la Fournaise is one of the most active worldwide volcanoes, located on the southeastern part of La Réunion Island. In this work, we focus on the eruption that occurred on the southeastern flank of this volcano, inside the Enclos Fouqué caldera, from 11 to 15 August 2019. This distal event was characterized by the opening of two eruptive fissures and accompanied by shallow volcano–tectonic earthquakes. We exploit the ground displacements using Sentinel-1 Differential Interferometric Synthetic Aperture Radar (DInSAR) measurements, which include the ground deformations generated during both the pre- and co-eruptive phases. To investigate the sources responsible for the detected ground displacements, we perform an analytical modeling of the retrieved DInSAR measurements. Our results reveal the presence of five volcanic sources (i.e., one sill-like source and four dikes), whose concomitant action during the pre- and co-eruptive phases generated the complex detected deformation pattern. The retrieved volcanic sources correlate well with the location of the opened fissures, the spatial distribution and the temporal evolution of the recorded seismicity, and other geophysical evidence already known in the literature.

Graphical Abstract

1. Introduction

Volcano monitoring and the related hazard assessment represent an important goal within the scope of modern geophysical research [1,2,3,4]. When the intrusion and/or the propagation of magma can provoke surficial ground displacements, earthquakes’ nucleation, and gas emission, it is possible to monitor the associated precursory phenomena. These precursory phenomena can occur at different times (from minutes to months) and space scales [5,6,7]. We can use the observed ground deformations to retrieve the main characteristics of a magmatic source (i.e., its location, depth, and volume change) by applying inversion techniques [8,9]. Satellite geodesy, such as Differential Interferometry Synthetic Aperture Radar (DInSAR) and Global Navigational Satellite System (GNSS), represents the most widely used tools in the surveillance of worldwide active volcanoes [10,11,12,13].
Piton de la Fournaise is a hot-spot basaltic volcano located on the southeastern part of La Réunion Island and inserted in the tectonic framework of the Indian Ocean [14,15,16,17] (Figure 1a–c). Thanks to the establishment of the Observatoire Volcanologique du Piton de la Fournaise (OVPF) in 1980, this volcano has been extensively studied by using and integrating geological, petrological, geochemical, geodetic, and geophysical monitoring approaches [17,18,19,20].
More than 150 eruptions have occurred at Piton de la Fournaise since the 17th century. From 1998 to 2007, the eruptive activity of this volcano has been characterized by continuous refilling of the plumbing system and short-term eruptive cycles, which usually culminated in distal eruptions. An important eruptive event occurred from 30 March to 1 May 2007, provoking a substantial change in the volcano’s behavior. During this distal eruption, a large volume of lava was emitted, the Dolomieu summit crater collapsed, and the upper reservoir and distribution system were destroyed [21,22]. Between 2008 and 2010, only low-volume summit or near-summit eruptions, and many intrusions occurred. This period was followed by a quiescent phase between 2011 and June 2014; another stage of nearly high activity began in July 2014 [17,23]. Moreover, between February and October 2019, an intense volcanic activity revealed with five eruptive episodes (Figure 1d).
This study is focused on the fourth eruption that happened in 2019 and, specifically, on the distal event that occurred from 11 to 15 August on the southeastern flank of the volcano inside the Enclos Fouqué caldera (Figure 1c). During the pre- and co-eruptive phases, this event was accompanied by gas emissions and shallow volcano-tectonic earthquakes recorded by the seismic network of the OVPF [24]. This distal eruption was characterized by the opening of two eruptive fissures, located at 1500 and 1700 m a.s.l., that were active on 11 and 12 August and from 11 to 15 August, respectively (Figure 1c). Lavas’ flows, erupted from these fractures, reached a maximum length of 2.7 and 2.9 km, respectively; the flow from the lowest fracture stopped about 2 km from the road. The OVPF estimated that about 3 × 10⁶ m3 of lava have been erupted during this fourth eruption [24].
In this work, we investigate the ground deformations caused by the eruptive activity, by exploiting the Differential Synthetic Aperture Radar Interferometry (DInSAR) measurements obtained by processing the data collected by the Sentinel-1 (S1) satellite of the Copernicus European Program along ascending and descending orbits. Moreover, we perform an analytical modeling of the retrieved DInSAR displacements to infer the volcanic source/s responsible for the pre- and co-eruptive deformation field. We verify our modeling results by a comparison with the spatial-temporal distribution of the recorded seismicity.

2. Geological Setting and Eruptive History

La Réunion Island, located east of Madagascar (SW Indian Ocean; Figure 1a), is characterized by a NW–SE-trending elliptical shape (Figure 1b). It is inserted in the large-scale geodynamic environment of the Indian Ocean and in the complex tectonic setting of the Marscarene Basin, generated by the oceanic expansion that occurred between the late Cretaceous and the Paleocene [15]. Several authors [14,15,16,25] agree in attributing a hot-spot origin to La Réunion volcanism.
The emerged part of the island corresponds to a small portion (about 4%) of the entire volcanic edifice, which presents a basal diameter of about 240 km and reaches more than 7000 m above the abyssal plain [15]. La Réunion Island can be considered the result of the overlap of two large basaltic shield-volcanoes, Piton des Neiges and Piton de la Fournaise (Figure 1b). Piton des Neiges (about 3070 m.a.s.l.), representing about two-thirds of La Réunion, is an extinct volcano located in the northwestern part of the island. Its volcanic activity began more than 2.4 million years ago [26,27] and terminated about 22,000 years ago [28,29]. Volcano–tectonic processes and intense tropical erosion led to the formation of deeply incised valleys and three major depressions (cirques of Mafate, Salazie and Cilaos) [29,30].
The southeastern part of La Réunion Island is occupied by the highly active Piton de la Fournaise. Geochemical analyses have confirmed that this volcano mainly generates basaltic lava flows and fountains with occasional phreatic and phreatomagmatic explosions and have suggested that its eruptive activity began about 450,000 years ago on the relics of an older volcano called Les Alizés [31,32,33,34]. From the beginning, Piton de la Fournaise has experienced several cycles of building phases, caldera collapses, and intense erosion. The most peculiar topographic element of the Piton de la Fournaise volcano is a steep, east-facing, u-shaped collapse structure that extends about 8 km N–S and 13 km W–E and is called Enclos Grand Brûlé. Its upper part is better known as the Enclos Fouqué caldera and seems to be the result of one or more vertical collapses; the upper slopes are known as the Grandes Pentes and the lower slopes as the Grand Brûlé, both affected by lateral flank failure that occurred about 4500 years ago [32,35]. The Enclos Fouqué caldera hosts the currently active volcanic center, a 400-m-high central cone with two deep summit craters, Bory and Dolomieu. Most historical eruptions have originated from the summit and flanks of the latter one (Figure 1c).

3. DInSAR Measurements and Seismological Data

We employed both DInSAR measurements and seismological data to infer the source/s responsible for the ground displacements observed during the analyzed eruption (11–15 August 2019).

3.1. DInSAR Measurements

We used the Differential SAR Interferometry (DInSAR) technique [36,37] to retrieve the ground displacements associated with this volcanic eruption. Thanks to the short revisit time (i.e., 12 days in this zone of the southern hemisphere) and the small spatial baseline separation of the Sentinel-1 (S1) acquisitions, we achieved a good spatial coverage and interferometric coherence.
We generated the line-of-sight (LOS) interferograms by selecting the interferometric pairs less affected by undesired phase artifacts, such as atmospheric phase delays and decorrelation noise. The employed S1 data were acquired on 2 and 14 August 2019 (Figure 2a) along the ascending orbit (ASC) and on 3 and 15 August 2019 (Figure 2b) along the descending orbits (DESC; Table 1). Several fringes located in the analyzed volcanic area are clearly visible on the generated interferograms (Figure 2a,b); each fringe represents a deformation estimated along the satellite LOS of approximately 2.8 cm for S1 data, corresponding to half of the C-band wavelength (i.e., λ = 5.56 cm).
The second step consisted of an appropriate phase unwrapping operation that allowed the generation of the corresponding LOS displacement maps (Figure 2c,d) [38,39]. We also used the SRTM (Shuttle Radar Topography Mission) DEM (Digital Elevation Model) of the investigated volcanic area [40]. Because of the 12-day temporal baseline, the processed S1 interferograms include the ground deformations generated during both the pre- and co-eruptive phases.
Both the retrieved ascending and descending DInSAR displacement maps show complex deformation pattern associated with this eruptive event that extended within the Enclos Fouqué caldera. In particular, the ascending map presents a bilobed deformation pattern in correspondence of the summit area characterized by positive values up to about +19 cm; on the southeastern flank, a deformation pattern is clearly visible and reaches negative values down to −23 cm (Figure 2c). The descending displacement maps show a curved deformation pattern characterized by positive values up to about +38 cm located at the summit area and along the southeastern flank; furthermore, north of the summit area, we measured negative values down to about −8 cm (Figure 2d). We remark that the measured negative values indicate a sensor-to-target distance increase, whereas the measured positive values highlight a sensor-to-target distance decrease. The observed LOS displacements can indicate both vertical (i.e., subsidence or uplift) and horizontal (East-West) motions.
Subsequently, by properly combining the retrieved LOS displacement maps reported in Figure 2c,d, we computed the vertical and horizontal displacements [41]. The vertical component map highlights a main uplift located both in the summit sector and along the southeastern flank of the volcano, reaching maximum values of about 36 cm; moreover, two minor subsiding areas are clearly visible north of the main craters and along the southeastern flank, where they reach values of about 13 cm (Figure 2e). In addition, the east-west component map shows a prevailing motion of the eastern flank toward the east (i.e., toward the Indian Ocean) up to 42 cm; on the other hand, a maximum value of 8 cm was measured for the westward motion of the western flank (Figure 2f).

3.2. Seismological Data

Several works have been focused on the relationship between earthquakes and volcanic eruptions with the aim of monitoring the volcano state, behavior, and activity, of forecasting eruptions, and of identifying the location of the main involved sources [42,43,44]. For this reason, it is fundamental to analyze the epicentral and hypocentral distributions as well as the temporal evolution of the recorded seismicity.
In this section, we analyze the seismicity distribution (i.e., epicentral and hypocentral distribution of the occurred earthquakes) to recognize the activated structure/s and to try to furnish further constraints to our modeling analysis that will be presented in the following section (data courtesy of the OVPF). We consider 70 volcano-tectonic earthquakes, with a magnitude range between −0.024 and 1.96, recorded by the seismic network of the OVPF from 2 to 15 August 2019 (Figure 3a–c).
During the pre-eruptive phase, from 2 to 10 August 2019, earthquakes were distributed under the main Dolomieu crater with magnitudes included between −0.024 and 1.96. These events were very surficial and were located at about sea level (Figure 3d–f).
From 11 (the day in which the eruption began) to 15 August, very shallow earthquakes continued to nucleate in correspondence of the Dolomieu crater at sea level depth, with magnitudes between 0.26 and 1.34. Some seismic events nucleated along the southeastern flank, showing a clear alignment along a plane dipping towards the sea (Figure 3g–i). These last earthquakes had magnitudes between 0.47 and 1.7 and depths between 1600 m.a.s.l. and 1500 m.b.s.l.

4. Analytical Modeling

We jointly inverted the retrieved S1 DInSAR ascending and descending displacements, searching for best-fit sources. We employed well-known analytical solutions (i.e., sphere, dislocations) inserted in a homogeneous, isotropic, elastic half-space (with a correction for the topography that properly reproduced the retrieved ground deformations). In particular, we applied a consolidated two-step approach, consisting of a non-linear optimization to constrain the source geometry, followed by a linear inversion to retrieve the opening distribution on the retrieved volcanic source/s [45]. The performed modeling procedure was carried out through the SARscape® modeling module (https://www.l3harrisgeospatial.com/Software-Technology/ENVI-SARscape). We applied a correction for the topography to refer the source depth to the actual ground surface [46], and we also assessed possible orbital offsets and ramps affecting the DInSAR measurements. To reduce the computational cost, we down sampled the DInSAR displacements to a 90 m regular grid; therefore, the inversion was performed by using 11,758 measurements (pixels). The non-linear inversion algorithm combines the Levenberg–Marquardt (LM) least-squares approach for local minimums of the cost function [47], with multiple random searches. This approach makes possible to catch the global minimum during the optimization process.
The initial non-linear inversions were performed by considering two sources, one located under the main crater and one along the southeastern flank, since the measured deformation pattern can be explained only by the concomitant action of several deformation sources. Since this relatively simple model could not reproduce the measured deformation pattern, we introduced additional sources in our modeling. In particular, we gradually increased the number of the volcanic sources by firstly considering two sources (i.e., one sill-like source and one dike), and then three sources (i.e., one sill-like source and two dikes), and four sources (i.e., one sill-like source and three dikes) (Figure S1). The preferred, final model represents the result of the gradual insertion of eruptive sources and shows that the observed deformation pattern by the concomitant action of five volcanic sources, consisting of one sill-like source and four dikes (hereinafter named D1, D2, D3, and D4). Note that we used an opening horizontal dislocation to simulate the action of a sill-like source located under the main Dolomieu crater [48]. Most of the parameters were set free to float, apart from the dip (set at 0°) and the location (i.e., center East, center North and top depth), which were constrained by the hypocentral distribution of the recorded seismicity and by taking into account the already known geophysical evidence [21,49,50,51]. The rake and the slip parameters of the sill-like source were set at 0° and 0 m, respectively. We used a dislocation source [48] to model the dike D1. Most of the parameters for D1 were set free to float, with the exception of the location (i.e., center East, center North and top depth) which was constrained by the eruptive fissures opened during the volcanic eruption. Finally, to model the D2, D3, and D4 eruptive sources, we employed dislocation sources [48] for which all source parameters were set free to float.
The results of the non-linear inversion are reported in Figure 4, where we show the LOS-projected original (Figure 4a,b) and modelled (Figure 4c,d) DInSAR measurements, as well as their residuals (Figure 4e,f), obtained as the difference between the original and the modelled data; the best-fit parameters of each retrieved source are also reported (Figure 4g and Figures S2–S6).
Subsequently, starting from the parameters retrieved from the previous non-linear inversion, we performed a linear inversion process to compute the non-uniform opening distribution along the sources’ planes. The sill and dikes dimensions (i.e., length and width) were increased to reduce the border effects, and all the planes were divided into patches of 0.1 km × 0.1 km. The final non-uniform opening distribution over the modelled volcanic sources reaches a maximum value of about 1.7 m (Figure 5).

5. Discussion

The interpretation and inversion of the DInSAR measurements retrieved from S1 acquisitions allowed us to infer the activation of a sources system due to the magma propagation, and to better understand the dynamic of the August 2019 distal eruption at the Piton de la Fournaise volcano.
The S1 DInSAR measurements highlight a complex deformation pattern generated by the eruptive event. The S1 interferograms, characterized by a 12-day temporal baseline, include the ground deformations generated during both the pre- and co-eruptive phases. Due to the position of the island in the southern hemisphere, there are no acquisitions with a shorter temporal baseline (i.e., 6 days) and, therefore, it has not been possible to distinguish between pre- and co-eruptive deformations.
Our modeling results indicate that the detected deformation pattern can be explained by the pressurization of one sill-like source and the opening of four dikes. The sill-like source is located below the main Dolomieu crater, approximately at sea level. Its existence is also verified by several geophysical evidence, such as seismicity distribution, seismic heterogeneities, and resistivity anomalies [21,49,50,51,52,53]. Note also the presence of an eruptive dike (i.e., D4) under the main crater that intersects the sill-like source. We suggest that part of the deformation measured in the crateric zone was generated by the retrieved sources during the pre-eruptive phase and could be attributed to a recharge phase of the surficial magmatic reservoir. The opening distribution along the D4 dike plane could simulate a magma rise from a deeper magma reservoir towards the surface (Figure 5). These findings agree with several studies focused on previous distal eruptions that occurred at Piton de la Fournaise [51,54,55,56]. Some studies have highlighted the presence of a deeper magma reservoir continuously recharging the smaller surficial reservoir [53,57,58]. Furthermore, our retrieved volcanic sources agree with the hypocentral distribution of the earthquakes that occurred during the pre-eruptive phase (i.e., from 2 to 10 August 2019; Figure 5).
We suggest that most of the measured ground deformation is compatible with the activity of the identified eruptive dikes (i.e., D1, D2, D3). In particular, the location of the D1 dike is in very good agreement with the position of the eruptive fissures that opened on the southeastern flank of the volcano. It is possible to identify two lobes along the plane of D1 where the opening distribution reaches the highest values (i.e., about 1 m), in correspondence of the areas where the eruptive fissures opened.
The number and the geometrical characteristics of the retrieved sources imply that the magma intrusion may have encountered pre-existing structures (i.e., D1, D2, and D3) along its path from the reservoir to the surface. The flowing magma moved along existing fractures to reach the ground surface, thus generating the distal eruption. A similar mechanism occurred during the March–April 2007 eruptive distal activity [53].
The performed modeling also highlighted that the eruptive dikes are characterized by both opening and slip (i.e., shear along the dikes plane). The retrieved slip values can justify the measured horizontal component (see Figure 2f), which shows a clear eastward motion of the volcano’s eastern flank with maximum values of 42 cm.
Several studies have highlighted that the eastern flank of the volcano is affected by an instability process. Sigmundsson et al. [59] proposed that the occurrence over time of distal eruptions and the consequent accumulation of deformation along the eastern flank of the volcano have led to the instability of this flank. The stress rate related to magmatism, the presence of pre-existing structural discontinuities, and/or active faults could contribute to the flank mobility [52,60,61]. Moreover, this instability is also favored by a spreading of the volcano edifice; the growing of the Piton de la Fournaise volcano at the eastern flank of Piton des Neiges implies that the direction of its spreading is oriented towards its unsupported eastern flank [62].
We suggest that the instability of the eastern flank influences the dike kinematics, implicating that they can be affected by both opening and slip along their planes. Moreover, we think that part of the residuals estimated along the eastern flank can be attributed to the abovementioned instability.

6. Conclusions

In this work, we have investigated the distal eruption that occurred from 11 to 15 August 2019 on the southeastern flank of the Piton de la Fournaise volcano inside the Enclos Fouqué caldera. To this purpose, we first exploited the DInSAR measurements obtained by processing the SAR data acquired by the Sentinel-1 satellites along ascending and descending orbits. Then, we performed an analytical modeling of the computed coseismic DInSAR displacements to infer the sources responsible for the detected deformation pattern and analyzed these findings against the seismological data recorded by the seismic network of the OVPF.
Our main findings can be summarized as follows:
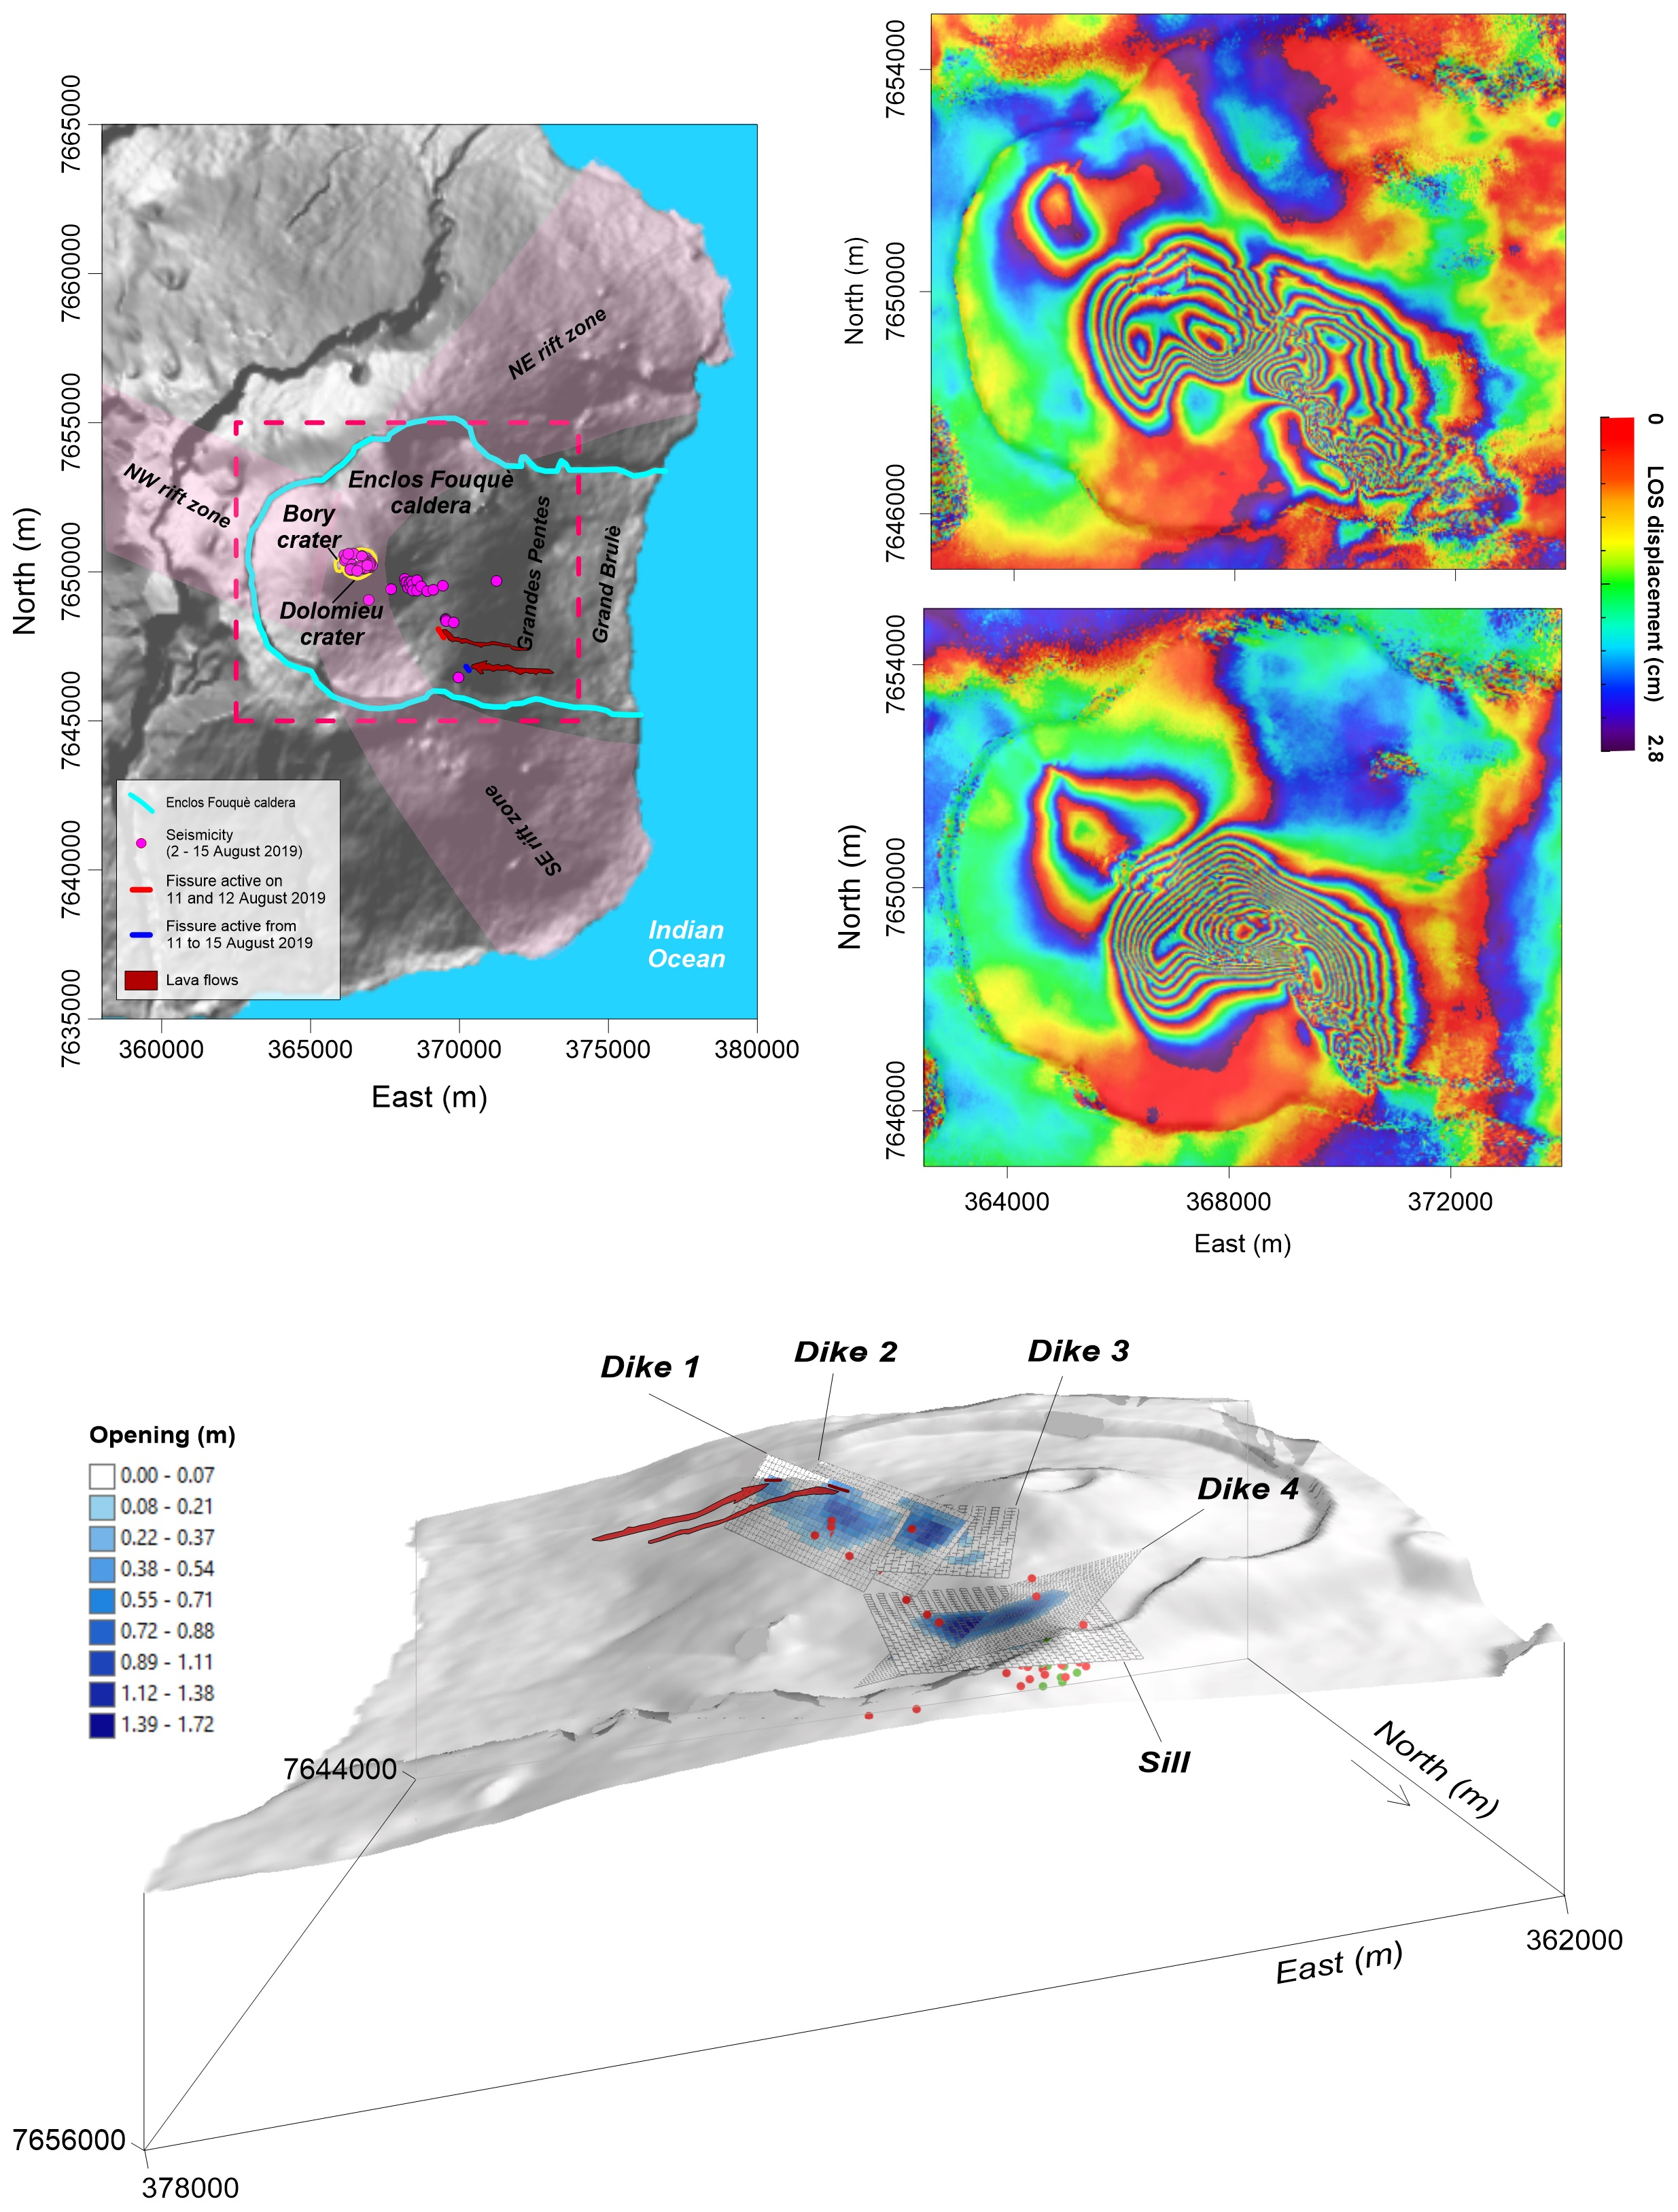
  • The DInSAR measurements highlight a complex deformation pattern, which includes the ground displacements generated during both the pre- and co-eruptive phases.
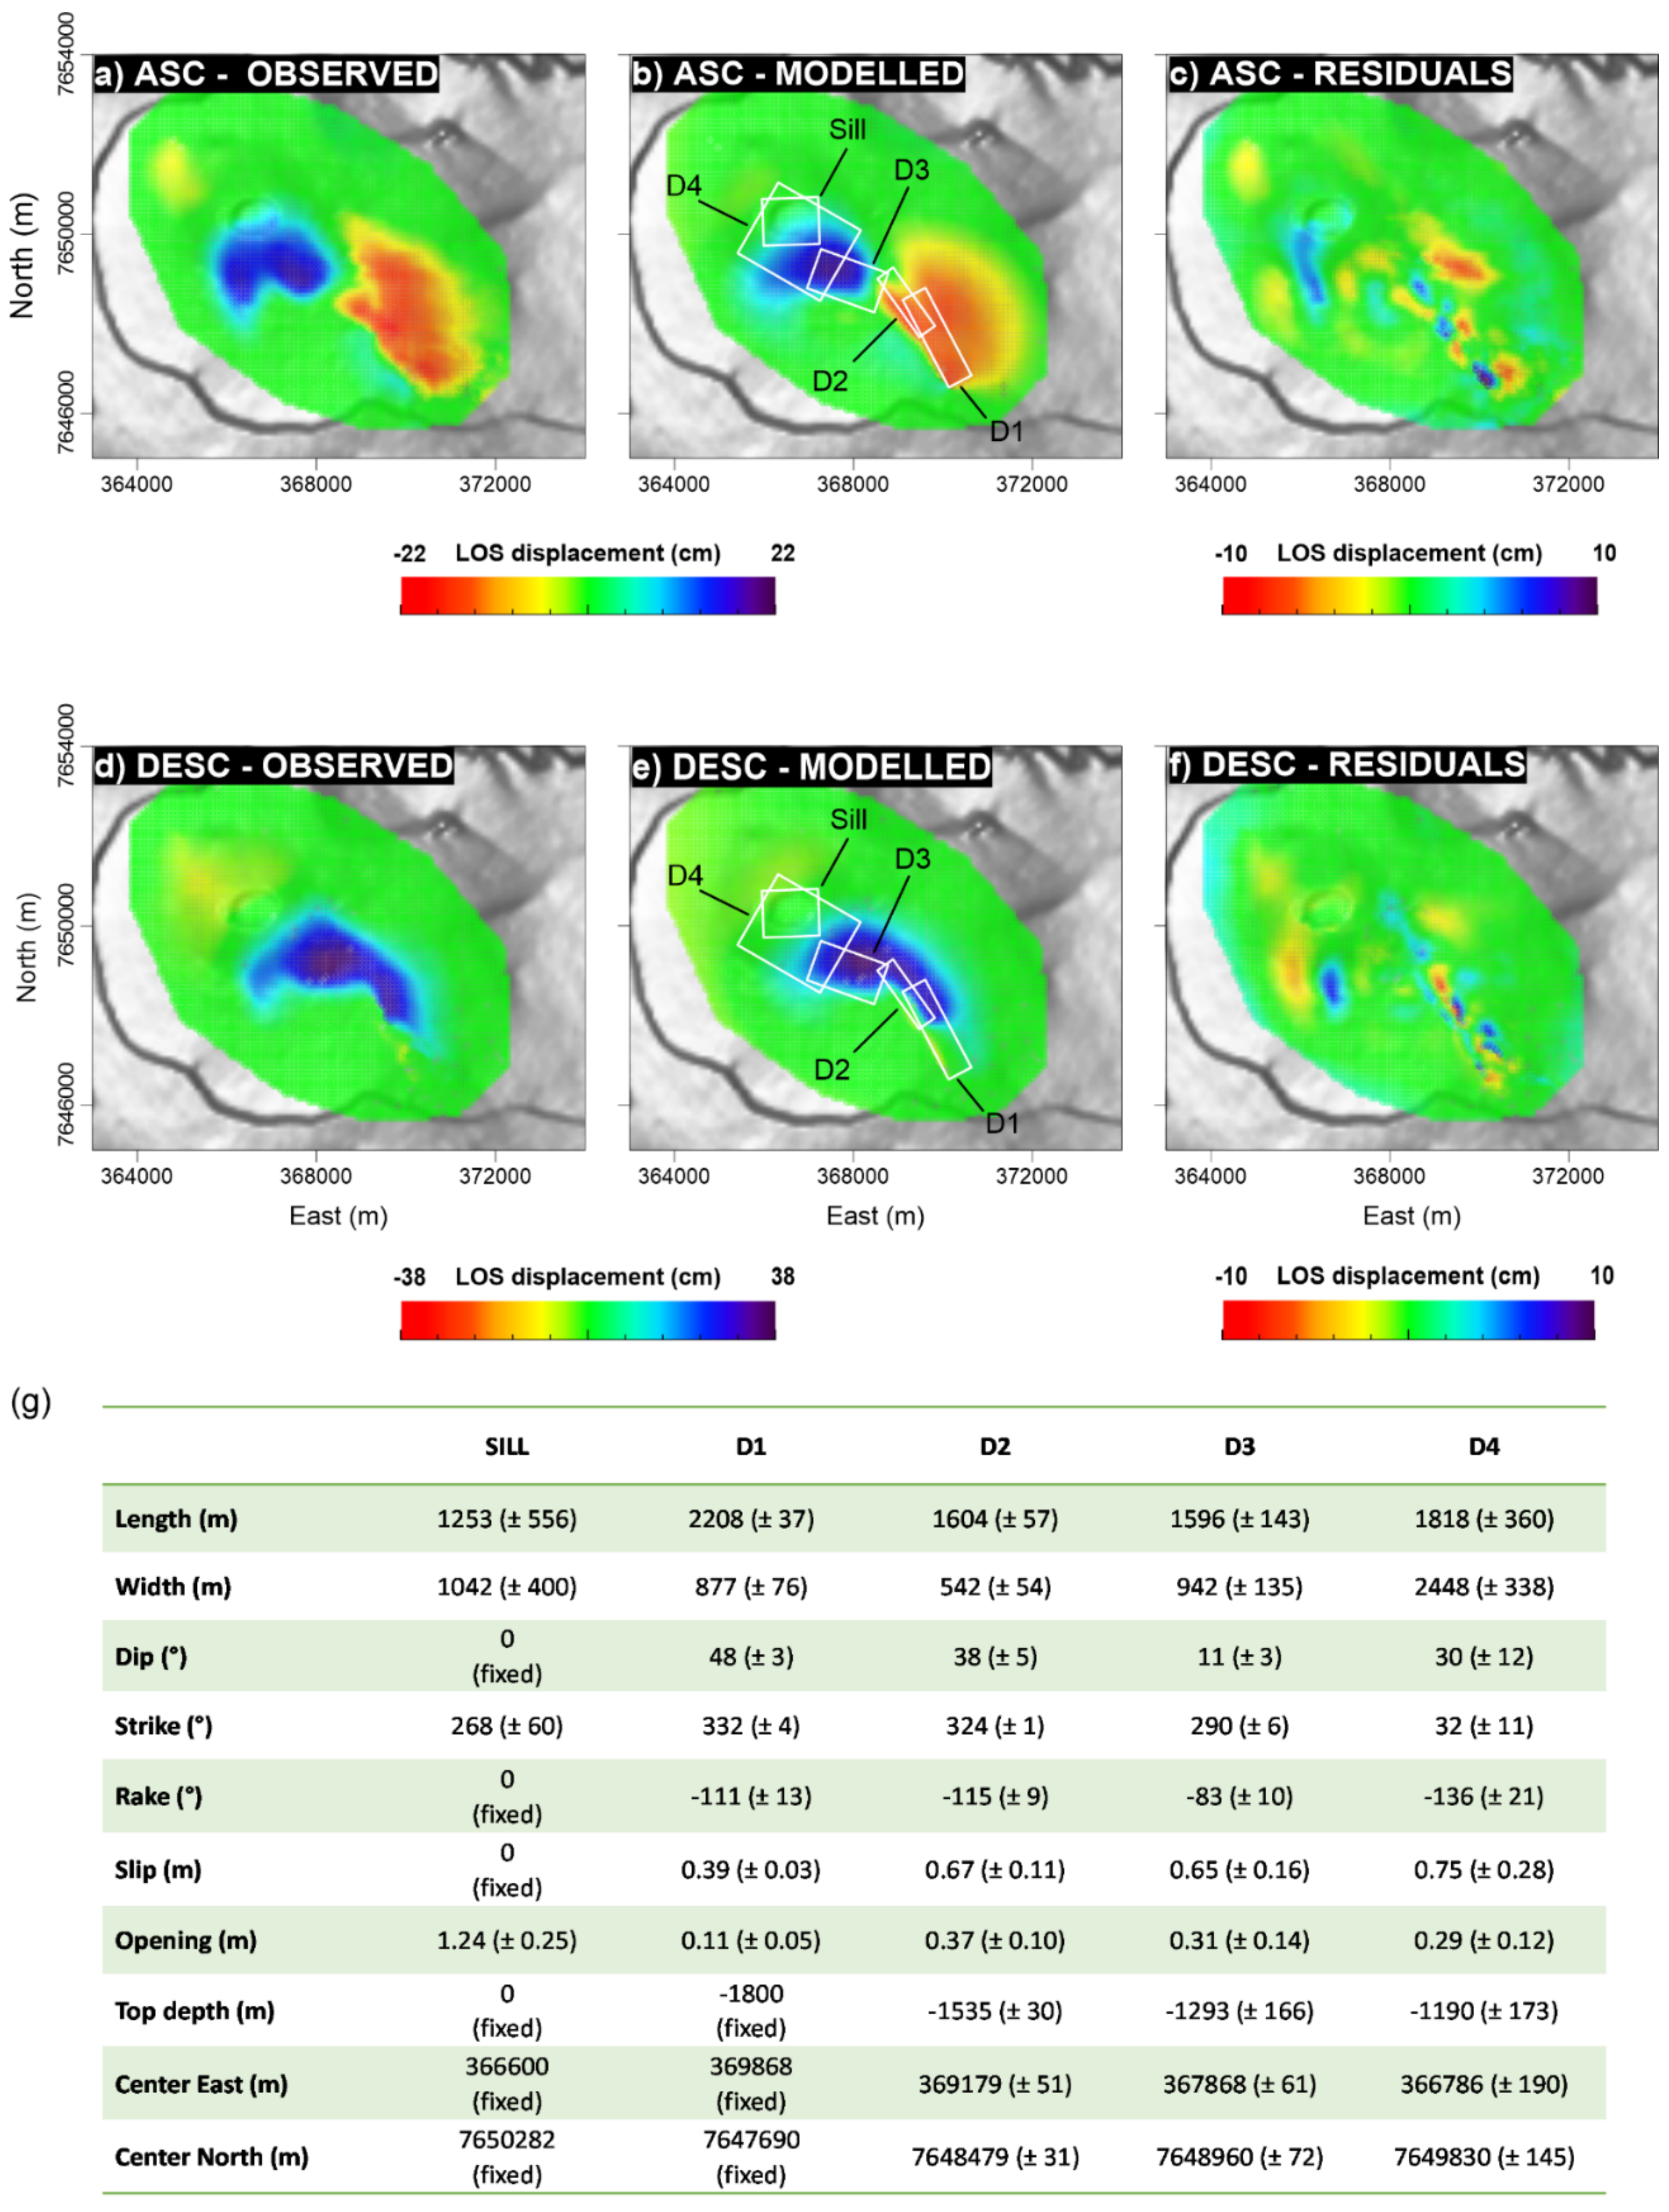
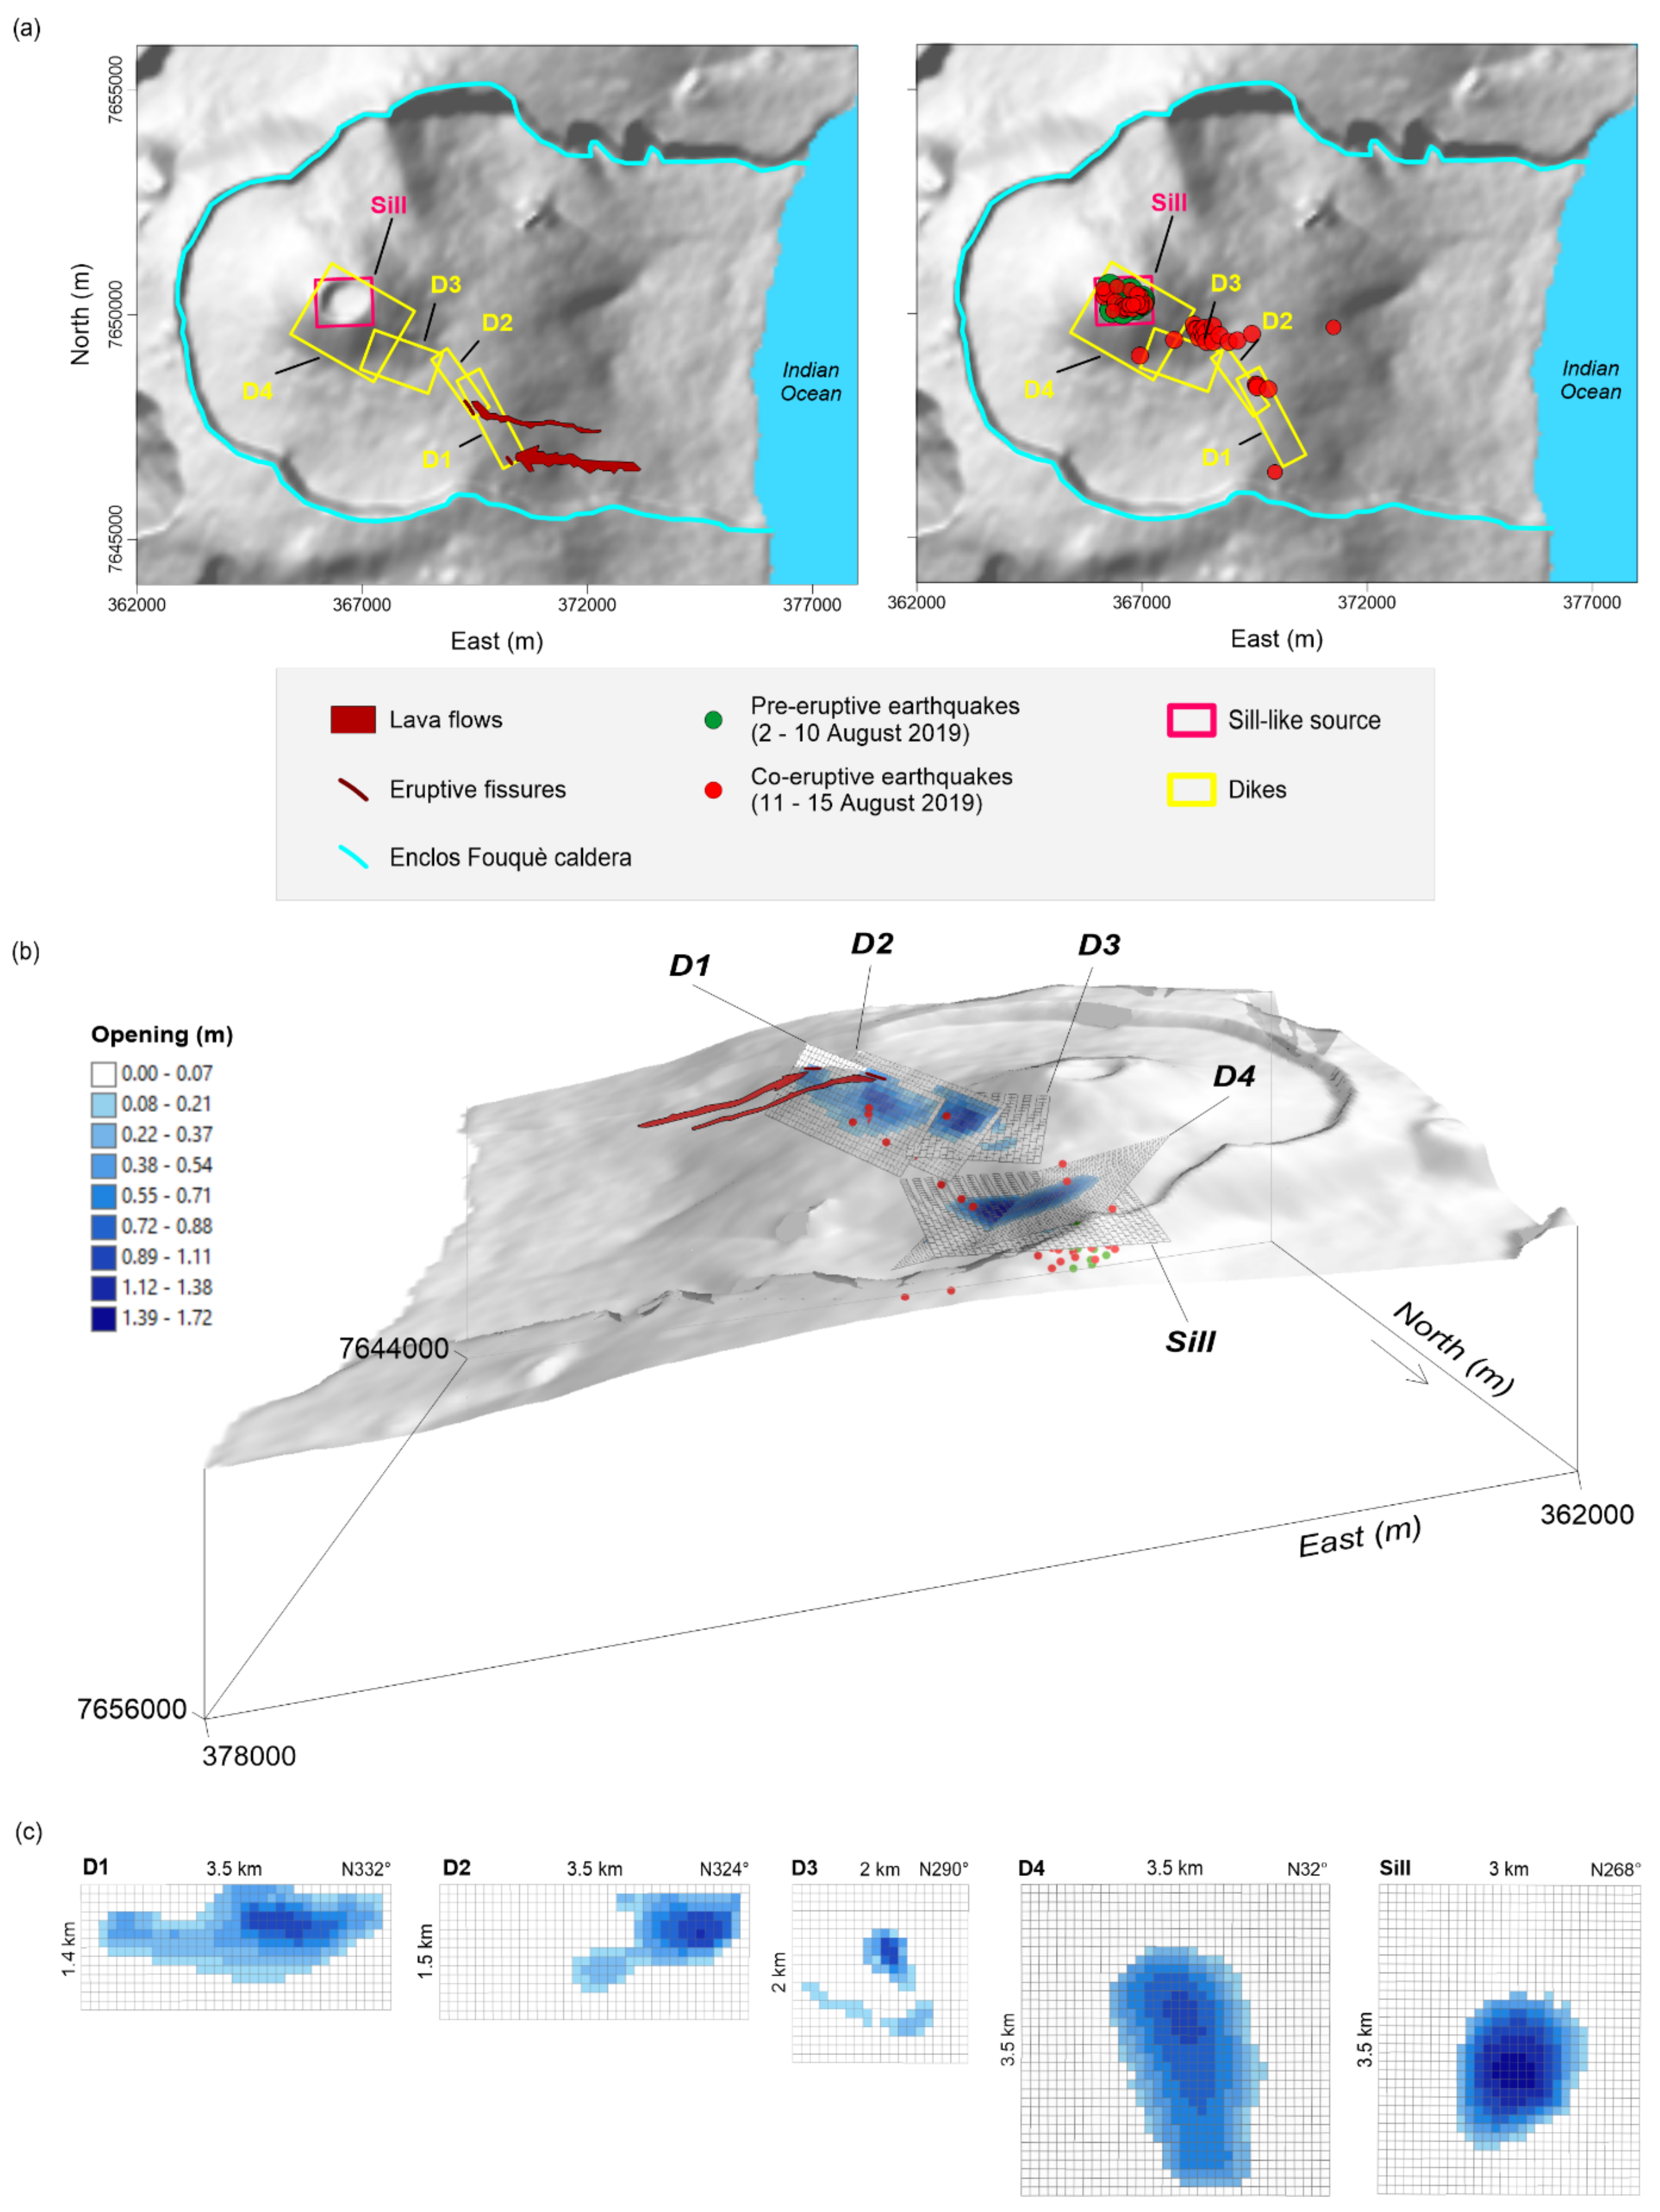
  • The performed modeling reveals the presence of five volcanic sources (i.e., one sill-like source and four dikes). Their concomitant action generated the observed deformation pattern. These results are also in good agreement with field evidence, such as the location of the opened fissures and other geophysical evidence already known in the literature.
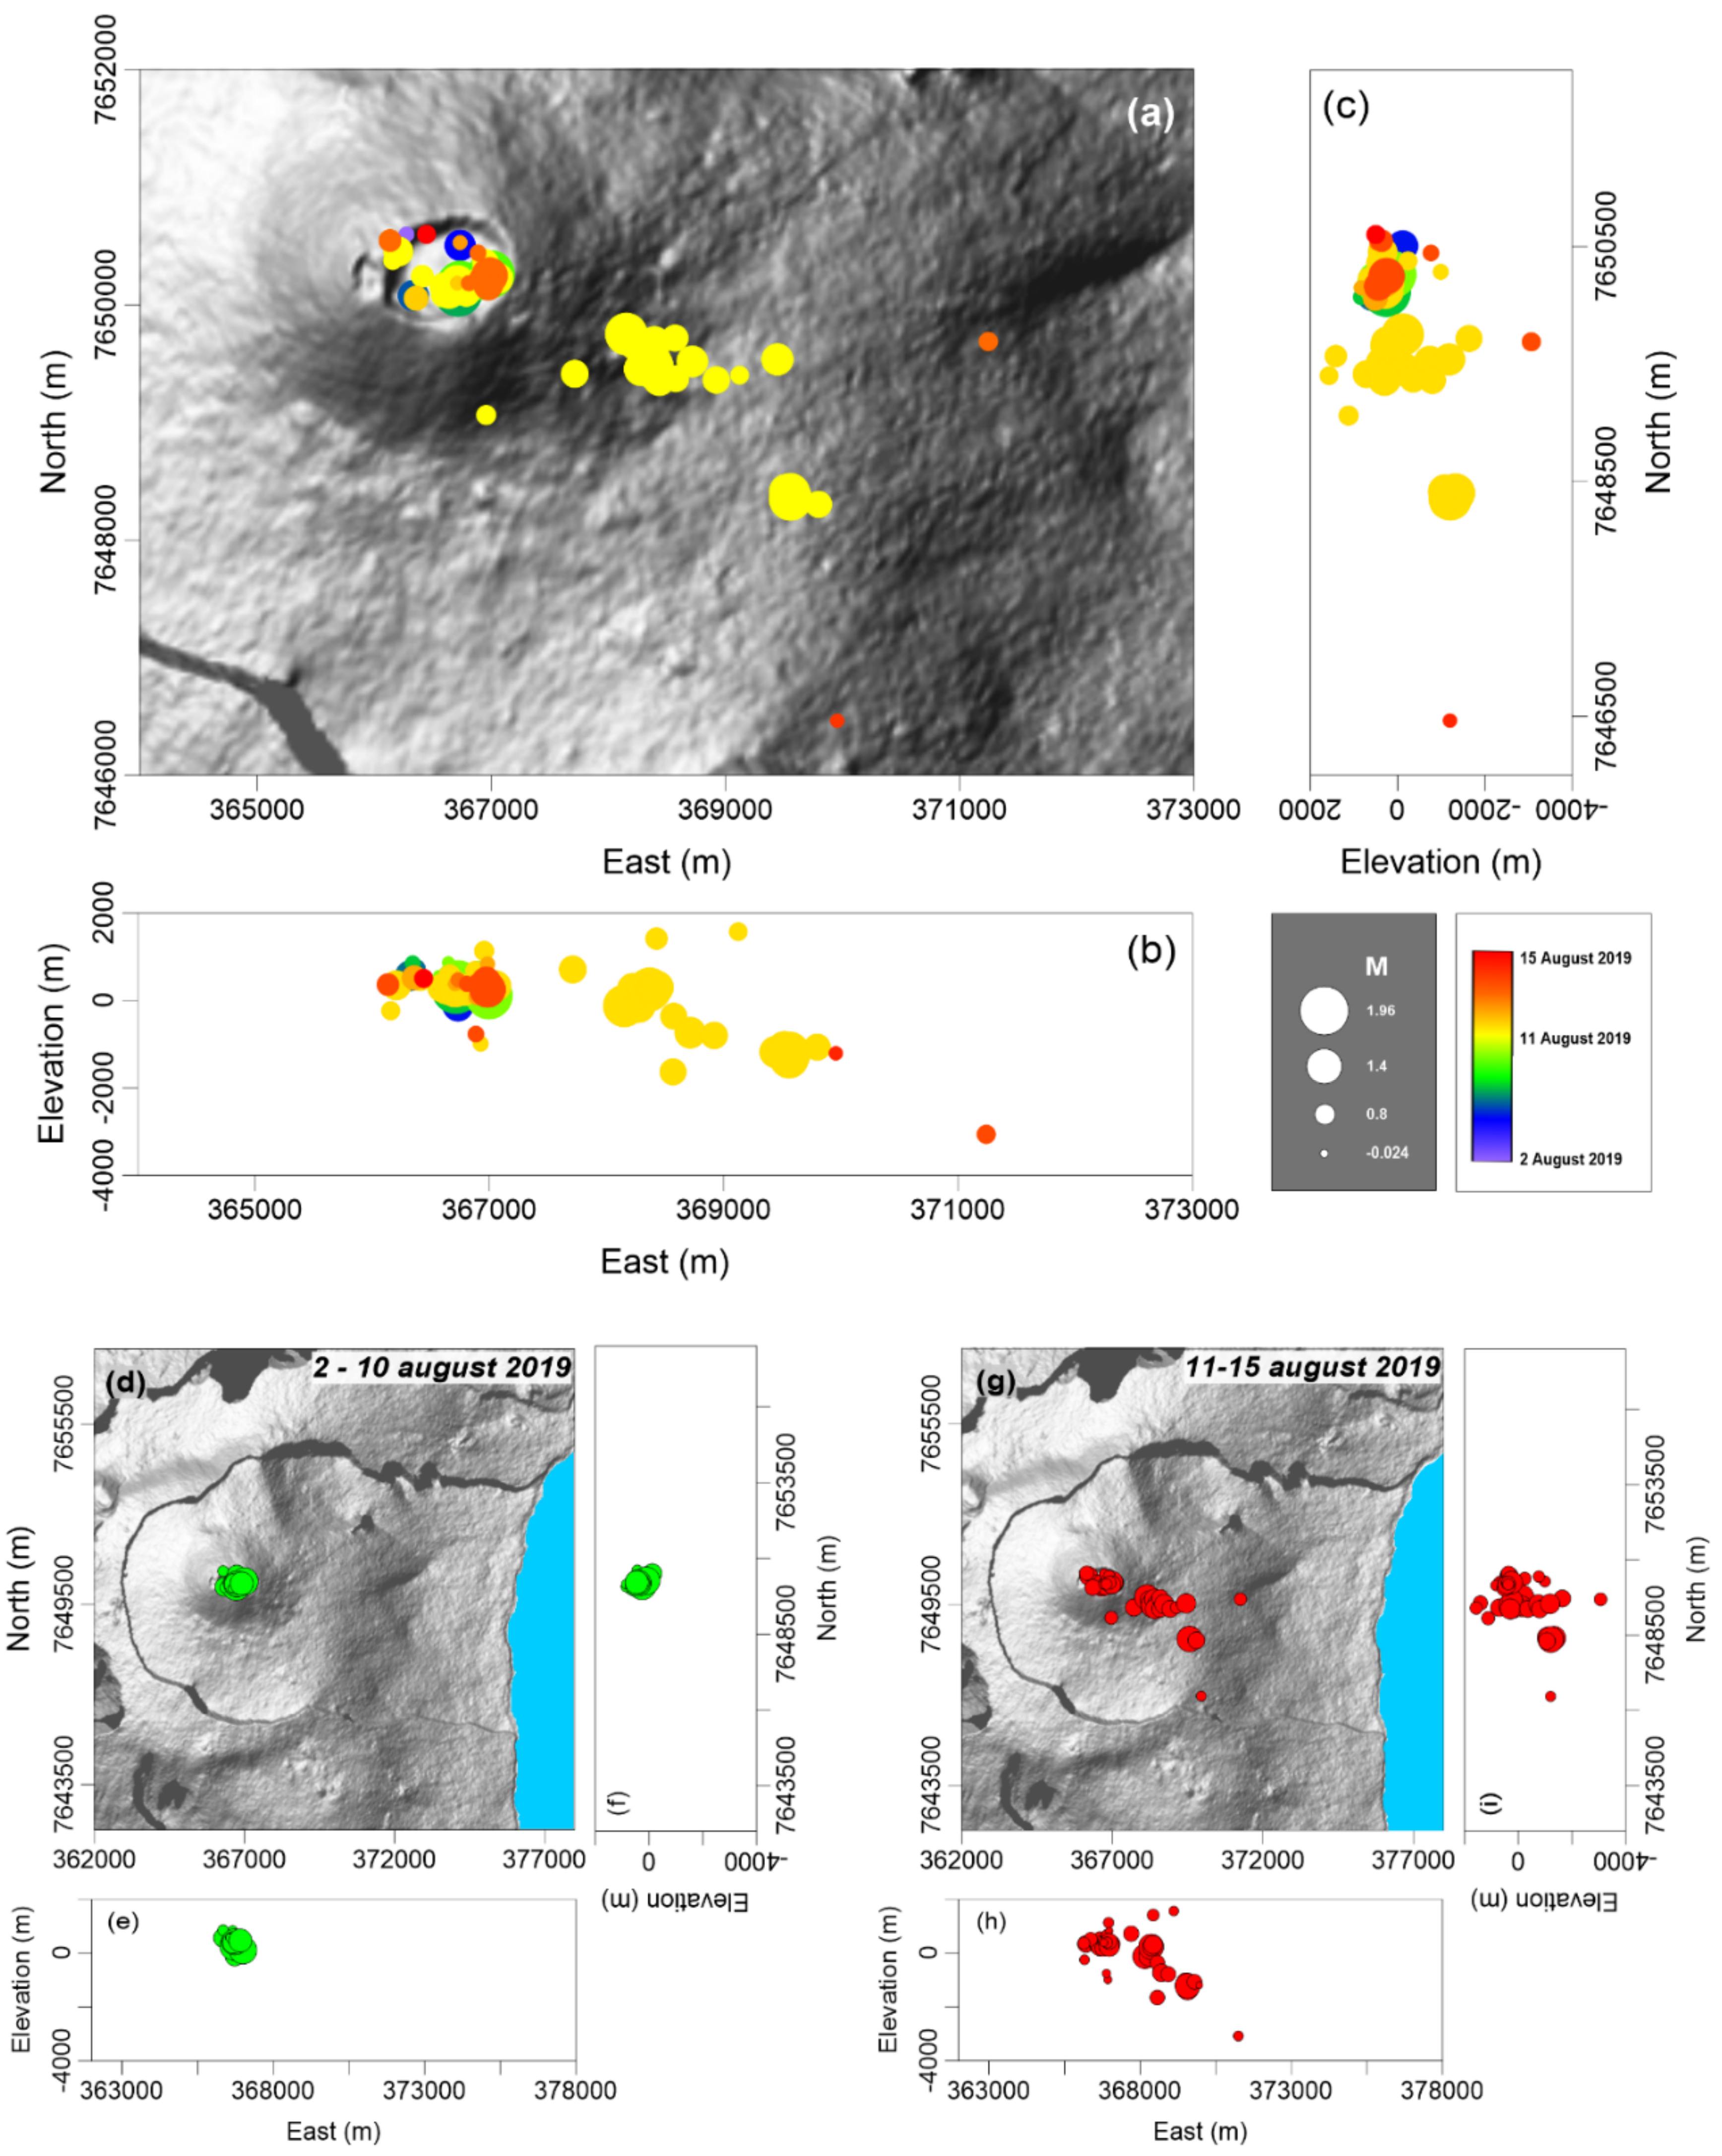
  • Our modeling results were validated against the epicentral and hypocentral analysis of the occurred volcano–tectonic earthquakes. The sources inferred from the inversion of the DInSAR measurements correlate well with the spatial distribution and the temporal evolution of the recorded seismicity.

Supplementary Materials

The following supporting information can be downloaded at: https://www.mdpi.com/article/10.3390/rs14071762/s1, Figure S1: Inversion results relevant to three scenarios obtained by gradually increasing the number of the volcanic sources, by considering two, three and four sources; Figure S2: D1 parameter uncertainties and tradeoffs; Figure S3: D2 parameter uncertainties and tradeoffs; Figure S4: D3 parameter uncertainties and tradeoffs; Figure S5: D4 parameter uncertainties and tradeoffs; Figure S6: Sill-like source parameter uncertainties and tradeoffs.

Author Contributions

Conceptualization, E.V.; methodology, E.V., M.B. and C.D.L.; software, E.V., C.D.L., R.L. and M.M.; validation, E.V. and M.B.; data curation, E.V. and C.D.L.; writing—original draft preparation, E.V., M.B. and R.L.; visualization, E.V.; supervision, M.B., R.L. and M.M.; funding acquisition, M.M. All authors have read and agreed to the published version of the manuscript.

Funding

This research received no external funding.

Institutional Review Board Statement

Not applicable.

Informed Consent Statement

Not applicable.

Data Availability Statement

GeoMapApp (Smithsonian Institute) is available online at http://www.geomapapp.org/. The employed 1 arcsec Shuttle Radar Topography Mission (SRTM) Digital Elevation Model (DEM) can be downloaded at https://earthexplorer.usgs.gov/. All the datasets generated and/or analyzed during the present study are available in the Zenodo repository (https:doi/org.10.5281/zenodo.6255531, accessed on 20 February 2022).

Acknowledgments

This work has been supported by the 2019–2021 IREA-CNR and Italian Civil Protection Department agreement, H2020 EPOS-SP (GA 871121), ENVRI-FAIR (GA 824068) projects, the I-AMICA project (Infrastructure of High Technology for Environmental and Climate Monitoring-PONa3_00363). The Sentinel-1 data have been furnished through the Copernicus Program of the European Union. The DEM of the investigated zone was acquired through the SRTM archive. We thank Valerie Ferrazzini to provide us the employed seismological data.

Conflicts of Interest

The authors declare no conflict of interest.

References

  1. Poland, M.P.; Peltier, A.; Bonforte, A.; Puglisi, G. The spectrum of persistent volcanic flank instability: A review and proposed framework based on Kīlauea, Piton de la Fournaise, and Etna. J. Volc. Geotherm. Res. 2017, 339, 63–80. [Google Scholar] [CrossRef]
  2. Ebmeier, S.K.; Andrews, B.J.; Araya, M.C.; Arnold, D.W.D.; Biggs, J.; Cooper, C.; Cottrell, E.; Furtney, M.; Hickey, J.; Jay, J.J.J.A.V.; et al. Synthesis of global satellite observations of magmatic and volcanic deformation: Implications for volcano monitoring & the lateral extent of magmatic domains. J. Appl. Volc. 2018, 7, 2. [Google Scholar] [CrossRef]
  3. Furtney, M.A.; Pritchard, M.E.; Biggs, J.; Carn, S.A.; Ebmeier, S.K.; Jay, J.A.; Kilbride, B.T.M.; Reath, K.A. Synthesizing multi-sensor, multi-satellite, multi-decadal datasets for global volcano monitoring. J. Volc. Geotherm. Res. 2018, 365, 38–56. [Google Scholar] [CrossRef]
  4. Valade, S.; Ley, A.; Massimetti, F.; D’Hondt, O.; Laiolo, M.; Coppola, D.; Loibl, D.; Hellwich, O.; Walter, T.R. Towards Global Volcano Monitoring Using Multisensor Sentinel Missions and Artificial Intelligence: The MOUNTS Monitoring System. Remote Sens. 2019, 11, 1528. [Google Scholar] [CrossRef] [Green Version]
  5. Sparks, R. Forecasting volcanic eruptions. Earth Planet. Sci. Lett. 2003, 210, 1–15. [Google Scholar] [CrossRef]
  6. Segall, P. Volcano deformation and eruption forecasting. Geol. Soc. Lond. Spec. Publ. 2013, 380, 85–106. [Google Scholar] [CrossRef]
  7. White, R.; McCausland, W. Volcano-tectonic earthquakes: A new tool for estimating intrusive volumes and forecasting eruptions. J. Volcanol. Geotherm. Res. 2016, 309, 139–155. [Google Scholar] [CrossRef] [Green Version]
  8. Dzurisin, D. Volcano Deformation: New Geodetic Monitoring Techniques; Springer Science & Business Media: Berlin/Heidelberg, Germany, 2006. [Google Scholar]
  9. Battaglia, M.; Cervelli, P.F.; Murray, J.R. dMODELS: A MATLAB software package for modeling crustal deformation near active faults and volcanic centers. J. Volcanol. Geotherm. Res. 2013, 254, 1–4. [Google Scholar] [CrossRef]
  10. Dzurisin, D. Volcano geodesy: Challenges and opportunities for the 21st century. Philos. Trans. R. Soc. Lond. Ser. A Math. Phys. Eng. Sci. 2000, 358, 1547–1566. [Google Scholar] [CrossRef]
  11. Aoki, Y. Space geodetic tools provide early warnings for earthquakes and volcanic eruptions. J. Geophys. Res. Solid Earth 2017, 122, 3241–3244. [Google Scholar] [CrossRef] [Green Version]
  12. Biggs, J.; Pritchard, M.E. Global Volcano Monitoring: What Does It Mean When Volcanoes Deform? Elements 2017, 13, 17–22. [Google Scholar] [CrossRef] [Green Version]
  13. Fernandez, J.; Pepe, A.; Poland, M.P.; Sigmundsson, F. Volcano Geodesy: Recent developments and future challenges. J. Volcanol. Geotherm. Res. 2017, 344, 1–12. [Google Scholar] [CrossRef]
  14. Oehler, J.-F.; Lénat, J.-F.; Labazuy, P. Growth and collapse of the Reunion Island volcanoes. Bull. Volcanol. 2007, 70, 717–742. [Google Scholar] [CrossRef]
  15. Lénat, J.-F. Geodynamic Setting of La Réunion. In Active Volcanoes of the Southwest Indian Ocean; Bachelery, P., Lenat, J.F., Di Muro, A., Michon, L., Eds.; Springer: Berlin/Heidelberg, Germany, 2016; Active Volcanoes of the World. [Google Scholar] [CrossRef]
  16. Pandey, O.P. Geodynamic and Geologic Evolution of Indian Continent: A Brief History. In Geodynamic Evolution of the Indian Shield: Geophysical Aspects; Springer: Cham, Switzerland, 2020; pp. 1–39. [Google Scholar]
  17. Richter, N.; Froger, J.-L. The role of Interferometric Synthetic Aperture Radar in Detecting, Mapping, Monitoring, and Modelling the Volcanic Activity of Piton de la Fournaise, La Réunion: A Review. Remote Sens. 2020, 12, 1019. [Google Scholar] [CrossRef] [Green Version]
  18. Famin, V.; Welsch, B.; Okumura, S.; Bachèlery, P.; Nakashima, S. Three differentiation stages of a single magma at Piton de la Fournaise volcano (Reunion hot spot). Geochem. Geophys. Geosyst. 2009, 10. [Google Scholar] [CrossRef] [Green Version]
  19. Rivet, D.; Brenguier, F.; Clarke, D.; Shapiro, N.; Peltier, A. Long-term dynamics of Piton de la Fournaise volcano from 13 years of seismic velocity change measurements and GPS observations. J. Geophys. Res. Solid Earth 2014, 119, 7654–7666. [Google Scholar] [CrossRef]
  20. Ren, C.X.; Peltier, A.; Ferrazzini, V.; Rouet-Leduc, B.; Johnson, P.A.; Brenguier, F. Machine Learning Reveals the Seismic Signature of Eruptive Behavior at Piton de la Fournaise Volcano. Geophys. Res. Lett. 2020, 47. [Google Scholar] [CrossRef] [Green Version]
  21. Peltier, A.; Staudacher, T.; Bachèlery, P.; Cayol, V. Formation of the April 2007 caldera collapse at Piton de La Fournaise volcano: Insights from GPS data. J. Volcanol. Geotherm. Res. 2009, 184, 152–163. [Google Scholar] [CrossRef]
  22. Staudacher, T.; Ferrazzini, V.; Peltier, A.; Kowalski, P.; Boissier, P.; Catherine, P.; Lauret, F.; Massin, F. The April 2007 eruption and the Dolomieu crater collapse, two major events at Piton de la Fournaise (La Réunion Island, Indian Ocean). J. Volcanol. Geotherm. Res. 2009, 184, 126–137. [Google Scholar] [CrossRef]
  23. Peltier, A.; Villeneuve, N.; Ferrazzini, V.; Testud, S.; Ali, T.H.; Boissier, P.; Catherine, P. Changes in the Long-Term Geophysical Eruptive Precursors at Piton de la Fournaise: Implications for the Response Management. Front. Earth Sci. 2018, 6. [Google Scholar] [CrossRef]
  24. Global Volcanism Program. Report on Piton de la Fournaise (France). In Weekly Volcanic Activity Report, 14–20 August 2019; Sennert, S.K., Ed.; Smithsonian Institution and US Geological Survey: Washington, DC, USA, 2019. [Google Scholar]
  25. Bonneville, A.; Barriot, J.P.; Bayer, R. Evidence from geoid data of a hotspot origin for the southern Mascarene Plateau and Mascarene Islands (Indian Ocean). J. Geophys. Res. Earth Surf. 1988, 93, 4199–4212. [Google Scholar] [CrossRef]
  26. McDougall, I. The geochronology and evolution of the young volcanic island of Réunion, Indian Ocean. Geochim. et Cosmochim. Acta 1971, 35, 261–288. [Google Scholar] [CrossRef]
  27. Quidelleur, X.; Holt, J.W.; Salvany, T.; Bouquerel, H. New K-Ar ages from La Montagne massif, Réunion Island (Indian Ocean), supporting two geomagnetic events in the time period 2.2–2.0 Ma. Geophys. J. Int. 2010, 182, 699–710. [Google Scholar] [CrossRef] [Green Version]
  28. Delibrias, G.; Guillier, M.-T.; Labeyrie, J. Gif Natural Radiocarbon Measurements X. Radiocarbon 1986, 28, 9–68. [Google Scholar] [CrossRef] [Green Version]
  29. Salvany, T.; Lahitte, P.; Nativel, P.; Gillot, P.-Y. Geomorphic evolution of the Piton des Neiges volcano (Réunion Island, Indian Ocean): Competition between volcanic construction and erosion since 1.4 Ma. Geomorphology 2012, 136, 132–147. [Google Scholar] [CrossRef]
  30. Labazuy, P.; Oehler, J.-F.; Lénat, J.-F. Recurrence of major flank landslides during the last 2-Ma-history of Reunion Island. Bull. Volcanol. 2004, 66, 585–598. [Google Scholar] [CrossRef]
  31. Gillot, P.-Y.; Nativel, P. Eruptive history of the Piton de la Fournaise volcano, Reunion Island, Indian Ocean. J. Volcanol. Geotherm. Res. 1989, 36, 53–65. [Google Scholar] [CrossRef]
  32. Merle, O.; Mairine, P.; Michon, L.; Bachelery, P.; Smietana, M. Calderas, landslides and paleo-canyons on Piton de la Fournaise volcano (La Réunion Island, Indian Ocean). J. Volcanol. Geotherm. Res. 2010, 189, 131–142. [Google Scholar] [CrossRef]
  33. Lénat, J.-F.; Bachelery, P.; Merle, O. Anatomy of Piton de la Fournaise volcano (La Réunion, Indian Ocean). Bull. Volcanol. 2012, 74, 1945–1961. [Google Scholar] [CrossRef]
  34. Michon, L.; Ferrazzini, V.; Di Muro, A. Magma paths at Piton de la Fournaise volcano. In Active Volcanoes of the Southwest Indian Ocean; Springer: Berlin/Heidelberg, Germany, 2016; pp. 91–106. [Google Scholar]
  35. Mairine, P.; Bachèlery, P. Major erosional period in the building of Piton de la Fournaise (Réunion Island). C. R. L’acad. Sci. Ser. IIA Earth Planet. Sci. 1997, 4, 243–249. [Google Scholar]
  36. Gabriel, A.K.; Goldstein, R.M.; Zebker, H.A. Mapping small elevation changes over large areas: Differential radar interferometry. J. Geophys. Res. Earth Surf. 1989, 94, 9183–9191. [Google Scholar] [CrossRef]
  37. Massonnet, D.; Rossi, M.; Carmona, C.; Adragna, F.; Peltzer, G.; Feigl, K.; Rabaute, T. The displacement field of the Landers earthquake mapped by radar interferometry. Nature 1993, 364, 138–142. [Google Scholar] [CrossRef]
  38. Fornaro, G.; Franceschetti, G.; Lanari, R.; Rossi, D.; Tesauro, M. Interferometric SAR phase unwrapping using the finite element method. IEE Proc. Radar Sonar Navig. 1997, 144, 266–274. [Google Scholar] [CrossRef]
  39. Costantini, M. A novel phase unwrapping method based on network programming. IEEE Trans. Geosci. Remote Sens. 1998, 36, 813–821. [Google Scholar] [CrossRef]
  40. Bamler, R. The SRTM Mission: A World-Wide 30 m Resolution DEM from SAR Interferometry in 11 Days; Fritsch, D., Spiller, R., Eds.; Wichmann Verlang: Heidelberg, Germany, 1999. [Google Scholar]
  41. De Luca, C.; Zinno, I.; Manunta, M.; Lanari, R.; Casu, F. Large areas surface deformation analysis through a cloud computing P-SBAS approach for massive processing of DInSAR time series. Remote Sens. Environ. 2017, 202, 3–17. [Google Scholar] [CrossRef]
  42. Collombet, M.; Grasso, J.; Ferrazzini, V. Seismicity rate before eruptions on Piton de la Fournaise volcano: Implications for eruption dynamics. Geophys. Res. Lett. 2003, 30. [Google Scholar] [CrossRef]
  43. Burlini, L.; Vinciguerra, S.; Di Toro, G.; DE Natale, G.; Meredith, P.; Burg, J.-P. Seismicity preceding volcanic eruptions: New experimental insights. Geology 2007, 35, 183. [Google Scholar] [CrossRef]
  44. McNutt, S.R.; Roman, D.C. Volcanic seismicity. In The Encyclopedia of Volcanoes; Academic Press: Cambridge, MA, USA, 2015; pp. 1011–1034. [Google Scholar]
  45. Atzori, S.; Hunstad, I.; Chini, M.; Salvi, S.; Tolomei, C.; Bignami, C.; Stramondo, S.; Trasatti, E.; Antonioli, A.; Boschi, E. Finite fault inversion of DInSAR coseismic displacement of the 2009 L’Aquila earthquake (central Italy). Geophys. Res. Lett. 2009, 36. [Google Scholar] [CrossRef]
  46. Williams, C.A.; Wadge, G. The effects of topography on magma chamber deformation models: Application to Mt. Etna and radar interferometry. Geophys. Res. Lett. 1998, 25, 1549–1552. [Google Scholar] [CrossRef]
  47. Marquardt, D.W. An Algorithm for Least-Squares Estimation of Nonlinear Parameters. J. Soc. Ind. Appl. Math. 1963, 11, 431–441. [Google Scholar] [CrossRef]
  48. Okada, Y. Surface deformation due to shear and tensile faults in a half-space. Bull. Seism. Soc. Am. 1985, 75, 1135–1154. [Google Scholar] [CrossRef]
  49. Nercessian, A.; Hirn, A.; Lépine, J.-C.; Sapin, M. Internal structure of Piton de la Fournaise volcano from seismic wave propagation and earthquake distribution. J. Volcanol. Geotherm. Res. 1996, 70, 123–143. [Google Scholar] [CrossRef]
  50. Sapin, M.; Hirn, A.; Lépine, J.-C.; Nercessian, A. Stress, failure and fluid flow deduced from earthquakes accompanying eruptions at Piton de la Fournaise volcano. J. Volcanol. Geotherm. Res. 1996, 70, 145–167. [Google Scholar] [CrossRef]
  51. Lénat, J.-F.; Fitterman, D.; Jackson, D.B.; Labazuy, P. Geoelectrical structure of the central zone of Piton de la Fournaise volcano (Réunion). Bull. Volcanol. 2000, 62, 75–89. [Google Scholar] [CrossRef]
  52. Peltier, A.; Bachèlery, P.; Staudacher, T. Magma transport and storage at Piton de La Fournaise (La Réunion) between 1972 and 2007: A review of geophysical and geochemical data. J. Volcanol. Geotherm. Res. 2009, 184, 93–108. [Google Scholar] [CrossRef]
  53. Froger, J.-L.; Famin, V.; Cayol, V.; Augier, A.; Michon, L.; Lénat, J.-F. Time-dependent displacements during and after the April 2007 eruption of Piton de la Fournaise, revealed by interferometric data. J. Volcanol. Geotherm. Res. 2015, 296, 55–68. [Google Scholar] [CrossRef] [Green Version]
  54. Letourneur, L.; Peltier, A.; Staudacher, T.; Gudmundsson, A. The effects of rock heterogeneities on dyke paths and asymmetric ground deformation: The example of Piton de la Fournaise (Réunion Island). J. Volcanol. Geotherm. Res. 2008, 173, 289–302. [Google Scholar] [CrossRef]
  55. Peltier, A.; Famin, V.; Bachèlery, P.; Cayol, V.; Fukushima, Y.; Staudacher, T. Cyclic magma storages and transfers at Piton de La Fournaise volcano (La Réunion hotspot) inferred from deformation and geochemical data. Earth Planet. Sci. Lett. 2008, 270, 180–188. [Google Scholar] [CrossRef]
  56. Smittarello, D.; Cayol, V.; Pinel, V.; Peltier, A.; Froger, J.; Ferrazzini, V. Magma Propagation at Piton de la Fournaise From Joint Inversion of InSAR and GNSS. J. Geophys. Res. Solid Earth 2019, 124, 1361–1387. [Google Scholar] [CrossRef]
  57. Battaglia, J.; Bachèlery, P. Dynamic dyke propagation deduced from tilt variations preceding the March 9, 1998, eruption of the Piton de la Fournaise volcano. J. Volcanol. Geotherm. Res. 2003, 120, 289–310. [Google Scholar] [CrossRef]
  58. Massin, F.; Ferrazzini, V.; Bachelery, P.; Nercessian, A.; Duputel, Z.; Staudacher, T. Structures and evolution of the plumbing system of Piton de la Fournaise volcano inferred from clustering of 2007 eruptive cycle seismicity. J. Volcanol. Geotherm. Res. 2011, 202, 96–106. [Google Scholar] [CrossRef]
  59. Sigmundsson, F.; Durand, P.; Massonnet, D. Opening of an eruptive fissure and seaward displacement at Piton De La Fournaise Volcano measured by RADARSAT satellite radar interferometry. Geophys. Res. Lett. 1999, 26, 533–536. [Google Scholar] [CrossRef]
  60. Peltier, A.; Got, J.-L.; Villeneuve, N.; Boissier, P.; Staudacher, T.; Ferrazzini, V.; Walpersdorf, A. Long-term mass transfer at Piton de la Fournaise volcano evidenced by strain distribution derived from GNSS network. J. Geophys. Res. Solid Earth 2015, 120, 1874–1889. [Google Scholar] [CrossRef]
  61. Chen, Y.; Zhang, K.; Froger, J.-L.; Tan, K.; Remy, D.; Darrozes, J.; Peltier, A.; Feng, X.; Li, H.; Villeneuve, N. Long-Term Subsidence in Lava Fields at Piton de la Fournaise Volcano Measured by InSAR: New Insights for Interpretation of the Eastern Flank Motion. Remote Sens. 2018, 10, 597. [Google Scholar] [CrossRef] [Green Version]
  62. Borgia, A.; Delaney, P.T.; Denlinger, R.P. Spreading Volcanoes. Annu. Rev. Earth Planet. Sci. 2000, 28, 539–570. [Google Scholar] [CrossRef]
Figure 1. Geodynamic framework: (a) map of southwestern Indian Ocean with the main geodynamic features [after GeoMapApp, Smithsonian institute]; (b) Landsat image of La Réunion Island with the highlighted local volcanoes. In particular, the fuchsia rectangle identifies the zone in (c); (c) Detailed map of the considered Piton de la Fournaise volcanic area in which the caldera rim (cyan line), craters (yellow lines), eruptive fissures (blue and red lines), lava flows (red areas), and the main features are shown. The dashed magenta rectangle highlights the areas reported in Figure 2. Data are superimposed on the 1 arcsec Shuttle Radar Topography Mission (SRTM) Digital Elevation Model (DEM) of the zone. (d) Eruptive activity occurred during 2019.
Remotesensing 14 01762 g001
Figure 2. Deformation pattern from DInSAR: (a,b) wrapped interferograms generated from Sentinel-1 data pairs acquired along (a) ascending orbits on 2 and 14 August 2019, and (b) descending (DESC) orbits on 3 and 15 August 2019, respectively. (c,d) line-of-sight (LOS) displacement maps for S1 ascending (c) and descending (d) orbits interferograms. (e) Vertical and (f) East-West displacement maps obtained through the combination of the geocoded displacement maps computed from the ascending and descending orbits. The caldera rim (magenta line) and the eruptive fissures (white lines) are also shown. The reported data are superimposed on the 1 arcsec Shuttle Radar Topography Mission (SRTM) Digital Elevation Model (DEM) of the zone.
Remotesensing 14 01762 g002
Figure 3. Seismicity analysis: (a) seismicity distribution as a function of magnitude (the higher the magnitude, the bigger the circles) and day of occurrence (from blue to red circles), superimposed on the 1 arcsec Shuttle Radar Topography Mission (SRTM) Digital Elevation Model (DEM) of the zone; (b) hypocenter distribution by longitude; (c) hypocenter distribution by latitude. Maps and sections of the seismicity nucleated during: (df) the 2–10 August 2019, and (gi) the 11–15 August 2019 time intervals; earthquakes are shown as a function of magnitude.
Remotesensing 14 01762 g003
Figure 4. Non-linear inversion results: we report the line-of-sight (LOS) projected displacement maps for the S1 ascending (a) and descending (d) orbits interferograms, and the LOS projected displacement maps computed from the retrieved analytical model for the S1 ascending (b) and descending (e) orbits interferograms. The corresponding residual maps are shown in (c,f), respectively. The retrieved solutions are also marked by white rectangles. The reported maps are superimposed on the 1 arcsec Shuttle Radar Topography Mission (SRTM) Digital Elevation Model (DEM) of the zone. (g) Best-fit parameters of the volcanic sources retrieved from the non-linear inversion modeling; the 1-σ uncertainty is also reported.
Remotesensing 14 01762 g004
Figure 5. Source modeling: (a) the main volcanic features, the related seismicity and the retrieved volcanic sources are superimposed on the 1 arcsec Shuttle Radar Topography Mission (SRTM) Digital Elevation Model (DEM) of the zone. (b) 3D view of the retrieved sources responsible for the detected deformation pattern; the related seismicity, fissures’ location and the lava flows are also shown. (c) Plane view of the opening distribution along the retrieved solutions.
Remotesensing 14 01762 g005
Table 1. Main characteristics of the interferometric pairs considered for the performed modeling.
SensorDInSAR PairOrbitTrackPerpendicular Baseline (m)Incidence Angle (deg)
Sentinel-1A02082019–14082019ASC14467.9828~42
Sentinel-1A03082019–15082019DESC151−56.6627~37
Publisher’s Note: MDPI stays neutral with regard to jurisdictional claims in published maps and institutional affiliations.

